Sedimentary Deposits from the 17 July 2006 Western Java Tsunami, Indonesia: Use of Grain Size Analyses to Assess Tsunami Flow Depth, Speed, and Traction Carpet Characteristics ANDREW MOORE, 1 JAMES GOFF, 2 BRIAN G. MCADOO, 3 HERMANN M. FRITZ, 4 ADITYA GUSMAN, 5 NIKOS KALLIGERIS, 6 KENIA KALSUM, 5 ARIF SUSANTO, 7 DEBORA SUTEJA, 5 and COSTAS E. SYNOLAKIS 8 Abstract—The 2006 western Java tsunami deposited a dis- continuous sheet of sand up to 20 cm thick, flooded coastal southern Java to a depth of at least 8 m and inundated up to 1 km inland. In most places the primarily heavy mineral sand sheet is normally graded, and in some it contains complex internal stra- tigraphy. Structures within the sand sheet probably record the passage of up to two individual waves, a point noted in eyewitness accounts. We studied the 2006 tsunami deposits in detail along a flow parallel transect about 750 m long, 15 km east of Cilacap. The tsunami deposit first becomes discernable from the underlying sediment 70 m from the shoreline. From 75 to 300 m inland the deposit has been laid down in rice paddies, and maintains a thickness of 10–20 cm. Landward of 300 m the deposit thins dra- matically, reaching 1 mm by 450 m inland. From 450 m to the edge of deposition (around 700 m inland) the deposit remains \ 1 mm thick. Deposition generally attended inundation—along the transect, the tsunami deposited sand to within about 40 m of the inundation limit. The thicker part of the deposit contains primarily sand indistinguishable from that found on the beach 3 weeks after the event, but after about 450 m (and roughly coinciding with the decrease in thickness) the tsunami sediment shifts to become more like the underlying paddy soil than the beach sand. Grain sizes within the deposit tend to fine upward and landward, although overall upward fining takes place in two discrete pulses, with an initial section of inverse grading followed by a section of normal grading. The two inversely graded sections are also density graded, with denser grains at the base, and less dense grains at the top. The two normally graded sections show no trends in density. The inversely graded sections show high density sediment to the base and become less dense upward and represents traction carpet flows at the base of the tsunami. These are suggestive of high shear rates in the flow. Because of the grain sorting in the traction carpet, the landward-fining trends usually seen in tsunami deposits are masked, although lateral changes of mean sediment grain size along the transect do show overall landward fining, with more variation as the deposit tapers off. The deposit is also thicker in the more seaward portions than would be produced by tsunamis lacking traction carpets. Key words: Tsunami deposit, Java, traction carpet. 1. Introduction The 2006 western Java tsunami provides a rare opportunity to study the deposits of a moderate tsu- nami along a relatively low profile beach-ridge plain on which the intervening swales are occupied by rice paddies. These tsunami deposits provide important information regarding flow dynamics not available from other field evidence of the flow. This region is well suited for this study as tsunami deposits are easily distinguished from the soils on which they rest, and the low relief coastline of much of the Java coast allows the tsunamis to dissipate inland rather than rushing up steep hillsides. Tsunami sedimentation has been studied for several smaller modern tsunamis, including 1992 Flores (MINOURA et al., 1997;SHI et al., 1995), 1993 Okushiri (NISHIMURA and MIYAJI, 1995;SATO et al., 1995), 1994 Java (DAWSON et al., 1996), 1998 Papua New Guinea (GELFENBAUM and JAFFE, 2003), 2009 South Pacific (DOMINEY-HOWES and THAMAN, 2009), and also the 1 Department of Geology, Earlham College, Richmond, IN 47374, USA. E-mail: [email protected] 2 Australian Tsunami Research Centre, School of Biological, Earth and Environmental Sciences, University of New South Wales, Sydney, NSW 2052, Australia. E-mail: [email protected] 3 Department of Geology and Geography, Vassar College, Poughkeepsie, NY 12604, USA. E-mail: [email protected] 4 School of Civil and Environmental Engineering, Georgia Institute of Technology, Savannah, GA 31407, USA. E-mail: [email protected] 5 Department of Oceanography, Institute of Technology Bandung, Bandung 40132, Indonesia. 6 Department of Environmental Engineering, Technical Universtity of Crete, 73100 Chanea, Greece. 7 Department of Geology, Institute of Technology Bandung, Bandung 40132, Indonesia. 8 Tsunami Research Center, Viterbi School of Engineering, Los Angeles, CA 90089, USA. E-mail: [email protected] Pure Appl. Geophys. 168 (2011), 1951–1961 Ó 2011 Springer Basel AG DOI 10.1007/s00024-011-0280-8 Pure and Applied Geophysics

Welcome message from author
This document is posted to help you gain knowledge. Please leave a comment to let me know what you think about it! Share it to your friends and learn new things together.
Transcript
Sedimentary Deposits from the 17 July 2006 Western Java Tsunami, Indonesia: Use of Grain
Size Analyses to Assess Tsunami Flow Depth, Speed, and Traction Carpet Characteristics
ANDREW MOORE,1 JAMES GOFF,2 BRIAN G. MCADOO,3 HERMANN M. FRITZ,4 ADITYA GUSMAN,5 NIKOS KALLIGERIS,6
KENIA KALSUM,5 ARIF SUSANTO,7 DEBORA SUTEJA,5 and COSTAS E. SYNOLAKIS8
Abstract—The 2006 western Java tsunami deposited a dis-
continuous sheet of sand up to 20 cm thick, flooded coastal
southern Java to a depth of at least 8 m and inundated up to 1 km
inland. In most places the primarily heavy mineral sand sheet is
normally graded, and in some it contains complex internal stra-
tigraphy. Structures within the sand sheet probably record the
passage of up to two individual waves, a point noted in eyewitness
accounts. We studied the 2006 tsunami deposits in detail along a
flow parallel transect about 750 m long, 15 km east of Cilacap. The
tsunami deposit first becomes discernable from the underlying
sediment 70 m from the shoreline. From 75 to 300 m inland the
deposit has been laid down in rice paddies, and maintains a
thickness of 10–20 cm. Landward of 300 m the deposit thins dra-
matically, reaching 1 mm by 450 m inland. From 450 m to the
edge of deposition (around 700 m inland) the deposit remains
\1 mm thick. Deposition generally attended inundation—along
the transect, the tsunami deposited sand to within about 40 m of the
inundation limit. The thicker part of the deposit contains primarily
sand indistinguishable from that found on the beach 3 weeks after
the event, but after about 450 m (and roughly coinciding with the
decrease in thickness) the tsunami sediment shifts to become more
like the underlying paddy soil than the beach sand. Grain sizes
within the deposit tend to fine upward and landward, although
overall upward fining takes place in two discrete pulses, with an
initial section of inverse grading followed by a section of normal
grading. The two inversely graded sections are also density graded,
with denser grains at the base, and less dense grains at the top. The
two normally graded sections show no trends in density. The
inversely graded sections show high density sediment to the base
and become less dense upward and represents traction carpet flows
at the base of the tsunami. These are suggestive of high shear rates
in the flow. Because of the grain sorting in the traction carpet, the
landward-fining trends usually seen in tsunami deposits are
masked, although lateral changes of mean sediment grain size
along the transect do show overall landward fining, with more
variation as the deposit tapers off. The deposit is also thicker in the
more seaward portions than would be produced by tsunamis
lacking traction carpets.
Key words: Tsunami deposit, Java, traction carpet.
1. Introduction
The 2006 western Java tsunami provides a rare
opportunity to study the deposits of a moderate tsu-
nami along a relatively low profile beach-ridge plain
on which the intervening swales are occupied by rice
paddies. These tsunami deposits provide important
information regarding flow dynamics not available
from other field evidence of the flow. This region is
well suited for this study as tsunami deposits are
easily distinguished from the soils on which they rest,
and the low relief coastline of much of the Java coast
allows the tsunamis to dissipate inland rather than
rushing up steep hillsides.
Tsunami sedimentation has been studied for several
smaller modern tsunamis, including 1992 Flores
(MINOURA et al., 1997; SHI et al., 1995), 1993 Okushiri
(NISHIMURA and MIYAJI, 1995; SATO et al., 1995), 1994
Java (DAWSON et al., 1996), 1998 Papua New Guinea
(GELFENBAUM and JAFFE, 2003), 2009 South Pacific
(DOMINEY-HOWES and THAMAN, 2009), and also the
1 Department of Geology, Earlham College, Richmond, IN
47374, USA. E-mail: [email protected] Australian Tsunami Research Centre, School of Biological,
Earth and Environmental Sciences, University of New South
Wales, Sydney, NSW 2052, Australia. E-mail: [email protected] Department of Geology and Geography, Vassar College,
Poughkeepsie, NY 12604, USA. E-mail: [email protected] School of Civil and Environmental Engineering, Georgia
Institute of Technology, Savannah, GA 31407, USA. E-mail:
[email protected] Department of Oceanography, Institute of Technology
Bandung, Bandung 40132, Indonesia.6 Department of Environmental Engineering, Technical
Universtity of Crete, 73100 Chanea, Greece.7 Department of Geology, Institute of Technology Bandung,
Bandung 40132, Indonesia.8 Tsunami Research Center, Viterbi School of Engineering,
Los Angeles, CA 90089, USA. E-mail: [email protected]
Pure Appl. Geophys. 168 (2011), 1951–1961
� 2011 Springer Basel AG
DOI 10.1007/s00024-011-0280-8 Pure and Applied Geophysics
great 2004 Indian Ocean Tsunami (e.g., PARIS
et al., 2009; BAHLBURG and WEISS, 2007; MOORE
et al., 2006). The 2006 Western Java tsunami provides
a simple test case for testing ideas about the nature of
tsunami sedimentation and how these deposits relate to
flow dynamics.
In the modern environment, it is possible to relate
the structures and properties of tsunami deposits with
estimates of flow depth based on eyewitness
accounts and post-tsunami surveys. These relation-
ships, in turn, help determine the size of ancient
tsunamis using the sedimentary record (JAFFE and
GELFENBAUM, 2007; MOORE et al., 2007). Deposits
from the 2006 Western Java tsunami may be used to
test these ideas because their depositional patterns
are minimally affected by local cross-shore or
longshore topography, and because they include a
wide range of grain sizes to record horizontal and
vertical changes in the deposit.
2. The 2006 Earthquake and Tsunami
At 08:19 UTC on 17 July 2006, an earthquake
estimated at Mw = 7.8 resulted from a *200 km-
long rupture of the fault boundary between the sub-
ducting Australian Plate and the overriding Eurasian
Plate (BILEK and ENGDAHL, 2007; FUJII and
SATAKE, 2006). Although few people felt this ‘‘slow’’
earthquake, with a low moment to energy ratio
(REYMOND, 2006; NEWMAN, 1998), the resulting tsu-
nami affected at least 200 km of coastline and ran up
more than 20 m locally, killing more than 600 people
(FRITZ et al., 2007).
An International Tsunami Survey Team com-
posed of tsunami researchers from Greece, Indonesia,
New Zealand, Norway, and the United States visited
the damaged area from August 3rd to 7th, 2006, in
order to survey the damage caused by the tsunami
(FRITZ et al., 2007). The 17 members formed five
teams specializing in runup (three teams), greenbelt
effectiveness, and sedimentation. The sedimentology
team wrote this paper.
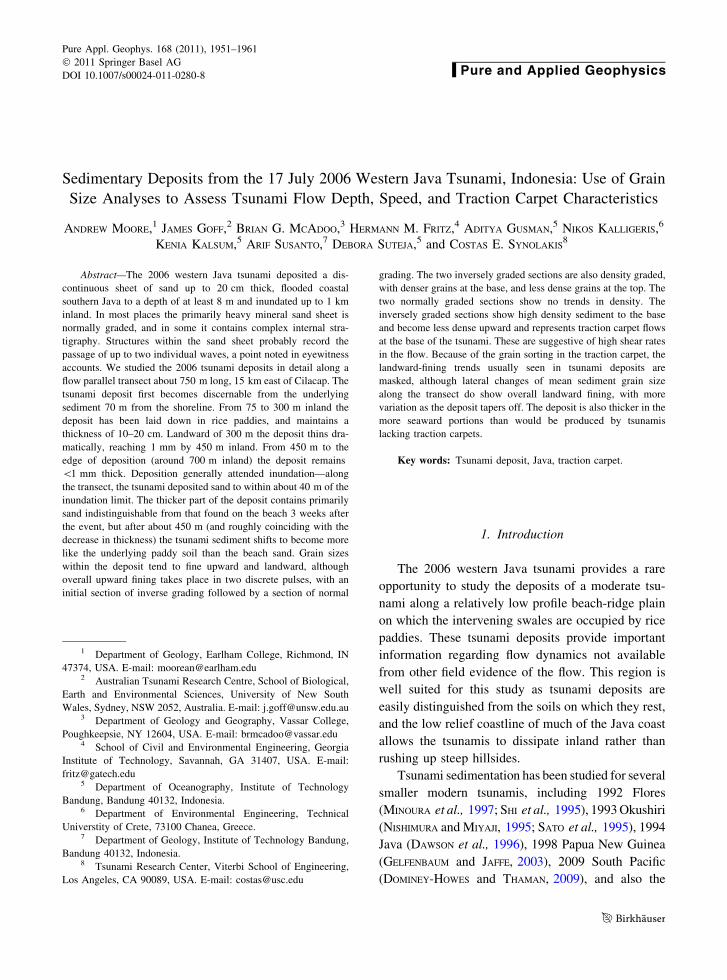
The sedimentology team traveled primarily to
coastal lowlands where the runup teams and satellite
imagery suggested extensive sand deposition. Coastal
plains extending inland for at least 1 km are common
along *30 km of coastline centered on Pangandaran
(Fig. 1), and for 50 km east of Cilacap. Between the
two cities and west of the Pangandaran plain the
Figure 1Measured tsunami runup and tsunami heights along Java’s south coast (FRITZ et al., 2007). Located epicenter for the 17 July 2006 earthquake
relative to the study area at Adipala. Tsunami height is composed of terrain elevation and flow depth above ground
1952 A. Moore et al. Pure Appl. Geophys.
coastline becomes steep, limiting the possibility of
sediment deposition.
3. Adipala Study Area
We selected the Adipala study area, east of
Cilacap, because of its relatively uniform physiog-
raphy with few buildings, ease of access and presence
of abundant flow direction indicators in the form of
low-lying dune grasses and rice plants. In this loca-
tion we characterized the tsunami sedimentation by
establishing a measured transect in the direction of
flow, extending from the shoreline to the limit of
inundation.
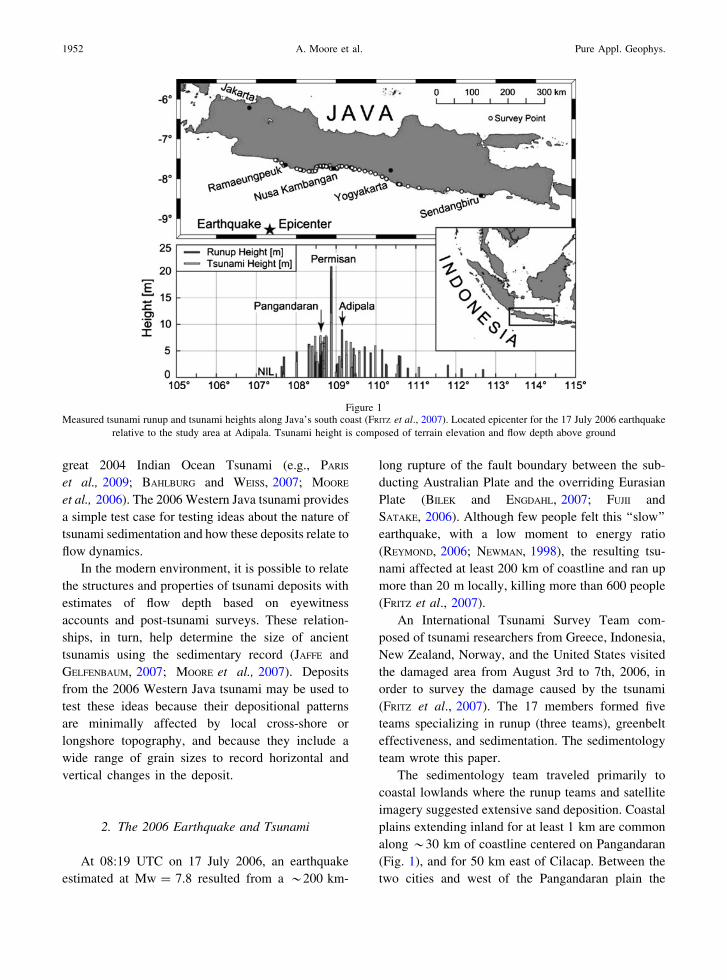
The 750 m transect is located between the Serayu
and Bengawan rivers, about 15 km east of Cilacap
(Fig. 2). It lies on an open coastal plain with Holo-
cene beach and dune sands overlying Tertiary
andesitic breccias (ASIKIN et al., 1992). The first
80 m from the mean high tide (MHT) line is the
modern beach ridge with an elevation of 1.2 m above
MHT. With the exception of a narrow ridge and
swale topography, the remainder of the transect pas-
ses through a generally broad, flat plain that has been
terraced for rice farming, gaining *20–50 cm of
elevation between dikes that separate individual rice
paddy fields which are practically flat, and vary in
length between 15 and 60 m (along the transect) and
are 15–20 m wide (Fig. 3).
Although few markers of flow depth were avail-
able along the transect, eyewitnesses to the disaster
reported that the tsunami here reached flow depths of
5 m adjacent to the coast, and that large waves
arrived twice, with the second wave being larger than
the first. The eyewitness observations in Adipala fit
well with the regional observations made by FRITZ
et al., (2007), where the wave height averaged
around 5 m for *100 km east of Cilicap.
4. Methods
Our measured transect originates at the shoreline
at 7�41025.500S, 109�8051.600E and extends *755 m
inland in the direction of flow, crossing the inland
limit of tsunami-deposited sand around 720 m from
shore and extending 40 m farther to the limit of
inundation (Fig. 3). We surveyed topography with a
hand level and tape measure. The horizontal distance
between stations was kept to \5 m (to retain accu-
racy). We measured sediment thickness, described
deposit stratigraphy, and collected sediment samples
at 20–40 m intervals along this transect. Sampling
Figure 22003 GeoEye photo of the study area showing line of transect in Fig. 3 (Photo credit: Google Earth)
Vol. 168, (2011) Sedimentary Deposits from the 17 July 2006 Western Java Tsunami, Indonesia 1953
locations were determined so that at least one sample
was collected from each diked field along the tran-
sect, and so that no sampling location was located
close to a dike, where the localized increased turbu-
lence might overwhelm the overall trends in
sedimentology and stratigraphy that are representa-
tive of the larger-scale flow dynamics of the tsunami.
Additionally, 100 m from the shore we pushed a
50 cm plastic core tube vertically through the deposit.
The sediment was retained in the tube and subse-
quently opened in the laboratory. Grain size analyses
of sub-samples taken at 0.5 cm intervals document
the vertical grain size changes in the deposit.
Samples for grain size analysis were dry heated to
140�C for 48 h before analysis. Few organics were
present in the sand samples (\1% by volume for most
samples, *10% by volume for the most landward
samples); large organic debris (primarily rice stems)
was removed with a forceps. Although seaward
samples contained almost no silt or clay, landward
samples often had abundant silt (up to 55% by
volume).
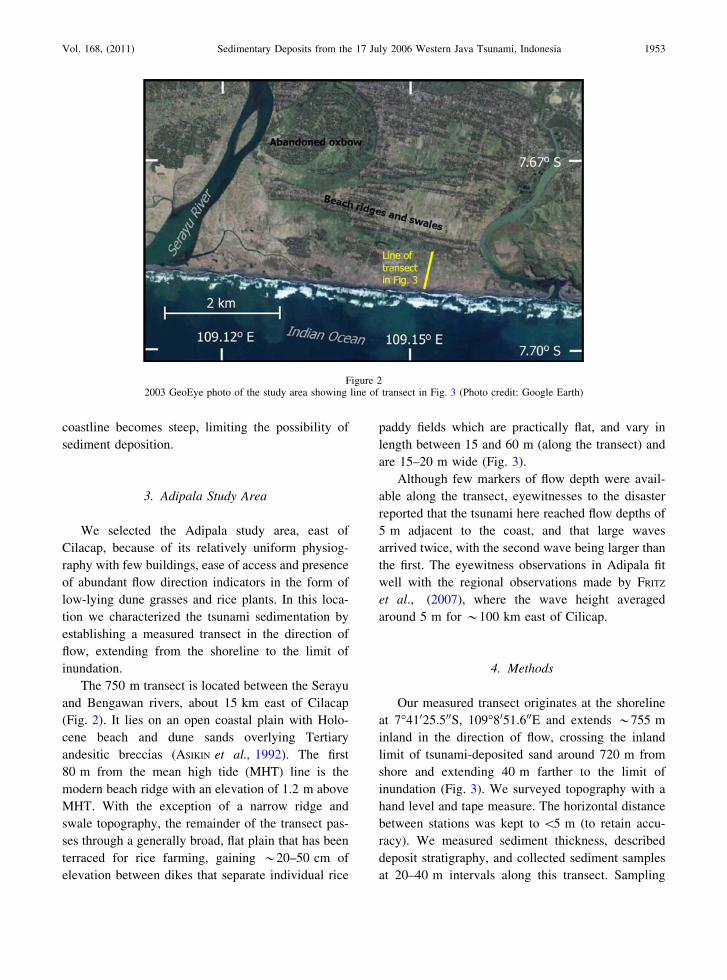
Figure 3Sediment transect at Adipala, central Java. Upper half transect topography measured using a hand level and measuring tape, with the sediment
grain size mean, standard deviation, and skewness overlain. Where more than one sample of the deposit was taken, the moment calculation is
based on a weighted average of the samples. The deposit thickness is shown as a vertical bar on the topographic profile. Lower half. Grain size
(in U) profiles for samples T5, T10, T14 and T25 are representative of the four zones of sediment deposition. The gray shaded region is the
grain size profile for the sample, the black outline is the grain size profile of beach sand, and the gray outline is the grain size profile of soil
underlying the tsunami deposit. Photographs of in situ deposits correspond to where samples T5, T10, T14 and T25 were taken
1954 A. Moore et al. Pure Appl. Geophys.
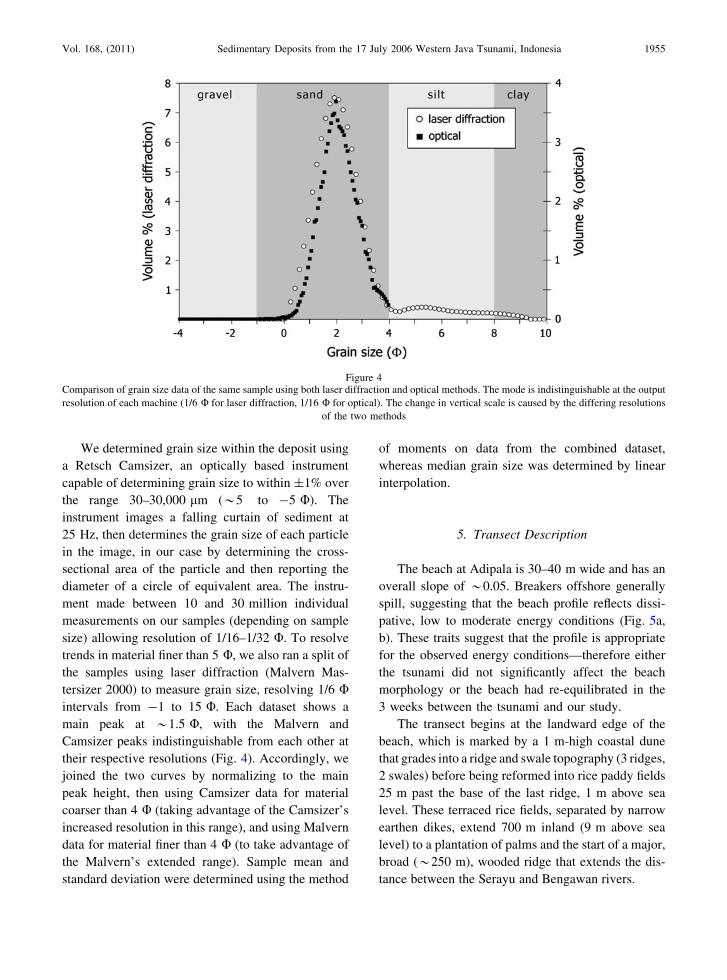
We determined grain size within the deposit using
a Retsch Camsizer, an optically based instrument
capable of determining grain size to within ±1% over
the range 30–30,000 lm (*5 to -5 U). The
instrument images a falling curtain of sediment at
25 Hz, then determines the grain size of each particle
in the image, in our case by determining the cross-
sectional area of the particle and then reporting the
diameter of a circle of equivalent area. The instru-
ment made between 10 and 30 million individual
measurements on our samples (depending on sample
size) allowing resolution of 1/16–1/32 U. To resolve
trends in material finer than 5 U, we also ran a split of
the samples using laser diffraction (Malvern Mas-
tersizer 2000) to measure grain size, resolving 1/6 Uintervals from -1 to 15 U. Each dataset shows a
main peak at *1.5 U, with the Malvern and
Camsizer peaks indistinguishable from each other at
their respective resolutions (Fig. 4). Accordingly, we
joined the two curves by normalizing to the main
peak height, then using Camsizer data for material
coarser than 4 U (taking advantage of the Camsizer’s
increased resolution in this range), and using Malvern
data for material finer than 4 U (to take advantage of
the Malvern’s extended range). Sample mean and
standard deviation were determined using the method
of moments on data from the combined dataset,
whereas median grain size was determined by linear
interpolation.
5. Transect Description
The beach at Adipala is 30–40 m wide and has an
overall slope of *0.05. Breakers offshore generally
spill, suggesting that the beach profile reflects dissi-
pative, low to moderate energy conditions (Fig. 5a,
b). These traits suggest that the profile is appropriate
for the observed energy conditions—therefore either
the tsunami did not significantly affect the beach
morphology or the beach had re-equilibrated in the
3 weeks between the tsunami and our study.
The transect begins at the landward edge of the
beach, which is marked by a 1 m-high coastal dune
that grades into a ridge and swale topography (3 ridges,
2 swales) before being reformed into rice paddy fields
25 m past the base of the last ridge, 1 m above sea
level. These terraced rice fields, separated by narrow
earthen dikes, extend 700 m inland (9 m above sea
level) to a plantation of palms and the start of a major,
broad (*250 m), wooded ridge that extends the dis-
tance between the Serayu and Bengawan rivers.
Figure 4Comparison of grain size data of the same sample using both laser diffraction and optical methods. The mode is indistinguishable at the output
resolution of each machine (1/6 U for laser diffraction, 1/16 U for optical). The change in vertical scale is caused by the differing resolutions
of the two methods
Vol. 168, (2011) Sedimentary Deposits from the 17 July 2006 Western Java Tsunami, Indonesia 1955
We saw no direct evidence of tsunami-induced
erosion on the transect. The beach has no visible
scarp, and even in our most seaward study location,
rice plants are still rooted in soil (Fig. 5c). The
boundary between the tsunami deposit and the
underlying soil is sharp, but retains fine details such
as footprints, further suggesting that little erosion
occurred on the transect.
The tsunami deposit overlies a brown (7.5 YR
4/4) sandy soil made up of sands mineralogically
similar to those of the tsunami deposit, but finer
grained (see photographs in Fig. 3). The soil also
contains silt and clay not found in the beach sedi-
ments; the coarse silts are organic-rich, and probably
represent organic debris from rice cultivation, mixed
with breakdown products of the iron oxides. The clay
fraction is inorganic, and is probably iron oxide
pigments. The presence of clays is likely to be par-
tially responsible for the lack of erosion of this basal
soil.
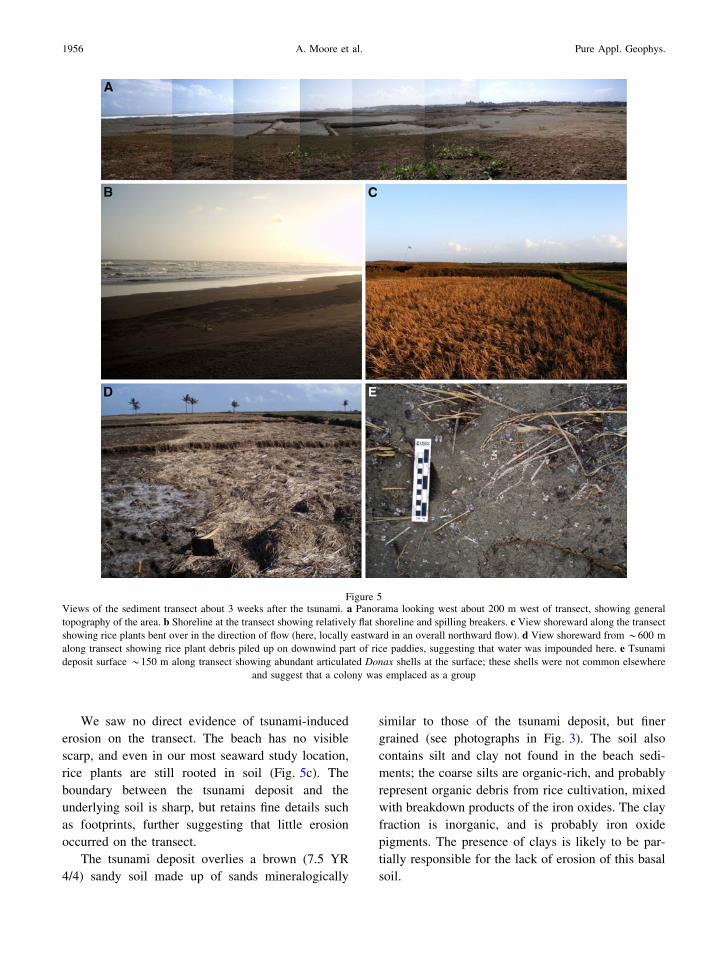
Figure 5Views of the sediment transect about 3 weeks after the tsunami. a Panorama looking west about 200 m west of transect, showing general
topography of the area. b Shoreline at the transect showing relatively flat shoreline and spilling breakers. c View shoreward along the transect
showing rice plants bent over in the direction of flow (here, locally eastward in an overall northward flow). d View shoreward from *600 m
along transect showing rice plant debris piled up on downwind part of rice paddies, suggesting that water was impounded here. e Tsunami
deposit surface *150 m along transect showing abundant articulated Donax shells at the surface; these shells were not common elsewhere
and suggest that a colony was emplaced as a group
1956 A. Moore et al. Pure Appl. Geophys.
Along the transect, the tsunami deposit itself
changes little in color (black, 7.5 YR 2.5/1; photo-
graphs in Fig. 3). Between the coastline and 350 m
inland (T10), it is a moderately sorted medium sand
becoming a poorly sorted fine to very fine sand
landward, with some fluctuations in mean grain size
between 550 and 700 m (samples T16 through T26;
Fig. 3). The sand grains are primarily olivine, mag-
netite, and ilmenite (*70%), with minor amounts of
quartz, amphibole, lithics, and glass. The grains are
generally angular, although olivine and quartz grains
are often subrounded as well. Although the overall
lithology is monomodal, lithics make up the bulk of
the coarser grains, and oxides the bulk of the finer
grains, suggesting that the hydraulic sorting based on
changes in density is perhaps more representative
than our grain sizing techniques. The prominence of
iron oxides is supported by the measured high sedi-
ment density (3.54 g/cm3), which is consistent with
mixing siliciclastic grains and magnetite/ilmenite.
Few shells or coral fragments were found in the
deposit, but in at least one location (150 m from
shore), hundreds of articulated Donax shells were
found at the surface, suggesting that a displaced
colony failed to adapt to life on land (Fig. 5d).
The tsunami deposit maintains a thickness of
between 10 and 20 cm from where it first becomes
discernable from the underlying sediment 70 m from
the shoreline (T1–T10; Fig. 3). At 330 m from the
shoreline, the deposit begins to thin, becoming only
1.5 cm by 440 m, and only 0.1 cm by 470 m (T11–
T14). The deposit continues as a layer a few grains
thick until 720 m, when it again becomes indistin-
guishable from the underlying soil (T15–T26).
A wrack line of floated, organic material suggests that
inundation continued for 40 m past the last deposi-
tional evidence, a total of 755 m from shore.
Deposition is typically thicker on the landward side
of the flow-normal paddy dikes closer to the beach
(e.g., T3–T11)—in more landward sections, debris
(and some sediment) has been piled up against the
rear dikes of the paddies, suggesting that floating
debris was pushed back by the prevailing sea breeze
(Fig. 5e).
Seaward parts of the deposit are plane laminated
throughout (samples T1–T7), but the laminae were
not detectable by 200 m from shore. Sand between
200 and 400 m from shore had dried sufficiently in
the 3 weeks since deposition that it was not possible
using the techniques available to determine if any
structures had been preserved as sand typically fell
away to the angle of repose when cut into. In the very
seaward portions of the deposit (T1–T3, from 70 to
115 m), two bands of blacker sand containing more
magnetite than usual for the deposit appear at the
base and about halfway up the deposit. These bands
become indistinct farther landward, but density
changes in a core taken 160 m from shore suggest
that the bands persist at least that far inland (Fig. 6).
Lateral changes of mean sediment grain size
analysis along the transect shows overall landward
fining, with more variable lateral grain size trends as
the deposit tapers off (Fig. 3). Mean grain size along
the transect remains constant at just coarser than 2 U(0.25 mm) from at least 70 to 350 m along the tran-
sect (T1–T10), then begins to fine smoothly, reaching
3.75 U (0.075 mm) by T16 at 550 m (Fig. 3). From
550 m (T17) to the end of deposit, however, mean
grain size becomes variable, although it never
becomes as coarse as the seaward part of the transect.
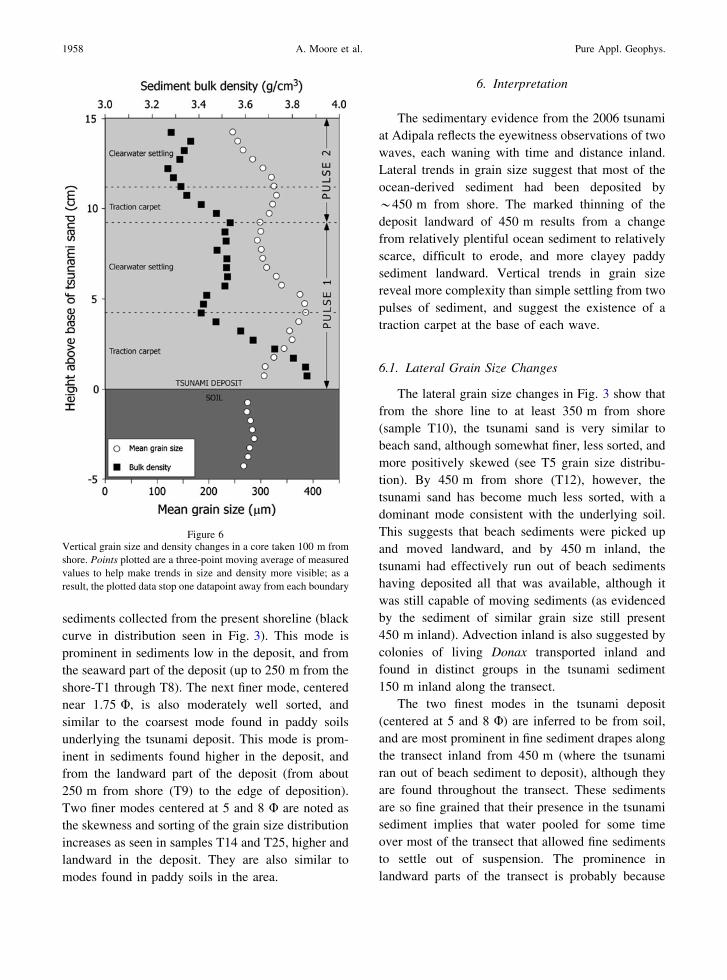
Vertical changes in grain size are also variable.
Upward fining takes place in two distinct pulses
where measured, 100 m from shore (near T2; Fig. 6).
From the base of the sand to about 1/3 of the deposit
thickness (here 4.5 cm) the sand is inversely graded,
coarsening upwards from 1.7 U (0.3 mm) to 1.3 U(0.38 mm). The second third of the deposit (between
4.5 and 9.5 cm) fines upwards (normally graded),
returning the mean grain size to 1.7 U (0.3 mm). The
uppermost third (9.5–15 cm) repeats the inversely
graded/normally graded pattern, but only coarsens to
1.6 U (0.33 mm) before falling to 2 U (0.25 mm).
Sediment bulk density generally behaves inversely to
grain size (so that the coarsest grains are the least
dense), but the density changes are not sufficient to
make the finer grains hydraulically equivalent to the
coarser ones, so that grain size patterns in the deposit
represent changes in hydraulics and not density
sorting of hydraulically equivalent grains.
The grain size population of the tsunami deposit
suggests at least four modes that may well represent
different sediment sources. The coarsest mode, cen-
tered near 1.5 U (see grain size distribution of T5,
Fig. 3), is moderately well sorted and similar to
Vol. 168, (2011) Sedimentary Deposits from the 17 July 2006 Western Java Tsunami, Indonesia 1957
sediments collected from the present shoreline (black
curve in distribution seen in Fig. 3). This mode is
prominent in sediments low in the deposit, and from
the seaward part of the deposit (up to 250 m from the
shore-T1 through T8). The next finer mode, centered
near 1.75 U, is also moderately well sorted, and
similar to the coarsest mode found in paddy soils
underlying the tsunami deposit. This mode is prom-
inent in sediments found higher in the deposit, and
from the landward part of the deposit (from about
250 m from shore (T9) to the edge of deposition).
Two finer modes centered at 5 and 8 U are noted as
the skewness and sorting of the grain size distribution
increases as seen in samples T14 and T25, higher and
landward in the deposit. They are also similar to
modes found in paddy soils in the area.
6. Interpretation
The sedimentary evidence from the 2006 tsunami
at Adipala reflects the eyewitness observations of two
waves, each waning with time and distance inland.
Lateral trends in grain size suggest that most of the
ocean-derived sediment had been deposited by
*450 m from shore. The marked thinning of the
deposit landward of 450 m results from a change
from relatively plentiful ocean sediment to relatively
scarce, difficult to erode, and more clayey paddy
sediment landward. Vertical trends in grain size
reveal more complexity than simple settling from two
pulses of sediment, and suggest the existence of a
traction carpet at the base of each wave.
6.1. Lateral Grain Size Changes
The lateral grain size changes in Fig. 3 show that
from the shore line to at least 350 m from shore
(sample T10), the tsunami sand is very similar to
beach sand, although somewhat finer, less sorted, and
more positively skewed (see T5 grain size distribu-
tion). By 450 m from shore (T12), however, the
tsunami sand has become much less sorted, with a
dominant mode consistent with the underlying soil.
This suggests that beach sediments were picked up
and moved landward, and by 450 m inland, the
tsunami had effectively run out of beach sediments
having deposited all that was available, although it
was still capable of moving sediments (as evidenced
by the sediment of similar grain size still present
450 m inland). Advection inland is also suggested by
colonies of living Donax transported inland and
found in distinct groups in the tsunami sediment
150 m inland along the transect.
The two finest modes in the tsunami deposit
(centered at 5 and 8 U) are inferred to be from soil,
and are most prominent in fine sediment drapes along
the transect inland from 450 m (where the tsunami
ran out of beach sediment to deposit), although they
are found throughout the transect. These sediments
are so fine grained that their presence in the tsunami
sediment implies that water pooled for some time
over most of the transect that allowed fine sediments
to settle out of suspension. The prominence in
landward parts of the transect is probably because
Figure 6Vertical grain size and density changes in a core taken 100 m from
shore. Points plotted are a three-point moving average of measured
values to help make trends in size and density more visible; as a
result, the plotted data stop one datapoint away from each boundary
1958 A. Moore et al. Pure Appl. Geophys.
little sandy sediment remained to be deposited here—
as a result, the finer fraction becomes relatively more
important. Dikes between the rice fields would have
acted as impediments to shallow flow eventually
leading to impoundment and pooling at the landward
end of the transect.
6.2. Vertical Grain Size Changes
The core 100 m from shore shows two sequences
of a coarsening upward trend at the base followed by
a fining upward trend (Fig. 6). The coarsening
upwards layers also show high density sediment to
the base, and become less dense upward, whereas the
fining upwards layers remain relatively constant with
respect to density. The layers that fine upwards are
easily explained as the product of suspended sedi-
ment settling from a decelerating flow, as might be
expected from a tsunami. The coarsening upwards
deposits, however, are more unusual.
The observed inverse correlation of density and
grain size suggests kinetic sieving, where collisions at
the base of the flow cause finer grained and denser
material to fall downwards as the larger, less dense
grains are jostled to the top (SOHN, 1997). This highly
concentrated sediment at the base of the flow is known
as a ‘‘traction carpet,’’ or a collision-dominated flow
driven by high shear stresses in the suspension-
dominated flow above. As the bed aggrades, the first
grains deposited (smallest, most dense) become
selectively removed from the traction carpet. These
particles are less dense than the larger particles and
their absence explains the reduction in the overall bulk
density upward in the deposits (Fig. 6).
Based on the coarsening upward trends in the base
of the deposit, deposition during the tsunami occurs
as a thin, hyperconcentrated flow of beach sand at the
base of the tsunami and a thick, turbulent flow that
keeps particles in suspension as the tsunami flows
across land (LEROUX and VARGAS, 2005). The hyper-
concentrated ‘‘traction carpet’’ exists because of very
high shear rates in the overlying flow, and can be
maintained only as long as those shear rates remain
high. During the lifespan of the traction carpet,
material settling to the bed from the turbid flow enters
the traction carpet, providing more sediment to that
flow. Once shear in the overlying flow drops to the
extent that the traction carpet can no longer be
maintained, normal settling begins, producing a
normally graded bed. Passage of a second wave
repeats the process.
Traction carpets do not sort sediment laterally.
Landward fining from the suspended sediment
portion of the flow will be obscured where the carpet
is present. Landward fining at Adipala does not begin
until about 300 m, suggesting that the traction carpet
extends about this far inland.
6.3. Size Estimate
Size of the tsunami can be estimated using the
coarsest grains deposited by the turbid portion the
flow (as compared to those in the traction carpet),
the distance from shore where they were found, then
testing against field evidence of tsunami height. If the
beach sands found in the tsunami deposit were to
have traveled in suspension from their source (at or
near the shoreline) to the farthest distance inland at
which they were found, the maximum time available
for travel is the time it would take for these grains to
settle from the top of the flow, a time given by:
h
ws
¼ t ¼ l
Uð1Þ
where ws is the settling velocity of the coarsest grains,
h is the depth of the flow, U is the depth-averaged
velocity, and l is the distance from the beach ridge to
the location of the last grains (MOORE, 1994;
MOORE et al., 2007). The coarsest grains present
350 m inland measure about 1.1 U (0.48 mm at T10);
using the average sediment bulk density for sediments
in the turbid part of the flow (*3.4 g/cm3), the settling
velocity of these grains is 8.0 cm/s (Dietrich, 1982).
Substituting into Eq. 1 yields:
Uh ¼ 28 ð2Þ
for this flow. If the tsunami arrived as a bore (as
eyewitnesses report), then the Froude number of the
wave should be at or near 1 (FRITZ et al., 2003)
F ¼ Uffiffiffiffiffi
ghp � 1 ð3Þ
which yields a two-equation, two-unknown system.
Solving this system using the method outlined in
Vol. 168, (2011) Sedimentary Deposits from the 17 July 2006 Western Java Tsunami, Indonesia 1959
MOORE et al., (2007) gives a flow depth of about
4.3 m moving at 6.5 m/s for the first wave of the
tsunami. Using a slightly subcritical Froude number
(as should occur in the area just seaward of the bore,
where most sediment transport will occur) of 0.8
yields a flow depth of 5.0 m moving at 5.6 m/s,
which correlates well with the field observations of a
5 m tsunami in this area (FRITZ, et al., 2006).
It should be noted that the modeling of tsunami
flow velocity from particle advection described above
has three main assumptions. First, that the largest
grain size is suspended to the top of water column.
Second, that such a particle falls from that height to
the bed at the landward limit that the particle is found
without multiple up and down excursions, possibly
hitting the bed and being resuspended. The effect of
violation of the second assumption is that the
effective settling velocity is lower than the actual
settling velocity and that the flow velocity is lower
than that calculated using the water column height at
the shore. Third, that the velocity at the shore applies
for the entire transport path to 350 m, where the
sediment particle was deposited. This is an overes-
timate if the tsunami slows as it moves inland, which
is typical.
7. Summary
Along a 750-m-long transect of sediments
deposited by the 2006 Central Java tsunami near
Adipala, Indonesia, sandy deposits show a zone of
little landward fining from 0 to 300 m, where the
deposit is thickest. From 300 to 500 m inland, the
deposit fines landward but becomes dramatically
thinner. From 500 m landward to the limit of depo-
sition, a very thin deposit shows inconsistent grain
sizes, most likely caused by the mixture of fine silt
and clay from the tsunami deposit mixed during
sampling with underlying soil. Vertical trends in the
sand show two coarsening-fining upward cycles,
probably corresponding to the two waves reported by
eyewitnesses. The coarsening base of each pulse
probably represents a traction carpet caused by high
excess shear in the overlying tsunami. When param-
eterizing, fining by the change in bulk (deposit
averaged) grain size including portions deposited by
traction carpets obscure trends in landward fining,
since little to no lateral grain size trend is to be
expected in this transport mode. Having two modes
of sediment transport (traction carpet and suspended
sediment) also tends to complicate modeling based
on sediment thickness, as they hyperconcentrate part
of the flow, making a thicker deposit than would a
wave without a traction carpet. On the other hand, the
overall thickness and distance inland traveled by
traction carpets may provide insight into tsunami
hydraulics, adding to information available from the
turbid portion of the deposit. It is probable that high
sediment bulk density at the site created favorable
conditions for the formation of a traction carpet. Data
from subsequent post-tsunami surveys, however, will
help to clarify this proposition.
REFERENCES
ASIKIN, S., HANDOYO, A., PRASTISTHO, B., and GAFOER, S., 1992,
Geology of the Banyumas Quadrangle, Java: Bandung, Indone-
sia, Geological Research and Development Center, Department
of Mines and Energy.
BAHLBURG, H., and WEISS, R., 2007, Sedimentology of the Decem-
ber 26, 2004, Sumatra tsunami deposits in eastern India (Tamil
Nadu) and Kenya: International Journal of Earth Sciences, vol.
96, no. 6, p.1195-1209.
BILEK, S.L., and ENGDAHL, E.R., 2007, Rupture characterization
and aftershock relocations for the 1994 and 2006 tsunami
earthquakes in the Java subduction zone. Geophys. Res. Lett.,
34, L20311, doi:1029/2007GL031357.
DAWSON, A.G., SHI, S., DAWSON, S., TAKAHASHI, T., and SHUTO, N.,
1996, Coastal sedimentation associated with the June 2nd and
3rd, 1994 tsunami in Rajegwesi, Java: Quaternary Science
Reviews, v. 15, p. 901-912.
DIETRICH, W.E., 1982. Settling velocity of natural particles. Water
Resources Research 18, 1615–1626.
DOMINEY-HOWES, D., and THAMAN, R., 2009, UNESCO-IOC Inter-
national Tsunami Survey Team Samoa (ITST Samoa) Interim
Report of Field Survey, 14th Ð 21st October 2009. Australian
Tsunami Research Centre Miscellaneous Report No. 2: October
2009, 190 p.
FRITZ, H.M., J.C. BORRERO, C.E. SYNOLAKIS, J. YOO, 2006, 2004
Indian Ocean tsunami flow velocity measurements from survivor
videos, Geophys. Res. Lett., 33, L24605, doi:10.1029/2006
GL026784.
FRITZ, H.M., HAGER, W.H., MINOR, H.-E., 2003, Landslide gener-
ated impulse waves: part 1: instantaneous flow fields. Exp. Fluids
35:505-519.
FRITZ, H.M., W. KONGKO, A. MOORE, B. MCADOO, J. GOFF, C.
HARBITZ, B. USLU, N. KALLIGERIS, D. SUTEJA, K. KALSUM, V.
TITOV, A. GUSMAN, H. LATIEF, E. SANTOSO, S. SUJOKO, D. DJUL-
KARNAEN, H. SUNENDAR, C. SYNOLAKIS, 2007, Extreme runup from
1960 A. Moore et al. Pure Appl. Geophys.
the 17 July 2006 Java tsunami, Geophys. Res. Lett., 34, L12602,
doi:10.1029/2007GL029404.
FUJII, Y., and SATAKE, K., 2006, Source of the July 2006 West Java
tsunami estimated from tide gauge records, Geophys. Res. Lett.,
33, doi:10.1029/2006GL028049.
GELFENBAUM, G., and JAFFE, B., 2003, Erosion and sedimentation
from the 17 July, 1998 Papua New Guinea tsunami: Pure and
Applied Geophysics, v. 160, p. 1969-1999.
JAFFE, B., and GELFENBAUM, G., 2007, A Simple Model for Calcu-
lating Tsunami Flow Speed from Tsunami Deposits: Sedimentary
Geology, v. 200, p. 347-361.
LEROUX, J.P., and VARGAS, G., 2005, Hydraulic behavior of tsunami
backflows: insights from their modern and ancient deposits:
Environmental Geology, v. 49, p. 65-75.
MINOURA, K., IMAMURA, F., TAKAHASHI, T., and SHUTO, N., 1997,
Sequence of sedimentation processes caused by the 1992 Flores
tsunami: Geology, v. 25, p. 523-526.
MOORE, A., 1994, Evidence for a Tsunami in Puget Sound *1000
Years Ago [M.S. thesis]: Seattle, University of Washington.
MOORE, A., MCADOO, B.G., and RUFFMAN, A., 2007, Landward
fining from multiple sources in a sand sheet deposited by the
1929 Grand Banks tsunami, Newfoundland: Sedimentary Geol-
ogy, v. 200, p. 336-346.
MOORE, A., NISHIMURA, Y., GELFENBAUM, G., KAMATAKI, T., and
TRIYONO, R., 2006, Sedimentary deposits of the 26 December
2004 tsunami on the northwest coast of Aceh, Indonesia: Earth,
Planets, and Space, v. 58, p. 253-258.
NEWMAN, A. V., and E. A. OKAL, 1998, Teleseismic estimates of
radiated seismic energy: The E/M0 discriminant for tsunami
earthquakes, J. Geophys. Res., 103(11), 26,885–26,898.
NISHIMURA, Y., and MIYAJI, N., 1995, Tsunami deposits from the
1993 Southwest Hokkaido earthquake and the 1640 Hokkaido
Komagatake eruption, Northern Japan, in Satake, K., and
Imamura, F., eds., Tsunamis: 1992-1994, their generation,
dynamics, and hazard: Basel, Birkhauser, p. 719-734.
PARIS, R., WASSMER, P., SARTOHADI, J., LAVIGNE, F., BARTHOMEUF,
B., DESGAGES, E., GRANCHER, D., BAUMERT, P., VAUTIER, F.,
BRUNSTEIN, D., and GOMEZ, C., 2009, Tsunamis as geomorphic
crises: Lessons from the December 26, 2004 tsunami in Lhok
Nga, West Banda Aceh (Sumatra, Indonesia): Geomorphology,
104, 59-72.
REYMOND, D., and E. A. OKAL, 2006, Rapid, yet robust source
estimates for challenging events: Tsunami earthquakes and
mega-thrusts, Eos Trans. AGU, 87(52), Fall Meet. Suppl.,
Abstract S14A-02.
SATO, H., SHIMAMOTO, T., TSUTSUMI, A., and KAWAMOTO, E., 1995,
Onshore tsunami deposits caused by the 1993 Southwest Hok-
kaido and 1983 Japan Sea earthquakes, in Satake, K., and
Imamura, F., eds., Tsunamis: 1992-1994, their generation,
dynamics, and hazard: Basel, Birkhauser, p. 693-717.
SHI, S., DAWSON, A.G., and SMITH, D.E., 1995, Coastal sedimen-
tation associated with the December 12th, 1992 tsunami in
Flores, Indonesia, in Satake, K., and Imamura, F., eds., Tsuna-
mis: 1992-1994, their generation, dynamics, and hazard: Basel,
Birkhauser, p. 525-536.
SOHN, Y.K., 1997, On traction-carpet sedimentation: Journal of
Sedimentary Research, v. 67, p. 502-509.
(Received September 8, 2010, revised December 28, 2010, accepted December 29, 2010, Published online May 4, 2011)
Vol. 168, (2011) Sedimentary Deposits from the 17 July 2006 Western Java Tsunami, Indonesia 1961
Related Documents