AEGC 2018: Sydney, Australia 1 Sedimentary Characteristics and Lithological Trap Identification of Distant Braided Delta Deposits: A Case on Upper Cretaceous Yogou Formation of Termit Basin, Niger ZHAO Ning HUANG Jiangqin PetroChina RIPED CECEP L&T Environmental Technology No.20 Xueyuan Road, Haidian District, Beijing, No.9, The 3 rd Shangdi Street, Haidian District, Beijing, China. 100083 China. 100085 [email protected] [email protected] SUMMARY Lithological trap identification in thin sand and thick shale layers is still a challenge for hydrocarbon exploration. Based on the high- resolution sequence stratigraphy theory and the establishment of high resolution sequence stratigraphy framework with seismic-well tie, the dynamic deposition process of braided river delta sands on late Cretaceous Yogou formation has been analyzed on 62 wells in passive rift Termit basin with multi-stages depressions and reversals. (1) Six kinds of sedimentary microfacies and three major reservoir sands with multi-stages stacking and lateral migration are in Yogou formation; (2) Based on Accommodation space/Sediments supply change and the deposition progress, sedimentary facies distribution in each member of YS3 sub-formation has been done according to sands thickness statistics of sedimentary micro-facies, narrow-time seismic attributes and slices analysis, multi-sources braided river delta depositional model has been concluded; (3) Based on source rock and caprock evaluation, with reservoir sands distribution and faults impact on Yogou formation of Termit basin, four types of traps, including structure-lithology, Structure-strata, stratigraphic and lithology are concluded. Traps influencing factors, i.e., structure geometry, sands distribution, paleotopography, stratigraphy cycling, sand/shale lateral connection, reservoir quality and so on, have different impacts on these traps, and different lithologic-stratigraphy traps have different exploration risks. Structure geometry and sands distribution are very important for the structure-lithology traps; structure geometry and paleotopography are the key factors in Structure-strata traps. Sands distribution and reservoir quality can be focused on lithology traps. Moreover, paleotopography and sand/shale lateral connection are significant on stratigraphic traps. Therefore, different hydrocarbon accumulation types of lithological traps have been established. Key words: A/S, Sedimentary characteristics, RMS, Lithology trap, influencing factors INTRODUCTION As M.c.Pherson mentioned (M.c.Pherson, 1988), braided river delta is rich in sands and gravels, formed by braided rivers system influxing into stagnant water, and there are many classification schemes about braided river delta models, i.e., shallow or deep water kinds (Zhu Xiaomin, 2013), gentle or steep slope types (Yu Xinhe, 2008), progradation or retrogradation sorts (Wang Yue, 2015; Li Shunming, 2011; Zhou Hongrui, 2006), and distant or nearby models (Zhou Lihong, 2013; Yang Fan, 2010) with no consistency. Different evolution stages of sedimentary basin cause the different controlling factors in deposition progress of braided river deltas. Since the 1970’s, the exploration level of most hydrocarbon basins has been so high in all around world, and most of traps have been found in relatively regular anticlines. The next step is to find newly subtle traps, i.e. lithologic stratigraphy traps. Carl (1880) found various, different shape, unknown, and unpredictable non-anticline reservoirs (Pang Xiongqi, 2007). Following “non-structural trap” (Wilson, 1934 (Niu Jiayu,2005)) and “stratigraphic trap” (A.I.levorsen, 1936, (Jiao Hansheng, 2000)), A.I.levorsen (1966) pointed out subtle trap concept systematically, and M.T.Halbouty (1972) (Zhang Wei, 2006) included stratigraphic trap, unconformity trap and paleo-topographic trap into subtle traps, but used rarely at that time. Professor Jia Chengzao (2003) suggested “lithologic stratigraphy trap” instead of “subtle trap” in 2003. For reasons of the difficulty of the trap identification, irregular shape, trap scale, low seismic technology accuracy, and high risk of oil/gas exploration, most of overseas oil company do not willing to explore litho-strata traps. For thin sand and shale interlayers in braided-river delta front deposits, based on high-resolution sequence stratigraphy (HRSS), this text discusses sands progradation and retrogradation through the dynamic depositional progress, considering about tectonic evolution of Termit basin, sedimentary micro-facies characteristics of the 3 rd member of Yogou formation, sands or shales thickness distribution of micro-facies statistics, multi-provenance supply sedimentary model on upper Cretaceous period, sands distribution evolution with seismic attributes prediction and well logs. Moreover, this text also evaluates source-reservoir-caprock condition on TOC, HI, and Kerogen maturity for source evaluation, sand thickness and porosity distribution for reservoir evaluation, and shales density, thickness, porosity and permeability for caprock evaluation. And then it shows favourable areas on Fana uplift-Yogou slope southeast Termit basin for depression tectonic background, slope paleotopography, near hydrocarbon center, sand-shale interlayer associations, and discusses influencing factors about structure geometry, paleotopography, sands distribution, sand-shale lateral connection, reservoir quality on four kinds of lithologic traps, i.e., structure-lithology, Structure-strata, stratigraphic and lithology traps. Finally, this text concludes the hydrocarbon accumulation model of four kinds of lithologic traps in upper Cretaceous period of Termit basin, and predicts risks and targets of lithologic traps for great support to oil-gas exploration of Termit basin.

Welcome message from author
This document is posted to help you gain knowledge. Please leave a comment to let me know what you think about it! Share it to your friends and learn new things together.
Transcript

AEGC 2018: Sydney, Australia 1
Sedimentary Characteristics and Lithological Trap Identification of Distant Braided Delta Deposits: A Case on Upper Cretaceous Yogou Formation
of Termit Basin, Niger ZHAO Ning HUANG Jiangqin PetroChina RIPED CECEP L&T Environmental Technology No.20 Xueyuan Road, Haidian District, Beijing, No.9, The 3rd Shangdi Street, Haidian District, Beijing, China. 100083 China. 100085 [email protected] [email protected]
SUMMARY
Lithological trap identification in thin sand and thick shale layers is still a challenge for hydrocarbon exploration. Based on the high-
resolution sequence stratigraphy theory and the establishment of high resolution sequence stratigraphy framework with seismic-well
tie, the dynamic deposition process of braided river delta sands on late Cretaceous Yogou formation has been analyzed on 62 wells in
passive rift Termit basin with multi-stages depressions and reversals. (1) Six kinds of sedimentary microfacies and three major reservoir
sands with multi-stages stacking and lateral migration are in Yogou formation; (2) Based on Accommodation space/Sediments supply
change and the deposition progress, sedimentary facies distribution in each member of YS3 sub-formation has been done according to
sands thickness statistics of sedimentary micro-facies, narrow-time seismic attributes and slices analysis, multi-sources braided river
delta depositional model has been concluded; (3) Based on source rock and caprock evaluation, with reservoir sands distribution and
faults impact on Yogou formation of Termit basin, four types of traps, including structure-lithology, Structure-strata, stratigraphic and
lithology are concluded. Traps influencing factors, i.e., structure geometry, sands distribution, paleotopography, stratigraphy cycling,
sand/shale lateral connection, reservoir quality and so on, have different impacts on these traps, and different lithologic-stratigraphy
traps have different exploration risks. Structure geometry and sands distribution are very important for the structure-lithology traps;
structure geometry and paleotopography are the key factors in Structure-strata traps. Sands distribution and reservoir quality can be
focused on lithology traps. Moreover, paleotopography and sand/shale lateral connection are significant on stratigraphic traps.
Therefore, different hydrocarbon accumulation types of lithological traps have been established.
Key words: A/S, Sedimentary characteristics, RMS, Lithology trap, influencing factors
INTRODUCTION
As M.c.Pherson mentioned (M.c.Pherson, 1988), braided river delta is rich in sands and gravels, formed by braided rivers system
influxing into stagnant water, and there are many classification schemes about braided river delta models, i.e., shallow or deep water
kinds (Zhu Xiaomin, 2013), gentle or steep slope types (Yu Xinhe, 2008), progradation or retrogradation sorts (Wang Yue, 2015; Li
Shunming, 2011; Zhou Hongrui, 2006), and distant or nearby models (Zhou Lihong, 2013; Yang Fan, 2010) with no consistency.
Different evolution stages of sedimentary basin cause the different controlling factors in deposition progress of braided river deltas.
Since the 1970’s, the exploration level of most hydrocarbon basins has been so high in all around world, and most of traps have been
found in relatively regular anticlines. The next step is to find newly subtle traps, i.e. lithologic stratigraphy traps. Carl (1880) found
various, different shape, unknown, and unpredictable non-anticline reservoirs (Pang Xiongqi, 2007). Following “non-structural trap”
(Wilson, 1934 (Niu Jiayu,2005)) and “stratigraphic trap” (A.I.levorsen, 1936, (Jiao Hansheng, 2000)), A.I.levorsen (1966) pointed out
subtle trap concept systematically, and M.T.Halbouty (1972) (Zhang Wei, 2006) included stratigraphic trap, unconformity trap and
paleo-topographic trap into subtle traps, but used rarely at that time. Professor Jia Chengzao (2003) suggested “lithologic stratigraphy
trap” instead of “subtle trap” in 2003. For reasons of the difficulty of the trap identification, irregular shape, trap scale, low seismic
technology accuracy, and high risk of oil/gas exploration, most of overseas oil company do not willing to explore litho-strata traps.
For thin sand and shale interlayers in braided-river delta front deposits, based on high-resolution sequence stratigraphy (HRSS), this
text discusses sands progradation and retrogradation through the dynamic depositional progress, considering about tectonic evolution
of Termit basin, sedimentary micro-facies characteristics of the 3rd member of Yogou formation, sands or shales thickness distribution
of micro-facies statistics, multi-provenance supply sedimentary model on upper Cretaceous period, sands distribution evolution with
seismic attributes prediction and well logs.
Moreover, this text also evaluates source-reservoir-caprock condition on TOC, HI, and Kerogen maturity for source evaluation, sand
thickness and porosity distribution for reservoir evaluation, and shales density, thickness, porosity and permeability for caprock
evaluation.
And then it shows favourable areas on Fana uplift-Yogou slope southeast Termit basin for depression tectonic background, slope
paleotopography, near hydrocarbon center, sand-shale interlayer associations, and discusses influencing factors about structure
geometry, paleotopography, sands distribution, sand-shale lateral connection, reservoir quality on four kinds of lithologic traps, i.e.,
structure-lithology, Structure-strata, stratigraphic and lithology traps.
Finally, this text concludes the hydrocarbon accumulation model of four kinds of lithologic traps in upper Cretaceous period of Termit
basin, and predicts risks and targets of lithologic traps for great support to oil-gas exploration of Termit basin.
AEGC 2018: Sydney, Australia 2
METHOD AND RESULTS
1. High-resolution sequence stratigraphy framework
In early Cretaceous period, Termit
basin went through thick alluvial fan
– river sands during rifting period
continental environment from
Valanginan to Albian stage in K1
formation with an intact the 2nd grade
sequence. In late Cretaceous period, it
became a limited-sea basin in Donga-
Yogou-Madama formation from
Cenomanian to Masstrichtian stage.
In the early epoch, Neo-Tethys and
south Atlantic oceans invaded into
Dinga and Moul depression, thick and
dark marine shales distributed in the
whole area, interbedded with thin and
fine sands deposits with retrograding
sequence stratigraphy stacking
pattern, especially in Turonian stage
(Lv Mingsheng, 2012) Donga
formation. In the late epoch, two
oceans retreated and disappeared from
Termit basin, with sands and shales
interlayers distributed in the whole
basin, with retrograding sequence
stacking pattern. Especially in Maastrichtian age, thick braided river channel sands overlaid vertically in Madama formation, indicating
relatively high hydraulic power in depositional progress (Figure.1). Therefore, another the 2nd grade sequence includes low-stand
system tract (LST) in early Donga formation, transgressive systems tract (TST) from middle Donga to early Yogou formation, high-
stand systems tract (HST) from late Yogou to late Madama formation (Figure.1).
There are two unconformities between
K1 and Donga formation, between
Madama and Sokor1 formation, and
they are the boundary between lower
Cretaceous, upper Cretaceous epoch
and Paleogene period. Combined with
logging data, choosing high continuity
and high amplitude seismic axis which
can be searched for whole area in
Sokor and Yogou formation
(Figure.2), the 3rd grade sequence
stratigraphy can be further divided.
Sokor1, sokor2 and sokor3 sub-
formations can be classified in sokor
formation in the 3rd grade, and ES1-
ES5 members are identified in sokor1
sub-formation. YS1, YS2 and YS3
sub-formations are divided in the 3rd
grade, and YS3-1-YS3-3 members
can be identified in YS3 sub-formation. High or low amplitude caused by impedance difference reflects sand-shale deposits
homogeneity, the continuity and frequency of seismic axis gives the information about sands continuity of lateral and planar
distribution, and also the hydrodynamic condition in deposition process.
According to HRSS and seismic and logging data, considering sands progradation and retrogradation dynamic process, Yogou
formation are divided into three sub-formations, showing coarsening upwards deposits, with funnel shape gamma (GR) and resistivity
(RT) logs, and from low to high amplitude and frequency seismic changes, which indicates getting higher hydrodynamic power
upwards. The upper YS3 sub-formation deposits marine braided delta front interlayers, with medium-low GR and medium-high RT
logs, corresponding with high amplitude, medium continuity and medium-high frequency seismic characteristics; the middle YS2 sub-
formation is grey or dark grey thick marine shales, interlaid with thin sands layers, with high GR, low RT logs, corresponding with
medium-high amplitude, high continuity and high frequency seismic characteristics; the lower YS1 sub-formation has dark grey thick
marine shales, without sand layers, with high GR, low RT logs, corresponding with high amplitude, high continuity and medium
frequency seismic responses. Furthermore, YS3-1/YS3-2/YS3-3 member (Figure.2), corresponding to three sand group can be
Figure.1 Tectonic structure and high-resolution sequence stratigraphy of Termit basin (left
figure: tectonic structure on Yogou formation of Termit basin; right figure: high resolution
sequence stratigraphy framework of Termit basin. Notes: BLC–base level cycle, LST –
low-stand system tract; TST – transgressive system tract; HST – high-stand system tract;
BLC – base level cycle; S – source rock; R – reservoir; C – cap rock)
Figure.2 Seismic well tie tectonic evolution in Termit basin (the left figure shows tectonic
evolution and high-resolution sequence stratigraphy classification on seismic well tie data
from Campanian to Eocene period, 2D line in Yogou slope. Hydrodynamic condition changed
from quiet to turbulent and then to quiet, with different BLC changes in different stages)
AEGC 2018: Sydney, Australia 3
partitioned in the main target layer YS3
sub-formation, and sands in three
members are unstable. Different BLC
change of depositional layers can be
caused by different paleotopography in
depression period. Progradation and
coarsing upwards deposits are located on
upper slope, near provenance supply,
which is sandy upwards and shaly
downwards; Retrogradation and fining
upwards deposits are located on lower
slope, near depositional center, which is
shaly upwards and sandy downwards.
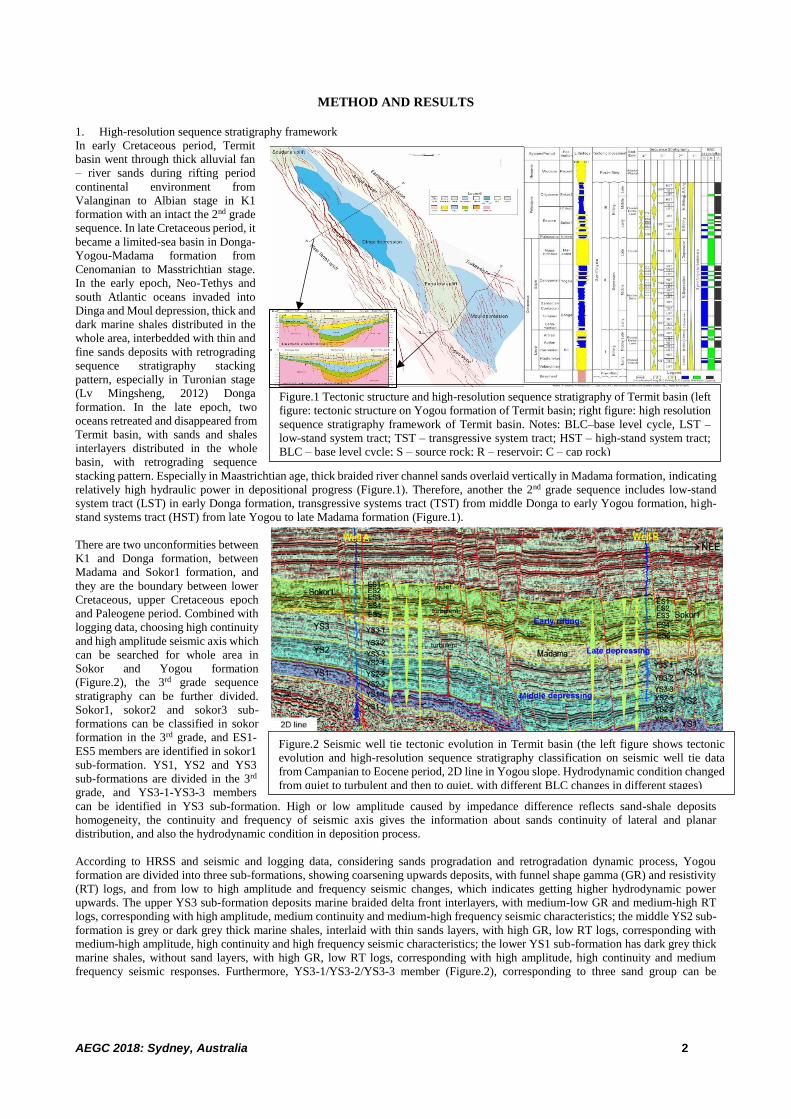
2. Sedimentary facies and sands
distribution
Based on HRSS division and correlation,
with seismic interpretation results, top
Yogou structure, bed thickness and
paleotopography are analyzed. Two sags,
two uplifts, two fault steps and two
slopes are the structure characters of
Termit basin, and the main Dinga sag
with Dinga fault step in west and Araga
graben in east, the secondary Moul sag with Yogou slope in west and Trakes slope in east, and Soudana uplift in north, Fana uplift
between two sags. Tethys ocean in north is unconnected with Dinga sag, the Atlantic Ocean in south connected with Moul sag during
Campanian stage Yogou formation, forming a limited sea and continental provenance depositional environment. Provenance in YS3
sub-formation came from the east, the northwest and the southwest, and continent sands supply was relatively more than a vast sea
environment (Zhao Ning, 2015). Marine – braided delta deposits, including braided delta front sands and seashore shales, were in
Yogou formation of Termit basin, using 62 wells logging, mud logging and 11607km2 3D seismic data. Sedimentary facies include
submarine distributary channel (SDC), mouth bar (MB), sand sheet (SS), coast shale (CS) and bathyal sea shale (Figure.3).
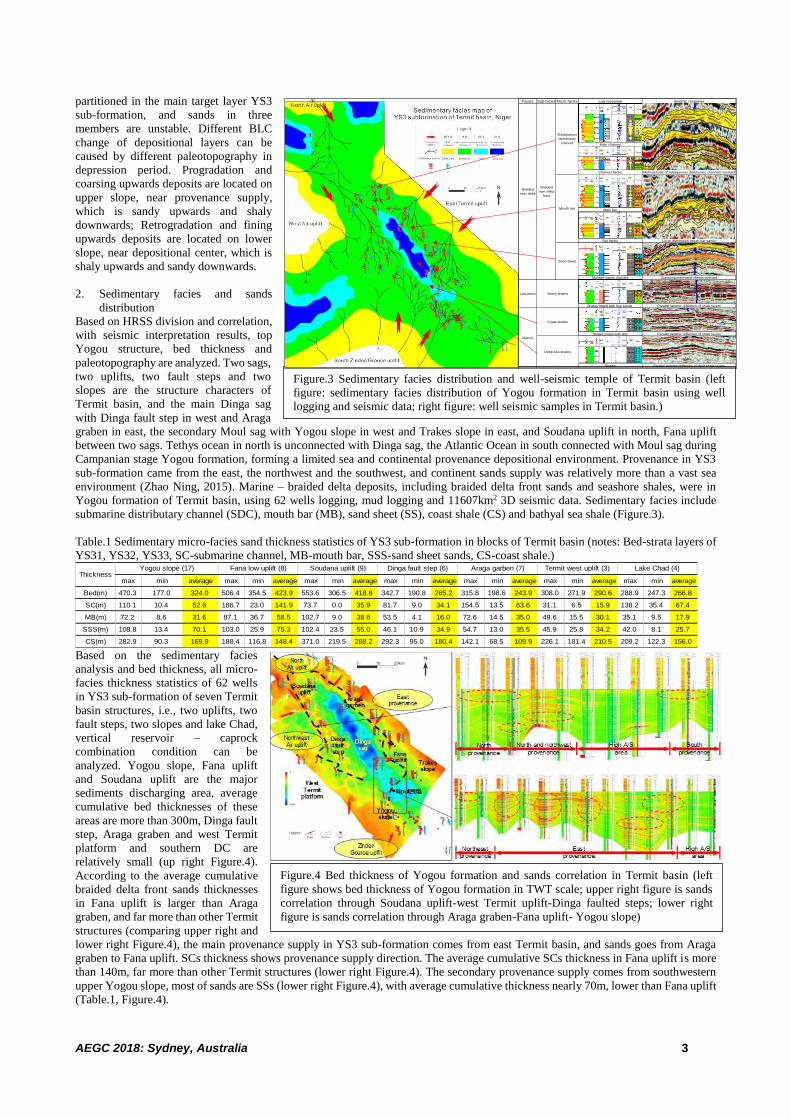
Table.1 Sedimentary micro-facies sand thickness statistics of YS3 sub-formation in blocks of Termit basin (notes: Bed-strata layers of
YS31, YS32, YS33, SC-submarine channel, MB-mouth bar, SSS-sand sheet sands, CS-coast shale.)
max min average max min average max min average max min average max min average max min average max min average
Bed(m) 470.3 177.0 324.0 506.4 354.5 423.9 553.6 306.5 418.8 342.7 190.8 265.2 315.8 198.6 243.9 308.0 271.9 290.6 288.9 247.3 266.8
SC(m) 110.1 10.4 52.6 186.7 23.0 141.9 73.7 0.0 35.9 81.7 9.0 34.1 154.5 13.5 63.6 31.1 6.5 15.9 138.2 35.4 67.4
MB(m) 72.2 8.6 31.6 87.1 36.7 58.5 102.7 9.0 38.6 53.5 4.1 16.0 72.6 14.5 35.0 49.6 15.5 30.1 35.1 9.5 17.9
SSS(m) 108.8 13.4 70.1 103.0 25.9 75.3 102.4 23.5 55.0 46.1 10.9 34.9 54.7 13.0 35.5 45.9 25.8 34.2 42.0 8.1 25.7
CS(m) 282.9 90.3 169.9 188.4 116.8 148.4 371.0 219.5 288.2 292.3 95.0 180.4 142.1 68.5 109.9 226.1 181.4 210.5 209.2 122.3 156.0
ThicknessTermit west uplift (3) Lake Chad (4)Yogou slope (17) Fana low uplift (8) Soudana uplift (9) Dinga fault step (6) Araga garben (7)
Based on the sedimentary facies
analysis and bed thickness, all micro-
facies thickness statistics of 62 wells
in YS3 sub-formation of seven Termit
basin structures, i.e., two uplifts, two
fault steps, two slopes and lake Chad,
vertical reservoir – caprock
combination condition can be
analyzed. Yogou slope, Fana uplift
and Soudana uplift are the major
sediments discharging area, average
cumulative bed thicknesses of these
areas are more than 300m, Dinga fault
step, Araga graben and west Termit
platform and southern DC are
relatively small (up right Figure.4).
According to the average cumulative
braided delta front sands thicknesses
in Fana uplift is larger than Araga
graben, and far more than other Termit
structures (comparing upper right and
lower right Figure.4), the main provenance supply in YS3 sub-formation comes from east Termit basin, and sands goes from Araga
graben to Fana uplift. SCs thickness shows provenance supply direction. The average cumulative SCs thickness in Fana uplift is more
than 140m, far more than other Termit structures (lower right Figure.4). The secondary provenance supply comes from southwestern
upper Yogou slope, most of sands are SSs (lower right Figure.4), with average cumulative thickness nearly 70m, lower than Fana uplift
(Table.1, Figure.4).
Figure.4 Bed thickness of Yogou formation and sands correlation in Termit basin (left
figure shows bed thickness of Yogou formation in TWT scale; upper right figure is sands
correlation through Soudana uplift-west Termit uplift-Dinga faulted steps; lower right
figure is sands correlation through Araga graben-Fana uplift- Yogou slope)
Figure.3 Sedimentary facies distribution and well-seismic temple of Termit basin (left
figure: sedimentary facies distribution of Yogou formation in Termit basin using well
logging and seismic data; right figure: well seismic samples in Termit basin.)
Facies Sub-facies Micro-facies Log response Seismic response
Main channel
Channel flanks Multi-periods of subaqueous distributary channels overlaid
Main bar
Bar flanks Local distribution mouth bar sands
Multiple sands overlaid Superimposed sand sheets overlaid
Shales mixed with fine sands Parallel seismic reflection of shale layers
Shales mixed with slits Parallel seismic reflection of shale layers
Shales Parallel seismic reflection of thick shale layers
Braided
river delta
front
Braided
river delta
Shore shales
Coast shales
Deep sea shales
Marine
Lacustrine
Subaqueous
distributary
channel
Mouth bar
Sand sheet
AEGC 2018: Sydney, Australia 4
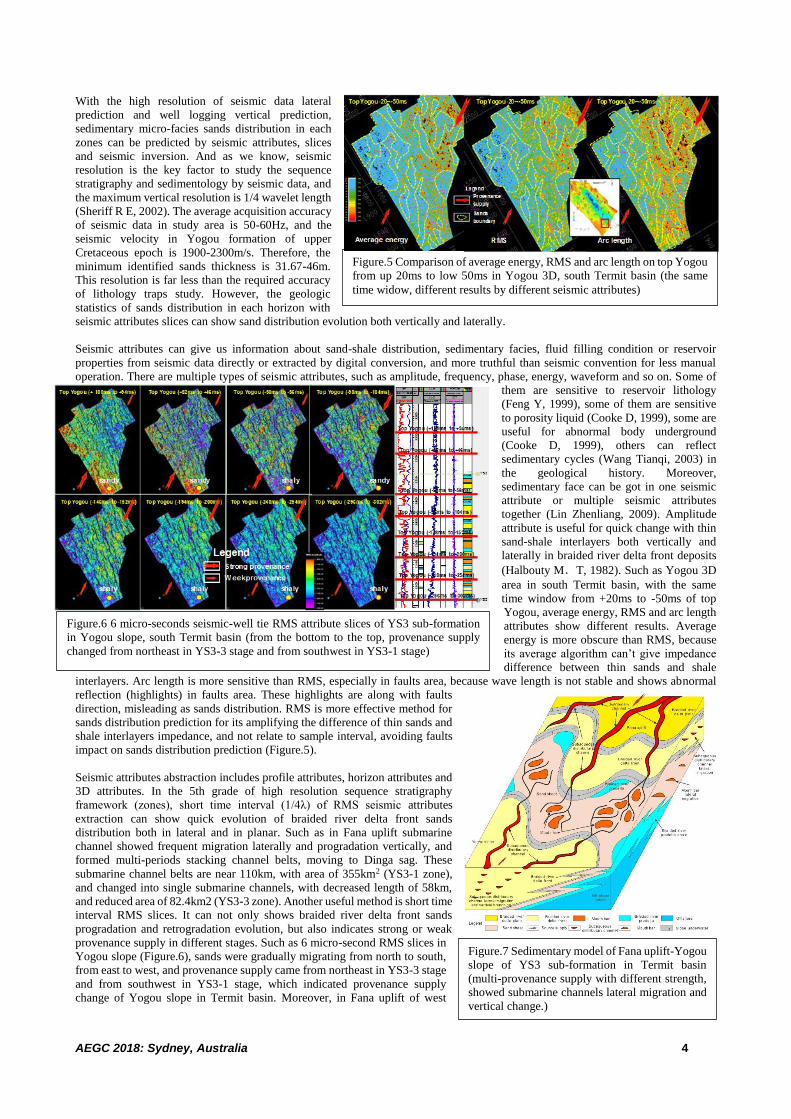
With the high resolution of seismic data lateral
prediction and well logging vertical prediction,
sedimentary micro-facies sands distribution in each
zones can be predicted by seismic attributes, slices
and seismic inversion. And as we know, seismic
resolution is the key factor to study the sequence
stratigraphy and sedimentology by seismic data, and
the maximum vertical resolution is 1/4 wavelet length
(Sheriff R E, 2002). The average acquisition accuracy
of seismic data in study area is 50-60Hz, and the
seismic velocity in Yogou formation of upper
Cretaceous epoch is 1900-2300m/s. Therefore, the
minimum identified sands thickness is 31.67-46m.
This resolution is far less than the required accuracy
of lithology traps study. However, the geologic
statistics of sands distribution in each horizon with
seismic attributes slices can show sand distribution evolution both vertically and laterally.
Seismic attributes can give us information about sand-shale distribution, sedimentary facies, fluid filling condition or reservoir
properties from seismic data directly or extracted by digital conversion, and more truthful than seismic convention for less manual
operation. There are multiple types of seismic attributes, such as amplitude, frequency, phase, energy, waveform and so on. Some of
them are sensitive to reservoir lithology
(Feng Y, 1999), some of them are sensitive
to porosity liquid (Cooke D, 1999), some are
useful for abnormal body underground
(Cooke D, 1999), others can reflect
sedimentary cycles (Wang Tianqi, 2003) in
the geological history. Moreover,
sedimentary face can be got in one seismic
attribute or multiple seismic attributes
together (Lin Zhenliang, 2009). Amplitude
attribute is useful for quick change with thin
sand-shale interlayers both vertically and
laterally in braided river delta front deposits
(Halbouty M.T, 1982). Such as Yogou 3D
area in south Termit basin, with the same
time window from +20ms to -50ms of top
Yogou, average energy, RMS and arc length
attributes show different results. Average
energy is more obscure than RMS, because
its average algorithm can’t give impedance
difference between thin sands and shale
interlayers. Arc length is more sensitive than RMS, especially in faults area, because wave length is not stable and shows abnormal
reflection (highlights) in faults area. These highlights are along with faults
direction, misleading as sands distribution. RMS is more effective method for
sands distribution prediction for its amplifying the difference of thin sands and
shale interlayers impedance, and not relate to sample interval, avoiding faults
impact on sands distribution prediction (Figure.5).
Seismic attributes abstraction includes profile attributes, horizon attributes and
3D attributes. In the 5th grade of high resolution sequence stratigraphy
framework (zones), short time interval (1/4λ) of RMS seismic attributes
extraction can show quick evolution of braided river delta front sands
distribution both in lateral and in planar. Such as in Fana uplift submarine
channel showed frequent migration laterally and progradation vertically, and
formed multi-periods stacking channel belts, moving to Dinga sag. These
submarine channel belts are near 110km, with area of 355km2 (YS3-1 zone),
and changed into single submarine channels, with decreased length of 58km,
and reduced area of 82.4km2 (YS3-3 zone). Another useful method is short time
interval RMS slices. It can not only shows braided river delta front sands
progradation and retrogradation evolution, but also indicates strong or weak
provenance supply in different stages. Such as 6 micro-second RMS slices in
Yogou slope (Figure.6), sands were gradually migrating from north to south,
from east to west, and provenance supply came from northeast in YS3-3 stage
and from southwest in YS3-1 stage, which indicated provenance supply
change of Yogou slope in Termit basin. Moreover, in Fana uplift of west
Figure.5 Comparison of average energy, RMS and arc length on top Yogou
from up 20ms to low 50ms in Yogou 3D, south Termit basin (the same
time widow, different results by different seismic attributes)
Figure.6 6 micro-seconds seismic-well tie RMS attribute slices of YS3 sub-formation
in Yogou slope, south Termit basin (from the bottom to the top, provenance supply
changed from northeast in YS3-3 stage and from southwest in YS3-1 stage)
Figure.7 Sedimentary model of Fana uplift-Yogou
slope of YS3 sub-formation in Termit basin
(multi-provenance supply with different strength,
showed submarine channels lateral migration and
vertical change.)
AEGC 2018: Sydney, Australia 5
Termit basin, with 10 isochronous RMS strata slices
of YS3-2 stage, sands were migrating from the east to
the west from the bottom to the top, and showed an
intact BLC cycle change vertically.
Seismic-well tie is useful to sands distribution
prediction. With sedimentary micro-facies sand
thickness in 62 wells in each member of YS3 sub-
formation, and RMS seismic attributes distribution,
sands distribution prediction can be done.
3. Sedimentary model
With the 2D seismic lines interpretation and structural
mapping, 62 wells bed thickness and sedimentary
micro-facies thickness indicate provenance supplies
in Campanian period coming from primary eastern
uplift, and braided river delta was widely spreading
around Araga garben, Dibeilla structure and Fana
uplift. The secondary provenance supply comes from
northwest Air uplift and southwest Zinder uplift, and
distal braided river delta front sands distributes near
Dinga fault belts in the west of Termit basin and
Yogou slope area in the southwest of Termit basin. Moreover, provenance supplies from east uplift and southwest Zinder uplift joint
together at Moul sag. Therefore, an assembly sedimentary model of braided river delta coming from opposite directions was
established. In this sedimentary model (Figure.7), sands distribution was controlled by submarine channels migration. Three belts can
be identified in this model. The upper belt is braided river delta plain, sands supply was relatively strong and stable, and most of
distributary channels above sea level
were stacking vertically with lateral
migration. Meanwhile, upper sea braided
channel belts were formed by wide
channels of large distribution and
thickness. The middle belt is braided
river channel front, distributary channels
went into sea, and subaqueous
distributary channel with lateral
migration were formed, with narrow
channel width and decreased sand layers
thickness gradually. Later subaqueous
distributary channels incised early
channels or mouth bar sands, and large
distributed subaqueous distributary
channel belts with fine sand sheets were
formed. The lower belt is braided river
prodelta, and most of marine shales
deposited with sea shore shales transition
for weak hydrodynamic condition.
4. Lithologic strata traps evaluation and types
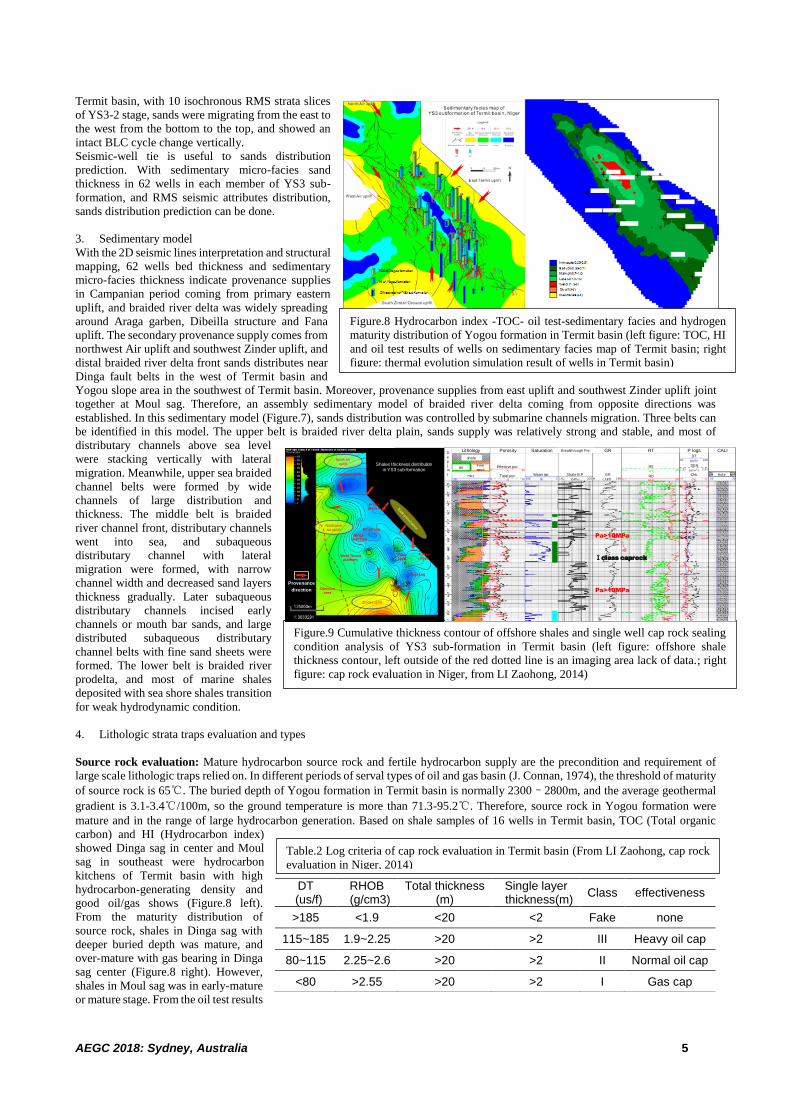
Source rock evaluation: Mature hydrocarbon source rock and fertile hydrocarbon supply are the precondition and requirement of
large scale lithologic traps relied on. In different periods of serval types of oil and gas basin (J. Connan, 1974), the threshold of maturity
of source rock is 65℃. The buried depth of Yogou formation in Termit basin is normally 2300–2800m, and the average geothermal
gradient is 3.1-3.4℃/100m, so the ground temperature is more than 71.3-95.2℃. Therefore, source rock in Yogou formation were
mature and in the range of large hydrocarbon generation. Based on shale samples of 16 wells in Termit basin, TOC (Total organic
carbon) and HI (Hydrocarbon index)
showed Dinga sag in center and Moul
sag in southeast were hydrocarbon
kitchens of Termit basin with high
hydrocarbon-generating density and
good oil/gas shows (Figure.8 left).
From the maturity distribution of
source rock, shales in Dinga sag with
deeper buried depth was mature, and
over-mature with gas bearing in Dinga
sag center (Figure.8 right). However,
shales in Moul sag was in early-mature
or mature stage. From the oil test results
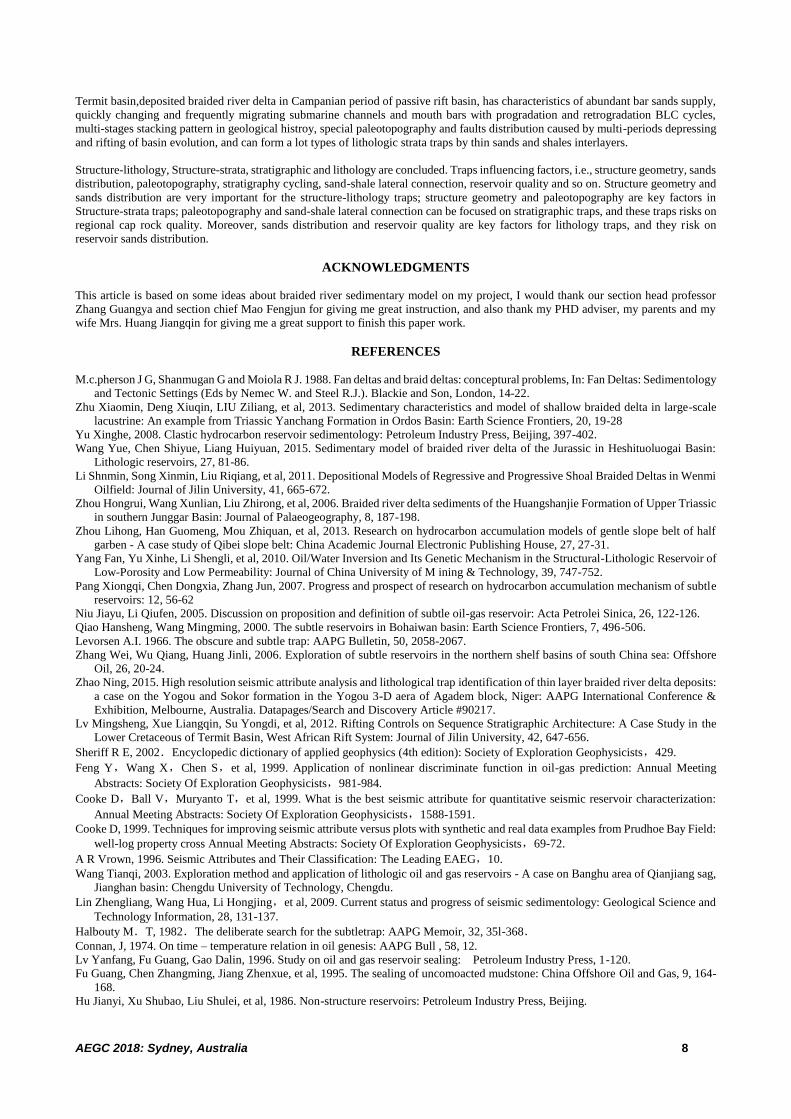
DT (us/f)
RHOB (g/cm3)
Total thickness (m)
Single layer thickness(m)
Class effectiveness
>185 <1.9 <20 <2 Fake none
115~185 1.9~2.25 >20 >2 III Heavy oil cap
80~115 2.25~2.6 >20 >2 II Normal oil cap
<80 >2.55 >20 >2 I Gas cap
Figure.8 Hydrocarbon index -TOC- oil test-sedimentary facies and hydrogen
maturity distribution of Yogou formation in Termit basin (left figure: TOC, HI
and oil test results of wells on sedimentary facies map of Termit basin; right
figure: thermal evolution simulation result of wells in Termit basin)
Figure.9 Cumulative thickness contour of offshore shales and single well cap rock sealing
condition analysis of YS3 sub-formation in Termit basin (left figure: offshore shale
thickness contour, left outside of the red dotted line is an imaging area lack of data.; right
figure: cap rock evaluation in Niger, from LI Zaohong, 2014)
Table.2 Log criteria of cap rock evaluation in Termit basin (From LI Zaohong, cap rock
evaluation in Niger, 2014)
Pa>10MPa
Pa>10MPa
Ⅰclass caprock
Shales thickness distribution in YS3 sub-formation
Fanauplift
Yogouslope
Moul sag
Dinga sag
Dingafault step
Soudana uplift
Trakes slope
Aragagraben
West Termit platform
Zinder uplift
North Air
uplift
Northwest
Air uplift
Obscure area
Provenance
direction
Lithology Porosity Saturation Breakthrough Pre. GR RT P logs CALI
shale
slitFine
sand
D
e
p
(
m
)
Effective por.
Total por. Water sat. Shale B.P GR
RS
RD
DT
DEN
CNL Hole

AEGC 2018: Sydney, Australia 6
of drilled wells in Yogou formation, most of oil in structure traps was discovered on Fana uplift and Yogou slope. Therefore, an oil
accumulation model of hydrocarbon supply in two sags with near source accumulation was established.
Cap rock evaluation: Cap rock is more important in effective lithologic traps forming. Shales should go through serval diagenetic
evolution progresses (Lv Yanfang, 1996), and then has the sealing ability. This ability is more relevant to the diagenesis, the deeper
buried depth, the higher shales diagenetic degree, and the displacement pressure goes higher to reach the oil/gas sealing ability
(Fuguang, 1995). The parameters for evaluating the sealing ability
are porosity, permeability, density, specific surface area,
microscopic pore structure and so on. According to shales sealing
ability analysis of wells in Termit basin (Figure.9, Table.2), shale
interlayers were very low porosity (1-10%), low permeability (2-
50md), high density (2.35-2.65g/cm3), large total shale thickness
(100-400m), with more than 3m single layer thickness, large shale
ratio (52-70%)。Shales thickness around Dinga and Moul sags was
larger than 200m, but relatively smaller in the center of the two
sags. This is another evidence of far provenance supply of YS3 sub-
formation. Moreover, comprehensive evaluation of cap rock in
Yogou formation of Termit basin showed the 1st grade gas cap with
very good sealing condition.
5. Influencing factor and oil accumulation model
Structure-lithologic, Structure-strata, stratigraphy, and sand lens
are four kinds of lithologic traps, and oil accumulation model of
lithologic traps in Termit basin was established according to
13026km 2D and 11607km2 3D seismic data observation and 62
drilled wells analysis (Figure.10). Except serval favorable and
common lithologic traps conditions, i.e., depressing basin
evolution, slope paleotopography, near hydrocarbon center,
sand-shale interlayer associations, influencing factors of three
types of lithologic traps are different.
Structure lithology traps:
On the structure high of Yogou slope and Fana uplift, favorable structure features for multiple faults constructed fault lithologic and
anticline lithologic traps (Table.3). These traps were controlled by structure condition and sands-faults allocation. Faults were not only
oil-gas migration tunnels, but also lateral sealing surfaces. For large faults, reverse fault blocks were not favorable for oil accumulation
as up-dip block jointed with thick and blocky braided river sands in Mandama formation, and oil leaked and escaped from the sands.
However, normal fault blocks may be favorable with good sands-faults allocation. For small faults, both normal fault and reverse fault
blocks were favorable for oil accumulation. Such as the lithologic trap in normal fault blocks southern Yogou slope, with “convex top
- flat bottom” shape of mouth bars and “flat top - convex bottom” of submarine channels showing multiple sands migration. This trap
area is 27.5km2, with 70ms amplitude. This kind of trap is more common in the study area, high risk on caprock and sands connection
on both sides of faults.
Trap type Trap element Typical seismic profile Risk evaluation
structure-lithology
anticline-lithology
area, buried depth, closure amplitude, sands distribution
S:90%, √
R:90%, √
C:30%, ?
M:80%, √
T:80%, √
P:80%, √
Favorable:S,
R, M, T, P;
Unfavorable:C
anticline lithology
area, buried depth, closure amplitude, sand-shale connection
S:90%, √
R:90%, √
C:30%, ?
M:80%, √
T:50%, ?
P:60%, ?
Favorable:S,
R, T (small fault throw), M
;
Unfavorable:C, T (large fault throw), P
structure-strata
Anticline un-conformity
area, buried depth, closure amplitude, paleotopography, sands distribution
S:90%, √
R:80%, √
C:30%, ?
M:80%, √
T:80%, √
P:80%, √
Favorable:S,
M, T, P;
Unfavorable:C
Figure.10 Sedimentary and reservoir model of YS3 sub-formation
in Termit basin (on Fana uplift and Yogou slope, structure-
lithologic, Structure-strata, stratigraphy, and sand lens four kinds of
lithologic strata traps of eight subtypes are classified)
Table.3 Types, cases and risk assessment of lithologic-stratigraphic traps in YS3 sub-formation of Termit basin

AEGC 2018: Sydney, Australia 7
fault-strata overlap
area, buried depth, closure amplitude, paleotopography, sand-shale connection
S:90%, √
R:80%, √
C:30%, ?
M:80%, √
T:50%, ?
P:60%, ?
Favorable:S,
R, T (small fault throw), M
;
Unfavorable:C, T (large fault throw), P
strata
un-conformity
sands distribution, paleotopography, sand-shale connection
S:90%, √
R:80%, √
C:30%, ?
M:80%, √
T:80%, √
P:80%, √
Favorable:S,
R, T, M, P;
Unfavorable:C
strata overlap
sands distribution, paleotopography, strata evolution
S:90%, √
R:80%, √
C:60%, ?
M:80%, √
T:70%, ?
P:80%, √
Favorable:S,
R, M, P;
Unfavorable:C, T (small scale)
lithology
turbidite sand lens
sands distribution, reservoir quality
S:90%, √
R:70%, ?
C:90%, √
M:80%, √
T:70%, ?
P:90%, √
Favorable:S,
C, M, P;
Unfavorable:
T (small scale), R (porosity unclear)
up dip pinch out
sands distribution, reservoir quality, strata dip angle
S:90%, √
R:70%, ?
C:90%, √
M:80%, √
T:70%, ?
P:90%, √
Favorable:S,
C, M, P;
Unfavorable:T (small scale), R (porosity unclear)
Structure strata traps: For structure strata traps, anticline-unconformity and fault-strata overlap are more common (Table.3),
controlled by structure background or paleotopography. The former is common in slope belts around depression basin sags, caused by
braided river delta front sands progradation and vertical staking on local anticlines, with a relatively large scale. Such as the anticline-
unconformity trap in southeast Fana uplift, and the area is 24.3km2, with 173ms amplitude (Table3. Anticline-unconformity trap). The
main risk in this kind of trap is the sealing ability, and composite evaluation is relatively low. Therefore, it is a favorable type of
lithologic trap in this area. The latter is common in slope belt around sags of fault-depression basin or depression basin with inherited
faults, caused by braided river delta front sands overlapped and then incised by later faults, with a relatively small scale. This kind of
trap is very common in Termit basin (Table3. fault-strata trap), and the main risk is caprock and sands connection on both sides of
faults, with high risk evaluation.
Strata traps: In center Yogou slope and west Fana uplift near Dinga sag, strata of onlap, downlap, toplap are always obvious, and
sands of progradation or retrogradation are very clear. Strata traps are very common in these area, composed with sand lens.For strata
traps, sand-shale allocation combination on sequence boundary both up and down are very important, including unconformity and
strata overlap traps. The two are formed in the process of the progradation or retrogradation of braided river delta front sands around
the slope of Dinga and Moul depression, controlled by sands shales connection, paleotopography, sands distribution and strata cycle
combination. The risk of unconformity trap is whether regional caprocks have or not (Table.3 strata unconformity trap), with low
comprehensive evaluation. The risk of strata overlap trap is not only whether regional caprock have or not, but also large or small trap
scale, and high comprehensive evaluation. Such as multiple sets of reservoir-caprock combination both vertical and lateral (Table.3
strata overlap trap), formed by quick strata overlapping of multi-periods braided river delta front sands. The sand combinations are thin
with large area, more than 20km2, and low comprehensive evaluation.
Lithology traps: Near the center of Dinga and Moul sags, thin sands of braided river delta front flew directly into onshore - shallow
sea as up dip pinch out sands or slid down to bathyal sea - deep sea as turbidite sand lens. These sands were string bead or fan shape
as point provenance supply, or belt shape as line provenance supply, with thin and fine sands interlaid by thick shales as effective
caprocks. However, these sands or traps were discontinuous, and small scale with single one and large scale with combination. Such
as in central-east of Fana uplift, these sand lens traps are 36km2 large area and 270ms traps amplitude (Table.3 sand lens traps), with
low risk of comprehensive evaluation. Moreover, up dip pinch out traps were caused by braided river delta front sands planar migration
and good up dip lateral sealing (Table.3 up dip pinch out traps), with small scale and high overall evaluation.
CONCLUSIONS
AEGC 2018: Sydney, Australia 8
Termit basin,deposited braided river delta in Campanian period of passive rift basin, has characteristics of abundant bar sands supply,
quickly changing and frequently migrating submarine channels and mouth bars with progradation and retrogradation BLC cycles,
multi-stages stacking pattern in geological histroy, special paleotopography and faults distribution caused by multi-periods depressing
and rifting of basin evolution, and can form a lot types of lithologic strata traps by thin sands and shales interlayers.
Structure-lithology, Structure-strata, stratigraphic and lithology are concluded. Traps influencing factors, i.e., structure geometry, sands
distribution, paleotopography, stratigraphy cycling, sand-shale lateral connection, reservoir quality and so on. Structure geometry and
sands distribution are very important for the structure-lithology traps; structure geometry and paleotopography are key factors in
Structure-strata traps; paleotopography and sand-shale lateral connection can be focused on stratigraphic traps, and these traps risks on
regional cap rock quality. Moreover, sands distribution and reservoir quality are key factors for lithology traps, and they risk on
reservoir sands distribution.
ACKNOWLEDGMENTS
This article is based on some ideas about braided river sedimentary model on my project, I would thank our section head professor
Zhang Guangya and section chief Mao Fengjun for giving me great instruction, and also thank my PHD adviser, my parents and my
wife Mrs. Huang Jiangqin for giving me a great support to finish this paper work.
REFERENCES
M.c.pherson J G, Shanmugan G and Moiola R J. 1988. Fan deltas and braid deltas: conceptural problems, In: Fan Deltas: Sedimentology
and Tectonic Settings (Eds by Nemec W. and Steel R.J.). Blackie and Son, London, 14-22.
Zhu Xiaomin, Deng Xiuqin, LIU Ziliang, et al, 2013. Sedimentary characteristics and model of shallow braided delta in large-scale
lacustrine: An example from Triassic Yanchang Formation in Ordos Basin: Earth Science Frontiers, 20, 19-28
Yu Xinghe, 2008. Clastic hydrocarbon reservoir sedimentology: Petroleum Industry Press, Beijing, 397-402.
Wang Yue, Chen Shiyue, Liang Huiyuan, 2015. Sedimentary model of braided river delta of the Jurassic in Heshituoluogai Basin:
Lithologic reservoirs, 27, 81-86.
Li Shnmin, Song Xinmin, Liu Riqiang, et al, 2011. Depositional Models of Regressive and Progressive Shoal Braided Deltas in Wenmi
Oilfield: Journal of Jilin University, 41, 665-672.
Zhou Hongrui, Wang Xunlian, Liu Zhirong, et al, 2006. Braided river delta sediments of the Huangshanjie Formation of Upper Triassic
in southern Junggar Basin: Journal of Palaeogeography, 8, 187-198.
Zhou Lihong, Han Guomeng, Mou Zhiquan, et al, 2013. Research on hydrocarbon accumulation models of gentle slope belt of half
garben - A case study of Qibei slope belt: China Academic Journal Electronic Publishing House, 27, 27-31.
Yang Fan, Yu Xinhe, Li Shengli, et al, 2010. Oil/Water Inversion and Its Genetic Mechanism in the Structural-Lithologic Reservoir of
Low-Porosity and Low Permeability: Journal of China University of M ining & Technology, 39, 747-752.
Pang Xiongqi, Chen Dongxia, Zhang Jun, 2007. Progress and prospect of research on hydrocarbon accumulation mechanism of subtle
reservoirs: 12, 56-62
Niu Jiayu, Li Qiufen, 2005. Discussion on proposition and definition of subtle oil-gas reservoir: Acta Petrolei Sinica, 26, 122-126.
Qiao Hansheng, Wang Mingming, 2000. The subtle reservoirs in Bohaiwan basin: Earth Science Frontiers, 7, 496-506.
Levorsen A.I. 1966. The obscure and subtle trap: AAPG Bulletin, 50, 2058-2067.
Zhang Wei, Wu Qiang, Huang Jinli, 2006. Exploration of subtle reservoirs in the northern shelf basins of south China sea: Offshore
Oil, 26, 20-24.
Zhao Ning, 2015. High resolution seismic attribute analysis and lithological trap identification of thin layer braided river delta deposits:
a case on the Yogou and Sokor formation in the Yogou 3-D aera of Agadem block, Niger: AAPG International Conference &
Exhibition, Melbourne, Australia. Datapages/Search and Discovery Article #90217.
Lv Mingsheng, Xue Liangqin, Su Yongdi, et al, 2012. Rifting Controls on Sequence Stratigraphic Architecture: A Case Study in the
Lower Cretaceous of Termit Basin, West African Rift System: Journal of Jilin University, 42, 647-656.
Sheriff R E, 2002.Encyclopedic dictionary of applied geophysics (4th edition): Society of Exploration Geophysicists,429.
Feng Y,Wang X,Chen S,et al, 1999. Application of nonlinear discriminate function in oil-gas prediction: Annual Meeting
Abstracts: Society Of Exploration Geophysicists,981-984.
Cooke D,Ball V,Muryanto T,et al, 1999. What is the best seismic attribute for quantitative seismic reservoir characterization:
Annual Meeting Abstracts: Society Of Exploration Geophysicists,1588-1591.
Cooke D, 1999. Techniques for improving seismic attribute versus plots with synthetic and real data examples from Prudhoe Bay Field:
well-log property cross Annual Meeting Abstracts: Society Of Exploration Geophysicists,69-72.
A R Vrown, 1996. Seismic Attributes and Their Classification: The Leading EAEG,10.
Wang Tianqi, 2003. Exploration method and application of lithologic oil and gas reservoirs - A case on Banghu area of Qianjiang sag,
Jianghan basin: Chengdu University of Technology, Chengdu.
Lin Zhengliang, Wang Hua, Li Hongjing,et al, 2009. Current status and progress of seismic sedimentology: Geological Science and
Technology Information, 28, 131-137.
Halbouty M.T, 1982.The deliberate search for the subtletrap: AAPG Memoir, 32, 35l-368.
Connan, J, 1974. On time – temperature relation in oil genesis: AAPG Bull , 58, 12.
Lv Yanfang, Fu Guang, Gao Dalin, 1996. Study on oil and gas reservoir sealing: Petroleum Industry Press, 1-120.
Fu Guang, Chen Zhangming, Jiang Zhenxue, et al, 1995. The sealing of uncomoacted mudstone: China Offshore Oil and Gas, 9, 164-
168.
Hu Jianyi, Xu Shubao, Liu Shulei, et al, 1986. Non-structure reservoirs: Petroleum Industry Press, Beijing.
Related Documents