Sediment Variation along the East Coast of Peninsular Malaysia *, ***Abd Rahman MatAmin, *Fadhli Ahmad, **Mustafa Mamat, ***Mohd Rivaie, ****Khiruddin Abdullah *Faculty of Maritime Studies and Marine Science, Universiti Malaysia Terengganu, 21030 Kuala Terengganu, Terengganu, Malaysia, e-mail: [email protected] **Fakulti Informatik dan Komputeran, Universiti Sultan Zainal Abidin, Kampus Tembila, 22200 Besut, Terengganu, Malaysia ***Faculty of Applied Science, Universiti Teknologi MARA Terengganu, Kampus Kuala Terengganu, 21080 Kuala Terengganu, Terengganu, Malaysia ****School of Physics, Universiti Sains Malaysia, 11800 Minden, Malaysia Abstract. The northeast monsoon season (NEMS), which occurs between November and March every year, brings heavy rains and strong wind to the east coast of Peninsular Malaysia. Large sediment resuspension during this season is caused by high waves and river discharge carried by the river to the sea. Sediment is defined in this research as both organic and inorganic materials. Remote sensing reflectance (R rs ) of the Moderate Resolution Spectroradiometer (MODIS) 667 nm channel is used in this study as a Total Suspended Sediment (TSS) index. The data was acquired from Aqua satellite with 9 km resolution. The study was conducted along the eastern coast of Peninsular Malaysia over the period of 2002–2012. The result shows that TSS along the Peninsular Malaysia coastline and the river mouth is highly seasonal. The highest TSS is observed during NEMS with the peak value in November-December every year. Keywords: sediment, coastal water, remote sensing, MODIS. 1. Introduction Malaysia is subjected to maritime and wind systems influence which is originated from Indian Ocean and South China Sea. Every year, Malaysia is influenced by south- west monsoon season (SWMS) and northeast monsoon season (NEMS). SWMS occurs from May to September and it brought rain to the west coast of Malaysia Peninsu- lar. Meanwhile NEMS occurs from November to March often caused severe floods along the east coast states of Kelantan, Terengganu and Pahang. The transition between this two season (April and October) is called inter-mon- soon period. During the NEMS, wind speed may reach 15 ms -1 or more over east coast states. Wave along the east coast of Peninsular Malaysia is higher during the NEMS as compared to the SWMS. Wave heights of over 3.5 m during November to January, have been recorded (http:// www.met.gov.my). The larger waves during the NEMS that due by the strong onshore winds cause the erosion of the coastline. Approximately 30% of Malaysia coastline is experience erosion and the most serious affected is the Malaysia pen- insular coastline that bordering the South China Sea (Hus- sain et. al. 1995). The sediment along the coastline is then brought to the sea and caused the turbid water area along the coastal line. High rainfall rate during NEMS will also cause severe flood to the east coast of Malaysia peninsular state. Due to the flooding, the top layer soil is washed away from their catchment and then discharged into the sea. The water turbidity along the coastal line is increase especially during NEMS. The TSS that present along coastal waters are com- monly derived from seabed re-suspension or discharged Ecological Questions 16/2012: 99 – 107 DOI: 10.2478/v10090-012-0010-6

Welcome message from author
This document is posted to help you gain knowledge. Please leave a comment to let me know what you think about it! Share it to your friends and learn new things together.
Transcript
Sediment Variation along the East Coast of Peninsular Malaysia
*, ***Abd Rahman MatAmin, *Fadhli Ahmad, **Mustafa Mamat,
***Mohd Rivaie, ****Khiruddin Abdullah
*Faculty of Maritime Studies and Marine Science, Universiti Malaysia Terengganu, 21030 Kuala Terengganu, Terengganu, Malaysia, e-mail: [email protected]
**Fakulti Informatik dan Komputeran, Universiti Sultan Zainal Abidin, Kampus Tembila, 22200 Besut, Terengganu, Malaysia
***Faculty of Applied Science, Universiti Teknologi MARA Terengganu, Kampus Kuala Terengganu, 21080 Kuala Terengganu, Terengganu, Malaysia
****School of Physics, Universiti Sains Malaysia, 11800 Minden, Malaysia
Abstract. The northeast monsoon season (NEMS), which occurs between November and March every year, brings heavy rains and strong wind to the east coast of Peninsular Malaysia. Large sediment resuspension during this season is caused by high waves and river discharge carried by the river to the sea. Sediment is defined in this research as both organic and inorganic materials. Remote sensing reflectance (Rrs) of the Moderate Resolution Spectroradiometer (MODIS) 667 nm channel is used in this study as a Total Suspended Sediment (TSS) index. The data was acquired from Aqua satellite with 9 km resolution. The study was conducted along the eastern coast of Peninsular Malaysia over the period of 2002–2012. The result shows that TSS along the Peninsular Malaysia coastline and the river mouth is highly seasonal. The highest TSS is observed during NEMS with the peak value in November-December every year.
Keywords: sediment, coastal water, remote sensing, MODIS.
1. Introduction
Malaysia is subjected to maritime and wind systems influence which is originated from Indian Ocean and South China Sea. Every year, Malaysia is influenced by south-west monsoon season (SWMS) and northeast monsoon season (NEMS). SWMS occurs from May to September and it brought rain to the west coast of Malaysia Peninsu-lar. Meanwhile NEMS occurs from November to March often caused severe floods along the east coast states of Kelantan, Terengganu and Pahang. The transition between this two season (April and October) is called inter-mon-soon period. During the NEMS, wind speed may reach 15 ms-1 or more over east coast states. Wave along the east coast of Peninsular Malaysia is higher during the NEMS as compared to the SWMS. Wave heights of over 3.5 m
during November to January, have been recorded (http://www.met.gov.my).
The larger waves during the NEMS that due by the strong onshore winds cause the erosion of the coastline. Approximately 30% of Malaysia coastline is experience erosion and the most serious affected is the Malaysia pen-insular coastline that bordering the South China Sea (Hus-sain et. al. 1995). The sediment along the coastline is then brought to the sea and caused the turbid water area along the coastal line. High rainfall rate during NEMS will also cause severe flood to the east coast of Malaysia peninsular state. Due to the flooding, the top layer soil is washed away from their catchment and then discharged into the sea. The water turbidity along the coastal line is increase especially during NEMS.
The TSS that present along coastal waters are com-monly derived from seabed re-suspension or discharged
Ecological Questions 16/2012: 99 – 107 DOI: 10.2478/v10090-012-0010-6
100 Abd Rahman MatAmin, Fadhli Ahmad, Mustafa Mamat, Mohd Rivaie, Khiruddin Abdullah
by particle-laden rivers (Miller & McKee 2004; Prasad & Singh, 2010). The increment of the TSS in the water will directly influences water quality, benthic (Miller & Cruise 1995) and phytoplankton productivity (Schallenberg & Burns 2004) and also the redistribution and transport of pollutants and materials (Prasad & Singh 2010). High con-centration of TSS along the coastal waters and estuaries could also reduce underwater vertical transmittance (May et al. 2003). The distribution patterns of sediments play an important role in monitoring marine environmental chang-es, especially in coastal areas (Min et. al. 2012). Suspended sediments may also affect nutrient dynamics (Mayer et al. 1998) and pollutant movement (Olsen et al. 1982). As a result, there is an interest to study about the variation of TSS concentration along Malaysia coastal region during monsoon and non-monsoon season.
The distribution and flux of suspended sediments are highly variable in coastal environments and vary over a broad spectrum of time and space scales. There are num-ber of methods have been developed to measure TSS. The common method is the field sampling. In this method, wa-ter sample is collected and then filtered to extract suspend-ed sediment. The filtered material is then dried, weight-ed and divided by the sample value to obtain TSS. This method provides accurate and point based measurement but spatial variations are rarely captured and temporal res-olution is often limited (Miller & McKee 2004; Pavelsky & Smith 2009). However, the presences of remote sensing technology offer an alternative way for tracking spatial and temporal variation of sediment concentration. The use of remote sensing technology to map suspended sediment concentration is well documented.
Numbers of researchers have proposed an empirical relationship between reflected solar radiance measured by airborne and satellite-based instruments with suspended sediments in a wide range of inland and coastal waters. Miller and McKee (2004) have used the remote sensing reflectance of MODIS Aqua 250 m resolution to estimate TSS. Wang and Lu (2010) have used MODIS Terra band 2 and band 5 to estimate TSS over the Lower Yangtze River, China. Another researchers (Min et. al. 2012) have devel-oped an algorithm to monitor TSS variation over the Sae-mangeum coastal area of Korea using Landsat and MODIS data. Kuang et. al. (2011) have used an integrated tech-nique to monitor the TSS transport over the Nanhui shore. Villar et. al. (2012) have conducted a study of sediment transport in the Madeira River, Brazil, using MODIS 250 m remote sensing images.
The main objective of this study is to investigate the sediment pattern and the factors that contribute to the TSS variation along east coast of Malaysia Peninsular. Due to the high relationship between sediment concentration and the surface reflectance of 667 nm (Rrs), the Rrs of MODIS 667 nm is used as a TSS indexing to investigate the sedi-
ment patent along the coastal area. In order to investigate the contribution factor for the variation, the supplement data also have been used. The supplement data are the av-erage river discharge and the wind vector data.
2. Study area
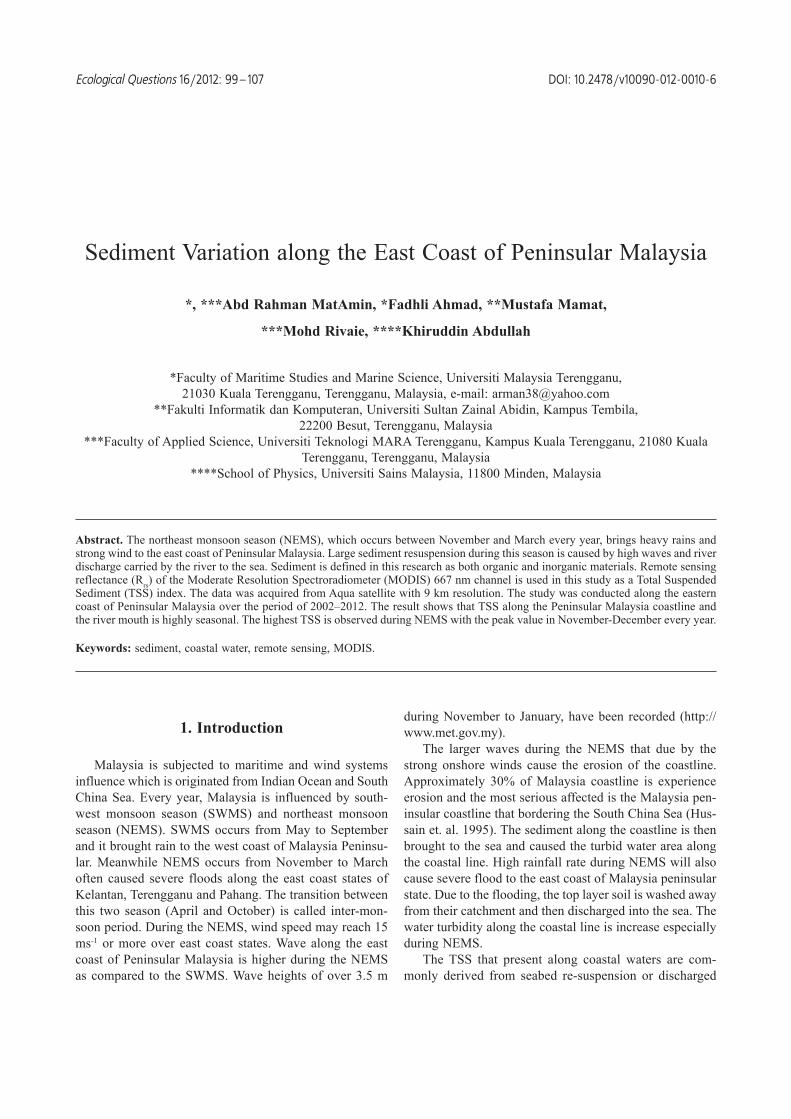
Malaysia are located at Southeast Asia and mostly sur-rounded by sea. Malaysia could be divided into West Ma-laysia and East Malaysia. West Malaysia is located at the South of Asian continental called Malaysia Peninsular. Ma-laysia Peninsular could be further divide into west peninsu-lar and east peninsular. Malaysia east peninsular consists of three states which are Kelantan, Terengganu and Pahang. Roughly, the study area is located between 2.5° and 6.5° latitude north and between 102.0° and 104.2° longitude east. In the north, Malaysia is bordered by Thailand. South China Sea is a border on the east side whereas the Straits of Malacca is a border on the west side. Straits of Malacca separate Malaysia Peninsular from Sumatra Island which is located in Indonesia region. East coast of Malaysia Peninsular is influence most by the NEMS that occurs on November to March yearly. This area receives maximum precipitation, with values ranging from 600 to 800 mm of rainfall, is recorded in November and December (Malaysia Meteorology Department, http://www.met.gov.my).
There are three main rivers that flow to the South China Sea. The rivers are Kelantan River, Terengganu River and Pahang River. The locations of the river are shows in the Figure 1 below. Pahang River is the longest river with 459 km length is located in the state of Pahang. The mouth of the river is located at Kuala Pahang with average dis-charge rate is 596 m3s-1. Kelantan River with catchment area about 11900 km2 is located at the state of Kelantan. The rainfall over the area varies between 0 to 1750 mm. The average runoff from the area is 557.5 m3s-1 over the mouth. Terengganu River is located at the state of Tereng-ganu. The river mouth is located at Kuala Terengganu, state capital of Terengganu. The topography of the study area is about 30 m.
3. Data and methodology
3.1 Remote sensing data
Moderate Resolution Imaging Spectroradiometer (MODIS) data with high temporal resolution is used in this study. High temporal resolutions provide the continuation in the data collection. MODIS was launched aboard Terra satel-lite in late 1999 and aboard Aqua satellite in early 2002. Both satellites are polar-orbiting, with Terra on a descend-ing orbit (southward) over the equator about 10:30 local
101Sediment Variation along the East Coast of Peninsular Malaysia
sun time, and Aqua on an ascending orbit (northward) over the equator about 13:30 local sun time. MODIS will view the entire surface of the Earth every 1–2 days. MODIS performs measurements in the visible to thermal infrared spectral region from 0.41 to 14.235 μm (Salomonson et. al. 1989). The MODIS instruments measure spectral ra-diance in 36 channels, in resolutions between 250 m and 1 km (at nadir). MODIS have distribute numbers of high quality through theirs data distribution website. There are 5 remote sensing product that distributed by MODIS team. However, in this study Rrs of 667 nm is used as a TSS index over the coastal line and rivers mouth. The Rrs of 667 nm used in this study is MODIS Aqua Level 3 prod-uct with 9 km resolution. This product is processed by the NASA Ocean Biology Processing Group (OBPG). The Rrs of 667 nm of MODIS Aqua is used as a key indicator of the sediment patent along the coastal line and river mouth. Input data are taken from the Giovanni (Goddard Earth Sciences Data and Information Services Center, Interactive Online Visualization and Analysis Infrastructure) (Acker & Leptoukh 2007). The Giovanni online data system was
developed and maintained by the NASA GES DISC. Image and remote sensing reflectance for the study area is then downloaded. Analyses and visualizations used in this study produced with the Giovanni online data system, developed and maintained by the NASA GES DISC.
3.2 River discharge
The average river discharge data are acquired from the Center for Sustainability and the Global Environment (SAGE) website. The website contains a compilation of monthly mean river discharge data for over 3500 sites worldwide. The data sources are RivDis2.0, the United States Geological Survey, Brazilian National Department of Water and Electrical Energy, and HYDAT-Environment Canada. The period of record for each station is varia-ble, from 3 years to greater than 100. All data is in m3 s-1 (Global Environment (SAGE), http://www.sage.wisc.edu/riverdata).
3.3 Wind vector
The second supplement data is a wind vector that derived from observations made by the WindSat Polarimetric Ra-diometer developed by the Naval Research Laboratory (NRL) and launched on January 6, 2003 aboard the De-partment of Defense Coriolis satellite. WindSat data are produced by Remote Sensing Systems and sponsored by the NASA Earth Science measures Discover Project and the NASA Earth Science Physical Oceanography Program. RSS WindSat data are available at www.remss.com.
4. Result
4.1 Monthly image analysis
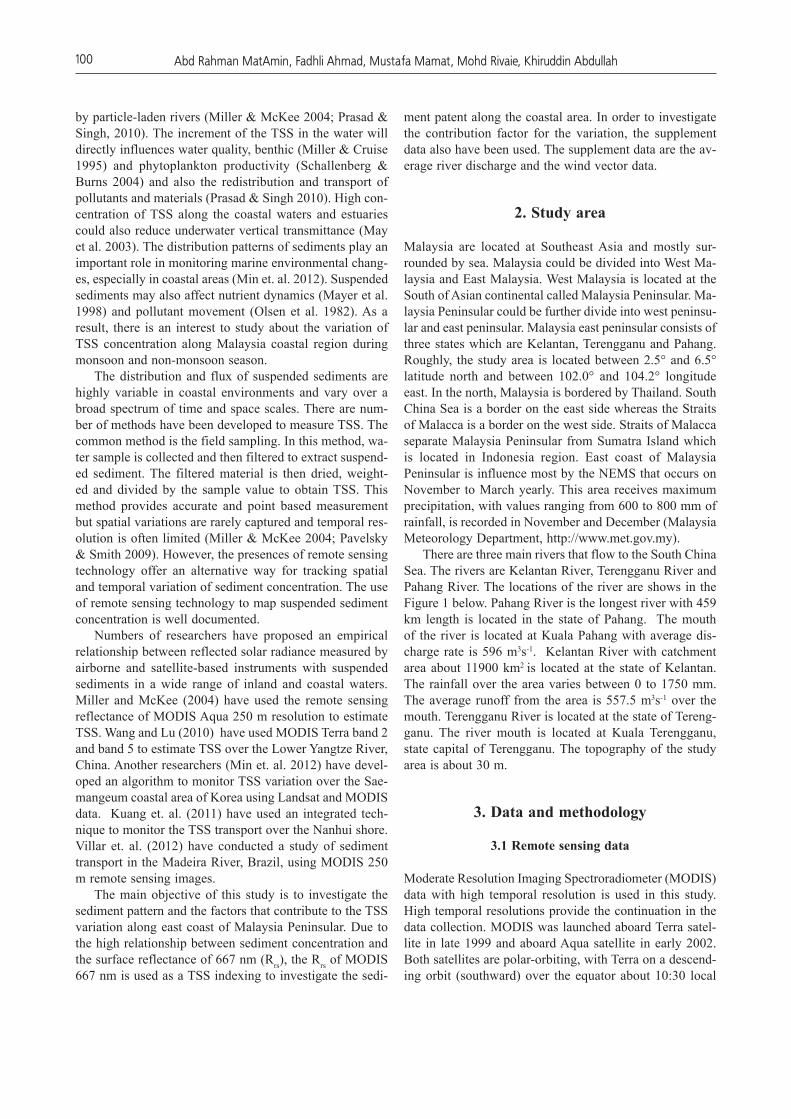
In this discussion, images acquired over the study for the period of November 2011 to October 2012 is used as an example. The TSS over the study area considers repeating over the time. The spatial distributions of TSS over the east coast of Malaysia Peninsular for the period of No-vember 2011 to October 2012 are illustrated by the Rrs of MODIS Aqua 9 km resolution as shown in Figure 2. As shown in this figure, the highest TSS is colored by orange and the lowest TSS is colored by purple. The Rrs value over the study area varies between 0 and 2.4 x 10⁻² sr-1. The sparse white color over the sea area indicates that the areas are covered by the clouds. Generally, the TSS is ob-servably higher along the coastal water area compared to open ocean region. Very low TSS value can be seen over the open ocean region. High TSS values are obviously ob-served at the river mouth, especially for the three main riv-ers, Kelantan River, Terengganu River and Pahang River.
Figure 1. Study area and the mouths of the rivers: A – Kelantan, B – Terengganu, C – Pahang
102 Abd Rahman MatAmin, Fadhli Ahmad, Mustafa Mamat, Mohd Rivaie, Khiruddin Abdullah
Figure 2. Images of monthly Rrs variation over east Coast of Malaysia Peninsular for November 2011 to October 2012
However, the increased in the TSS over the rivers mouth is not observably throughout the year.
For the month of November 2011 which is the begin-ning of the NEMS, a group of sediment was detected over the Kelantan River and the Pahang River. The increment in the TSS is represented by the dark blue color that appears over the river mouth and coastal line as shown by the circle in Figure 2(a). The TSS values are observably increased in the month of December 2011 which represented by the light blue color especially over the Kelantan and Pahang Rivers as shown in the Figure 2(b). A group of white color can be seen in the Figure 2(b) that represents the clouds cover area. Figure 2(c) shows the study area for the month of January 2012. Clearly seen in this figure the TSS cov-ered areas are growing up especially over the three main rivers. The widest TSS covered area is observable over Kelantan River. Figure 2(c) also shows that the high TSS covered area is the widest compared to the other months. The TSS covered area start to decrease on February 2012
as shown by the Figure 2(d). Start from May 2012 until September 2012 very low TSS value can be detected over the study area. The presences of high TSS detected again on October 2012. The comparison between these three riv-ers shows that, the highest TSS is observably over Kelan-tan River follow by Pahang River and the lowest value is Terengganu River.
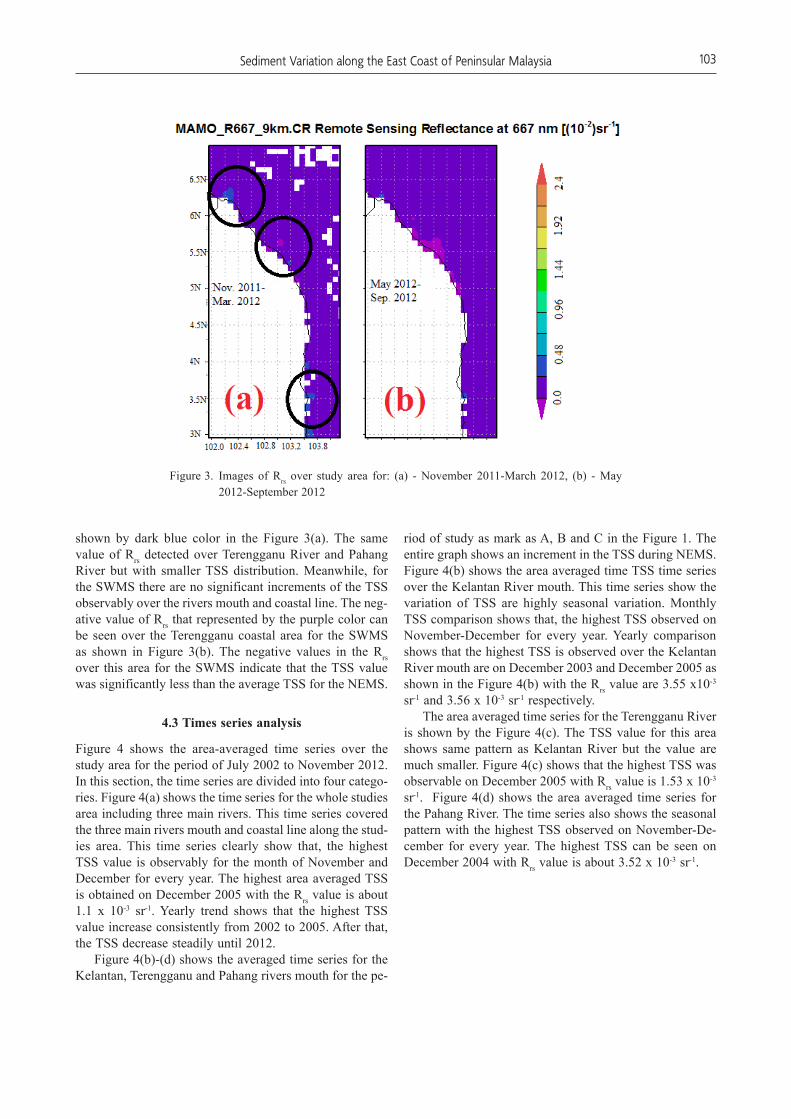
4.2 Seasonal Image Analysis
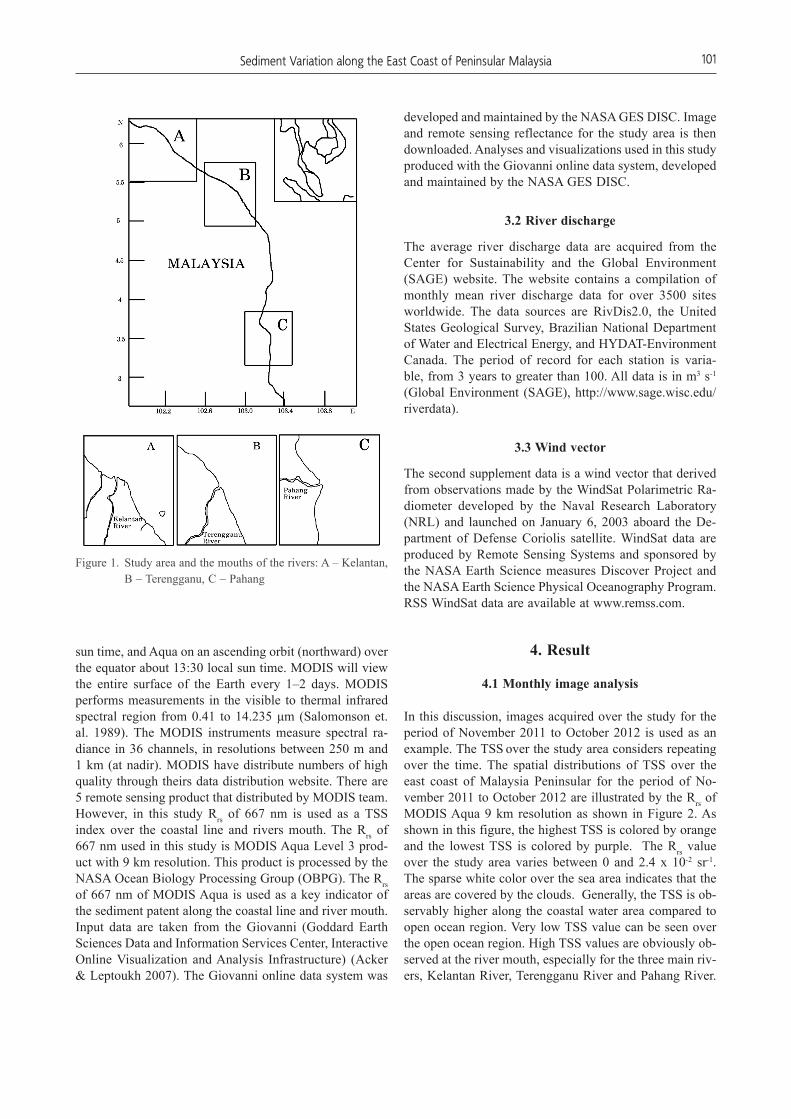
Figure 3 provide the seasonal TSS comparison for the pe-riod of NEMS (November 2011-March 2012) and SWMS (May 2012-September 2012). During the NEMS blue colors that indicate the increment in the TSS is observably over the rivers mouth especially Kelantan River and Pa-hang River. The wide area of TSS was observable over the Kelantan River follow by the Pahang and the Terengganu River. The high TSS value is represented by the increment in the Rrs with the value is as high as 0.48 x 10⁻² sr-1 as
103Sediment Variation along the East Coast of Peninsular Malaysia
shown by dark blue color in the Figure 3(a). The same value of Rrs detected over Terengganu River and Pahang River but with smaller TSS distribution. Meanwhile, for the SWMS there are no significant increments of the TSS observably over the rivers mouth and coastal line. The neg-ative value of Rrs that represented by the purple color can be seen over the Terengganu coastal area for the SWMS as shown in Figure 3(b). The negative values in the Rrs over this area for the SWMS indicate that the TSS value was significantly less than the average TSS for the NEMS.
4.3 Times series analysis
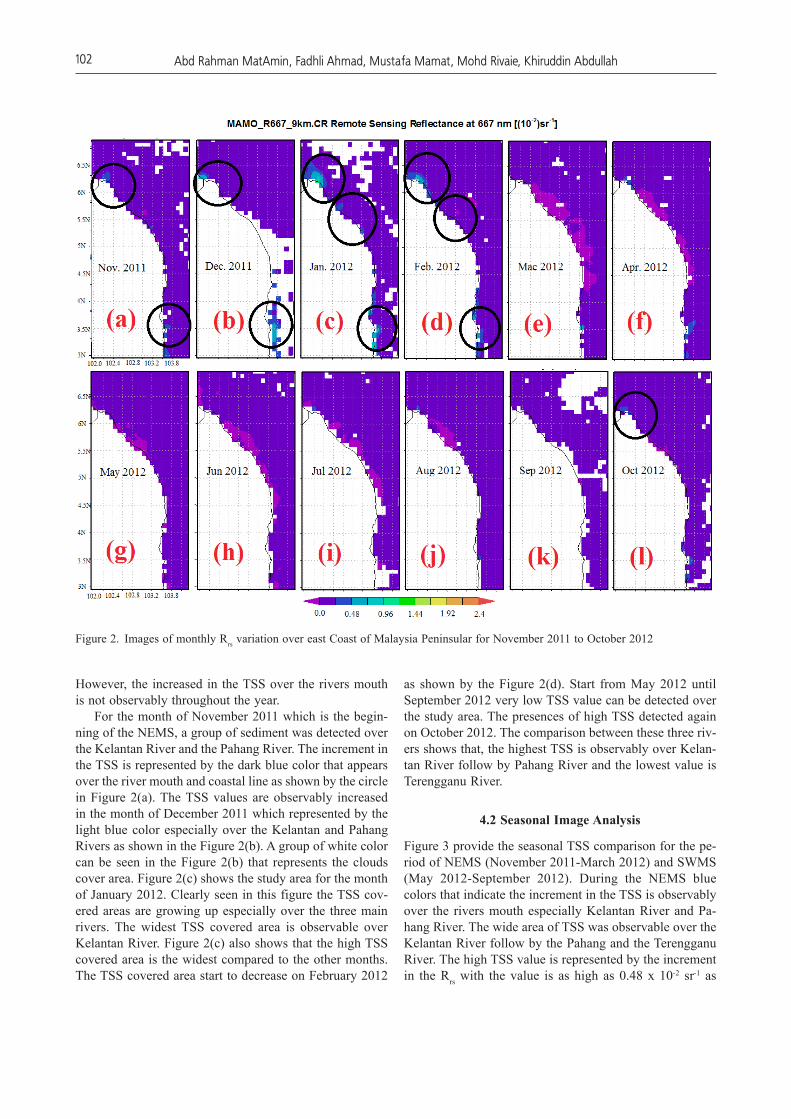
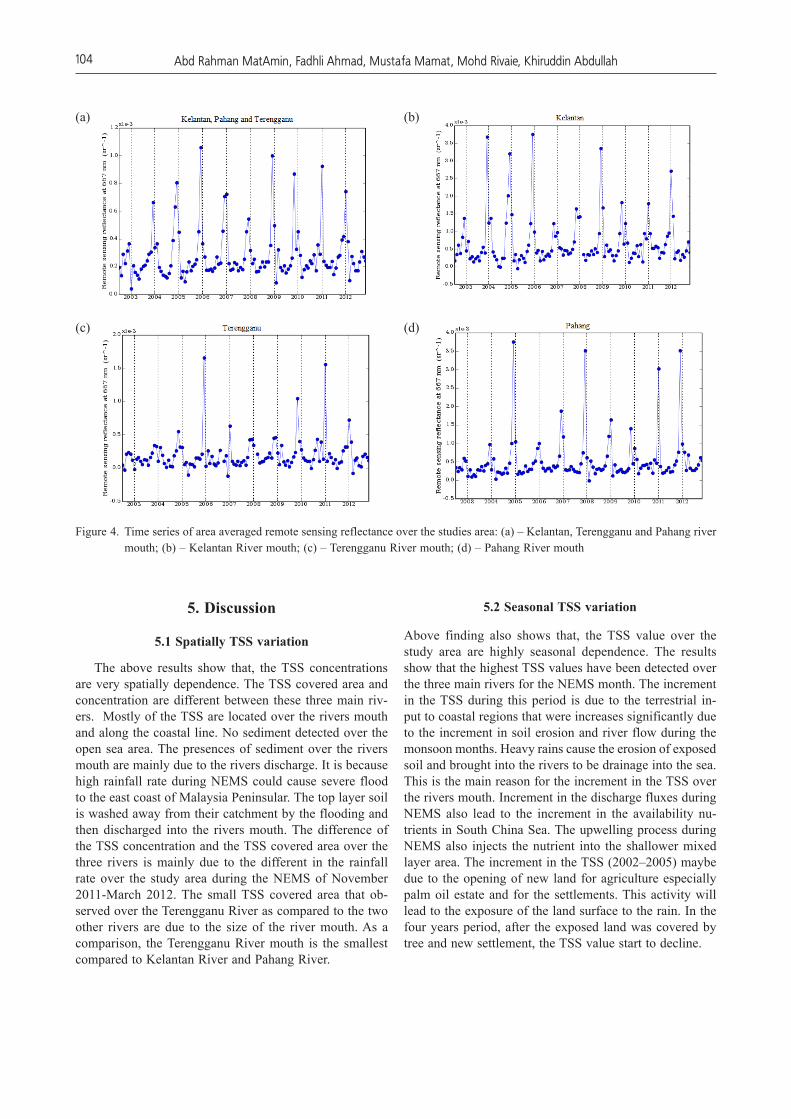
Figure 4 shows the area-averaged time series over the study area for the period of July 2002 to November 2012. In this section, the time series are divided into four catego-ries. Figure 4(a) shows the time series for the whole studies area including three main rivers. This time series covered the three main rivers mouth and coastal line along the stud-ies area. This time series clearly show that, the highest TSS value is observably for the month of November and December for every year. The highest area averaged TSS is obtained on December 2005 with the Rrs value is about 1.1 x 10⁻³ sr-1. Yearly trend shows that the highest TSS value increase consistently from 2002 to 2005. After that, the TSS decrease steadily until 2012.
Figure 4(b)-(d) shows the averaged time series for the Kelantan, Terengganu and Pahang rivers mouth for the pe-
riod of study as mark as A, B and C in the Figure 1. The entire graph shows an increment in the TSS during NEMS. Figure 4(b) shows the area averaged time TSS time series over the Kelantan River mouth. This time series show the variation of TSS are highly seasonal variation. Monthly TSS comparison shows that, the highest TSS observed on November-December for every year. Yearly comparison shows that the highest TSS is observed over the Kelantan River mouth are on December 2003 and December 2005 as shown in the Figure 4(b) with the Rrs value are 3.55 x10⁻³ sr-1 and 3.56 x 10⁻³ sr-1 respectively.
The area averaged time series for the Terengganu River is shown by the Figure 4(c). The TSS value for this area shows same pattern as Kelantan River but the value are much smaller. Figure 4(c) shows that the highest TSS was observable on December 2005 with Rrs value is 1.53 x 10⁻³ sr-1. Figure 4(d) shows the area averaged time series for the Pahang River. The time series also shows the seasonal pattern with the highest TSS observed on November-De-cember for every year. The highest TSS can be seen on December 2004 with Rrs value is about 3.52 x 10⁻³ sr-1.
Figure 3. Images of Rrs over study area for: (a) - November 2011-March 2012, (b) - May 2012-September 2012
104 Abd Rahman MatAmin, Fadhli Ahmad, Mustafa Mamat, Mohd Rivaie, Khiruddin Abdullah
5. Discussion
5.1 Spatially TSS variation
The above results show that, the TSS concentrations are very spatially dependence. The TSS covered area and concentration are different between these three main riv-ers. Mostly of the TSS are located over the rivers mouth and along the coastal line. No sediment detected over the open sea area. The presences of sediment over the rivers mouth are mainly due to the rivers discharge. It is because high rainfall rate during NEMS could cause severe flood to the east coast of Malaysia Peninsular. The top layer soil is washed away from their catchment by the flooding and then discharged into the rivers mouth. The difference of the TSS concentration and the TSS covered area over the three rivers is mainly due to the different in the rainfall rate over the study area during the NEMS of November 2011-March 2012. The small TSS covered area that ob-served over the Terengganu River as compared to the two other rivers are due to the size of the river mouth. As a comparison, the Terengganu River mouth is the smallest compared to Kelantan River and Pahang River.
5.2 Seasonal TSS variation
Above finding also shows that, the TSS value over the study area are highly seasonal dependence. The results show that the highest TSS values have been detected over the three main rivers for the NEMS month. The increment in the TSS during this period is due to the terrestrial in-put to coastal regions that were increases significantly due to the increment in soil erosion and river flow during the monsoon months. Heavy rains cause the erosion of exposed soil and brought into the rivers to be drainage into the sea. This is the main reason for the increment in the TSS over the rivers mouth. Increment in the discharge fluxes during NEMS also lead to the increment in the availability nu-trients in South China Sea. The upwelling process during NEMS also injects the nutrient into the shallower mixed layer area. The increment in the TSS (2002–2005) maybe due to the opening of new land for agriculture especially palm oil estate and for the settlements. This activity will lead to the exposure of the land surface to the rain. In the four years period, after the exposed land was covered by tree and new settlement, the TSS value start to decline.
Figure 4. Time series of area averaged remote sensing reflectance over the studies area: (a) – Kelantan, Terengganu and Pahang river mouth; (b) – Kelantan River mouth; (c) – Terengganu River mouth; (d) – Pahang River mouth
(a) (b)
(c) (d)
105Sediment Variation along the East Coast of Peninsular Malaysia
(a) (b)
(c)
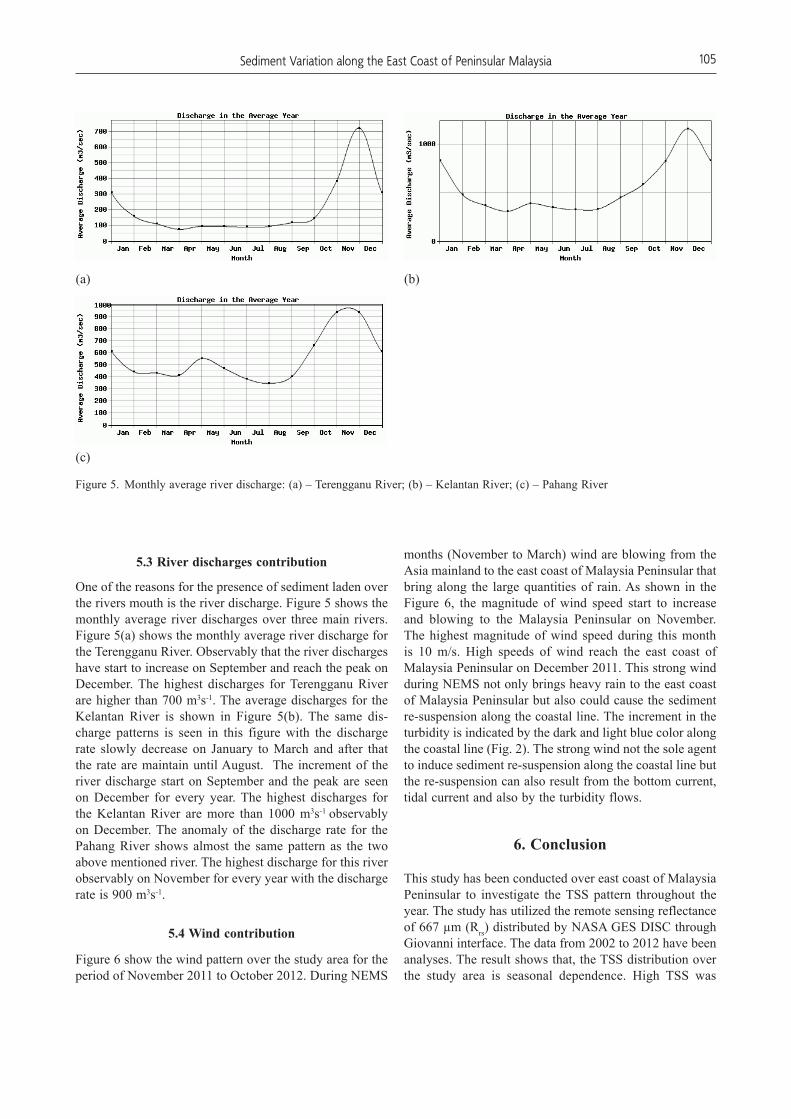
Figure 5. Monthly average river discharge: (a) – Terengganu River; (b) – Kelantan River; (c) – Pahang River
5.3 River discharges contribution
One of the reasons for the presence of sediment laden over the rivers mouth is the river discharge. Figure 5 shows the monthly average river discharges over three main rivers. Figure 5(a) shows the monthly average river discharge for the Terengganu River. Observably that the river discharges have start to increase on September and reach the peak on December. The highest discharges for Terengganu River are higher than 700 m3s-1. The average discharges for the Kelantan River is shown in Figure 5(b). The same dis-charge patterns is seen in this figure with the discharge rate slowly decrease on January to March and after that the rate are maintain until August. The increment of the river discharge start on September and the peak are seen on December for every year. The highest discharges for the Kelantan River are more than 1000 m3s-1 observably on December. The anomaly of the discharge rate for the Pahang River shows almost the same pattern as the two above mentioned river. The highest discharge for this river observably on November for every year with the discharge rate is 900 m3s-1.
5.4 Wind contribution
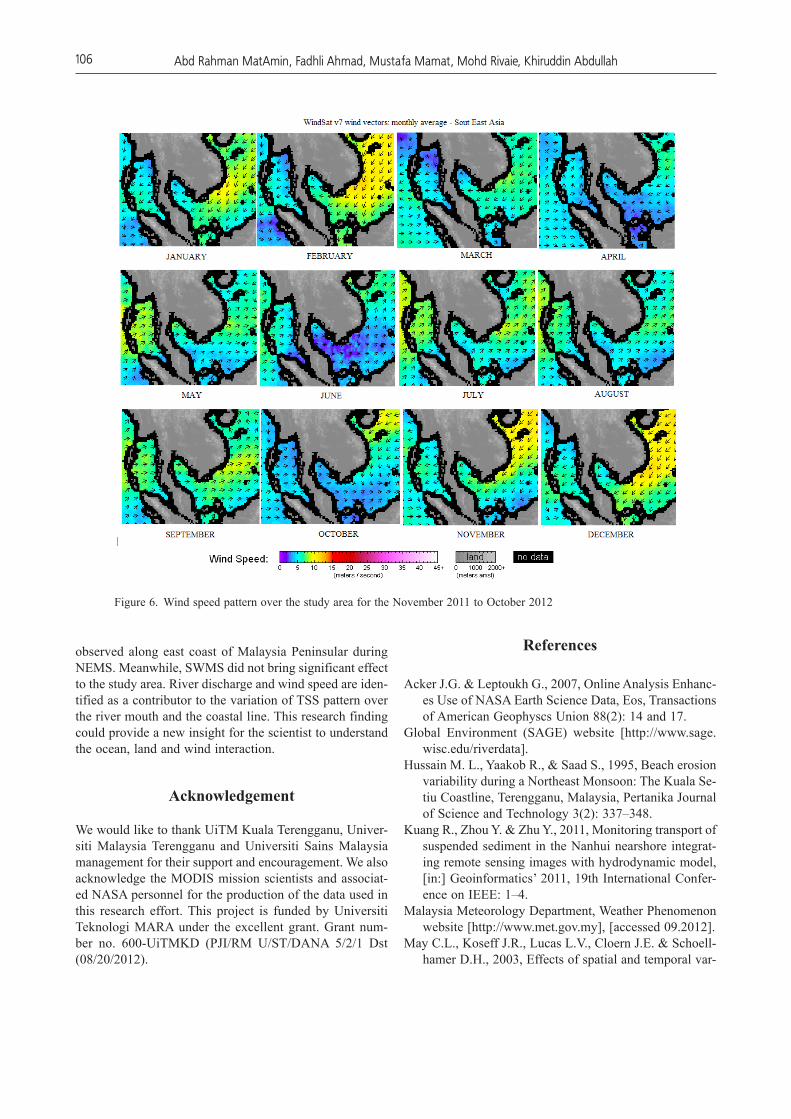
Figure 6 show the wind pattern over the study area for the period of November 2011 to October 2012. During NEMS
months (November to March) wind are blowing from the Asia mainland to the east coast of Malaysia Peninsular that bring along the large quantities of rain. As shown in the Figure 6, the magnitude of wind speed start to increase and blowing to the Malaysia Peninsular on November. The highest magnitude of wind speed during this month is 10 m/s. High speeds of wind reach the east coast of Malaysia Peninsular on December 2011. This strong wind during NEMS not only brings heavy rain to the east coast of Malaysia Peninsular but also could cause the sediment re-suspension along the coastal line. The increment in the turbidity is indicated by the dark and light blue color along the coastal line (Fig. 2). The strong wind not the sole agent to induce sediment re-suspension along the coastal line but the re-suspension can also result from the bottom current, tidal current and also by the turbidity flows.
6. Conclusion
This study has been conducted over east coast of Malaysia Peninsular to investigate the TSS pattern throughout the year. The study has utilized the remote sensing reflectance of 667 µm (Rrs) distributed by NASA GES DISC through Giovanni interface. The data from 2002 to 2012 have been analyses. The result shows that, the TSS distribution over the study area is seasonal dependence. High TSS was
106 Abd Rahman MatAmin, Fadhli Ahmad, Mustafa Mamat, Mohd Rivaie, Khiruddin Abdullah
observed along east coast of Malaysia Peninsular during NEMS. Meanwhile, SWMS did not bring significant effect to the study area. River discharge and wind speed are iden-tified as a contributor to the variation of TSS pattern over the river mouth and the coastal line. This research finding could provide a new insight for the scientist to understand the ocean, land and wind interaction.
Acknowledgement
We would like to thank UiTM Kuala Terengganu, Univer-siti Malaysia Terengganu and Universiti Sains Malaysia management for their support and encouragement. We also acknowledge the MODIS mission scientists and associat-ed NASA personnel for the production of the data used in this research effort. This project is funded by Universiti Teknologi MARA under the excellent grant. Grant num-ber no. 600-UiTMKD (PJI/RM U/ST/DANA 5/2/1 Dst (08/20/2012).
References
Acker J.G. & Leptoukh G., 2007, Online Analysis Enhanc-es Use of NASA Earth Science Data, Eos, Transactions of American Geophyscs Union 88(2): 14 and 17.
Global Environment (SAGE) website [http://www.sage.wisc.edu/riverdata].
Hussain M. L., Yaakob R., & Saad S., 1995, Beach erosion variability during a Northeast Monsoon: The Kuala Se-tiu Coastline, Terengganu, Malaysia, Pertanika Journal of Science and Technology 3(2): 337–348.
Kuang R., Zhou Y. & Zhu Y., 2011, Monitoring transport of suspended sediment in the Nanhui nearshore integrat-ing remote sensing images with hydrodynamic model, [in:] Geoinformatics’ 2011, 19th International Confer-ence on IEEE: 1–4.
Malaysia Meteorology Department, Weather Phenomenon website [http://www.met.gov.my], [accessed 09.2012].
May C.L., Koseff J.R., Lucas L.V., Cloern J.E. & Schoell-hamer D.H., 2003, Effects of spatial and temporal var-
Figure 6. Wind speed pattern over the study area for the November 2011 to October 2012
107Sediment Variation along the East Coast of Peninsular Malaysia
iability of turbidity on phytoplankton blooms, Marine Ecology Progress Ser. 25: 111–128.
Mayer L.M., Keil R.G., Macko S.A., Joye S.B., Ruttenberg K.C. & Aller R.C., 1998, Importance of suspended par-ticipates in riverine delivery of bioavailable nitrogen to coastal zones, Global Biogeochemical Cycles, 12: 573–579.
Miller R.L. & Cruise J.F., 1995, Effects of suspended sed-iments on coral growth: Evidence from remote sensing and hydrologic modeling, Remote Sensing of Environ-ment 53: 177–187.
Miller R.L. & McKee B.A., 2004, Using MODIS Terra 250 m imagery to map concentrations of total suspended matter in coastal waters, Remote Sensing of Environ-ment 93: 259–266.
Min J.E., Ryu J.H., Lee S. & Son S., 2012, Monitoring of suspended sediment variation using Landsat and MODIS in the Saemangeum coastal area of Korea, Marine Pollution Bulletin 64: 382–390.
National Aeronautics and Space Administration web-site [http://gdata1.sci.gsfc.nasa.gov/daac-bin/G3/gui.cgi?instance_id=ocean_month].
Olsen C.F., Cutshall N.H. & Larsen I.L., 1982, Pollutant—particle associations and dynamics in coastal marine en-vironments: a review, Marine Chemistry 11: 501–533.
Pavelsky T.M. & Smith L.C., 2009, Remote sensing of suspended sediment concentration, flow velocity, and lake recharge in the Peace-Althabasca Delta, Canada, Water Resources Research 45: W11417.
Prasad A.K. & Singh R.P., 2010, Chlorophyll, calcite, and suspended sediment concentrations in the Bay of Ben-gal and the Arabian Sea at the river mouths, Advances in Space Research 45: 61–69.
RSS WindSat [available at www.remss.com].Schallenberg M. & Burns C.W., 2004, Effects of sediment
resuspension on phytoplankton production: teasing apart the influences of light, nutrients and algal entrain-ment, Freshwater Biology 49(2): 143–159.
Salomonson V.V., Barnes W.L., Maymon P.W., Montgom-ery H.E. & Ostrow H., 1989, MODIS: Advanced fa-cility instrument for studies of the Earth as a system, IEEE Transactions on Geoscience and Remote Sensing 27: 145–153.
Villar E.R., Martinez J.M., Le Texier M., Guyot J.L., Fraizy P., Meneses P.R. & Oliveira E.D., 2012, A study of sediment transport in the Madeira River, Bra-zil, using MODIS remote-sensing images, Journal of South American Earth Sciences (2012), [doi: 10.1016/j.jsames], [accessed 06.11.2012].
Wang J.J. & Lu X.X., 2010, Estimation of suspended sed-iment concentrations using Terra MODIS: An example from the Lower Yangtze River, China Sciience of the Total Environment 408(5): 1131–1138.

Related Documents