UNCORRECTED PROOF Ocean Engineering ] (]]]]) ]]]–]]] Sediment transport patterns at Trafalgar offshore windfarm G. Besio a, , M.A. Losada b a D.I.C.A.T Department of Civil, Environmental and Architectural Engineering, Via Montallegro 1, 16145 Genova, Italy b Grupo de Puertos y Costas, Centro Andaluz de Medio Ambiente (CEAMA), Avenida del Mediterraneo s/n, 18006 Granada, Spain Received 16 November 2006; accepted 2 January 2008 Abstract A simple analytical model of wave propagation has been developed in order to study the potential sediment transport patterns due to the action of currents and waves in the neighborhood of cylindrical structures as well inside a group of these structures. The attention is focused on the study of Trafalgar offshore windfarm, a case in which it has been necessary to analyze the flow trough porous structures in order to model fish growing-cages planned to be installed at each aerogenerator structure. The results are obtained by averaging over one period of wave in order to evaluate the net potential sediment transport. The analysis of the results reveals how the processes of wave diffraction and reflection give rise to periodic patterns of sediment transport around and between the structures. r 2008 Published by Elsevier Ltd. Keywords: Sediment transport; Porous media; Waves; Cylindrical structures; Wave reflection; Diffraction; Windfarm 1. Introduction Nowadays the use of cylindrical structures in ocean and coastal engineering has assumed a predominant role, especially in the constructions of piers, wharfs, quays, artificial islands and offshore platforms. The choice to use this kind of geometry is justified either by constructive matters (the round shape minimizes the wave–structure interaction) or by morphodynamic reasons (the scour induced by a circular structure is usually smaller than that induced by a sharp corner structure due to the absence of separation of the current stream). One of the first studies about wave–structure interaction that considered just one single pile was presented by MacCamy and Fuchs (1954) who based their work on the linear diffraction theory over a flat bed. Since then, the research about wave interaction with a single cylindrical structure has received several contributions as shown in the review books of Sarpkaya and Isaacson (1981) and Chakrabarti (1987). The first study of the wave interaction with permeable cylindrical structure was carried out by Darwiche et al. (1994) and Wang and Ren (1994). These studies focused their attention on the wave interaction with a semi-porous cylindrical breakwater protecting an impermeable cylind- rical structure. In both cases the flow through the porous media was assumed to comply the Darcy’s law as suggested by Taylor (1956). More recently Williams and Li (2000) and Silva et al. (2003) dealt with arrays of porous circular cylinders. The former found a semi-analytical solution in the case of bottom mounted surface-piercing structures subject to monochromatic waves, while the latter derived an analytical solution for either submerged or emerged structures; this solution has been evaluated in the case of monochromatic waves and, using a transfer function, for spectral multidirectional waves. In the present contribution a simple model based on the above-mentioned theories, and in particular on the work of Silva et al. (2003), has been developed in order to study the effects of the interaction between waves and a field of cylindrical structures representing aerogenerators located offshore of Cape Trafalgar, Spain. The attention has been focused on the patterns of sediment transport which arise around a single pile and in the proximity of a group of them. The constructive typology of the structures foresees the integration of cages for fish farming with the piles of the offshore windfarms. In order to limit the velocities at the interior of the cages to values sustainable to the fishes ARTICLE IN PRESS www.elsevier.com/locate/oceaneng 1 3 5 7 9 11 13 15 17 19 21 23 25 27 29 31 33 35 37 39 41 43 45 47 49 51 53 55 57 59 61 63 65 67 69 71 73 75 77 79 81 83 85 5þ model OE : 1450 Prod:Type:FLP pp:1213ðcol:fig::NILÞ ED:ShijaJeejiDaniel PAGN:Bhaskara SCAN: 0029-8018/$ - see front matter r 2008 Published by Elsevier Ltd. doi:10.1016/j.oceaneng.2008.01.002 Corresponding author. Tel.: +39 010 3532491; fax: +39 010 3532546. E-mail addresses: [email protected], [email protected] (G. Besio). Please cite this article as: Besio, G., Losada, M.A., Sediment transport patterns at Trafalgar offshore.... Ocean Engineering (2008), doi:10.1016/ j.oceaneng.2008.01.002

Welcome message from author
This document is posted to help you gain knowledge. Please leave a comment to let me know what you think about it! Share it to your friends and learn new things together.
Transcript
ARTICLE IN PRESS
1
3
5
7
9
11
13
15
17
19
21
23
25
27
29
31
33
35
37
39
41
43
45
47
49
51
53
55
57
5þmodelOE : 1450 Prod:Type:FLP
pp:1213ðcol:fig::NILÞED:ShijaJeejiDaniel
PAGN:Bhaskara SCAN:
0029-8018/$ - se
doi:10.1016/j.oc
�CorrespondiE-mail addre
Besio).
Please cite thi
j.oceaneng.200
Ocean Engineering ] (]]]]) ]]]–]]]
www.elsevier.com/locate/oceaneng
Sediment transport patterns at Trafalgar offshore windfarm
G. Besioa,�, M.A. Losadab
aD.I.C.A.T Department of Civil, Environmental and Architectural Engineering, Via Montallegro 1, 16145 Genova, ItalybGrupo de Puertos y Costas, Centro Andaluz de Medio Ambiente (CEAMA), Avenida del Mediterraneo s/n, 18006 Granada, Spain
Received 16 November 2006; accepted 2 January 2008
ROOFAbstract
A simple analytical model of wave propagation has been developed in order to study the potential sediment transport patterns due to
the action of currents and waves in the neighborhood of cylindrical structures as well inside a group of these structures. The attention is
focused on the study of Trafalgar offshore windfarm, a case in which it has been necessary to analyze the flow trough porous structures in
order to model fish growing-cages planned to be installed at each aerogenerator structure. The results are obtained by averaging over one
period of wave in order to evaluate the net potential sediment transport. The analysis of the results reveals how the processes of wave
diffraction and reflection give rise to periodic patterns of sediment transport around and between the structures.
r 2008 Published by Elsevier Ltd.
Keywords: Sediment transport; Porous media; Waves; Cylindrical structures; Wave reflection; Diffraction; Windfarm
P E59
61
63
65
67
69
71
73
75
77
79
UNCORRECT1. Introduction
Nowadays the use of cylindrical structures in ocean andcoastal engineering has assumed a predominant role,especially in the constructions of piers, wharfs, quays,artificial islands and offshore platforms. The choice to usethis kind of geometry is justified either by constructivematters (the round shape minimizes the wave–structureinteraction) or by morphodynamic reasons (the scourinduced by a circular structure is usually smaller than thatinduced by a sharp corner structure due to the absence ofseparation of the current stream). One of the first studiesabout wave–structure interaction that considered just onesingle pile was presented by MacCamy and Fuchs (1954)who based their work on the linear diffraction theory overa flat bed. Since then, the research about wave interactionwith a single cylindrical structure has received severalcontributions as shown in the review books of Sarpkayaand Isaacson (1981) and Chakrabarti (1987). The firststudy of the wave interaction with permeable cylindricalstructure was carried out by Darwiche et al. (1994) andWang and Ren (1994). These studies focused their
81
e front matter r 2008 Published by Elsevier Ltd.
eaneng.2008.01.002
ng author. Tel.: +39010 3532491; fax: +39 010 3532546.
sses: [email protected], [email protected] (G.
s article as: Besio, G., Losada, M.A., Sediment transport pa
8.01.002
Dattention on the wave interaction with a semi-porouscylindrical breakwater protecting an impermeable cylind-rical structure. In both cases the flow through the porousmedia was assumed to comply the Darcy’s law as suggestedby Taylor (1956). More recently Williams and Li (2000)and Silva et al. (2003) dealt with arrays of porous circularcylinders. The former found a semi-analytical solution inthe case of bottom mounted surface-piercing structuressubject to monochromatic waves, while the latter derivedan analytical solution for either submerged or emergedstructures; this solution has been evaluated in the case ofmonochromatic waves and, using a transfer function, forspectral multidirectional waves.In the present contribution a simple model based on the
above-mentioned theories, and in particular on the work ofSilva et al. (2003), has been developed in order to study theeffects of the interaction between waves and a field ofcylindrical structures representing aerogenerators locatedoffshore of Cape Trafalgar, Spain. The attention has beenfocused on the patterns of sediment transport which arisearound a single pile and in the proximity of a group ofthem. The constructive typology of the structures foreseesthe integration of cages for fish farming with the piles ofthe offshore windfarms. In order to limit the velocities atthe interior of the cages to values sustainable to the fishes
83
85
tterns at Trafalgar offshore.... Ocean Engineering (2008), doi:10.1016/
ARTICLE IN PRESS
OE : 1450
1
3
5
7
9
11
13
15
17
19
21
23
25
27
29
31
33
35
37
39
41
43
45
47
49
51
53
55
57
59
61
63
65
67
69
71
73
75
77
79
81
83
85
87
89
G. Besio, M.A. Losada / Ocean Engineering ] (]]]]) ]]]–]]]2
T
which will be fed inside (basically gilthead breams and seabasses), it is necessary to design the structural elements ofthe cages as dissipative ones in order to lower the energytransmitted by waves and tidal current. Hence developingthe project it is necessary to satisfy two antagonisticconditions: reduced velocities in the aquaculture cages inorder to limit the stress on the fishes and reduced reflectionand diffraction of the sea waves in order to minimize thesedimentary dynamics of the sea bed around the structuresand inside a group of them. A possible solution to thisproblem is to model the cages as thin porous structures,investigating which values of porosity � and frictioncoefficient f comply with the previous conditions.
The procedure used in the rest of the paper is as follows.In the next section, we will describe the Trafalgar offshorewindfarm—aquaculture project. In Section 3 the theore-tical model is developed. The results are described inSection 4 where we will present quantitative figures ofvelocity field and potential sediment transport in functionof the parameters of the problem, while in Section 5 someconclusions are drawn.
2. ‘‘Mar de Trafalgar’’ offshore windfarm—aquaculture
project. Site characterization
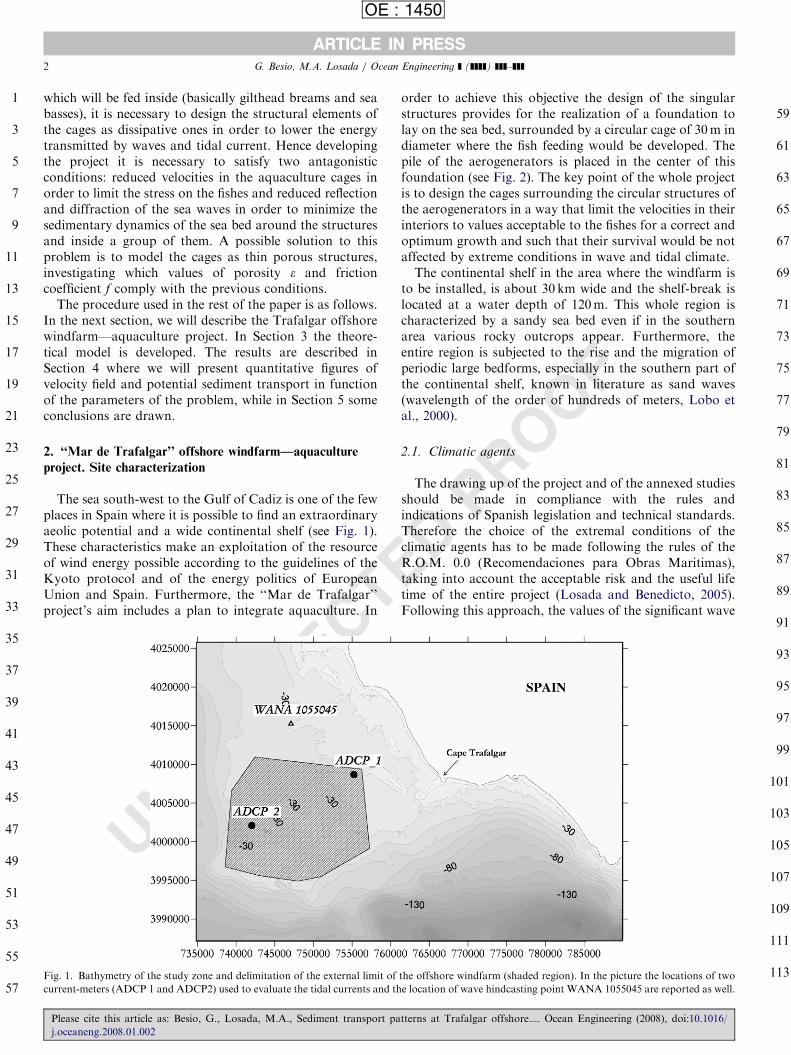
The sea south-west to the Gulf of Cadiz is one of the fewplaces in Spain where it is possible to find an extraordinaryaeolic potential and a wide continental shelf (see Fig. 1).These characteristics make an exploitation of the resourceof wind energy possible according to the guidelines of theKyoto protocol and of the energy politics of EuropeanUnion and Spain. Furthermore, the ‘‘Mar de Trafalgar’’project’s aim includes a plan to integrate aquaculture. In
UNCORREC
Fig. 1. Bathymetry of the study zone and delimitation of the external limit of
current-meters (ADCP 1 and ADCP2) used to evaluate the tidal currents and th
Please cite this article as: Besio, G., Losada, M.A., Sediment transport pa
j.oceaneng.2008.01.002
ED PROOF
order to achieve this objective the design of the singularstructures provides for the realization of a foundation tolay on the sea bed, surrounded by a circular cage of 30m indiameter where the fish feeding would be developed. Thepile of the aerogenerators is placed in the center of thisfoundation (see Fig. 2). The key point of the whole projectis to design the cages surrounding the circular structures ofthe aerogenerators in a way that limit the velocities in theirinteriors to values acceptable to the fishes for a correct andoptimum growth and such that their survival would be notaffected by extreme conditions in wave and tidal climate.The continental shelf in the area where the windfarm is
to be installed, is about 30 km wide and the shelf-break islocated at a water depth of 120m. This whole region ischaracterized by a sandy sea bed even if in the southernarea various rocky outcrops appear. Furthermore, theentire region is subjected to the rise and the migration ofperiodic large bedforms, especially in the southern part ofthe continental shelf, known in literature as sand waves(wavelength of the order of hundreds of meters, Lobo etal., 2000).
2.1. Climatic agents
The drawing up of the project and of the annexed studiesshould be made in compliance with the rules andindications of Spanish legislation and technical standards.Therefore the choice of the extremal conditions of theclimatic agents has to be made following the rules of theR.O.M. 0.0 (Recomendaciones para Obras Maritimas),taking into account the acceptable risk and the useful lifetime of the entire project (Losada and Benedicto, 2005).Following this approach, the values of the significant wave
91
93
95
97
99
101
103
105
107
109
111
113the offshore windfarm (shaded region). In the picture the locations of two
e location of wave hindcasting point WANA 1055045 are reported as well.
tterns at Trafalgar offshore.... Ocean Engineering (2008), doi:10.1016/

E
ROOF
ARTICLE IN PRESS
OE : 1450
1
3
5
7
9
11
13
15
17
19
21
23
25
27
29
31
33
35
37
39
41
43
45
47
49
51
53
55
57
59
61
63
65
67
69
71
73
75
77
79
81
83
85
87
89
91
93
95
97
99
101
103
105
107
109
111
113
Fig. 2. Pictorial views of the integrated structure composed by the aerogenerator and the aquaculture cage. Courtesy of INR Eolica.
G. Besio, M.A. Losada / Ocean Engineering ] (]]]]) ]]]–]]] 3
UNCORRECTheight Hm0 associated to the peak period Tp and the valuesof the velocity of the tidal current U to be used in theanalysis can be estimated (Besio, 2005).
2.1.1. Wave climate
The analysis of the wave climate has been performedwith the data provided by Puertos del Estado at onehindcasting point which can be considered the mostrepresentative of the sea climate, denoted as WANA1055045. WANA1055045 is close to Cabo Roche atapproximately 30m in depth and its coordinates arelatitude 36025 and longitude �6025. This point covers aperiod of time from 1996 to 2003 and provides data aboutsignificant wave height ðHm0Þ, peak period ðTpÞ, and meanwave direction W (in degrees; 0� ¼ N; 90� ¼ EÞ every 3 h.
In order to analyze the extreme sea state regime, a peaksover threshold analysis (POT) was performed, defining astorm event that formed by the consecutive sequences ofsea states in which the significant wave height exceeds thethreshold value of Hm0 ¼ 2m. For every storm event, theduration of the storm, the maximum value of Hm0 achievedand the corresponding values of the peak period, Tp andmean wave direction W were calculated.
Fig. 3 shows the significant wave height–mean wavedirection rose diagrams, and the joint probability densityfunction of significant wave height and peak period for theWANA point considered. This information together withan analysis of the extreme values performed checking theadjustment of different probability distribution (Gumbel,Weibull, Lognormal), reveal that the design storms are
Please cite this article as: Besio, G., Losada, M.A., Sediment transport pa
j.oceaneng.2008.01.002
D Pcharacterized by a value of the significant wave equal to7.2m proceeding from W–SW, with a peak period of about13 s.
2.1.2. Tidal currents at Trafalgar heights
In order to obtain reliable information about thepropagation of the tidal wave offshore of the Atlanticcoast of Andalusia, in the proximity of the Trafalgar shelf,two current meters have been placed close to the TrafalgarCape (see Fig. 1). The two ADCP have been positioned,respectively, at 26 and 40m of depth and have beenmeasuring current velocities and pressure during a periodof time spanning from 13/11/2003 to 10/12/2003 for thefirst ADCP and from 13/11/2003 to 19/12/2003 for thesecond ADCP.In Fig. 4 the signal of the tide development over one year
is reported, evaluated by means of the analysis of thedifferent tide constituents from the data of ADCP1. Fromthis chart it is possible to observe that the range of theextremal values of the tide velocity is of the order ofmagnitude of 1m/s. Furthermore, when combining thevalue of the velocity amplitude with the direction ofpropagation, it is possible to observe that the velocity fieldis mainly horizontal with a north–south component muchlarger than the west–east of about one order of magnitude.Moreover all the peaks of the tide correspond to velocitydirected from N–NW to S–SE corresponding to the tideentering the Strait of Gibraltar (Lobo et al., 2000). In Table1 the extreme conditions of the climatic agents obtainedfollowing R.O.M. 0.0 guidelines are resumed.
tterns at Trafalgar offshore.... Ocean Engineering (2008), doi:10.1016/

UNCORRECTED PROOF
ARTICLE IN PRESS
OE : 1450
1
3
5
7
9
11
13
15
17
19
21
23
25
27
29
31
33
35
37
39
41
43
45
47
49
51
53
55
57
59
61
63
65
67
69
71
73
75
77
79
81
83
85
87
89
91
93
95
97
99
101
103
105
107
109
111
113
Fig. 3. Extreme conditions for hindcasting point WANA 1055045. Left panel: significant wave height–mean direction rose diagram. Right panel: joint
probability density functions of significant wave height and peak period.
1000 2000 3000 4000 5000 6000 7000 8000
0.2
0.4
0.6
0.8
1
Velocity Modulus − Astronomic Tide
Vel
ocity
[m
/s]
1000 2000 3000 4000 5000 6000 7000 8000
−150
−100
−50
0
50
100
150
Direction °E − Astronomic Tide
Time [h]
Ang
le [
°]
Fig. 4. Modulus and direction of tidal current throughout one year. Values obtained after the analysis of data of ADCP1.
G. Besio, M.A. Losada / Ocean Engineering ] (]]]]) ]]]–]]]4
2.2. Sediment characteristics
The sediment size in the zone close to the coast ofTrafalgar is composed of a high percentage of fine sand.Moving from north to south, the medium size sand phaseincreases towards Trafalgar, fed by the erosion of the cliffs.
Please cite this article as: Besio, G., Losada, M.A., Sediment transport pa
j.oceaneng.2008.01.002
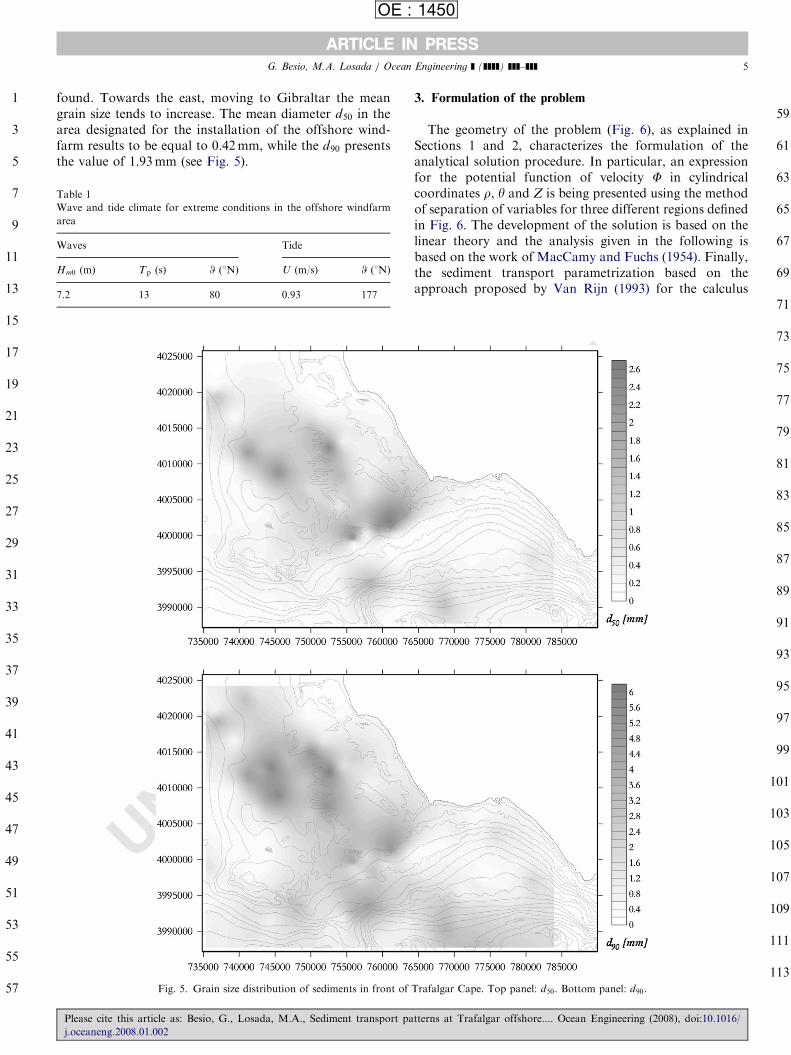
It is here where the maximum amounts of medium sand(higher than 0.5mm) is reached. In the Trafalgar shelf (seeFig. 5), most of the coarse sand is found over the deepestareas in the highs while finer sand is distributed over thedunes and down the scarp. From Trafalgar Cape south-ward, the medium size phase decreases and the finer sand is
tterns at Trafalgar offshore.... Ocean Engineering (2008), doi:10.1016/
ARTICLE IN PRESS
OE : 1450
1
3
5
7
9
11
13
15
17
19
21
23
25
27
29
31
33
35
37
39
41
43
45
47
49
51
53
55
57
59
61
G. Besio, M.A. Losada / Ocean Engineering ] (]]]]) ]]]–]]] 5
found. Towards the east, moving to Gibraltar the meangrain size tends to increase. The mean diameter d50 in thearea designated for the installation of the offshore wind-farm results to be equal to 0.42mm, while the d90 presentsthe value of 1.93mm (see Fig. 5).
UNCORRECTE
63
65
67
69
Table 1
Wave and tide climate for extreme conditions in the offshore windfarm
area
Waves Tide
Hm0 (m) Tp (s) W (1N) U (m/s) W (1N)
7.2 13 80 0.93 177
Fig. 5. Grain size distribution of sediments in front of
Please cite this article as: Besio, G., Losada, M.A., Sediment transport pa
j.oceaneng.2008.01.002
3. Formulation of the problem
The geometry of the problem (Fig. 6), as explained inSections 1 and 2, characterizes the formulation of theanalytical solution procedure. In particular, an expressionfor the potential function of velocity F in cylindricalcoordinates r, y and Z is being presented using the methodof separation of variables for three different regions definedin Fig. 6. The development of the solution is based on thelinear theory and the analysis given in the following isbased on the work of MacCamy and Fuchs (1954). Finally,the sediment transport parametrization based on theapproach proposed by Van Rijn (1993) for the calculus
D PROOF
71
73
75
77
79
81
83
85
87
89
91
93
95
97
99
101
103
105
107
109
111
113Trafalgar Cape. Top panel: d50. Bottom panel: d90.
tterns at Trafalgar offshore.... Ocean Engineering (2008), doi:10.1016/

ARTICLE IN PRESS
OE : 1450
1
3
5
7
9
11
13
15
17
19
21
23
25
27
29
31
33
35
37
39
41
43
45
47
49
51
53
55
57
59
61
63
65
67
69
71
73
75
77
79
81
83
85
87
89
91
93
95
97
99
101
103
105
107
109
111
113
Fig. 6. Definition sketch of the problem geometry. X -axis is pointing east, Y -axis is pointing north. Z-axis lay on the free surface.
G. Besio, M.A. Losada / Ocean Engineering ] (]]]]) ]]]–]]]6
UNCORRECT
of the bed load due to the presence of combined currentand waves is presented.
3.1. Hydrodynamics
The velocity potential function, defined by the followingexpressions:
u ¼qFqX
, (1a)
v ¼qFqY
, (1b)
w ¼qFqZ
(1c)
can be obtained solving the Laplace equation
r2F ¼q2FqX 2þ
q2FqY 2þ
q2FqZ2¼ 0 (2)
coupled with the classic boundary conditions of vanishingof vertical velocity at the bed and the dynamic condition atthe free surface obtained evaluating the Bernoulli equationfor z ¼ ZðX ;Y ; tÞ where Z is the free surface elevation.Finally, the system should comply the radiation conditionat infinity, i.e. that there is no reflection of the perturbedwaves from the limits of the domain.
Because of the cylindrical symmetry of the system, it isconvenient to rewrite Eq. (2) in cylindrical coordinates
r2F ¼q2Fqr2þ
1
r
qFqrþ
1
r2q2F
qy2þ
q2FqZ2¼ 0 (3)
and hence it is possible to obtain an expression for thefunction F of the incident waves propagating with an angleb with respect to the x-axis as follows:
Fi ¼ AF ðZÞeik�xe�iot
¼ AF ðZÞX1m¼0
dmimJmðkrÞ cos½mðy� bÞ�e�iot, ð4Þ
where A is the wave amplitude, k is the wavenumber, o isthe wave frequency, dm are the Jacobi numbers and JmðkrÞ
is the Bessel function of the first kind of order m. Finally,F ðZÞ is a depth function defined as
Please cite this article as: Besio, G., Losada, M.A., Sediment transport pa
j.oceaneng.2008.01.002
ED PROOF
F ðZÞ ¼ �ig
2ocosh½kðhþ ZÞ�
coshðkhÞ. (5)
The potential function of the scattered wave can beexpressed with an expression similar to (4) even if it isuseful to use the Hankel function instead of the Bessel one,because the former complies automatically with theradiation condition at infinity. The total potential functionof velocity can be expressed as a sum of the potentialfunction for the incident wave and for the scattered wave.The velocity potential F is defined for the three differentregions as
F1 ¼ AI0ðZÞX1m¼0
dmim½AmJmðk0rÞ þ BmH ð1Þm ðk0rÞ�
� cos½mðy� bÞ�e�iot, ð6Þ
F2 ¼ AP0ðZÞX1m¼0
dmim½CmJmðK0rÞ þDmH ð1Þm ðK0rÞ�
� cos½mðy� bÞ�e�iot, ð7Þ
F3 ¼ AI0ðZÞX1m¼0
dmim½Jmðk0rÞ þ EmH ð1Þm ðk0rÞ�
� cos½mðy� bÞ�e�iot, ð8Þ
where I0 and P0 are the depth function for the water andthe porous media, respectively, and H ð1Þm is the Hankelfunction of the first kind, order m. Furthermore, thevelocity potentials in the three different regions satisfyLaplace equation (2). The wavenumber k0 refers to thewater regions and it is evaluated by means of the followingdispersion relationship:
ðo�Ukx0 � Vk
y0Þ
2¼ gk0 tanhðk0hÞ, (9)
where U and V are the velocity components along the X -and Y -axis, respectively. For what concern the wavenum-ber in the porous media, due to the fact that wavediffraction under current in porous medium is a majorproblem, the size of the porous ring is much smaller thanthe wavelength and because the current is almost perpen-dicular to the waves, the dispersion relationship obtainedby Darlymple et al. (1991) for the propagation of linear
tterns at Trafalgar offshore.... Ocean Engineering (2008), doi:10.1016/

E
ARTICLE IN PRESS
OE : 1450
1
3
5
7
9
11
13
15
17
19
21
23
25
27
29
31
33
35
37
39
41
43
45
47
49
51
53
55
57
59
61
63
65
67
69
71
73
75
77
79
81
83
85
87
89
91
93
95
97
99
101
103
105
107
109
111
113
G. Besio, M.A. Losada / Ocean Engineering ] (]]]]) ]]]–]]] 7
UNCORRECT
waves in an homogeneous and isotropic media has beenadopted
o2ðs� if Þ ¼ gK0 tanhðK0hÞ, (10)
where s is the added mass coefficient and f is the frictionfactor.
Since the solutions in adjacent regions must be contin-uous at each interface, it is necessary to impose theboundary conditions of continuity of mass flux andpressure at the surface of the impermeable cylinder ðr ¼aÞ and at the limit between the water regions and theporous media ðr ¼ b, r ¼ cÞ:
qF1
qr¼ 0; r ¼ a and � hoZo0, (11)
qF1
qr¼ �
qF2
qr; F1 ¼ ðs� if ÞF2; r ¼ b and � hoZo0,
(12)
�qF2
qr¼
qF3
qr; ðs� if ÞF2 ¼ F3; r ¼ c and � hoZo0,
(13)
where � is the porosity of the permeable material and in theporous medium (region 2) the incompressible fluid motionis described in terms of seepage velocity and pressure. Asshowed by Darlymple et al. (1991), for intermediate andshallow waters no evanescent modes are needed in order tomatch the solution between adjacent regions as thehorizontal velocity of linear waves is uniformly distributedover the vertical. In this case Darlymple et al. (1991)showed that the relative error between the long waveapproximation and the full solution tends to values smallerthan 5% for values of kho1.
In order to evaluate the constants Am, Bm, Cm, Dm, Em, itis necessary to orthogonalize Eqs. (11)–(13) and solve thelinear system which is obtained. Once the solution for thepotential is obtained, it is possible to evaluate the freesurface elevation Z imposing the Bernoulli boundarycondition at the free surface and the instantaneous velocityfield follows from Eqs. (1a)–(1c).
In order to study the effect of interaction among wavesand a group of structures with respect to the sedimenttransport, the model proposed by Silva et al. (2003) hasbeen employed, considering an equivalent porous pile forthe element composed by the aerogenerator and the porouscage. Details on the procedure needed to extend thesolution for one cylinder to a group of porous cylindershave been reported in Appendix A.
3.2. Sediment transport
Due to the contemporaneous presence of current andwaves, the sediment transport model employed has to takeinto account these two effects. To comply this necessity, theformulation proposed by Van Rijn (1993) for bed materialtransport in combined waves and currents has been chosen
Please cite this article as: Besio, G., Losada, M.A., Sediment transport pa
j.oceaneng.2008.01.002
D PROOF
among different suitable models. Basically in the presenceof strong tidal current (as is the case at the Trafalgar shelf),the particles are mobilized by the stirring wave action,while the net transport is controlled by the direction andintensity of the current.The formulation proposed by Van Rijn (1993) is based
on an instantaneous evaluation of the sediment transportand the bed load reads as
Qb ¼ 0:25abd50D�0:3�
tb;cwrw
� �0:5 tb;cw � tb;crtb;cr
� �1:5, (14)
where ab is a calibration factor, depending on the wavessignificant height and the local depth ðab ¼ 1� ðHm0=hÞ0:5Þ,d50 is the median particle diameter of bed material and D�is a dimensionless particle diameter defined asD� ¼ ½ðssed � 1Þg=n2�1=3d. Furthermore ssed is the ratiobetween the sediment density and the water densityðrs=rwÞ, while n is the kinematic viscosity of the water.The rate of sediment transport is proportional to the grain-related instantaneous bed shear stress due to combinedcurrent and waves tb;cw. Eq. (14) presents a threshold valueðtb;crÞ for the sediment mobilization which is a function ofthe sediment size characteristics. According to the Shieldscurve (Tanaka and Van To, 1995):
tb;cr ¼ f0:055½1� expð�0:09S0:58� Þ� þ 0:09S�0:72� g
�ðrwðssed � 1Þgd50Þ, ð15Þ
where S� is the particle number S� ¼
ffiffiffiffiffiffiffiffiffiffiffiffiffiffiffiffiffiffiffiffiffiffiffiffiffiffiffiðssed � 1Þgd3
50
q=4n.
The instantaneous bed shear stress related to the graindue to combined current and waves can be expressed astb;cw ¼ 1
2rwf 0cwU2
d (the interested reader is referred to VanRijn, 1993 and references therein) where the velocity Ud
represents the modulus of the instantaneous velocity due tocombined presence of current and waves. Its value isobtained adding the instantaneous velocity componentsalong the X - and Y -axes due to waves and current to thenear bed wave induced velocity unb, introduced to take intoaccount wave asymmetry:
Ud ¼
ffiffiffiffiffiffiffiffiffiffiffiffiffiffiffiffiffiffiffiffiffiffiffiffiUX2
d þUY2d
q; UX
d ¼ uw þ uc þ unb,
UYd ¼ vw þ vc þ vnb, ð16Þ
where ðunb; vnbÞ ¼ ½0:05� ðas � 0:5Þ�ðUX
d ; UY
d Þ, defined infunction of the wave near bed peak orbital velocityðU
X
d ; UY
d Þ and as is an asymmetry factor of the oscillatingflux, defined as the fraction of the near bed peak orbitalvelocity in forward direction and the sum of the formerwith the near bed orbital velocity in backward direction.Finally, it is necessary to evaluate the instantaneousfriction coefficient f 0cw which depends on the frictioncoefficients due to the presence of current and waves f 0cw ¼
af bf f 0c þ ð1� af Þf0w where af is defined as the ratio between
the modulus of the current velocity and the sum of thelatter with the modulus of the near bed peak orbitalvelocity af ¼ jucj=ðjucj þ jUdjÞ, while bf is a function of thethickness of the boundary layer
tterns at Trafalgar offshore.... Ocean Engineering (2008), doi:10.1016/

ARTICLE IN PRESS
OE : 1450
1
3
5
7
9
11
13
15
17
19
21
23
25
27
29
31
33
35
37
39
41
43
45
47
49
51
53
55
57
59
61
63
65
67
69
71
73
75
77
79
81
83
85
87
89
91
93
95
97
99
101
103
105
107
109
111
113
G. Besio, M.A. Losada / Ocean Engineering ] (]]]]) ]]]–]]]8
UNCORRECT
bf ¼1
4
�1þ lnð30h=kscÞ
lnð30d=kscÞ
� �, (17)
where d is the maximum value between three times thethickness of the wave boundary layer and the bedroughness due to the current ksc: d ¼ maxð3dw; kscÞ. Theformer is evaluated as a function of the near bed peak
orbital excursion Ad and the bed roughness due to waves
ksw: dw ¼ 0:072A1:25
d =k0:25sw . Ad and Ud are evaluated
applying linear wave theory. The effective bed roughnessdue to current and due to waves can be split into two
contributions, one related directly to the grain size ðk0sc; k0swÞ
and one related to eventual bedforms height ðk00sc; k00swÞ in the
form ksc ¼ k0sc þ k00sc and ksw ¼ k0sw þ k00sw. Following Van
Rijn (1993), the relationships which are commonly used for
grain roughness are k0sc ¼ k0sw ¼ 3d90 for current and
waves, respectively, while the bedform roughness can beevaluated for ripples and dunes as
Ripples k00sc ¼ 20grDrDr
lr; k00sw ¼ 20grDr
Dr
lr, (18)
Dunes k00sc ¼ 1:1gdDdð1� e�25Dd=ldÞ, (19)
where Dr, Dd, lr and ld are the height and the length ofripples and of dunes, respectively, while gr is a ripplepresence factor ðgr ¼ 1, if there are ripples alone, while gr ¼0:7 if the ripples are superimposed on dunes) and gd is adune form factor ðgd ¼ 0:7Þ which expresses the influenceof the dune form on the roughness height. Note that largerforms than ripples do not have a friction effect on waterwaves because the water waves experience the forms as agradual bottom topography. Finally, the instantaneousfriction coefficient due to current and due to waves havebeen evaluated as suggested by Van Rijn (1993).
4. Discussion of the results
In order to evaluate the sediment patterns around asingular structure and at the interior of a group of them,the bed load sediment transport has been averaged overone wave period, obtaining the net contribution over acycle of wave. In this manner it is possible to identify whichzones of the studied area will be subject to erosion andwhich will be characterized by deposition of sediments. It isnecessary to clarify that because the theory which has beenemployed to describe the hydrodynamics of the problem isfounded on the hypothesis of a flat bottom, it is notpossible to make the system evolve to an equilibriumconfiguration applying the sediment continuity equation.What is obtained, hence, is an instantaneous picture of thetrend of the potential sediment transport, which anywaycan give us reliable predictions about the behavior of thesedimentary trends. In order to discuss the result it isnecessary to remember that it is possible to identify zonesof possible erosion/accretion of the sea bed by analyzingthe gradient of the sediment transport rates: as indicated bythe sediment continuity equation a positive value of the
Please cite this article as: Besio, G., Losada, M.A., Sediment transport pa
j.oceaneng.2008.01.002
ED PROOF
transport rate gradient corresponds to potential erosion,while a negative value of the transport rate gradientcorresponds to a potential deposition of sediments.
4.1. Single structure
First of all the effect of the porous media on thesediment transport pattern around a single structure hasbeen analyzed in order to obtain a picture of possible fieldconditions in order to correctly plan and design theprotection to be applied around the foundation of theaerogenerator–aquaculture cage system. In Fig. 7 theresults concerning the velocity field obtained for the timestep in which the velocity is at a maximum in the feedingcages are presented for different values of the frictionparameter f (left panel f ¼ 5, right panel f ¼ 15Þ. Herein-after, in all the figures, the positive X -axis represents theeast direction, while the positive Y -axis represents thenorth direction. Basically although the friction coefficient f
can assume high values, due to the fact that the thickness ofthe cages walls is very small compared with the incidentwave length, the final effect on the inner wave height andwave velocity will be small. As showed by Darlymple et al.(1991) the magnitude of the typical dimensionless skindepth assumes values of order Oð1Þ which cannot bereached in this particular geometrical configuration.Left panel of Fig. 7 shows how a limited value of the
friction coefficient f (in this case f ¼ 5Þ leads to a verylimited dump in the velocity field at the interior of thefeeding cages. The porous ring which represents thestructure of the cages is almost transparent to the incidentwaves. It should be noted that the predominant direction ofthe velocity is controlled by the tide while the wavesproduce large fluctuations of the velocity field deviating theprincipal direction of the velocity vector.By increasing the friction exerted by the porous media up
to a value of f ¼ 15 it is possible to observe that thevelocities at the interior of the feeding cage can be reducedup to values which are comfortable for the optimumgrowth of the fishes being lower or slightly greater than1m/s (see right panel of Fig. 7). Indeed the porous media ismuch less transparent in comparison with the configura-tion characterized by f ¼ 5 and the deviation of the streamlines around the external structure is more significant.In Fig. 8, the results of the potential sediment transport
around a single structure considering the effect due to thegravity waves and the tidal current are illustrated. Thevalue of the sediment transport rate has been obtainedaveraging over one wave period in order to obtain theaverage net contribution. Results are reported for f ¼ 5and 15 in the left and right panels, respectively, of Fig. 8.As already pointed out when describing the effect of theincrease in friction for the velocity field, it can be observedthat for small values of friction the patterns of sedimenttransport are slightly deviated by the presence of thestructure, suggesting erosion in zones located approxi-mately at around y ¼ 30�, 150�, 210� and 330� (note that
tterns at Trafalgar offshore.... Ocean Engineering (2008), doi:10.1016/

UNCORRECTED PROOF
ARTICLE IN PRESS
OE : 1450
1
3
5
7
9
11
13
15
17
19
21
23
25
27
29
31
33
35
37
39
41
43
45
47
49
51
53
55
57
59
61
63
65
67
69
71
73
75
77
79
81
83
85
87
89
91
93
95
97
99
101
103
105
107
109
111
113
Fig. 7. Field velocity in the proximity of the integrated structure for the following value of characteristic parameters: � ¼ 0:4, Tp ¼ 13, Hm0 ¼ 7:2. Leftpanel: f ¼ 5; Right panel: f ¼ 15.
Fig. 8. Potential sediment transport rate averaged over a wave period in the proximity of the integrated structure. Result obtained with the following
values of characteristic parameters: � ¼ 0:4, Tp ¼ 13 s, Hm0 ¼ 7:2m; left panel f ¼ 5, right panel f ¼ 15.
G. Besio, M.A. Losada / Ocean Engineering ] (]]]]) ]]]–]]] 9
Please cite this article as: Besio, G., Losada, M.A., Sediment transport patterns at Trafalgar offshore.... Ocean Engineering (2008), doi:10.1016/
j.oceaneng.2008.01.002
ARTICLE IN PRESS
OE : 1450
1
3
5
7
9
11
13
15
17
19
21
23
25
27
29
31
33
35
37
39
41
43
45
47
49
51
53
55
57
59
61
63
65
67
69
71
73
75
77
79
81
83
85
87
89
91
93
95
97
99
101
103
105
107
109
111
113
G. Besio, M.A. Losada / Ocean Engineering ] (]]]]) ]]]–]]]10
UNCORRECT
y ¼ 0� corresponds to the positive Y-axis and positiveangles are counter-clockwise). Furthermore, the sedimen-tary activity in the interior of the cages is significant due tothe fact that the inner field velocity is of the same order ofmagnitude as the exterior one. The combined action of tideand waves also indicates a generalized pattern of erosion/deposition from north to south in the back side of thestructure (with respect to the direction of propagation ofwaves, i.e. between X ¼ 0 and 40Þ while in front of theporous ring ð�40oXo0Þ the tendency is inverted (in thefirst case the gradient of bed load sediment transport ispositive moving from north to south until the value ofY ¼ 0 and then is negative from Y ¼ 0 to �40, while in thelatter potential sediment transport decreases from north tosouth until the value of Y ¼ 0 and then tends to increasefrom Y ¼ 0 to �40Þ. Note that the effect of the wavesimproves the stirring effect of mobilizing sediments, whilethe direction of dominant sediment transport is controlledby the tide current.
Considering a greater value of f, the erosion patternsoutside the porous ring appear to be more accentuated, andthey persist in the same position of that one observed forf ¼ 5 ðy ¼ 30�, 150�, 210� and 330�Þ. The erosion patternsexternal to the porous ring present a more symmetricalcharacter either in the front side or in the back side of theporous ring, with respect to the direction of wavepropagation. The net effect of tidal current is to controlthe direction of net potential sediment transport. Inparticular the sediment is moved form north to south andsediment transport patterns of right panel of Fig. 8 suggestthe formation of localized erosion in the proximity of thenorthern part of porous ring ð�15oXo15 and10oYo25Þ and deposition in the southern zoneð�20oXo20 and �40oYo� 20Þ. In this case the areasubject to intense mobilization of sediments extends up to10m from the porous ring. These last results show how it isvery important to provide the structures with a scourprotection in order to limit the possibility of stabilityfailure of the integrated system due to the lowering of thesea bed around the foundation. The same tendency oferosional patterns development has been observed in thelaboratory during the experiments performed in presenceof waves and current interacting with circular largefoundations (Whitehouse et al., 2004; Whitehouse, 2004).
4.2. Group of structure
The second part of this contribution is dedicated to thestudy of the effect of the interaction among waves and agroup of structures on the rates of potential sedimenttransport. Indeed, if a protection from scour is importantfor local erosion around the foundations of the singlestructure, it is of primary importance to investigate how thephenomenon of diffraction and reflection can lead to therise of rhythmic sediment patterns inside a group ofelements. In order to perform this analysis, two differentconfigurations of the aerogenerator’s plane displacement
Please cite this article as: Besio, G., Losada, M.A., Sediment transport pa
j.oceaneng.2008.01.002
ED PROOF
have been considered: one symmetrical with the elementsaligned in the X - and Y -direction (named as configurationA) and one with asymmetrical displacement between theelement lines (named as configuration B). For both of thetwo configurations, an analysis of the potential transportsediment patterns in function of the friction coefficient f ithas been performed. Following the work by Silva et al.(2003), the group of integrated structures (the aerogenera-tor piles and the feeding cages) has been modeled as anunique porous cylindrical structure due to the fact that thephenomenon to be investigated is of the scale ofwavelength of the gravity waves and to have a correctdescription of this phenomenon it is sufficient to reproducethe radiation and reflection of the incident waves caused bythe porous ring.Left panels of Figs. 9 and 10 show the results obtained
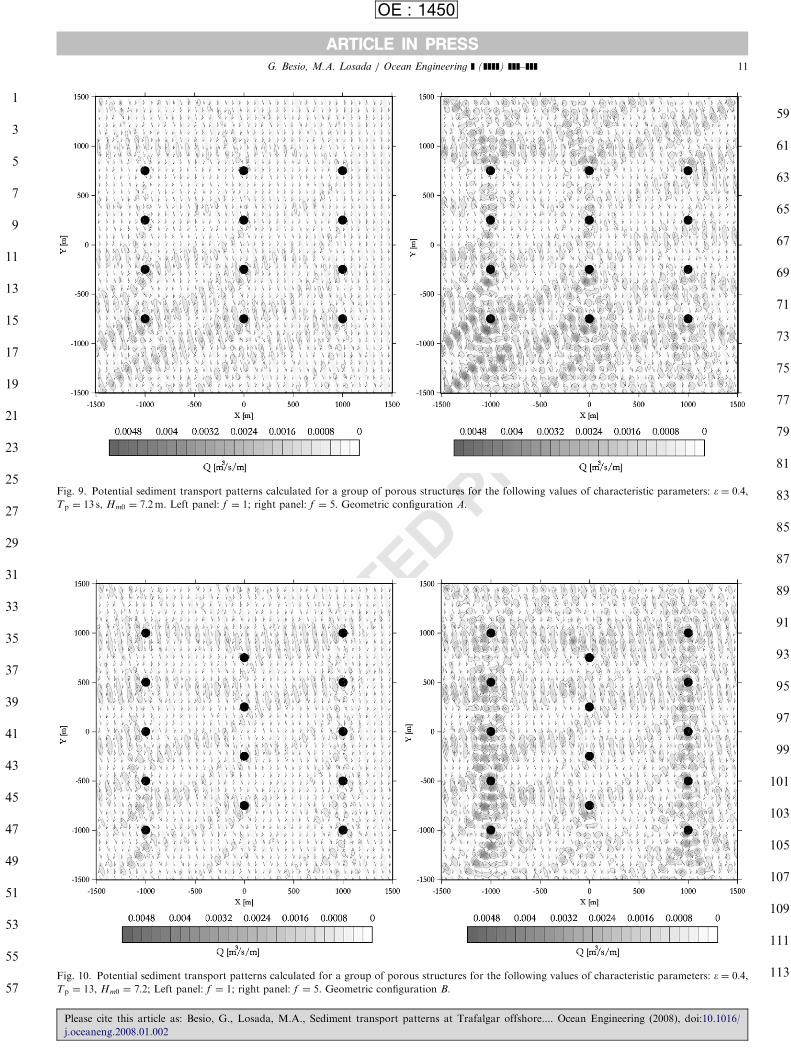
for configuration A and configuration B, respectively,employing a friction factor f equal to one, while rightpanels of the same figures show the results obtained for afriction factor equal to 5. As explained in the Introduction,the antagonistic conditions of reduced velocities in theaquaculture cages and reduced reflection and diffractionaround the structures are difficult to satisfy at the sametime. It is possible to note, in fact, that for small values ofthe friction factor ðf ¼ 1Þ, the influence of the wavereflection and diffraction on the patterns of the potentialsediment transport is quite weak whether close to thestructures or far away from them. Indeed, from the resultsshowed in the left panels of Figs. 9 and 10, it is possible tonotice only slight deviations of the values of potentialsediment transport from the uniform case which should beobserved in the case of absence of the cylindrical structures.The low friction value of the porous media have a verysmall effect on the incident wave giving rise to smalldiffraction and reflection. On the other hand, such a smallfriction on the wave motion leads to high velocities in theinterior of the cages (see Fig. 7, left panel). A largerresistance to flow motion, exerted by the cages on tide andwaves, leads to smaller velocities in the interior of thefeeding facilities (see Fig. 7, right panel) but increases theeffects of diffraction and especially reflection of waves. Inthis case greater values of the potential sediment transportrates either close to the external structures, as illustrated inSection 4.1 or far away from them, enhancing the rise ofperiodical sediment transport patterns (compare left withright panels of Figs. 9 and 10) are found.The alternate patterns of erosion/deposition (refer to the
gradient of the potential sediment transport) whichcharacterize the results obtained in all the cases (even forsmall values of the friction), reveal that the typicalwavelength of these possible rhythmic bedforms is relatedto the wavelength of the incident waves, being of the sameorder of magnitude. This correlation can be explained bythe phenomenon of reflection of waves enhanced by thestructures: zones of more intense sediment transport arelocated in proximity of the nodes and zones of smallerpotential sediment transport should occur where the
tterns at Trafalgar offshore.... Ocean Engineering (2008), doi:10.1016/
UNCORRECTED PROOF
ARTICLE IN PRESS
OE : 1450
1
3
5
7
9
11
13
15
17
19
21
23
25
27
29
31
33
35
37
39
41
43
45
47
49
51
53
55
57
59
61
63
65
67
69
71
73
75
77
79
81
83
85
87
89
91
93
95
97
99
101
103
105
107
109
111
113
Fig. 9. Potential sediment transport patterns calculated for a group of porous structures for the following values of characteristic parameters: � ¼ 0:4,Tp ¼ 13 s, Hm0 ¼ 7:2m. Left panel: f ¼ 1; right panel: f ¼ 5. Geometric configuration A.
Fig. 10. Potential sediment transport patterns calculated for a group of porous structures for the following values of characteristic parameters: � ¼ 0:4,Tp ¼ 13, Hm0 ¼ 7:2; Left panel: f ¼ 1; right panel: f ¼ 5. Geometric configuration B.
G. Besio, M.A. Losada / Ocean Engineering ] (]]]]) ]]]–]]] 11
Please cite this article as: Besio, G., Losada, M.A., Sediment transport patterns at Trafalgar offshore.... Ocean Engineering (2008), doi:10.1016/
j.oceaneng.2008.01.002

O
Q1
Q2
ARTICLE IN PRESS
OE : 1450
1
3
5
7
9
11
13
15
17
19
21
23
25
27
29
31
33
35
37
39
41
43
45
47
49
51
53
55
57
59
61
63
65
67
69
71
73
75
77
79
81
83
85
87
89
91
93
95
97
99
101
103
105
107
109
111
113
G. Besio, M.A. Losada / Ocean Engineering ] (]]]]) ]]]–]]]12
UNCORRECT
antinodes are located. These results suggest that theclimatic agents during severe storms are able to triggerperiodic zones of deposition/erosion of sediment, alsoenhancing the formation of rhythmic bedforms which canbe amplified by the continuous action of tide (Van der Veenet al., 2007) and could reach sizes typical of sand waveswhich represent a serious hazard for the entire installationlaying on the sea bed (Besio et al., 2008). Moreover theeffect of the structures on the sediment transport it ismainly localized close to the most exposed cylinders towave propagation, i.e. in the south-west boundary ofcylinders group. In particular, for configuration A it ispossible to observe a stronger sediment transport in theareas surrounding the bottom left and central cylindersððX ;Y Þ ¼ ð�1000;�750Þ and ðX ;Y Þ ¼ ð0;�750Þ, respec-tively) which are the most exposed cylinders for thisconfiguration. Indeed the central and the right lines of pilesare sheltered by the left line. Furthermore reflection ofscattered waves from different piles trigger sedimenttransport of greater intensity between the most externalpiles, compared with the areas located between the lines inthe northern part of the group of cylinders. In the case ofconfiguration B, as for configuration A, the most exposedpiles are those located in the south-west bound of thegroup. However, the central line results to be less exposedto the incident wave, in comparison with configuration A
due to the sheltering effect provided by the left line of piles.Furthermore the neighboring effect results to be slightlydifferent in the two configurations: in configuration B thescattered wave reflection between piles tends to triggerstronger sediment transport between the piles of the leftline ðX ¼ �1000Þ while in the configuration A this effect ismainly localized in the area comprised between the firsttwo piles of the left line and between the first piles of leftand central lines. Finally, it should be observed that thedifferent windfarm geometrical planar configuration leadschanges in the localization of zones of stronger sedimenttransport, but does not affect considerably its order ofmagnitude.
5. Conclusions
In this work we have analyzed the sediment transportpatterns appearing in the neighborhood of an impermeablecircular structure surrounded by a porous ring due to thepresence of gravity waves and tide. Moreover the sedimenttransport patterns arising in a group of these structuresused to integrate aquaculture with offshore windfarmshave also been studied. Because of the peculiarity of theproject, the conditions to be satisfied in the design andconstruction of the structures are antagonistic: it isnecessary to reduce the velocities in the porous ring interiorto allow an optimal and safe growth of the fish and it isnecessary to reduce the diffraction and reflection of seawaves in order to limit the erosion processes around asingle structure and inside a group of them. The problemhas been analyzed developing a simple model based on the
Please cite this article as: Besio, G., Losada, M.A., Sediment transport pa
j.oceaneng.2008.01.002
linear theory of wave propagation over a flat bottom. Evenif the results have been obtained for the initial stage ofsediment transport process, the model is capable to givereliable indications for the design of scour protectionaround the structure’s foundation and to predict thewideness of the erosional pattern around the externalporous ring. Moreover, the simulations made taking intoaccount the planar disposition of the structures show therise of rhythmic sediment transport patterns in the areainterested by the installation of the Trafalgar offshorewindfarm. Finally, it has been observed that the increase inthe sheltering effect exerted by the aquaculture cages on thewaves and on the tide current causes and provokes strongersediment transport dynamics due to greater diffraction andreflection of the sea gravity waves.
F6. Uncited references
Carter et al. (1973) and Sollitt and Cross (1972).
ED PROAcknowledgments
This research has been supported by INR Eolica underthe contract no. 2296 ‘‘Estudio de dinamica de litoral yasesoramiento tecnico para el proyecto Parque EolicoOffshore Mar de Trafalgar’’ and by MIUR in theframework of ‘‘Azioni Integrate ITALIA-SPAGNA’’.The first author acknowledges contributions and assistancefrom colleagues at the University of Granada, especiallyRafael Molina Sanchez and Alberto Avila Armella.
Appendix A. Solution for a group of porous cylinders
The solution for a group of cylinders is developedassuming that there are NX1 porous vertical cylinders. Acoordinate system ðr; y;ZÞ centered at the origin is used,while ðrj ; yj ;ZjÞ, j ¼ 1; . . . ;N are the polar coordinates ofthe jth cylinder. The velocity potential can be expressed asfor a single pile in an incident component and a scatteredone. The incident plane wave making an angle b with theX -axis can be expressed in local coordinates as
Fi ¼Mjeikrj cosðyj�bÞ ¼Mj
X1m¼�1
JmðkrjÞeimðp=2�yjþbÞ, (A.1)
where Mj ¼ exp½ikðxj cos b� yj sin bÞ� is a phase factorassociated with the jth cylinder. Following Linton andEvans (1990) or Williams and Li (2000) the scattered wavefrom the jth cylinder can be expressed as
Fjs ¼
X1m¼�1
AjmW j
mHmðkrjÞeimyj . (A.2)
Finally, the planar potential in the water region can beexpressed as
tterns at Trafalgar offshore.... Ocean Engineering (2008), doi:10.1016/
E
Q3
ARTICLE IN PRESS
OE : 1450
1
3
5
7
9
11
13
15
17
19
21
23
25
27
29
31
33
35
37
39
41
43
45
47
49
51
53
55
57
59
61
63
65
67
69
71
73
75
77
79
81
83
85
87
89
G. Besio, M.A. Losada / Ocean Engineering ] (]]]]) ]]]–]]] 13
ORRECT
F ¼ Fi þXN
j¼1
Fjs ¼ eikr cosðy�bÞ
þXN
j¼1
X1m¼�1
AjmW j
mHmðkrjÞeimyj , ðA:3Þ
where W jm ¼ J 0nðkajÞ=H 0nðkajÞ and aj is the radius of the jth
cylinder. After some algebra (for more details refer toLinton and Evans, 1990 and Williams and Li, 2000) weobtain the velocity potential viewed from the jth cylinder
Fjðrj ; yjÞ ¼X1
m¼�1
½MjJmðkrjÞeimðp=2�yjþbÞ
þ AjmW j
mHmðkrjÞeimyj �
þX1
l¼�1
XN
q¼1;aj
X1m¼�1
AqmW q
mHm�lðkRqjÞeiðm�lÞaqj
" #
�JlðkrjÞeilyj , ðA:4Þ
where it has been accounted for interactions amongdifferent cylinders through the last term of Eq. (A.4) andRqj and aqj are, respectively, the distance between the jthand the qth cylinders and its angle from the X -axis. Thevelocity potential inside the porous medium can beexpressed as
Fjp ¼ P
j0
X1m¼�1
BjmJmðK
jrjÞeimyj . (A.5)
Given proper boundary conditions at interfaces andapplying the orthogonality to the matching conditions itis possible to find the solution for the unknown parametersAj
m and Bjm (the interested reader is referred to Williams
and Li, 2000 and Silva et al., 2003 for the details).
References
Besio, G., 2005. Analisis de la dinamica sedimentaria local dentro del
campo eolico ‘‘Mar de Trafalgar’’ Informe Tecnico IT II v1, Grupo de
Puertos y Costas, University of Granada, 100pp.
Besio, G., Blondeaux, P., Brocchini, M., Hulscher, S.J.M.H., Idier, D.,
Knaapen, M.A.F., Nemeth, A.A., Roos, P.C., Vittori, G., 2008. The
morphodynamics of tidal sand waves: a model overview. Coastal
Engineering, in press.
Carter, T.J.P., Liu, P.L.F., Mei, C.C., 1973. Mass transport by waves and
offshore sand bedforms. Journal of Waterways, Port, Coastal and
Ocean Engineering 99 (WW2), 165–184.
Please cite this article as: Besio, G., Losada, M.A., Sediment transport pa
j.oceaneng.2008.01.002
D PROOF
Chakrabarti, S.K., 1987. Hydrodynamics of Offshore Structures. Com-
putational Mechanics Publication, Southampton, Boston.
Darlymple, R.A., Losada, M.A., Martin, P.A., 1991. Reflection and
transmission from porous structures under oblique wave attack.
Journal of Fluid Mechanics 224, 625–644.
Darwiche, M.K.M., Williams, A.N., Wang, K.H., 1994. Wave interaction
with semiporous cylindrical breakwater. Journal of Waterways, Port,
Coastal and Ocean Engineering 120 (4), 382–403.
Linton, C., Evans, D., 1990. The interaction of waves with arrays of
vertical circular cylinders. Journal of Fluid Mechanics 215, 549–569.
Lobo, F.J., Hernandez-Molina, F.J., Somoza, L., Rodero, J., Maldonado,
A., Barnolas, A., 2000. Patterns of bottom current flow deduced from
dune asymmetries over the Gulf of Cadiz shelf (southwest Spain).
Marine Geology 164, 91–117.
Losada, M.A., Benedicto, M.I., 2005. Target design levels for maritime
structures. Journal of Waterways, Port, Coastal and Ocean Engineer-
ing 131 (4), 171–180.
MacCamy, R.C., Fuchs, R.A., 1954. Wave forces on piles: a diffraction
theory. Tech Memo no. 69, U.S. Army Corps of Engineers, Beach
Erosion Board, 17pp.
Sarpkaya, T., Isaacson, M., 1981. Mechanics of Wave Forces On Offshore
Structures. Van Nostrand Reinhold, New York.
Silva, R., Govaere, G., Salles, P., 2003. Wave interaction with cylindrical
porous piles. Ocean Engineering 30, 1719–1740.
Sollitt, C.K., Cross, R.H., 1972. Wave transmission through permeable
breakwaters. In: Proceedings of the 13th Coastal Engineering
Conference on ASCE, pp. 1827–1846.
Tanaka, H., Van To, D., 1995. Initial motion of sediment under waves and
waves–current combined motions. Coastal Engineering 25, 153–163.
Taylor, G.I., 1956. Fluid flow in regions bounded by porous surfaces.
Proc. R. Soc. London A 234, 456–475.
Van der Veen, H.H., Hulscher, S.J.M.H., Perez Lapena, B., 2007. Seabed
morphodynamics due to offshore wind farms. In: Proceedings of the
Fifth RCEM Conference, Enschede, The Netherlands, pp. 1061–1066.
Van Rijn, L.C., 1993. Principles of Sediment Transport in Rivers,
Estuaries and Coastal Seas. Aqua Publication, Amsterdam, The
Netherlands.
Wang, K.H., Ren, X., 1994. Wave interaction with a concentric porous
cylinder system. Ocean Engineering 21 (4), 343–360.
Whitehouse, R.J.S., 2004. Marine scour at large foundations. In: Chiew,
Y.M., Lim, S.Y., Cheng, N.S. (Eds.), Proceedings of the Second
International Conference on Scour and Erosion, Singapore, pp.
455–463.
Whitehouse, R.J.S., Dunn, S.L., Alderson, J.S., Vun, P.L., 2004. Testing
of the interaction of coastal windfarm foundations with the seabed:
scour and liquefaction. In: Proceedings of the 29th Coastal Engineer-
ing Conference. ASCE, Lisbon, Portugal, pp. 4215–4227.
Williams, A.N., Li, W., 2000. Water wave interaction with an array of
bottom-mounted surface-piercing porous cylinders. Ocean Engineer-
ing 27, 841–866.
91
C UNtterns at Trafalgar offshore.... Ocean Engineering (2008), doi:10.1016/
Related Documents