Sediment–Laden Ice Measurements and Observations, and Implications for Potential Interactions of Ice and Large Woody Debris with Tidal Turbines in Minas Passage Final Report submitted to the OEER/OETR by Brian G. Sanderson, Anna M. Redden and Jeremy E. Broome Publication No. 109 of the Acadia Centre for Estuarine Research (ACER) Acadia University, Wolfville, NS, Canada 10 February 2012 The report is one of three reports submitted under the overall project “3-D Acoustic Tracking of Fish, Sediment-Laden Ice, and Large Wood Debris in the Minas Passage of the Bay of Fundy” Research Project Duration: October 1, 2009 - December 31, 2011 Grant Recipients (PIs): Dr. Michael Stokesbury and Dr. Anna M. Redden Institution Holding Grant: Acadia University

Welcome message from author
This document is posted to help you gain knowledge. Please leave a comment to let me know what you think about it! Share it to your friends and learn new things together.
Transcript

Sediment–Laden Ice Measurements and Observations, and Implications
for Potential Interactions of Ice and Large Woody Debris with
Tidal Turbines in Minas Passage
Final Report submitted to the OEER/OETR
by
Brian G. Sanderson, Anna M. Redden and Jeremy E. Broome
Publication No. 109 of the Acadia Centre for Estuarine Research (ACER)
Acadia University, Wolfville, NS, Canada
10 February 2012
The report is one of three reports submitted under the overall project “3-D Acoustic Tracking of
Fish, Sediment-Laden Ice, and Large Wood Debris in the Minas Passage of the Bay of Fundy”
Research Project Duration: October 1, 2009 - December 31, 2011
Grant Recipients (PIs): Dr. Michael Stokesbury and Dr. Anna M. Redden
Institution Holding Grant: Acadia University

1
The Ice Phenomena of the Bay of Fundy
Within an hour or so of the flood tide the estuary is seen to be full of masses of floating
ice, mud-stained and some times, but not often, loaded with earth, stones, or pieces of
marsh.
Henry Y. Hind, 1875.
2
Contents
1 Synopsis 3
2 Introduction 8
3 Sediment Density 9
4 Measurements of Ice Density and Porosity 11
4.1 Measurements on 16 February 2011 . . . . . . . . . . . . . . . . . . . . . . . . . . 14
4.1.1 Ice Cake 1, Evangeline Beach, 16 February 2011 . . . . . . . . . . . . . . . 15
4.1.2 Ice Cake 2, Blue Beach, 16 February 2011 . . . . . . . . . . . . . . . . . . 17
4.1.3 Ice Spear, Blue Beach, 16 February 2011 . . . . . . . . . . . . . . . . . . . 19
4.2 Measurements on 18 February 2011 . . . . . . . . . . . . . . . . . . . . . . . . . . 20
4.3 Measurements on 22 February 2011 . . . . . . . . . . . . . . . . . . . . . . . . . . 24
4.4 Measurements on 23 February 2011 . . . . . . . . . . . . . . . . . . . . . . . . . . 29
4.5 Measurements on 7 March 2011 . . . . . . . . . . . . . . . . . . . . . . . . . . . . 33
4.6 Measurements on 8 March 2011 . . . . . . . . . . . . . . . . . . . . . . . . . . . . 37
5 Ice Formation 43
6 Observations Regarding a Negatively Buoyant Ice Cake 46
7 Formation of Near-Neutral Buoyancy Ice Cakes 50
8 Locating Near-Neutral Buoyancy Ice Cakes and Wood Logs 51
9 Vertical Motion of Ice 55
9.1 Density discrepancy, skeletons, and impact force . . . . . . . . . . . . . . . . . . . 57
10 The Danger of Subsurface Ice 59
11 The Danger of Water-Soaked Wood 60
12 A Practical Response to Alarm 64
13 Acknowledgements 65

3
1 Synopsis
1. Floating ice cakes are commonly observed in February and March. Infrequently surface ice-
jams form in Minas Passage, where bathymetry causes convergence as floating material is
advected into the channel on the outgoing tide. Floating ice imposes a recognized constraint
upon the deployment and maintenance of turbines in the tidal stream.
2. Ice cakes are produced in Minas Basin at locations that are relatively shallow, subject to
snow accumulation, and have low salinity due to catchment discharge.
3. Large sediment-laden ice cakes were sectioned and samples cut from layers, top to bottom.
Density and porosity were measured. Porosity of samples was highly variable but tended
to increase going from the base of the ice cake to its top. Most samples were buoyant.
Negatively buoyant samples were sometimes found at the base of the ice cake when frozen
sediment (or gravel) had become attached.
4. Frozen sediment samples had densities of about 1600-1800 kg/m3. Sediment has a soft red
surface-layer that is easy to suspend. The dark sediment beneath is much more stable to
mechanical disturbance.
5. Often, ice cakes are greatly discoloured by sediment loading and yet they were observed
to remain very buoyant. Furthermore, all portions of these ice cakes were both greatly
discoloured and were very buoyant.
6. Sediment stained ice cakes are not a concern for the operations of subsurface turbines de-
ployed in Minas Passage.
7. Sediment staining reduces the albedo of ice cakes and has been observed to promote melting
of stranded ice cakes, even when the air temperature is below freezing.
8. Limited observations (of floating ice) indicate that sediment is washed out of stained ice
cakes when they are eroded by melting.
9. Ice cakes can freeze to bottom substrate (sediment, gravel, or rock) when the receding tide
leaves them stranded for sufficient time in freezing weather. Such ice cakes will:
(a) Remain anchored to the bottom when the tide rises, in which case they are of no concern
for the operations of subsurface turbines deployed in Minas Passage.

4
(b) Become detached from the bottom substrate as they are lifted by buoyancy forces on
the rising tide. Again, this does not cause them to be of any concern for the operations
of subsurface turbines deployed in Minas Passage.
(c) Incorporate a layer (or portion) of frozen bottom sediment as buoyancy forces tear it
from the bottom. This creates an ice cake with overall positive buoyancy but consisting
of large portions that are negatively buoyant — quite different from staining. Samples
cut from such ice cakes were observed to have higher porosity in the top layers. Samples
more dense than seawater were usually only found near the base of the ice cake. Such
ice cakes may:
i. Melt or fracture so as to drop the dense material. Observations of rafted material
are consistent with this happening. The rafted material was too dense to suspend
into the water column.
ii. Melt or fracture so as to become near neutral buoyancy. By calculating the balance
of drag and buoyancy forces we infer that ice cakes can have a range of densities
(around neutral buoyancy) consistent with it being entrained into the water column
by turbulent flow. The density range (Table 10) decreases as the size of the ice cake
increases. Thus the probability of a large ice cake impacting a subsurface turbine
is low. We did not observe any ice cakes that might pose a danger to subsurface
turbines. Most were far too buoyant to be a danger. One mudflat stranded ice
cake was too dense to become suspended into the water column, and barely moved
in a strong tidal current. To the best of our knowledge, there has never been a
reliable observation of large subsurface ice cakes drifting in Minas Basin or Minas
Passage. Such ice cakes are uncommon because their production requires that they
are composed of just the right ratio of constituent parts, one part (sediment-stained
ice) being far too buoyant, the other part (frozen sediment torn from the bottom)
being far too dense.
10. Water-soaked logs and other wood debris has been suggested as a potential danger to subsur-
face turbines in Minas Passage. The abundance of waterlogged wood debris is not expected
to be exceptional because:
(a) Much of the coastal area within Minas Basin has been stripped of trees due to farming

5
and other human activity.
(b) Softwood tree species are common and most can be expected to be strongly buoyant.
Surface floating drifters have been tracked and they tend to be either stranded nearshore
or quickly washed through the Minas Passage and beyond. It is unlikely that a drifting
log would remain within the critical area for the relatively long period required for it
to become waterlogged.
11. The danger posed, to a subsurface turbine, by large subsurface objects (water-soaked wood
debris or sediment-laden ice) will scale as the cube of current speed. The power that a
subsurface turbine can generate will also scale as the cube of current speed. Thus, the risk
of damage scales in proportion to the potential for power production.
12. We advise that:
(a) Subsurface ice cakes and water-soaked wood debris may still pose a risk to any subsur-
face turbines being tested in Minas Passage.
i. Nonetheless, there are many other ways in which turbines might fail during trial
deployments. It would be excessive to forestall turbine deployment on account of
the low risk of collision with subsurface ice or wood debris.
ii. It would be expensive and difficult to monitor cross-sections of Minas Passage in
order to reliably detect and identify subsurface ice cakes and wood debris in a
sufficiently comprehensive manner so as to derive the probability of collisions with
a subsurface turbine.
iii. It would be practicable and desirable to mount monitoring equipment to the turbine
and/or its support structure in order to:
A. Measure current flow near the turbine.
B. Detect and identify objects moving near the turbine. We suggest use of both
acoustic and photographic/video technologies.
C. Detect vibrations of the turbine and its support structure that might be associ-
ated with collisions (or machine-current interaction, or machine performance).
D. Once cable technologies are in place, such data may be transmitted to shore
for near real-time monitoring and analysis.

6
Turbine engineers and environmental scientists should be free to jointly and indi-
vidually study all measurements. Risks can be identified and quantified, machines
improved, and operating procedures developed to mitigate risks of collisions.
(b) The entrainment of slightly buoyant objects into the water column at the turbine test
area should be measured. This is a low-cost activity.
(c) The strength of samples cut from ice cakes should be measured and compared to mea-
surements of porosity and density. This is a low-cost activity. Strength of the ice is
fundamental to understanding damage that may result from collisions.
(d) The lower portion of the intertidal zone (in Minas Basin) be surveyed at low tide. This
is where one is most likely to be able to unambiguously observe ice cakes and wood
debris that have near-neutral buoyancy. This is a low-cost activity.
(e) Near-shore areas in the Minas Passage region, where wood debris are commonly ob-
served to be washed ashore, should be surveyed and densities of wood samples measured.
Determine how many logs move onto and off the shore over a period of time. This is a
low-cost activity.

7
Figure 1: Locations referred to in this study.

8
2 Introduction
The Minas Passage and Minas Basin are sometimes subject to surface ice in winter (Sanders
and Baddour 2006,2007) so in-stream tidal turbines and their support structures must either be
engineered to withstand surface ice flows or submerged beneath those ice flows. Sanders et al (2008)
flag other possible dangers associated with sub-surface sediment-laden ice, waterlogged wood and
large marine vertebrates. The distributions and abundances of sub-surface ice and water-soaked
wood have not been assessed in either Minas Basin or Minas Passage. Large marine vertebrates are
sometimes seen in the area but they are capable of detecting and evading obstructions, abilities
which place them in an entirely different category from sub-surface ice and wood. Tollit et al
(2011) address the detection of marine mammals in the Minas Passage.
In the following work, we use the more general term ‘water-soaked wood’ rather than ‘water-
logged trees’. Other researchers may prefer ‘ice block’ or some other term rather than ‘ice cake’
and we do not disagree. Presently we use ‘ice cake’ in order to conform with Sanders et al (2008).
The following are anecdotes about submerged ice in the Bay of Fundy.
• Mark Taylor, fisherman, reports ‘catching’ ice in a scallop dredge during early spring in the
Minas Passage (Sanders et al 2008). No observation was reported whether this ice floated
or sank upon being emptied from the scallop dredge.
• Professor Graham Daborn (Acadia University) retrieved a small (10 cm long) piece of ice
from a plankton net that was dragged through a portion of the water column beneath the
Port Williams Bridge (Personal Communication).
• Ice cakes on mud flats become frozen to the frozen bottom-sediment when the tide is out.
After the tide rises, buoyancy forces sometimes break ice free from the bottom. In such
circumstances, it is common place to observe (both see and hear) ice bursting to the surface
(Desplanque and Mossman 1998, Personal Observations and Communicated Observations
by others).
Sanders et al (2008) quote measurements of sediment concentrations in ice cakes from two
studies (Atlantic Tidal Power Engineering and Management Committee 1969, and Knight and
Dalrymple 1976). Sanders infers that 3 out of the 10 ice cakes might have been negatively buoyant,
based upon their sediment content. No consideration is given to air bubbles trapped within the
ice and no measurement was made to determine whether these ice cakes did actually float.

9
Ollerhead et al (1999) measured sediment concentrations in 25 ice cakes, each at least a metre
in size. Most ice cakes had little sediment but a small minority contained substantial sediment.
Only one ice cake contained sufficient sediment that it may have been negatively buoyant according
to the criteria used by Sanders et al (2008). Again, there is no evidence that it was negatively
buoyant nor were there any measures of air space contained within the ice. Indeed, the premise
for the measurements made by Ollerhead et al (1999) was that sediment was being rafted onto
the marsh by positively buoyant sediment-laden ice cakes.
Smith et al (2009) attempted to measure density of 83 samples of ice cakes from 34 locations
around Minas Basin during the period March to early April 2009. Their method was to place a
sample in a plastic bag and convey the sample to the laboratory where the volume of the bagged
sample was measured according to water displaced. Each sample was subsequently processed
to determine the amount of water, salinity, dissolved solids, and dry weight of sediment. Such
information is difficult to obtain and is insufficient to determine whether or not freshly cut samples
would float when placed in seawater (without being bagged). The major difficulty is that no proper
account is taken for air spaces, either those that would be infiltrated upon placing the sample in
seawater or those that would remain as isolated bubbles.
Density is the variable of primary interest for determining the risk of ice cakes drifting at
sufficient depth to collide with sub-surface turbines. It is far easier to simply measure ice density
than to measure sediment concentration and all the other quantities required in order to calculate
ice density (if this is even possible). The following work will, therefore, be mostly concerned with
the direct measurement of the density of ice cakes.
3 Sediment Density
What actually gets incorporated into ice is wet sediment that becomes frozen (not dry sediment).
We have therefore measured the density of frozen sediment samples. The samples were collected
with minimal disturbance at the location marked in Figure 2 on 4 December 2010. (The top
1-2 cm of sediment is red and easy to disturb but beneath the sediment is black and firm.) The
samples were frozen and their densities were determined using Archimedes Principle.
• The sediment sample from the unvegetated (lower) site had density 1805± 25 kg/m3.
• The sediment sample from the more elevated, vegetated site had density 1657± 20 kg/m3.

10
The vegetated site had lower sediment density, probably due to the inclusion of saltmarsh
roots and perhaps other less obvious organic material.
Figure 2: Location of sediment sampling sites at Grand Pre is shown with the yellow thumb tack.
One sample was obtained at a level that was largely clear of marsh grass. The other sample was
obtained at approximately 1 m higher elevation where marsh grass was ubiquitous.
The standard paradigm is that a buoyant ice cake settles on sediment during the falling tide.
Freezing weather causes the ice cake to attach to the frozen sediment beneath. Upon the rising
tide, buoyancy forces lift the ice cake, perhaps with some of the frozen sediment attached. The
following calculation shows how the density of the ice cake would be changed.

11
Let the initial density of the ice cake be ρi and its initial volume Vi. This initial volume is the
volume of water that is displaced when the ice cake is submerged (ie, not including porous spaces).
If an additional volume of sediment Vs is attached to the bottom when the ice cake is torn from
the bottom by buoyancy forces then the ice cake will have volume Vi + Vs and new density
ρnew =ρiVi + ρsVs
Vi + Vs
assuming no other mechanisms apply in the interim. Interestingly, the ice cake must have density
less than the seawater in which it is immersed ρnew < ρseawater or the necessary buoyant force could
not exist.
Assuming geometric similarity, large ice cakes will have a greater ratio of volume to surface
area than will small ice cakes. Smaller ice cakes will, therefore, be less able to tear up frozen
bottom sediment when inundated by the tide. Perhaps such intertidal sediment-attached ice cakes
might be ‘caught’ as a scallop dredge is dragged along the bottom? Large ice cakes are more able
to tear large portions of sediment (or rock) from the frozen bottom substrate. Desplanque and
Mossman (1998) report that it is easier for ice cakes to tear free from a gravel substrate than from
clay or silt substrate. Conceivably, it is large ice cakes that might, through subsequent melting
or fracturing, result in smaller chunks of submerged ice that are sufficiently big to be potentially
dangerous to turbines in tidal streams.
4 Measurements of Ice Density and Porosity
The volume of an ice cake is not simple to describe using Euclidean geometry. Ice cakes have
cavities with many scales so there is no clear separation into macroscopic surface that encloses
an ice cake volume and smaller scale cavities that can be separately considered as porous spaces.
The Hausdorff metric geometry (Mandelbrot 1982, Barnsley 1988) may provide a better mathe-
matical foundation but requires making more detailed measurements than are practicable within
the constraints of the present project.
Ice cakes are usually too massive to manually manipulate and directly measure using inexpen-
sive, portable tools. For this reason, ice cakes were sectioned vertically in the field and divided
into layers (from top to bottom). Three to five ice samples were cut from each layer and separately
measured. Ice samples had a typical size of about 30 × 30 × 20 cm3. Figure 3 shows an ice cake
that has been sectioned and later sampled following the obvious layering.

12
Figure 3: An ice cake has been sectioned. The axe is 83.5 cm long. Samples of ice were cut from
each layer in order to measure their density and porosity. This photograph was taken at 14:15 on
18 February 2011 from the beach at Block Wharf Road, Summerville. The background view looks
across the ice rafts on the Avon River towards the Hantsport - Blue Beach coastline.
Immediately we can determine whether or not the ice sample will float by placing it in a
container containing local seawater. The salinity and temperature of the seawater was measured
so that the seawater density ρseawater could be calculated using the UNESCO equation of state
(Gill 1982).
The practical-mass of a floating ice sample can be determined from the volume Vf of water
that it displaces while freely floating. Thus the practical-mass is ρseawaterVf . We shall define the
practical-volume of an ice sample as the volume of seawater Vs that it displaces when it is fully
submerged within a container of seawater for a short time. Thus, the practical-density (henceforth
density) of a floating ice sample is
ρsample = ρseawaterVf
Vs
(1)
In the instances when the ice sample did not float, the ice sample was placed on top of styrofoam

13
so the joint styrofoam-ice volume and density could be measured as above and the ice density
backed out from the known mass and volume of the styrofoam.
The practical-porosity (henceforth porosity) was arrived at by considering the volume of water
Vr removed from the container when the submerged ice cake is removed from the container in a
smooth, deliberate, repeatable motion. Thus, the porosity is
Porosity =Vr
Vs + Vr
(2)
Obviously, if the ice cake is lifted out of the water and held above the container to drain then
the measurement of porosity would be less. For this reason, the same person (Brian Sanderson)
conducted all measurements in as consistent fashion as was biomechanically possible.
Throughout this report we tabulate densites and porosities to 3 or 4 significant figures. Mea-
surement accuracy could only justify 2 significant figures. The additional figures are kept to
preserve the arithmetic consistency between the calculated numbers and the raw data, in order to
facilitate future cross-checking and analyses.
14
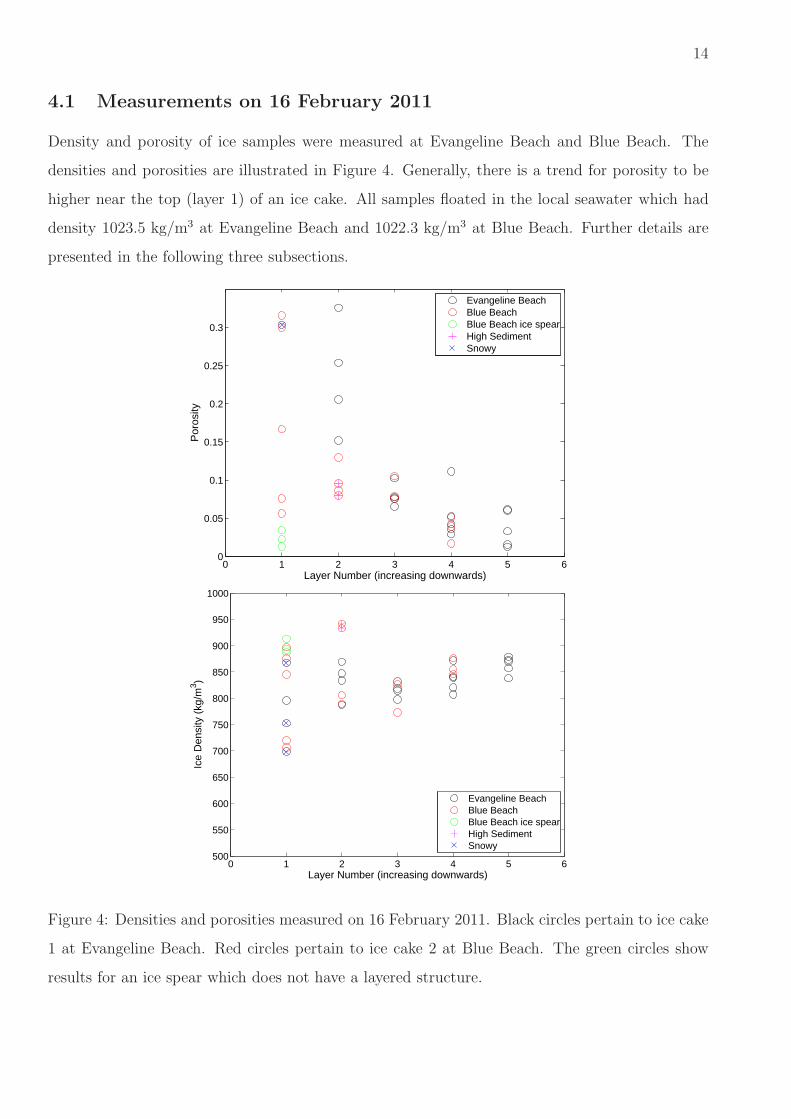
4.1 Measurements on 16 February 2011
Density and porosity of ice samples were measured at Evangeline Beach and Blue Beach. The
densities and porosities are illustrated in Figure 4. Generally, there is a trend for porosity to be
higher near the top (layer 1) of an ice cake. All samples floated in the local seawater which had
density 1023.5 kg/m3 at Evangeline Beach and 1022.3 kg/m3 at Blue Beach. Further details are
presented in the following three subsections.
0 1 2 3 4 5 60
0.05
0.1
0.15
0.2
0.25
0.3
Layer Number (increasing downwards)
Por
osity
Evangeline BeachBlue BeachBlue Beach ice spearHigh SedimentSnowy
0 1 2 3 4 5 6500
550
600
650
700
750
800
850
900
950
1000
Layer Number (increasing downwards)
Ice
Den
sity
(kg
/m3 )
Evangeline BeachBlue BeachBlue Beach ice spearHigh SedimentSnowy
Figure 4: Densities and porosities measured on 16 February 2011. Black circles pertain to ice cake
1 at Evangeline Beach. Red circles pertain to ice cake 2 at Blue Beach. The green circles show
results for an ice spear which does not have a layered structure.

15
4.1.1 Ice Cake 1, Evangeline Beach, 16 February 2011
One ice cake (Figure 5) was sectioned at Evangeline Beach (45.13834◦ N, 64.31901◦ W) and
porosity and density determined for ice samples taken from 5 levels (level 1 being at the top and
level 5 at the base of the ice cake). Results are reported in Table 1.
Figure 5: Photograph of ice cake 1 at Evangeline Beach (45.13834◦ N, 64.31901◦ W) on 16 February
2011. The tide has yet to recede to the base of the ice cake. A preliminary sectioning cut is being
made.

16
Table 1: Density and porosity of samples from layers of an ice cake sectioned at Evangeline Beach
(45.13834◦ N, 64.31901◦ W) on 16 February 2011
Evangeline Beach, ice cake 1 Layer Porosity density (kg/m3)
1 — 796
1 — 867
1 — 753
1 0.3033 698
2 0.1522 787
2 0.2059 834
2 0.3256 847
2 0.2535 869
3 0.1026 819
3 0.0755 815
3 0.0652 797
3 0.0776 832
4 0.0357 872
4 0.0526 807
4 0.0423 820
4 0.1111 841
4 0.0292 839
5 0.0331 857
5 0.0612 879
5 0.0153 872
5 0.0600 838
5 0.0123 870

17
4.1.2 Ice Cake 2, Blue Beach, 16 February 2011
Ice cake 2 (Figure 6) was sectioned at Blue Beach (45.09667◦ N, 64.21221◦ W) and porosity and
density determined for ice samples taken from 4 levels (level 1 being at the top and level 4 at the
base of the ice cake). Results are reported in Table 2.
Figure 6: Photograph of ice cake 2 at Blue Beach (45.09667◦ N, 64.21221◦ W) on 16 February
2011. Preliminary sampling cuts have been made. The length of the axe is 83.5 m. The ice spear
is visible in the upper left corner of the photograph.

18
Table 2: Density and porosity of samples from layers of an ice cake sectioned at Blue Beach
(45.09667◦ N, 64.21221◦ W) on 16 February 2011
Blue Beach, ice cake 2 Layer Porosity density (kg/m3)
1 0.3000 876
1 0.0562 706
1 0.1667 897
1 0.0755 720
1 0.3158 845
2 0.0860 806
2 0.0952 942
2 0.0800 933
2 0.1293 790
3 0.0752 773
3 0.0787 773
3 0.1053 827
4 0.0508 876
4 0.0392 855
4 0.0169 846

19
Table 3: Density and porosity of samples from an ice spear sectioned at Blue Beach (45.09667◦ N,
64.21221◦ W) on 16 February 2011
Blue Beach, ice spear Layer Porosity density (kg/m3)
1 0.0345 913
1 0.0225 893
1 0.0130 888
4.1.3 Ice Spear, Blue Beach, 16 February 2011
An ice spear (Figure 7) was cut into three pieces at Blue Beach (45.09667◦ N, 64.21221◦ W) and
porosity and density determined. Results are reported in Table 3. It is doubtful that this ice
spear formed in the marine environment. It looks like the ice spears that can be seen hanging
from down-pipes at highway overpasses.
Figure 7: Photograph of ice spear at Blue Beach (45.09667◦ N, 64.21221◦ W) on 16 February 2011.
The length of the axe is 83.5 m.

20
4.2 Measurements on 18 February 2011
One ice cake was measured at Summerville, Block Wharf Rd (45.09813◦ N, 64.18271◦ W). Figure
8 shows the ice cake prior to sectioning. Figure 3 shows a different view after the ice cake has
been sectioned. Porosity and density determined for ice samples taken from 5 levels (level 1 being
at the top and level 5 at the base of the ice cake). Results are reported in Table 4 and plotted
with black circles in Figure 10. Porosity is much higher near the top of the ice cake but density
does not vary systematically from top to bottom layers. None of these samples were more dense
than seawater.
We also searched the beach for dense-looking, sediment-laden ice and results from these are
shown in Table 5 and plotted with red circles in Figure 10. None of these samples were more dense
than seawater.
Finally, we found an ice cake that had become frozen into the gravel substrate. We cut a block
out of it (Figure 9) and measured its density to be 1470 km/m3. This gravel-laden ice-block was
taken back to the lab and allowed to melt. The melt-water had salinity 4.3 ppt.
Figure 8: Ice cake 3 at Summerville, Block Wharf Rd, 18 February 2011.

21
Table 4: Density and porosity of samples from ice cake 3 sectioned at Summerville, Block Wharf
Rd (45.09813◦ N, 64.18271◦ W) on 18 February 2011
Summerville, ice cake 3 Layer Porosity density (kg/m3)
1 0.3824 901
1 0.2826 898
2 0.2075 852
2 0.0541 876
2 0.2118 885
2 0.2466 855
3 0.1690 866
3 0.2323 860
3 0.2111 864
4 0.1765 912
4 0.1852 883
5 0.0500 874
5 0.0385 900
5 0.0192 862
Table 5: Density and porosity of dense-looking, sediment-laden ice at Summerville, Block Wharf
Rd (45.09813◦ N, 64.18271◦ W) on 18 February 2011
Summerville, ice with a dense appearance Porosity density (kg/m3)
0.1067 946
0.0784 870
0.0092 871
0.0179 874
0.0317 888

22
Figure 9: Summerville, Block Wharf Rd, 18 February 2011. A dense gravel-laden block of ice.
The axe head has dimension 18 cm.

23
0 1 2 3 4 5 60
0.05
0.1
0.15
0.2
0.25
0.3
0.35
0.4
Layer Number (increasing downwards)
Por
osity
Sectioned IcebergDense Ice Search
0 1 2 3 4 5 6500
550
600
650
700
750
800
850
900
950
1000
Layer Number (increasing downwards)
Ice
Den
sity
(kg
/m3 )
Sectioned IcebergDense Ice Search
Figure 10: Densities and porosities measured on 18 February 2011 at Summerville, Block Wharf
Rd. Black circles show results for ice samples from ice cake 3. Red circles show results for samples
collected in a deliberate effort to find dense pieces of sediment-laden ice.

24
4.3 Measurements on 22 February 2011
By 22 February 2011 most of the ice cakes had drifted from the beach at Summerville, Block
Wharf Rd (Figure 11). The spring tide had a maximum height of 14.69 m on 19 February and was
14.41 m on 21 February, making many floatable ice cakes vulnerable to offshore wind and tide.
Winds were generally from the west-north-west, although they were strong and more northerly
around the time of the 20 February high tide (14:00 hours AST) — so this may have been when
many ice cakes were washed offshore. One expects that some of those ice cakes that have been left
behind are stranded because they are more dense than seawater or too high up the beach to be
floated on the tide. A dense ice cake (number 4) was found and sampled at Summerville, Block
Wharf Rd on 22 February 2011 (Figure 12).
Figure 13 shows density and porosity of samples. The usual sectioning and layer sampling
strategy was not applicable for ice cake 4. Ice cake 4 can be considered to have a broad, thin base
with weakly attached top layers. Samples from the lower part of the base were all more dense
than the local seawater. The weakly attached “cake” on top had density much less than that of
the local seawater. The upper portions of the base were also less dense than the local seawater.
Table 6 records density of the various samples taken from ice cake 4.
The less dense top cake was removed during sampling, leaving behind a base that we expect to
be marginally more dense than the local seawater. The adjacent Avon River had salinity 26.3 ppt
and temperature -0.8 oC which corresponds to a density of 1021.1 kg/m3. Unsurprisingly, ice cake
4 did not move more than a few metres (Figure 25) even though it was subsequently washed by
strong tidal currents because its location is at a coastal prominence where tidal current is strong.
A sample obtained from ice cake 4 on 23 Feb 2011 had density 1122 kg/m3.

25
Table 6: Density and porosity of ice cake 4 at Summerville, Block Wharf Rd (45.09811◦ N,
64.18322◦ W) on 22 February 2011
Ice cake 4 density (kg/m3) Porosity
Bottom of Base 1172
1112
1062
1169
1073
1060
Cake sitting on top of the base 789 0.0638
801 0.1096
817 0.0678
832 0.0000
Top layer of base 873 0.0159
856 0.0312
823 0.0270
891 0.0351
Vertical section of base 964
992
983
Top/bottom vert. sect. of base 941 0.0377
917 0.0167
1074
1174

26
Figure 11: Views from Block Wharf Rd, Summerville. Top: Stranded ice covers the beach on 18
February 2011. Bottom: Tides and wind have removed most ice from the beach by 22 February
2011.

27
Figure 12: Ice cake 4 at Summerville, Block Wharf Rd, on 22 February 2011. Ice cake 4 has a
negatively buoyant base (high sediment) with positively buoyant sediment-laden ice above. The
top levels of ice were weakly attached and they broke off as we worked on them. The base had
equivalent dimensions of about 1.9 m × 2.3 m × 0.3 m. The weakly attached top snowy part had
equivalent dimensions of about 1.6 m × 0.75 m × 0.4 m. Location, GPS: 45.09811◦ N, 64.18322◦
W.

28
0 1 2 3 4 5 60
0.05
0.1
0.15
0.2
0.25
0.3
0.35
0.4
Sample−set
Por
osity
Cake sitting on topTop layer of base
0 1 2 3 4 5 6750
800
850
900
950
1000
1050
1100
1150
1200
1250
1300
Sample−set
Den
sity
(kg
/m3 )
Bottom of BaseCake sitting on topTop layer of baseVertical section of baseTop/bottom vert. sect. of baseseawater
Figure 13: Densities and porosities measured on 22 February 2011 at Summerville, Block Wharf
Rd. We did not measure the porosity of negatively buoyant samples. The horizontal-axis and
symbols indicate samples obtained from different locations within ice cake 4.
29
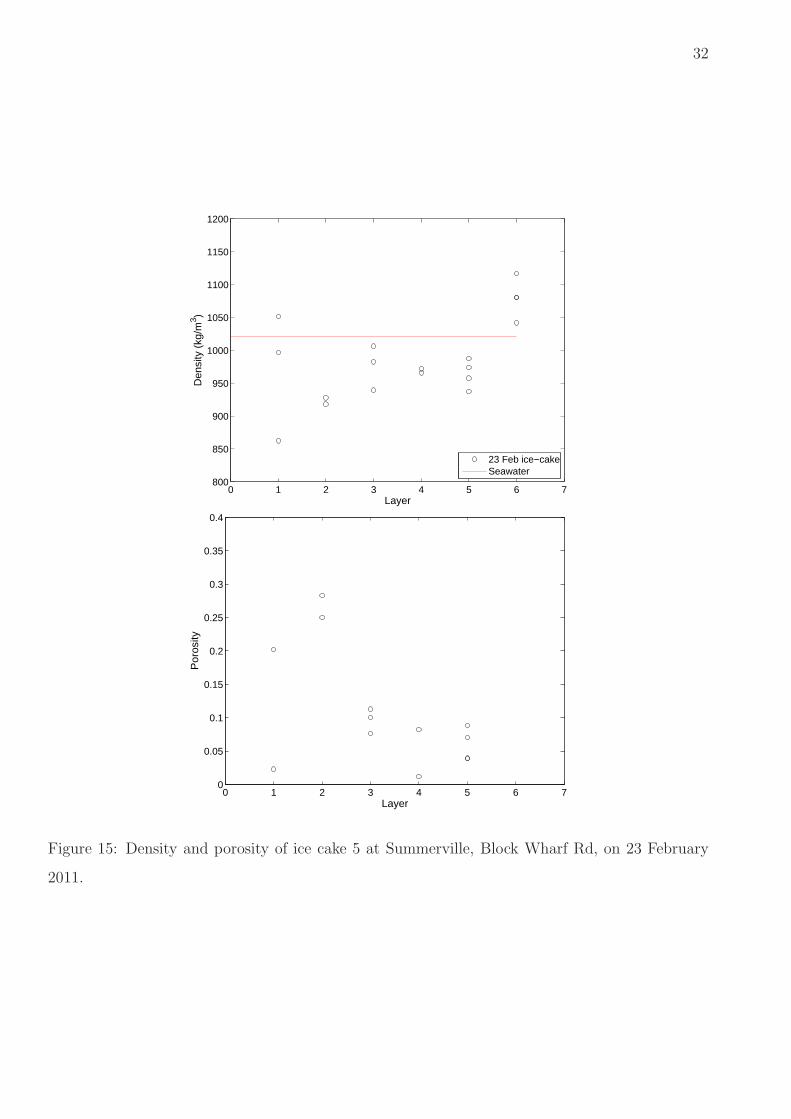
4.4 Measurements on 23 February 2011
Measurements were made at Summerville, Block Wharf Rd, on 23 February 2011. Water temper-
ature was -0.8 oC and salinity was 25.3 ppt in the Avon River. Mean air temperature at Kentville
on 23 February 2011 was -6.4oC (max -2.0oC, min -11.4oC). We recorded air temperatures of -4
and -8oC at the study site. It was sunny and a brisk northerly wind blew alongshore (towards
upriver). Figure 14 shows the sunny and shaded sides of ice cake 5. Air temperature was below
zero but the dark sediment decreases albedo so the ice melts on the sunny side. The meltwater
does not absorb radiation and so it freezes in the cold wind, forming long icicles. Sediment is left
behind as little muddy nodules which wash off ice samples when they are immersed to measure
density and porosity — volumes of muddy nodules are not sufficient to significantly corrupt the
determination of density.
Ice cake 5 is substantially eroded revealing an extremely complex topography when sectioned
(photograph not presently presented) — as would be expected from the appearance of the intact ice
cake (Figure 14). Porosity shows the usual features, being highly variable and generally decreasing
towards the base of the ice cake. Most of the samples were less dense than the local seawater,
except for the bottom-most layer. Ice cake 5 was probably stranded by virtue of being high on
the beach because it is unlikely that its overall buoyancy was negative — although it is clearly
less buoyant than ice cakes 1-3.

30
Table 7: Density and porosity of ice cake 5 at Summerville, Block Wharf Rd (45.09811◦ N,
64.18322◦ W) on 23 February 2011
Ice cake 5 Layer Porosity density (kg/m3)
1 0.2022 862
1 — 1051
1 0.0227 997
2 0.2826 928
2 0.2500 918
3 0.1000 983
3 0.0759 1006
3 0.1127 939
4 0.0820 966
4 0.0118 972
5 0.0882 987
5 0.0392 958
5 0.0390 938
5 0.0704 974
6 — 1042
6 — 1080
6 — 1347
6 — 1080
6 — 1117

31
Figure 14: Ice cake 5 at Summerville, Block Wharf Rd, on 23 February 2011. Top: view of the
shaded side. Bottom: the sunny side. Average air temperature was -6.4 oC at Kentville.
32
0 1 2 3 4 5 6 7800
850
900
950
1000
1050
1100
1150
1200
Layer
Den
sity
(kg
/m3 )
23 Feb ice−cakeSeawater
0 1 2 3 4 5 6 70
0.05
0.1
0.15
0.2
0.25
0.3
0.35
0.4
Layer
Por
osity
Figure 15: Density and porosity of ice cake 5 at Summerville, Block Wharf Rd, on 23 February
2011.

33
4.5 Measurements on 7 March 2011
Ice density and porosity measurements were made on the saltmarsh at Grand Pre, West Long
Island Rd, on 7 March 2011. Two sets of measurements were made. The first was of ice cake 6
(Figure 16). The second was of samples of ice cut from the ice ridge (Figure 17) that typically
crests the top-edge of channels running through marshland. Desplanque and Mossman (1998) use
the term “ice wall” but we consider “ice ridge” to be more descriptive of the sites that we studied.
Figure 2 shows the approximate location of ice cake 6 and the ice ridge using the red symbols A
and B.
We measured an air temperature of 10.4 oC. Water was collected from the channel running
through the saltmarsh. It had salinity 0.5 ppt and temperature 2.6 oC at 1231h (at which time
the water level was about 3 m higher than that shown in Figure 16). High tide was 13.30 m at
1418h so the channel water was collected after about 4 hours of incoming tide. This explains the
low salinity in the channel as being farmland drainage through the aboiteau that had accumulated
in the channel ahead of the incoming tide.
Figure 16: Ice cake 6 at Grand Pre, West Long Island Rd, on 7 March 2011. GPS 45.12154◦ N,
64.33353◦ W. This ice block is located at the upper part of the channel. The water flowing in
the channel is freshwater flowing out of the aboiteau. Salinity 0.5 ppt and temperature 2.6 oC of
channel water were measured at 12:31 pm when the tide had risen about 3 m from the level shown
in this photograph.
Ice cake 6 (Figure 16) is heavily stained by sediment which is typical for ice cakes on saltmarsh

34
Table 8: Density and porosity of ice cake 6 (45.12154◦ N, 64.33353◦ W) and ridge ice (45.12016◦
N, 64.33297◦ N), Grand Pre, West Long Island Rd. Measured on 7 March 2011
Porosity density (kg/m3)
ice cake 6 0 871
0.015 857
0.010 830
0 845
0 842
0.020 830
ridge ice 0.007 827
0 811
0 797
0 831
0 822
at this late stage of the ice season. It takes very little sediment to greatly modify the appearance
and albedo of ice cakes so it is not surprising that all samples from ice cake 6 were quite buoyant
(Figure 18, Table 8). Ollerhead et al (1999) quantify the amount of sediment in ice cakes and
show photographs of the small layer of sediment that a large ice cake leaves behind after it has
melted. We photographed similar features on the saltmarsh at Grand Pre. Sediment obviously
increases the rate of melting by increasing the absorption of solar radiation. Porosity was low for
all samples.
The mechanisms for formation of ice ridges (also called “ice walls”) along the top edge of
channels are outlined by Desplanque and Mossman (1998). Presently it is of interest that this
ridge ice has relatively low density (Figure 18 and Table 8) so buoyancy forces will cause lifting
forces at high tide which act against any attachment to the frozen sediment beneath. However the
ridge ice is observed to remain in place, perhaps because it is topologically molded to the curved
surface of the crest of the channel and this might increase its mechanical stability.

35
Figure 17: Top: Looking at the ice ridge that forms along the top-edge of the channel (down
stream about 150 m from ice cake 6). Bottom: A section cut through the ice ridge. Ice samples
were taken from the sides of this cut to measure density and porosity. GPS: 45.12016◦ N, 64.33297◦
W, date: 7 March 2011.

36
0 1 2 3 4 5 6 7700
750
800
850
900
950
1000
1050
1100
Sample Number
Den
sity
(kg
/m3 )
7 March 2011 ice−cake 67 March 2011 ridge ice
0 1 2 3 4 5 6 7
0
0.05
0.1
0.15
0.2
0.25
Sample Number
Por
osity
7 March 2011 ice−cake 67 March 2011 ridge ice
Figure 18: Density and porosity of ice-cake 6 and ridge ice at Grand Pre saltmarsh, West Long
Island Rd, 7 March 2011.

37
4.6 Measurements on 8 March 2011
Measurements were made at Summerville, Block Wharf Rd on 8 March 2011. Two hours after
low tide we waded into the channel to a depth of about 1 m and measured salinity of 12.6 ppt
and temperature 0.7 oC. Nearer to shore, in water about 10 cm deep, salinity was 11.1 ppt
and temperature was 2.2 oC. Note, temperature is increased as water rises over the sun-warmed
sediment. It was sunny at the time of measurements (about 1100 h) so the solar heating can be
expected to raise surface-sediment temperature significantly above the -1 oC air temperature.
At 1320 hours the tide had risen substantially so further temperature and salinity measurements
were made at three distances from the shoreline that correspond to increasing water depth: 23.4
ppt and 2.4 oC at 0.1 m depth, 23.8 ppt and 1.5 oC at 0.5 m depth, 25.3 ppt and 0.5 oC at 1 m
depth. This seems to confirm that water is heated as it rises over the solar-warmed sediment. The
on-offshore salinity gradient results from horizontal shear in the incoming tidal current and the
along-thalweg salinity gradient. Salinities are higher than at the earlier low tide measurements,
consistent with salinity being less towards the head of the Avon River. Baroclinicity results in
some vertical salinity structure. Salinity and temperature structure influences ice formation and
melting.
There was very little ice on the inter-tidal flat but there were ice cakes high on the beach.
Tides were near spring (high tide on 8 March being 13.08 m). What little ice remained in the
channel was highly eroded and melted (Figure 19). The ice has a skeletal look about it, being
more holes than ice. Notably, sediment seemed to have been washed out, leaving a skeleton of
clear ice. Such skeletal ice cakes might be characterized as more water than ice and obviously
have far less ice mass and strength than solid ice with the same overall length scales. Given the
large amount of surface area for a relatively small volume of ice, it is conceivable (but has not
been observed) that skeletal ice cakes could be prone to being dragged to depth in roiling currents
— even though they are clearly buoyant.
Higher up the beach we found two ice cakes (Figures 20 and 21) that were subsequently
sampled to measure density and porosity. Densities and porosities of samples from these ice cakes
are plotted in Figure 22 and recorded in Table 9. Ice cake 7 was sectioned into 3 layers and all
samples were buoyant except for one sample from the lower layer that contained a great deal of
gravel, frozen into the base from the local substrate. Ice cake 8 was sectioned into 4 layers and
only one negatively buoyant sample was obtained from its base (layer 4). Porosity was highly

38
Figure 19: The skeletal remains of an ice cake, Summerville, Block Wharf Rd, 8 March 2011.
There is no sediment in or on that portion of the ice cake that is washed by waves.
variable but clearly diminishes nearer the base of both ice cakes.

39
Figure 20: This is ice cake 7 which we sampled for density and porosity measurements. Samples
from this ice-block were less dense than the sea water except for one sample from the bottom
layer. The GPS location was 45.09785◦ N, 64.18295◦ W.

40
Figure 21: Top: This is ice cake 8 and its position is 45.09810◦ N, 64.18295◦ W. The axe is 83.5
cm long and the axe head has max dimension 18 cm. Most of this ice block is less dense than
seawater. But it has settled on frozen gravel and sand which has become attached to the bottom
layer. We can see that buoyancy forces seem to have ripped it away from the underlying sand (see
bottom photograph) so that the bottom of the ice-block consists of a layer of frozen gravel and
sand. Bottom: A thin layer of frozen sediment (sand and gravel) has been removed to the left of
ice cake 8. The removed material has dimension and shape consistent with the base of ice cake 8.

41
1 2 3 4 800
850
900
950
1000
1050
1100
1150
1200
Layer
Den
sity
(kg
/m3 )
8 March ice−cake 78 March ice−cake 8Seawater
1 2 3 4 −0.05
0
0.05
0.1
0.15
0.2
0.25
0.3
0.35
0.4
Layer
Por
osity
8 March ice−cake 78 March ice−cake 8
Figure 22: Density and porosity of ice-cakes 7 and 8, at Summerville, Block Wharf Rd, March
2011.

42
Table 9: Density and porosity of ice cakes 7 and 8, at Summerville, Block Wharf Rd on 8 March
2011
Layer Porosity density (kg/m3)
ice cake 7 1 0.2093 862
1 0.1290 860
1 0.0889 813
2 0.1860 866
2 0.0577 845
2 0.0968 830
3 0.0476 909
3 0.0400 926
3 — 1064
ice cake 8 1 0.0588 915
1 0.0820 866
1 0.0141 895
2 0.0206 840
2 0.0267 844
2 0.0351 845
3 0.0147 859
3 0.0541 837
3 0.0357 860
4 0 957
4 0.0217 875
4 — 1142

43
5 Ice Formation
Water with salinity S (ppt) freezes at a temperature T (oC) of approximately
Tfreeze = −0.003− 0.0527S − 0.00004S2 (3)
whereas the temperature at which water achieves maximum density is approximately
Tρmax = 3.95− 0.200S − 0.0011S2 (4)
(Neumann and Pierson 1966). Obviously Tρmax falls more quickly than Tfreeze as salinity S is
increased. At a salinity of 24.7 ppt both temperatures are the same, Tρmax = Tfreeze = −1.33 oC.
• Most of the Minas Basin has salinity more than 24.7 ppt so convective adjustment requires
that the entire water column be cooled to freezing temperature before ice is formed in the wa-
ter column. Nova Scotia winters are not sufficiently severe for this to happen. Envirosphere
(2009a) and Oceans (2009) measured salinities close to 31 ppt in Minas Passage.
• Salinities less than 24.7 ppt might be found nearshore and certainly up-river where there is
freshwater discharge from the catchment. By way of example, on 7 March 2011 we measured
salinities of: 0.5 ppt in the aboiteau channel at West Long Island Rd Grand Pre, and 19-21.8
ppt in Cornwallis River at Port Williams Bridge. About 2 hours after low tide on 8 March
2011 we measured salinities 11.1 ppt in the Avon River at Summerville. At such locations
(and further up-river) ice can form on the surface while the water beneath is warmer and
more dense, as is seen to happen in freshwater lakes.
Ice cake 1 was measured on a cold day with fresh onshore winds forming frazil in the shallow
waters adjacent Evangeline Beach on 16 February 2011, see Figure 5. Kentville meteorological
station recorded an average air temperature of -9.3 oC with a range from -14 to -3 oC. Wind-waves
were quickly attenuated as they propagated into the frazil adjacent the shoreline. Dipping a YSI
probe into the frazil-laden seawater gave a salinity reading of 29.3 ppt and temperature -1.5 oC. A
sieve was used to collect a sample of frazil which had a salinity of 20.5 ppt when it was melted. The
29.3 ppt salinity is higher than 24.7 ppt but given the shallow water and high frazil content it seems
likely that ice formation was in progress. The freezing point temperature of 29.3 ppt seawater is
-1.58 oC which is not significantly different to our measurement, given instrument uncertainty and
the fact that seawater salinity would have been lower prior to the frazil formation. When the tide

44
falls, the onshore winds ensure that a 2-3 inch layer of clean-white frazil is left behind, coating the
beach, rock, and ice cakes (Figure 23). The freshly deposited frazil ice is soft and slushy but can
harden if cold conditions persist.
Figure 23: The tide has fallen on Evangeline Beach and ice cake 1 is shown in a sectioned view
after samples had been cut out of it. Beyond the work area, the beach has been covered with a
fresh white layer of soft frazil-ice, left behind by the combination of falling tide and onshore wind.
Snowfall contributes directly to the mass of frozen material on a saltmarsh (van Proosdij 2005).
We have observed wind-driven currents and waves to cause large accumulations of frazil, snow and
small ice-bits upon saltmarsh during the rising tide and to add to the frozen mass of stranded ice
cakes after the tide has fallen. Such mechanisms will increase the buoyancy of ice cakes.

45
Figure 24: Top: Frazil driven ashore on a high tide. Photograph taken shortly after high tide on
Sunday 22 Jan 2012. The tide was about 0.5 m below its highest level (14.19 m). Bottom: Ice
coated with freshly deposited frazil after the tide falls. Photograph taken after 4 hours of falling
tide. The frazil is soft when the tide first recedes but hardens with continued exposure to the cold
weather. Note, all ice has been washed off the distant saltmarsh. Long Island Point is visible at
the top-right of both photographs.

46
6 Observations Regarding a Negatively Buoyant Ice Cake
Ice cake 4 was first observed on 22 February 2011 (Figure 12). Samples taken from the ice cake
(Table 6) indicated that what remained might be negatively buoyant. We watched the ice cake as
the tide rose over it. The ice cake appeared, briefly, to move with the tide. Tidal currents were
strong at this location and the water was highly turbid with suspended sediment. The incoming
tide also transported many floating ice cakes so it was difficult to be certain whether or not ice cake
4 was moved or remained anchored to the bottom. We returned to the site at several times when
the tide was low and obtained GPS coordinates for ice cake 4. Positions are plotted in Figure 25.
Positions on 23, 24, 25 February are the same to within the accuracy of the GPS. Nevertheless,
between 22 and 23 of February ice cake 4 did move a short distance. The direction of motion was
up-estuary and down the beach slope so this movement is consistent with our brief observation of
apparent motion with the incoming tide on the afternoon of 22 February 2011.
It is notable that the most dense material in an ice cake is typically distributed in a thin bottom
layer as must be expected since large masses of dense material can only be accumulated
by a large ice cake lifting sediment from the bottom (the bottom usually being fairly flat
on the scale of an ice cake). Thus ice cake 4 had a flattened shape, which is probably a common
feature of ice cakes that have lost positive buoyancy. Such flattened shapes are favourable for
hugging a flat seabed in tidal currents.
On 25 February 2011, ice cake 4 was melting (Figure 26) and by 8 March 2011 it was entirely
gone. Radiative heating is mostly responsible for the melting, which is far greater on the side
exposed to the sun. Any ice cakes that might have made it as far as Minas Passage would be
exposed to relatively warm water compared to the Avon River, given measurements at Scots Bay
gave salinity 32 ppt and water temperature of 2.5 oC at 1344 hours on 25 February 2011.
There is some evidence for rafting of clumps of saltmarsh, as shown in Figures 27 and 28.

47
−5 0 5 10 15 20 25−25
−20
−15
−10
−5
0
5
22−Feb−2011
23−Feb−2011
24−Feb−201125−Feb−2011
Displacement East (m)
Dis
plac
emen
t Nor
th (
m)
Position of Ice−Cake 4
Figure 25: Positions of the negatively buoyant ice cake 4.

48
Figure 26: Ice cake 4 was melting on 25 February 2011. Top: the side most exposed to the sun.
Bottom: the side least exposed to the sun.

49
Figure 27: Photograph taken on February 23, 2011 at Cheverie, Shipyard Road. GPS location:
45.16736◦ N, 64.16587◦ W. This large frozen chunk of Spartina and saltmarsh sediment may have
been rafted from a nearby saltmarsh.
Figure 28: A clump of saltmarsh that has been rafted to Summerville, Block Wharf Road, on
25 February 2011. The clump was not present on the previous day. The GPS coordinates are:
45.09792◦ N, 64.18286◦ W.

50
7 Formation of Near-Neutral Buoyancy Ice Cakes
We have measured the distribution of density (and porosity) in ice cakes. The general tendency
is for ice cakes to become more dense and less porous at their base. Sometimes samples from the
bottom layer were negatively buoyant where they had frozen sediment or gravel into their base.
The ice cakes that we sampled cannot be considered to be representative of the total population
of ice cakes. Generally, we were sampling at locations and times that are expected to be biased
towards finding dense ice cakes, or ice cakes that contain some dense material. Ice cake 4 is a
particular example of extreme sample bias. This ice cake was found at a time and place where a
great many floating ice cakes had recently been removed by wind and tide. But for this fact, we
may never have sampled ice cake 4 because it would have been hidden amongst numerous buoyant
ice cakes.
Ice cakes are formed in shallows adjacent the coast. To incorporate dense material, an ice cake
must freeze onto the sediment and then break a portion of the sediment free from the bottom.
The only way this can be done is through buoyancy forces which scale proportional to the volume
of the ice cake. Thus, to incorporate a large amount of sedimentary material, an ice cake must
be both large and have high buoyancy. In order to obtain a near neutrally-buoyant ice cake in
offshore waters, it is necessary for:
1. A much larger buoyant ice cake to form in the intertidal zone,
2. Incorporate a large mass of dense, frozen sedimentary material,
3. Still be buoyant,
4. Be washed offshore,
5. While offshore, it must differentially melt or fracture, so less dense ice is lost preferentially
to negatively buoyant sedimentary ice.
6. Achieve an overall density that falls within a narrow range in order that turbulence can move
it vertically through the water column.
This sequence of events is plausible. Steps 1-3 happened for ice cake 4. But then ice cake 4 achieved
negative buoyancy in shallow water where it remained trapped. (Also, our sampling strategy may
have contributed to ice cake 4 becoming negatively buoyant.) In part, ice cake 4 may have been

51
stable to strong tidal flows because of its low profile, being broad and flat, hugging the bottom.
Given the mechanism for incorporating dense material into ice cakes, one might expect a broad,
flat shape to be common for ice cakes that are both large and not strongly buoyant.
It is difficult to assess a probability for each of steps 1 to 6 above. The preferential melting of
less dense ice, leaving sediment-laden ice, is not evident in Figure 19. Cleaner ice cakes are seldom
seen. The chance of forming an ice cake dangerous to tidal turbines is a multiplicative process,
equal to the product of probabilities of processes in steps 1 to 6. This joint probability is akin
to the “Drake Equation” (Brin 1983) and is similarly confounded by poorly known constituent
probabilities and the lack of a single observation of the sought-after entity.
The frequency distribution of density for ice samples is somewhat binormal (Figure 29), or
at least has a long tail on the high-density end of the distribution. This must be expected if
the material derives from two sources: (1) low-density frozen water, (2) high-density sediment.
Furthermore, the mechanics of incorporating large quantities of bottom-sediment requires that
this should happen as a two-dimensional feature at the base of a large ice cake. As previously
noted, our sampling strategy is biased towards dense ice. Thus, drifting ice (eg Figure 30) is
undersampled and we expect the low-density peak in Figure 29 would be larger (relative to the
number of higher-density samples) for a frequency distribution that was generally representative
of all ice cakes in Minas Basin.
It is notable that the density of ice is substantially less than the density of seawater at Minas
Passage whereas the density of frozen bottom sediment is very much higher. Similarly, samples
from within ice cakes are either much more or much less dense than the seawater at Minas Passage
(Figure 29). Obviously, it is possible for inhomogeneous buoyant ice cakes to drift offshore and
become near neutrally-buoyant by mechanisms indicated in step 5 above. Even if this happens,
near neutral buoyancy is not expected to be commonly achieved and when it is achieved it may
not be for long.
8 Locating Near-Neutral Buoyancy Ice Cakes and Wood
Logs
Floating ice cakes (Figure 30) will move according to the wind and tide. Their motion is also
influenced by baroclinicity. Up-estuary water is lower-salinity which enhances the down-estuary
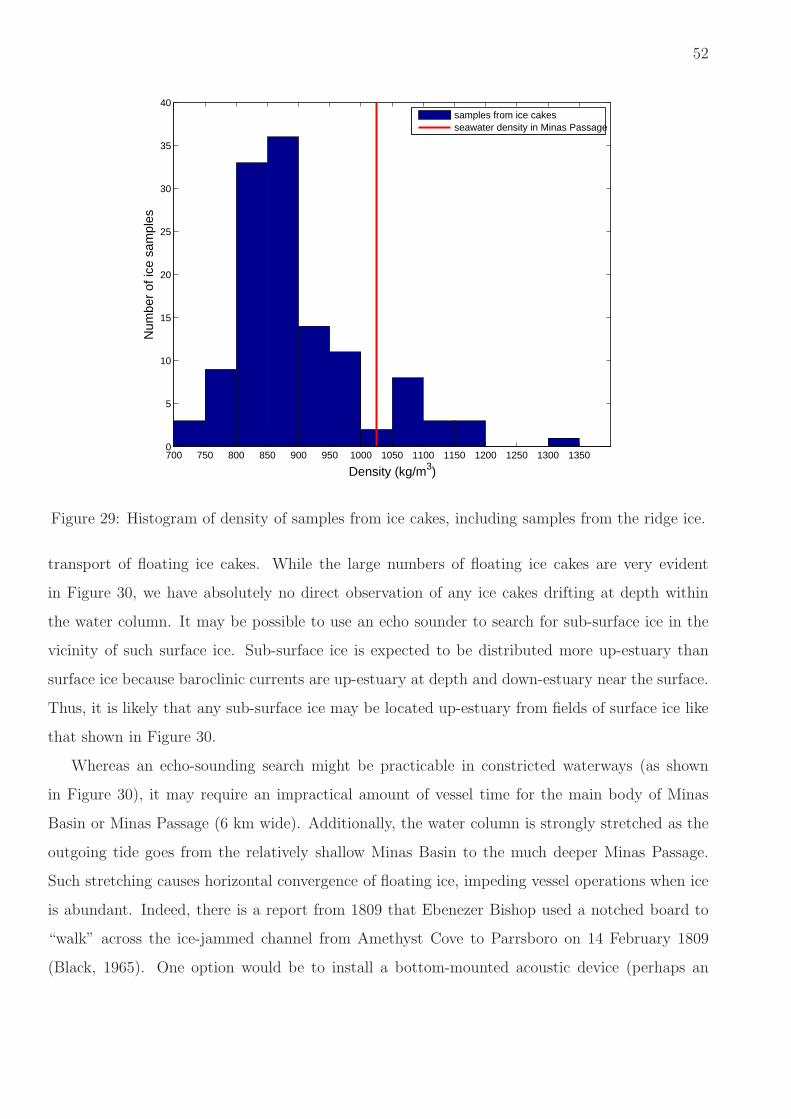
52
700 750 800 850 900 950 1000 1050 1100 1150 1200 1250 1300 13500
5
10
15
20
25
30
35
40
Num
ber
of ic
e sa
mpl
es
Density (kg/m3)
samples from ice cakesseawater density in Minas Passage
Figure 29: Histogram of density of samples from ice cakes, including samples from the ridge ice.
transport of floating ice cakes. While the large numbers of floating ice cakes are very evident
in Figure 30, we have absolutely no direct observation of any ice cakes drifting at depth within
the water column. It may be possible to use an echo sounder to search for sub-surface ice in the
vicinity of such surface ice. Sub-surface ice is expected to be distributed more up-estuary than
surface ice because baroclinic currents are up-estuary at depth and down-estuary near the surface.
Thus, it is likely that any sub-surface ice may be located up-estuary from fields of surface ice like
that shown in Figure 30.
Whereas an echo-sounding search might be practicable in constricted waterways (as shown
in Figure 30), it may require an impractical amount of vessel time for the main body of Minas
Basin or Minas Passage (6 km wide). Additionally, the water column is strongly stretched as the
outgoing tide goes from the relatively shallow Minas Basin to the much deeper Minas Passage.
Such stretching causes horizontal convergence of floating ice, impeding vessel operations when ice
is abundant. Indeed, there is a report from 1809 that Ebenezer Bishop used a notched board to
“walk” across the ice-jammed channel from Amethyst Cove to Parrsboro on 14 February 1809
(Black, 1965). One option would be to install a bottom-mounted acoustic device (perhaps an

53
Figure 30: High-floating ice cakes drifting with the outgoing tide in Avon River. Photograph was
taken 16 February 2011, looking from Blue Beach to across the Avon River.
appropriately configured ADCP) to try to detect mid-water column objects moving in Minas
Passage. (Alternatively, monitory devices could be mounted to platforms used to retain turbines.)
The difficulty would always be knowing what caused the reflected signal: ice, water-soaked wood,
fish, marine mammals, etc. Concurrent image detection would be required.
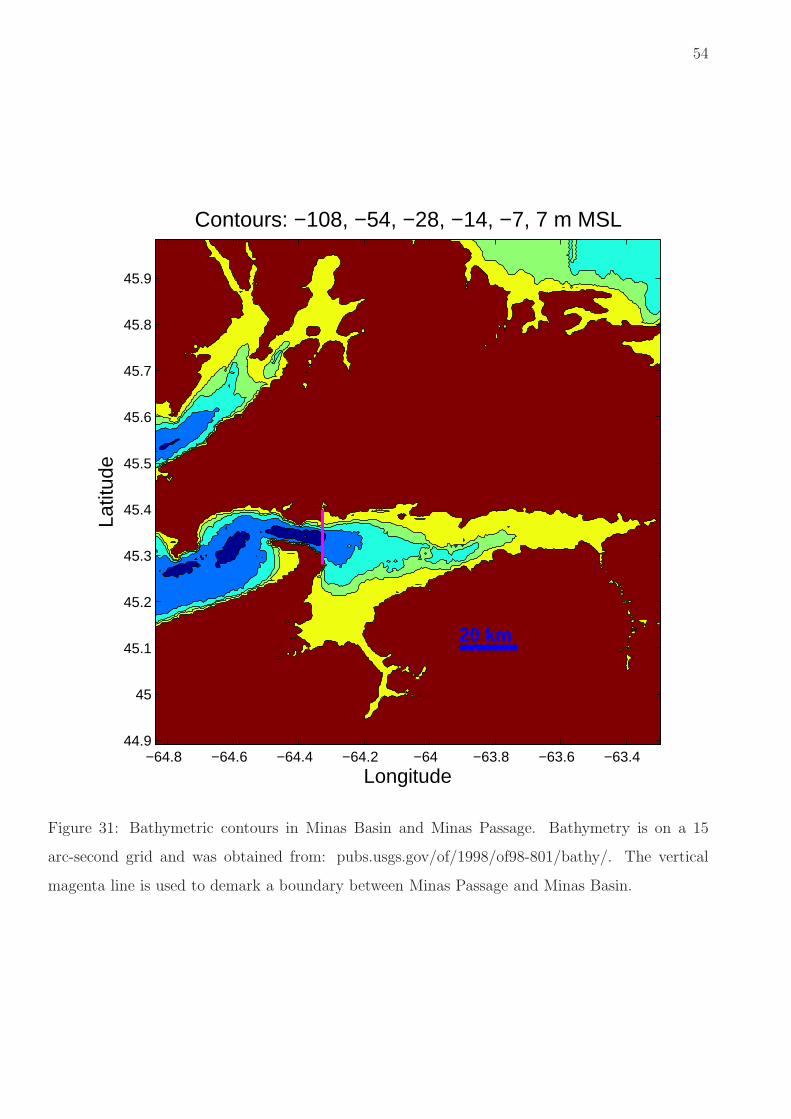
There is another strategy that should reveal both near-neutrally buoyant ice cakes and near
neutrally-buoyant logs — if such things exist in dangerous numbers. Consider the bathymetry of
Minas Basin (Figure 31) where, for a 14 m tide, the area coloured yellow would be inundated at
high tide but exposed at low tide. A simple calculation shows that about 63% of the water that
was in Minas Basin at high tide would have flowed out of the basin by low tide. The outflowing
currents are stronger near the surface than at depth. If there are near neutrally-buoyant ice cakes
(or logs), that sometimes float within the water column, then the place where they are most likely
to be visible is stranded at low tide in the deeper parts of the yellow zone of Minas Basin.
54
Longitude
Latit
ude
Contours: −108, −54, −28, −14, −7, 7 m MSL
20 km
−64.8 −64.6 −64.4 −64.2 −64 −63.8 −63.6 −63.444.9
45
45.1
45.2
45.3
45.4
45.5
45.6
45.7
45.8
45.9
Figure 31: Bathymetric contours in Minas Basin and Minas Passage. Bathymetry is on a 15
arc-second grid and was obtained from: pubs.usgs.gov/of/1998/of98-801/bathy/. The vertical
magenta line is used to demark a boundary between Minas Passage and Minas Basin.

55
9 Vertical Motion of Ice
There are breaking wind-waves in Minas Basin and Minas Passage which might push down small
particles of buoyant ice. Tidal currents can be strong at some places in the Bay of Fundy, especially
Minas Passage. Even in the Cornwallis River, the strongly flowing tide causes big rolling swirls
(boils) where turbulent eddies roll from top to bottom. These boils cause vertical currents that
can drag a particle with them even if that particle has density different from the water in which
it is immersed.
Let’s say that the vertical current speed is w. Denote the cross-sectional area of an ice cake
as A, its volume as V , and denisty ρ. The drag force scales as (1/2)CdρseawaterAw2 whereas the
buoyancy force scales as g(ρseawater − ρ)V . Thus, there will be a critical current speed wc at which
these forces balance1
2CdρseawaterAw
2c = g(ρseawater − ρ)V (5)
A little algebra enables us to calculate the critical vertical current wc that might drag a particle
beneath the surface and deep into the water column.
wc =
√
2g|ρseawater − ρ|V
CdρseawaterA(6)
Notice, this formula applies in both the upwards and downwards sense, depending upon whether
a particle is more dense or less dense than the water in which it is immersed.
Presently, the key thing to realize is that wc is proportional to√
V/A which is simply a length
scale L for the ice. Obviously, all else being equal, small pieces of ice are relatively easy to entrain
into the water column compared to large pieces of ice. Let’s put some typical numbers into the
problem, as they might pertain to the ice in plankton net observation made by Professor Daborn.
Density of 30 ppt Cornwallis River water at -0.5 oC is ρseawater = 1024 kg/m3 (Gill 1981, UNESCO
equation of state). Density of 5 ppt ice containing neither bubbles nor sediment is ρ = 930 kg/m3
(Timco and Frederking, 1996). Let’s give the piece of ice a length scale L = V/A = 0.05 m.
Consider a drag coefficient Cd = 1, and gravity g = 9.81 m/s2.
wc =
√
2× 9.81× |1024− 930| × 0.1
1× 1024= 0.3m/s (7)
In turbulent boundary-layer flows the characteristic velocity of the turbulence is typically 1/30 of
the mean current (Tennekes and Lumley 1972). If the horizontal tidal currents are about 3 m/s
then one might expect turbulence to occasionally have vertical speeds as high as 0.3 m/s. This

56
is consistent with Professor Daborn’s observation. A little bit of ice might be swept down into
the water column by a swirling eddy, but typically it would be found at or near the surface. It
is important to note that larger ice blocks with the same density will require larger currents to
displace them downwards into the water column. A 16 ton ice block might be considered to have
a length scale of 2.5 m in which case wc ≈ 1.5 m/s. The 90 ton denizens of the deep would require
wc ≈ 2 m/s. The other point to note is that strong vertical currents tend to be very localized
in the horizontal dimension. Thus, large buoyant particles are much less likely to be subject to
large downward currents than are the small particles. The take home message is, yes, we
do expect to find small pieces of ice deep in the water column, but larger pieces will
only be found at depth if their buoyancy is very close to that of the water in which
they are immersed.
There is another simple explanation for the observation by Professor Daborn. Ice can freeze
to the bottom during low tide. After the tide has come in, defrosting and buoyancy forces can
release it so that it floats upwards through the water column — perhaps becoming caught in a
plankton net before reaching the surface. On the flood tide it is not uncommon to see a large
buoyant block of ice emerge from the depths and bounce spectacularly at the surface, sometimes
disappearing again as it gets trapped beneath the moving ice pack. Such things should not be
mistaken as evidence for large neutrally-buoyant ice cakes.
It is important to realize that vertical current speed can be strongly influenced by bottom
topography so the above theory requires site-specific calibration. Unfortunately it is difficult to
measure vertical currents and any such measurements are very localized. Fundy Ocean Research
Centre for Energy (FORCE) has commissioned deployment of several ADCPs near turbine berth
sites and, when these data become available, these should enable some limited determination of
vertical velocity.
It is conceptually easy to deploy slightly buoyant drifters in an area of interest and measure the
extent to which they are dragged under. We plan to piggy-back with other projects (acoustic fish
tracking and marine mammal monitoring) to obtain boat charter time in order to make such drifter
measurements. Equipment has been constructed and preliminary methodologies formulated.

57
9.1 Density discrepancy, skeletons, and impact force
The observations by Professor Daborn and equation (5) enable preliminary calculations that con-
tribute to an assessment of the probability that large ice cakes might collide with a submerged
tidal turbine. Oceans (2009) measured tidal currents with values up to ∼ 5 m/s in Minas Passage.
Conservatively setting wc = 5/10 = 0.5 m/s we can estimate the upper limit on density discrep-
ancy from ambient |ρseawater − ρ| that an ice cake with scale L can have and still conceivably be
dragged to depths of a submerged tidal turbine. Table 10 shows that density of large ice cakes
must be very close to seawater density if they are to be found at the depth of submerged tidal
turbines. The main peak in Figure 29 has a density discrepancy from ambient seawater of about
200 kg/m3 which is much greater than the density discrepancies required by a large ice cake in
order for it to be potentially submerged. It seems improbable that just the right amount of much
denser frozen sediment or rock will become attached in order that the ice cake can be dragged
vertically through the water column by currents.
Given that ice cakes can achieve density discrepancies (of Table 10) by melting away excess
buoyancy, and given observations that melting ice cakes have a skeletal structure, the nominal
mass of the ice cake is made up of a good deal of liquid water filling gaps in an ice skeleton. The
structural strength of such an ice cake would seem to be limited.
Submerged ice has very nearly the same density as seawater and so it has almost the same
momentum as the water it displaces. The difference between the force of the flowing water on a
turbine and the force of the ice on a turbine is attributable to the ice being less deformable. Thus,
strength of an ice cake is a critical metric. We expect the strength of an ice cake to be related
to its porosity (which is one reason for measuring porosity). An attempt was made to measure
the strength of ice cakes using a penetrometer. This attempt failed, ice being inhomogeneous and
having a complex texture. Nevertheless, ice cakes are easy to break up with simple hand tools
and we have designs to make measurements pertaining to a ‘practical’ quantification of strength
in future.

58
Table 10: An upper limit on density discrepancy |ρseawater − ρ| of an ice cake with length scale L
if that ice cake is to be dragged into mid water-column by turbulence resulting from 5 m/s tidal
currents.
|ρseawater − ρ| (kg/m3) L (m) nominal ice-cake mass (kg)
130 0.1 1
26 0.5 130
13 1.0 1000
8.7 1.5 3500
6.5 2.0 8200
5.2 2.5 16000
4.3 3.0 28000

59
10 The Danger of Subsurface Ice
We see that ice cake density has to fall within a very narrow range (Table 10) in order to pose a
hazard to sub-surface tidal turbines. Samples from ice cakes are mostly outside of this range, the
majority being of much lower density and a minority being of much higher density. A large ice
cake with near-neutral buoyancy and high structural strength can be achieved but
only through a multiplicative sequence of physical mechanisms (see section 6), some
of which seem unlikely, and jointly far more rare.
Figure 32 is a copy of photograph seven which appears in Sanders et al (2008), along with
commentary: ‘It is not known if the cake pictured in photograph seven was negatively or positively
buoyant. If positively buoyant, it may have joined the surface ice that accumulates in the Head-
waters of the Bay of Fundy [3,4]. If negatively buoyant, it may have rolled along the sea floor out
of view from the surface.’ First, it may be misleading for Sanders et al (2008) to suggest that
floating ice ‘accumulates in the Headwaters’ because estuarine circulation has a general tendency
for near-surface flows to be out of the estuary with deep flows having a tendency for transport
towards the head of the estuary. Second, we have sectioned and measured enough ice cakes to
be reasonably confident that photograph seven shows a positively buoyant ice cake. Given the
incorporated rock (lower right), a negatively buoyant sample might be cut out of this ice cake but
almost all of the rest of this ice cake is made from positively buoyant ice.
Sanders et al (2008) make repeated reference to the discolouration of ice cakes. Photograph
2 of Sanders et al (2008) is described in its caption as: ‘Hundreds of lightly snow-covered, heavily
sediment-stained ice cakes of unknown buoyancy grounded on Nova Scotia’s extensive intertidal
mudflats. Spring tides, storm surges, offshore winds and impacts from adjacent mobile cakes
can combine to return these grounded, sediment-laden ice cakes to the central sub-tidal channel.’
Few of those ice cakes were nearly so stained as the very buoyant ice cake shown in Figure 16.
Measurements confirm that ice cakes can be very discoloured by silt and yet still be very buoyant.
Observations regarding ‘visible amounts of ‘silt” are of little relevance for assessing density.
Sanders et al (2008) report anecdotes of ice rafting ‘derelict motor vehicles’. We have found
patches of saltmarsh that appear to have been rafted by ice. Certainly rafting is a valid mechanism
but this does not mean that submerged tidal turbines are in serious danger of being struck by
neutrally-buoyant ice cakes carrying ‘derelict motor vehicles or farm equipment abandoned on the
Fundy shore’. Our observations are more consistent with ice cakes dropping rafted material, i.e.

60
Figure 32: Photograph seven from Sanders et al (2008).
splitting into two parts, one clearly buoyant the other clearly sinking to the bottom.
Sanders et al (2008) say ‘We suspect that some of the cakes removed from intertidal mudflats
are negatively buoyant.’ We have studied one ice cake which samples indicated to be marginally,
negatively buoyant. It moved only 20 m (Figure 25) even though it was located at a coastal
prominence which concentrated strong tidal currents.
11 The Danger of Water-Soaked Wood
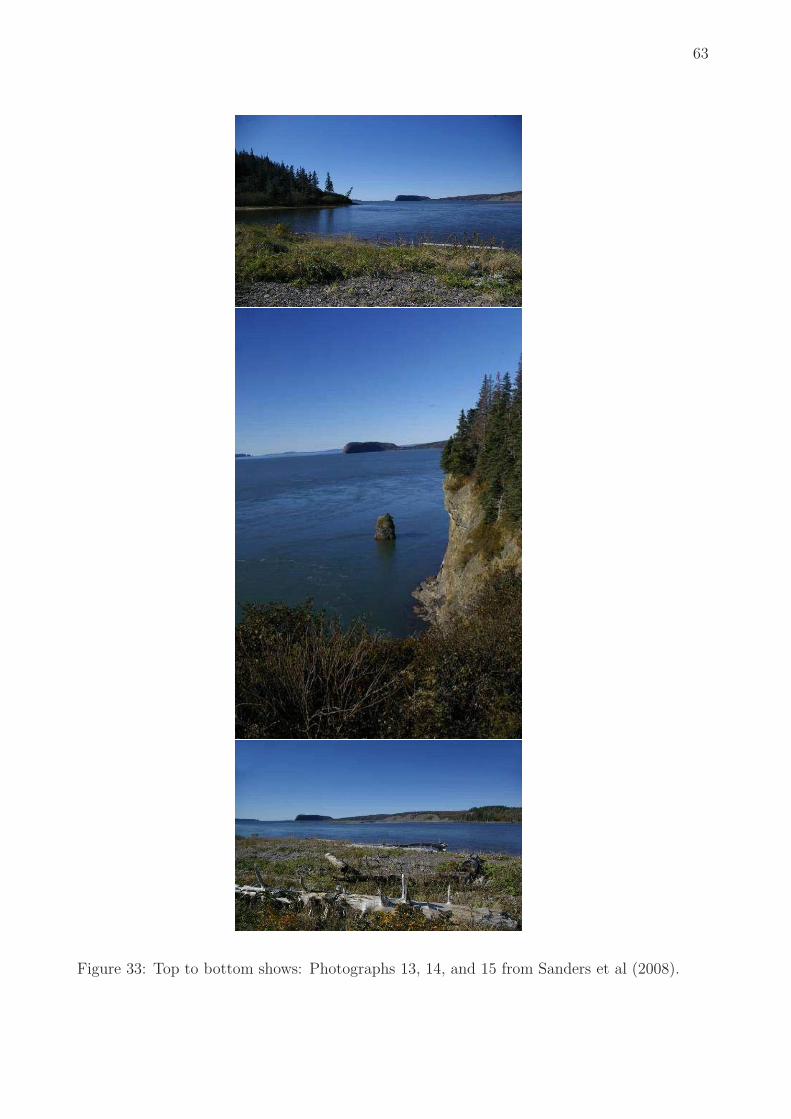
Figure 33 shows Photographs 13, 14 and 15 which have been adapted from Sanders et al (2008).
Photograph 13 shows a portion of the Parrsboro shoreline with a tree tilting towards the ocean,
presumably due to shoreline erosion. Photograph 14 shows forest extending to the edge of cliffs,
high above the shoreline at Cape Split, Minas Passage. Photograph 15 shows very weathered logs
high on the foreshore at some unspecified location, presumably near Parrsboro or at least in the
vicinity of the Minas Passage. Our interpretation of these photographs is different from that of

61
Sanders et al (2008).
Strong tidal currents are well known to cause coastline erosion and trees tilting towards the
sea, such as the one shown in Photograph 13, are not unusual in many parts of the world. Using
Google Earth, one can scan the coastline of Minas Basin and Minas Passage and see that human
activity has stripped trees from much of the coastal land. On the one hand, this might increase
rates of erosion but on the other hand it diminishes the number of trees that might fall into the
waterway because of coastal erosion.
Trees at the edge a high cliff (eg Cape Split) might eventually fall into the ocean. But the rate
at which trees fall into the ocean is controlled by the rate at which the cliff face is moved inland. A
great volume of rock and sediment must be eroded for such a high cliff to recede a short distance.
It does not follow from Photograph 14 that this region represents a major source of trees falling
into the tide.
Photographs 13, 14, and 15 indicate a predominance of softwood species. Many softwood
species are relatively buoyant although they might become waterlogged if they remain in a wet
environment for sufficient time. Smith et al (2009) fixed satellite transmitters to 9 ice cakes at
various nearshore sites within Minas Basin. Trajectories of some of the transmitters were clearly
influenced by grounding and some were lost before they could get out of rivers and into open
waters. Three of the transmitters traversed Minas Passage and were retrieved west of Scots Bay.
Surface currents tend to be out of the estuary. One expects surface floating objects, like logs and
other wooden debris, to either be washed high onto the shoreline (eg Photograph 15) or to be
quickly discharged from the area before becoming waterlogged.
Other soarces of water-soaked wood include fish weirs and derelict wharves. The wood in these
structures gets soaked, usually intermitently, over long periods.
There will be a narrow range of densities for which water-soaked wood can be suspended in
the water column by turbulent currents. Table 10 can be considered to apply to water-soaked
wood if the length scale L is re-interpreted to allow for the fact that trees are typically long and
thin with a small cross-section. We have not made measurements of the frequency distribution for
density of logs found in and around Minas. But there is no evidence of sinking wood in the 2500+
photographs and extensive video footage in the Minas Passage in and near the FORCE leased area
(Envirosphere 2009b). This goes some distance towards suggesting a low risk that water-soaked
wood have a density near the dangerous range.
It seems unlikely that ‘waterlogged trees’ are more common in the Minas Passage than else-

62
where. It is an inevitable fact, however, that the number of particles crossing a particular area in
a given time will scale in proportion to the tidal current. Similarly, impact forces increase as the
square of current. The expectation of impact damage will scale as the cube of current (product
of impact force with the distance traversed by particles drifting in the tide). The power that a
turbine can generate will scale as the cube of current speed. Potential for power production scales
proportional to the potential damage by unwanted collisions, for a given concentration of ice or
woody debris drifting in the mid-water column. Waterlogged trees are not a disproportionate
concern in Minas Passage.
63
Figure 33: Top to bottom shows: Photographs 13, 14, and 15 from Sanders et al (2008).

64
12 A Practical Response to Alarm
Sanders (2011) writes: ‘While I am aware of no proof (either of the existence or non-existence)
of sub-surface ice in the tidal energy-rich waters of Nova Scotia’s Minas Passage, I feel there
is adequate circumstantial evidence [Sanders et al., 2008] of its formation to require immediate
direct monitoring for its presence.’ Specifically, Sanders recommends ‘that transects of sea-floor
to water’s surface monitoring of sub-surface traffic be carried out at both the eastern and west-
ern boundaries of Minas Passage for at least a full calendar year.’ In order to be useful, such
monitoring would require identification of the sub-surface objects, not an easy task.
To the best of our knowledge, there is no direct observation of ice cakes that are both: (1)
near neutrally buoyant and (2) drifting near the middle of the Minas Passage water column.
Lack of observation is not a proof on nonexistence unless one has made an infallible search.
Several methods of searching have been outlined above but none of them can be considered to be
comprehensive. But is a comprehensive search required?
Presently, the objective of the FORCE tidal turbine testing facility is to test in-stream tidal
turbine technologies and to develop operational protocols. Fundamentally, this is challenging.
There are a great many ways in which turbines could fail aside from the risk of collision with large
inanimate objects like sub-surface ice or water-soaked wood.
Our measurements, and inference from known physics, leave us better informed as to the risks
that ice cakes might present to sub-surface tidal turbines. Qualitatively, we think that near-
neutral buoyancy ice cakes pose a small part of the total risk to tidal turbines installed for the
purpose of testing. Testing of sub-surface tidal turbines in Minas Passage should be mindful of
the ice-collision risk (albeit low) but not delayed or obviated by that risk.
Sanders (2011) proposes monitoring that would be expensive and still would not directly mea-
sure the frequency of collisions, or near collisions, with in-stream tidal turbines. It would be more
cost-effective to equip turbines and their platforms with devices to measure currents and detect
and identify any inanimate objects or marine life that passes nearby or collides with the installa-
tion. Other targeted methods to quantify sub-surface hazards may be worth funding, given some
prospect that they might be cost-effective.

65
13 Acknowledgements
Colin Buhariwalla kindly assisted Brian Sanderson in the field on 7-8 March 2011. We thank Bruce
MacDonald (Minas Basin Pulp and Power Co.) and Richard Clark for early discussions. Facilities
were provided by Acadia University at the Acadia Centre for Estuarine Research. Funding was
provided by the Nova Scotia Offshore Energy and Environmental Research Association.
References
[1] Atlantic Tidal Power Engineering and Management Committee, 1969. Report to Atlantic Tidal
Power Programming Board on Feasibility of Tidal Power Development in the Bay of Fundy,
by the Atlantic Tidal Power Engineering and Management Committee, 1969, , Appendix 3
Ice and Sediment, Halifax, Nova Scotia, Canada, Appendix 3, Ice and Sediment, pp. 1-17.
[2] Barnsley, M.F. 1988. Fractals Everywhere. Academic Press Inc. London.
[3] Black, M. 1965. Ebenezer Bishop. Kings County Vignettes, Volume 3. Published by Kings
County Historical Society of Nova Scotia.
[4] Brin, G.D. 1983. The “Great Silence”: the controversy concerning extraterrestrial intelligent
life. Quarterly Journal of the Royal Astronomical Society, 24, 283-309.
[5] Desplanque, C., and D.J. Mossman 1998. A review of ice and tide observations in the Bay of
Fundy. Atlantic Geology, 34, 195-209.
[6] Cox, G. F. N. and W. F. Weeks. 1983. Equations for determining the gas and brine volumes
of sea-ice samples. Journal of Glaciology, 29, 306-316.
[7] Envirosphere 2009a. Oceanographic survey, oceanographic measurements — salinity, temper-
ature & turbidity, Minas Passage Study Site August 2008-March 2009. A report submitted
to: Minas Basin Pulp and Power Co. Ltd. By Envirosphere Consultants Limited, Windsor,
Nova Scotia.
[8] Envirosphere 2009b. Seabed Biological Communities in the Minas Passage. A report submitted
to: Minas Basin Pulp and Power Co. Ltd. By Envirosphere Consultants Limited, Windsor,
Nova Scotia.

66
[9] Gill, A.E. 1982. Atmosphere-Ocean Dynamics. Academic Press.
[10] Hind, H.Y. 1875. The ice phenomena and the tides of the Bay of Fundy, considered in connec-
tion with the construction of Baie Verte Canal. The Canadian Monthly and National Review.
Vol. 8, No. 3, 189-203.
[11] Knight, R.J. and Dalrymple, R.W. Winter 1976. Conditions in a Macrotidal Environment,
Cobequid Bay, Nova Scotia in Rev.Geogr.Montr.,1976, vol.xxx, no. 1-2, pp.65-85.
[12] Knight, R.J. 1977. Sediments, Bedforms and Hydraulics in a Macrotidal Environment, Cobe-
quid Bay, (Bay of Fundy) Nova Scotia. A thesis submitted to the School of Graduate Studies
in partial fulfillment of the requirement for the degree of Doctor of Philosophy, McMaster
University, January, 1977, 693 pages.
[13] Loewe, F. 1961. On melting of fresh-water ice in sea-water. Journal of Glaciology, 3, 1051-
1052.
[14] Mandelbrot, B.B. 1982. The Fractal Geometry of Nature. W.H. Freeman and Company, New
York.
[15] Neumann, G. and W. J. Pierson 1966. Principles of Physical Oceanography. Prentice-Hall
Inc. Englewood Cliffs, N.J.
[16] Oceans, 2009. Current in Minas Basin May 1, 2008 March 29, 2009 Submitted To: Minas
Basin Pulp and Power. By: Oceans Ltd.
[17] Ollerhead, J., D. van Proosdij, and R. G. D. Davidson-Arnott. 1999. Ice as a mechanism for
contributing sediments to the surface of a macro-tidal saltmarsh, Bay of Fundy. Canadian
Coastal Conference 1999.
[18] Sanders, R. E., C. Byers, E. Baddour, 2008. Tidal Power and Migratory Sub-Surface Ice in
the Bay of Fundy, Canada. A Report to The Fundy Tidal Energy Technical Advisory Group
and The Ocean Energy Environmental Research Association. April 2008.
[19] Sanders, R. E., E. Baddour, 2006. Documenting Ice in the Bay of Fundy, Canada. Contractor
Report CR-2006-01. National Research Council of Canada, Institute for Ocean Technology.

67
[20] Sanders, R. E., E. Baddour, 2007. Tidal Power and Ocean Ice in the Bay of Fundy, Canada
1968-2007. The Proceedings of the 2007 International Conference On Offshore Mechanics and
Arctic Engineering, Jun 10-15, 2007, San Diego, USA.
[21] Sanders, R. 2011. Marine ice and other issues during harvest of tidal electricity from Nova
Scotia’s Minas Passage in 2011. The Journal of Ocean Technology, 6(1), 34-56.
[22] Smith, K., J. Woods, A. Long, W.B. MacDonald, G. Fader, R. Bishop and S. Melrose. 2009.
The characterization and tracking of sediment-laden ice in Minas Basin, Nova Scotia. In:
Redden, A.M., J.A. Percy, P.G. Wells, and S.J. Rolston (Eds). 2009. Resource Development
and its Implications in the Bay of Fundy and Gulf of Maine. Proceedings of the t8th BoFEP
Bay of Fundy Science Workshop, Acadia University, Wolfville, Nova Scotia, 26-29th May
2009. Bay of Fundy Ecosystem Partnership Technical Report No. 4. Bay of Fundy Ecosystem
Partnership, Wolfville, NS. 392 p.
[23] Tennekes, H. and J.L. Lumley, 1972. A First Course in Turbulence. The MIT Press, Cam-
bridge.
[24] Timco, G. W. and R. M. W. Frederking. 1996. A review of sea ice density. Cold Regions
Science and Technology, 24, 1-6.
[25] Tollit, D., J. Wood, J. Broome, and A. Redden, 2011. Detection of Marine Mammals and
Effects Monitoring at the NSPI (OpenHydro) Turbine Site in the Minas Passage during 2010.
A report for: Fundy Ocean Research Centre for Energy (FORCE). Publication No. 101 of
the Acadia Centre for Estuarine Research (ACER) Acadia University, Wolfville, NS, Canada
(Also SMRU Ltd document NA0410BOF).
[26] van Proosdij, D. 2005. Monitoring Seasonal Changes in Surface Elevation and Intertidal
Environments near Windsor Causeway. Report prepared for the Nova Scotia Department of
Transportation. 22 pp. Search for “Proosdij” at http://gov.ns.ca/tran/publications/
Related Documents


![Satellite Observations of Polar Ice Fields [and Discussion]](https://static.cupdf.com/doc/110x72/61fc8a738d33c02b785e5ede/satellite-observations-of-polar-ice-fields-and-discussion.jpg)


