Characterizing the Post-Dredge Surface: Comparison of In-Situ (Pre-dredge) and Post-Dredge Grab Samples at Three Sites in the Willamette River, Portland Harbor, Oregon Michelle Hollis Port of Portland & James McMillan Portland District Laura Inouye, Washington Department of Ecology Jonathan Freedman, US Environmental Protection Agency, Region 10

Welcome message from author
This document is posted to help you gain knowledge. Please leave a comment to let me know what you think about it! Share it to your friends and learn new things together.
Transcript

Characterizing the Post-Dredge Surface: Comparison of In-Situ (Pre-dredge) and
Post-Dredge Grab Samples at Three Sites in the Willamette River, Portland Harbor, Oregon
Michelle Hollis Port of Portland
&
James McMillan Portland District
Laura Inouye, Washington Department of Ecology Jonathan Freedman, US Environmental Protection Agency, Region 10

Purpose Compare concentrations from pre-dredge core
samples and post-dredge grab samples at 3 sites Examine contributions to post-dredge surface
(PDS) chemistry based on site conditions Use findings to inform risk-based regulatory
decision making for dredging projects in the Portland Harbor
PDS
Dredge Prism
PDS
BEFORE AFTER

Problem Core samples measure the pre-dredge condition The in-situ core sample characterizing the PDS is often used in
regulatory decision making BUT, in-situ PDS samples don’t account for:
Post-dredge Surface (PDS)
fallback & physical mixing from dredging
deposition
side slope sloughing
mixing from marine traffic
current mixing
Fallback from the dredge Physical mixing during dredging Side-slope sloughing Current mixing within the dredge area
Deposition during/after dredging Mixing caused by natural processes and
marine traffic
(After ERDC, 2008 The Four Rs of Environmental Dredging: Resuspension, Release, Residual, and Risk [TR-08-4])

Regulatory Review of Post-Dredge Surface Regulatory agencies want to know what’s being
dredged AND what will be exposed after dredging Regulatory concerns regarding:
Endangered species State water quality parameters (sediment-water
column interface) State anti-degradation policies
(i.e., exposed surface >> dredge prism = BAD) State and federal permits may require:
Monitoring after dredging Physical isolation of the PDS
Placement of a clean sand cover Natural infill (of cleaner sediment)

Methods Compared concentrations of chemicals of concern:
PDS
BEFORE DREDGING
Dredge Prism
In-situ core sample (pre-dredge estimate)
AFTER DREDGING
PDS
Post-dredge grab samples (of the actual post-dredge surface)

Methods (cont.) Examined factors contributing to PDS chemistry:
Post-dredge Surface (PDS)
fallback & physical mixing from dredging
deposition
side slope sloughing
mixing from marine traffic
current mixing
(After ERDC, 2008 The Four Rs of Environmental Dredging: Resuspension, Release, Residual, and Risk [TR-08-4])

Port
land
Har
bor S
ites (
3)
PORTLAND, OR
VANCOUVER, WA PoP T5
Willamette FNC – PO Bar
N
2 4 6 0 miles
PoP T2

Willamette R. FNC Post Office Bar
PORTLAND, OR
VANCOUVER, WA
N
2 4 6 0 miles
DETAILS • Location: Willamette River, RM 2.1-2.4 • Volume: 52,300 cy • Depth: Dredged to -40 feet CRD
(plus 2 feet advanced maintenance) • Disposal: Upland, West Hayden Is.
Placement Site • Project completed in Sept./Oct.
2011

73.2
80.4 83.8 -36
-32
-45
-33
-34
-43
-42
-41
-40
-39
-38
-37
-44
-35
Dept
h (fe
et C
RD) VC-05
VC-01 VC-03
Downstream End (RM 2.1) Upstream End (RM 2.3)
ZINC: WILLAMETTE R., POST OFFICE BAR – 2009 pre-dredge
In-situ dredge prism core sample (PRE-dredge)
68.9
In-situ PDS core sample (PRE-dredge)
89 87.1
77.2 Dredge Prism
Zinc SL = 130 ppm
VC-02 VC-04
VC-06
Zinc Concentrations
Sample
PRE-DREDGE (Core) Zinc
Screening Level
Dredge Prism
Sloughing Material
In-Situ PDS
Average 84.4 79.1 150.3 130 ppm

73.2
80.4 83.8 -36
-32
-45
-33
-34
-43
-42
-41
-40
-39
-38
-37
-44
-35
Dept
h (fe
et C
RD) VC-05
VC-01 VC-03
BC-01 BC-02 BC-03 BC-04 BC-05
Downstream End (RM 2.1) Upstream End (RM 2.3)
ZINC: WILLAMETTE R., POST OFFICE BAR – 2009 pre-dredge; 2011 post-dredge
In-situ dredge prism core sample (PRE-dredge)
68.9
91 103 96 97 112
In-situ PDS core sample (PRE-dredge)
Surface grab sample (POST-dredge)
89 87.1
77.2 Dredge Prism
Zinc SL = 130 ppm
VC-02 VC-04
VC-06
Zinc Concentrations
Sample
PRE-DREDGE (Core) POST-DREDGE
(Grab) Zinc Screening
Level Dredge Prism
Sloughing Material
In-Situ PDS
Oct. 2011
Average 84.4 79.1 150.3 99.8 130 ppm

73.2
80.4 83.8 -36
-32
-45
-33
-34
-43
-42
-41
-40
-39
-38
-37
-44
-35
Dept
h (fe
et C
RD) VC-05
VC-01 VC-03
BC-01 BC-02 BC-03 BC-04 BC-05
Downstream End (RM 2.1) Upstream End (RM 2.3)
ZINC: WILLAMETTE R., POST OFFICE BAR – 2009 pre-dredge; 2011 & 2012 post-dredge
In-situ dredge prism core sample (PRE-dredge)
68.9
91 103 96 97 112
In-situ PDS core sample (PRE-dredge)
Surface grab sample (POST-dredge)
88 75 98
86 88
89 87.1
77.2 Dredge Prism
Zinc Concentrations
Sample
PRE-DREDGE (Core) POST-DREDGE
(Grab) Zinc Screening
Level Dredge Prism
Sloughing Material
In-Situ PDS
Oct. 2011
Apr. 2012
Average 84.4 79.1 150.3 99.8 87 130 ppm
Zinc SL = 130 ppm
VC-02 VC-04
VC-06
<7.2
<12 <12 -36
-32
-45
-33
-34
-43
-42
-41
-40
-39
-38
-37
-44
-35
Dept
h (fe
et C
RD) VC-05
VC-01 VC-03
Downstream End (RM 2.1) Upstream End (RM 2.3)
PCBs: WILLAMETTE R., POST OFFICE BAR – 2009 pre-dredge
In-situ dredge prism core sample (PRE-dredge)
<7.4
In-situ PDS core sample (PRE-dredge)
<12 56
<12 Dredge Prism
PCBs SL = 60 ppb
VC-02 VC-04
VC-06
PCBs Concentrations
Sample
PRE-DREDGE (Core) PCB
Screening Level
Dredge Prism
Sloughing Material
In-Situ PDS
Average 22.7 ND 78.9 60 ppb
<7.2
<12 <12 -36
-32
-45
-33
-34
-43
-42
-41
-40
-39
-38
-37
-44
-35
Dept
h (fe
et C
RD) VC-05
VC-01 VC-03
BC-01 BC-02 BC-03 BC-04 BC-05
Downstream End (RM 2.1) Upstream End (RM 2.3)
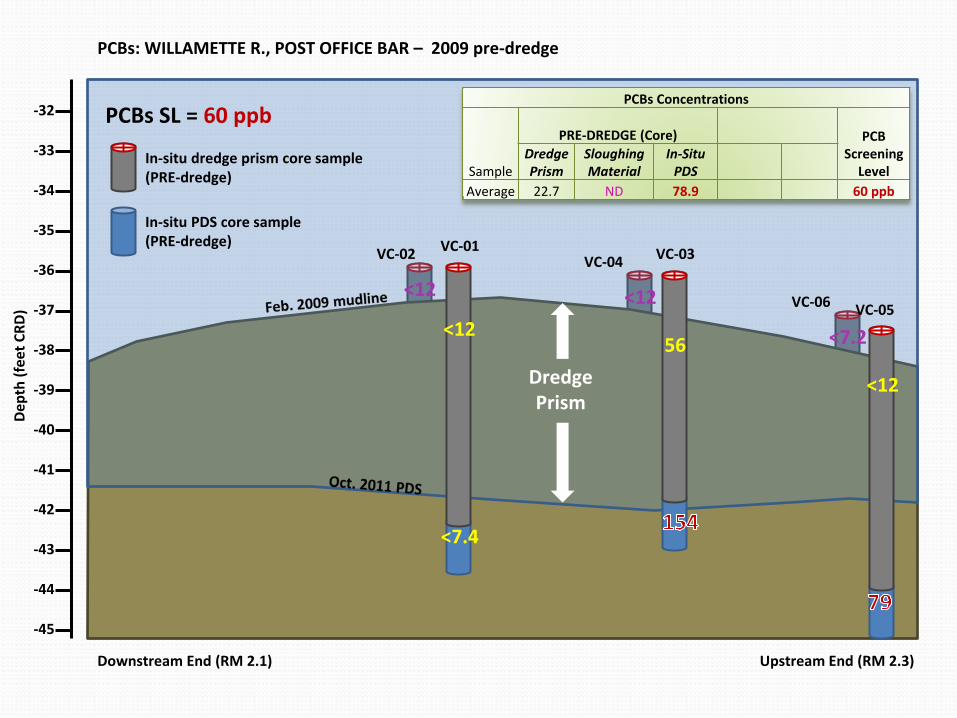
PCBs: WILLAMETTE R., POST OFFICE BAR – 2009 pre-dredge; 2011 post-dredge
In-situ dredge prism core sample (PRE-dredge)
<7.4
16 <9.8 <9.6 <10 39
In-situ PDS core sample (PRE-dredge)
Surface grab sample (POST-dredge)
<12 56
<12 Dredge Prism
PCBs SL = 60 ppb
VC-02 VC-04
VC-06
PCBs Concentrations
Sample
PRE-DREDGE (Core) POST-DREDGE
(Grab) PCB Screening
Level Dredge Prism
Sloughing Material
In-Situ PDS Oct. 2011
Average 22.7 ND 78.9 13.9 60 ppb
<7.2
<12 <12 -36
-32
-45
-33
-34
-43
-42
-41
-40
-39
-38
-37
-44
-35
Dept
h (fe
et C
RD) VC-05
VC-01 VC-03
BC-01 BC-02 BC-03 BC-04 BC-05
Downstream End (RM 2.1) Upstream End (RM 2.3)
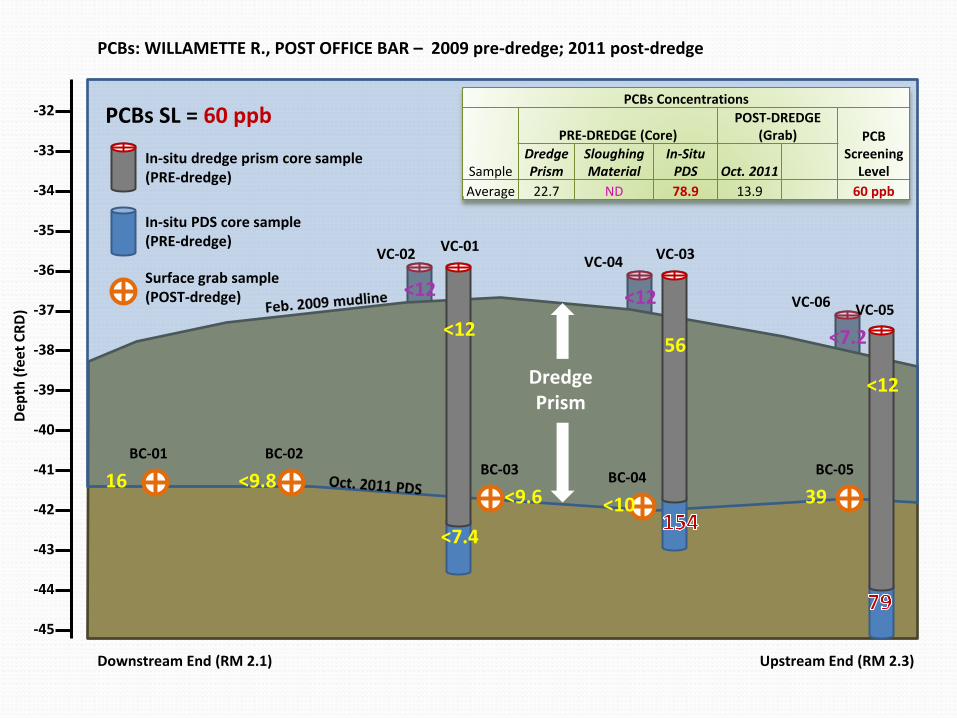
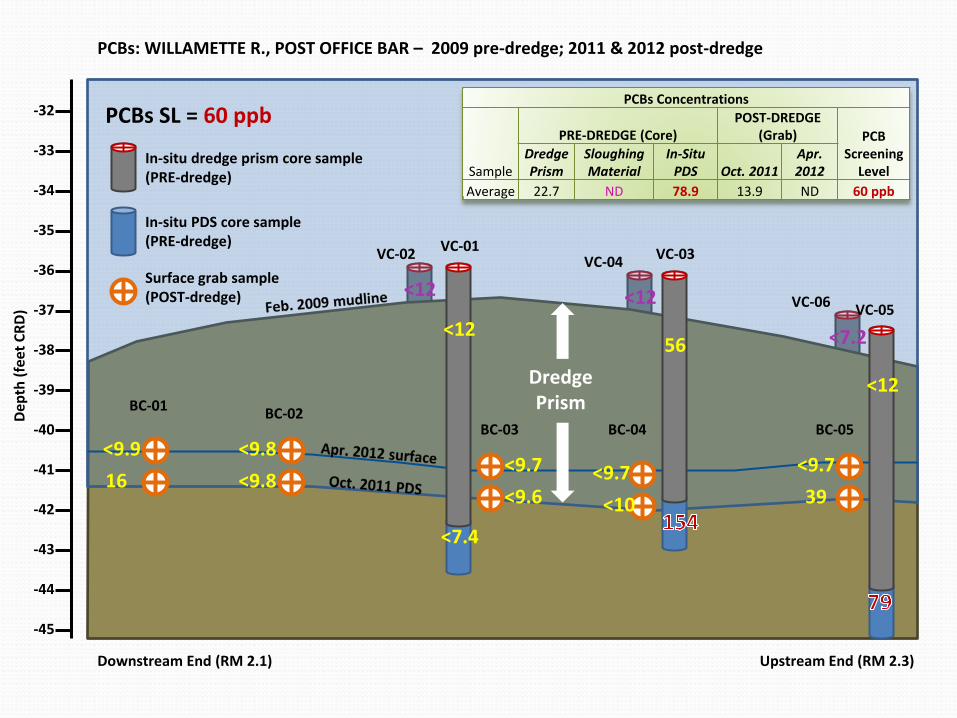
PCBs: WILLAMETTE R., POST OFFICE BAR – 2009 pre-dredge; 2011 & 2012 post-dredge
In-situ dredge prism core sample (PRE-dredge)
<7.4
16 <9.8 <9.6 <10 39
In-situ PDS core sample (PRE-dredge)
Surface grab sample (POST-dredge)
<9.7 <9.9 <9.8
<9.7 <9.7
<12 56
<12 Dredge Prism
PCBs Concentrations
Sample
PRE-DREDGE (Core) POST-DREDGE
(Grab) PCB Screening
Level Dredge Prism
Sloughing Material
In-Situ PDS Oct. 2011
Apr. 2012
Average 22.7 ND 78.9 13.9 ND 60 ppb
PCBs SL = 60 ppb
VC-02 VC-04
VC-06

Port of Portland Terminal 2, Berth 205 DETAILS • Location: Willamette River, RM 10 • Volume: ~10,000 cy (project total 12,424 cy) • Depth: Dredged to -37 feet CRD
(plus 2 feet overdepth allowance) • Disposal: Upland, West Hayden Island
Placement Site • Project completed in July/Aug. 2008
PORTLAND, OR
VANCOUVER, WA
N
2 4 6 0 miles

DEHP: PORT OF PORTLAND, TERMINAL 2 – January 2008 pre-dredge
-29
-38
-26
-27
-36
-35
-34
-33
-32
-31
-30
-37
-28
Dept
h (fe
et C
RD)
Downstream Upstream
Aug. 2008 PDS
DEHP SL = 220 ppb
-39
C-5
130
C-3
In-situ dredge prism core sample (PRE-dredge)
In-situ PDS core sample (PRE-dredge)
Dredge Prism
Jan. 2008 mudline
100 (dredge prism
composite)
DEHP Concentrations
Sample
PRE-DREDGE (Core)
DEHP Screening Level
Dredge Prism
In-Situ PDS
Result 100 240 220 ppb

DEHP: PORT OF PORTLAND, TERMINAL 2 – January 2008 pre-dredge; August 2008 post-dredge
-29
-38
-26
-27
-36
-35
-34
-33
-32
-31
-30
-37
-28
Dept
h (fe
et C
RD)
Downstream Upstream
Aug. 2008 PDS
DEHP SL = 220 ppb
-39
100
C-5
130
C-3
DEHP Concentrations
Sample
PRE-DREDGE (Core)
POST-DREDGE (Grab)
DEHP Screening Level
Dredge Prism
In-Situ PDS August 2008
Result 100 240 100 220 ppb
In-situ dredge prism core sample (PRE-dredge)
In-situ PDS core sample (PRE-dredge)
Surface grab sample (POST-dredge)
Dredge Prism
Jan. 2008 mudline
100 (dredge prism
composite)
PORTLAND, OR
VANCOUVER, WA
N
2 4 6 0 miles
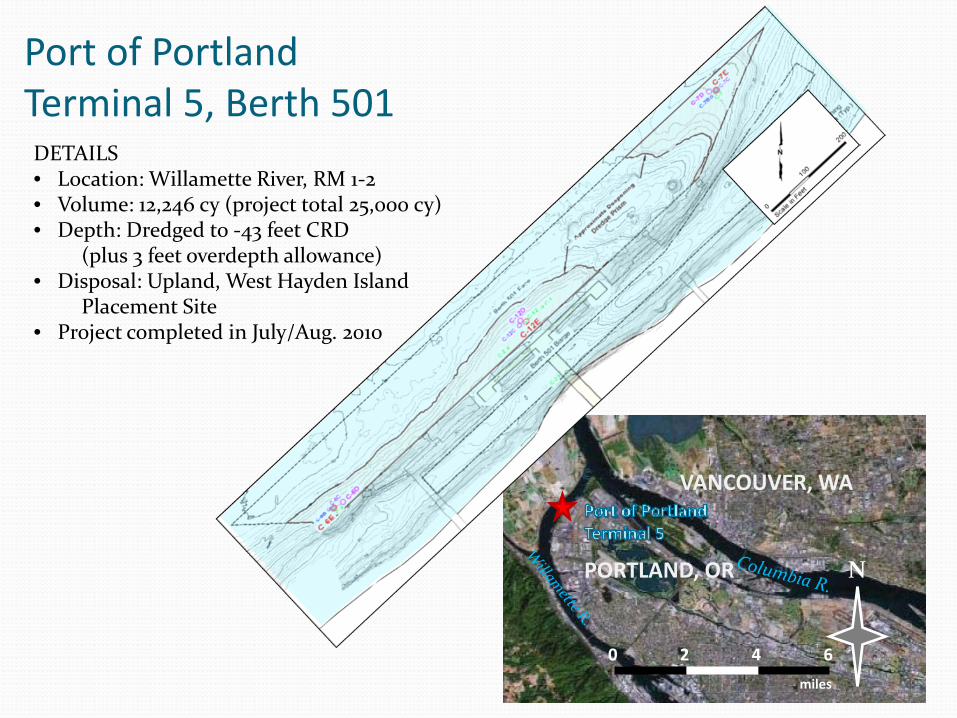
Port of Portland Terminal 5, Berth 501 DETAILS • Location: Willamette River, RM 1-2 • Volume: 12,246 cy (project total 25,000 cy) • Depth: Dredged to -43 feet CRD
(plus 3 feet overdepth allowance) • Disposal: Upland, West Hayden Island
Placement Site • Project completed in July/Aug. 2010
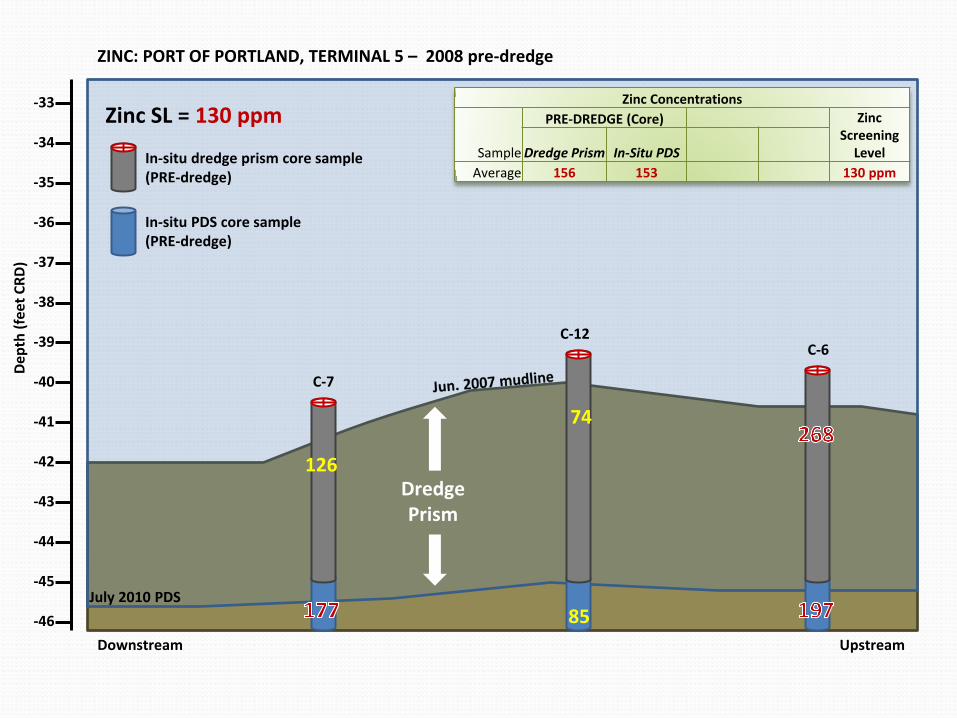
ZINC: PORT OF PORTLAND, TERMINAL 5 – 2008 pre-dredge
-36
-45
-33
-34
-43
-42
-41
-40
-39
-38
-37
-44
-35
Dept
h (fe
et C
RD)
Downstream Upstream
July 2010 PDS
Zinc SL = 130 ppm
-46
C-7
126
C-12
74
85
C-6
In-situ dredge prism core sample (PRE-dredge)
In-situ PDS core sample (PRE-dredge)
Dredge Prism
Zinc Concentrations
Sample
PRE-DREDGE (Core) Zinc Screening
Level Dredge Prism In-Situ PDS Average 156 153 130 ppm

ZINC: PORT OF PORTLAND, TERMINAL 5 – 2008 pre-dredge; 2010 post-dredge
-36
-45
-33
-34
-43
-42
-41
-40
-39
-38
-37
-44
-35
Dept
h (fe
et C
RD)
Downstream Upstream
July 2010 PDS
Zinc SL = 130 ppm
-46
98 116
C-7
126
C-12
74
85
C-6
C-7 C-12 C-6
In-situ dredge prism core sample (PRE-dredge)
In-situ PDS core sample (PRE-dredge)
Surface grab sample (POST-dredge)
Dredge Prism
Zinc Concentrations
Sample
PRE-DREDGE (Core) POST-DREDGE (Grab) Zinc Screening
Level Dredge Prism In-Situ PDS July 2010 Average 156 153 127 130 ppm
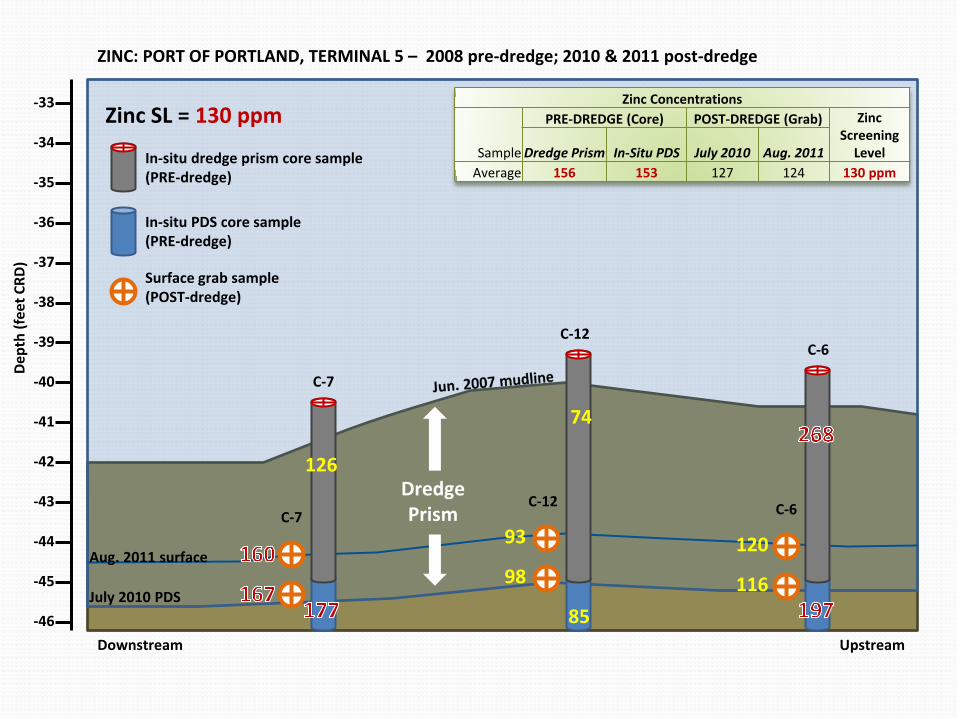
ZINC: PORT OF PORTLAND, TERMINAL 5 – 2008 pre-dredge; 2010 & 2011 post-dredge
-36
-45
-33
-34
-43
-42
-41
-40
-39
-38
-37
-44
-35
Dept
h (fe
et C
RD)
Downstream Upstream
July 2010 PDS
Zinc SL = 130 ppm
-46
98 116 Aug. 2011 surface
C-7
126
C-12
74
85
C-6
C-7 C-12
93 C-6
120
Zinc Concentrations
Sample
PRE-DREDGE (Core) POST-DREDGE (Grab) Zinc Screening
Level Dredge Prism In-Situ PDS July 2010 Aug. 2011 Average 156 153 127 124 130 ppm
In-situ dredge prism core sample (PRE-dredge)
In-situ PDS core sample (PRE-dredge)
Surface grab sample (POST-dredge)
Dredge Prism

PCBs: PORT OF PORTLAND, TERMINAL 5 – 2008 pre-dredge
-36
-45
-33
-34
-43
-42
-41
-40
-39
-38
-37
-44
-35
Dept
h (fe
et C
RD)
Downstream Upstream
July 2010 surface
PCBs SL = 60 ppb
-46
C-7
34
47 38
C-6 C-12
<3.9
22
In-situ dredge prism core sample (PRE-dredge)
In-situ PDS core sample (PRE-dredge)
Dredge Prism
PCBs Data Summary
Sample
PRE-DREDGE (Core) PCB Screening
Level Dredge Prism In-Situ PDS
Average 149 36 60 ppb

PCBs: PORT OF PORTLAND, TERMINAL 5 – 2008 pre-dredge; 2010 post-dredge
-36
-45
-33
-34
-43
-42
-41
-40
-39
-38
-37
-44
-35
Dept
h (fe
et C
RD)
Downstream Upstream
July 2010 surface
PCBs SL = 60 ppb
-46
28 25.3 37
C-7
34
47 38
C-6 C-12
<3.9
22
C-7 C-12 C-6
In-situ dredge prism core sample (PRE-dredge)
In-situ PDS core sample (PRE-dredge)
Surface grab sample (POST-dredge)
Dredge Prism
PCBs Data Summary
Sample
PRE-DREDGE (Core) POST-DREDGE (Grab) PCB Screening
Level Dredge Prism In-Situ PDS July 2010
Average 149 36 30 60 ppb
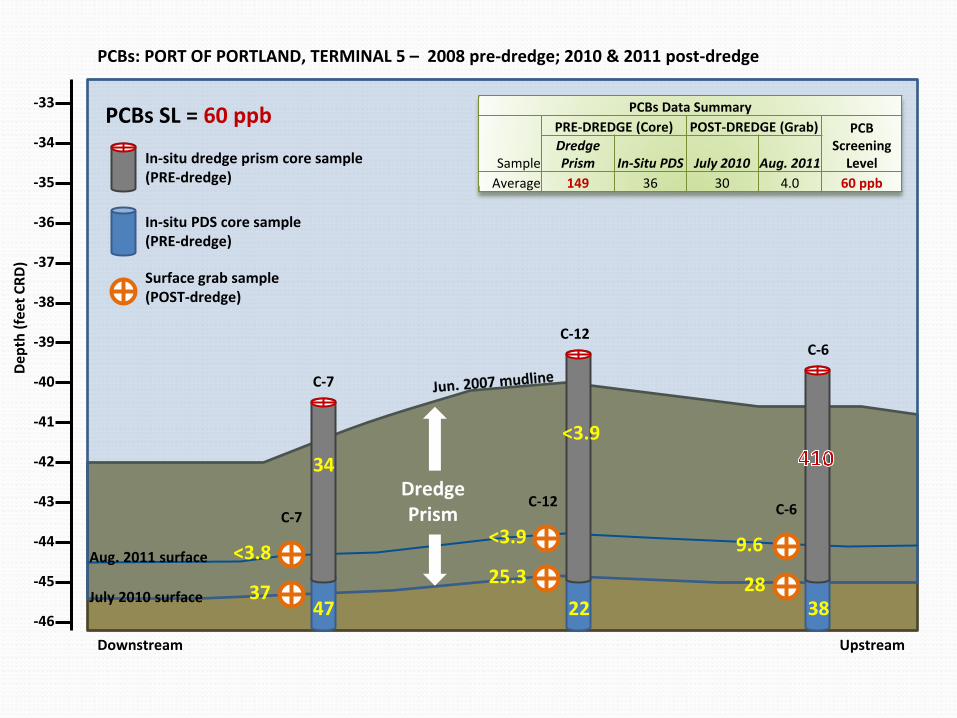
PCBs: PORT OF PORTLAND, TERMINAL 5 – 2008 pre-dredge; 2010 & 2011 post-dredge
-36
-45
-33
-34
-43
-42
-41
-40
-39
-38
-37
-44
-35
Dept
h (fe
et C
RD)
Downstream Upstream
July 2010 surface
PCBs SL = 60 ppb
-46
28 25.3 37
Aug. 2011 surface
C-7
34
47 38
C-6 C-12
<3.9
22
C-7
<3.8
C-12
<3.9 C-6
9.6
PCBs Data Summary
Sample
PRE-DREDGE (Core) POST-DREDGE (Grab) PCB Screening
Level Dredge Prism In-Situ PDS July 2010 Aug. 2011
Average 149 36 30 4.0 60 ppb
In-situ dredge prism core sample (PRE-dredge)
In-situ PDS core sample (PRE-dredge)
Surface grab sample (POST-dredge)
Dredge Prism
What might account for differences between in-situ cores and PDS grabs? Fallback is a reality Mixing happens: physical mixing during dredging
natural river processes, marine traffic Side slope sloughing Known rates of deposition: 4” to 6” year
accumulation

PDS
Regulatory requirements for the PDS (based on pre-dredge core sampling) BEFORE DREDGING Bioassays on pre-dredge core samples Benthic invertebrate study AFTER DREDGING PDS sediment sampling Monitored natural recovery
Additional sediment sampling Bathymetric surveys Additional benthic invertebrate studies
OR OVERDREDGE and cover with sand

Conclusions The in-situ PDS core sample generally over-predicted
the post-dredge condition Depending on site conditions and patterns of
contamination, the in-situ PDS sample may under-predict the post-dredge condition
When available, consider historic information and knowledge of site conditions to help predict PDS chemistry and potentially reduce sampling burden:
CPDS = ƒ[cin-situ core, cDP(mixed&fallback), cside slope, cdeposition]

Conclusions Agencies and the regulated community should use these findings to inform risk-based regulatory decision making for dredging projects in the Portland Harbor
Future Work Examine additional paired in-situ core and PDS grab samples to improve risk-based decision making in the Portland Harbor
Related Documents