1 Sedentary Work, Low Physical Job Demand, and Obesity in US Workers September 9, 2009 BongKyoo Choi 1 ScD, Peter Schnall 1 MD, Haiou Yang 1 PhD, Marnie Dobson 1 PhD, Paul Landsbergis 2 PhD, Leslie Israel 1 DO, Robert Karasek 3,4 PhD, Dean Baker 1 MD 1 Center for Occupational and Environmental Health, University of California Irvine, Irvine, USA. 2 Department of Environmental and Occupational Health Sciences, The State University of New York Downstate School of Public Health, Brooklyn, USA. 3 Department of Work Environment, University of Massachusetts Lowell, Lowell, USA. 4 Department of Psychology, Copenhagen University, Copenhagen, Denmark For correspondence: BongKyoo Choi, Center for Occupational and Environmental Health, University of California Irvine, 5201 California Avenue, Suite 100, Irvine, CA, 92617. Tel. 1- 949-824-5130, Fax 1-949-824-2345, E-mail: [email protected]

Welcome message from author
This document is posted to help you gain knowledge. Please leave a comment to let me know what you think about it! Share it to your friends and learn new things together.
Transcript

1
Sedentary Work, Low Physical Job Demand,
and Obesity in US Workers
September 9, 2009
BongKyoo Choi1 ScD, Peter Schnall
1MD, Haiou Yang
1PhD, Marnie Dobson
1PhD,
Paul Landsbergis2PhD, Leslie Israel
1DO, Robert Karasek
3,4PhD, Dean Baker
1MD
1Center for Occupational and Environmental Health, University of California Irvine, Irvine, USA.
2Department of Environmental and Occupational Health Sciences, The State University of New
York Downstate School of Public Health, Brooklyn, USA. 3Department of Work Environment, University of Massachusetts Lowell, Lowell, USA.
4Department of Psychology, Copenhagen University, Copenhagen, Denmark
For correspondence: BongKyoo Choi, Center for Occupational and Environmental Health,
University of California Irvine, 5201 California Avenue, Suite 100, Irvine, CA, 92617. Tel. 1-
949-824-5130, Fax 1-949-824-2345, E-mail: [email protected]

2
Abstract
Objective: To examine whether low physical activity at work (sedentary work or low physical
job demand) is associated with total and central obesity in US workers.
Methods: The analysis included 955 male and 956 female workers (age range: 32 to 69), who
completed both the telephone interview and mailed questionnaire of the National Survey of
Midlife Development in the United States (MIDUS) II study (2004-2006). Sedentary work and
physical job demand were each measured by one questionnaire item. Total obesity (based on
body mass index) and central obesity (based on waist circumference) were defined using WHO
criteria.
Results: After controlling for covariates (socio-demographic, psychosocial work characteristics,
health status, and health behaviors including leisure-time physical activity and stress-induced
overeating), sedentary work, low physical job demand, and their combination increased the risk
for total and central obesity only in male workers, particularly when they worked longer than 40
hours per week. The risk of the combination of sedentary work and low physical job demand for
central obesity was greater than those of either lack of leisure-time physical activity or stress-
induced overeating in the longer working male group.
Conclusions: Low physical activity at work is a significant risk factor for total and central
obesity in middle-aged US male workers. Increasing opportunities for physical activity at work
and/or reducing long work hours could contribute to obesity prevention. More studies are needed
to understand the role of physical activity at work in the obesity of US female workers.
Key words: total obesity, central obesity, physical activity, leisure-time, overeating, work hours.

3
1. Introduction
Obesity, an excess of body fat, has been a serious public health issue in the general
population and among workers in the United States (US) since the 1980s (1-3). Obesity has been
well documented as a key risk factor for a wide range of chronic diseases such as hypertension,
coronary heart disease, osteoarthritis, dyslipidemia, Type II diabetes, some cancers as well as
increased mortality (4-5). One estimate of the national cost of obesity amounted to 78.5 billion in
1998, which accounted for 9.1% of total U.S. medical expenditures in the same year (6).
Most experts agree that the obesity epidemic arises from changes in the environment and
health behaviors rather than from changes in genes (7-9). However, due to the multifaceted
characteristics of obesity etiology (10), there is not as yet a clear consensus on what
environmental and behavioral changes have driven the current US obesity epidemic (11-17).
One promising explanation is that “the decline in work-related physical activity seems a
prime suspect in the growth of obesity.” (14, p. 12). In fact, there have been substantial changes
in technology (eg, computers), the organization of work (eg, lean production system) as well as
the structure of industries and occupations (eg, service-driven economy and increased women‟s
labor force participation rate) and labor relations (ie, decreased union density) in the US since the
1980s (18-21). Consequently, routine manual and cognitive tasks at work (within detailed
occupations) in the US have been reduced substantially over time by mechanization, automation,
or computerization (13, 20). Strenuous jobs have decreased and sedentary jobs (ie, sitting most
of time) have increased significantly in male workers, albeit not to the same extent in female
workers (22). In addition, work-related dynamic physical activities have been further restricted

4
due to lean production system, squeezing workers in terms of work space as well as time and
motion for profitability (18, 23-25).
However, to our knowledge, few studies (22, 26-28) have investigated the role of low
physical activity at work (sedentary work or low physical job demand) in the increasing
prevalence of obesity of US workers. In addition, the associations of low physical activity at
work with obesity have been inconclusive across the few existing studies and between men and
women as in non-US studies (29-36).
Physical inactivity at work was associated with total obesity (BMI 30 kg/m2) in the
third National Health and Nutrition Examination Survey (1988-1994), but it was not presented
separately for male and female workers (28). Hu et al. (26) also reported that sedentary work was
a risk factor for total obesity in female nurses, although sedentary work was defined broadly in
this study to include not only sitting at work, but also sitting away from home or while driving.
By contrast, Jeffery et al. (27) found no association (for men) and a significant, „positive‟
association (for women) between physical job activity and total obesity in the Healthy Worker
Project. Lakdawalla and Philipson (22) reported dynamic associations between occupational
physical (ie, physical fitness-demanding) activity and total obesity using the National
Longitudinal Survey of Youth data: no association between the two variables at baseline, but
later increasing inverse associations over time in male workers; and a positive association at
baseline, but no associations over time in female workers.
Furthermore, the above studies have limitations in particular that leisure-time physical
activity (LTPA) (22) and/or any energy intake information (22, 28) were not adjusted for the
reported associations. In addition, none of the above studies (22, 26-28) examined central obesity
as an outcome which has been known to be more strongly associated with chronic diseases than

5
BMI (2, 37-38) and has been a key criterion for clinical diagnosis of the metabolic syndrome
(39).
In this study, we will test whether low physical activity at work (sedentary work or low
physical job demand) is associated with total (based on BMI) and central (based on waist
circumference) obesity in male and female US workers, after adjustment for various social and
psychosocial variables, health conditions, and health behaviors (including leisure-time physical
activity and stress-induced overeating behavior).
2. Methods
Study population
Data from the National Survey of Midlife Development in the United States (MIDUS) II
study (40) was used for this study. From 1995 to 1996, the MacArthur Midlife Research
Network carried out a national survey (ie, MIDUS I study) to investigate the role of social,
psychological, and behavioral factors in understanding age-related differences in physical and
mental health (40). 7,108 persons (males, 48% and females, 52%) completed both a telephone
interview and mailed questionnaires for the MIDUS I study. All of the participants were non-
institutionalized, English-speaking adults, aged 25-74, in the United States. They were drawn
from four subsamples: (1) a national random-digit-dial (RDD) sample (n=3,487); (2)
oversamples from five metropolitan areas (N=757); (3) siblings of individuals from the RDD
sample (n=950); and (4) a national RDD sample of twin pairs (n=1,914). The response rates of
the four subsamples ranged from 60% to 70%. The four subsamples were very similar to one
another in terms of the distributions of age, education, and gender (40). The socio-demographic
6
characteristics of the RDD subsample were comparable to those of a US population
representative sample, the October 1995 Current Population Survey (http://www.census.gov/cps).
However, the RDD subsample relatively underrepresented those who were blacks, young (eg,
aged 25 to 34), or had less education (ie, 12 or less than 12 years of formal education) (40).
A follow-up survey of the participants of the MIDUS I study respondents was conducted
from 2004 to 2006. The average follow-up interval was approximately 9 years later and ranged
from 7.8 to 10.4 years. The longitudinal retention rates among the four subsamples ranged from
65% to 78% (on average, 70%). In the follow-up, low educated persons were relatively more
likely to have dropped out of the study. 4,963 persons (males, 47% and females, 53%) completed
both a telephone interview and mailed questionnaires for the MIDUS II study. For this study,
first we restricted study subjects to those (n = 2,157) who were working for a paid-job at the
MIDUS II survey, had worked as full-time or part-time workers in 2003, and were aged less than
70 years. Finally 1,911 workers (955 males and 956 females) who had valid information on the
exposure and outcome variables (see below) were chosen for this study.
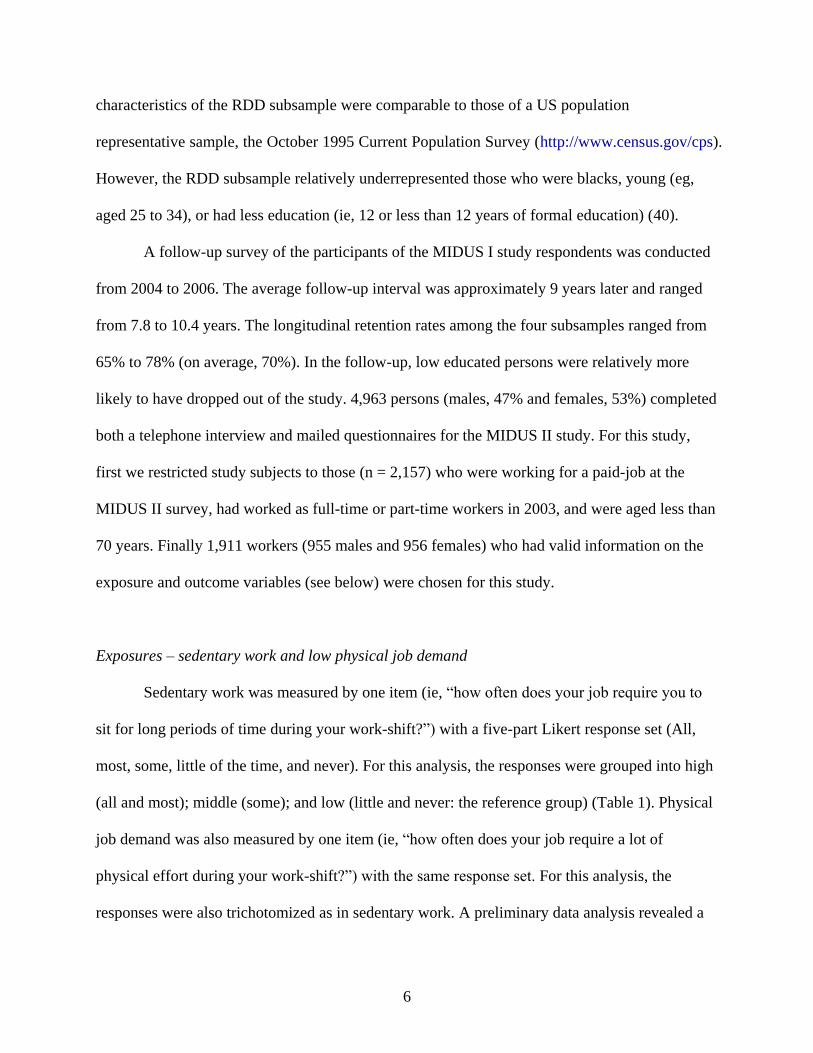
Exposures – sedentary work and low physical job demand
Sedentary work was measured by one item (ie, “how often does your job require you to
sit for long periods of time during your work-shift?”) with a five-part Likert response set (All,
most, some, little of the time, and never). For this analysis, the responses were grouped into high
(all and most); middle (some); and low (little and never: the reference group) (Table 1). Physical
job demand was also measured by one item (ie, “how often does your job require a lot of
physical effort during your work-shift?”) with the same response set. For this analysis, the
responses were also trichotomized as in sedentary work. A preliminary data analysis revealed a

7
high negative correlation between the sedentary work and physical job demand variables
(Spearman coefficients were -0.54 and -0.50 for men and women, respectively) so a variable
combining sedentary work and physical job demand (hereafter called “physical inactivity at
work”) was additionally created for a potential interaction effect between sedentary work and
physical job demand on obesity. The variable was then grouped into three categories: high (high
sedentary work and low physical job demand); low (low sedentary work and high physical job
demand); and middle (the other combination groups of sedentary work and physical job demand).
Spearman correlations of quantitative job demand (see below) with sedentary work and physical
job demand were weak (ie, less than 0.11) for both men and women. Despite the same response
(eg, all of the time – your work-shift) to the sedentary work and physical job demand items, its
meaning (ie, absolute exposure time) could differ by the length of the “work-shift” of the
respondents (eg, 8 hours for a worker who works 8 hours per day vs. 12 hours for a worker who
works 12 hours per day). To address this issue, the risks of sedentary work and low physical
demand for total and central obesity in the multivariate analyses (see below) were additionally
investigated with stratification for the working hours per week (≤ 40 hrs and > 40 hrs per week)
of the respondents.
Outcome – obesity (body mass index and waist circumference)
General obesity was defined by the body mass indexes (≥ 30 kg/m2) (10), based on self-
reported height and weight information. There were strong correlations between self-reported
and measured values of BMI in a subsample (n = 464) of the MIDUS II participants (11):
Pearson correlation coefficients were 0.93 in men and 0.92 in women. Central obesity was

8
defined by the self-reported waist circumferences (> 40 inches for men; > 35 inches for women)
(10).
Covariates
Various potential covariates were considered in the analysis: data sources, socio-
demographic (2, 3, 17), psychosocial working conditions (11, 41-44), health status, and health
behaviors (16, 41, 45, 46). Specifically, four data sources: city; siblings; and twin subsamples (vs.
the national random subsample), age (< 40; 40 to 49; 50 to 59; and ≥ 60 years old), sex, marital
status (married and non-married), any children aged 0 to 6 years at home, race (whites and
others), annual household income (<$ 60,000; $ 60,000 to $ 99,999; and ≥ $100,000), and
education (high - university/graduate school graduate; middle - some college education, but
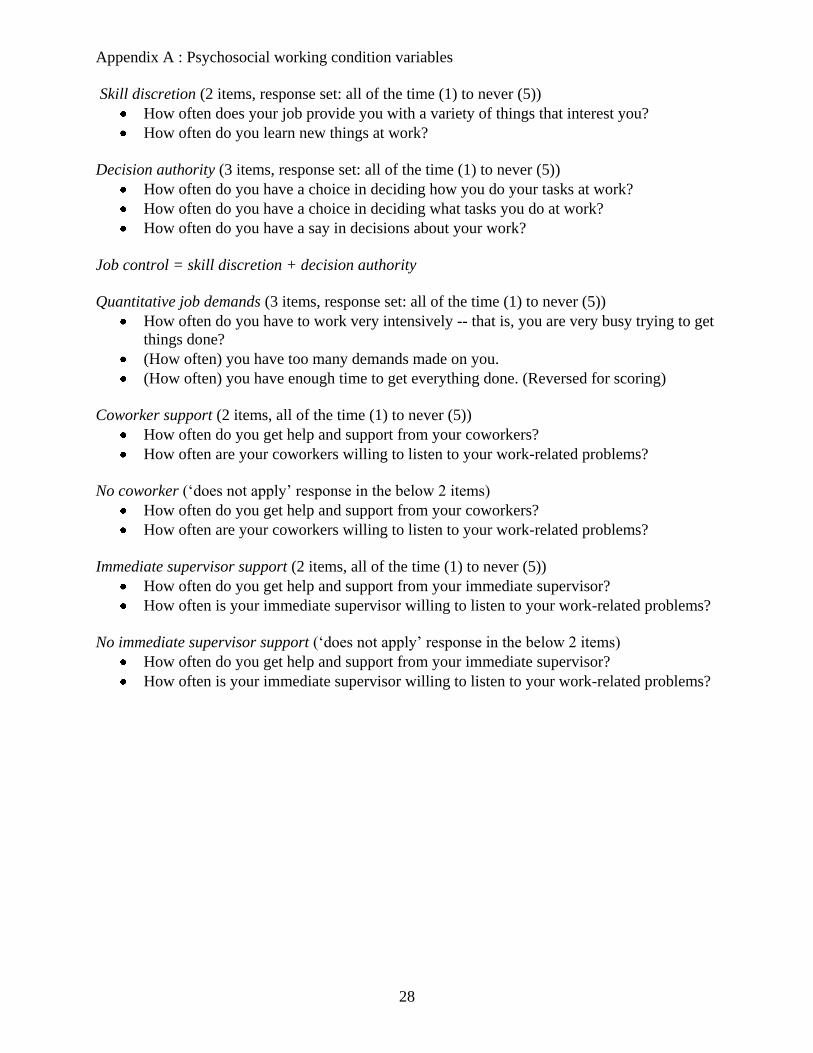
unfinished; and low - high school graduate and lower education). Several psychosocial working
conditions were measured by questionnaire items (see Appendix A): job control (skill discretion
plus decision authority, 5 items), quantitative job demands (3 items), coworker (2 items) and
immediate supervisor (2 items) support, and no coworkers (2 items) and immediate supervisors
(2 items). Job control, quantitative job demands, coworker support, and supervisor support were
dichotomized into high and low at their median values. In addition, hours of work per week
(from a main job and other jobs: ≤ 40 hrs and > 40 hrs per week) were also self-reported.
The following health status and health behaviors were measured: depression (those who
felt sad, blue, or depressed for „all‟ or „almost all‟ of two weeks or more in a row during the past
12 months); anxiety (those who worried „every day‟ or „most of days‟ during the last 12 months
and worried all day long or most of the days); chronic diseases (those who have experienced or
been treated for any of the following during the past 12 months: arthritis, sciatica, recurring
9
stomach trouble or diarrhea, persistent foot troubles, trouble with varicose veins, multiple
sclerosis, stroke, and hernia; or those who have ever had heart problems or ever had cancer);
smoking (current smokers vs. non-smokers); alcohol consumption (moderate drinking – up to
two drinks per day for men and one drink per day for women (47) during the past month and
heavy drinking – more than moderate drinking vs. no drinking); active leisure-time physical
activity (ie, vigorous or moderate physical activity long enough to work up a sweat, several times
a week or more during the summer or the winter); and stress-induced overeating (those who
endorsed either of the following two items about “how you respond when you are confronted
with difficult or stressful events in your life”: “I eat more than I usually do” and “I eat more of
my favorite foods to make myself feel better”).
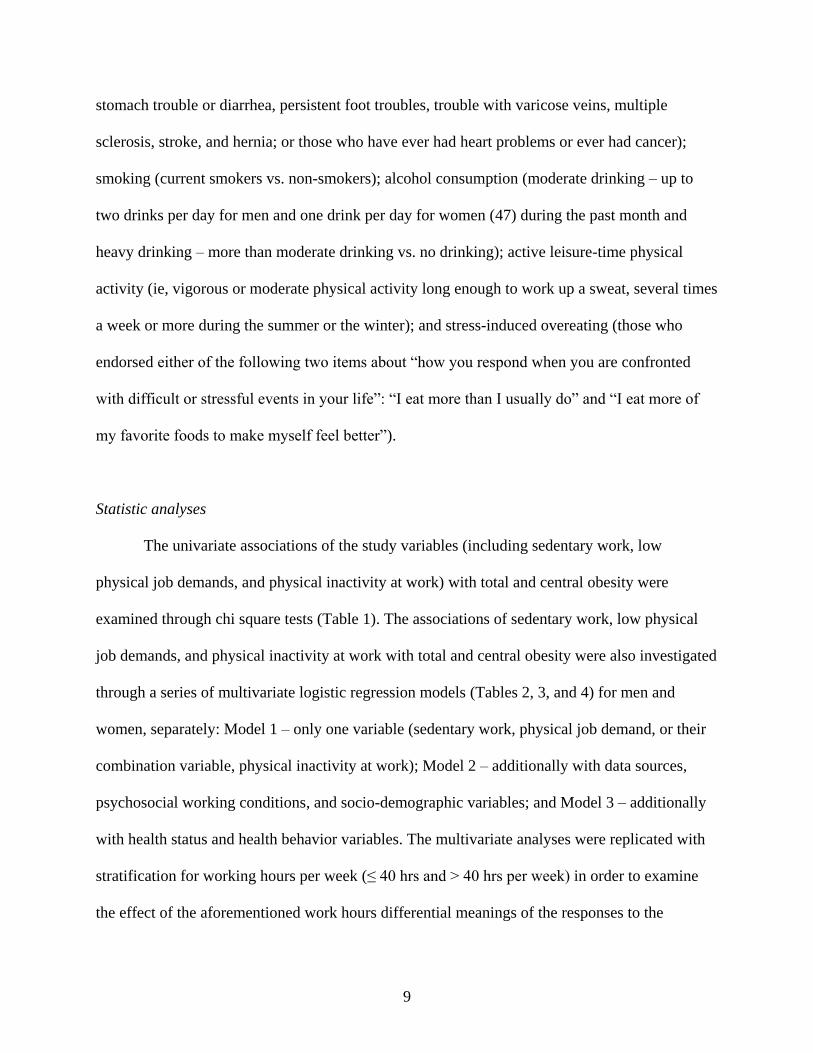
Statistic analyses
The univariate associations of the study variables (including sedentary work, low
physical job demands, and physical inactivity at work) with total and central obesity were
examined through chi square tests (Table 1). The associations of sedentary work, low physical
job demands, and physical inactivity at work with total and central obesity were also investigated
through a series of multivariate logistic regression models (Tables 2, 3, and 4) for men and
women, separately: Model 1 – only one variable (sedentary work, physical job demand, or their
combination variable, physical inactivity at work); Model 2 – additionally with data sources,
psychosocial working conditions, and socio-demographic variables; and Model 3 – additionally
with health status and health behavior variables. The multivariate analyses were replicated with
stratification for working hours per week (≤ 40 hrs and > 40 hrs per week) in order to examine
the effect of the aforementioned work hours differential meanings of the responses to the

10
sedentary work and low physical job demand items (Table 4). Due to space limitations, the odds
ratios in the multivariate analyses were presented in Tables 2 and 3 only for the covariates which
were significant (p < 0.05) in the univariate analyses or in Model 3.
3. Results
Descriptive statistics of total and central obesity
The means and standard deviations of BMI were 28.42 kg/m2 and 4.87 for men, and
27.02 kg/m2 and 6.15 for women, respectively. Total obesity percentages were 28.9% and 26.6%
for male and female workers, respectively. The means and standard deviations of waist
circumference were 39.18 inches and 4.80 for men, and 34.85 inches and 5.79 for women,
respectively. Central obesity percentages were 32.9% and 41.7% for male and female workers,
respectively. Spearman correlations between continuous body mass indexes and waist
circumferences were 0.81 (p < 0.001) for men and 0.84 (p < 0.001) for women. The kappa values
between total obesity and central obesity were 0.69 (p < 0.05) for men and 0.58 (p < 0.05) for
women.
Descriptive statistics of sedentary work and physical job demand
The distributions of sedentary work, physical job demand, and physical inactivity at work
in male workers were very similar to those in female workers (Table 1). For instance, 35.1% of
male and female workers, respectively, reported high physical inactivity at work. As expected,
sedentary work was most prevalent in the high education group, while physical job demand was
most prevalent in the low education group. As a result, the percentages of physical inactivity at

11
work were highest in the high education group (51.7%) and followed by the middle education
group (23.0%) and the low education group (13.2%) for men, and 38.0%, 35.0%, and 30.8%,
respectively, for women.
Univariate correlations with total and central obesity
In the univariate analysis, sedentary work, physical job demand, and physical inactivity at
work were not associated with total and central obesity in male workers, while the prevalence of
obesity was lowest at the middle levels of sedentary work and physical inactivity at work in
female workers when compared to those at low or high levels (Table 1). On the other hand,
lower levels of education, lack of LTPA, stress-induced overeating, less alcohol consumption,
and any chronic diseases were strongly associated with total and central obesity in both men and
women. Age and being married were associated with central obesity in male workers. Race (non-
whites), low job control, and depression were associated with total and central obesity in female
workers. Lower annual income and having a supervisor were associated only with central obesity
while low coworker support and being a non-smoker were associated only with total obesity in
female workers.
Multivariate associations with total obesity
In the multivariate analyses, both physical job demand and physical inactivity at work
were not associated with total obesity in both men and women (data not shown). However, high
and middle levels of sedentary work increased the risk for total obesity in male workers, when
compared to the low level of sedentary work: their odds ratios for total obesity (95% confidence
12
intervals (CIs)) were 1.53 (1.04-2.24) and 1.60 (1.05-2.45), respectively (Table 2). However,
such significant risk increases were not observed in female workers.
In both men and women, lower levels of education, any chronic diseases, and stress-
induced overeating were risk factors for total obesity, while active LTPA and alcohol
consumption were inversely associated with total obesity as in the univariate analyses (Table 2).
In male workers, depression was associated with a decreased risk for total obesity. In female
workers, race (non-whites), low coworker support, and long working hours per week increased
the risk for total obesity, while smoking decreased the risk. Depression and low job control were
not associated with total obesity in female workers in multivariate models.
Multivariate associations with central obesity
After controlling for all of the covariates, sedentary work, low physical job demand, and
high physical inactivity at work were associated with central obesity in male workers. Increased
risk was observed in both high and middle levels of sedentary work in male workers, with odds
ratios (95% CIs) of 1.97 (1.36-2.85) and 1.68 (1.11-2.53), respectively (Table 3). Similarly, high
and middle levels of physical job demand were associated with central obesity in male workers,
with odds ratios (95% CIs) of 0.63 (0.41-0.97) and 0.76 (0.52-1.11), respectively. Finally, the
combined variable (physical inactivity at work) was associated with even stronger associations
with central obesity: and odds ratio of 2.08 (1.23-3.54) for high levels of physical inactivity at
work and 1.70 (1.06-2.73) for middle levels. However, these variables were not significantly
associated with central obesity in female workers.
In both men and women, race (non-whites), low education, any chronic diseases, and
stress-induced overeating increased the risk for central obesity, while active LTPA, smoking, and

13
moderate alcohol consumption decreased the risk for central obesity (Table 3). Interestingly,
having a supervisor (vs. no immediate supervisors) increased the risk for central obesity in
female workers. Depression and low job control were not significantly associated with central
obesity in female workers.
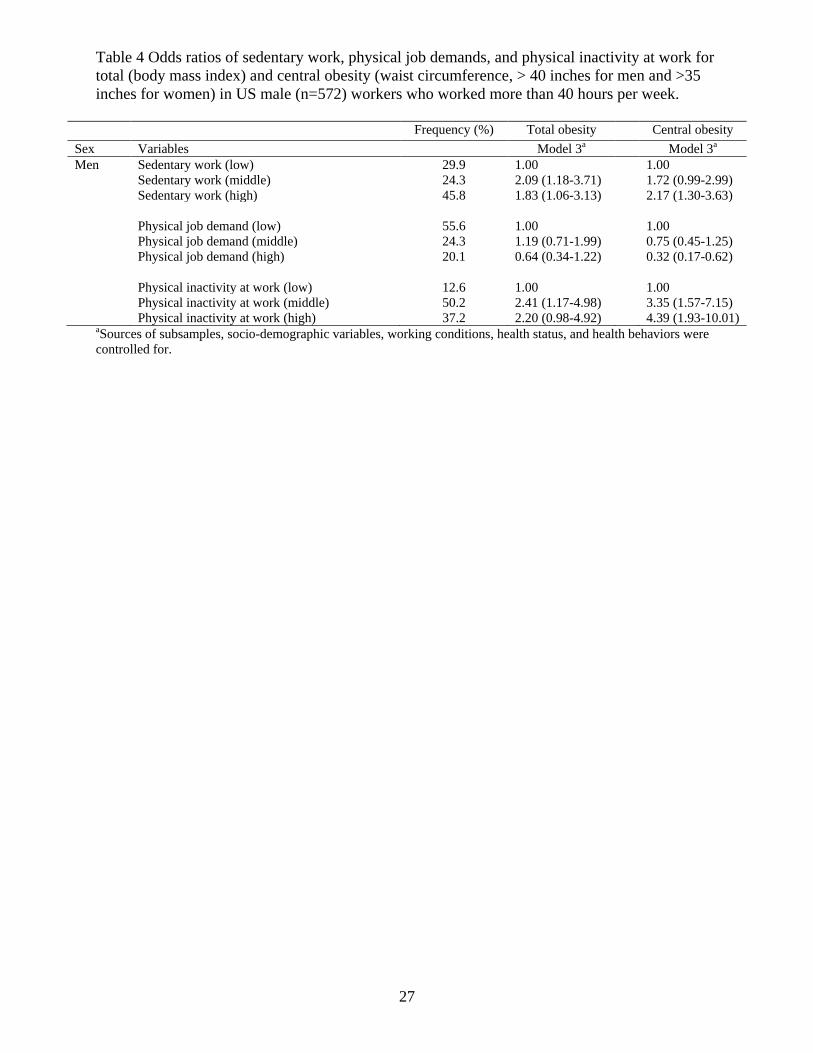
Stratified analyses by working hours per week
The above multivariate analyses for total and central obesity were replicated after
stratification by hours worked per week. Increased risks of total obesity due to sedentary work
and physical inactivity at work was observed in male workers (n=572) who worked longer (ie, >
40 hours per week) (Table 4), but not in male workers (n=383) who worked shorter (ie, 40 hours
per week or less). The risk of central obesity due to high level of sedentary work was somewhat
greater in the >40 hours per week male group (2.17, 95% CI, 1.30-3.63) than in the ≤40 hours
per week male group (1.78, 95% CI, 1.00-3.14). The risk of central obesity due to physical job
demand and physical inactivity at work increased substantially and were significant only in the
group of men working >40 hours per week. For example, the odds ratio of high physical
inactivity at work for central obesity was 4.39 (95% CI, 1.93-10.01), which was greater than the
risks of non-active LPTA and stress-induced overeating in the male group: 1.85 (1.20-2.78) and
3.20 (1.99-5.12), respectively. There were no such effect modifications by working hours per
week in female workers.
4. Discussions
There were significant associations of low physical activity at work (sedentary work, low
physical job demand, or their combination) with total and central obesity among US male

14
workers participating in the MIDUS II study, particularly those who worked longer than forty
hours per week. However, we failed to find such associations in female workers. These findings
partially support the hypothesis that substantial reductions of work-related physical activity may
be an important cause of the current obesity epidemic in the US. Increasing opportunities for
physical activity at workplaces and/or reducing long work hours could contribute to obesity
prevention in US workers. More sophisticated prospective studies are needed to examine the role
of physical activity at work in reducing the prevalence of obesity in male and female workers in
the US.
Comparisons with other studies
To the best of our knowledge, this is one of only a few studies showing an association of
low physical activity at work (sedentary work or low physical job demand) with central obesity
in male workers. This finding is consistent with one Japanese study at a metal manufacturing
factory (33). This study is also one of a very few studies controlling for many key risk factors for
obesity (ie, socioeconomic status, LTPA, and overeating behavior) in assessing the association
between low physical activity at work and total obesity in male workers, although several studies
have observed such an association (22, 29, 30, 33-35).
However, this study is not consistent with one US cross-sectional study (27) and two
non-US cross-sectional studies (31, 32) reporting no associations between work-related physical
activity and total obesity in male workers. Differences in measurement of physical activity at
work might explain the inconsistency of this study with the other US study (27). In the other US
study, “occupational physical activity” did not specifically assess the extent of sedentary (ie,
sitting) work. In the current study, low physical job demand was not associated with total obesity

15
in male workers as in the other study (27), however, sedentary work was associated with total
obesity in the current study. We can not rule out socio-cultural differences in obesity etiology
(48), which may explain differences between this study and non-US studies (31, 32).
On the other hand, we found no significant, albeit positive, associations between low
physical activity at work and total or central obesity in female workers. The literature on this
hypothesis in female workers has been very inconclusive: no association in four non-US studies
(30, 31, 34, 35); a positive association in one US study (26) and two non-US studies (29, 33); an
inverse association in one US study (27) and one non-US study (36); and a changing (inverse to
the null) association over time in one US study (22).
Several explanations are possible for the gender differences in this study. Obese female
workers might underreport their weight, height, and waist circumference more frequently than
obese male workers. However, this seems unlikely for two reasons. First, there were very high (>
0.90) correlations between self-reported and measured BMI values in both men and women of
the subsample of the MIDUS II (11). Second, the self-reported BMI values were slightly more
accurate in female than in male US adults (49, 50) as in the MIDUS II subsample study (11).
Two-level rather than three-level definitions of sedentary work and physical job demand (high =
all and almost of the time vs. low = some, little, and never) did not make a difference in results
(data not shown).
Another possible explanation is that the level of BMI or waist circumference may
influence choice of job in females, but not in males, which was demonstrated in a recent study
with the National Longitudinal Survey of Youth data (22). There is also some evidence that
obese workers are discriminated against in both hiring and job placement/promotion and such
discrimination is more prevalent in females than in males (51, 52). If obese female workers were
16
hired more frequently in physically demanding jobs, a positive association between high physical
activity at work and obesity would be observed in a cross-sectional study. However, given no
substantial changes in job and employment, the association might eventually change to the null
or to an inverse association due to the causal impact of physical activity at work on weight (eg,
obese female workers start to lose weight due to physical work, while thinner female workers
start to gain weight due to sedentary work). Prospective studies, which can assess changes in
jobs and weight due to social selection and discrimination, are needed to better test the
hypothesis that reductions in physical activity at work contribute to the current obesity epidemic
in US male and female workers.
Policy perspectives: increasing physical activity at work and/or reducing long work hours
This study highlights the importance of physical activity at work for obesity prevention in
US male workers. In this study, the risk of high physical inactivity at work (combination of
sedentary work and low physical job demand) for central obesity was greater than those of either
lack of leisure-time physical activity or stress-induced overeating, especially in male workers
who work longer than 40 hrs per week. In addition, the longer working hours (> 40 hours per
week) was a significant independent risk factor for total obesity in female workers. These
indicate that increasing opportunities for physical activity at work as well as in leisure time
and/or reducing long working hours per week should be major components of a public health
policy for obesity prevention. Such policies should be helpful in counteracting the current
positive energy imbalance of the US population: increased average total energy intake (53, 54)
and stable leisure-time physical activity (LTPA) (1, 55) since the 1980s.

17
Enacting such policies will not be easy. According to the 2004 national survey of
worksite health promotion activities (56), only about 20% of US workplaces conduct a worksite
weight management or physical activity program. Stairs in US buildings are usually hidden from
entrances and the use of stairs is not recommended as a way of work activities (57). More
problematically, reduction of dynamic physical activity at work has been quite often praised for
increased efficiency or productivity (8). For instance, after introduction of a lean production
system at car assembly factories (18, 23), the assembly line was reconfigured from flow lines
toward U-shaped. Work-related physical activities such as waking with the car along the line and
walking between the car and parts racks were substantially removed under the name of non-value
added motions. A similar case in a medical center was reported (eg, on average, reduction of
5,000 steps) (25). Increasing physical activity at work, through health promotion programs,
physical workspace design, or by not physically constricting work activities, seems to be
contingent on how much our society is willing to view dynamic physical activity at work as a
social value-adding (ie, health promoting) activity and to maintain/reflect this perspective in
designing technology and organizing work. A recent study (58) suggested that it might be
possible to increase physical activity at work without sacrificing productivity: frequent micro-
breaks in sedentary work, independent of the total sedentary time, was inversely associated with
total and central obesity. The percentages of long (50 hours per day or more) working hours in
US workers increased 21.0% in 1970 and 26.5% in 2000 for men and 5.2% in 1970 and 11.2% in
2000 for women (59). According to a recent study using the 2002 US General Social Survey data
(60), overtime (ie, >40 hours per week) workers were more prevalent in male, white, and middle-
aged workers with higher levels of education and income. Therefore, the impact of reducing

18
working hours per week on obesity prevention would be greatest in male high status workers
who are mostly subjected to high physical inactivity at work.
Limitations of this study
This study has several limitations. First, as a cross-sectional study, we cannot draw a
causal inference about the effect of low physical activity at work on obesity in US workers.
Second, although the MIDUS II was a national study, with participants recruited from diverse
occupations and industries across the US, it is not necessarily representative of the US working
population. In fact, the dataset under-represents minorities (eg, blacks) and people with low
levels of education. If such groups had been represented in the study relative to their proportion
in the US population, the prevalence of obesity in this study would have been higher. Third,
interpretations about the associations of other exposures with obesity should be made carefully
because they were not the main focus of this study. For example, in this study, despite some
expected associations of psychosocial working conditions with obesity in female workers, there
were no such associations in male workers. Such null associations mean no “direct” effects of
psychosocial working conditions on obesity, which does not exclude the possibility of any
“indirect” impacts of psychosocial working conditions on obesity via health behaviors (not
addressed in this study). Fourth, self-reported measures of physical activity at work and waist
circumference could be vulnerable to self-report bias. However, it was reported in a study on 111
US male and female workers (61) that self-reported waist circumference values were highly (ie,
> 0.80) correlated with technician-measured ones. In addition, self-reported sitting time at work
and physical job demand items, very similar to ones used in this study, were valid in
comparisons to some objective measures in the National Longitudinal Survey of Youth and a
19
sample of Australian workers (22, 62). Therefore, it is unlikely that the use of self-reported
measures affected the results of this analysis substantially.
Acknowledgements
We are thankful to the Center for Social Epidemiology for supporting this study.
References
1. Caban AJ, Lee DJ, Fleming LE, Gomez O, LeBlanc W, Pitman T. Obesity in US workers: the
national health interview survey, 1986 to 2002. Am J Public Health 2005; 95(9): 1-9.
2. Ford ES, Mokdad AH, Giles WH. Trends in waist circumference among US adults. Obes Res
2003; 11(10):1223-31.
3. Ogden CL, Carroll MD, McDowell MA, Flegal KM. Obesity among adults in the United
States – no statistically significant change since 2003-2004. NCHS data brief 2007; (1):1-8.
4. National Institute of Health. Clinical guidelines on the identification, evaluation, and treatment
of overweight and obesity in adults: the evidence report. Obes Res 1998; 6 Suppl 2: 51S-209S.
5. Flegal KM, Graubard BI, Williamson DF, Gail MH. Excess deaths associated with
underweight, overweight, and obesity. JAMA 2005; 293: 1861-67.
6. Finkelstein EA, Fiebelkorn IC, Wang G. National medical spending attributable to overweight
and obesity: how much, and who‟s paying? Health Aff 2003; W3: 219–26.
7. Hill JO, Peters JC. Environmental contributions to the obesity epidemic. Science 1998; 280:
1371-74.
8. Peters JC. The challenge of managing body weight in the modern world. Asia Pac J Clin Nutr
2002; 11 Suppl 8:S714-7.
9. Prentice AM, Jebb SA. Obesity in Britain: gluttony or sloth? BMJ 1995; 311(7002):437-9.
10. World Health Organization. Obesity: preventing and managing the global epidemic. Geneva:
WHO; 1999.
11. Block JP, He Y, Zaslavsky AM, Ding L, Ayanian JZ. Psychosocial stress and change in
weight among US adults. Am J Epidemiol 2009; 170(2):181-92.
12. Harnack LJ, Jeffery RW, Boutelle KN. Temporal trends in energy intake in the United
States: an ecologic perspective. Am J Clin Nutr 2000; 71(6):1478-84.
13. Helmchen LA. Can structural change explain the rise in obesity? a look at the past 100 years.
Chicago (IL): The Population Research Center at NORC and the University of Chicago; 2001
Sep. Report No.: 2001-09.
14. Philopson T. The world-wide growth in obesity: an economic research agenda. Health Econ
2001; 10: 1-7.
15. Young LS, Nestle M. The contribution of expanding portion sizes to the US obesity epidemic.
Am J Public Health 2002; 92: 246-49.
16. Williamson DF, Madans J, Anda RF, Kleinman JC, Giovino GA, Byers T. Smoking
cessation and severity of weight gain in a national cohort. N Engl J Med 1991; 324: 739-745.
20
17. Zhang O, Wang Y. Trends in the association between obesity and socioeconomic status in
US adults: 1971 to 2000. Obes Res 2004; 12(10): 1622-32.
18. Adler PS, Goldoftas B, Levine DI. Ergonomics, employee involvement, and the Toyota
production system: a case study of NUMMI‟s 1993 model introduction. Ind Lab Relat Rev 1997;
50(3): 416-37.
19. Ashford NA, Caldart CC. Technology, law, and working environment. Washington (DC):
Island; 1996. p. 1-40.
20. Auto DH, Levy F, Murnane RJ. The skill content of recent technological change: an
empirical exploration. Quart J Econ 2001; 118(4): 1279-1334.
21. Freeman RB. America works: the exceptional U.S. labor market. New York (NY): Russell
Sage; 2007.
22. Lakdawalla D, Philipson T. Labor supply and weight. J Human Res 2007; 41: 85-116.
23. Leslie D, Butz D. GM suicide: flexibility, space, and the injured body. Econ Geogr 1998;
74(4):360-78.
24. Womack JP, Jones DT, Roos D. The machine that changed the world. New York (NY):
Harper-Perennial; 1991.
25. Nelson-Peterson DL, Leppa CJ. Creating an environment for caring using lean principles of
the Virginia Mason Production System. J Nurs Adm 2007 Jun;37(6):287-94.
26. Hu FB, Li TY, Colditz GA, Willett WC, Manson JE. Television watching and other
sedentary behaviors in relation to risk of obesity and type 2 diabetes mellitus in women. JAMA
2003; 289(14):1785-91.
27. Jeffery RW, French SA, Forster JL, Spry VM. Socioeconomic status differences in health
behaviors related to obesity: the Healthy Worker Project. Int J Obes 1991;15(10):689-96.
28. King GA, Fitzhugh EC, Bassett DR Jr, McLaughlin JE, Strath SJ, Swartz AM et al.
Relationship of leisure-time physical activity and occupational activity to the prevalence of
obesity. Int J Obes Relat Metab Disord 2001 ;25(5):606-12.
29. Bell AC, Ge K, Popkin BM. Weight gain and its predictors in Chinese adults. Int J Obes
Relat Metab Disord 2001;25(7):1079-86.
30. Böckerman P, Johansson E, Jousilahti P, Uutela A. The physical strenuousness of work is
slightly associated with an upward trend in the BMI. Soc Sci Med 2008;66(6):1346-55.
31. Gutiérrez-Fisac JL, Guallar-Castillón P, Díez-Gañán L, López García E, Banegas Banegas
JR, Rodríguez Artalejo F. Work-related physical activity is not associated with body mass index
and obesity. Obes Res 2002;10(4):270-6.
32. Haglund BJ. Geographical and socioeconomic distribution of overweight and morbidity in a
rural Swedish county. Scand J Soc Med 1987;15(1):19-29.
33. Ishizaki M, Morikawa Y, Nakagawa H, Honda R, Kawakami N, Haratani T et al. The
influence of work characteristics on body mass index and waist to hip ratio in Japanese
employees. Ind Health 2004; 42(1):41-9.
34. Mummery WK, Schofield GM, Steele R, Eakin EG, Brown WJ. Occupational sitting time
and overweight and obesity in Australian workers. Am J Prev Med 2005;29(2):91-7.
35. Ostry AS, Radi S, Louie AM, LaMontagne AD. Psychosocial and other working conditions
in relation to body mass index in a representative sample of Australian workers. BMC Public
Health 2006;6:53.
36. Pols MA, Peeters PH, Twisk JW, Kemper HC, Grobbee DE. Physical activity and
cardiovascular disease risk profile in women. Am J Epidemiol 1997;146(4):322-8.

21
37. Lee K, Song YM, Sung J. Which obesity indicators are better predictors of metabolic risk? :
healthy twin study. Obesity 2008 ;16(4):834-40.
38. Vazquez G, Duval S, Jacobs DR Jr, Silventoinen K. Comparison of body mass index, waist
circumference, and waist/hip ratio in predicting incident diabetes: a meta-analysis. Epidemiol
Rev 2007; 29:115-28.
39. Zimmet P, Magliano D, Matsuzawa Y, Alberti G, Shaw J. The metabolic syndrome: a global
public health problem and a new definition. J Atheroscler Thromb 2005;12(6):295-300.
40. Ryff C, Almeida DM, Ayanian JS, Carr DS, Cleary PD, Coe C et al. Midlife Development
in the United States (MIDUS II), 2004-2006 [Computer file]. ICPSR04652-v1. Ann Arbor (MI):
Inter-university Consortium for Political and Social Research [distributor], 2007-03-22.
doi:10.3886/ICPSR04652.
41. Brunner EJ, Chandola T, Marmot M. Prospective effect of job strain on general and central
obesity in the Whitehall II study. Am J Epidemiol 2007; 165(7): 828-37.
42. Ishizaki M, Nakagawa H, Morikawa Y, Honda R, Yamada Y, Kawakami N et al. Influence
of job strain on changes in body mass index and waist circumference – 6-year longitudinal study.
Scand J Work Environ Health 2008; 34(4): 288-96.
43. Rosmond R, Lapidus L, Björntorp P. The influence of occupational and social factors on
obesity and body fat distribution in middle-aged men. Int J Obes Relat Metab Disord
1996;20(7):599-607.
44. Shields M. Shift work and health. Health Rep 2002; 13: 11–33.
45. Rosmond R, Bjorntorp P. Psychosocial and socio-economic factors in women and their
relationship to obesity and regional body fat distribution. Int J Obes 1999; 23: 138-45.
46. Van Strien T, Rookus MA, Bergers GP, Frijters JE, Defares PB. Life events, emotional
eating and change in body mass index. Int J Obes 1986; 10(1):29-35.
47. Department of Health and Human Services and the Department of Agriculture. Dietary
guidelines for Americans 2005 [cited 2009 Aug 31]. Available from
http://www.health.gov/dietaryguidelines/dga2005/document/pdf/DGA2005.pdf.
48. Swinburn BA. Obesity prevention: the role of policies, laws and regulations. Aust New
Zealand Health Policy 2008;5:12.
49. Kuczmarski MF, Kuczmarski RJ, Najjar M. Effects of age on validity of self-reported height,
weight, and body mass index: findings from the Third National Health and Nutrition
Examination Survey, 1988-1994. J Am Diet Assoc 2001;101(1):28-34.
50. Nieto-García FJ, Bush TL, Keyl PM. Body mass definitions of obesity: sensitivity and
specificity using self-reported weight and height. Epidemiology 1990;1(2):146-52.
51. Chernov AE. Weight discrimination: the effects of obesity on employment. Hohonu 2006;
4(1) [cited 2009 Aug 31]. Available from
http://www.uhh.hawaii.edu/academics/hohonu/writing.php?id=111.
52. Puhl RM, Andreyeva T, Brownell KD. Perceptions of weight discrimination: prevalence and
comparison to race and gender discrimination in America. Int J Obes 2008;32(6):992-1000.
53. Briefel RR, Johnson CL. Secular trends in dietary intake in the United States. Annu Rev Nutr
2004;24:401-31.
54. Nielsen SJ, Siega-Riz AM, Popkin BM. Trends in energy intake in U.S. between 1977 and
1996: similar shifts seen across age groups. Obes Res 2002 ;10(5):370-8.
55. Centers for Disease Control and Prevention. 1988–2007 no leisure-time physical activity
trend chart [cited 2009 Aug 31]. Available from
http://www.cdc.gov/nccdphp/dnpa/physical/stats/leisure_time.htm.

22
56. Linnan L, Bowling M, Childress J, Lindsay G, Blakey C, Pronk S et al. Results of the 2004
National Worksite Health Promotion Survey. Am J Public Health 2008;98(8):1503-9.
57. Mansi IA, Mansi N, Shaker H, Banks D. Stair design in the United States and obesity: the
need for a change. South Med J 2009 May 7. [Epub ahead of print].
58. Healy GN, Dunstan DW, Salmon J, Cerin E, Shaw JE, Zimmet PZ et al. Breaks in sedentary
time: beneficial associations with metabolic risk. Diabetes Care 2008;31(4):661-6.
59. Jacobs JA, Gerson K. The time divide: Work, family, and gender inequality. Cambridge
(MA): Harvard University; 2004.
60. Grosch JW, Caruso CC, Rosa RR, Sauter SL. Long hours of work in the U.S.: associations
with demographic and organizational characteristics, psychosocial working conditions, and
health. Am J Ind Med 2006;49(11):943-52.
61. Roberts CA, Wilder LB, Jackson RT, Moy TF, Becker DM. Accuracy of self-measurement
of waist and hip circumference in men and women. J Am Diet Assoc 1997;97(5):534-6.
62. Miller R, Brown W. Steps and sitting in a working population. Int J Behav Med
2004;11(4):219-24.

23
Table 1. Total and central obesity prevalence for the variables for this study in 955 male and 956 female US workers.
Major
variable
category
Minor variable
category
Frequency (%) Total obesity, %
(based on BMI)
Central obesity, %
(based on WC)
Subcategory Men Women Men Women Men Women
Data source Subsamples National random 42.4 41.8 29.1 23.8 35.3 39.8
City 11.0 7.6 36.2 27.4 33.3 39.7
Siblings 15.9 16.6 27.0 28.3 30.3 42.1
Twin 30.7 33.9 27.0 29.0 30.7 44.4
Socio- Age (years old) < 40 10.4 13.3 22.2 28.3 22.2* 39.4
demographic 40 to 49 35.1 36.5 28.1 27.8 30.4* 42.7
50 to 59 38.0 35.0 32.2 26.6 36.9* 40.0
≥ 60 16.5 15.2 27.2 22.1 35.4* 45.5
Marital status Married 78.8 68.6 29.5 25.2 34.5* 39.8
Non-married 21.2 31.4 26.7 29.7 26.7* 46.0
Race White 93.5 91.8 28.3 24.9*** 32.1 40.4**
Others 6.5 8.2 37.1 44.9*** 43.5 56.4**
Education High school or less 23.8 26.5 37.0** 31.2* 39.2** 49.4**
Some college 26.0 31.7 31.9** 29.0* 36.7** 43.2**
University or more 50.3 41.8 23.5** 21.8* 27.9** 35.8**
Annual household income < $ 60,000 26.7 36.8 29.4 29.0 34.1 46.0**
$ 60,000 to $ 99,999 35.6 31.0 32.6 27.7 34.4 44.6**
≥ $ 100,000 37.7 32.2 25.0 22.7 30.6 34.1**
Any children, aged 0 to 6 years No 88.3 90.8 29.5 26.4 33.5 41.8
Yes 11.7 9.2 24.1 28.4 28.6 40.9
Working Sedentary work (S) Low 34.1 35.6 26.7 25.3 28.2 42.9*
conditions Middle 22.6 21.9 30.1 21.5 33.8 34.4*
High 43.2 42.6 30.0 30.2 36.1 44.5*
Physical job demand (P) Low 54.1 59.2 27.9 27.6 33.8 41.2
Middle 24.8 22.4 30.8 23.4 33.8 40.2
High 21.0 18.4 29.4 27.3 29.4 45.5
Physical inactivity at work Low 14.5 14.0 25.4 29.1* 24.6 47.8*
(= S + P) Middle 50.5 50.8 30.5 22.8* 34.4 38.1*
High 35.1 35.1 28.1 31.0* 34.0 44.6*
Job control Low 45.9 52.7 30.1 30.0* 33.6 46.6**

24
High 54.1 47.3 27.9 22.8* 32.3 36.3**
Psychological job demands Low 41.3 42.7 29.9 25.2 35.5 41.2
High 58.7 57.3 28.2 27.6 31.0 42.2
Supervisor support Low 44.2 40.8 30.8 27.9 32.0 43.6*
High 36.8 48.1 27.6 27.2 32.8 43.0*
No immediate supervisors 19.1 11.1 26.9 18.9 35.2 29.2*
Coworker support Low 50.6 45.0 30.4 31.6** 32.1 45.6
High 40.6 46.3 28.4 21.9** 34.8 38.8
No coworkers 8.8 8.7 22.6 25.3** 28.6 37.3
Hours of work per week 40 or less 40.1 69.2 29.5 25.1 33.9 41.5
> 40 59.9 30.8 28.5 29.9 32.2 42.2
Health status Any chronic diseases No 53.4 49.5 24.5** 21.8** 27.3*** 33.4***
Yes 46.6 50.5 33.9** 31.3** 39.3*** 49.9***
Depression No 94.1 87.1 29.5 25.3* 33.3 40.3*
Yes 5.9 12.9 19.6 35.0* 26.8 51.2*
Anxiety No 93.5 83.8 29.0 26.3 32.7 41.6
Yes 6.5 16.2 27.4 27.7 35.5 42.6
Health Leisure-time physical activity Non-active 55.2 55.4 33.2** 32.1*** 38.1*** 49.6***
behaviors Active 44.8 44.6 23.6** 19.7*** 26.4*** 31.9***
Stress-induced overeating No 80.5 61.2 22.8*** 17.3*** 28.0*** 30.8***
Yes 19.5 38.8 54.3*** 41.2*** 53.2*** 59.0***
Current smoker No 85.8 83.4 29.1 28.2** 33.6 42.3
Yes 14.2 16.6 27.9 18.2** 28.7 39.0
Alcohol consumption No 30.1 35.9 35.2** 37.0*** 39.4** 51.9***
Moderate 67.2 62.4 26.8** 20.8*** 30.5** 36.0***
Heavy 2.7 1.7 11.5** 18.8*** 19.2** 37.5***
Obesity Total obesity (BMI, ≥ 30 kg/m2) 28.9 26.6
Central obesity (WC) 32.9 41.7
Note. BMI = body mass index. WC = waist circumference, > 40 inches for men and >35 inches for women. *p < 0.05, **p < 0.01, and ***p < 0.001 at chi-
square tests.

25
Table 2. Odds ratios of sedentary work for total obesity (BMI, ≥ 30 kg/m2) in US male (n=955)
and female (n=956) workers Sex Variables Model 1 Model 2a Model 3b
Men Sedentary work (middle) 1.18 (0.81-1.73) 1.32 (0.89-1.97) 1.60 (1.05-2.45)
Sedentary work (high) 1.18 (0.85-1.63) 1.53 (1.07-2.20) 1.53 (1.04-2.24)
Education (middle) 1.65 (1.14-2.37) 1.69 (1.15-2.50)
Education (low) 2.16 (1.47-3.17) 2.32 (1.52-3.53)
Any chronic diseases 1.56 (1.14-2.14)
Depression 0.44 (0.20-0.95)
Active leisure-time physical activity 0.66 (0.48-0.91)
Stress-induced overeating 4.83 (3.32-7.03)
Moderate alcohol consumption 0.71 (0.51-0.99)
Heavy alcohol consumption 0.27 (0.07-0.95)
Women Sedentary work (middle) 0.81 (0.54-1.22) 0.85 (0.55-1.31) 0.98 (0.62-1.55)
Sedentary work (high) 1.28 (0.93-1.77) 1.23 (0.87-1.75) 1.28 (0.87-1.87)
Job control (low) 1.28 (0.94-1.76) 1.01 (0.72-1.41)
Coworker support (low) 1.68 (1.21-2.33) 1.66 (1.16-2.36)
Working hours (> 40 hrs per week) 1.44 (1.04-2.01) 1.49 (1.04-2.13)
Race (non-whites) 2.54 (1.54-4.17) 2.78 (1.61-4.81)
Education (middle) 1.51 (1.04-2.18) 1.63 (1.09-2.43)
Education (low) 1.61 (1.09-2.39) 1.69 (1.09-2.62)
Any chronic diseases 1.81 (1.30-2.54)
Depression 1.25 (0.75-2.07)
Active leisure-time physical activity 0.59 (0.42-0.82)
Stress-induced overeating 3.19 (2.29-4.43)
Smoking 0.40 (0.24-0.65)
Moderate alcohol consumption 0.46 (0.33-0.65)
Heavy alcohol consumption 0.52 (0.13-2.06) aSources of subsamples, socio-demographic variables, and working conditions were controlled for. bCovariates in
Model 2 plus health status and health behaviors were additionally controlled for. Due to space limitations, the odds
ratios in the multivariate analyses were presented only for the covariates which were significant (p < 0.05) in the
univariate analyses or in Model 3.

26
Table 3. Odds ratios of sedentary work for central obesity (waist circumference, > 40 inches for
men and >35 inches for women) in US male (n=955) and female (n=956) workers Sex Variables Model 1 Model 2a Model 3b
Men Sedentary work (middle) 1.30 (0.90-1.88) 1.46 (0.98-2.15) 1.68 (1.11-2.53)
Sedentary work (high) 1.44 (1.05-1.97) 1.94 (1.36-2.76) 1.97 (1.36-2.85)
Marital status (vs. married) 0.65 (0.45-0.96) 0.67 (0.44-1.01)
Race (others vs. white) 1.68 (0.97-2.90) 1.77 (0.99-3.18)
Education (middle) 1.76 (1.23-2.51) 1.78 (1.22-2.58)
Education (low) 1.96 (1.34-2.86) 2.03 (1.36-3.04)
Any chronic diseases 1.61 (1.19-2.18)
Active leisure-time physical activity 0.60 (0.44-0.81)
Stress-induced overeating 3.26 (2.26-4.70)
Smoking 0.69 (0.44-1.10)
Moderate alcohol consumption 0.74 (0.54-1.02)
Heavy alcohol consumption 0.40 (0.14-1.18)
Women Sedentary work (middle) 0.70 (0.49-1.00) 0.76 (0.52-1.11) 0.82 (0.55-1.23)
Sedentary work (high) 1.06 (0.80-1.42) 1.12 (0.82-1.53) 1.18 (0.84-1.66)
Job control (low) 1.31 (0.99-1.72) 1.06 (0.79-1.44)
No immediate supervisors 0.45 (0.25-0.83) 0.52 (0.27-1.00)
Race (others vs. white) 1.99 (1.22-3.24) 2.12 (1.25-3.60)
Income (middle) 1.50 (1.06-2.12) 1.44 (0.99-2.11)
Income (low) 1.34 (0.91-1.98) 1.22 (0.80-1.87)
Education (middle) 1.30 (0.94-1.80) 1.32 (0.92-1.89)
Education (low) 1.52 (1.07-2.16) 1.48 (1.00-2.18)
Any chronic diseases 2.10 (1.56-2.83)
Depression 1.35 (0.85-2.15)
Active leisure-time physical activity 0.53 (0.40-0.72)
Stress-induced overeating 3.19 (2.36-4.29)
Smoking 0.63 (0.42-0.96)
Moderate alcohol consumption 0.61 (0.45-0.83)
Heavy alcohol consumption 0.77 (0.24-2.42) aSources of subsamples, socio-demographic variables, and working conditions were controlled for. bCovariates in
Model 2 plus health status and health behaviors were additionally controlled for. Due to space limitations, the odds
ratios in the multivariate analyses were presented only for the covariates which were significant (p < 0.05) in the
univariate analyses or Model 3.
27
Table 4 Odds ratios of sedentary work, physical job demands, and physical inactivity at work for
total (body mass index) and central obesity (waist circumference, > 40 inches for men and >35
inches for women) in US male (n=572) workers who worked more than 40 hours per week.
Frequency (%) Total obesity Central obesity
Sex Variables Model 3a Model 3a
Men Sedentary work (low) 29.9 1.00 1.00
Sedentary work (middle) 24.3 2.09 (1.18-3.71) 1.72 (0.99-2.99)
Sedentary work (high) 45.8 1.83 (1.06-3.13) 2.17 (1.30-3.63)
Physical job demand (low) 55.6 1.00 1.00
Physical job demand (middle) 24.3 1.19 (0.71-1.99) 0.75 (0.45-1.25)
Physical job demand (high) 20.1 0.64 (0.34-1.22) 0.32 (0.17-0.62)
Physical inactivity at work (low) 12.6 1.00 1.00
Physical inactivity at work (middle) 50.2 2.41 (1.17-4.98) 3.35 (1.57-7.15)
Physical inactivity at work (high) 37.2 2.20 (0.98-4.92) 4.39 (1.93-10.01) aSources of subsamples, socio-demographic variables, working conditions, health status, and health behaviors were
controlled for.
28
Appendix A : Psychosocial working condition variables
Skill discretion (2 items, response set: all of the time (1) to never (5))
How often does your job provide you with a variety of things that interest you?
How often do you learn new things at work?
Decision authority (3 items, response set: all of the time (1) to never (5))
How often do you have a choice in deciding how you do your tasks at work?
How often do you have a choice in deciding what tasks you do at work?
How often do you have a say in decisions about your work?
Job control = skill discretion + decision authority
Quantitative job demands (3 items, response set: all of the time (1) to never (5))
How often do you have to work very intensively -- that is, you are very busy trying to get
things done?
(How often) you have too many demands made on you.
(How often) you have enough time to get everything done. (Reversed for scoring)
Coworker support (2 items, all of the time (1) to never (5))
How often do you get help and support from your coworkers?
How often are your coworkers willing to listen to your work-related problems?
No coworker („does not apply‟ response in the below 2 items)
How often do you get help and support from your coworkers?
How often are your coworkers willing to listen to your work-related problems?
Immediate supervisor support (2 items, all of the time (1) to never (5))
How often do you get help and support from your immediate supervisor?
How often is your immediate supervisor willing to listen to your work-related problems?
No immediate supervisor support („does not apply‟ response in the below 2 items)
How often do you get help and support from your immediate supervisor?
How often is your immediate supervisor willing to listen to your work-related problems?
Related Documents