Security in Physical Distribution Networks A Survey study of Swedish transport operators Thesis for Doctorate in Engineering degree Luca Urciuoli Department of Industrial Management and Logistics Division of Engineering Logistics Lund University

Welcome message from author
This document is posted to help you gain knowledge. Please leave a comment to let me know what you think about it! Share it to your friends and learn new things together.
Transcript

Security in Physical Distribution Networks A Survey study of Swedish transport operators Thesis for Doctorate in Engineering degree Luca Urciuoli Department of Industrial Management and Logistics Division of Engineering Logistics Lund University

Security in Physical Distribution Networks - A Survey study of Swedish transport operators © Luca Urciuoli Department of Industrial Management and Logistics Engineering Logistics Lund University Box 118 SE – 221 00 Lund SWEDEN ISRN LUTMDN/TMTP--1049--SE ISBN 978-91-976974-5-3 Printed by Media Tryck Lund 2010 This research has been financed by Vinnova, the Swedish Governmental Agency for Innovation Systems and NGIL, Next Generation Innovative Logistics, which is a VINN Excellence Center based at Lund University.

Acknowledgements Many logistics and security professionals, security organizations and researchers have helped me
to overcome the obstacles encountered during my research. Ironically, for security reasons, I
cannot mention all of them, but I hope they will feel my gratitude whenever they will encounter
familiar comments, concepts and analytical reasoning in the report.
First of all, I would like to thank the Secureflow consortium, Vinnova and Next Generation
Innovative Logistics centre for financing this report. My gratitude goes also to my supervisors
Professor Sten Wandel, Professor Andreas Norrman and Assistant Professor Henrik Tehler.
Thank you for your inestimable reviews, comments, criticism and opinions that helped me make
this work better. I would also like to thank Lars Ringström and in particular Siv Ringtröm and
Mats Wicktor at the Swedish Customs, Martin Nyberg at SAAB Security, Bertil Lindh and Jonas
Pehrson at IF insurances, Per-Arne Nilsson, police detective at the Swedish law enforcement
agency in Västra Götaland, Daniel Ekwall, Lecturer at the Universtiy of Borås and the board of
directors of TAPA EMEA. Thank you all for the significant support and collaboration given to
my research.
I would like to thank, Professor Håkan Torstensson, University of Borås, and Associate
Professor Antony Paulraj, University of North Florida, for their reviews on a preliminary version
of this study.
I am grateful to my supervisors as well as to Professor Kenth Lumsden for allowing me to spend
the last period of my research at the Division of Transport and Logistics Management of
Chalmers University of Technology. I am also thankful to all my colleagues at the Division of
Engineering Logistics: Ala, Ali, Anita, Carina, Fredrik, Hana, Joakim, Johan, Kostas, Laila,
Mikael and Robert, thank you for making me feel welcome and for helping me with my research.
Finally my greatest gratitude goes to my family, my wife Frida whose help and support has been
fundamental to complete this study and to my children, Matteo and Livia. This report is
dedicated to all you.
Abstract The objective of this study is to understand what factors influence the security of physical
distribution networks. Thereafter it aims to bring to light what security measures exist today to
enhance security and finally how to determine the profitability of security investments.
Eight stakeholders affecting security in physical distribution networks are identified and
combined into a Physical Distribution Security System (PDSS): the law enforcement agency,
transport and distribution operators, business security certifications, insurance companies,
security providers, cargo criminals, contract regulatory associations and authority. The actions of
these actors on security are formulated in terms of 19 hypotheses in which factors as criminal
prosecution, law enforcement agencies resource allocation, willingness to pay for security,
impact of business and authority security certifications, premium discounts etc., are put into
relation with the security of distribution companies. The tenability of the hypotheses is tested by
means of a survey study sent to 577 physical carriers based in Sweden (response rate 36.4%). By
means of multivariate statistical techniques, 9 of the 19 hypotheses are rejected determining the
exclusion from the PDSS of the business and authority certifications (AEO). The hypotheses that
were considered tenable confirm the following factors as significantly affecting the magnitude of
security investments as well as the number of security incidents:
• Prosecution of criminals. Companies perceiving that criminals are not properly
prosecuted by the Swedish courts of justice have lower security investments and are more
affected by security incidents.
• Law enforcement agency resource allocation. Companies perceiving that the Swedish law
enforcement agency is not allocating enough resources to mitigate cargo crime have
lower security investments and are more affected by security incidents.
• Collaborative activities. Companies participating to collaborative activities to benchmark
security or start security partnerships and initiatives have higher security investments and
are affected by a fewer number of security incidents.
• Just in Time. Companies perceiving that the enhanced safeguard of cargo may corrupt
Just In Time operations and deliveries have lower security investments and are more
affected by security incidents.

• Premium discounts. Companies that receive premium discounts whenever security
solutions are implemented have higher security investments and are less affected by
security problems.
• Uncertainty of security prototypes. Companies that have too many doubts about new and
more advanced security products and especially their integration in existing IT systems
and business processes have lower security investments and are more affected by security
incidents.
• The criminals’ opportunistic behavior. Companies fearing the opportunistic behavior of
criminals that have access to technical and economical resources and may learn how to
deceive security solutions have lower security investments and are more affected by
security problems.
• Security requirements agreements. Companies that experience difficulties in the process
to agree on security measures to be applied within a transport assignment and thereafter
to be specified in the transport contract have lower security investments and are more
affected by security incidents.
• Contract complexity. Companies that experience the bureaucracy related to transportation contract agreements as too complex have lower security investments and are more affected by security problems.
• Risk sharing. Companies that do not share risks in transport contract agreements have
lower investments and are affected by a higher number of security incidents.
Examining previous research we found that many of these factors are still unknown to the supply
chain and logistics academic field (prosecution of criminals, resource allocation, collaborative
activities, uncertainty of security prototypes, contract complexity). Other factors as the
specification of security requirements in contract agreements, JIT and the cargo criminals’
behaviors are confirmed. Other as the length of distribution networks, conflicts with logistics
performance and willingness to pay are rejected. Finally the role of the authority is also
mentioned in previous research. However this study doesn’t show significant relationships with
the security of transportation companies. In particular, the findings reveal that transportation
companies in Sweden that are AEO compliant have higher security budget but still a higher
number of security incidents.
To facilitate the choice of security measures and determine their impact on security threats, this
study proposes two approaches: a multi-layered logistics framework and an investment model
based on experts’ judgments, quantitative risk assessment and Reliability Block Diagram
techniques. The multi-layered logistics framework describes supply chains as split into six layers
where security measures may be applied. The framework may be used by managers to
qualitatively identify weak spots and related countermeasures in supply chains. Finally,
quantitative risk assessment combined with Reliability Block Diagrams and Monte Carlo
techniques are exploited to give an example of how to compare costs and benefits, in the form of
risk reductions, of technical security systems for road transport operations (i.e. GPS, RFID, e-
seals etc.) against cargo theft.
Keywords: supply chain security, physical distribution security, cargo security, transportation security, Quantitative Risk Assessment, cargo theft, antagonistic threats.

Abstrakt Syftet med denna studie är att förstå vilka faktorer som påverkar säkerheten i fysisk distribution
(d.v.s. godstransporter). Den belyser vidare vilka säkerhetsåtgärder som finns idag för att öka
säkerheten samt slutligen hur man kan fastställa lönsamheten för säkerhetsinvesteringar.
Åtta aktörer som påverkar säkerheten i fysisk distribution identifieras och dessa kombineras till
ett säkerhetssystem för fysisk distribution (PDSS) : brottsbekämpande myndigheter, transport-
och distributionsoperatörer, verksamhets- och säkerhetscertifieringsföretag, försäkringsbolag,
säkerhetsleverantörer, transportbrottslingar, avtalsreglerande företag och tullverket. Dessa
aktörers agerande definieras i 19 hypoteser där faktorer som åtal av transportbrottslingar, de
brottsbekämpande myndigheternas insatser, varuägarnas vilja att betala för säkerhet, resultat av
företagens och tullverkets säkerhetscertifieringar, rabatter på försäkringspremier etc., sätts i
förhållande till distributionsföretagens säkerhetsarbeten och säkerhetsnivåer. Hypotesernas
hållbarhet har testats i en enkätstudie som besvarats av 210 transportföretag i Sverige
(svarsfrekvens 36.4%). Studien visar, med hjälp av multivariata statistiska metoder, att 9 av de
19 hypoteserna förkastades. Därför uteslöts aktörerna som är ansvariga för företags och
tullverkets säkerhetscertifieringar (AEO) från ramverket PDSS. De hypoteser som ansågs
hållbara bekräftade följande faktorer som väsentligt påverkar omfattningen av
säkerhetsinvesteringar, liksom antalet säkerhetsincidenter:
• Åtal mot brottslingar. De företag som uppfattar att brottslingar inte åtalas och döms på ett
korrekt sätt av de svenska domstolarna investerar mindre i säkerhet och har högre antal
säkerhetsincidenter.
• De brottsbekämpande myndigheternas insatser. De företag som upplever att de
brottsbekämpande myndigheterna inte tilldelar tillräckliga resurser för att bekämpa
problemet investerar mindre i säkerhet och har högre antal säkerhetsincidenter.
• Samarbetsaktiviteter som organiseras av de brottsbekämpande myndigheterna. De företag
som deltar i samarbetsaktiviteter för att jämföra säkerheten och starta säkerhetsinitiativ
och partnerskap investerar mindre i säkerhet och har ett färre antal säkerhetsincidenter.
• Just In Time (Just In Time tankesätt av transportföretag). De företag som uppfattar att det
förstärkta godsskyddet kan påverka Just In Time operationer och leveranserna negativt
investerar mindre i säkerhet och har ett högre antal säkerhetsincidenter.

• Rabatter på försäkringspremier. De företag som inte erbjuds premierabatter från
försäkringsbolag när säkerhetslösningar införs investerar mindre i säkerhet och har ett
högre antal säkerhetsincidenter.
• Osäkerhet kring nyttan av nya säkerhetsprodukter. De företag som har alltför många
tvivel om nya och mer avancerade säkerhetsprodukter och speciellt deras integration i
befintliga IT-system och affärsprocesser investerar mindre i säkerhet och har högre antal
säkerhetsincidenter.
• De kriminellas opportunistiska beteende. De företag som fruktar brottslingarnas
opportunistiska beteende, det faktum att brottslingarna har tillgång till tekniska och
ekonomiska resurser och att de snabbt kan lära sig hur man lurar säkerhetslösningar
investerar mindre i säkerhet och har högre antal säkerhetsincidenter.
• Identifiering av säkerhetskrav i transportavtal. De företag som upplever svårigheter med
processen att komma överens med avsändare, mottagare och serviceleverantörer om
skyddsåtgärder som skall tillämpas vid ett specifikt transportuppdrag och därefter
precisera dessa i transportavtalet, investerar mindre i säkerhet och har högre antal
säkerhetsincidenter.
• Transportavtalens komplexitet. De företag som upplever byråkratin som krävs för att
sätta ihop transportavtal som alltför komplex investerar mindre i säkerhet och har högre
antal säkerhetsincidenter.
• Riskdelning. De företag som inte delar risker med avsändare, mottagare eller
serviceleverantörer i transportavtalet investerar mindre i säkerhet och har högre antal
säkerhetsincidenter.
I tidigare forskning fann vi att många av dessa faktorer fortfarande är okända i den akademiska
världen (åtal mot brottslingar, resursfördeling, samarbetsaktivitieter, osäkerheten kring nya
säkerhetsprodukter, kontraktkomplexitet och riskdelning). Några av de faktorer som tidigare
föreslagits i den akademiska litteraturen såsom specifikation av säkerhetskrav i transportavtal,
JIT, och de kriminellas opportunistiska beteende, bekräftas. Andra faktorer som rör längden av
distributionskedjor, logistikeffektivitet och betalningsvilja avslås. Slutligen nämns också vikten
av tullens säkerhetscertifiering (AEO) i tidigare forskning. Denna studie visar dock att det inte
finns några signifikanta samband mellan AEO-certifiering och säkerhet i distributionskedjor.

Tvärtom visar resultaten att transportföretag i Sverige som är AEO-certifierade har högre
säkerhetsbudget och samtidigt större antal säkerhetsincidenter.
För att underlätta valet av säkerhetsåtgärder och förutsäga deras inverkan på säkerhetshot,
föreslår denna studie två modeller: en logistisk referensram i flera lager och en
investeringsmodell som bygger på kvantitativ riskbedömning och Reliability Block Diagram-
tekniker som används inom vetenskapsgrenar såsom säkerhet och risk management.
Referensramen beskriver försörjningskedjor som delats upp i sex nivåer där olika skyddsåtgärder
tillämpas på varje nivå. Ramverket kan användas för att identifiera svaga punkter och relaterade
motåtgärder i försörjningskedjor på ett kvalitativt sätt. Slutligen utnyttjas kvantitativ
riskbedömning i kombination med Reliability Block Diagrams och Monte Carlo-teknik vilket
illustreras i ett exempel där kostnader och nytta i form av riskreduktion för olika tekniska
säkerhetssystem för vägtransporter (t.ex. GPS, RFID, e-seals etc.) mot stöld av last jämförs.
Nyckelord: risker i försörjningskedjor, säkerhet i fysisk distribution, fraktsäkerhet, transportsäkerhet, kvantitativ riskbedömning, godsstölder, antagonistiska hot.

Populärvetenskaplig sammanfattning
Antagonistiska hot mot godstransporter och logistik såsom stölder, smuggling, förfalskningar
och terroristaktiviteter utgör ett stort och ofta förbisett problem. Bara i Sverige beräknas stölder
under transport kosta samhället ca 1 miljard kronor årligen. Denna avhandling visar att många
svenska transportföretag trots detta inte investerar i lösningar för att förbättra skydd av gods mot
sådana hot. Transportföretagen i allmänhet, och i synnerhet de med lägre säkerhet tenderar att:
1. uppfatta att brottslingar inte åtalas och döms på ett korrekt sätt av de svenska domstolarna.
2. uppleva att de brottsbekämpande myndigheterna inte tilldelar tillräckliga resurser för att bekämpa problemet.
3. inte delta i samarbetsaktiviteter för att jämföra säkerhet och starta säkerhetsinitiativ och partnerskap.
4. prioritera Just In Time verksamheter och leveranser snarare än att skydda godsets integritet.
5. inte erbjudas premierabatter från försäkringsbolag när säkerhetslösningar införs.
6. ha alltför många tvivel om nya och mer avancerade säkerhetsprodukter och speciellt deras integration i befintliga IT-system och affärsprocesser.
7. frukta brottslingarnas opportunistiska beteende och det faktum att de har tillgång till tekniska och ekonomiska resurser och att de snabbt kan lära sig hur man lurar säkerhetslösningar.
8. uppleva svårigheter med processen att komma överens med avsändare, mottagare och serviceleverantörer om skyddsåtgärder som skall tillämpas vid ett specifikt transportuppdrag och därefter precisera dessa i transportavtalet.
9. uppleva byråkratin som krävs för att sätta ihop transportavtal som alltför komplex.
10. inte dela risker med avsändare, mottagare eller serviceleverantörer i transportavtalet.
I tidigare forskning fann vi att många av dessa faktorer fortfarande är okända i den akademiska
världen, såsom åtal mot brottslingar, resursfördelning, samarbetsaktiviteter, osäkerheten kring
nya säkerhetsprodukter, kontraktkomplexitet och riskdelning. Två av de faktorer vilka tidigare
föreslagits i den akademiska litteraturen, som bestämmande för säkerhetskraven i transportavtal,
bekräftas: JIT och de kriminellas opportunistiska beteende. Andra föreslagna faktorer: att risken

ökar med distributionskedjans längd, att säkerhetsåtgärder är i konflikt med logistikeffektivitet
och att kunderna inte är villiga att betala för extra säkerhet avslås. Slutligen nämns också vikten
av tullens säkerhetscertifiering (AEO) i tidigare forskning. Denna studie visar dock att
transportföretag i Sverige som är AEO-certifierade har högre säkerhetsbudget, men trots detta
har de ett större antal säkerhetsincidenter än genomsnittet.
Denna forskning visar också att, för att eliminera svaga punkter i distributionsnät, är det viktigt
att stärka godsskyddet genom att kombinera olika säkerhetslösningar i form av
managementstrategier, tekniska lösningar, operativa rutiner och säkerhetscertifieringar på sex
dimensioner: 1) supply chain management, 2) IT infrastruktur, 3) alla noder och länkar i kedjan
från råvaruleverantörer till slutkonsumenter, 4) fordonet, 5) trailern/containern,
primärförpackningen och sekundärförpackningen, och 6) produkten, samt att variera
skyddsåtgärderna över tiden. Tillämpning av detta flerdimensionella ramverk skulle förbättra
möjligheterna för distributionsföretagen att förebygga, upptäcka och återhämta sig efter
säkerhetsincidenter på ett kostnadseffektivt sätt.
Slutligen visar undersökningen att lönsamheten för säkerhetslösningar bör beräknas som en
avvägning mellan deras kostnader och hur de minskar säkerhetshotens förväntade konsekvenser.
I synnerhet visas hur enkla säkerhetslösningar som mekaniska lås, inbrottslarm för trailers som
avger ett kraftigt ljud eller hårda skåp i stället för presenning på lastbilssläp kan vara lönsamma
investeringar. Däremot är vissa säkerhetsåtgärder, som starkt kan minska godsbrottslighet,
fortfarande för dyra och därför inte lönsamma (om enbart förväntad minskning av stölder räknas
in). Speciellt gäller detta säkerhetslösningar baserade på Radio Frequency Identification (RFID)
och angränsande tekniker som ger den mest effektiva minskningen av säkerhetshoten under
vägtransport, men som inte är lönsamma investeringar (såvida inte nyttan med
realtidsinformation för optimering av lager och transportresursernas utnyttjande räknas in).
Resultaten från denna studie kan användas på olika sätt. Först och främst kan förståelsen av de
faktorer som påverkar transportföretagens säkerhet stimulera utvecklingen av nya certifieringar
och förordningar som uppmuntrar till att öka säkerheten i svenska distributionsnätverk. Därefter
kan det flerdimensionella ramverket användas för att identifiera svaga punkter och se till att alla
aktörers anläggningar och tillgångar i distributionsnätverken är skyddade på ett balanserat och
kostnadseffektivt sätt. Slutligen kan den metod för beräkning av lönsamheten för investeringar i

säkerhetslösningar som utvecklats i studien utnyttjas av bolag 1) för att fastställa de mest
lönsamma säkerhetslösningarna, 2) för att enas om rabatter på försäkringspremier, 3) för att
komma överens om ökning av fraktpris och 4) för att enas om vilket skydd som skall anges i
transportavtal.
Förstärkningen av skydd i distributionsnätverken kan bidra till att minska de ekonomiska
förluster som idag bärs av industriella aktörer, inklusive producenter, handels- och
distributionsföretag, och Skatteverket eftersom handel med stöldgods och smuggling innebär
förlust av skatteintäkter. Dessutom bör konsekvenserna för samhället inte försummas.
Antagonistiska aktiviteter som stöld, smuggling, förfalskning etc. finansierar tillväxten av
kriminella organisationer och även terrorism i våra samhällen. Det är väl känt att höga nivåer av
kriminalitet bidrar till samhällelig degradering och hindrar ekonomisk utveckling. Slutligen kan
bristen på skydd av distributionsnätverk innebära en högre sårbarhet för terrordåd, i form av
smuggling av komponenter för bomber och massförstörelsevapen, eller förgiftning eller
förfalskning av livsmedel och läkemedel. Enbart förfalskade läkemedel anses medföra att
närmare 1 miljon människor dör i världen varje år.
Denna studie visar att logistikföretag ofta saknar kunskap om grundläggande säkerhetskrav och
säkerhetsåtgärder. Ett syfte med denna undersökning var att identifiera och vetenskapligt visa
vilka faktorer som är nödvändiga för att stimulera transportföretagen att förbättra sin säkerhet.
Mer specifikt visas, med hjälp av en enkätstudie som skickats till 577 transportföretag i Sverige
(svarsfrekvens 36,4%) och vars svar analyserats med multivariata tekniker, att de inledningsvis
beskrivna 10 faktorerna påtagligt påverkar säkerheten.
Samtidigt är det väl känt att "en försörjningskedja inte är säkrare än den svagaste av sina
länkar". Den flerdimensionella referensramen i denna undersökning syftar till att stödja
beslutsfattare med att identifiera de svaga punkterna i försörjningskedjorna och därefter hitta de
mest lämpliga säkerhetslösningarna. Denna del av studien genomfördes med hjälp av
litteraturstudier och en enkät som skickats till en panel av svenska säkerhetsexperter. Till sist,
många experter anser att säkerhetslösningarnas lönsamhet inte kan beräknas på grund av bristen
på statistiska uppgifter avseende deras inverkan på säkerhetshoten. Tvärtom visar denna
undersökning, att med hjälp av kvantitativa metoder som använder expertbedömningar och
Monte Carlo-simulering, kan tillförlitliga investeringskalkyler tas fram.

Table of Contents 1 Introduction ............................................................................................................................. 1
1.1 Background ...................................................................................................................... 1
1.2 Consequences of Security Incidents ................................................................................. 3
1.3 Research Problem ............................................................................................................. 5
1.4 Research Purpose ............................................................................................................. 7
1.5 Delimitations .................................................................................................................... 7
1.6 Thesis Disposition ............................................................................................................ 8
2 Licentiate Summary ............................................................................................................... 11
2.1 Research Questions and Purpose .................................................................................... 11
2.2 RQ1. What are the fundamental stakeholders and interactions within and outside physical distribution systems from a security perspective? ...................................................... 12
2.2.1 Methodology ........................................................................................................... 13
2.2.2 Findings................................................................................................................... 14
2.3 RQ2. What mitigation measures can be implemented today to enhance the security of physical distribution operations? ............................................................................................... 16
2.3.1 Methodology ........................................................................................................... 16
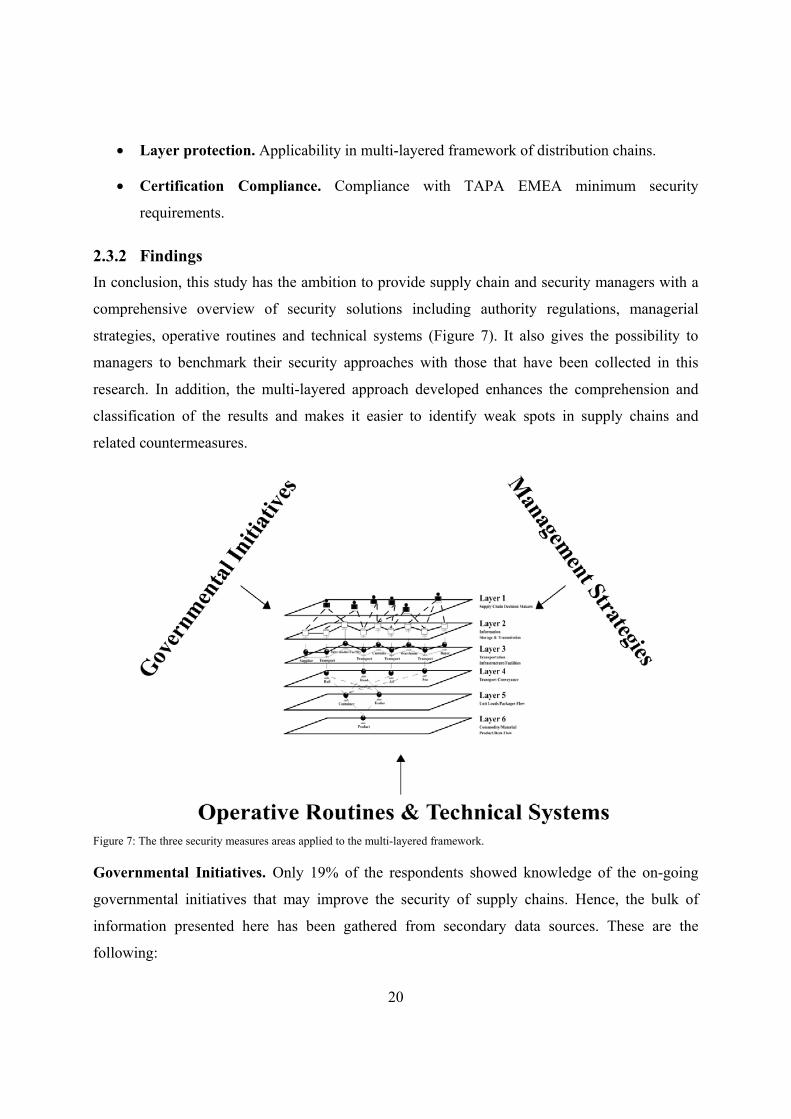
2.3.2 Findings................................................................................................................... 20
2.4 RQ3. How can existing investment and risk models be exploited to estimate the performance of security solutions and support investment decisions? ..................................... 24
2.4.1 Application of QRA Approach ............................................................................... 24
2.4.2 Methodology ........................................................................................................... 24
2.4.3 Findings................................................................................................................... 28
2.4.4 Implementation of Reliability Block Diagrams ...................................................... 32
2.4.5 Method Development .............................................................................................. 34
2.4.6 A numerical Example ............................................................................................. 35
2.4.7 Conclusion .............................................................................................................. 39
2.5 Criticism of Licentiate Study ......................................................................................... 40
3 Literature review.................................................................................................................... 42
3.1 Recommendations to Enhance Security ......................................................................... 42
3.2 Factors Influencing Security .......................................................................................... 44
3.3 Security Impacts ............................................................................................................. 45
3.4 Research Agendas .......................................................................................................... 45
3.5 Supply Chain Risk Management .................................................................................... 46
3.6 Conclusion ...................................................................................................................... 48

4 Research Hypotheses ............................................................................................................. 49
4.1 Introduction .................................................................................................................... 49
4.2 Law Enforcement Agency .............................................................................................. 50
4.3 Distribution and Transport Operators ............................................................................ 52
4.4 Business Security Certifications ..................................................................................... 55
4.5 Insurance Companies ..................................................................................................... 56
4.6 Security Providers .......................................................................................................... 57
4.7 Cargo Criminals ............................................................................................................. 59
4.8 Contract Regulatory Associations .................................................................................. 60
4.9 Authority ........................................................................................................................ 63
5 Methodology .......................................................................................................................... 66
5.1 Research Approach ........................................................................................................ 66
5.2 The Explorative Study .................................................................................................... 67
5.3 Literature Review ........................................................................................................... 67
5.4 The Survey ..................................................................................................................... 68
5.4.1 Stage 1 - Survey First Draft and Planning .............................................................. 70
5.4.2 Stage 2-3 – Pretesting and Final Survey Design ..................................................... 74
5.4.3 Stage 4 - Data Collection ........................................................................................ 94
5.4.4 Stage 5 - Data Analysis ........................................................................................... 95
5.4.5 Survey Validity and Reliability .............................................................................. 98
6 Analysis ............................................................................................................................... 101
6.1 Descriptive Statistics .................................................................................................... 101
6.2 Law Enforcement Agency ............................................................................................ 113
6.2.1 Factor and Reliability Analysis ............................................................................. 113
6.2.2 H1a – Criminal Prosecution .................................................................................. 115
6.2.3 H1b - Resource Allocation .................................................................................... 118
6.2.4 H1c - Involvement in Collaborative Activities ..................................................... 120
6.3 Distribution and Transport Operators .......................................................................... 122
6.3.1 Factor and Reliability Analysis ............................................................................. 122
6.3.2 H2a. Willingness to Pay ........................................................................................ 124
6.3.3 H2b – Just In Time ................................................................................................ 126
6.3.4 H2c – Length of Distribution Network ................................................................. 128
6.3.5 H2d – Performance ............................................................................................... 130
6.4 Business Security Certifications ................................................................................... 131
6.5 Insurance Companies ................................................................................................... 131
6.5.1 Factor and Reliability Analysis ............................................................................. 131
6.5.2 H4a – Insurance Coverage .................................................................................... 134
6.5.3 H4b – Premium Discounts .................................................................................... 135
6.6 Security Providers ........................................................................................................ 137
6.6.1 Factor and Reliability Analysis ............................................................................. 137
6.6.2 H5a. Uncertainty of Security Prototypes .............................................................. 140
6.6.3 H5b. Security Expensiveness ................................................................................ 142
6.7 Criminals ...................................................................................................................... 143
6.7.1 Factor and Reliability Analysis ............................................................................. 143
6.7.2 H6. Perception of Opportunistic Behavior............................................................ 144
6.8 Contract Regulatory Associations ................................................................................ 147
6.8.1 Factor and Reliability Analysis ............................................................................. 147
6.8.2 H7a. Security Requirements Agreements ............................................................. 150
6.8.3 H7b. Contract Complexity .................................................................................... 152
6.8.4 H7c. Risk Sharing ................................................................................................. 154
6.8.5 H7d. Security Requirements Specification ........................................................... 156
6.9 Authority ...................................................................................................................... 158
6.9.1 Factor and Reliability Analysis ............................................................................. 158
6.9.2 H8a. AEO Compliance ......................................................................................... 159
6.9.3 H8b. AEO Security and Efficiency Impacts ......................................................... 160
7 Discussion ............................................................................................................................ 163
7.1 Research Results .......................................................................................................... 163
7.2 Law Enforcement Agency ............................................................................................ 165
7.3 Distribution and Transport Operators .......................................................................... 166
7.4 Business Security Certifications ................................................................................... 168
7.5 Insurance Companies ................................................................................................... 168
7.6 Security Providers ........................................................................................................ 169
7.7 Cargo Criminals ........................................................................................................... 170
7.8 Contract Regulatory Associations ................................................................................ 170
7.9 Authority ...................................................................................................................... 171
8 Conclusion ........................................................................................................................... 173
8.1 Findings Summary ....................................................................................................... 173
8.2 Research Limitations .................................................................................................... 179

8.3 Research Contribution .................................................................................................. 182
8.4 Practical Contribution .................................................................................................. 185
8.5 Future Research ............................................................................................................ 188
REFERENCES ........................................................................................................................... 191
APPENDIX 1 – Glossary and Abbreviations ............................................................................. 199
APPENDIX 2 – Interview Questions ......................................................................................... 201
APPENDIX 3 – Swedish Business Register ............................................................................... 202
APPENDIX 4 – The Survey (Swedish) ...................................................................................... 205
APPENDIX 5 – The Survey (English) ....................................................................................... 221
1
1 Introduction
This chapter includes a background in which the security problem in physical distribution networks is
described. Further, it formulates the research problem, the research question and the purpose of the
study. Finally, the delimitations and the thesis’ disposition are illustrated.
1.1 Background Supply chain security is becoming a more and more important challenge for managers
(especially security managers) and national authorities (Voss et al., 2009; Voss et al., 2009;
Thibault et al., 2006, Autry and Bobbitt, 2008; Sheffi, 2001; Williams et al., 2009). Statistics
report the existence of several criminal activities affecting global supply chains (Ekwall, 2009;
Anderson, 2007; European Parliament, 2007; OECD, 2007; IMB, 2009). The magnitude of the
frequency of security incidents as well as of the related consequences are so incredibly high
(Voss et al., 2009a; Elkins et al., 2005; Ekwall, 2009) that many supply chain firms have
indicated “security” as one of their management top priorities (Thomas, 2006). In addition, it is
well known that the figures publicly reported by firms may hide the real magnitude of the
phenomenon; because of the negative effects it may have on the brand image of the
organizations involved (Ekwall, 2009).
In this report physical distribution networks are interpreted as the facilities and infrastructure
necessary to ensure the movement, through wholesaling and retailing distribution channels, of
finished products to end consumers (Hesse and Rodrigue, 2004). Typical activities performed are
inventory control, materials handling, packaging, order processing, transportation, warehouse
site selection etc. (ibid). The term “security” generally refers to “the state of being free or
protected against danger or threat” and it is usually related to threats that are perpetrated
voluntarily against a target (Inglese Hazon, 2008). One part of security includes “safety” with the
difference that “security” includes those threats that are intentionally performed on a target,
while safety is based mostly on operational accidents and relates often to a potential damage to
society and its individuals. ISO (2008) proposes a definition of supply chain security covering all
the efforts to enhance the security of people and cargo in the supply chain against such
antagonistic threats as terrorism, fraud and piracy (ISO, 2008).

2
Hence, given the interpretation of physical distribution networks as well as of security incidents,
the expression used in this report “Security in Physical Distribution Networks” is associated to
the following definition:
“The state of cargo moved within physical distribution networks of being protected against
voluntarily attacks such as terrorism, theft, fraud, piracy, counterfeiting etc.”
The security incidents considered in this study are those taking place in distribution networks,
where products, components or raw materials are temporarily stored or moved between
companies that are part of supply chains (networks of buyers and suppliers). Hence, all attacks
deliberately perpetrated against cargo at nodes (i.e. intermodal terminals, storage warehouses,
etc.) and links (road, water, rail and air transportation) of the physical distribution network.
Typical security incidents may include theft, smuggling, piracy, counterfeiting of the cargo or
terror and contamination (sabotage actions) (ISO, 2008; Voss et al., 2009a; Coghlan, 2006;
Rodwell et al. 2007; EU Commission, 2008; European Parliament, 2007).
Theft. Products are stolen from distribution facilities or while transported to their destination
(Thibault et al., 2006). According to statistics collected from TAPA EMEA in 2006, the most
exploited modus operandi are: 23% burglary (breaking into a building or into a terminal area or a
container), 2% fraud, or robbery (3%), where operators, by means of force, threat or
intimidation, are coerced to hand over the cargo stored at a facility or while being transported.
Hijacking is also a technique used to take over the vehicle and its cargo (7%) (TAPA EMEA,
2009).
Smuggling. Drugs, humans, nuclear weapons or terrorists are smuggled in containers to enter US
or Europe. Stowaways and smuggling in containers take place often on the routes travelled by
trucks in high risk countries like South Africa, Morocco, Tanzania, Algeria, West Africa, Eastern
Europe, Colombia and China. Containers are penetrated either when they are accidentally left
open or by forcing seals and locks put on the doors (Mason, 2004). It seems that in 2002,
between 75 and 125 operatives belonging to the terror network of Al Qaeda infiltrated the United
States through containers (ibid). These events pose a threat to national security and social order
but also an economic burden to owners of containers or vessels (Chen et al., 2005; Mason, 2004;
Thibault et al., 2006).

3
Piracy (Ship Hijacking). Products or raw materials in cargo or bulk ships are today being
hijacked and exchanged for money. This scenario is typical of maritime transportation, where
ships transporting all sorts of cargo are being hijacked by pirates and exchanged for money.
According to available statistics, the number of ships attacked during the first quarter of 2009
almost doubled, if compared to 2008 (IMB, 2009). The economical losses for shipping
companies are enormous. The ransoms alone vary between $2 and $5 million (ibid). However,
other costs related to the capital tied up (i.e. perishable goods or high value goods), consultancy
(lawyers, security officers, etc.), the resources tied up, the fuel wasted by pirates, the operations
to pay the ransom, may double the losses borne by the shipping companies.
Counterfeiting. Fake products, with low cost and quality, may appear in the end of supply
chains because purchased either voluntarily or involuntarily by a consignee (OECD, 2007).
Illegal entities are able to infiltrate a distribution chain, conduct trading and bidding with
potential buyers and finally sell fake products at competitive prices. The fake products could be
illegally produced from original suppliers that are running manufacturing operations outside the
scheduled time without the knowledge of the consignee. In other cases illegal industries are able
to manufacture products with the same appearance as the originals but of lower quality (ibid).
Contamination. Products or raw materials, such as chemical substances, food or
pharmaceuticals, that are moved in distribution chains can be deliberately contaminated or
poisoned by terrorists or saboteurs. Examples are given by the anthrax attack in US in 2001 that
injured 17 persons and killed 5 (FBI, 2009), but also the contamination of citrus fruits exported
from Israel in 2003 (CFSAN, 2003), E-coli contaminated spinach in US (Voss et al., 2009) and
glass contaminated chicken fillets in Sweden 2009 (Krisinformation, 2009).
1.2 Consequences of Security Incidents The direct costs of security incidents concern first of all the value of the goods, if these are
damaged, stolen, substituted or contaminated. Available figures show that stolen cargo in US
amounts to $10 to $30 billion and in Europe to about €8.2 billion (Anderson, 2007; European
Parliament, 2007). It has also been estimated that in Europe alone $176 billion of goods where
counterfeited in 2005 (OECD, 2007).
In addition to the direct costs, companies may also experience the economic consequences
related to flow disruptions (Voss et al., 2009a). The consequences of flow disruptions may have

4
a high magnitude and are directly proportional to the degree of Just In Time and globalization of
a supply chain, i.e. the degree of tightness and length of supply chains (Abbott et al., 2003;
Crone, 2006). Security incidents taking place in the physical distribution layer often spread from
the physical carrier or terminal owner, upward to the logistics service providers and thereby to
the whole supply chain network. At this level, a chain reaction that forces the supply chain into
temporary irrecoverable shut down is triggered, and it ends in delays, lost sales and unsatisfied
customer demand (Viswanadham and Gaonkar, 2007). Other indirect costs of flow disruptions
that are related to the lack of implementation of security are the following (Hess and Wrobleski,
1996; Voss et al., 2009a; Voss et al., 2009):
• Increased costs of insurance and security protection.
• Costs of internal audit activities to detect crime.
• Costs of investigation and prosecution of suspects measured in terms of lost time of security and management personnel.
• Increased selling prices and weakened competitive advantage.
• Reduced profits.
• Loss of productivity.
• Loss of business reputation.
• Deterioration in quality of service.
• Threat to the survival of the business.
Terror related threats in supply chains may also put society in danger, e.g. environmental
contamination, leaks of toxic gases, population exposure or infrastructure damage (Parentela and
Cheema, 2002; Sheffi, 2001). Likewise, if supply chains are not adequately protected,
consumable products (e.g. food, pharmaceuticals) could be counterfeited or contaminated and
smuggled into a country, giving rise to death or diseases (Thibault et al., 2006; Voss et al., 2009).
These events should not be seen as remote from reality, especially after the whole world has
witnessed the terror attacks in New York 2001, London 2004 and Madrid 2005. Since these
attacks were performed against transportation means, the linkage with supply chains is
straightforward and the hypothesis that distribution networks could be targeted by terrorists (e.g.
5
Al-Qaeda) should not be seen as unrealistic (Sheffi, 2001). This explains the motivations behind
the development of certifications aiming to enhance the security of distribution networks. Hence,
logistics and transportation managers are required to link their supply chain processes and
operations to security requirements. If this is not properly done there is not only the risk to be
attacked by antagonists but also to jeopardize supply chains and terribly increase transport delays
and delivery uncertainty (Willys and Ortiz, 2004; Peleg-Gillai et al., 2006; Rice and Spayd,
2005; Lee and Whang, 2005; Closs and McGarrell 2004; Sheffi, 2001). Some of the most
prominent authority certifications available to stakeholders are the following:
• The Authorized Economic Operator (AEO). Operators are requested to prove
compliance with Customs requirements, appropriate record-keeping, and financial
solvency, and to follow specific safety and security regulations (CP3 Group, 2005; CP3
Group, 2006). The compliance with the requirements ensures quick customs clearance.
• The Customs-Trade Partnership against Terrorism (C-TPAT). This certification
includes a set of security criteria to be followed by supply chain operators to enhance
their security degree. The compliance to the security criteria ensures faster border
inspections and customs’ clearance (CBP, 2008).
• International Organization for Standardization (ISO). Recommendations and
guidelines about the application of security systems and harmonization of operations
among players in supply chains by means of security standards are given in the ISO28001
certification. Parts of the recommended security standards have been integrated into the
AEO (ISO, 2008).
• International Ship and Port Security (ISPS) and SOLAS. The ISPS is a framework to
ensure the safety and security of ports and vessels. Guidance to support compliance to the
mandatory security requirements specified in the ISPS code is provided in the SOLAS
(International Convention for the Safety of Life at Sea) Chapter XI-2 (IMO, 2009).
1.3 Research Problem Today security, logistics and supply chain managers have wide access to handbooks and
certification programs, to enhance the protection of their assets. Technology is at the forefront
and offers wide sets of devices to hinder criminals from attacking cargo (Sheffi, 2001; Urciuoli,
2009). In addition, organizations often have specialized security personnel in charge of spreading
6
the security culture among the employees as well as ensuring that security routines and
technologies are correctly implemented and working in line with the organizations’ operations
(Sheffi, 2001; Lee and Whang, 2005). Security certifications like the AEO, the ISO28001 or
ISPS are available to practitioners to support the understanding of security and learn how to
prevent antagonistic threats (Sheffi, 2001; Rice and Spayd, 2005; Willys and Ortiz, 2004;
Urciuoli and Ekwall, 2010). Despite this, statistics testify that distribution networks are more and
more often targeted by criminals. Every day cargo is stolen, hijacked, and counterfeited. Further,
personnel working in transportation companies are exposed to the risk for being seriously
injured. Less often, we also witness episodes of terror attacks or food and pharmaceuticals
contamination that have terrible consequences on our communities. Hence, we wonder how
companies are coping with this situation that we don’t believe is sustainable from either an
economic pr a social responsibility viewpoint. More specifically, we wonder what factors are
determining the security of distribution networks (Figure 1).
Previous research points out that lack of security is an important source of risk to be considered
by supply chain and logistics managers (Manuj and Mentzer, 2008; Sheffi, 2001; Asbjørnslett,
2008). Therefore, it is fundamental to identify drivers of risks in supply chains to optimize risk
mitigation strategies and consequently moderate the negative outcomes of disruptions (Williams
et al., 2008; Jüttner et al., 2003). However, despite the highly scientific relevance, it appears that
too little research has been performed to identify factors external to the supply chain that may
influence the efforts made by firms to enact security. Voss et al. (2009) find that companies
operating in the food segment are willing to trade off price and delivery reliability with greater
security (customers’ willingness to pay). In addition, the hypothesis about the relationship
between the length of supply chains (domestic vs. global) and the demand for security is also
supported (ibid). Other authors identify the following factors as influencing the security of
supply chains: supply chain length, customers’ requirements, authority regulations, and security
partnerships (Giunipero and Eltantawy, 2004; Cupp et al., 2004; Craighead et al., 2007; Whipple
et al., 2009).
It appears that the relevance of the security problem found in practical instances is not equally
treated in the scientific literature (Williams et al., 2008; Staake et al., 2009). Moreover, more
descriptive research and empirical data are needed in this research area to find the theoretical
validity of existing normative studies or even to investigate the existence of further factors
7
influencing security that may be still unknown in the academic field (Williams et al., 2008; Voss
et al., 2009a). As a consequence the research question that this study aims to answer is the
following (Figure 1):
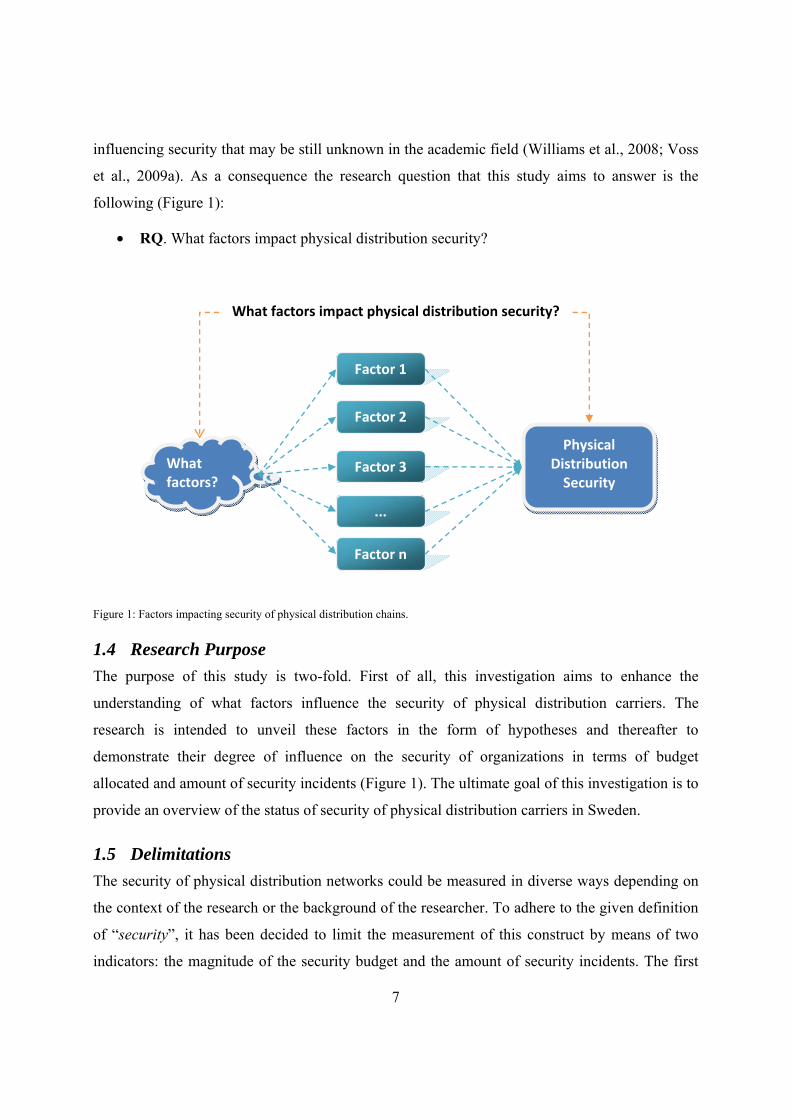
• RQ. What factors impact physical distribution security?
Figure 1: Factors impacting security of physical distribution chains.
1.4 Research Purpose The purpose of this study is two-fold. First of all, this investigation aims to enhance the
understanding of what factors influence the security of physical distribution carriers. The
research is intended to unveil these factors in the form of hypotheses and thereafter to
demonstrate their degree of influence on the security of organizations in terms of budget
allocated and amount of security incidents (Figure 1). The ultimate goal of this investigation is to
provide an overview of the status of security of physical distribution carriers in Sweden.
1.5 Delimitations The security of physical distribution networks could be measured in diverse ways depending on
the context of the research or the background of the researcher. To adhere to the given definition
of “security”, it has been decided to limit the measurement of this construct by means of two
indicators: the magnitude of the security budget and the amount of security incidents. The first
Physical Distribution
Security
Factor 1
Factor 2
Factor 3
...
Factor n
What factors?
What factors impact physical distribution security?

8
tells the monetary efforts made by companies to enhance security, the second gives indication of
the effectiveness of the investments made.
To tailor the questions formulated in the survey and consequently enhance their understanding, it
has been decided to perform the survey study exclusively with physical carriers. Hence, physical
distribution operators like logistics service providers, owners of warehouses and intermodal
terminals are not included in the sample; likewise manufacturing industries, wholesalers and
retailers have been excluded. Finally, due to the difficulty of finding a consistent and reliable
European database, the physical carriers that have been surveyed are those registered in the
Swedish Business Register database (more details about the characteristics of the sample frame
and size are provided in Chapter 5).
Finally, this thesis will not investigate supply chain consequences of security incidents. It is
indeed important to quantify these outcomes to emphasize the importance of protecting supply
chains and distribution networks. However, for time and money constraints this issue will only
be considered as a topic for future research.
1.6 Thesis Disposition This doctoral dissertation is based upon an investigation performed from 2006 and 2008 and
published in a licentiate thesis in 2008 (Urciuoli, 2008). The main purposes of the licentiate
study concerned 1) the identification of the influence of diverse stakeholders on the security of
physical distribution networks, 2) the identification of mitigation measures to deter cargo
security incidents and 3) the development of an investment model to estimate the profitability of
security solutions. Hence, the aim of this doctoral study is to perform a survey study to validate
the findings related to the first purpose of the licentiate study (Figure 2).

9
Figure 2: Overall thesis disposition and integration with licentiate study.
This report starts by introducing the research background, problem, research question, purpose
and delimitation of the doctoral study. Thereafter, in Chapter 2 a comprehensive summary of the
licentiate investigation is provided, including background, purposes, methodology, and findings.
The content from Chapter 3 to Chapter 7 is exclusively related to the research conducted within
the survey study. The last chapter summarizes all the findings of the licentiate and doctoral
investigations. More specifically, this thesis consists of the following chapters:
Chapter 1. The research background, context, objectives and delimitation of this study are
reported.
Chapter 2. A summary of the licentiate thesis is reported in this section.
Chapter 3. The literature collected between 2008 and 2009 is reviewed and categorized in this
section.
Chapter 4. In this chapter the research hypotheses, concerning the factors impacting the security
of physical distribution networks, are formulated.
Security in Physical Distribution Causes, Mitigation measures and investment model
Licentiate Study Purpose Doctoral Study Purpose
Chapters 2,8 Chapter 1, 3, 4, 5, 6, 7, 8
Overall Doctoral Thesis Title
1. Identification of Stakeholders and impact on security.
2. Identification of mitigation measures.
3. Development of SecurityInvestment model.
1. Survey study to validate findings of RQ1 in licentiate thesis.
Doctoral Thesis Disposition
Licentiate and Doctoral Studies Purposes
2008 20102006
Execution Time

10
Chapter 5. This chapter describes the methodological assumptions and research design followed
1) to formulate the hypotheses, 2) to develop the survey instrument and 3) to perform the
analysis of the data collected. In addition, the validity and reliability of the survey study are
discussed.
Chapter 6. This section contains descriptive statistics of the answers collected as well as the
numerical findings of the statistical analysis performed.
Chapter 7. This chapter includes a managerial summary of the results of the survey
investigation.
Chapter 8. The findings of the licentiate and doctoral investigation are reported. Delimitations,
research and practical contributions as well as future research are highlighted in this chapter.

11
2 Licentiate Summary
This chapter summarizes the three research questions and purpose of the investigations performed in the
licentiate thesis (Urciuoli, 2008). Thereafter, the answers to the research questions are presented as three
separate studies organized in a structure including the background, the methodology and the findings.
2.1 Research Questions and Purpose The study developed in this report builds upon the findings of investigations published in a
licentiate thesis in 2008 (Urciuoli, 2008). Three research questions were elaborated (Figure 3):
• RQ1. What are the fundamental stakeholders and interactions within and outside physical
distribution systems from a security perspective?
• RQ2. What mitigation measures can be implemented today to enhance the security of
physical distribution operations?
• RQ3. How can existing investment and risk models be exploited to estimate the
performance of security solutions and support investment decisions?
Today, according to available statistics, distribution networks are insecure (Figure 3). Therefore
it is of primary importance to understand what factors are hindering security, how it is possible
to protect physical distribution networks and finally to evaluate the profitability of security
measures available on the market place.
By answering these three research questions, the main ambition of the licentiate investigations
was to provide an understanding about how it is possible to enhance the security of physical
distribution systems (“suggestions for new system”, Figure 3). The understanding of the business
mechanisms hindering or driving security may facilitate the work to set up regulations or
incentives for key stakeholders. Finally, the collection and classification of security measures as
well as the development of investment models may enhance the capability of main actors to
choose among wide sets of security solutions in accordance with their impacts on security and
monetary benefits. The next subsections summarize the scope, methodology and findings of the
three research questions. Since the findings from the first research question are used to develop
the survey study presented in this report, it has been decided to shorten the summary and give a
more extended presentation of the results and methodology respectively in Chapters 4 and 5.

12
Figure 3: The research questions identified in the licentiate thesis.
2.2 RQ1. What are the fundamental stakeholders and interactions within and outside physical distribution systems from a security perspective?
The purpose of this study is to develop a Physical Distribution Security System framework
(PDSS) to identify actors and the main factors impacting the security of physical distribution
networks. Very few researchers have undertaken exploratory studies to understand the
difficulties encountered by industries to improve supply chain security and thereby discover the
causes that determine the security of distribution chains against antagonistic threats. Some
authors point out globalization and JIT as the main causes (Crone, 2006; Khemani, 2007). Yet
security problems in supply chain operations were known for many years before the emergence
of these factors. Other authors emphasize the importance of top management commitment,
authorities’ regulation, supply chain security partnerships and willingness to pay as
facilitators/inhibitors of supply chain security (Autry and Bobbitt, 2008; Voss et al. 2009b).
However, it is unclear how each of these factors is understood and put into practice by
transportation companies. In other words, previous research doesn’t unveil the practical
difficulties experienced by companies to ensure, for instance, top management commitment,
integration of authority regulation, the correct arrangement of supply chain security partnerships
etc. These factors have not been unveiled yet by previous research, and the additional hypothesis
about other reasons that may actually be significant factors for security in physical distribution
networks may be suggested.
Driving Forces Barriers Insecure Physical Distribution Systems
Secured Physical Distribution Systems
RQ1 RQ2 RQ3 Suggestions for
new system
Theory
Empiric
13
2.2.1 Methodology A qualitative methodology is exploited in this investigation. This choice has been preferred
because of the explorative nature of this study and also for the novelty of the research topic in
supply chain management literature and the consequent lack of research constructs (Denzin and
Lincoln, 2000; Autry and Bobbitt, 2008). Hence, the method followed consists of three main
phases: a literature search, and collection and analysis of empirical data.
The literature search was performed within available scientific journals to investigate previous
security research in the fields of supply chain and logistics management. Non-participant
observations performed on the occasion of a workshop and a seminar organized in Sweden,
facilitated comprehension of how the security problem is perceived by Swedish actors. In
particular, the preliminary findings led to the formulation of a set of stakeholders and factors
influencing the security of physical distribution. To enhance the comprehension of the roles of
these actors, a total of 16 interviews were performed: 4 unstructured and 12 semi-structured.
Respondents were randomly selected from a convenient sample of professionals joining a
research project dealing with logistics security and in a way to represent the preliminary actors
previously identified. Table 1 shows the demographic characteristics of the sample interviewed.
The interviews were completely unstructured in the beginning of the research to gain better
understanding of the area and add the widest range of information. They were meant to let the
respondents share thoughts about two main topics: 1) the vulnerability of physical distribution
chains to antagonistic threats and 2) the main causes determining the high exposure of physical
distribution chains (see Appendix 2). Once these topics became more comprehensible, semi-
structured interviews with more pointed questions were used. Already after 12 interviews it was
experienced that the respondents were not adding new actors or factors to the findings. Before
discontinuing the data collection, four more interviews were carried out (Glaser and Strauss,
1967; Easterby-Smith et al., 1991). Finally, by means of content analysis, themes and constructs
were derived from the interviews and the notes from the observations and merged with those
found in the literature search. More specifically, factors influencing security were identified in
the text of the literature material, notes from observations, and the transcribed interviews, labeled
and thereafter systematically associated to stakeholders.

14
Table 1: Demographic characteristics of the respondents.
Industry Position Respondent 1 Electronics Manufacturer Security manager Respondent 2 Transportation Lawyer Respondent 3 Road Carrier Security Manager Respondent 4 Logistics Service Provider Global Security Manager Respondent 5 Food Products Security Manager Respondent 6 Pharmaceutical Security Manager Respondent 7 Cash Transportation Security Manager Respondent 8 Law Enforcement Agency Police inspector Respondent 9 Security Certification International Sales Manager Respondent 10 Logistics Service Providers Regional Security Manager Respondent 11 Security Solution Provider Commercial Director Respondent 12 Road Carrier CEO Respondent 13 Security Solution Provider CEO Respondent 14 Shipping company Senior Director Respondent 15 Shipping Company Corporate Security Manager Respondent 16 Insurance Company Claims Manager
2.2.2 Findings The findings of this study are amalgamated into the Physical Distribution Security System
(PDSS) in Figure 4, where eight actors and 19 hypotheses are brought to light as factors
influencing the security of physical distribution networks. The actors that are playing a
significant role in the level of security in physical distribution networks are the following:
• The law enforcement agency. This stakeholder has to ensure that criminals are
prosecuted and that resources are allocated to fight cargo crime. According to the
interviewed managers this is not happening today and therefore cargo crime is a
profitable activity with high revenues and low risks. At the same time, this actor is
organizing collaborative activities that are meant to enhance the understanding of security
and stimulate the implementation of security measures.
• Distribution and transport operators. The difficulties encountered by these
stakeholders are the willingness to pay of transport buyers, the dilemma to trade off JIT
with security, and the impact on performance of security measures. In addition, the length
of distribution networks is another factor influencing the security of operations.

15
Figure 4: The system framework (Urciuoli, 2008).
• Insurance Companies. According to some interviewees, insurances are being used to
cover losses related to security incidents. Hence, these operators prefer to pay the
excesses and higher premiums instead of purchasing security devices or implementing
specific routines. In addition, some transport providers indicate the importance of
obtaining premium discounts whenever security is improved.
• Security Solution Providers. The main issue experienced by these actors is that many
products are still in a development phase and are too hard to integrate into an
organization from both a business process and a technical viewpoint. In addition, some
respondents claimed that the most advanced and effective security devices are too
expensive to be implemented on a large fleet of vehicles.
• Cargo Criminals. Criminals are intelligent, have access to financial resources, and most
of all have the capability to quickly learn and deceive security measures. Hence, some
operators stated that is useless to invest in security solutions since criminals will find out
how to deceive them.
Physical Distribution
Security
Distribution & Transport Operators
Business Certifications
Insurance Companies
Security Providers
Cargo Criminals
Contract Regulatory
Associations
Authority
Law Enforcement
Agency

16
• Contract Regulatory Associations. The role of contract regulatory associations (e.g.
(e.g. International Chamber of Commerce, International Federation of Freight Forwarders
Associations, etc.) that develop contract agreements to share risks is brought to light by
previous research. However, observations and interviews unveiled that these contracts are
often not used because of their complexity. In addition, whenever contracts are used,
security requirements are not specified or are difficult to agree on. This does not favor the
enhancement of security.
• Authority. The authority is working by issuing security certifications. In particular, the
AEO is a security certification introduced in Europe by the authority. According to data
collected, it may be hypothesized that this certification may enhance security. At the
same time, some respondents pointed out that this certification is still confusing. In
addition, some operators perceive that these regulations may worsen efficiency and still
not enhance security. Hence, this uncertainty may result in a worsening of security.
2.3 RQ2. What mitigation measures can be implemented today to enhance the security of physical distribution operations?
The purpose of this investigation is to identify the mitigation measures that may be implemented
to enhance security of physical distribution networks. The ultimate goal is to determine how to
narrow the knowledge gap among managers about how to protect distribution networks. Security
problems often are multifaceted and dependent on the specific context (geographical, cultural
etc.) in which they take place. Therefore managers need to have access to comprehensive lists of
security solutions to be able to choose the ones that best fit their logistics and security
requirements. The final purpose is to identify and classify existing security measures at the
disposal of managers and to provide them with a framework to facilitate the work of increasing
security and identifying weak spots in supply chains.
2.3.1 Methodology To gain a clearer picture of security needs and managerial knowledge, several methodological
steps had to be accomplished. First of all, a literature search was performed to depict the status of
the research devoted to security, including the analysis of management strategies, technical tools
and certifications. After that, a first draft of a survey was prepared and sent to a group of
potential respondents. The collected results were categorized and put into a layered framework.
17
Survey Instrument
The table for the collection of security systems was split into six columns. The first two columns
asked for open answers about the name of the known security system, hyperlinks to existing
providers on the marketplace and the components constituting the system. The last four columns
asked respectively for “the part of the distribution chain where the system was implementable”,
“Type of Security Solution (Prevention, Detection or Recovery)”, “Type of Unit Load the
Solution was applicable to” and “Type of Resources the Solution was applicable to”. This
information had to be gathered to get a deeper understanding about how security systems,
procedures or certifications work. The respondents had the possibility to check boxes under each
column to simplify the answering procedure or to propose possibly missing alternatives.
Similarly the table for the collection of security procedures was made of five columns. The first
two were open questions in which respondents could specify the name of the procedure (possibly
by mentioning the corresponding ISO code), and the processes composing the procedure. The
last three questions were made up of checkboxes and asked for “Type of Security Procedure
(Prevention, Detection or Recovery)”, “Distribution Chain’s Actors involved” and “External
Actors involved”. These were also fundamental to understand the main processes and actors
involved in the security procedure. At the end of the survey, the respondents were given the
opportunity to make comments, specify their company’s business area and provide their contact
details.
Data Collection
The survey was sent to a group of 76 security experts. 16 members of the group returned the
survey (21%) and 5 additional experts were convinced by phone to fill in the questionnaire (6%).
4 members explicitly declared that they couldn’t join the investigation because of lack of time or
confidentiality issues (5%). Finally, 42 managers never answered (55%) and 9 (11%) surveys
could not be delivered to the email addresses collected in the database.
Data analysis and Classification
The analysis of the findings collected from the literature review and the survey, revealed three
major areas in which strategies, routines and technical devices are gathered as means to improve
supply chain security. These are Governmental Initiatives, Management Strategies and Operative
Routines and Technical Systems (Figure 5).

18
Figure 5: The three areas for supply chain security improvement.
To enhance the ability to make effective use of the information collected, it was necessary to
represent a generic logistics system by means of a multi-layered structure. In this way it is
possible to conceptually explain in which part of the logistics systems the collected security
measures are meant to be implemented. The multi-layered logistics framework developed has
been adapted from the model used in Wandel et al. (1991) to represent transportation systems.
Hence, it is composed of 6 layers (Figure 6):
• Layer 1. The first layer represents the decision makers in the supply chain that have the
responsibility to allocate resources, monitor system performance and optimize costs and
efficiency.
• Layer 2. This layer concerns the information flows to be transmitted through or stored at
every element of supply chains. These flows can contain information about the cargo as
well as about the consignor, consignee etc.
• Layer 3. Layer 3 comprises the infrastructure of transportation chains the goods travel
through, including suppliers’ and buyers’ facilities, intermodal terminals, warehouses,
Customs, and other terminals and elements of the transport infrastructure (e.g. vehicle
depots, parking areas, rights of way etc.).

19
• Layer 4. Layer 4 is exclusively dedicated to the transport conveyance adopted during the
transportation process. In this analysis four transportation modes are considered: road,
rail, air and sea.
• Layer 5. Layer 5 includes the unit loads or packages used for transportation or storing
purposes at the distribution terminals.
• Layer 6. Layer 6 represents the product itself or the material that is being moved in the
distribution chain.
Figure 6: The multi-layered logistics framework (adapted from Wandel et al. 1991).
Finally, the security solutions are classified according to the following functions:
• Typology. Operative routines, management strategies and technical systems
• Prevention. The role of preventive measures is to be a step ahead of the antagonists,
scare them and to provide security analysts with key information to predict threats.
• Detection. Detection measures register an attack taking place and send this information
to personnel in charge.
• Recovery. Recovery measures are all solutions that support managers in recovering from
an attack and reducing its consequences (i.e. detect, identify and capture the antagonists
or the processes to recover stolen cargo or to set up a new shipment etc.).
20
• Layer protection. Applicability in multi-layered framework of distribution chains.
• Certification Compliance. Compliance with TAPA EMEA minimum security
requirements.
2.3.2 Findings In conclusion, this study has the ambition to provide supply chain and security managers with a
comprehensive overview of security solutions including authority regulations, managerial
strategies, operative routines and technical systems (Figure 7). It also gives the possibility to
managers to benchmark their security approaches with those that have been collected in this
research. In addition, the multi-layered approach developed enhances the comprehension and
classification of the results and makes it easier to identify weak spots in supply chains and
related countermeasures.
Figure 7: The three security measures areas applied to the multi-layered framework.
Governmental Initiatives. Only 19% of the respondents showed knowledge of the on-going
governmental initiatives that may improve the security of supply chains. Hence, the bulk of
information presented here has been gathered from secondary data sources. These are the
following:
21
• Aviation and Transportation Security Act. The Aviation and Transportation Security
Act called for a noticeable increment of inspections and 100% screening of cargo loaded
on passenger planes. Similar reforms have been adopted in Germany, UK and Singapore.
• ISPS. The sea sector followed the air sector when the International Ship and Port facility
Security code (ISPS) was widened to include a standard framework, for the identification
and assessment of vulnerabilities of sea transportation and port facilities by means of risk
analysis.
• The Container Security Initiative (CSI). The Container Security Initiative (CSI) was
introduced in US in January 2002. The CSI highlights the importance of developing
domestic bilateral agreements to permit the exchange of Customs officers in US. In
addition it is fundamental to allow benchmarking and improvement in inspection and
clearance processes of containerized cargo.
• Customs-Trade Partnership against Terrorism (C-TPAT). The Customs-Trade
Partnership against Terrorism (C-TPAT) was issued by the US government in April
2002, to gather representatives from the US Customs Border Protection (CBP) and the
private sector and develop a list of minimum security requirements for shippers and
carriers. The ultimate goal of these guidelines is the identification of less risky cargo. A
Supply Chain Security Specialists team (SCSS) is in charge of this task and determines
companies’ security profiles according to such factors as security related anomalies,
shipping geographic regions, other risk related information, or import volumes.
• Advance Manifest Rule (AMR). The AMR initiative obliges shippers to submit to US
Customs detailed cargo information 24 hours before loading containers on ships. When
the containers are delivered, customs officers check information, and consequently
anomalies may be detected. The same information can even be used by the CBP to
designate if the cargo can be loaded on a vessel or to make decisions about inspections
(Automated Targeting System). This is important in order to reduce the number of
containers to be scanned.
• The Authorized Economic Operator (AEO). The scope of the AEO initiative is to
detect high-risk cargo as early as possible in supply chains and in a resource-efficient
way. To gain certification, firms have to comply with a set of criteria: Customs
compliance history, adoption of appropriate system for documenting commercial reports,

22
financial solvency, information exchange, security of conveyance, cargo and personnel as
well as monitoring and follow up of guidelines’ consistency and the integrity of security
systems. In this way, each European Customs is stimulated to establish a partnership with
the private sectors and grade their security degree.
• Regulation of the European Parliament and of the Council on enhancing supply
chain security (79/2006). This proposal calls for improved risk assessment and cost
benefits analysis as well as comprehensive harmonization of security measures by means
of equal judgment of all transportation modes in an integrated way
Management Strategies. None of the managers that participated in this study mentioned
managerial strategies, which are instead collected exclusively from previous literature. The focus
of these measures is mainly on supply chain risk management to mitigate disruptions’
consequences (layer 1 in Figure 6). Some of these are the following (a comprehensive list is
available in Urciuoli, 2008 or likewise in Urciuoli, 2009):
• Supply chain restructuring. To rethink and make more resilient supply chains by
reducing transport content, using transportation more efficiently, improving sourcing
strategy and increasing buffers and inventories.
• Hedging and flexible strategies. Application of strategies aiming at balancing profits
and losses in a supply chain as well as increasing redundancy.
• Risk Management. Extended usage of risk management activities, in particular “what if”
analysis to identify risk sources and related countermeasures.
• Collaboration and outsourcing. Improve collaboration and outsourcing with suppliers
by introducing risk-sharing contracts.
• Total Quality Management. Implementation of Total Quality Management (TQM) to
achieve higher security at lower costs.
• Resources Backup. Improve knowledge and process backup.
• Decentralization. Exploit decentralization of operations and redundancy to recover
supply chains in case of forced shut down.
• Public-private cooperation. Improve public-private cooperation, assets reorganization
and introduction of a security manager who is familiar with corporate environment issues
and with risk assessment techniques.

23
Operative Routines and Technical Systems. Operative routines refer to all the procedures put
into operation to enhance the security against antagonistic threats. The managers who responded
to the survey have provided most of the collected procedures. The most mentioned operative
routines include access control, personnel identification, employee background screening, check
up of security measures, cargo screening etc. (a comprehensive list is available in Urciuoli, 2008
or likewise in Urciuoli, 2009).
Technical systems can automate operative and strategic measures by means of a combination of
hardware (e.g. sensors to capture data) and software (e.g. middleware or Decision Support
Systems). Prominent technical systems include biometrics and surveillance systems, IT security
technologies such as Firewalls, Secure Socket Layers (SSL), Application Authentication, Virtual
Private Networks (VPN) as well as systems for Access Control (or Identity Management or
Authentication) etc. (layer 2 in Figure 6) Other technical systems are those meant to protect
physical objects and include vehicle or perimeter alarms, vehicle immobilizers, locks or fuel cap
locks (layers 3 to 6 in Figure 6). Track and Trace systems are also well known among
practitioners. These are made up of a unit containing a GPS and a GSM/GPRS modem to
communicate the position of the transport conveyance to a remote server. Other security
solutions to prevent tampering or intrusion in unit loads are locks, hard walls or reinforced
curtains, devices for immobilization, tamper evident seals etc. Locks and tamper evident seals
are available as mechanical or electrical systems. Examples of mechanical locks are padlocks,
bolts, and cable locks. Examples of seals are cup seals and metal strap seals. Electronic seals
(RFID tags) are instead made up of a body that can be installed on multiple levels of physical
objects, thus from single items to pallets, containers, and transportation conveyances. To collect
the data stored on the tags, RFID readers have to be installed at specific locations (usually the
facilities of the distribution system). Often these solutions allow nesting, which gives the
possibility to identify items in pallets, pallets in containers and so forth. Further, sensors like
GPS, biometrics, satellite communication systems, IR motion detection, and acoustics,
temperature, weight, flow and shock vibration and more, can be added. Sensor technology is
finally coupled with diverse web-services (often based on SOA - Service Oriented Architecture)
as track and trace, time/geo-fencing, alerts, event management and so on (a more comprehensive
list is provided in Urciuoli, 2008 or Urciuoli, 2009).
24
2.4 RQ3. How can existing investment and risk models be exploited to estimate the performance of security solutions and support investment decisions?
The purpose of this last investigation is to determine the possibility of applying existing risk
management and investment models to determine the profitability of security measures in
distribution networks. To enhance the clarity of the work performed within this research
question, this part is split into two sub-sections: the first showing the application of the
Quantitative Risk Assessment (QRA) methodology to evaluate the impact of transport security
solutions; the second to demonstrate how the integration of Reliability Block Diagrams (RBD)
may enable the estimation of security measures combined into hybrid systems.
2.4.1 Application of QRA Approach The purpose of the first part of this study is to present one of the best-known approaches used in
the risk management discipline, the Quantitative Risk Assessment (QRA) as it is described in
Kaplan (1997). The application of the approach on a hypothetical transport assignment may
demonstrate its feasibility for the evaluation of security solutions against cargo crime. It seems
that still too little research has focused on the quantification of the impacts of transport security
solutions. In addition, the few quantitative studies found in the literature don’t take advantage of
the methodologies developed within the risk and safety management discipline that acknowledge
many years of experience related to the evaluation of measures to minimize, monitor, and control
risks (Lee and Whang, 2005; Talas and Menachof, 2009).
2.4.2 Methodology The methodology used in this investigation follows three main phases of the QRA approach
(Kaplan, 1997; Haimes, 1998; Johansson, 2003): identification of scenarios, collection of body
of evidence and scenario quantification.
Scenario Identification. The identification of scenarios is meant to determine the possible
attacks against a system. The set of risk scenarios to be used in a Quantitative Risk Assessment
should be complete, finite and disjoint (Kaplan, 1997; Haimes and Garrick, 2001). Hence, real
problems may be assumed as “an underlying continuum to be carved up or partitioned into a
finite set of scenarios” (ibid). Kaplan (1997) suggests viewing any risk scenario, , considered
in an analysis as a deviation from the normal conditions specified by the analyst in an initial
scenario ; “one is to think of as a trajectory in the state space of the system”

25
The case considered in this investigation is a road transportation assignment in which a container
loaded with generic cargo is moved between two warehouses (node 1 to node 2). This is also
depicted in Figure 8, where the transportation network is represented in the form of nodes and
links. Hence, by following the recommendations given by Kaplan (1997), this case may be
considered as the scenario from which End States are identified.
Figure 8: Scenario identification from initiating events to end states.
Collection of Body of Evidence. Statistics data and expert panels may be utilized to gather
evidence of possible security incidents (Kaplan, 1997). To enhance the accuracy and reliability
of the data, it is a good practice to combine different data sources like literature, databases,
experts’ judgments etc. In this case the Bayes’ theorem may be applied according to the equation
below (Apostolakis, 1986; Kaplan, 1997).
The body of evidence used in this study consists of cargo theft statistics, the costs of security
measures, the impact of the security measures on the cargo theft scenarios, and the average
annual shipments carried out in Sweden. The data have been collected from primary and
secondary sources by means of interviews, statistics data stored in electronic databases and
experts’ judgments.
,
Node 1
Node 2
…
Initiating Event
End States
Cargo Stolen
Cargo not Stolen
Cargo Stolen
Cargo not Stolen
Cargo Stolen
Cargo not Stolen
,
...
Cargo Stolen
Cargo not Stolen
Cargo Stolen
Cargo not Stolen

26
Cargo Theft Statistics
Statistical data were gathered to determine the frequency of theft attacks against transport
operations. This was performed by gathering data corresponding to theft incidents from 2006 to
2007 available from the Swedish HOBIT database, built and provided by the Swedish Law
Enforcement Agency, and the TAPA EMEA (Transported Assets Protection Association)
Incident Information System (IIS) (Table 2). This study assumes that the statistics about the
modus operandi collected on a European level can reliably represent the existing threats in
Sweden.
Table 2: Road cargo theft modus operandi and corresponding frequency (n=6).
Modus Operandi Frequency
Burglary (Container) 7,39*10-6
Burglary (Vehicle) 2,77*10-6
Fraud (Vehicle/Container) 9,23*10-7
Hijacking (Vehicle/Container) 3,23*10-6
Robbery (Container) 9,24*10-7
Robbery (Pallets) 1,52*10-5
Costs of Security Measures
Interviews were used to gather the costs of the security solutions considered in this study. First of
all, a set of nine security systems was selected among those that are mostly used by transport
operators. Thereafter, companies developing these systems were selected and interviewed to find
out the costs of the solutions. The costs have been mathematically formalized in a total cost
vector = , , , … , , where the generic element is given by the
sum = + , ∀ ∈ Μ , and and are respectively the fixed and
monthly variable costs of a generic technology (Table 3). The names of the companies
interviewed are not provided for privacy concerns.
Scenario Quantification. The input variables used in the model to quantify the scenarios are:
the theft statistics ( ) measured as percentage of frequency, the interest rate (ir), the loss value
or value of shipment transported ( ), and the impact given by the introduction of security
solutions (security solutions impact) (Table 4).

27
Table 3: security solutions and associated fixed and variable costs (m=9).
Security Solutions Fixed Costs (€) Variable Costs (€)
Track & Trace 1 000 15
ID Tag + Readers + Sensor (E-SEALS) 52 000 0
Active RFID Tags + Readers 52 766 0
Active RFID Tag + Reader + GPS + GPRS/GSM 55 000 15
Passive RFID Tags + Readers (gates)+WIFI 53 336 0
Sound Barrier 665 5
Mechanical Locks 300 0
Vehicle Immobilizer 720 15
Reinforced Trailers 500 0
The impact of the security solutions, measured as the percentage of the reduction of the theft
risk, is assumed to be an exogenous variable defined by three values to be used to generate
random data from triangular distribution (an interval range and a mean value,
respectively , , ). The remaining input parameters are fixed and set by the analyst in the
previous phase of the QRA approach (Table 4).
Table 4: Model variables.
Variable I/O variable Type Symbol Dimension
Theft Statistics Input Fixed [%]
Interest Rate Input Fixed [%]
Loss Value Input Fixed [€]
Security Solutions Impact Input Exogenous , , [%]
B/C Output Endogenous [--]
NPV Output Endogenous [€]
Risk Output Endogenous [€]

28
The endogenous variables constituting the output parameters of the mathematical model are the
capital investment indexes (the B/C ratio and the Net Present Value) and the risk reductions.
These parameters are calculated according to the following equations (Equations 1, 2, and 3).
= ∑ ∙ (1 + )∑ ∙ (1 + ) , ∈ ̅ (1)
= − ∙ (1 + ) , ∈ ̅ (2)
= ∙ (r) ∙ ΨΜ
, ∀ ∈ μ, ∈ ̅ (3)
Where (r), is the inverse of the cumulative triangular distribution function generated with the experts’ judgments.
, is the risk reduction of a generic security solution . , is the Benefit-Cost ration of the generic security solution . , is the Net Present Value of the generic security solution .
Ψ = C × , is the yearly average value shipped by a generic transport operator in Sweden.
T, is the calculation period of the investment.
t, time measured in years.
2.4.3 Findings A Monte Carlo simulation has been run with 5,000 iterations and over a time period of 10 years.
Examining Table 5, which depicts the maximum and minimum values as well as the standard
deviations of the B/C ratios and the NPVs, it is possible to notice that only the first security
solution (GPS based track and trace) may have negative values of the NPV (min=-€499) as well
as values of the B/C<1 (min=0.79). This implies that there could be a small possibility that this
technology could not be profitable. This is also illustrated in Figure 9 and Figure 10 where the
distributions of the frequency and cumulative frequency of the NPV and B/C ratio are reported.

29
Table 5: The computed investment indexes for the nine security solutions considered (A-RFID=Active RFID, P-RFID=Passive RFID).
Security Solution B/C B/C
(Max, min, St.Dev) NPV (€)
NPV (€ Max, min, St.Dev.)
Risk Reduction (%)
GPS 1,23 (1.76, 0.79, 0.14) 566.5 (1,904, -499, 369) 6,3%
E-Seals 0,07 (0.10, 0.04, 0.01) -48,142.5 (-46,363, -49,788, 651) 8,2%
A-RFID 0,07 (0.10, 0.04, 0.01) -49,057.4 (-47,052, -50,529, 680) 7,4%
A-RFID (GPS) 0,28 (0.33, 0.22, 0.01) -40,642.8 (-37,558, -43,851, 1097) 36,5%
P-RFID 0,06 (0.10, 0.03, 0.01) -49,957.2 (-47,846, -51,240, 694) 8,5%
Sound Barrier 7,03 (8.63, 5.29, 0.58) 7,028.3 (8,883, 4,994, 676) 16,7%
Mech. Lock 17,43 (24.41, 9.53, 2.71) 4,928.1 (7,346, 2,569, 822) 9,3%
Immobilizer 1,44 (1.71, 1.19, 0.07) 977.1 (1,582, 428, 175) 6,5% Reinforced Trailer 7,66 (10.62, 5.42, 0.92) 3,328.7 (4,813, 2,214, 463) 7,6%
RFID based solutions (e-seals, Active RFID with and without GPS, Passive RFID) are not
profitable even though these devices are among the ones that are most effective on the risk
reduction of the threats, i.e. Active RFID coupled with GPS gives a risk reduction of 36.5%
(Table 5). Mechanical locks have the highest Benefit/Cost ratio, followed by reinforced trailer
(B/C=7.66) and sound barrier (7.03). The vehicle immobilizer is also profitable, but when
examining the distribution of the B/C ratio some uncertainty may be found (values below 1).
Figure 9: Frequency distribution of NPV index for GPS track and trace solution.
0
100
200
300
400
500
600
700
800
Freq
uenc
y
NPV

30
Figure 10: Frequency distribution of B/C ratio for GPS track and trace solution.
Sensitivity analysis is fundamental to assess the differences in the outputs of a mathematical
model due to a) unexpected outcomes of the exogenous variables, b) errors committed during the
measurement of the system, c) invalid model structure, d) incorrect objectives and e) improper
execution of decisions (Wandel, 1985).
In this study, a nominal range sensitivity analysis has been performed to determine the impact of
the input values on the outcome variables. For practical reasons, it is not possible to illustrate the
sensitivity analysis for all the nine security solutions considered in this paper. Therefore, this
section presents only the results of a sensitivity analysis performed for the GPS track and trace
solution (ρ ), which is one of the most common devices used by operators to monitor their
vehicles’ fleets. The inputs chosen in this investigation and the related plausible ranges are:
• Loss Value. This factor has a minimum value of €25,000 and a maximum of €56,000.
These values have been identified by using available statistics that report the value of
goods stolen in Europe (ECMT, 2002).
• Threat frequency. The panel of experts used in this investigation believed that today
available statistics are too low and most of all that the existing figures should be
increased by at least 30%. Hence, the minimum value corresponds to the theft statistics
shown in Table 2, and the maximum value is instead calculated by incrementing these
figures by 30%.
0
100
200
300
400
500
600
700
800
Freq
uenc
y
B/C Ratio

31
• Total cost of the solution. Data gathered from secondary sources show that the fixed
costs of GPS based track and trace devices vary from about €500 to €2,000. The variable
costs have been changed proportionally to the variation of the fixed costs.
• The interest rate. The interval values of the interest rate have been determined by
examining the trend of this indicator on a 10-year time period from January 2000 to
January 20101. The minimum interest rate was 1.5% and the maximum 4.75%.
The results of the analysis show that the loss value and the total cost of the solution have the
most dramatic effects. The former is capable of causing the expected net present value to be as
low as -€1,159 and as high as €508; almost similarly, the latter strongly influences the net
present values that vary from -€800 to a maximum of €702 (Figure 11). These factors are
followed rather closely by the threat frequency and the interest rate.
Figure 11. Tornado Diagram.
1 Swedish Central Bank, REPO Rate trend.
-€1 159
-€800
€208
€106
€508
€702
€1 024
€357
-€1 500 -€1 000 -€500 €0 €500 €1 000 €1 500
Loss Value
Total Cost of Solution
Threat Frequency
Interest Rate

32
Finally, it has to be pointed out that the available data concerning the loss value as well as the
threat frequency have a high degree of uncertainty. The loss values were determined from
available statistics. However, it is well known that companies do not report minor losses because
it is not worth the related administrative costs. Likewise, high values are also kept hidden
because of the fear of 1) bad reputation and 2) increments of premium discounts. Hence, the
interval range of this variable could be larger. For the same reasons, data concerning threat
frequency also have a high degree of ambiguity. In this investigation, the maximum value was
substantially incremented by 30%. Nevertheless, this was also a rough estimation made in
accordance with the opinions of the experts.
2.4.4 Implementation of Reliability Block Diagrams The study presented in the previous section unveiled some difficulties related to the
implementation of the QRA approach described in Kaplan (1997). These include 1) a problem
related to systematically identifying security scenarios and to quantitatively modelling the
interdependency of security devices, and 2) some concerns that appeared when trying to model
the impact of the combination of security devices to be introduced in transport systems. Finally,
the process exploited to gather experts’ judgments was also perceived as practically unfeasible in
some situations.
The first issue, the interdependency of security devices, implies that sometimes the
implementation of a security device may not affect the security of a system, although an expert
would rank the device as effective on specific threats. For instance, the implementation of a
window alarm on a warehouse may have different impacts depending on the physical structure of
the building. While an expert would rank the impact of the security device as high, its real effect
depends on the number of weaker spots of the target, i.e. the number of windows or doors not
alarmed. The approach described by Kaplan (1997) suggests the identification of the initial
scenario S0, but analysts are not recommended to enhance the technical description of the target
and, above all, assess the introduced security device in terms of existing weaker spots on the
target.
Other concerns appeared when trying to assess the combination of security devices on the same
transport system. For instance, the computation of the effect of a mechanical lock may be
different on a curtain or rigid trailer. An expert would rank the protection degree of a mechanical

33
lock higher on the rigid trailer. However, when the mechanical lock is implemented on a curtain
trailer, the protection degree becomes illogical, because antagonists will orient all their attacks
on the curtains.
One way to solve this issue could be to enhance the description of the initial scenarios by using
the experts to judge single as well as combinations of security systems. However, in this case,
the process used to collect experts’ judgments could become practically impossible. For instance,
if one wants to evaluate the impact of m security devices on n threats, the total number of
scenarios to be evaluated is given by × , which means that the number of experts’ judgments
grows when n or m are increased. However, according to combinatorial mathematics, if the
analyst wants to take into consideration even the interrelation between security devices against
the n threats, the total amount of necessary experts’ judgments is given by the amount of
combinations of m security devices in groups of k (k=1 to m) un-ordered collections multiplied
by the n security threats (Equation 4).
= ⋅ = ⋅ !! ( − )! (4)
The figure below depicts, in accordance to Equation 4, how rapidly the number of experts’
judgments increases when the number of security devices, m, is incremented from 1 to 10 and the
number of threats, n, is incremented from n=2 to n=8. Thus, it is clear that the collection of
experts’ judgments may become soon an impractical operation (i.e. 10 security devices against 4
modus operandi require about 4,000 experts’ judgments).

34
Figure 12: Relationship between security devices and amount of security systems for n=2,4,6,8 security threats.
2.4.5 Method Development The implementation of Reliability Block Diagrams (RBD) techniques could be one of the
possible ways to solve the identified difficulties. The implementation of the RBD technique to
evaluate transport security systems requires analysts to design series and parallel diagrams in
which security devices are interconnected to each other’s. The failure of the system is provoked
by an intentional attack against one or more single components of the security system. This
failure determines the interruption of the connection between the end points of the RBD. Hence,
the RBD technique could be a realistic method to uncover the interdependencies between
security devices and model them in a quantitative manner. If the failure of only one device
determines the failure of the whole system then the security devices should be drawn in series
structures. The security of a system, SSSs, made of n components in series is given in the
following equation (Equation 5) (Rausand and Høyland, 2004; Bergman and Klefsjö, 2004):
= ( ) = ( ) = ( ) (5)
Where
= ( ) = ℎ
n=2
n=4
n=6
n=8
0
1 000
2 000
3 000
4 000
5 000
6 000
7 000
8 000
5 6 7 8 9 10
No.
Exp
erts
Judg
emen
ts
No. Security Devices, m

35
( ( )) = ( ( ), ( ), … , ( ))= ℎ ℎ ℎ
( ) = ℎ ℎ ( )
( ) = ℎ
On the contrary, when security devices are drawn in parallel it implies that an intruder will need
to deceive all the devices in the system to successfully perpetrate an attack. The security SSSSp of
parallel structure of security devices may be formalized as it follows (Equation 6) (Rausand and
Høyland, 2004; Bergman and Klefsjö, 2004):
= ( ) = (1 − ( )) (6)
At this point, it is important to notice that when security devices are put into series structure the
system is as secure as the weakest of its components. In mathematical terms this is expressed as
(Rausand and Høyland, 2004; Bergman and Klefsjö, 2004):
( ) ≤ ( ( )) (7)
On the contrary, the introduction of security devices in parallel will make the system harder to
penetrate (Equation 6).
Finally, the application of the RBD technique implies that a security analyst is merely required to
determine the logical interconnections among the security components and thereby to estimate,
by means of experts’ judgments, the failures of the single devices against diverse security threats.
The effect on the threats of the combined security devices will be quantitatively computed by
means of equations 6 and 7. Keeping the amount of judgments limited may aid analysts to
overcome the practical difficulties related to too many judgments.
2.4.6 A numerical Example This section provides a numerical example in which the RBD technique is integrated with the
QRA and exploited to determine the profitability of 7 security devices in a hypothetical
transportation assignment. This example will consider the combination of the 7 security devices
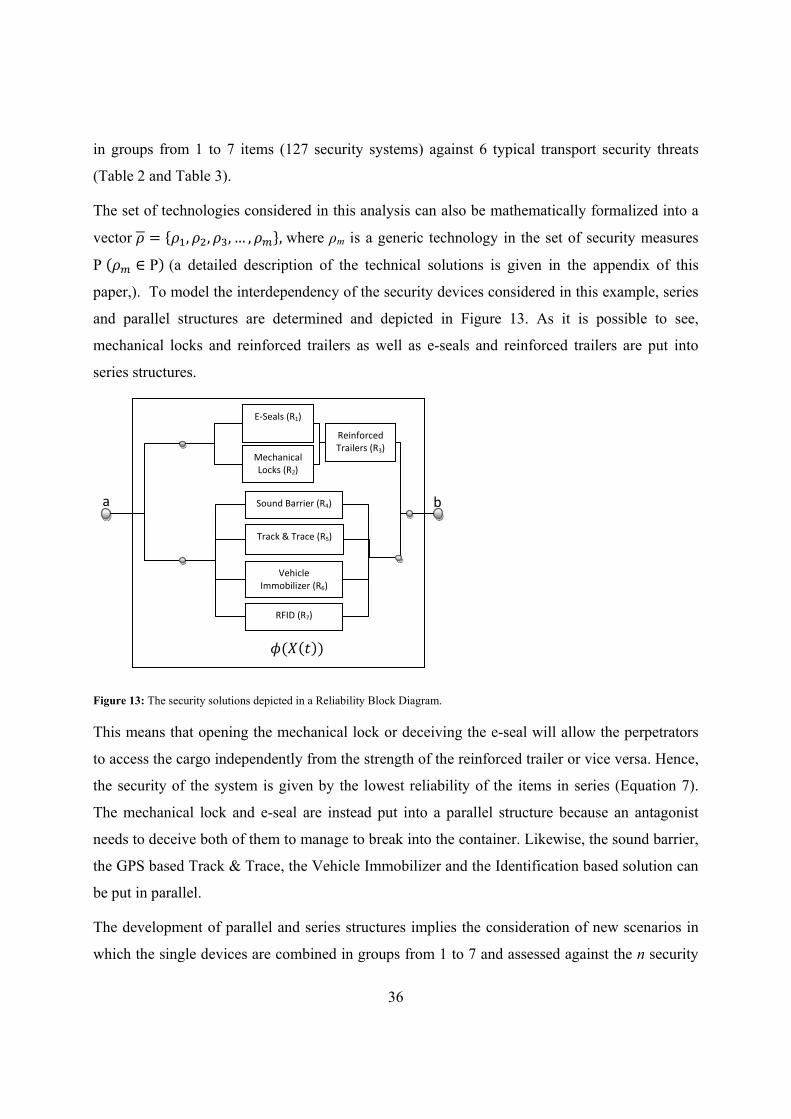
36
in groups from 1 to 7 items (127 security systems) against 6 typical transport security threats
(Table 2 and Table 3).
The set of technologies considered in this analysis can also be mathematically formalized into a
vector = , , , … , , where ρm is a generic technology in the set of security measures
Р ( ∈ Ρ) (a detailed description of the technical solutions is given in the appendix of this
paper,). To model the interdependency of the security devices considered in this example, series
and parallel structures are determined and depicted in Figure 13. As it is possible to see,
mechanical locks and reinforced trailers as well as e-seals and reinforced trailers are put into
series structures.
Figure 13: The security solutions depicted in a Reliability Block Diagram.
This means that opening the mechanical lock or deceiving the e-seal will allow the perpetrators
to access the cargo independently from the strength of the reinforced trailer or vice versa. Hence,
the security of the system is given by the lowest reliability of the items in series (Equation 7).
The mechanical lock and e-seal are instead put into a parallel structure because an antagonist
needs to deceive both of them to manage to break into the container. Likewise, the sound barrier,
the GPS based Track & Trace, the Vehicle Immobilizer and the Identification based solution can
be put in parallel.
The development of parallel and series structures implies the consideration of new scenarios in
which the single devices are combined in groups from 1 to 7 and assessed against the n security
Mechanical Locks (R2)
Sound Barrier (R4)
( ( ))
Track & Trace (R5)
Vehicle Immobilizer (R6)
b
RFID (R7)
Reinforced Trailers (R3)
E-Seals (R1)
a

37
threats (Figure 8). Thus, a total of (1 + ) ∙ 2 = 1 + ∑ !!( )! ∙ 2 scenarios will be
considered.
Figure 14: Scenario identification from initiating events to end states.
In the scenario quantification phase a mathematical model, Visual Basic scripts (developed in
Excel macro development environment) and Monte Carlo simulations are exploited to estimate
the impact of the security solutions on transportation in the form of investment indexes. The
model variables are the same presented in Table 4 but this time referred to hybrid security
systems SSc. To determine the risk reduction factor of the hybrid security systems considered in
this investigation ( ), the reliability block diagram in Figure 13 can be mathematically
formalized in equation 8.
= 1 − ( ).. ∙ ( ) ∙ 1 − ( )..
(8)
Where,
, is the security of security system SSc. , is the generic element of the security system vector = , , , … , ,
= ,
Node 1
Node 2 =
= … =
Initiating Event
End States
Cargo Stolen
Cargo not Stolen
Cargo Stolen
Cargo not Stolen
Cargo Stolen
Cargo not Stolen
= , …
...
Cargo Stolen
Cargo not Stolen
Cargo Stolen
Cargo not Stolen
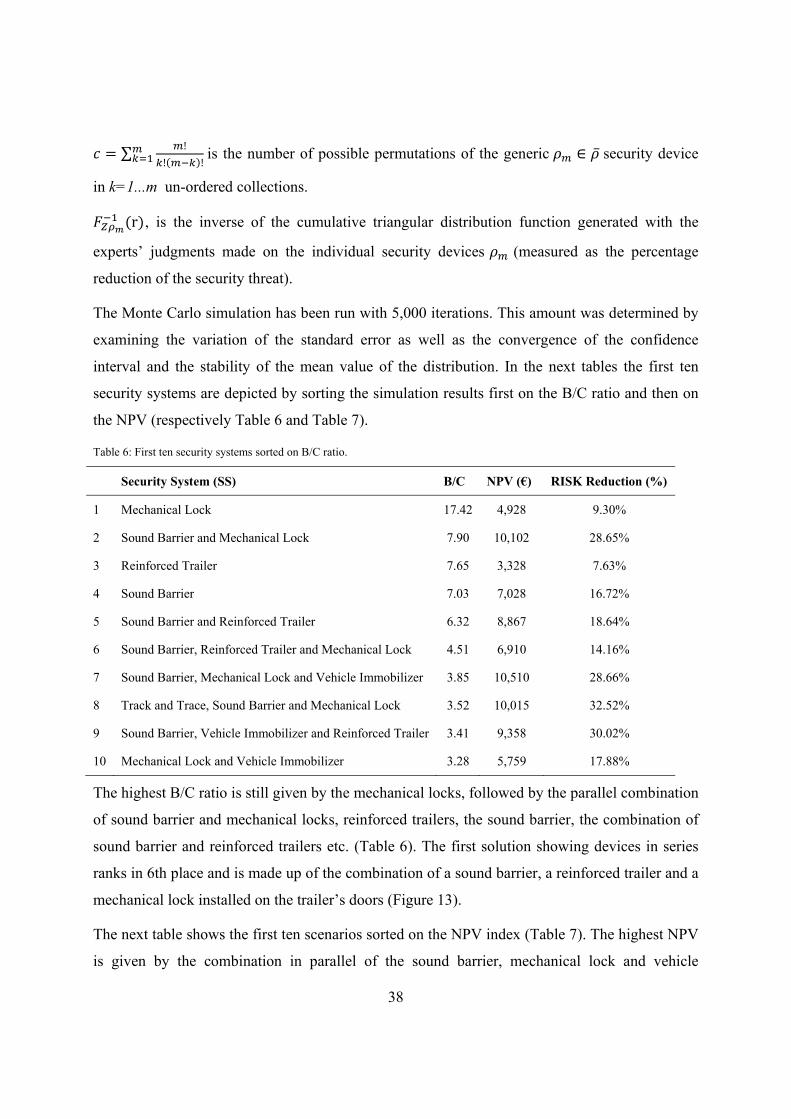
38
= ∑ !!( )! is the number of possible permutations of the generic ∈ ̅ security device
in k=1...m un-ordered collections. (r), is the inverse of the cumulative triangular distribution function generated with the
experts’ judgments made on the individual security devices (measured as the percentage
reduction of the security threat).
The Monte Carlo simulation has been run with 5,000 iterations. This amount was determined by
examining the variation of the standard error as well as the convergence of the confidence
interval and the stability of the mean value of the distribution. In the next tables the first ten
security systems are depicted by sorting the simulation results first on the B/C ratio and then on
the NPV (respectively Table 6 and Table 7).
Table 6: First ten security systems sorted on B/C ratio.
Security System (SS) B/C NPV (€) RISK Reduction (%)
1 Mechanical Lock 17.42 4,928 9.30%
2 Sound Barrier and Mechanical Lock 7.90 10,102 28.65%
3 Reinforced Trailer 7.65 3,328 7.63%
4 Sound Barrier 7.03 7,028 16.72%
5 Sound Barrier and Reinforced Trailer 6.32 8,867 18.64%
6 Sound Barrier, Reinforced Trailer and Mechanical Lock 4.51 6,910 14.16%
7 Sound Barrier, Mechanical Lock and Vehicle Immobilizer 3.85 10,510 28.66%
8 Track and Trace, Sound Barrier and Mechanical Lock 3.52 10,015 32.52%
9 Sound Barrier, Vehicle Immobilizer and Reinforced Trailer 3.41 9,358 30.02%
10 Mechanical Lock and Vehicle Immobilizer 3.28 5,759 17.88%
The highest B/C ratio is still given by the mechanical locks, followed by the parallel combination
of sound barrier and mechanical locks, reinforced trailers, the sound barrier, the combination of
sound barrier and reinforced trailers etc. (Table 6). The first solution showing devices in series
ranks in 6th place and is made up of the combination of a sound barrier, a reinforced trailer and a
mechanical lock installed on the trailer’s doors (Figure 13).
The next table shows the first ten scenarios sorted on the NPV index (Table 7). The highest NPV
is given by the combination in parallel of the sound barrier, mechanical lock and vehicle
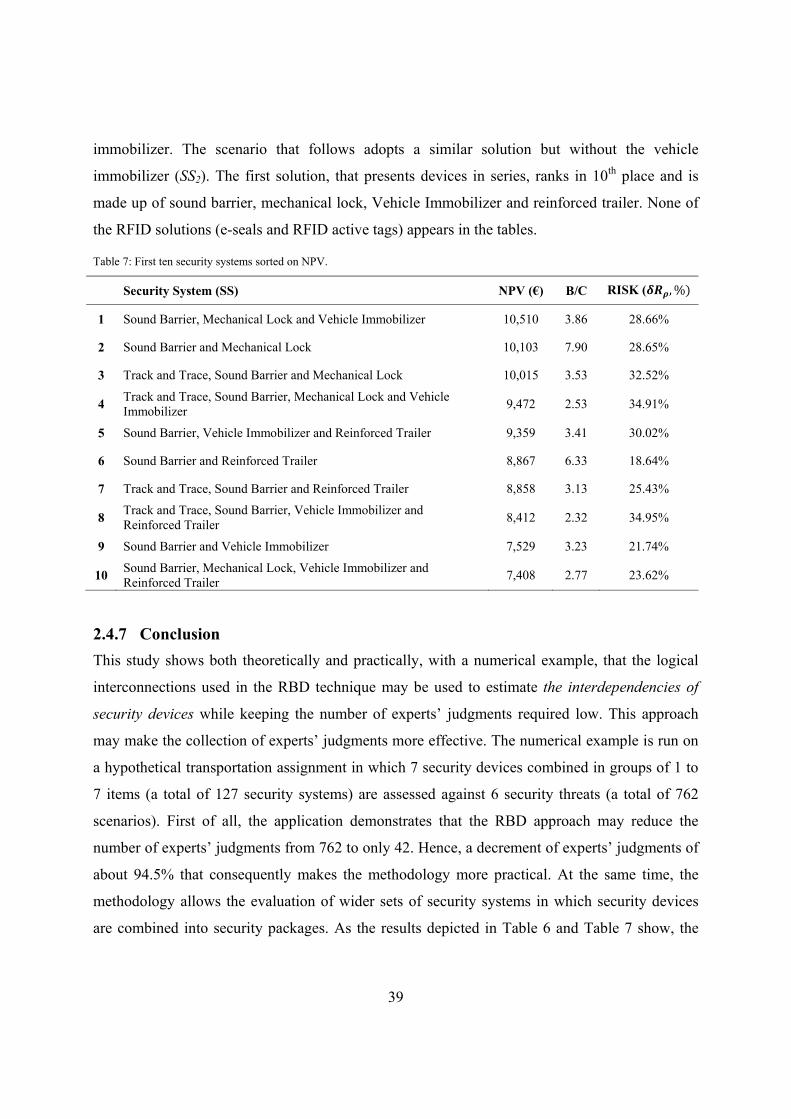
39
immobilizer. The scenario that follows adopts a similar solution but without the vehicle
immobilizer (SS2). The first solution, that presents devices in series, ranks in 10th place and is
made up of sound barrier, mechanical lock, Vehicle Immobilizer and reinforced trailer. None of
the RFID solutions (e-seals and RFID active tags) appears in the tables.
Table 7: First ten security systems sorted on NPV.
Security System (SS) NPV (€) B/C RISK ( , %)
1 Sound Barrier, Mechanical Lock and Vehicle Immobilizer 10,510 3.86 28.66%
2 Sound Barrier and Mechanical Lock 10,103 7.90 28.65%
3 Track and Trace, Sound Barrier and Mechanical Lock 10,015 3.53 32.52%
4 Track and Trace, Sound Barrier, Mechanical Lock and Vehicle Immobilizer 9,472 2.53 34.91%
5 Sound Barrier, Vehicle Immobilizer and Reinforced Trailer 9,359 3.41 30.02%
6 Sound Barrier and Reinforced Trailer 8,867 6.33 18.64%
7 Track and Trace, Sound Barrier and Reinforced Trailer 8,858 3.13 25.43%
8 Track and Trace, Sound Barrier, Vehicle Immobilizer and Reinforced Trailer 8,412 2.32 34.95%
9 Sound Barrier and Vehicle Immobilizer 7,529 3.23 21.74%
10 Sound Barrier, Mechanical Lock, Vehicle Immobilizer and Reinforced Trailer 7,408 2.77 23.62%
2.4.7 Conclusion This study shows both theoretically and practically, with a numerical example, that the logical
interconnections used in the RBD technique may be used to estimate the interdependencies of
security devices while keeping the number of experts’ judgments required low. This approach
may make the collection of experts’ judgments more effective. The numerical example is run on
a hypothetical transportation assignment in which 7 security devices combined in groups of 1 to
7 items (a total of 127 security systems) are assessed against 6 security threats (a total of 762
scenarios). First of all, the application demonstrates that the RBD approach may reduce the
number of experts’ judgments from 762 to only 42. Hence, a decrement of experts’ judgments of
about 94.5% that consequently makes the methodology more practical. At the same time, the
methodology allows the evaluation of wider sets of security systems in which security devices
are combined into security packages. As the results depicted in Table 6 and Table 7 show, the

40
combinations of security devices may be more profitable than single devices, both in terms of
B/C ratios and NPVs.
2.5 Criticism of Licentiate Study At the end of the licentiate work diverse limitations were identified. First of all, the first research
question was based on an explorative approach whose theoretical validity is difficult to
demonstrate. The last research question, related to the development of the investment model, had
two main limitations: the evaluation of investments on long-term periods didn’t take into account
the learning capabilities of criminals. At the same time, the simulation model didn’t consider
other beneficial effects of some security devices on the performance of distribution networks,
e.g. GPS systems may enhance on-time deliveries, quick responses etc.
To overcome these issues three possible approaches were possible. The first involved performing
a survey study to enhance the generalizability of the findings from the first research question.
The second was to enhance the investment model by applying game theory approaches to model
the opportunistic behaviors of criminals and thereby improve the reliability of the profitability
indexes along long-term investment periods. Finally, the third regarded the exploitation of the
QRA approach to simulate the impact of security incidents on supply chains’ efficiency in terms
of inventory costs, transportation costs, unsatisfied customers’ demand etc. Previous research
has developed plenty of simulation models showing how supply chain disruptions determine loss
of efficiency and monetary costs to operators. However, the majority of these works are
addressed to safety accidents and not to security incidents.
The first alternative, the survey study, was the alternative chosen to continue the work done in
the licentiate thesis. This decision was based on conceptual and practical arguments. From a
conceptual viewpoint it was more interesting to generalize the results of the first research
question because the findings of the second and third research questions, despite their
limitations, were already useful tools that could support managers in choosing security measures.
The enhancement of these tools was without any doubt a relevant contribution to previous
research, but the practical contribution could have been strongly questioned, since the majority
of security and risk managers today work with qualitative tools. Another belief was that the
choice of a security measure is strongly dependent on the magnitude of the budget put at
disposal. Hence, it is more relevant to find confirmation about the business mechanisms that

41
determine the commitment of companies to security. The first part of the licentiate thesis tried to
answer this question; however the implementation of a qualitative explorative approach
penalized the findings and consequently the theoretical contribution.
From a practical viewpoint, the survey study is often a cost-efficient research design. There are
some risks of receiving a low response rate, but it was believed that the adoption of anonymous
post envelopes could have improved the data collection. Or at least it could have been better than
performing interviews and direct observations. The game theory study required a deeper
understanding of criminal psychology to develop models capable of forecasting criminals’
behaviors. Hence, the lack of this knowledge as well as the complexity of setting up
collaboration with experts in the criminology field influenced the decision to abandon this path.
Finally, the simulation of supply chain disruptions caused by security incidents required, first of
all, a case study and secondly the close collaboration between logistics companies with security
experts and technology developers. This was also a problematic path for various reasons. First of
all, it is well known that security is a delicate topic within companies and therefore
confidentiality issues would have make it difficult to find a case. Even though the case could
have been found it still remained the problem that the majority of the experts in transportation
and logistics security are more favorable to adopt qualitative methods. Hence, confidentiality
issues together with lack of enthusiasm to provide practical support to gather data would have
made the project idea hard to perform.
As a consequence, after a careful evaluation of conceptual and practical motivations it was
decided to continue the work done in the licentiate thesis by performing a survey study with
Swedish physical distribution carriers. Such a study was believed to be more cost-efficient and
most of all more relevant because of its research and practical contributions.

42
3 Literature review
This section presents the literature reviewed during the investigation performed after the licentiate study
(between 2008 and 2009). The literature is classified in five research areas and articles clustered in each
of the areas are briefly summarized.
The topic examined in this research appears to be relatively new in the supply chain and logistics
discipline. Nevertheless, some studies have been performed and published in previous scientific
literature. This section presents an overview and classification of the literature related to supply
chain and transport security published between 2008 and 2009 (Table 8). More details about the
methodology are given in Chapter 5. The research area identified within this study may be
classified in five sub-areas:
1. Recommendations to enhance security.
2. Factors influencing supply chain security.
3. Security impacts.
4. Research agendas.
5. Supply chain risk management.
3.1 Recommendations to Enhance Security Autry and Bobbitt (2008) perform a study to explore multiple approaches to mitigation of
security in supply chains. The methodological approach of the authors is based on a literature
review and on a self-administered survey interview with open-ended questions. 31 individuals
responded to the survey during a workshop. The findings reveal four main emerging trends that
are recommended to enhance security:
• Preparation and planning, highlighting the importance of resiliency as well as mutual
understanding between supply chain partners and the role of insurances.
• Security related partnerships, covering contractual agreements and risk and reward
sharing.
• Organizational adaptation, concerning the physical introduction of security enhancements
for securing and recovery purposes.

43
• Security dedicated communication and technology, i.e. the implementation of GPS
monitoring, RFID and similar technologies to monitor and enhance security in supply
chains.
Meixell and Norbis (2008) performed a literature review to identify themes related to transport
choice and carrier selection. The literature search is performed within peer-reviewed journals
over the past 20 years. In addition, practitioners’ articles are used as a supplement and to bring to
light the current challenges in the logistics field. The findings reveal that the following themes
are under-represented in transportation choice literature: environmental and energy use, supply
chain security, supply chain integration, international growth and role of IT. More specifically,
security is depicted as an important criterion for the carrier selection decision process to mitigate
economic losses borne by companies.
Table 8: Summary of research area.
Recommendations Factors
influencing Security
Security Impacts
Research Agendas SCRM
Autry and Bobbitt (2008) X
Meixell and Norbis (2008) X
Manuj and Mentzer (2008) X X
Whipple et al. (2009) X
Voss et al. (2009) X
Williams et al. (2009b) X
Hameri and Hintsa (2009) X
Williams et al. (2009a) X
Staake et al. (2009) X
Williams et al. (2008) X X
Asbjørnslett, (2008) X = 2 4 2 2 3

44
3.2 Factors Influencing Security Manuj and Mentzer (2008) also emphasize that many initiatives to enhance security in supply
chain organizations are based on the C-TPAT certification and other similar authority regulations
(e.g. International Ship and Port facility Security).
In Whipple et al. (2009) the authors try to determine whether international supply chain firms put
more emphasis on security than domestic ones. The authors make use of a survey sent to a group
of 1,385 respondents. The response rate was 14%. The results confirm that global supply chains
place more managerial importance on security. In addition, managers of international firms
experience an increased ability to detect and recover from security incidents.
Voss et al. (2009) underline the importance of willingness to pay and the concern of firms to
ensure that suppliers with advanced security are selected. The authors try to assess whether firms
in the food industry are willing to trade off price and delivery reliability in return for greater
supply chain security. The methodology is based on Grounded Theory approach to enhance the
knowledge of the topic and develop a first draft of the survey. Thereafter data were collected
with a survey and analyzed by means of conjoint analysis. The sample group size was of 1,228
firms. A total of 130 managers answered the survey, giving a response rate of 10.5%. The results
show that price and delivery reliability, are more important than security. In addition the authors
demonstrate the positive relationship between concern over security incidents and preferences
for advanced security as well as willingness to trade off price for advanced security. Finally, the
findings also show that international sourcing is positively related to preferences for suppliers
with higher security competences and to willingness to pay higher prices and lowering delivery
reliability. The same approach is proposed in Voss et al. (2009a), but this time to compare firms
in terms of the strategic priority given to security. The findings reveal that companies placing a
high level of strategic importance on security have higher levels of security implementation as
well as better security performance.
In another article, Williams et al. (2009b) enhance their exploration of drivers affecting security
in supply chain firms. The authors exploit institutional theory as a background to determine the
environmental drivers that motivate firms to engage in Supply Chain Security (SCS). The study
is based on 17 in-depth interviews, and the results identify the following drivers: government (C-
TPAT certification), customers (customers request higher security), competitors (firms believe

45
that security may ensure competitive advantage on the marketplace), and society (the impact that
security breaches may have on society).
3.3 Security Impacts Hameri and Hintsa (2009) make a study to identify drivers of change in cross border supply
chains and assess their impacts on global supply chain management. The investigation is based
on a Delphi panel and a literature review of 150 publications. Data collection is performed by
means of semi-structured interviews with 33 industry professionals and a final workshop to
compile a total of 14 supply chain change drivers and 44 supply chain parameters. In the findings
14 drivers of change in supply chains are identified. Among these, security concerns are believed
to be significant and will probably continue to be a central issue for stakeholders in the future. In
particular, security will shape the global business environment and affect supply chain
performance.
Williams et al. (2009a) recognize the importance of security-focused culture in organizations to
embrace higher security, as well as the importance of introducing activities to support security.
Therefore the paper introduces a psychometric scale to measure supply chain security culture in
organizations. The investigation makes use of a survey to measure the level of security culture in
supply chain industries (including wholesalers, distribution, manufacturers, carriers etc.). The
survey consists of five questions to measure Supply Chain Security Culture (SCSC) and five
questions to measure resiliency. The survey was sent to a total of 1,753 unique individuals
identified in the Council of Supply Chain Management Professionals database (CSCMP). The
final response rate was 3.5%. The findings put into evidence the validity and reliability of the
scale developed to measure SCSC in supply chain organizations. Finally the authors also discuss
the strong positive correlation between SCSC and resiliency.
3.4 Research Agendas Two of the articles, located in the literature review explore previous research to determine
research gaps and need for future research. Staake et al. (2009) present a literature review
focusing on the counterfeiting trade and its economic principles. At the end of the analysis, the
authors point out that the problem exists and it is relevant in practical instances, but that still too
little is known by researchers due to the low accessibility to the phenomenon. Williams et al.
(2008) also complain about the lack of research in academic settings. Therefore, they set up a

46
research agenda for Supply Chain Security by means of a literature review. The findings classify
existing articles into four approaches: inter-organizational, intra-organizational, both, or ignore.
Thus the authors conclude by stating the need for more primary empirical research on Supply
Chain Security.
3.5 Supply Chain Risk Management An area of high relevance in the supply chain and logistics discipline is that of risk management.
Supply chain risk management is “the identification and management of risks for the supply
chain, through a coordinated approach amongst supply chain members, to reduce vulnerability
on the whole” (Jüttner et al., 2003). Norrman and Lindroth (2004) classify supply chain risk
management in a three dimensional framework in which emphasis is put on the unit of analysis,
business continuity management and type of risk and uncertainty. Typical accidents in supply
chains that have been widely studied in existing literature are those in which the following
sources of risk are involved (Manuj and Mentzer, 2008; Norrman and Jansson, 2004; Paulsson,
2007; Mullai, 2007; Viswanadham and Gaonkar, 2007; Franck, 2007; Asbjørnslett, 2008;
Parentela and Cheema, 2002; Harland et al. 2003):
• Supply. Improper selection of inbound suppliers, capability deficiency to meet customer
demand.
• Strategic. All parameters affecting business strategies implementation.
• Demand/Capacity. Lack of flexibility to respond to demand variations in outbound
flows. For instance Agrell et al. (2002) explore incentives for demand uncertainty related
risks in the telecom industry. In this case the demand concerns coverage, capacity and
telecom services.
• Natural Catastrophes. Examples of such risks are earthquakes, floods, hurricanes etc.
that may damage and shutdown plants, transportation and other sensitive operations.
• Equipment failure. Failure of technical components that have a central role in
production, transportation, storing operations.
• Operational. These are all the adverse internal events in supply chains that may affect
the capability of industries to produce and ensure quality and timeliness. Accidents
involving dangerous goods are a relevant example. Consequences are hazardous for
industries and society (Parentela and Cheema, 2002; Mullai, 2007).

47
• Financial and Fiscal. Potential losses caused by variation of financial and taxation
markets.
• Regulatory. The risks to which firms are exposed because of changes in regulations, i.e.
environmental or security regulations.
• Legal. All risks related to litigations between or within supply chain firms, i.e. with
customers, suppliers, shareholders or employees.
Supply chain security may be identified within the larger construct of Supply Chain Risk
Management since “disruptions of flows between organizations” constitute a risk for a supply
chain (Jüttner, 2005), apart from the fact that they are caused by mistakes or voluntary actions
(security incidents). Hence, it may be possible to locate the discussion about security in the
larger construct of supply chain risk management. Many authors point out that security in supply
chains may be managed by following existing risk management models and theories (Manuj and
Mentzer, 2008; Sheffi, 2001; Asbjørnslett, 2008). Williams et al. (2008) state that there are four
constructs that can be associated with supply chain risk management and the security construct.
Figure 15: Security related model for Supply Chain Risk Management (Williams et al., 2008, adapted from Jüttner et al., 2003).
These constructs are shown in the figure above (Figure 15) and are based on a framework
developed by Jüttner et al. (2003) in which the following concepts are included:
Supply Chain Risk Sources
Hazards Accidents
Security Incidents
Disruptions
Vulnerability
Outcomes
Supply Chain Risk Mitigation Strategies Inter/Intra-organizational complexity
- Mitigate - Avoid - Control
Risk Drivers

48
• Risk Sources. Typical risk sources have been enumerated in this section and may include
both hazards and security threats (even though the focus of the supply chain risk
management discipline is on hazards-related accidents). These threats may cause
disruptions of supply chains.
• Risk drivers of supply chain strategy. Examples of risk drivers may be the
globalization and outsourcing trends that have aggravated the exposure of supply chains
to risks as well as to disruption consequences.
• Supply chain risk management strategies. These include all activities to mitigate,
control and avoid risks as well as supply chain coordination and flexibility.
• Outcomes of supply chain risks. The main outcomes include disruptions and
vulnerability, i.e. the exposure to threats that may introduce disturbances into a supply
chain (Christopher and Peck, 2004).
3.6 Conclusion This literature review highlights the importance of performing more empirical research on the
topics of logistics and supply chain security. Previous research points out that security is an
important source of risk to be considered by supply chain and logistics managers (Manuj and
Mentzer, 2008; Sheffi, 2001; Asbjørnslett, 2008). Therefore, it is fundamental to identify drivers
of risks in supply chains to optimize risk mitigation strategies and consequently moderate the
negative outcomes of disruptions (Williams et al., 2008; Jüttner et al., 2003). However, despite
the highly scientific relevance, it appears that too little empirical research has been performed to
identify factors external to the supply chain that may influence the efforts made by firms to enact
security. Voss et al. (2009) find that companies operating in the food segment are willing to trade
off price and delivery reliability with greater security (customers’ willingness to pay). In
addition, the hypothesis about the relationship between the length of supply chains (domestic vs
global) and the demand for security is also supported (ibid). Other authors identify the following
factors influencing the security of supply chains: supply chain length, customers’ requirements,
authority regulations, and security related partnerships (Giunipero and Eltantawy, 2004; Cupp et
al., 2004; Craighead et al., 2007; Whipple et al., 2009). However, only Whipple et al. (2009)
perform an empirical study to demonstrate the influence of supply chain length and security
partnerships.
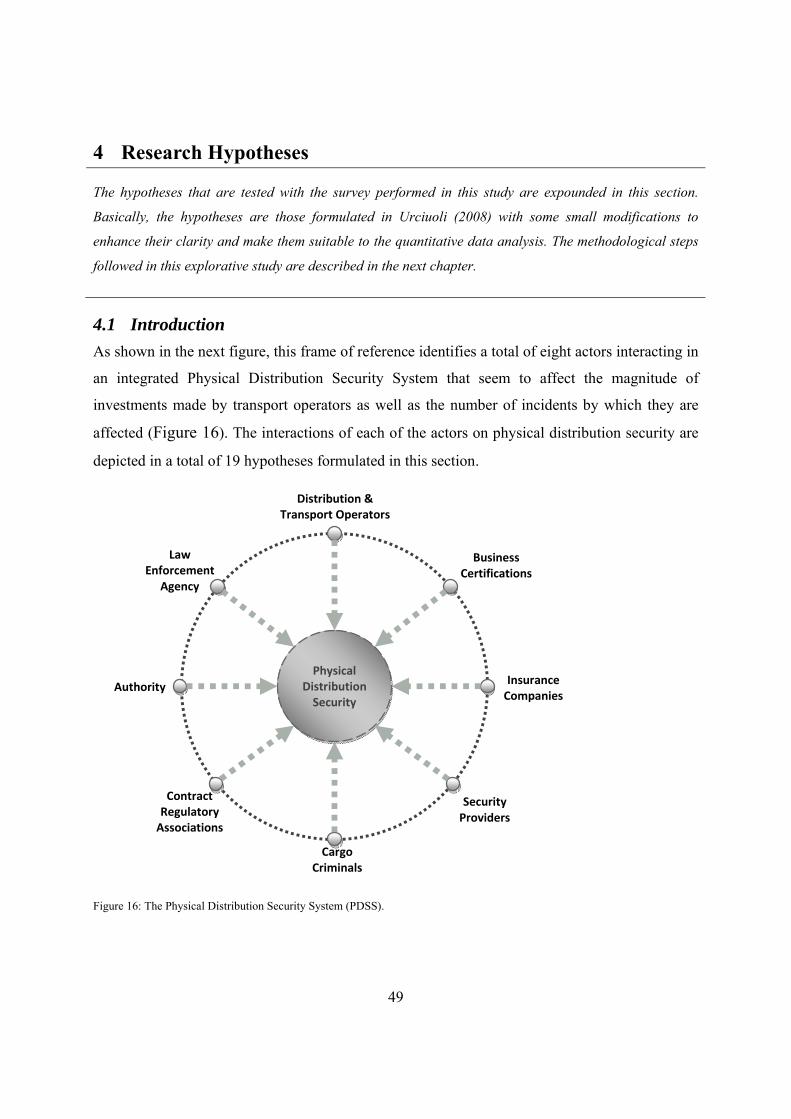
49
4 Research Hypotheses
The hypotheses that are tested with the survey performed in this study are expounded in this section.
Basically, the hypotheses are those formulated in Urciuoli (2008) with some small modifications to
enhance their clarity and make them suitable to the quantitative data analysis. The methodological steps
followed in this explorative study are described in the next chapter.
4.1 Introduction As shown in the next figure, this frame of reference identifies a total of eight actors interacting in
an integrated Physical Distribution Security System that seem to affect the magnitude of
investments made by transport operators as well as the number of incidents by which they are
affected (Figure 16). The interactions of each of the actors on physical distribution security are
depicted in a total of 19 hypotheses formulated in this section.
Figure 16: The Physical Distribution Security System (PDSS).
Physical Distribution
Security
Distribution & Transport Operators
Business Certifications
Insurance Companies
Security Providers
Cargo Criminals
Contract Regulatory
Associations
Authority
Law Enforcement
Agency
50
The system is outlined by combining previous research with data collected from secondary
sources, observations2, and a total of 16 interviews (4 unstructured and 12 semi-structured)
performed with key actors in the transport security area (Table 1 in Chapter 2). The scheme for
the interviews performed is provided in Appendix 2 of this report.
4.2 Law Enforcement Agency The relevance of the law enforcement agency to prevent theft as well to support operators in
recovering their shipments was affirmed in two security workshops held in Sweden3. During the
events, representatives from this organization encouraged transportation companies to report
cargo theft and improve collaboration with the law enforcement. The law enforcement agency
was also criticized by the participants since often they don’t prioritize cargo theft among their
activities as well as they don’t prosecute cargo criminals. The issue concerning the rare
prosecution of criminals has also been found in articles published in scientific journals
(Anderson, 2007; Badolato, 2000). The interviews performed confirm that operators perceive
that existing laws to prosecute criminals are not strong enough to discourage thieves in taking the
risk to assault cargo moving in distribution networks. As a consequence, it is not only difficult to
capture thieves but also to keep them in custody.
“Criminals attack according to a trade-off between risks and revenues. The situation today is
that distribution chains are easy and profitable targets. At the same time, prosecution is not
severe enough to discourage perpetrators”.
“Once criminals are captured, we can keep them in custody for a limited amount of time. So they
are back in business after only few months.”
“Prosecution should be more severe to discourage criminals attacking our distribution chains.”
Other interviews confirm the relevance of the law enforcement agency in the discussion
concerning physical distribution security. According to three of the respondents, the problem
faced today is that the amount of received theft claims from transport operators is not high
enough to justify an increment of resources to combat criminals. Transport operators are afraid to
2 IF seminar, Gothenburg, March 2008. Worskhop on Transportation Security, Jönköping, November 2007. 3 IF seminar, Gothenburg, March 2008. Worskhop on Transportation Security, Jönköping, November 2007.

51
show their brands in theft statistics. In addition, they feel that this is only an administrative cost
that will rarely lead to cargo recovery.
“Transport operators are afraid to show their brand names in theft statistics and therefore they
don’t announce the problem to the police that in its turn doesn’t have the real picture of the
situation”.
“Operators are not claiming enough, thus we cannot allocate resources adequately.”
“Our company has good cooperation with the national law enforcement agency. However, we
know that many thefts are not reported by other companies. This makes it hard to combat cargo
theft.”
Two respondents also say that to reduce the increase in cargo theft experienced during recent
years, the Swedish law enforcement agency is today working with activities to increase
awareness about the cargo security problem.
“The activities organized by the law enforcement agency have contributed to increase awareness
of the cargo theft problem”
“Thanks to the workshops we have had the possibility to come closer to the law enforcement
agency and strengthen collaboration”
Hence, the following hypotheses are formulated:
H1a. Companies that perceive that criminals are not prosecuted are discouraged from
improving security.
H1b. Companies that perceive that the Swedish law enforcement agency is not allocating enough
resources are discouraged from enhancing security.
H1c. Companies that perceive as beneficial the collaboration in activities organized by the
Swedish law enforcement agency are stimulated to improve security.

52
Figure 17: summary of hypotheses related to the impact of law enforcement agency on security (note: arrows don’t imply causal relationships).
4.3 Distribution and Transport Operators According to previous research, supply chain, logistics and transport operators have an influence
on the security of distribution chains. This influence may be characterized by the following
factors: length of distribution networks, JIT trends, willingness to pay and impacts of security on
efficiency.
Globalization and JIT trends are exposing supply chains to higher risks. Moving products in
foreign countries where companies lack knowledge of local culture, authorities and legislation
makes it difficult to protect cargo (Crone, 2006; Khemani, 2007; Sheffi, 2001). Crone (2006)
compares today’s globalization strategies to the classic story of the Trojan War where the
Trojans “failed to see the risks of what appeared to be a benefit”. Voss et al. (2009a)
demonstrate that international sourcing is positively related to preferences for suppliers with
higher security competences. Firms expanding into foreign markets also have a tendency to
enhance security (Manuj and Mentzer, 2008). Managers of global supply chains place more
importance on supply chain security and are more likely to enhance the protection of their assets
(Whipple et al., 2009). Giunipero and Eltantawy (2004) state that longer supply chains
necessitate higher security.
Just in Time may increase the exposure of shipments to threats as well as the economic
consequences of security incidents. Shipments arriving too early or too late to the receiving
terminals have to wait outside, increasing the chance for theft (Tarnef 2006). Just in Time (JIT)
trends tighten supply chains in a way to increase the consequences of disruptions and thereby
Resource Allocation
Prosecution
Collaboration
Security
H1a
H1b
H1c

53
increasing the risks of security incidents in distribution networks (Khemani, 2007). According to
an analysis performed by Wilson (2005), Just in Time manufacturing and deliveries or
streamlined order fulfillment techniques can reduce in-transit and on-hold inventories but can
also severely increase the magnitude of disruptions. None of the workshops4 or the interviews
performed unveiled the importance of the globalization factor. However, JIT principles were
under discussion during the workshop and seminars attended. More specifically, the participants
were claiming that JIT increases cargo flows on the transportation networks and thereby the
frequency of attacks. At the same time, other JIT practices, such as for instance shorter time
windows to load/unload cargo at terminals, may force trucks to wait outside facilities and
thereafter increase possibilities of attacks.
Willingness to pay by goods owners may also be an inhibitor of physical distribution security
(Voss et al., 2009). Supply chain firms are not always willing to pay for firms offering advanced
security transportation. Voss et al. (2009) demonstrate the positive relationship between concern
over security incidents and preferences for advanced security as well as willingness to trade off
price for advanced security. The findings show that price, and delivery reliability, are more
important than security when contracting suppliers. Hence, this suggests that if companies want
to retain market competitiveness, security investments may become an issue, especially if
customers are not willing to pay (Thibault et al., 2006).
Four managers mentioned the difficulties encountered in raising their prices when enhancing
security. In two of the interviews, the respondents highlighted the fact that goods owners
requesting higher security also have to be willing to pay for it.
“Security costs have to be internalized into our freight rates. Thus it is difficult for us to remain
competitive on the marketplace”
“Some customers are willing to pay for extra costs related to security. Thus we increase our
prices. In some cases we also perform a negotiation process with the transport carriers to define
how security costs, direct and indirect, have to be split”
Previous literature outlines the correlation between security and efficiency as factors that may be
interrelated (Rice and Spayd, 2005; Lee and Whang, 2005; Willy and Ortiz, 2004). In Mazeradi
4 IF seminar, Gothenburg, March 2008. Worskhop on Transportation Security, Jönköping, November 2007.

54
and Ekwall (2009) it is shown how the implementation of the ISPS-code may increase
paperwork and slow down processes. Likewise, Stevenson (2005) indicates the negative impact
of the ISPS code on costs and the efficiency of port terminals. Security measures are required to
be built upon existing efficiency and quality processes that today are the top priority areas of
transportation companies. It is well known that these actors, especially the carrier operators, face
costs and time pressures from their customers and are demanded to efficiently manage products’
demand volatility. At the same time, wasting time and costs, caused by infrastructure bottlenecks
as well as by the high complexity of transport chains in which multiple actors with conflicting
goals interact must be avoided (Urciuoli et al., 2010). Besides this, security routines constitute
additional mandatory work for terminal, manufacturing or transport operators, whose personnel
are forced to learn and apply new procedures on top of their duties (Rolandsson and Ekwall,
2008). Finally, existing security tools are too complex and expensive to be implemented and
necessitate qualified operators as well as top management commitment to be truly effective in a
transport company. As a consequence, it can be hypothesized that the performance of logistics
and transportation services may be seriously compromised (Williams et al., 2008; Urciuoli et al.,
2010).
The following hypotheses can be formulated:
H2a. Companies that encounter difficulties in raising freight rates are discouraged from
improving security.
H2b. Companies applying JIT principles are discouraged from improving security.
H2c. Companies that are part of international distribution networks are more interested in
improving security.
H2d. Companies believing that security measures may negatively affect their performance level
don’t improve security.

55
Figure 18: summary of hypotheses related to the impact of distribution and transport operators on security (note: the arrows don’t imply causal relationships).
4.4 Business Security Certifications Some participants to the workshops5 mentioned the existence of TAPA EMEA (Transported
Asset Protection Association) as an organization supporting transportation buyers and sellers
with recommendations and guidelines to secure transportation assets (TAPA EMEA, 2009).
Participants believed that the implementation of routines and specific technologies suggested by
the organization might enhance physical distribution security. Other secondary data mention the
International Standards Organization (ISO) certification as a means to enhance supply chain
security (Liard, 2007; ISO, 2008). The ISO proposes best practices and minimum requirements
for supply chain management, recommends technologies (e.g. mechanical locks or electronic
seals) and establishes communication standards for radio frequency based security solutions
(Liard, 2007; ISO, 2008).
H3. Companies complying with business certifications have higher security.
5 IF seminar, Gothenburg, March 2008. Worskhop on Transportation Security, Jönköping, November 2007.
Freight Rates Increments
JIT
Lenght of Distribution
Network
Security
H2a
H2b
H2c
Performance
H2c

56
Figure 19: summary of hypotheses related to the impact of Business Security Certifications on security (note: the arrows don’t imply causal relationships).
4.5 Insurance Companies The role of insurers concerns the coverage of the risks related to loss or damage of goods during
a transportation assignment. All the mentioned parties involved in goods transportation,
including consignors and consignees, LSPs and transport carriers, have the possibility to buy
property or liability insurances, according to what is stated in the contract agreement. Likewise,
stakeholders have the possibility to retain part of these risks to pay lower premiums (Stöth,
2004).
The role of the insurance companies is confirmed in the workshops where observations were
performed6. The collected data reveal that operators blame the insurance companies for exerting
pressure on their customers and denying premium discounts to customers retaining risks by
purchasing or implementing security measures. Managers were expecting not only financial
solutions but also practical support in choosing security measures and defining security levels in
transport operations. Another finding from the workshops was that operators with a risk-seeking
attitude could trade off the costs for insurance premiums and excesses with the costs of
implementing security solutions. This was especially true if the contracted operators were not
obliged, by means of contracts, to follow specific security recommendations. Two respondents
declared that insurances’ excesses are too high, and therefore operators prefer to bear the
consequences of the losses.
“We know that if the loss is lower than the insurance excesses than we prefer to pay it
ourselves”
“We have insurances and also our transport carriers do. However, we know that companies
prefer to pay the losses themselves, since the excesses are too high”
6 IF seminar, Gothenburg, March 2008. Worskhop on Transportation Security, Jönköping, November 2007.
Business Security
Certifications Security
H3

57
Other secondary data used for the analysis and related to insurance companies concern mostly
the procedures to sub-contract carriers and transfer risks, as well as current regulations to define
cargo liabilities (Stöth, 2004; ICC, 2008; NSAB, 2000).
Finally, when it comes to the application of premium discounts, opinions diverge. Two
respondents state that they encounter difficulties to agree on discounts. As one of them states:
“We have a dialogue with only one insurance company and they are not willing to give us
premium reductions. This is nonsensical...”
Contrarily three respondents declared that it is possible to have discounts, although in some cases
these are too low and affect only the excesses.
The following hypotheses are formulated:
H4a. Companies that make use of insurances to cover the economical losses of security incidents
are less interested in improving security.
H4b. Companies benefiting from premium discounts don‘t work actively with enacting security.
Figure 20: summary of hypotheses related to the impact of Insurance Companies on security (note: the arrows don’t imply causal relationships).
4.6 Security Providers Security solutions providers can be distinguished in two categories: security services and
technology providers. Providers of security services offer expertise in the form of education,
consultancy, surveillance guards, screening and technological systems like GPS monitoring,
camera surveillance, mobile-based alarms etc. Technology providers work by combining
hardware sensors and software platforms to automate security processes and increase the
accuracy of prevention, detection and recovery operations. Among the solutions available on the
market, some are addressed to packages; others can be installed on unit loads (pallets, containers
or trailers), or on the transport conveyance. Other solutions deal with protecting facilities from
Insurance Coverage
Premium Discounts
Security
H4a
H4b
58
external intrusion (i.e. gates, fences, access control, Closed Circuit TeleVision) (Sheffi, 2001;
Urciuoli, 2009). Three of the interviewed professionals underlined the importance of using
security solutions to combat criminals attacking distribution chains.
“We work intensively with detection sensors to be installed at our facilities and protect them
against various threats. These sensors include motion detection or perimeter alarms to be
installed at main doors or windows.”
“We put great emphasis on security technologies, and when it comes to the protection of our
facilities we want to be a step ahead of our competitors”
“Our terminals are highly secured although it is often difficult to have the security budget
approved by top management”
While facility based security measures are widely implemented by operators, most of the security
solutions intended to protect assets in movement (e-seals, track and trace) appear to be in a
development stage and are experiencing difficulties in taking off. As a consequence, potential
customers express concerns about the costs and the prematurity of the technology (Engler, 2007).
According to Liard (2007), most companies believe that the value provided by security solutions
does not justify the expensive investments in technologies that are still in a development phase.
The development of integrated solutions is too hard because of the presence of too many players
in supply chains (Liard 2007). Even though ISO is actively working at issuing security standards
(ISO, 2008), technology providers still lack leadership from industries or governments in
establishing standard requirements (Liard, 2007). None of the respondents mentioned this
reasoning.
The expensiveness of security solutions is also an obstacle to the enhancement of security in
physical distribution networks. This has been confirmed by three interviewed professionals as
well as during the workshop in Jönköping.
“We make assessments of technologies ‘on offer’. However, most of these systems cannot
guarantee 100% security and cost too much money. You can imagine the financial implications
of implementing these systems on a fleet of a hundred vessels”
“As a security manager I get a limited budget to spend on security. Thus it is difficult to buy
more advanced technologies”

59
“… only those companies that have access to money and resources can properly attack the
problem”
H5a. Companies believing that security solutions are in a development stage and difficult to
integrate do not improve security.
H5b. Companies believing that security solutions are too expensive compared to the value
provided do not improve security.
Figure 21: summary of hypotheses related to the impact of Security Providers on security (note: the arrows don’t imply causal relationships).
4.7 Cargo Criminals Criminals’ actions depend on a trade-off between costs and revenues. If risks are too high
criminals will search for easier targets to attack. Criminology models the behaviors of these
players according to the principle of the rational choice theory. Ekwall (2007) states that
situational crime is determined by a rational choice made by weighing diverse factors such as
effort, potential payoff, risk of apprehension and punishment and individual needs. A variation of
situational crime is the professional theft that is based on methodical plans and takes advantage
of high-tech methods to defeat protection measures (Ekwall, 2007; Ekwall and Lumsden, 2007).
Ekwall (2009), according to the principles of the routine activity theory, identifies three elements
characterizing cargo theft: a perpetrator, a supply chain (the criminals’ target) and the lack of
protective measures. Insufficient protection in one of the links of a supply chain will determine a
weak point and the consequent attack (crime displacement effect) (Ekwall, 2009a). Two
respondents confirmed this line of reasoning:
“Criminals search for weak points and attack in specific places where they know trucks stop.”
“Criminals attack according to a trade-off between risks and revenues. The situation today is
that supply chains are easy and profitable targets.”
Prototypes Uncertainty
Security Expensiveness
Security
H5a
H5b

60
Despite this, companies are not motivated to increase their security levels. As one respondent
commented, “statistics show increasing attacks against freight transportation. Nevertheless, for
reasons I can’t understand, operators don’t consider this as a problem and are not seeking
adequate protection”. In one of the workshops7 some participants stated that security may
become useless and not a profitable investment since the criminals have access to financial and
technical resources to deceive existing measures.
Hence, the hypothesis is the following:
H6. Companies perceiving the opportunistic behavior of criminals do not improve security.
Figure 22: summary of hypotheses related to the impact of Cargo Criminals on security (note: the arrows don’t imply causal relationships).
4.8 Contract Regulatory Associations The relationships among actors involved in a shipment are regulated by specific laws. While
transportation disputes are stated in international conventions and rules (e.g. CIM, CMR
conventions), logistics matters concerning such operations as inventory management, labeling or
packaging are not put under any convention and are primarily determined by industrial
organizations or private agreements (e.g. Incoterms 2000 and NSAB 2000). Transport
agreements can be performed in verbal or written form in which liabilities among transport
buyers and sellers about goods losses, damages, transport etc. are defined (Stöth, 2004). In most
cases, the consignor takes care of the transportation purchase and is responsible for the goods
until they are delivered. However, when a transport service is bought, risks of goods damage or
loss are usually transferred to a Logistics Service Provider (LSP). The contracted LSP can in turn
sub-contract transport carriers and transfer its risks. Each player can purchase insurances to cover
part of its risks (Stöth, 2004) (Figure 23).
7 Workshop on Transportation Security, Jönköping, November 2007.
Opportunistic Behavior Security
H6

61
Figure 23: Contractual relationships (adapted from Stöth, 2004, pp. 22).
Previous research points out the importance of security related partnerships, covering contractual
agreements and risk and reward sharing among actors (Autry and Bobbitt, 2008; Voss et al.,
2009b; Rice and Spayd, 2005). Customers create security expectations that have to be achieved
by suppliers to retain business and remain competitive on the marketplace (Williams et al.,
2009). Enacting collaboration among supply chain members and specifying security
requirements in contractual agreements may improve the security of distribution chain assets and
operations (ibid). In addition, risk-sharing and rewards are also fundamental practices to
stimulate stakeholders in taking their share of responsibility and working actively with security
(Autry and Bobbitt, 2008).
According to four of the interviews, it often happens that agreements are not properly formalized
among all the actors, especially with the physical carriers (road, rail, sea, and air carriers), or
between them (a carrier contracting another carrier). Transportation carriers are companies
owning fleets of vehicles including vessels, airplanes, trucks, and in some cases even trains (train
companies are usually state owned). Often, within the road sector, the transport carrier can even
be the driver and his vehicle. Therefore, the complexity and administrative burden experienced,
concerning laws, regulations and standard contracts, makes informal verbal agreements more
congenial.
“It happens that some carriers mention and stress the complexity of the contracts or standard
agreements. Large industries or LSPs can handle them, but often small-medium transport
carriers can prefer verbal agreements”
“According to our experience the standard agreements are perceived as too complex and it has
happened that carriers prefer verbal agreements”

62
“We know that in some cases carriers are engaged with verbal agreements”
“As an insurance association we have had cases in which transportation carriers had been
engaged with verbal agreements”
This situation was also confirmed during the observations performed at the workshops in
Sweden.8
Existing regulations like Incoterms or NSAB 2000 focus on the transfer of risks among actors
and indicate Combiterms as a means to split costs among players. In addition, in case of a loss
these agreements oblige the reimbursement of the goods invoice value plus 10% for indirect
costs (ICC, 2008; NSAB, 2000). In these standard agreements, nothing is specified about
security requirements for transportation assignments and how related costs should be split among
actors. This is a practice strongly recommended by business and authority security certifications
to ensure that security is actually enacted (Urciuoli and Ekwall, 2010). The findings from the
observations also reveal that it is crucial to specify security requirements in the contracts
between transport buyers and sellers.8
Finally, according to the observations performed8, it appears that the specification of security
requirements in contracts requires deep understanding of physical security and achieving an
agreement among parties. Companies are experiencing difficulties in justifying their security
investments, especially because it is difficult to assess the impacts of security solutions (Peleg-
Gillai et al., 2006; Rice and Spayd, 2005). Closs and McGarrell (2004) claim that the lack of
effective security metrics may make it difficult to agree on freight rate increments. In addition, it
is difficult to verify if a carrier is truly following the security measures specified in the contract.
One respondent commented that whenever an agreement is arranged, “we request our carriers to
install specific security measures, but we don’t really know if they follow them or not”.
The following hypotheses are formulated:
H7a. Companies that experience difficulties in agreeing on security requirements are not
encouraged to improve security.
H7b. Companies that perceive the contract agreements as too complex are not encouraged to
improve security. 8 IF seminar, Gothenburg, March 2008. Worskhop on Transportation Security, Jönköping, November 2007.

63
H7c. Companies that don’t share risks by means of contract agreements are not encouraged to
improve security.
H7d. Companies that do not specify security requirements are not encouraged to improve
security.
Figure 24: summary of hypotheses related to the impact of Contract Regulatory Associations on security (note: the arrows don’t imply causal relationships).
4.9 Authority Authorities are mainly afraid of the terror threats hidden in the vulnerability of international
supply chains that put society in danger. These are smuggling of weapons or terrorists,
contamination or counterfeiting of products and usage of transport conveyances as weapons (Lee
and Whang, 2005; Sheffi, 2001; Willys and Ortiz, 2005).
Authority programs (e.g. C-TPAT and AEO) promote the usage and implementation of security
routines and technologies to secure the intercontinental shipment of containers across operators
and reduce delivery uncertainties caused by inspections (CBP, 2006; CBP, 2008; CP3 Group,
2005; CP3 Group, 2006). Regulations aim primarily at preventing terror attacks, but many theft
threats will also be mitigated. Customs are the “right hand” of authorities in implementing the
mandatory requirements for inspecting containers. Their participation, together with key
technology providers, in security initiatives is fundamental to enforce fast-lanes initiatives and
guarantee free-flow through borders to certified operators (CP3 Group, 2005; CP3 Group, 2006).
Security Requirements
Agreement
Contract Complexity
Risk Sharing
Security
H7a
H7b
H7c
Security Requiremens Specification
H7d
64
Previous research also confirms the central role of customs as well as private-public partnerships
as means to enhance security in physical distribution (Sheffi, 2001; Rice and Spayd, 2005;
Manuj and Mentzer, 2008; Williams et al., 2009b). Companies that aim to enhance their security
should join authority certifications (Rice and Caniato, 2003; Sheu et al., 2006). Joining
authorities certifications may also ensure companies to retain competition (Williams et al.,
2009). Many security initiatives have been stimulated by the close collaboration between private
industries and authorities (Thibault et al., 2006; Closs and McGarrell, 2004). At the same time,
security regulations may jeopardize supply chains by introducing new costs in form of process
variabilities, time deliveries and loss of efficiency (Voss et al., 2009). Five of the respondents
mentioned that they know the AEO or C-TPAT initiatives, but only two of them declared that the
AEO initiative could influence their security investments.
“We are participating in the AEO initiative set up by the European Commission and are working
to gain compliance.”
“Yes, we are working to meet the AEO requirements since it is our desire to secure our
operations. In addition, it is important to gain compliance to simplify customs inspections and
avoid transport delays.”
Other authors acknowledge the importance of following the authority regulations but report also
that many operators are afraid of the impacts on organizational efficiency. Security measures, in
the form of inspections, are seen as conflicting with logistics efficiency. Thus, shippers are afraid
to introduce new administrative costs to gain compliance that have to be internalized in their
products’ prices. Absence of business cases, solid ROIs and clear guidelines intimidates many
operators (Lee, 2004; Rice and Spayd, 2005; DNV, 2005). According to Liard (2007) some
operators are waiting for more detailed definitions from authority programs before taking
investment decisions.
The following hypotheses can be formulated:
H8a. Transportation companies complying with the AEO certification have higher security.
H8b. Transportation companies that have a negative perception about the impact of AEO
regulations on security and efficiency are discouraged from enhancing security.

65
Figure 25: summary of hypotheses related to the impact of Authority regulations on security (note: the arrows don’t imply causal relationships).
AEO Compliance
AEO Impact
Security
H8a
H8b
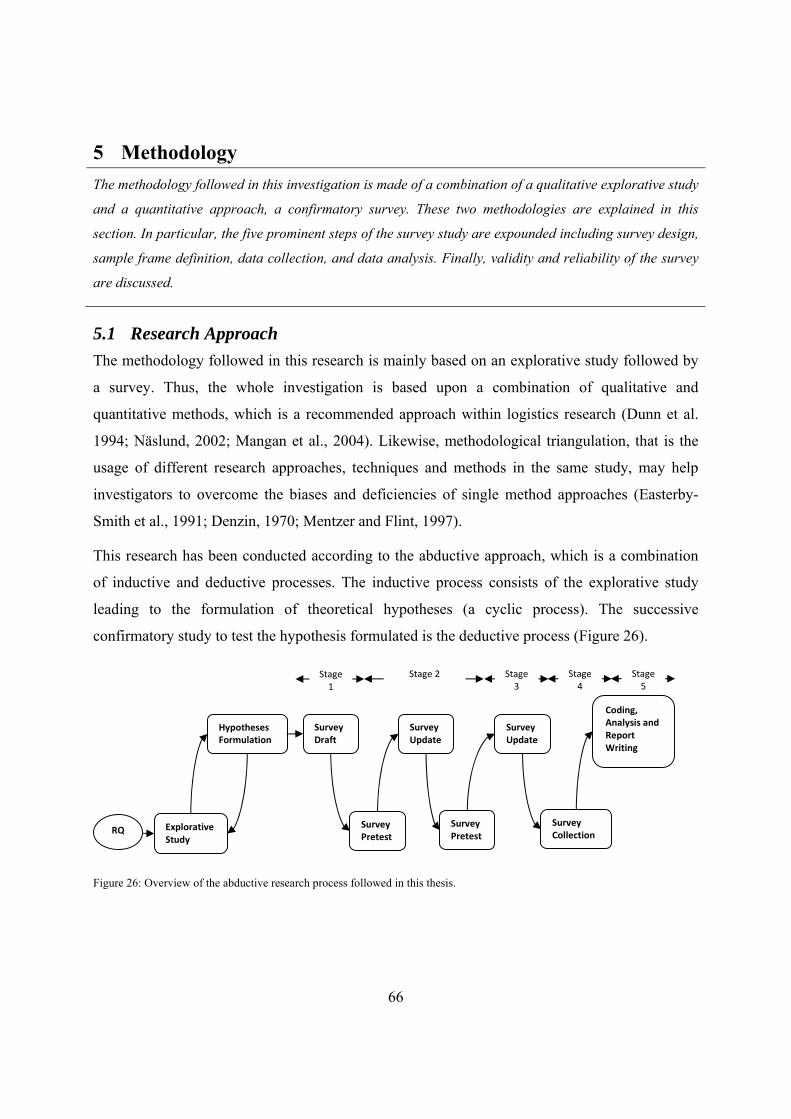
66
5 Methodology The methodology followed in this investigation is made of a combination of a qualitative explorative study
and a quantitative approach, a confirmatory survey. These two methodologies are explained in this
section. In particular, the five prominent steps of the survey study are expounded including survey design,
sample frame definition, data collection, and data analysis. Finally, validity and reliability of the survey
are discussed.
5.1 Research Approach The methodology followed in this research is mainly based on an explorative study followed by
a survey. Thus, the whole investigation is based upon a combination of qualitative and
quantitative methods, which is a recommended approach within logistics research (Dunn et al.
1994; Näslund, 2002; Mangan et al., 2004). Likewise, methodological triangulation, that is the
usage of different research approaches, techniques and methods in the same study, may help
investigators to overcome the biases and deficiencies of single method approaches (Easterby-
Smith et al., 1991; Denzin, 1970; Mentzer and Flint, 1997).
This research has been conducted according to the abductive approach, which is a combination
of inductive and deductive processes. The inductive process consists of the explorative study
leading to the formulation of theoretical hypotheses (a cyclic process). The successive
confirmatory study to test the hypothesis formulated is the deductive process (Figure 26).
Figure 26: Overview of the abductive research process followed in this thesis.
Explorative Study
Survey Draft
Survey Pretest
Survey Update
Survey Pretest
Survey Update
Survey Collection
Coding, Analysis and Report Writing
Stage 1
Stage 2
RQ
Hypotheses Formulation
Stage 3
Stage 4
Stage 5
67
5.2 The Explorative Study The explorative study is based on previous work performed in Urciuoli (2008), whose findings
are summarized in the previous chapter (Chapter 4). The choice of the explorative approach has
been preferred because of the explorative nature of this study and also for the novelty of the
research topic in supply chain management literature and the consequent lack of research
constructs (Denzin and Lincoln, 2000; Autry and Bobbitt, 2008). Literature review, observations
and qualitative unstructured and semi-structured interviews were exploited to gather data
concerning the factors impacting security in physical distribution.
The literature reviewed was collected between 2006 and 2009. Non-participant observations
were performed on the occasion of a workshop about transportation security and a seminar about
logistics security organized in Sweden. The notes taken during the observations and the material
gathered during the literature review were used to draft a preliminary set of factors influencing
the security of physical distribution systems. To enhance the understanding of the factors and the
identification of the stakeholders associated with the factors a total of 16 interviews were
conducted, 4 unstructured and 12 semi-structured (the interview scheme is available in Appendix
2 of this report). Already after 12 interviews it was realized that the respondents were not adding
any new factors. Hence, 4 additional semi-structured interviews were performed to ensure data
saturation (demographic characteristics of the sample are given in Table 1 of Chapter 2) (Glaser
and Strauss, 1967; Easterby-Smith et al., 1991).
Patterns and themes were identified within the transcribed texts of previous literature,
observations and interviews (ibid). Finally, by means of comparative processes 19 hypotheses
(see Chapter 4) were identified and systematically categorized in terms of the eight stakeholders
of the Physical Distribution Security System shown in Chapter 2 (Figure 4).
5.3 Literature Review The collection of relevant literature was performed by using the following keywords: “supply
chain security”, “physical distribution security”, and “goods transportation security”. Other
searches were performed by using the three mentioned keywords coupled with “drivers” and
“barriers” and the Boolean operator “AND”.
Articles relevant to the purpose of this investigation were selected by scanning first the title and
thereafter the abstract of the manuscript. In some cases it was found that some articles were

68
using the term “security” although they were related to natural disasters or other hazard
accidents. This investigation makes a clear distinction between involuntary accidents that are
purely random events such as natural disasters, mistakes etc. and voluntary attacks perpetrated
by antagonists. More specifically, the definition of supply chain security used in this research
context is the following proposed by ISO (2008):
“All the efforts required to enhance the security of people and cargo in the supply chain against
such antagonistic threats as theft, terrorism, fraud and piracy”
As a consequence, only security incidents related to antagonistic attacks have been considered
during the literature review. Another typology of articles that were selected by the search engine
was related to supply chain vulnerability to disruptions. These were also discarded as not
relevant for this investigation that is looking instead to identify the drivers of security in physical
distribution networks. Finally, other articles related to supply chain IT security and privacy
topics in supply chains were not taken into account.
5.4 The Survey The survey methodology is probably the unique instrument available to researchers to perform
confirmatory research and validate constructs upon a large sample group given specific time and
money constraints. Generally, the steps that are necessary to perform survey research can be
summarized in five stages (Figure 26) (Czaja and Blair, 2005; Forza, 2009; Groves et al., 2004).
Stage 1 – Survey Design and Preliminary Planning. In this stage the research problem and the
research questions that will be addressed in the survey are generated. It is important to decide
whether the survey should 1) test a hypothesis, 2) estimate the proportion of people or firms with
a specific behavior, or 3) study specific topics over time to see if changes occur. In this phase it
is also important to make decisions about the population of interest. This brainstorming should
bring to light which organizations or which individuals, the informants, can provide more
accurate information. Profiling the respondents is also important to make trade-offs in the
analysis and balance the answers between the groups of respondents. Another issue to be
discussed is how well the sampling frame represents the population eligible for the analysis.
Thus, it must be clear how the sample is framed, according to which factors the selection is made
and finally what percentage of the population is missing and how it will bias the final results.
The next stage is to design the questionnaire by determining the kind of analysis to be performed
69
to answer the research questions and thereafter by evaluating the usage of open-ended, closed-
ended questions (i.e. Likert scale) or both. Finally it is fundamental to begin considering the
availability of money and time for conducting the survey. For instance web surveys are the
fastest and cheapest, while face to face surveys are the most expensive (Czaja and Blair, 2005;
Forza, 2009; Groves et al., 2004).
Stage 2 – Pretesting. In this session the sampling frame is gathered, and record-keeping forms
and survey questions are prepared. The survey material is submitted to diverse individuals to get
feedback on the questionnaire items. This process may be done in a formal or informal manner
and family, friends, colleagues or students may be involved. Once the draft is reviewed and
updated, it can be sent to real respondents for a more formal test. Also in this case comments and
feedback are gathered and used to update the survey (Czaja and Blair, 2005; Forza, 2009; Groves
et al., 2004).
Stage 3 - Final Survey Design and Planning. In this stage the results of the pretest are
integrated in the final survey. At the same time, the experience developed in the previous step
may be exploited to decide how to make the survey, i.e. by telephone interviews, e-mails,
surveys etc. and how much time to allocate for following up the contacts (Czaja and Blair, 2005;
Forza, 2009; Groves et al., 2004).
Stage 4 - Data Collection. Data collection has to be thoroughly monitored including reminders
and follow up interviews with those who decided not to participate in the survey. It is important
to keep track of the rates of refusals, non-contacts, ineligibles and completed interviews. The
data collected has to be progressively transferred into a computer data file. During this process it
is important to check for missing answers or inconsistencies and thereafter try, whenever
possible, to contact the respondent to correct the questionnaire (Czaja and Blair, 2005; Forza,
2009; Groves et al., 2004).
Stage 5 - Data Analysis and Coding. The final stage of the survey approach consists of coding
and analyzing the data. Coding is about assigning a number to the responses given in the survey
questions. This is necessary to look for patterns among variables. Finally the data are analyzed
according to the analysis technique chosen for the investigation and by means of specific
software packages, e.g. miniTab or SPSS (Czaja and Blair, 2005; Forza, 2009; Groves et al.,
2004).

70
5.4.1 Stage 1 - Survey First Draft and Planning During this stage a first draft of the survey was prepared and used to determine the sample to be
surveyed. The objects of interest of this study are transportation firms operating in Sweden.
According to the Swedish Business Register, 28,250 firms work today with transportation and
storage activities. These consist of transportation companies, owners of infrastructure facilities
and terminals (harbors, airports, intermodal terminals, storage warehouses, etc.), service
providers etc. that are all registered in the Swedish Business Register provided by Statistics
Sweden.
This register is updated weekly with information retrieved by the Swedish National Tax Board.
Information stored in the database contains the name of the firm, the postal address, the
organization number, emails etc. (a detailed overview of the standard variables extracted from
the database is given in Appendix 3 of this document).
Examining the substructure of the transportation and storage category of the database, it was
noticed that both passengers and goods transportation were included. Hence, a first filter has
been applied to extrapolate exclusively the companies working with goods transportation. Table
9 reports the demographic characteristics of firms working with goods transportation and
storage. The first column from the left of the table shows the typology of the firm and the second
the number of companies operating in Sweden in each of the categories. The last row of the table
shows that a total of N=17,862 companies are registered in the database.
This investigation will focus merely on transportation companies, hence, on the security degree
of the links of transportation networks. Companies like forwarders, brokers, document
administrators as well as owners of terminals and infrastructure have been filtered out from the
population of interest. Likewise, companies providing cargo handling and other external services
to transportation companies have not been considered. Thus, examining the definition of the
categories specified in Table 9 (the definitions are given in Appendix 3) it has been decided to
remove the following sub-categories:
• Support activities. Companies working with support activities like cargo handling,
3PLs, 4PLs, customs brokers, capacity brokerage, document administration etc.
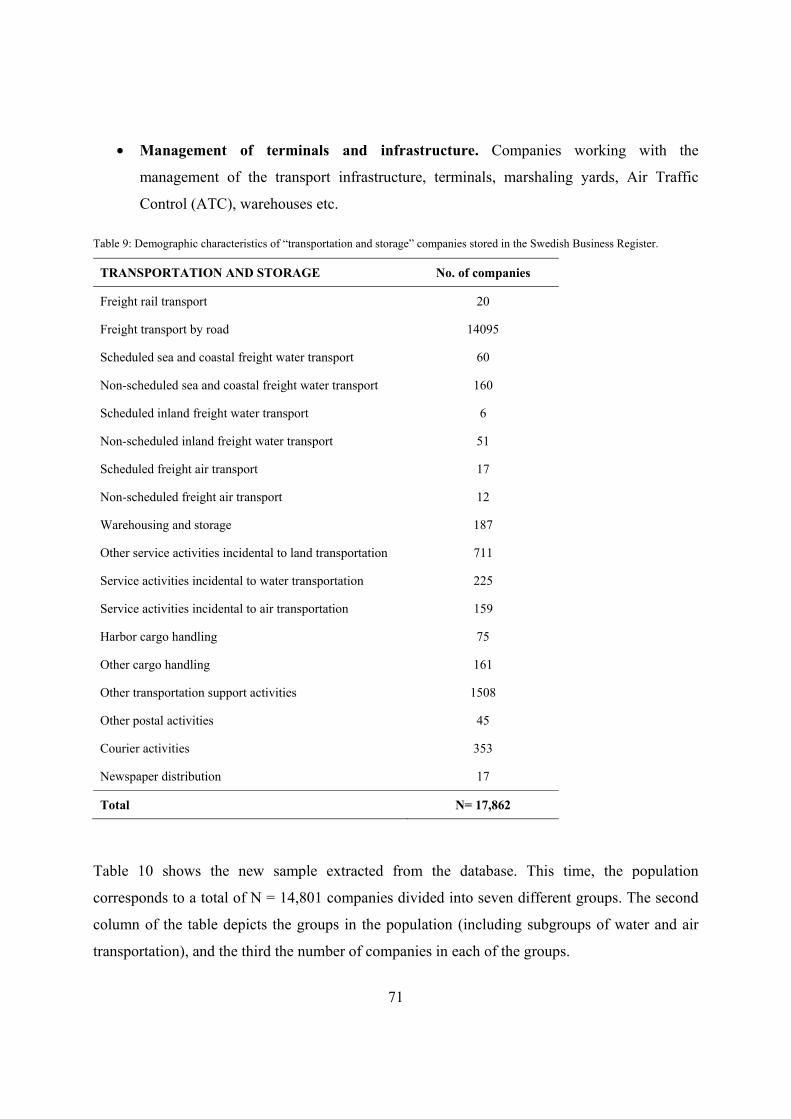
71
• Management of terminals and infrastructure. Companies working with the
management of the transport infrastructure, terminals, marshaling yards, Air Traffic
Control (ATC), warehouses etc.
Table 9: Demographic characteristics of “transportation and storage” companies stored in the Swedish Business Register.
TRANSPORTATION AND STORAGE No. of companies
Freight rail transport 20
Freight transport by road 14095
Scheduled sea and coastal freight water transport 60
Non-scheduled sea and coastal freight water transport 160
Scheduled inland freight water transport 6
Non-scheduled inland freight water transport 51
Scheduled freight air transport 17
Non-scheduled freight air transport 12
Warehousing and storage 187
Other service activities incidental to land transportation 711
Service activities incidental to water transportation 225
Service activities incidental to air transportation 159
Harbor cargo handling 75
Other cargo handling 161
Other transportation support activities 1508
Other postal activities 45
Courier activities 353
Newspaper distribution 17
Total N= 17,862
Table 10 shows the new sample extracted from the database. This time, the population
corresponds to a total of N = 14,801 companies divided into seven different groups. The second
column of the table depicts the groups in the population (including subgroups of water and air
transportation), and the third the number of companies in each of the groups.

72
Table 10: Demographic characteristics of the population of interest.
TRANSPORTATION COMPANIES No. Of companies
1 Freight Rail Transport 20
2 Freight Road Transport 14064
3 Freight Water Transport 283
Scheduled sea and coastal freight water transport 63
Non-scheduled sea and coastal freight water transport 160
Scheduled inland freight water transport 6
Non-scheduled inland freight water transport 54
4 Freight Air Transport 29
Scheduled freight air transport 17
Non-scheduled freight air transport 12
5 Other postal activities 47
6 Courier activities 341
7 Newspaper distribution 16
Total N= 14,801
To overcome the issues related to efficiency and expensiveness of performing a census (send the
survey to all the companies of the population), it has been decided to extract a sample from the
above population. The size of the sample has been computed with the equation below proposed
by Cochran (1977).
= 1 − ∗ ( ) × × (1 − ) (12)
Where
n = the sample size required for the analysis,
N = the population of interest,
Z = standard deviation score (Z score) that refers to the area under a normal distribution of values,
p = percentage of the sample picking a particular answer,
CI= confidence interval.
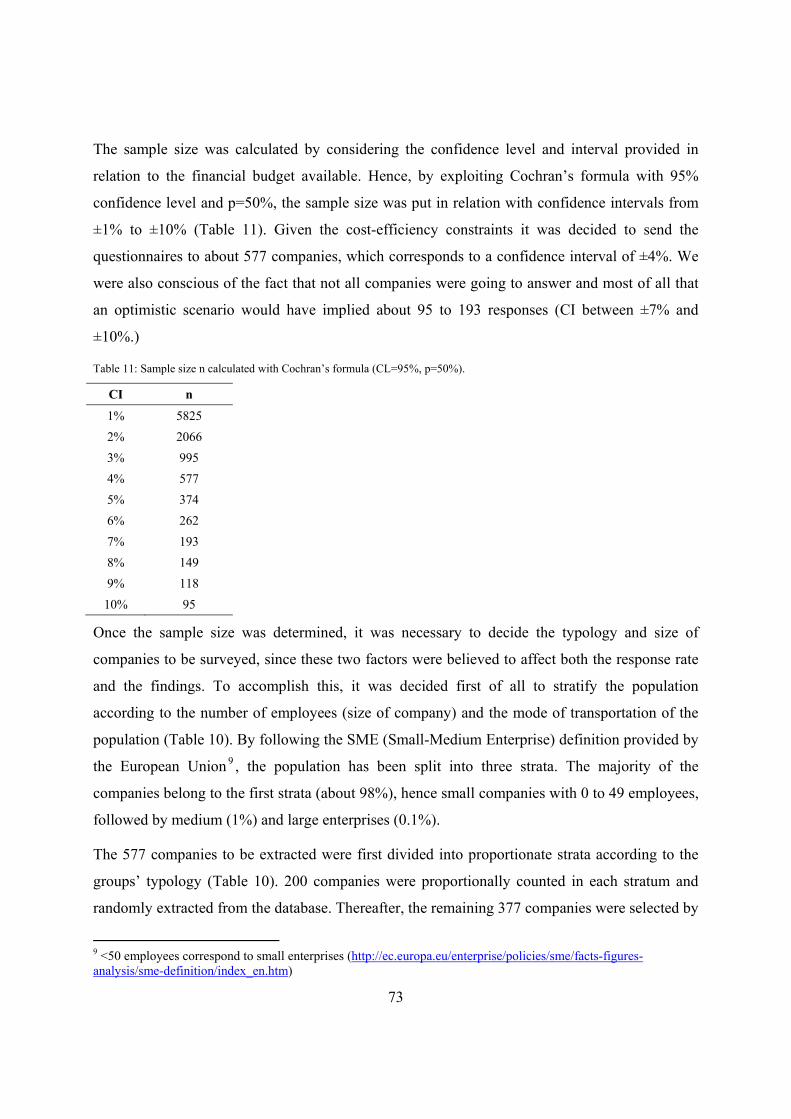
73
The sample size was calculated by considering the confidence level and interval provided in
relation to the financial budget available. Hence, by exploiting Cochran’s formula with 95%
confidence level and p=50%, the sample size was put in relation with confidence intervals from
±1% to ±10% (Table 11). Given the cost-efficiency constraints it was decided to send the
questionnaires to about 577 companies, which corresponds to a confidence interval of ±4%. We
were also conscious of the fact that not all companies were going to answer and most of all that
an optimistic scenario would have implied about 95 to 193 responses (CI between ±7% and
±10%.)
Table 11: Sample size n calculated with Cochran’s formula (CL=95%, p=50%).
CI n
1% 5825 2% 2066 3% 995 4% 577 5% 374 6% 262 7% 193 8% 149 9% 118 10% 95
Once the sample size was determined, it was necessary to decide the typology and size of
companies to be surveyed, since these two factors were believed to affect both the response rate
and the findings. To accomplish this, it was decided first of all to stratify the population
according to the number of employees (size of company) and the mode of transportation of the
population (Table 10). By following the SME (Small-Medium Enterprise) definition provided by
the European Union 9 , the population has been split into three strata. The majority of the
companies belong to the first strata (about 98%), hence small companies with 0 to 49 employees,
followed by medium (1%) and large enterprises (0.1%).
The 577 companies to be extracted were first divided into proportionate strata according to the
groups’ typology (Table 10). 200 companies were proportionally counted in each stratum and
randomly extracted from the database. Thereafter, the remaining 377 companies were selected by
9 <50 employees correspond to small enterprises (http://ec.europa.eu/enterprise/policies/sme/facts-figures-analysis/sme-definition/index_en.htm)
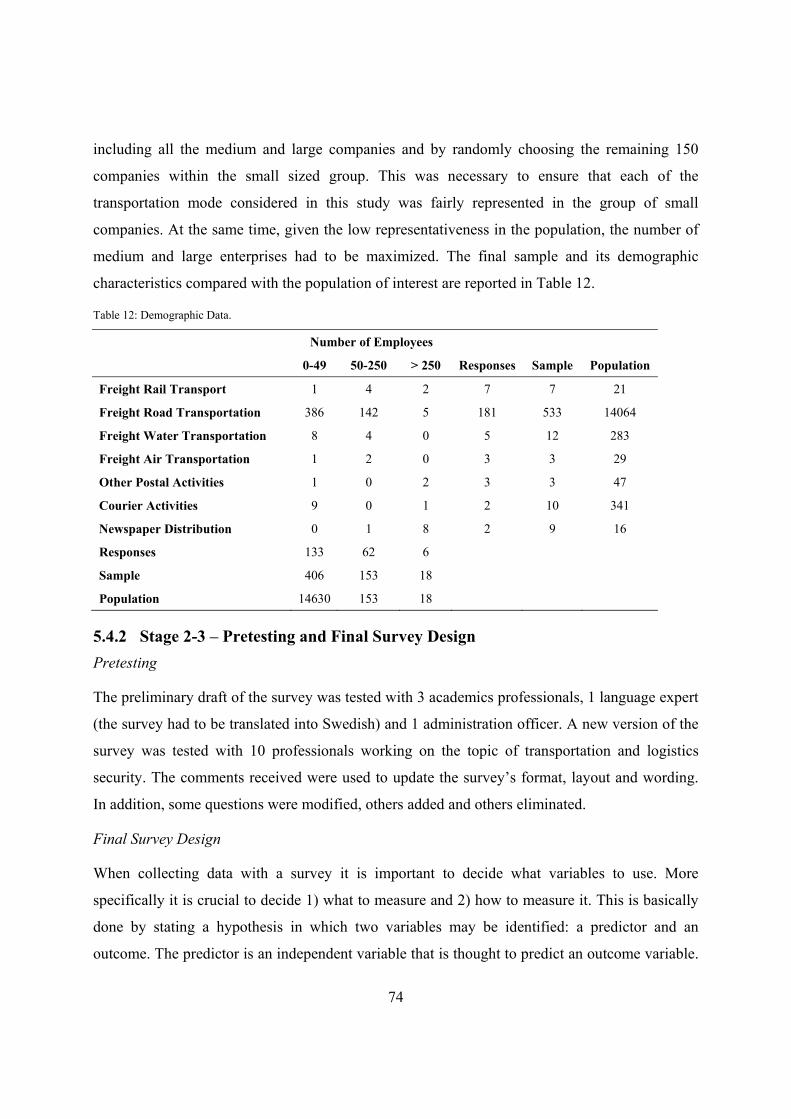
74
including all the medium and large companies and by randomly choosing the remaining 150
companies within the small sized group. This was necessary to ensure that each of the
transportation mode considered in this study was fairly represented in the group of small
companies. At the same time, given the low representativeness in the population, the number of
medium and large enterprises had to be maximized. The final sample and its demographic
characteristics compared with the population of interest are reported in Table 12.
Table 12: Demographic Data.
Number of Employees
0-49 50-250 > 250 Responses Sample Population
Freight Rail Transport 1 4 2 7 7 21
Freight Road Transportation 386 142 5 181 533 14064
Freight Water Transportation 8 4 0 5 12 283
Freight Air Transportation 1 2 0 3 3 29
Other Postal Activities 1 0 2 3 3 47
Courier Activities 9 0 1 2 10 341
Newspaper Distribution 0 1 8 2 9 16
Responses 133 62 6
Sample 406 153 18
Population 14630 153 18
5.4.2 Stage 2-3 – Pretesting and Final Survey Design Pretesting
The preliminary draft of the survey was tested with 3 academics professionals, 1 language expert
(the survey had to be translated into Swedish) and 1 administration officer. A new version of the
survey was tested with 10 professionals working on the topic of transportation and logistics
security. The comments received were used to update the survey’s format, layout and wording.
In addition, some questions were modified, others added and others eliminated.
Final Survey Design
When collecting data with a survey it is important to decide what variables to use. More
specifically it is crucial to decide 1) what to measure and 2) how to measure it. This is basically
done by stating a hypothesis in which two variables may be identified: a predictor and an
outcome. The predictor is an independent variable that is thought to predict an outcome variable.

75
The outcome is a dependent variable that is thought to change as a function of changes in the
predictor variable (Hair et al., 2009). Both the outcome and the predictor variables may be
assessed by means of metric and non-metric measurement scales (ibid):
• Non-metric measurement scales. Non-metric scales are used to describe differences in
terms of types and kind in case a specific property is present or not. Examples of non-
metric scales are nominal and ordinal scales:
o Nominal Scale. A nominal scale is basically made up of names or labels to which
numbers are assigned to allow basic statistical computations. Popular examples of
nominal scales include gender (male or female, nominal binary variable),
categorical (religion, occupation, political party affiliation etc.) etc.
o Ordinal Scale. Variables using ordinal scales indicate only relative positions in
an ordered series. Thus the variables can be ordered or ranked in relation to the
attribute possessed.
• Metric measurement scales. In metric scales, different objects differ from each others in
the amount or degree of a particular attribute. Variables using metric measurement scales
are quantitative and may be distinguished in interval and ratio scales. Both of the scales
are characterized by the fact that the distances between two adjacent objects in the scale
are equal on any part of the scale. In addition, almost any mathematical operation may be
performed on these scales.
o Interval Scale. Interval scales are similar to ratio scales with the only difference
that they use an arbitrary zero point. Moreover in interval scales it is not possible
to say that a specific point is a multiple of some other point on the scale.
o Ratio Scale. Ratio scales make use of an absolute zero point and points on the
scale may be related to each other in terms of multiples.
The choice of metric and non-metric scales is fundamental to determine which multivariate
techniques are most applicable to the data (Hair et al., 2009). For instance, non-metric data
cannot be used for dependent variables in multiple regressions, discriminant analysis, MANOVA
etc. (ibid). As a consequence, the outcome variables chosen for this investigation will be based
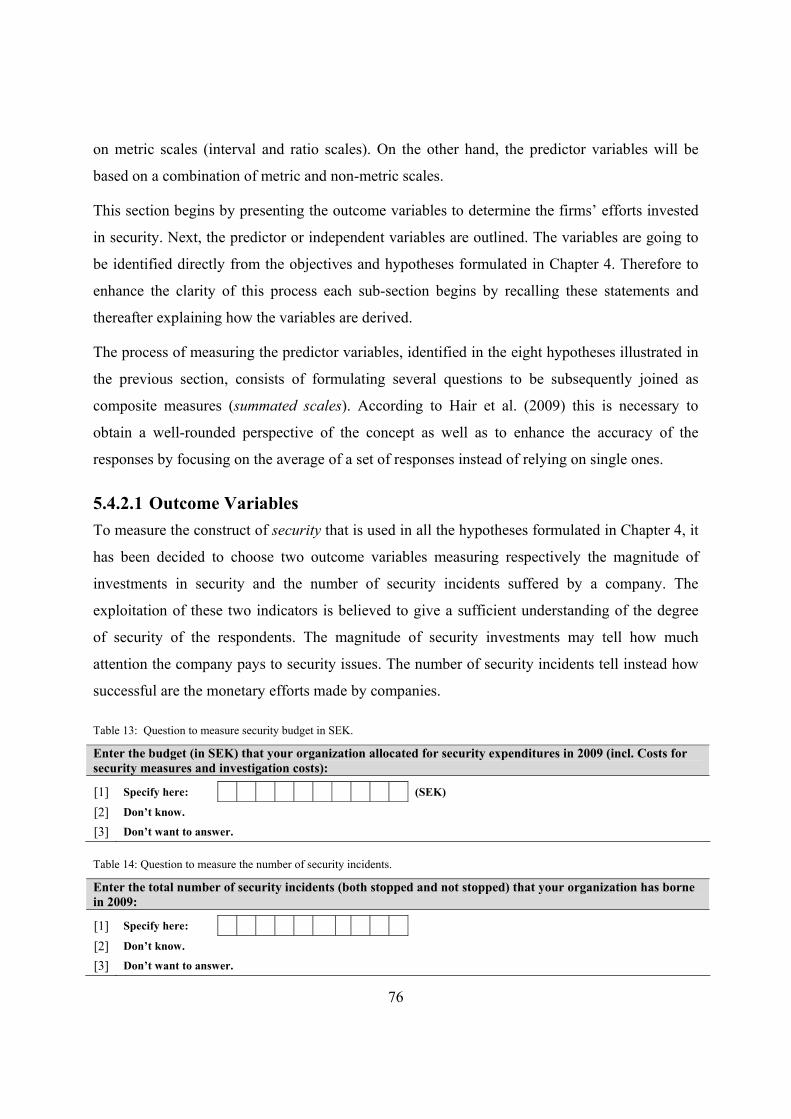
76
on metric scales (interval and ratio scales). On the other hand, the predictor variables will be
based on a combination of metric and non-metric scales.
This section begins by presenting the outcome variables to determine the firms’ efforts invested
in security. Next, the predictor or independent variables are outlined. The variables are going to
be identified directly from the objectives and hypotheses formulated in Chapter 4. Therefore to
enhance the clarity of this process each sub-section begins by recalling these statements and
thereafter explaining how the variables are derived.
The process of measuring the predictor variables, identified in the eight hypotheses illustrated in
the previous section, consists of formulating several questions to be subsequently joined as
composite measures (summated scales). According to Hair et al. (2009) this is necessary to
obtain a well-rounded perspective of the concept as well as to enhance the accuracy of the
responses by focusing on the average of a set of responses instead of relying on single ones.
5.4.2.1 Outcome Variables To measure the construct of security that is used in all the hypotheses formulated in Chapter 4, it
has been decided to choose two outcome variables measuring respectively the magnitude of
investments in security and the number of security incidents suffered by a company. The
exploitation of these two indicators is believed to give a sufficient understanding of the degree
of security of the respondents. The magnitude of security investments may tell how much
attention the company pays to security issues. The number of security incidents tell instead how
successful are the monetary efforts made by companies.
Table 13: Question to measure security budget in SEK.
Enter the budget (in SEK) that your organization allocated for security expenditures in 2009 (incl. Costs for security measures and investigation costs):
[1] Specify here: (SEK)
[2] Don’t know.
[3] Don’t want to answer.
Table 14: Question to measure the number of security incidents.
Enter the total number of security incidents (both stopped and not stopped) that your organization has borne in 2009:
[1] Specify here:
[2] Don’t know.
[3] Don’t want to answer.

77
The plan for this survey is to exploit MANOVA techniques to determine the relationship
between security and a certain set of predictors; thus the outcome variables had to be
quantitative, continuous and unbounded (Hair et al., 2009). The security budget as well as the
number of security incidents are measured by means of two ratio variables (the scales contain
absolute zero points, and points on the scale may be related to each other in terms of multiples).
The first variable indicates the budget at disposal of the firms to combat security threats in 2009
(Table 13), and the second measures the number of security incidents in which the firms have
been involved in the same year (Table 14). To increase the power of the MANOVA it is also
necessary that the outcome variables be correlated with each other (Hair et al., 2009). The
relationship between security budget and security incidents is believed to be inverse: higher
security budgets should correspond to fewer security incidents; low security budgets are assumed
to determine a higher amount of security incidents.
Figure 27: Outcome Variables to measure the Security construct.
5.4.2.2 Predictor variables The hypotheses formulated in the previous section are proposed again to enhance the clarity of
the process to identify the predictor variables (composite measures or summated scales) and the
related sets of questions used in the survey.
Law Enforcement Agency
H1a. Companies that perceive that criminals are not prosecuted are discouraged from
improving security.
H1b. Companies that perceive that the Swedish law enforcement agency is not allocating enough
resources are discouraged from enhancing security.
H1c. Companies that perceive as beneficial the collaboration in activities organized by the
Swedish law enforcement agency are stimulated to improve security.
SECURITY
Security Budget
Security Incidents
-

78
The above hypotheses correspond to three main constructs: the degree of prosecution of
criminals, the allocation of resources and finally the collaboration degree between distribution
firms and the Swedish law enforcement agency.
The construct concerning the degree of prosecution of criminals once they are captured is
measured by means of a set of six questions based on a five point Likert scale (1, Strongly
Disagree to 5, Strongly Agree). The hypothesis formulated in H1a points out that if the operators
perceive that the legal system is not prosecuting their offenders, they will feel discouraged in
working with security and will consequently abandon or limit to the essential any security
initiative. Hence, the purpose of this set of questions is to measure the perception of the work
done by the legal system to prosecute criminals (Table 15).
Table 15: Set of questions to measure perception of criminals’ prosecution degree.
In 2009...
Strongly Disagree
Disagree
Neither A
gree nor D
isagree
Agree
Strongly Agree
Can’t answ
er
… the Swedish Prosecutor's effort to prosecute transport offenders was very good. [1] [2] [3] [4] [5] [6]
… when criminals who attacked our business were arrested, there has been a long time before they have been released from prison. [1] [2] [3] [4] [5] [6]
… cargo criminals have always been promptly captured and kept in custody by the Swedish police and the Prosecutor. [1] [2] [3] [4] [5] [6]
… our confidence in the efforts of law enforcement authorities to prosecute offenders has increased. [1] [2] [3] [4] [5] [6]
… we have noticed that criminals, once arrested stayed away from our operations. [1] [2] [3] [4] [5] [6]
… we have noticed that cargo crime has always been severely punished. [1] [2] [3] [4] [5] [6]
The second construct that was developed in the questionnaire concerns the allocation of
resources made by the Swedish law enforcement agency. A set of six questions based on a five-
point Likert scale (1, Strongly Disagree to 5, Strongly Agree) have been developed to measure
how firms perceive this issue as a function of the efforts made by the law enforcement agency as
well as in relation to the reporting frequency of security incidents (Table 16).

79
Table 16: Set of questions to measure the perception of the resource allocation issue.
In 2009...
Strongly Disagree
Disagree
Neither A
gree nor D
isagree
Agree
Strongly Agree
Can’t answ
er
… our organization has always reported security incidents to the law enforcement agency. [1] [2] [3] [4] [5] [6]
… the law enforcement efforts to arrest criminals have been very good. [1] [2] [3] [4] [5] [6]
… the law enforcement agency has devoted sufficient resources to combat cargo crime. [1] [2] [3] [4] [5] [6]
… we have always reported security incidents to law enforcement authorities as we have confidence that appropriate action against offenders will be taken. [1] [2] [3] [4] [5] [6]
… reporting security incidents was a top priority in our organization. [1] [2] [3] [4] [5] [6]
… we noticed that the more we reported security incidents, the better the efforts of law enforcement authorities had been. [1] [2] [3] [4] [5] [6]
Finally, six more questions, based on five-point Likert scales (1, Strongly Disagree to 5, Strongly
Agree), have been constructed to measure how firms perceive the degree of collaboration offered
by the law enforcement agency (H2a. Companies that encounter difficulties in raising freight
rates are discouraged from improving security.
H2b. Companies applying JIT principles are discouraged from improving security.
H2c. Companies that are part of international distribution networks are more interested in
improving security.
H2d. Companies believing that security measures may negatively affect their performance level
don’t improve security.
Table 17). Questions included the participation frequency in the activities, the stimulation
perceived to increase security as well as the improvements to prevent and recover after security
incidents.
Distribution and Transport Operators
H2a. Companies that encounter difficulties in raising freight rates are discouraged from
improving security.

80
H2b. Companies applying JIT principles are discouraged from improving security.
H2c. Companies that are part of international distribution networks are more interested in
improving security.
H2d. Companies believing that security measures may negatively affect their performance level
don’t improve security.
Table 17: Set of questions to measure perception of collaboration with the law enforcement agency.
In 2009...
Strongly Disagree
Disagree
Neither A
gree nor D
isagree
Agree
Strongly Agree
Can’t answ
er
... our organization has always taken part in seminars and other activities organized by the national law enforcement agency. [1] [2] [3] [4] [5] [6]
... our organization, by participating in seminars and activities organized by the law enforcement authorities, was stimulated to increase security. [1] [2] [3] [4] [5] [6]
... our organization, by participating in seminars and activities organized by the law enforcement authorities, was stimulated to increase knowledge about how to protect themselves from such incidents.
[1] [2] [3] [4] [5] [6]
.. we have noticed that, during seminars and activities, we have been able to come up with interesting initiatives for protection of goods. [1] [2] [3] [4] [5] [6]
... we have noticed that it is important to strengthen cooperation with law enforcement authorities to combat cargo crime. [1] [2] [3] [4] [5] [6]
... we have noted that cooperation with law enforcement agency has improved our ability to prevent and recover after security incidents. [1] [2] [3] [4] [5] [6]
In these hypotheses it is possible to discern four constructs: the willingness to pay for security,
the influence of JIT operations, the length of distribution networks and the impact of security on
organizational performance. To measure the willingness to pay it has been decided to use a
continuous ratio variable (Table 18) as well as a set of questions based on a five-point Likert
scale (1, Strongly Disagree to 5, Strongly Agree). The continuous ratio variable is primarily used
in the descriptive statistics and asks for the average price increase accepted by transport
customers regarding security improvements (Table 18).
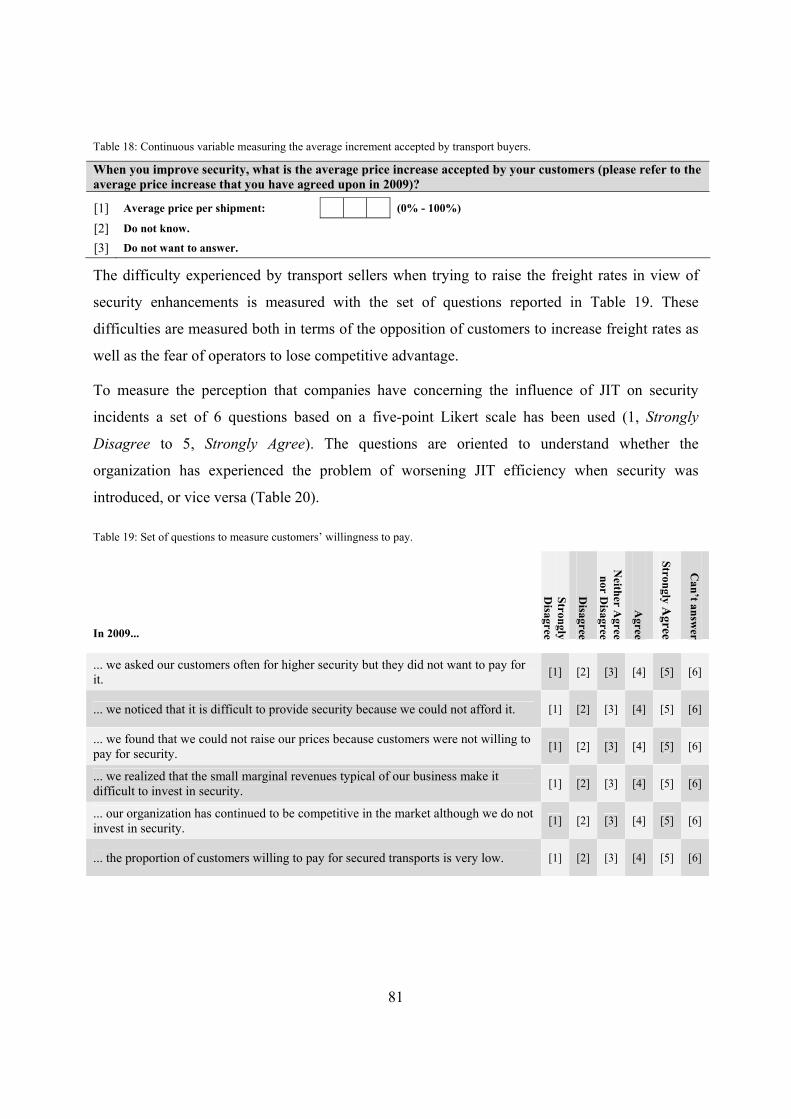
81
Table 18: Continuous variable measuring the average increment accepted by transport buyers.
When you improve security, what is the average price increase accepted by your customers (please refer to the average price increase that you have agreed upon in 2009)?
[1] Average price per shipment: (0% - 100%)
[2] Do not know. [3] Do not want to answer.
The difficulty experienced by transport sellers when trying to raise the freight rates in view of
security enhancements is measured with the set of questions reported in Table 19. These
difficulties are measured both in terms of the opposition of customers to increase freight rates as
well as the fear of operators to lose competitive advantage.
To measure the perception that companies have concerning the influence of JIT on security
incidents a set of 6 questions based on a five-point Likert scale has been used (1, Strongly
Disagree to 5, Strongly Agree). The questions are oriented to understand whether the
organization has experienced the problem of worsening JIT efficiency when security was
introduced, or vice versa (Table 20).
Table 19: Set of questions to measure customers’ willingness to pay.
In 2009...
Strongly D
isagree
Disagree
Neither A
gree nor D
isagree
Agree
Strongly Agree
Can’t answ
er
... we asked our customers often for higher security but they did not want to pay for it. [1] [2] [3] [4] [5] [6]
... we noticed that it is difficult to provide security because we could not afford it. [1] [2] [3] [4] [5] [6]
... we found that we could not raise our prices because customers were not willing to pay for security. [1] [2] [3] [4] [5] [6]
... we realized that the small marginal revenues typical of our business make it difficult to invest in security. [1] [2] [3] [4] [5] [6]
... our organization has continued to be competitive in the market although we do not invest in security. [1] [2] [3] [4] [5] [6]
... the proportion of customers willing to pay for secured transports is very low. [1] [2] [3] [4] [5] [6]
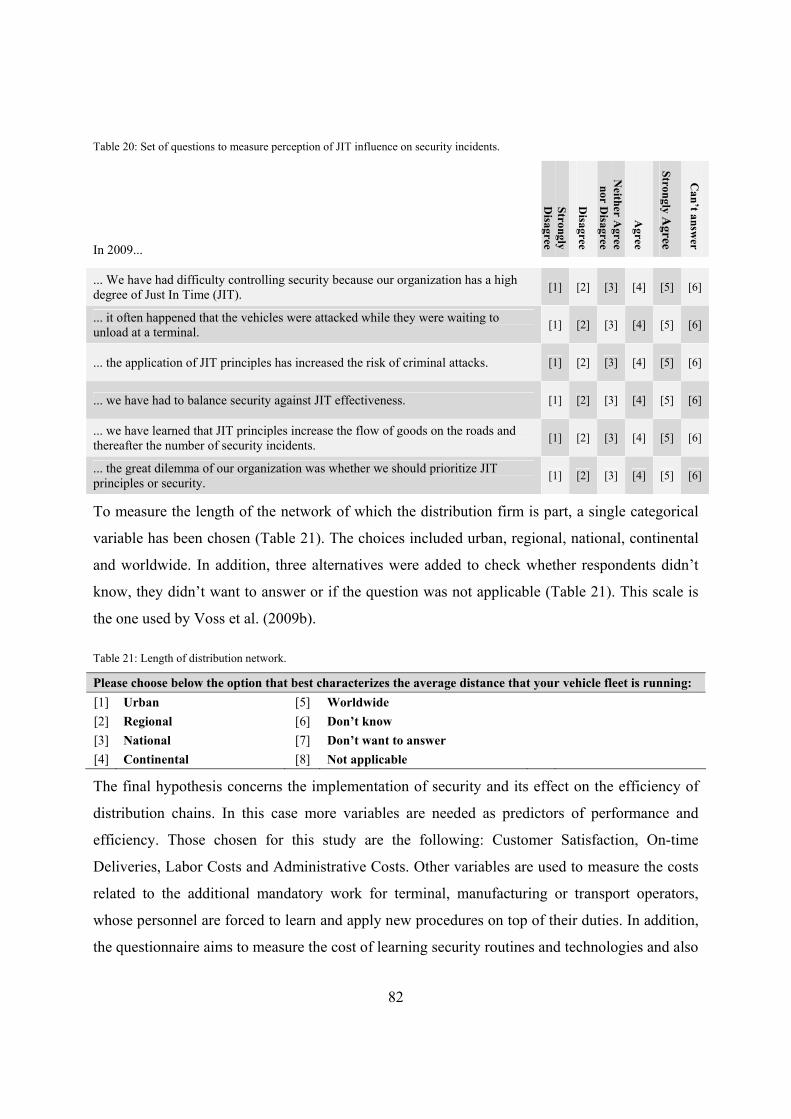
82
Table 20: Set of questions to measure perception of JIT influence on security incidents.
In 2009... Strongly D
isagree
Disagree
Neither A
gree nor D
isagree
Agree
Strongly Agree
Can’t answ
er
... We have had difficulty controlling security because our organization has a high degree of Just In Time (JIT). [1] [2] [3] [4] [5] [6]
... it often happened that the vehicles were attacked while they were waiting to unload at a terminal. [1] [2] [3] [4] [5] [6]
... the application of JIT principles has increased the risk of criminal attacks. [1] [2] [3] [4] [5] [6]
... we have had to balance security against JIT effectiveness. [1] [2] [3] [4] [5] [6]
... we have learned that JIT principles increase the flow of goods on the roads and thereafter the number of security incidents. [1] [2] [3] [4] [5] [6]
... the great dilemma of our organization was whether we should prioritize JIT principles or security. [1] [2] [3] [4] [5] [6]
To measure the length of the network of which the distribution firm is part, a single categorical
variable has been chosen (Table 21). The choices included urban, regional, national, continental
and worldwide. In addition, three alternatives were added to check whether respondents didn’t
know, they didn’t want to answer or if the question was not applicable (Table 21). This scale is
the one used by Voss et al. (2009b).
Table 21: Length of distribution network.
Please choose below the option that best characterizes the average distance that your vehicle fleet is running: [1] Urban [5] Worldwide
[2] Regional [6] Don’t know
[3] National [7] Don’t want to answer
[4] Continental [8] Not applicable
The final hypothesis concerns the implementation of security and its effect on the efficiency of
distribution chains. In this case more variables are needed as predictors of performance and
efficiency. Those chosen for this study are the following: Customer Satisfaction, On-time
Deliveries, Labor Costs and Administrative Costs. Other variables are used to measure the costs
related to the additional mandatory work for terminal, manufacturing or transport operators,
whose personnel are forced to learn and apply new procedures on top of their duties. In addition,
the questionnaire aims to measure the cost of learning security routines and technologies and also

83
the increased complexity and resources needed by organizations. All the variables are measured
on a five-point Likert scale from 1, Strongly Disagree to 5, Strongly Agree (Table 23). To
facilitate the answer to this set of questions an introductory question was used to let the
respondents first choose a security solution and thereafter evaluate the impact on efficiency
(Table 22).
Table 22: Question to select a security solution.
Choose one of the following security measures (response linked to subsequent terms):
[1] GPS Track and Trace [5] Employees background screening [9] Vehicle-/Container alarm
[2] Mechanical Lock [6] E-seal [10] Fuel cap lock [3] Rigid curtains [7] VHF tracer [11] Other: [4] Sound Barrier [8] Vehicle Immobilizer
Table 23: Set of questions to measure influence on performance of security measures.
The introduction of the security solution chosen above will ...
Strongly Disagree
Disagree
Neither A
gree nor D
isagree
Agree
Strongly Agree
Can’t answ
er
... adversely affect customer satisfaction. [1] [2] [3] [4] [5] [6]
... have a negative impact on on-time deliveries (delivery precision). [1] [2] [3] [4] [5] [6]
... increase our labor costs. [1] [2] [3] [4] [5] [6]
... increase our administrative costs. [1] [2] [3] [4] [5] [6]
... make our work to satisfy customers more difficult. [1] [2] [3] [4] [5] [6]
... inevitably increase delivery delays. [1] [2] [3] [4] [5] [6]
... inevitably increase the number of procedures that operators must follow. [1] [2] [3] [4] [5] [6]
... make the transport operators' working environment too complex and resource intensive. [1] [2] [3] [4] [5] [6]
... inevitably increase the amount of technology that operators must learn and use every day. [1] [2] [3] [4] [5] [6]
Business Security Certifications
H3. Companies complying with business certifications have higher security.
In this case a non-metric categorical variable is used to check if the organization is a member of
a voluntary certification (i.e. TAPA, ISO28000, etc.). An open option is also available to

84
respondents to allow the indication of other certifications not mentioned in the question (Table
24).
Table 24: Question to determine the compliance to security certifications.
Indicate which of the following certifications / guidelines you comply with to improve security (more than one answer is possible): [1] TAPA EMEA. [4] None of them.
[2] ISO28000. [5] Don’t know.
[3] Other: [6] Don’t want to answer.
Insurance Companies
H4a. Companies that make use of insurances to cover the economical losses of security incidents
are less interested in improving security.
H4b. Companies benefiting from premium discounts don‘t work actively with enacting security.
To measure the first construct, concerning how firms work with insurances, four ratio variables
and six questions based on five-point Likert scales are used (1, Strongly Disagree to 5, Strongly
Agree).
The first ratio variable measures the proportion of shipments that are fully insured against
security incidents. The next two variables seek to determine whether the insurance purchased
will only cover the weight costs (in accordance to NSAB 2000) or the real value of the goods
plus other indirect costs. The last question asks for the proportion of captive insurances used by
the organization (Table 25).
The set of questions in Table 26 is used to measure how companies are using insurances to cover
economic losses related to security incidents. Basically the questions are oriented to determine
whether companies have a tendency to trade off the costs of insurance premiums and excesses
with the costs of implementing security solutions.

85
Table 25: Set of questions to measure the degree of insurances used by operators.
Please indicate the proportion of shipments (in percent) that were fully insured against security incidents in 2009 (regardless of who paid the insurance).
[1] Specify here: (0% - 100%)
[2] Don’t know.
[3] Don’t want to answer.
What proportion of your shipments is not insured by goods owners (according to NSAB2000)?
[1] Specify here: (0% - 100%)
[2] Don’t know.
[3] Don’t want to answer.
What proportion of your shipments had an increased liability compared to NSAB2000 requirements?
[1] Specify here: (0% - 100%)
[2] Don’t know.
[3] Don’t want to answer. If your company has a captive of its insurance program, what proportion of losses related to security incidents were covered in 2009 by the captive company?
[1] Specify here: (0% - 100%)
[2] Don’t know.
[3] Don’t want to answer.
Table 26: Set of questions to measure degree of insurance usage.
Strongly D
isagree
Disagree
Neither A
gree nor D
isagree
Agree
Strongly Agree
Can’t answ
er
Insurances are the best solution to cover the economic losses from security incidents. [1] [2] [3] [4] [5] [6]
Our organization makes extensive use of commercial insurance to cover losses related to security incidents. [1] [2] [3] [4] [5] [6]
In order to cover losses associated with security incidents, our organization has a captive company for its insurance program. [1] [2] [3] [4] [5] [6]
Our organization makes use of insurance to cover direct and indirect losses caused by security incidents. [1] [2] [3] [4] [5] [6]
All the financial losses caused by security incidents are covered by our insurances. [1] [2] [3] [4] [5] [6]
By purchasing insurances, we will never lose money in the event of incidents. [1] [2] [3] [4] [5] [6]
Another group of questions is used to determine how distribution operators perceive the efforts
of insurance companies to lower premium rates in case security measures are efficiently
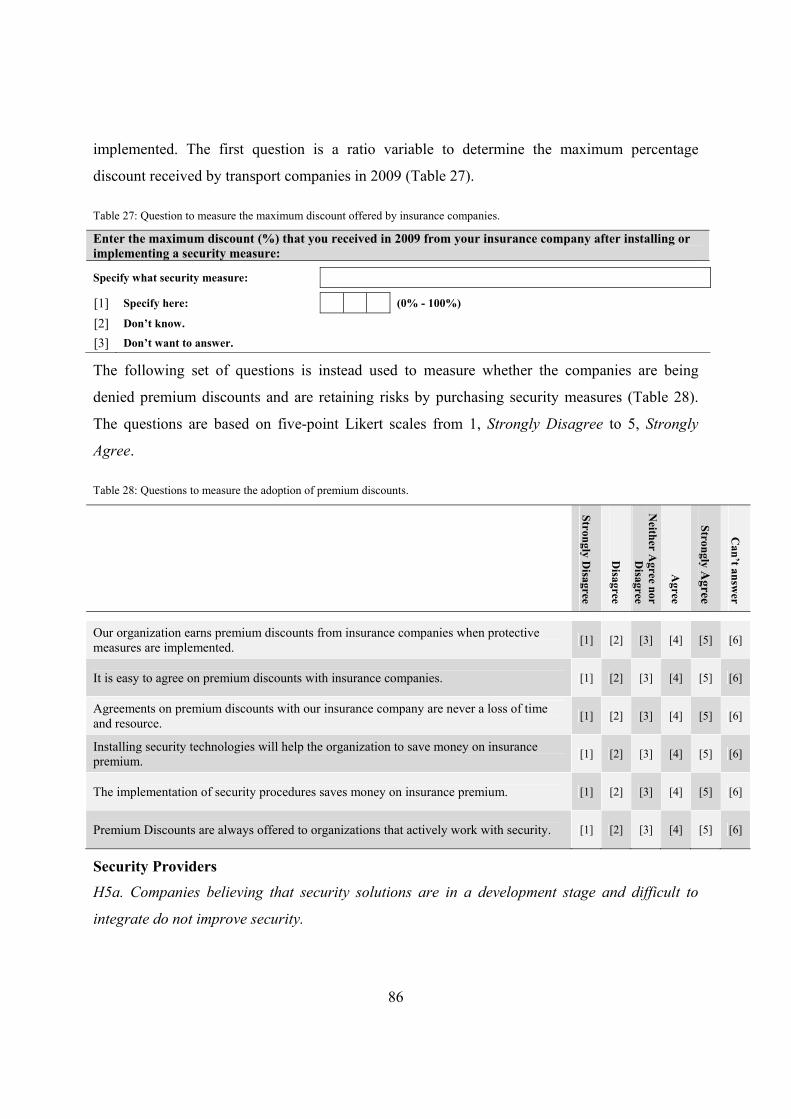
86
implemented. The first question is a ratio variable to determine the maximum percentage
discount received by transport companies in 2009 (Table 27).
Table 27: Question to measure the maximum discount offered by insurance companies.
Enter the maximum discount (%) that you received in 2009 from your insurance company after installing or implementing a security measure:
Specify what security measure:
[1] Specify here: (0% - 100%)
[2] Don’t know.
[3] Don’t want to answer.
The following set of questions is instead used to measure whether the companies are being
denied premium discounts and are retaining risks by purchasing security measures (Table 28).
The questions are based on five-point Likert scales from 1, Strongly Disagree to 5, Strongly
Agree.
Table 28: Questions to measure the adoption of premium discounts.
Strongly Disagree
Disagree
Neither A
gree nor D
isagree
Agree
Strongly Agree
Can’t answ
er
Our organization earns premium discounts from insurance companies when protective measures are implemented. [1] [2] [3] [4] [5] [6]
It is easy to agree on premium discounts with insurance companies. [1] [2] [3] [4] [5] [6]
Agreements on premium discounts with our insurance company are never a loss of time and resource. [1] [2] [3] [4] [5] [6]
Installing security technologies will help the organization to save money on insurance premium. [1] [2] [3] [4] [5] [6]
The implementation of security procedures saves money on insurance premium. [1] [2] [3] [4] [5] [6]
Premium Discounts are always offered to organizations that actively work with security. [1] [2] [3] [4] [5] [6]
Security Providers
H5a. Companies believing that security solutions are in a development stage and difficult to
integrate do not improve security.

87
H5b. Companies believing that security solutions are too expensive compared to the value
provided do not improve security.
The variables used are concentrated to measure the perception that distribution companies have
concerning security solutions both from a technological maturity and cost perspective. The first
set of questions is meant to verify the maturity of security prototypes, the payback, how well
these will turn into products, how well the prototypes may be integrated with the organizations
(Table 29). These concepts are measured by means of six five-point Likert scales from 1,
Strongly Disagree to 5, Strongly Agree.
Table 29: Set of questions to measure perception of security prototypes implementation.
Strongly Disagree
Disagree
Neither A
gree nor D
isagree
Agree
Strongly Agree
Can’t answ
er
Security prototypes that seem to have the shortest payback period are not ready for industrial use yet. [1] [2] [3] [4] [5] [6]
It will take too much time and effort before an advanced security solution is implemented in our organization. [1] [2] [3] [4] [5] [6]
Security prototypes often fail to improve security and will never turn into reliable products. [1] [2] [3] [4] [5] [6]
Most of the existing security technology is too difficult to integrate within our organization. [1] [2] [3] [4] [5] [6]
Most of the existing security technology is too difficult to integrate with our business processes. [1] [2] [3] [4] [5] [6]
The next set of questions is instead oriented to measure the expensiveness of security solutions.
The questions ask first directly the opinion about the expensiveness of security measures and
then try to put into relation costs with efficiency on cargo crime, security budget, payback period
and dimension of the vehicles’ fleet (Table 30). The questions are measured with a five-point
Likert scale from 1, Strongly Disagree to 5, Strongly Agree.

88
Table 30: Set of questions to measure the expensiveness of security solutions.
Strongly D
isagree
Disagree
Neither A
gree nor D
isagree
Agree
Strongly A
gree
Can’t answ
er
The most effective and advanced security solutions are too expensive. [1] [2] [3] [4] [5] [6]
The security solutions that we can afford cannot effectively prevent the cargo crime. [1] [2] [3] [4] [5] [6]
Our security budget is not high enough to buy the most effective security solutions. [1] [2] [3] [4] [5] [6]
The payback period for the most effective security solutions is too long. [1] [2] [3] [4] [5] [6]
Security costs increase considerably when purchasing devices to be installed on the whole fleet of vehicles of our organization. [1] [2] [3] [4] [5] [6]
Cargo Criminals
H6. Companies perceiving the opportunistic behavior of criminals do not improve security.
The variables chosen to measure this construct are all based on ordinal five-point Likert scales
from 1, Strongly Disagree to 5, Strongly Agree. The variables are oriented to measure the belief
that companies have about the opportunistic behavior of criminals in terms of learning
capabilities, access to technical resources and insiders (Table 31).
Contract Regulatory Associations
H7a. Companies that experience difficulties in agreeing on security requirements are not
encouraged to improve security.
H7b. Companies that perceive the contract agreements as too complex are not encouraged to
improve security.
H7c. Companies that don’t share risks by means of contract agreements are not encouraged to
improve security.
H7d. Companies that do not specify security requirements are not encouraged to improve
security.

89
Table 31: Set of questions to measure the perception of the opportunistic behavior of cargo criminals.
Strongly Disagree
Disagree
Neither A
gree nor D
isagree
Agree
Strongly Agree
Can’t answ
er
No matter how much protection we establish on our assets, criminals will always find ways to strike us. [1] [2] [3] [4] [5] [6]
Our organization has experience of criminals that quickly learn how to outsmart the new security measures. [1] [2] [3] [4] [5] [6]
The criminal groups are too advanced to be fought only with the implementation of security measures (both technical and non technical). [1] [2] [3] [4] [5] [6]
The majority of the security incidents are perpetrated with the support of insiders that know what security measures we use and how to deceive them. [1] [2] [3] [4] [5] [6]
Today, there is no silver bullet technology or method to effectively prevent cargo crime. [1] [2] [3] [4] [5] [6]
In the above hypotheses it is possible to identify four main constructs that have to be measured
by means of summated scales. These are risk sharing, perception of complexity of contract
agreements, specification of security requirements in contract agreements and finally difficulties
experienced in specifying security requirements in contract agreements.
Risk-sharing has been measured by means of 1) a ratio variable indicating the proportion of
stipulated contract agreements in which liabilities are shared (Table 32) and 2) five questions
based on a five-point Likert scale from 1, Strongly Disagree to 5, Strongly Agree (Table 33). The
questions aim to measure whether standard agreements are used as well as whether the
organizations put a high priority on these agreements.
Table 32: ratio variable to measure the proportion of contracts in which liabilities are shared.
Enter the percentage (%) of contracts signed by your company in 2009, where liabilities are shared among the involved parties:
[1] Specify here: (0% - 100%).
[2] Don’t know.
[3] Don’t want to answer.
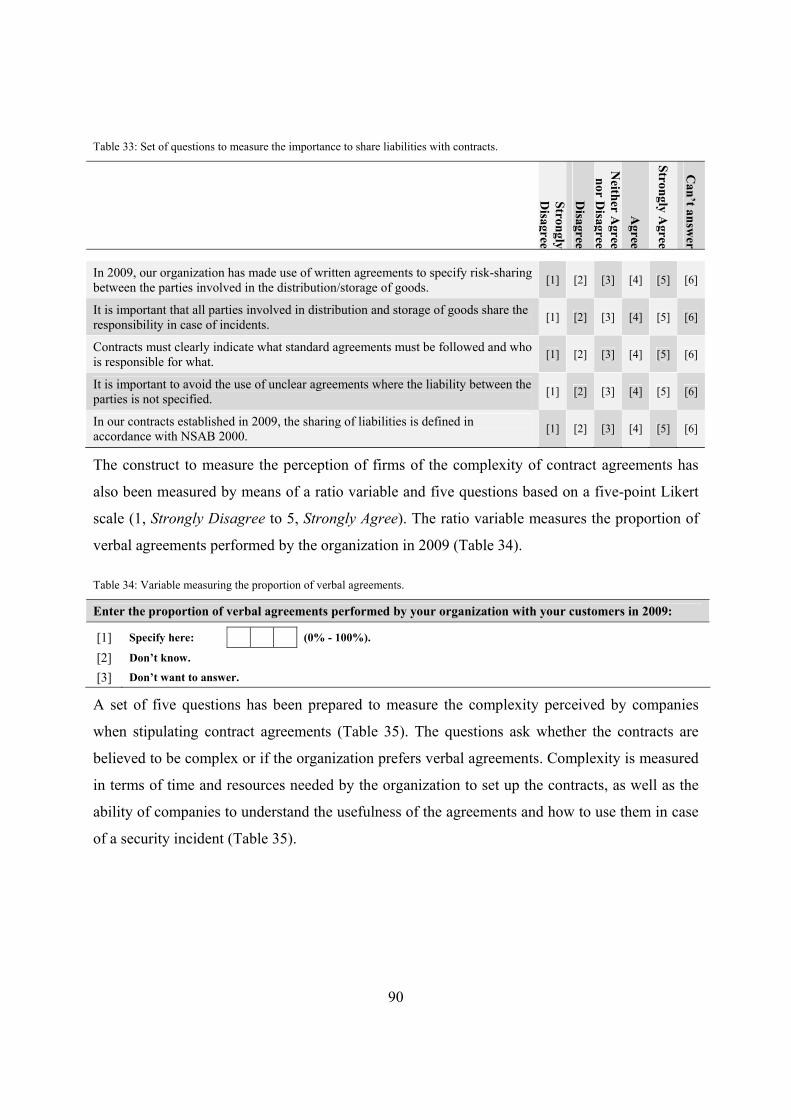
90
Table 33: Set of questions to measure the importance to share liabilities with contracts.
Strongly D
isagree
Disagree
Neither A
gree nor D
isagree
Agree
Strongly Agree
Can’t answ
er
In 2009, our organization has made use of written agreements to specify risk-sharing between the parties involved in the distribution/storage of goods. [1] [2] [3] [4] [5] [6]
It is important that all parties involved in distribution and storage of goods share the responsibility in case of incidents. [1] [2] [3] [4] [5] [6]
Contracts must clearly indicate what standard agreements must be followed and who is responsible for what. [1] [2] [3] [4] [5] [6]
It is important to avoid the use of unclear agreements where the liability between the parties is not specified. [1] [2] [3] [4] [5] [6]
In our contracts established in 2009, the sharing of liabilities is defined in accordance with NSAB 2000. [1] [2] [3] [4] [5] [6]
The construct to measure the perception of firms of the complexity of contract agreements has
also been measured by means of a ratio variable and five questions based on a five-point Likert
scale (1, Strongly Disagree to 5, Strongly Agree). The ratio variable measures the proportion of
verbal agreements performed by the organization in 2009 (Table 34).
Table 34: Variable measuring the proportion of verbal agreements.
Enter the proportion of verbal agreements performed by your organization with your customers in 2009:
[1] Specify here: (0% - 100%).
[2] Don’t know.
[3] Don’t want to answer.
A set of five questions has been prepared to measure the complexity perceived by companies
when stipulating contract agreements (Table 35). The questions ask whether the contracts are
believed to be complex or if the organization prefers verbal agreements. Complexity is measured
in terms of time and resources needed by the organization to set up the contracts, as well as the
ability of companies to understand the usefulness of the agreements and how to use them in case
of a security incident (Table 35).

91
Table 35: Set of questions to measure the complexity of standard agreements.
Strongly Disagree
Disagree
Neither A
gree nor D
isagree
Agree
Strongly Agree
Can’t answ
er
Agreements with our customers are too complex to define and agree on. [1] [2] [3] [4] [5] [6]
Since the contract agreements with our customers are too complex to define and agree on, we prefer verbal agreements. [1] [2] [3] [4] [5] [6]
It takes too much time and too many resources to draw up and underwrite contracts. [1] [2] [3] [4] [5] [6]
Even if we use written agreements we do not understand their true meaning and benefit for our organization. [1] [2] [3] [4] [5] [6]
We have used written contracts but we do not really know how to use them in case a security incident occurs. [1] [2] [3] [4] [5] [6]
The construct about the specification of security requirements in contracts follows the structure
of the two preceding constructs. Thus, it is measured by means of a ratio variable and five
questions based on a five-point Likert scale (1, Strongly Disagree to 5, Strongly Agree). The
ratio variable asks for the proportion of contract agreements signed in which security
requirements are specified (Table 36).
Table 36: Variable measuring the proportion of contracts in which security is specified.
Please indicate the proportion of contract agreements (in percent) that your organization stipulated with its customers in 2009, in which security requirements are specified in the text:
[1] Specify here: (0% - 100%).
[2] Don’t know
[3] Don’t want to answer.
The construct concerning how firms perceive the complexity of specifying security requirements
in contract agreements is measured by a set of five questions based on a five-point scale. In
particular, the set of questions to measure the adoption of security requirements in transport
contracts aim to understand whether the organization or its customers strive to specify security in
contracts. In addition, the questions try to capture the importance given by companies as well as
the easiness to perform this process (Table 37).

92
Table 37: Variables measuring the exploitation of security requirements in contracts.
Strongly Disagree
Disagree
Neither A
gree nor D
isagree
Agree
Strongly Agree
Can’t answ
er
In 2009, our customers have always specified in contract agreements which security requirements should be applied. [1] [2] [3] [4] [5] [6]
It is important to specify security requirements in order to clarify the protection that is required for distribution/storage of goods. [1] [2] [3] [4] [5] [6]
In 2009, most of our customers asked to specify the security requirements in contract agreements. [1] [2] [3] [4] [5] [6]
In 2009, our organization has always proposed detailed descriptions of security requirements in contracts. [1] [2] [3] [4] [5] [6]
In 2009, both our organization and our customers have easily agreed on how to specify security requirements in contracts. [1] [2] [3] [4] [5] [6]
The questions ask directly about the difficulties encountered to agree on security requirements,
but also the time and resources needed to accomplish this task. In addition, 1) the degree of
diverging opinions about security requirements, 2) the avoidance of this process because of its
complexity as well as 3) the difficulty to estimate the impacts of security measures are asked in
the questionnaire (Table 38).
Table 38: Set of questions to measure difficulties to agree on security requirements.
Strongly D
isagree
Disagree
Neither A
gree nor D
isagree
Agree
Strongly Agree
Can’t answ
er
In 2009, we had difficulty getting along with our partners on the security requirements that should be specified in the agreement. [1] [2] [3] [4] [5] [6]
Agreement processes on the security requirements to be specified in contracts takes too much time and resources from our organization. [1] [2] [3] [4] [5] [6]
We prefer to avoid the specification of security requirements in contract agreements because it is too complicated. [1] [2] [3] [4] [5] [6]
We do not really know how to specify security requirements because it is difficult to estimate the impact on security of the measures selected. [1] [2] [3] [4] [5] [6]
In 2009, we and our customers often had different opinions about the performance of security solutions on cargo threats. [1] [2] [3] [4] [5] [6]

93
Authority
H8a. Transportation companies complying with the AEO certification have higher security.
H8b. Transportation companies that have a negative perception about the impact of AEO
regulations on security and efficiency are discouraged from enhancing security.
In the hypotheses formulated for the authority it is possible to extract two main constructs:
compliance to the AEO certifications, perception of the AEO regulations and finally perception
of the impact of AEO compliance. The first construct is measured by a categorical variable to
determine whether the company is member of one of the three available AEO certifications
(AEO-C, AEO-S or AEO-F) (Table 39).
Table 39: Categorical variable to determine AEO compliance.
Our organization complies with or is planning to comply with the following certifications: [1] AEO-C. [5] Don’t know
[2] AEO-S. [6] Don’t want to answer.
[3] AEO-F.
[4] None of them.
The second construct concerns the perception of the benefits of AEO compliance. This topic is
measured by means of a set of 5 questions based on a five-point Likert scale from 1, Strongly
Disagree to 5, Strongly Agree (Table 40).
The questions ask whether the AEO certification may impact the organization from a security
and efficiency viewpoint. In particular, the questions aim to measure the degree of confusion
about AEO requirements, the perception about the impact of the certification on security, costs in
terms of time and resources allocated, and finally impact on competitive advantage and
organizational efficiency (Table 40).

94
Table 40: Set of questions to measure the perception of the AEO impact on the organization.
Strongly D
isagree
Disagree
Neither A
gree nor D
isagree
Agree
Strongly Agree
Can’t answ
er
Our organization perceives the AEO's requirements as confusing. [1] [2] [3] [4] [5] [6]
The AEO certification will not increase the security of our organization. [1] [2] [3] [4] [5] [6]
Complying with the AEO certification will cost us too much time and resources in relation to the benefits. [1] [2] [3] [4] [5] [6]
It is not necessary to be AEO certified from a competitive advantage perspective. [1] [2] [3] [4] [5] [6]
The requirements of the AEO guidelines reduce the efficiency of our operations. [1] [2] [3] [4] [5] [6]
5.4.3 Stage 4 - Data Collection The data collection was performed between April and June 2010. The security, risk,
transportation and logistics managers of the selected companies were posted questionnaires
together with a two page cover letter and a prepaid postage return envelope (see Appendixes 3
and 4). To respect the anonymity of the answers, a unique code was generated, assigned to the
respondents and printed on the return envelopes. This was also necessary to keep track of the
responses and limit the mailing of reminders.
To increase the response rate, the cover letter 1) included the logo of the Swedish law
enforcement agency, with which we collaborated for this study, 2) included a detailed
description about how to compile the questionnaire 3) ensured the confidentiality of the answers
and 4) promised an executive summary of the results. In the middle of May about 85
questionnaires corresponding to a response rate of 14.7% were received. Reminder letters,
together with a copy of the questionnaire and a prepaid postage return envelope were sent to non-
respondents two weeks after the deadline. In addition, it was decided to put in the reminder letter
the link to a website where it was possible to respond to the survey. This was done to stimulate
respondents that were more familiar with web surveys and thereafter increase the response rate.
Finally, follow-up telephone calls were made 1) to enhance the quality of the answers, 2) to
obtain additional responses and 3) to understand the motivations for not answering. At the end of

95
the data collection a total of 210 questionnaires had been collected which corresponds to a
response rate of about 36.4%.
In some cases, the companies’ owners called on their own initiative to ask if the questionnaire
was compulsory and thereby to explain that they preferred to not answer because of
confidentiality issues. In addition to that, a total of 47 companies were contacted by phone. The
reasons for not answering the questionnaire were in order, lack of time, internal policy, difficult
to find the right competence, not relevant for the organization (this was especially true for
recycling and low value goods companies). In only one case could a manager not access data
from 2009 because she had been recently employed. Finally, in other cases the company had
bankrupted or had been sold.
By performing a missing value analysis it was decided to keep only the questionnaires with less
than 17 missing answers. This implies that 34 questionnaires were removed from the sample for
subsequent data analysis.
5.4.4 Stage 5 - Data Analysis The statistical methods used in this investigation are based on multivariate analysis techniques.
According to Hair et al. (2009) multivariate analysis “simultaneously analyzes multiple
measurements on individuals or objects under investigation”. The general structure of the
statistical analysis to be performed includes the following steps: descriptive statistics,
Exploratory and Confirmatory Factor Analysis, cluster analysis, MANOVA to test the
hypotheses, discriminant analysis and finally an analysis to ensure the validity and reliability of
the survey.
Before running the analysis, the presence of common method bias was checked by performing an
un-rotated factor analysis using Kaiser criterion (eigen value > 1). This analysis revealed the
existence of 18 distinct factors that accounted for 75.3% of the variance. In particular, it was
noticed that the first factor accounted for only 27.9% of the variance. Hence, since a single factor
didn’t appear in the analysis and the first factor didn’t account for the most of the variance, the
absence of common method bias may be assumed (Paulray et al., 2008).
Finally, the results of the analysis carried out are presented in the form of mean values,
proportions, p-values, and correlations computed with 95% confidence intervals. In addition, in

96
this investigation one-tailed tests are used and the level of significance has been set to < 0.05. All
the statistical analyses have been carried out with SPSS v. 15.0. and LISREL 8.80.
Descriptive Statistics This analysis is carried out to summarize and describe important features of the data. An
important part of this step is the analysis of missing values that is fundamental to generate a filter
variable and select the cases to be used in the analysis. In addition, the missing values of the
remaining questionnaires have been replaced with values’ means. Afterwards, calculation of
numerical summary measures as means and standard deviations has been performed. The
normality degree of the outcome variables has been checked with Kolmogorov-Smirnov tests. In
addition, graphic tools such as bar charts, histograms, and scatter-plots are used to support quick
visual comparisons of frequency distributions, normality degree of the variables, and correlations
in bivariate data. Computation of correlation coefficients with non-parametric tests has been
performed to determine the relationship between the outcome variables. In addition, by log-
transforming the outcome variables a linear regression was performed to verify the results of the
non-parametric tests. Also, ANOVA have been used to determine the influence of the sample
size on the outcome variables.
Exploratory and Confirmatory Factor Analysis By performing an Exploratory Factor Analysis (EFA) the questions in the survey have been put
together in summated scales. The EFA is a statistical technique that supports analysts in the
reduction of the number of variables while retaining as much original information as possible.
The EFA performed within this investigation is based on a Principal Component Analysis (PCA)
with orthogonal rotation (Varimax). If data are not properly reduced, biases due to the
multicollinearity of the variables could appear. Therefore, the correlation coefficients as well as
the determinant of the correlation matrix have been screened to detect multicollinearity problems
and avoid biases in the reduced data (Hair et al., 2009). The adequacy of the sample size as well
as the magnitude of correlations between the items (necessary conditions for PCA) are assessed
respectively with the Kaiser-Meyer-Olkin (KMO) measure and the Bartlett’s test of sphericity
(ibid). The factor variables were saved by using the regression method. Finally, the reliability
degree of the related constructs has been checked by performing a reliability analysis and by
consequently examining the values of the Chronbach’s alpha (Hair et al., 2009).
97
A Confirmatory Factor Analysis (CFA) has been run to determine how well the measured
variables represented the constructs. This technique is different from the EFA since the number
of constructs, as well as the relationships between the items and the constructs are established by
the researcher (Hair et al., 2009). The analysis of the model fit indices was exploited to establish
construct validity and unidimensionality. Convergent validity was assessed by examining the
value of standardized coefficients, t-values for the individual paths, Construct Reliability (CR)
and Average Variance Extracted (AVE) (ibid). Discriminant validity was estimated by
developing additional measurement models in which the correlation of any two constructs under
examination was set to 1.0. Thereafter, differences of the values for the fixed and free
solutions were examined to assess the distinctiveness of the two constructs (ibid).
Cluster Analysis The factors identified in the previous step have been successively used to classify the
respondents into groups according to a hierarchical cluster analysis. In this study clusters have
been constructed with the Wards method based on the squared Euclidean distance, which is
known to guarantee a better distribution of the groups (Hair et al., 2009). The joint analysis of
the agglomeration schedule and the dendogram graph generated by SPSS, supported the decision
concerning the optimal number of groups to be taken for further investigation. After the initial
assessment of the number of clusters, the iterative K-means cluster approach was used to
determine the cluster membership of the data (Aldenderfer and Blashfield, 1984; Paulraj, 2008).
The clusters were saved in variables generated in SPSS. To enhance the profiling of these
groups, a discriminant analysis with a Wilks’ lambda stepwise method and a Varimax rotation
was computed. In addition, groups’ means in relation to the identified factors are exploited to
enhance the profiling of the identified groups. Finally, the reliability of the cluster analysis was
demonstrated by means of cross-validation (Sherman and Sheth, 1977; Paulraj, 2008). Hence, the
sample was divided randomly in two equal sub-samples and cluster analysis was performed on
each half. The examination and comparison of the descriptive statistics of the two sets of
clusters was exploited to establish the reliability of the cluster solution (Paulraj, 2008).
MANOVA The groups created in the previous step will be finally used to run a Multivariate ANalysis Of
VAriance (MANOVA). The main peculiarity of the MANOVA instrument is its particular
98
suitability to look at the relationship between predictors and several outcome variables
simultaneously (Hair et al., 2009). While it could be possible to run ANOVAs for each outcome
variable, MANOVA is usually preferred because of its capability to reduce the chance to commit
a Type I error. Hence, its application to this investigation is fundamental to determine how
different groups of firms invest in security and at the same time how much they are affected by
security incidents. MANOVA assumptions like multivariate normality as well as the
homogeneity of covariance matrices have been checked with Levene’s and Box’s tests.
Whenever problems with the homogeneity of covariance matrices were detected, the outcome
variables were log-transformed. Several ANOVAs as well as further discriminant analyses have
been performed to follow up and strengthen the comprehension of possible relationships between
the dependent variables used in the MANOVA. Finally, bar charts with error bars (95%
confidence intervals) are used to visualize the differences of the groups in terms of security
budget allocated and number of incidents suffered.
5.4.5 Survey Validity and Reliability Survey instruments often produce discrepancies or measurement errors between what they are
measuring and the actual value of the variables to be measured. A way to keep the measurement
errors at a minimum level is to enhance the validity and reliability of the survey instrument.
Validity is “the degree to which a measure accurately represents what it is supposed to” (Hair et
al., 2009). As a consequence, to enhance the validity of a questionnaire it is important to
improve its design by acting on the wording and format of the questions (Iarossi, 2006).
According to Iarossi (2006) there are two basic rules to accomplish this: relevance and accuracy.
Relevance concerns the familiarity of the researcher with the topic and the objectives of the
study. A question is accurate if information is collected in a reliable and valid manner. Hence, to
improve the accuracy of the answers, it is important to avoid asking questions that are hard to
understand or that refer to events or data too far in the past to be correctly remembered (ibid). In
addition, a questionnaire has to be sent to the people that are able to provide the more accurate
answers (Moser and Kalton, 1971). Finally pre-tests have to be conducted to enhance wording,
format, comprehension and thereafter the overall accuracy of the survey (Czaja and Blair, 2005;
Iarossi, 2006, Groves et al., 2004).
99
In this investigation, to ensure the validity of the questionnaire, the survey has been directly
developed from the research hypotheses. The hypotheses breakdown into constructs and related
summated scales is clearly illustrated in this document and it has been scrutinized by academic
experts. The data collected refer to 2009, which is believed not to be too far in the past and
therefore easily accessible by respondents. Moreover, the survey has been addressed to logistics
or transportation or security managers in the firms extracted from the Swedish Business Register.
These individuals are believed to possess the right competence and experience to provide
credible and accurate answers. Finally, to enhance the validity of this investigation, the
developed survey instrument has been thoroughly pretested first with academic professionals
(supervisors and other colleagues), 1 language expert, 1 administration officer and 10
professional experts working in the field of transportation and logistics security. Comments and
feedbacks from these two reviews have been used to enhance the accuracy of the questions.
Reliability is the degree to which observed variables measure true values (Hair et al., 2009).
Diverse methods may be used to ensure the reliability of a questionnaire. Some of the most
popular include test-retests, alternate forms, split-half, internal consistency and non-response
bias (Litwin, 1995; Hair et al., 2005; Armstrong and Overton, 1977):
Because of the time and money constraints allocated for this investigation, double administration
of surveys has been avoided (i.e. test-retests). At the same time, approaches like split-half or
alternate forms were not feasible due to the length of the questionnaire. Hence, reliability has
been assessed by measuring internal consistency (factor analysis and Cronbach’s alpha to
systematically assess the validity of the scales), and non-response bias. Internal consistency
consists to check if individual variables (or sets of variables) produce results that are consistent
with the constructs generated in the questionnaire (Hair et al., 2009). In this investigation internal
consistency has been checked by means of a factor analysis (ibid) as well as by calculating the
Cronbach’s alpha α as shown in the equation below (Litwin, 1995).
α = N COV∑ s + ∑ COV
Where COV = Average Covariance between items

100
N = number of items s = item variance COV = item covariance
Usually a value of alpha of 0.7/0.8 indicates that the scale is reliable. The results of the factor
analysis as well as the values of the Cronbach’s alpha, measuring the reliability of the scales
used in the questionnaire, are reported within the factor analysis illustrated in the next chapter.
The reliability of a survey may be measured by analyzing non-response bias. Armstrong and
Overton (1977) suggest that the comparison of early respondents with late responses obtained
after follow-up calls or emails may provide indications about the presence (or not) of non-
response bias (if there are not statistical differences between these two groups, then response bias
may be estimated to be absent). This approach, also called extrapolation method, is built upon
the assumption that respondents answering less readily are more like non-respondents
(Armstrong and Overton, 1977). In this investigation, to check for non-response bias, early and
late responses of the survey were compared. No significant differences were found, either in
terms of the outcome variables or of the demographic characteristics, which indicates the
absence of non-response bias (Armstrong and Overton, 1977).

101
6 Analysis This chapter presents the analysis of the data collected with the survey. First of all, descriptive statistics
of outcome and predictor variables are expounded. Next, the hypotheses formulated in Chapter 4 are
tested. To enhance the clarity of the analysis and tests of the hypotheses, this chapter follows the same
structure used in the Frame of Reference section (Chapter 4).
6.1 Descriptive Statistics Of the respondents, 39% stated that they don’t make any investments in security. Hence, the
average investment made on security, by Swedish transportation companies in 2009, is about
€4,874 (SD=€9,392) while the maximum investment is €50,000 (N=171).
Figure 28: Distribution of Security Budget variable (N=171).
About 18% of the respondents stated that they are not affected by any security incidents. The
companies that instead claimed to be affected by security incidents had on average suffered 6.4
attacks (SD=7.4, Max=44). Examining the graphical distributions of the dependent variables it
was deduced that these were differing from normal distributions (Figure 28 and Figure 29). A
Kolmogorov-Smirnov test also confirmed that both the dependent variables significantly differ
Security Budget50,000€40,000€30,000€20,000€10,000€0€
Freq
uenc
y
120
100
80
60
40
20
0
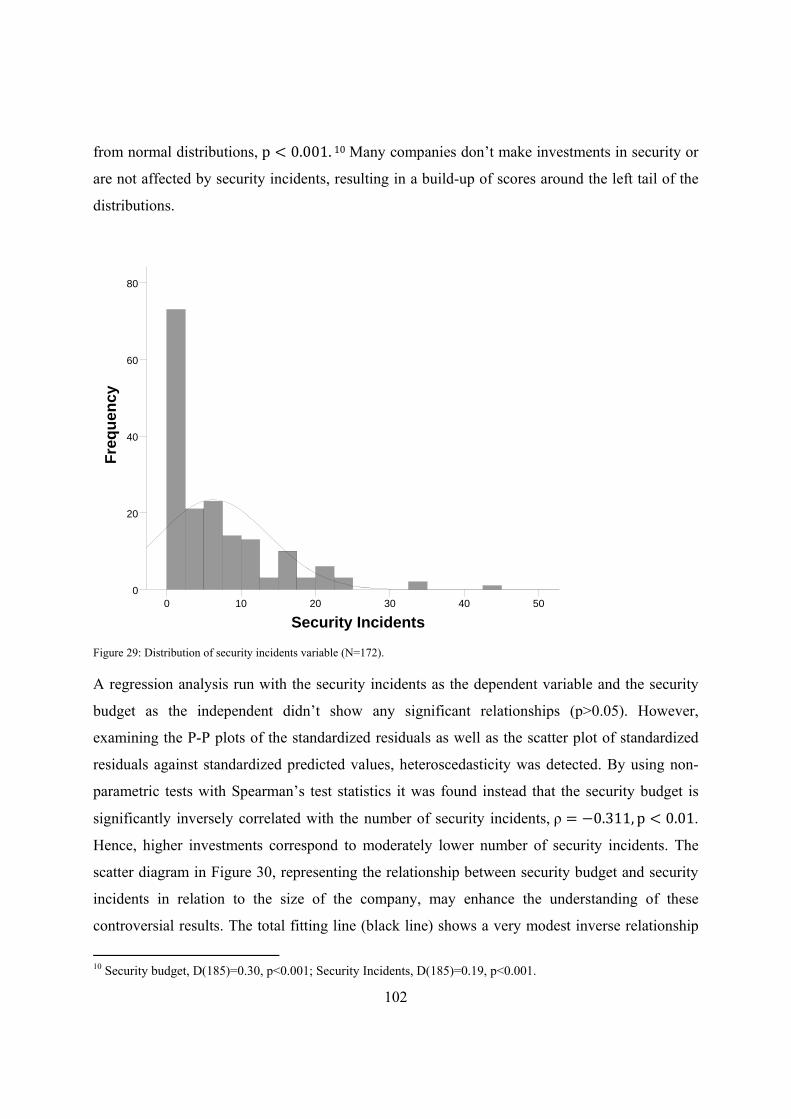
102
from normal distributions, p < 0.001. 10 Many companies don’t make investments in security or
are not affected by security incidents, resulting in a build-up of scores around the left tail of the
distributions.
Figure 29: Distribution of security incidents variable (N=172).
A regression analysis run with the security incidents as the dependent variable and the security
budget as the independent didn’t show any significant relationships (p>0.05). However,
examining the P-P plots of the standardized residuals as well as the scatter plot of standardized
residuals against standardized predicted values, heteroscedasticity was detected. By using non-
parametric tests with Spearman’s test statistics it was found instead that the security budget is
significantly inversely correlated with the number of security incidents, ρ = −0.311, p < 0.01.
Hence, higher investments correspond to moderately lower number of security incidents. The
scatter diagram in Figure 30, representing the relationship between security budget and security
incidents in relation to the size of the company, may enhance the understanding of these
controversial results. The total fitting line (black line) shows a very modest inverse relationship
10 Security budget, D(185)=0.30, p<0.001; Security Incidents, D(185)=0.19, p<0.001.
Security Incidents5040302010 0
Freq
uenc
y
80
60
40
20
0
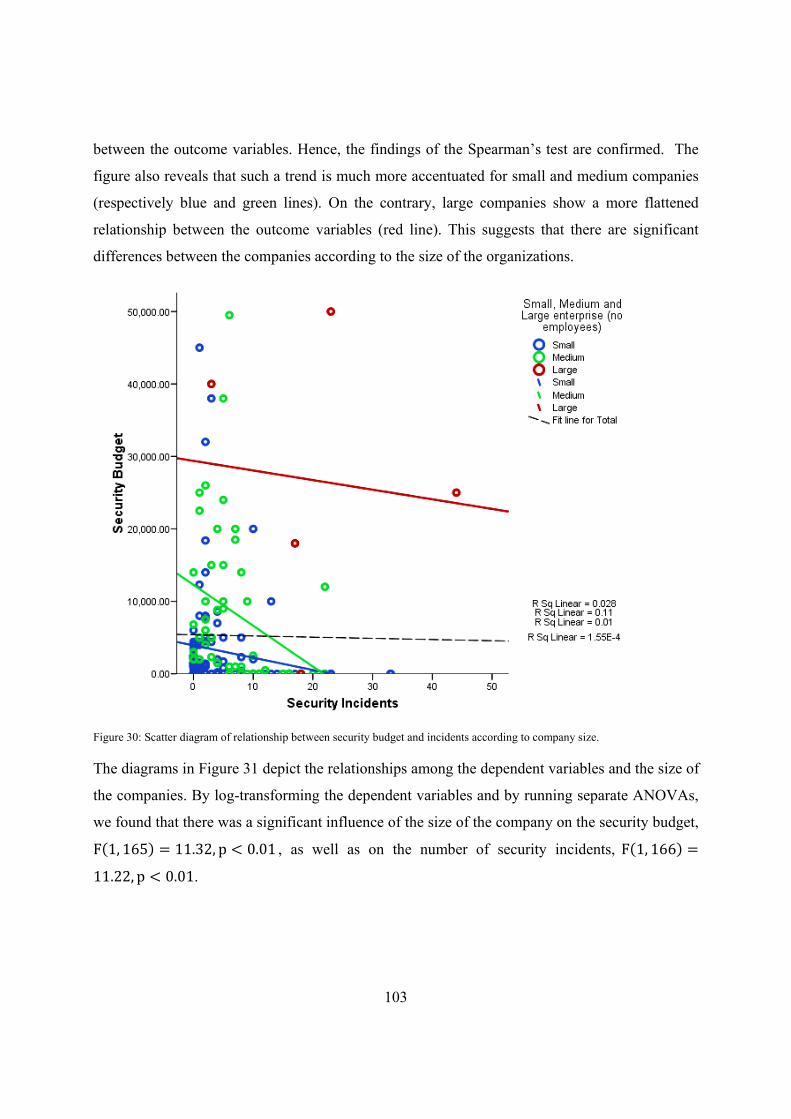
103
between the outcome variables. Hence, the findings of the Spearman’s test are confirmed. The
figure also reveals that such a trend is much more accentuated for small and medium companies
(respectively blue and green lines). On the contrary, large companies show a more flattened
relationship between the outcome variables (red line). This suggests that there are significant
differences between the companies according to the size of the organizations.
Figure 30: Scatter diagram of relationship between security budget and incidents according to company size.
The diagrams in Figure 31 depict the relationships among the dependent variables and the size of
the companies. By log-transforming the dependent variables and by running separate ANOVAs,
we found that there was a significant influence of the size of the company on the security budget, F(1, 165) = 11.32, p < 0.01 , as well as on the number of security incidents, F(1, 166) =11.22, p < 0.01.
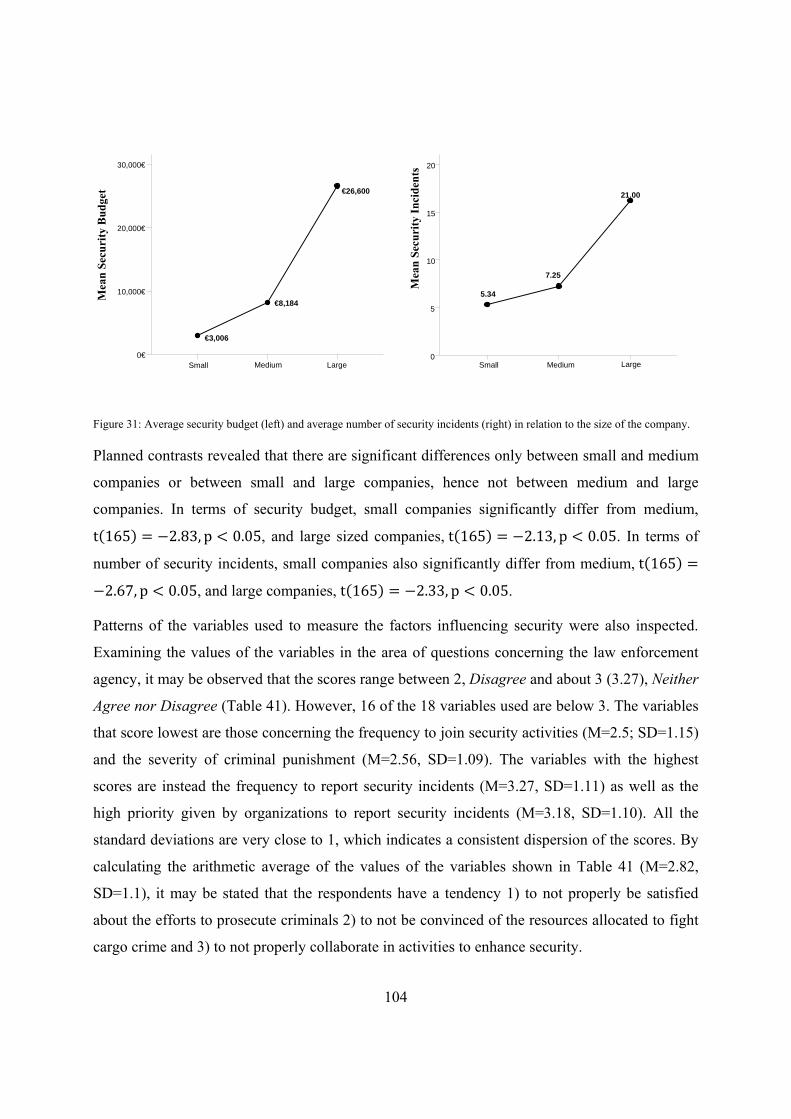
104
Figure 31: Average security budget (left) and average number of security incidents (right) in relation to the size of the company.
Planned contrasts revealed that there are significant differences only between small and medium
companies or between small and large companies, hence not between medium and large
companies. In terms of security budget, small companies significantly differ from medium, t(165) = −2.83, p < 0.05, and large sized companies, t(165) = −2.13, p < 0.05. In terms of
number of security incidents, small companies also significantly differ from medium, t(165) =−2.67, p < 0.05, and large companies, t(165) = −2.33, p < 0.05.
Patterns of the variables used to measure the factors influencing security were also inspected.
Examining the values of the variables in the area of questions concerning the law enforcement
agency, it may be observed that the scores range between 2, Disagree and about 3 (3.27), Neither
Agree nor Disagree (Table 41). However, 16 of the 18 variables used are below 3. The variables
that score lowest are those concerning the frequency to join security activities (M=2.5; SD=1.15)
and the severity of criminal punishment (M=2.56, SD=1.09). The variables with the highest
scores are instead the frequency to report security incidents (M=3.27, SD=1.11) as well as the
high priority given by organizations to report security incidents (M=3.18, SD=1.10). All the
standard deviations are very close to 1, which indicates a consistent dispersion of the scores. By
calculating the arithmetic average of the values of the variables shown in Table 41 (M=2.82,
SD=1.1), it may be stated that the respondents have a tendency 1) to not properly be satisfied
about the efforts to prosecute criminals 2) to not be convinced of the resources allocated to fight
cargo crime and 3) to not properly collaborate in activities to enhance security.
Large MediumSmall
Mea
n Se
curi
ty In
cide
nts 20
15
10
5
0
21.00
7.25
5.34Mea
n Se
curi
ty B
udge
t
30,000€
20,000€
10,000€
0€
€26,600
€8,184
€3,006
LargeMedium Small

105
Table 41: Summary of variables measuring the influence of law enforcement agency (N=175).
Mean Std. Deviation
Effort of Prosecutor to punish criminals 2.63 0.95
Penalty sentence 2.74 1.08
Quick arrest and process in court 2.64 1.14
Increased confidence for law enforcement's efforts 2.94 1.06
Criminals' return to target 2.79 1.05
Rigid criminal punishment 2.56 1.09
High security reporting frequency 3.27 1.11
Efforts to arrest criminals 2.84 1.05
Law enforcement resource allocation 2.72 1.13
Confidence in prosecution after reporting 2.98 1.07
Security reporting highest priority 3.18 1.10
Reporting incidents increases police resource allocation 2.94 1.05
Always joined security activities 2.50 1.15
Security activities enhance security 2.66 1.19
Security knowledge is improved by joining security activities 2.82 1.24
Security activities improve collaboration among stakeholders 2.75 1.20
Importance of collaboration with law enforcement agency 2.91 1.26
Collaboration with law enforcement agency improves security 2.79 1.17
Moving to the areas of questions concerning the behaviors of distribution and transport operators
we found that the acceptance of freight rate increments of transport buyers is quite low
(M=1.3%, SD=3.17%, N=71).
Figure 32: Freight Rate Increments (%) accepted by transportation buyers (N=71; the remaining 59.4% didn’t know or didn’t want to answer).
30.9%
1.7% 1.7% 0.6%
4%1.1% 0.6%
0%
5%
10%
15%
20%
25%
30%
35%
0% 2% 3% 4% 5% 10% 20%

106
About 31% respondents state that their customers are not willing to accept any freight rate
increments when enhancing security. 4% of the respondents have managed to increase by 5%.
Increments of 2%, 3% and even 10% are also common among respondents. On a few occasions
freight rate increments scored 10% (1.1% of respondents) and 20% (0.6% of respondents)
(Figure 32).
Examining the summary of the scores given to the variables measuring the acceptance of freight
rates increments the respondents seem to agree that it is difficult to justify price increments
because of security enhancements (Table 42). All the scores range between 3, Neither Agree nor
Disagree and 4, Agree with a mean value of M=3.45 and SD=1.18.
Table 42: Summary of variables to measure acceptance of freight rates increments (N=175).
Mean Std. Deviation Security at low price 3.42 1.15 Security budget lack 3.16 1.06 Freight rates increment acceptance 3.64 1.23 Marginal revenues too low to allow security investments 3.53 1.25 Competitive advantage not compromised by higher security 3.34 1.20 Magnitude of customers willing to pay for higher security 3.63 1.17
Table 43 depicts the perception of the conflict between JIT and security. All the values are very
close to 3, Neither Agree nor Disagree and have a very small tendency towards 2, Disagree.
However, examining the mean value of this group of questions it is possible to state that the
respondents were almost neutral to this problem (M=2.9, SD=1.02).
Table 43: Summary of variables measuring JIT vs. Security problem (N=175).
Mean Std. Deviation Security compromised by high degree of JIT 3.28 1.01 Security compromised by waiting time at terminals 2.45 1.12 Applications of JIT principles increase risk for security incidents 2.92 0.99
JIT and security have to be traded off 2.92 1.03 JIT increases goods flows on the network as well as security 2.96 0.98 Doubts about increasing JIT or security 2.82 1.01
Of the respondents, about 44% move goods on a regional scale, followed by national (34%),
urban (10.3%), continental (8%) and worldwide (2%) (Figure 33).

107
Figure 33: Distribution length of respondent companies (N=175).
Table 44 depicts the mean and standard deviations of the variables used to measure the impact on
performance of security measures. All the variables range between 1, Strongly disagree and 3
(2.60), Neither agree nor disagree. It seems that generally the introduction of security measures
does not affect organizational performance (M=2.18, SD=1.17). However it is possible to depict
two groups of variables, one with higher scores and one with lower. The variables that score
higher are labor costs, administrative costs, increased number of routines, working environment
too complex and increased number of technologies to be learned. Hence, it appears that
respondents perceive some influence of the security measures more on direct costs rather than on
logistical efficiency (i.e. time delays, customer satisfaction, delivery precision etc.).
Table 44: Summary of variables measuring the impact on performance of security (N=175).
Mean Std. Deviation Worsening of customer service 1.69 0.87 Worsening of time deliveries precision 1.71 0.91 Labor costs increase 2.29 1.37 Increased administrative costs 2.58 1.43 Customer satisfaction more difficult 1.87 1.05 Time deliveries delays 1.88 1.04 Increased number of routines to be followed 2.60 1.33 Working environment too complex 2.48 1.22 Increased number of technologies to be learned 2.54 1.33
10.3%
44%
34.3%
8%2.3% 0.6% 0.6%
0%5%
10%15%20%25%30%35%40%45%50%
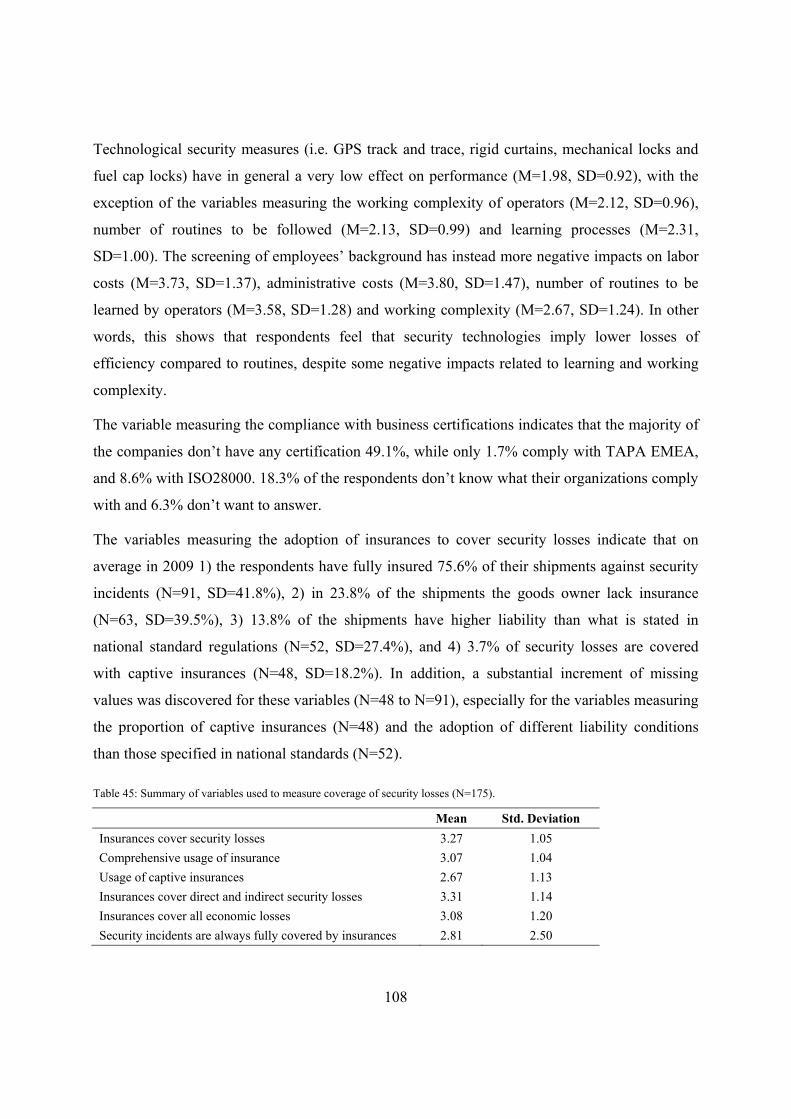
108
Technological security measures (i.e. GPS track and trace, rigid curtains, mechanical locks and
fuel cap locks) have in general a very low effect on performance (M=1.98, SD=0.92), with the
exception of the variables measuring the working complexity of operators (M=2.12, SD=0.96),
number of routines to be followed (M=2.13, SD=0.99) and learning processes (M=2.31,
SD=1.00). The screening of employees’ background has instead more negative impacts on labor
costs (M=3.73, SD=1.37), administrative costs (M=3.80, SD=1.47), number of routines to be
learned by operators (M=3.58, SD=1.28) and working complexity (M=2.67, SD=1.24). In other
words, this shows that respondents feel that security technologies imply lower losses of
efficiency compared to routines, despite some negative impacts related to learning and working
complexity.
The variable measuring the compliance with business certifications indicates that the majority of
the companies don’t have any certification 49.1%, while only 1.7% comply with TAPA EMEA,
and 8.6% with ISO28000. 18.3% of the respondents don’t know what their organizations comply
with and 6.3% don’t want to answer.
The variables measuring the adoption of insurances to cover security losses indicate that on
average in 2009 1) the respondents have fully insured 75.6% of their shipments against security
incidents (N=91, SD=41.8%), 2) in 23.8% of the shipments the goods owner lack insurance
(N=63, SD=39.5%), 3) 13.8% of the shipments have higher liability than what is stated in
national standard regulations (N=52, SD=27.4%), and 4) 3.7% of security losses are covered
with captive insurances (N=48, SD=18.2%). In addition, a substantial increment of missing
values was discovered for these variables (N=48 to N=91), especially for the variables measuring
the proportion of captive insurances (N=48) and the adoption of different liability conditions
than those specified in national standards (N=52).
Table 45: Summary of variables used to measure coverage of security losses (N=175).
Mean Std. Deviation Insurances cover security losses 3.27 1.05 Comprehensive usage of insurance 3.07 1.04 Usage of captive insurances 2.67 1.13 Insurances cover direct and indirect security losses 3.31 1.14 Insurances cover all economic losses 3.08 1.20 Security incidents are always fully covered by insurances 2.81 2.50

109
On average, the respondents are neutral when asked to judge if they believe that security
insurances are the best way to cover security losses (M=3.04, SD=1.34). All the variables except
two, usage of captive insurances and full coverage of security incidents, are greater than 3,
Neither Agree nor Disagree. Also in this case standard deviations show a consistent variance,
especially for the last variable “Security incidents are always fully covered by insurances”,
M=2.81 and SD=2.5 (Table 45).
Finally, the respondents moderately complain about premium discounts that seem not being
offered when enhancing security (M=2.73, SD=1.16). This may also be observed in Table 46
where all the variables’ scores are between 2.53, easiness to agree on premium discounts, and
2.88, premium discounts in relation to the installation of security technologies.
Table 46: Summary of variables measuring the premium discounts acceptance (N=175).
Mean Std. Deviation Our organization gets premium discounts 2.77 1.15 Easiness to agree on premium discounts 2.53 1.12 Premium discounts agreements are never a loss of time 2.78 1.23 Installation of security technologies gives premium discounts 2.88 1.16 Application of security routines gives premium discounts 2.87 1.20 Premium discounts always offered if working actively with security 2.78 1.13
Almost 60 respondents report that they are not receiving premium discount when implementing
security measures. Among the companies that are receiving premium discounts, 8% and 10%
reductions are the most popular. In addition, the premium discounts offered by insurance
companies are on average around 3% with a standard deviation of 4.3% (N=93) (Figure 34).

110
Figure 34: Frequency distribution of magnitude of premium discounts (N=92).
Table 47 shows that the first five variables used to measure the respondents’ opinions about the
integration in their organization of security devices are slightly greater than 3, Neither Agree nor
Disagree. Hence, it is possible to affirm that the issue concerning the impact of the security
devices on security as well as the integration in the organization is perceived as a problem. The
last five variables measuring the expensiveness of the security solutions are closer to 4 (Agree)
which implies that the respondents have a more pronounced tendency to agree with the fact that
in general security devices are too expensive.
Table 47: Summary of data used to measure the influence of security solution providers (N=175).
Mean Std. Deviation Security devices with short pay off are not ready for industrial usage 3.22 0.80 Too long time and work to integrate advanced security solutions 3.35 0.97 Security prototypes don't succeed to enhance security and don't become products 3.24 0.93 Existing security measures are difficult to integrate 3.12 1.02 Security devices are difficult to integrate with our processes 3.21 0.99 Most effective security is too expensive 3.54 1.09 Security solutions we can afford cannot stop criminals 3.48 1.10 Security budget not enough to buy most effective devices 3.44 1.13 Payoff of the most efficient security devices is too long 3.45 1.02 Security costs become too high when installing on the whole fleet of vehicles 3.70 1.14
Magnitude of premium discount14121086420
Freq
uenc
y
60
50
40
30
20
10
0

111
The variable that scored higher is the one measuring the costs impact of security solutions when
installed on the whole fleet of vehicles owned by the company (M= 3.70, SD=1.14). The
standard deviations of the variables that are close to 1 also indicate a consistent dispersion of the
scores.
Respondents had a slight tendency to agree that criminals are difficult to stop (M=3.72,
SD=1.00) because their technical skills make security useless (M= 3.56, SD=1.07), and easily
deceived (M=3.56, SD=1.07). Besides, respondents believe that the exploitation of insiders may
make most existing protections ineffective (M=3.50, SD=1.09) (Table 48).
Table 48: Summary of data measuring the behavior of criminals (N=175).
Mean Std. Deviation Criminals can’t be stopped by security measures 3.72 1.00 Security solutions are easily deceived by criminals 3.56 1.07 Skilled criminal groups make security useless 3.57 1.10 Use of insiders makes security useless 3.50 1.09 No technologies or routines may efficiently stop cargo crime 3.55 1.06
The majority of the variables used to measure the usage of contract agreements including
liabilities sharing between buyers and sellers indicate that respondents have a moderate tendency
to believe that it is important to share liabilities, to avoid unclear contracts, use standard
agreements etc. (Table 49).
Some lower scores may be detected for the variables measuring the difficulty to agree on
security requirements in contract agreements, especially the question asking whether customers
require the specification of security in contracts (M=2.59, SD=1.09). All the variables show
consistently high standard deviations (all are slightly greater than 1).
The majority of the companies has not complied with any of the AEO certifications (60.6%),
while about 5.7% of the respondents didn’t want to answer and 28.6% didn’t know whether they
have joined the certification or not. The AEO-C (Customs Simplification) is the most popular
certification for the companies (2.3%), followed by AEO-F (Full) (1.7%) and finally AEO-S
(Safety and Security) (0.6%) (Figure 35).

112
Table 49: Summary of contract regulatory association variables (N=175).
Mean Std. Deviation
Written contracts with liabilities sharing usage 2.90 1.07 Importance to share liabilities 3.43 1.02 Contracts clarity about risk sharing standards 3.56 1.07 Avoidance of unclear contracts with no risk sharing 3.61 1.08 Usage of NSAB2000 to share risks 3.21 1.04 Contracts with customers are too complex 2.86 0.97 Prefer Verbal Agreements (due to contract complexity) 2.85 1.07 Contract agreements demand too much time and resources 2.94 1.11 Don't understand the importance of written agreements 2.84 1.09 Don't know how to use contracts in case of security incidents 2.88 1.06 Always specify security requirements in contracts 2.74 1.11 It is important to specify security requirements in contracts 3.30 1.12 Our customers require the specification of security in contracts 2.59 1.09 Our organization always proposes detailed descriptions of security in contracts 2.67 1.04 We have easily agreed with our customers on specifying security requirements in contracts 2.76 1.05 It has been difficult to agree on what security requirements to choose 2.94 1.04 Contract agreement about security requirements takes too much time and resources 3.05 1.08 We avoid specifying security requirements since it is too complex 2.90 1.02 It is difficult to determine the effect of security and thereafter agree on contracts 3.06 1.00 Different opinions about security requirements in contracts 2.88 1.04
Figure 35: Respondents’ compliance to AEO certification (N=175).
Finally, the respondents are neutral in relation to the statement that AEO reduces the efficiency
of transport companies (M=3.09, SD=0.35) (Table 50). The respondents have a slight tendency
to agree that the AEO is confusing (M=3.31, SD=0.42), is not effective on security (M=3.30,
2.3% 0.6% 1.7%
60.6%
28.6%
5.7%
0%
10%
20%
30%
40%
50%
60%
70%
AEO-C AEO-S AEO-F None of the above
Don't know Don't want to answer

113
SD=0.42) and is too costly (M=3.32, SD=0.44). At the same time, the respondents have a
moderate inclination to perceive the AEO as a means to improve their competitive advantage
(M=2.83, SD=0.56) (Table 50). An important issue that was noticed is that this set of questions
had missing values between 120 and 126, giving the overall impression that respondents have
very scarce knowledge of the AEO certifications and couldn’t answer the questions. This was
also confirmed by the fact that some respondents wrote with a pen on the side of the
questionnaire that they couldn’t answer since they didn’t know what AEO is.
Table 50: Perception of AEO impacts on security and efficiency of transport companies (N=175).
Mean Std. Deviation AEO is confusing 3.31 0.42 AEO doesn't enhance security 3.30 0.42 AEO compliance costs too much 3.32 0.44 AEO is not giving any competitive advantage 2.83 0.56 AEO reduces our organization’s efficiency 3.09 0.35
6.2 Law Enforcement Agency
6.2.1 Factor and Reliability Analysis A Principal Component Analysis with Varimax rotation was performed to identify different
dimensions in the variables used to measure the influence of the law enforcement agency.
Examining the correlation coefficients as well as the determinant of the correlation matrix no
multicollinearity problems were detected. The Kaiser-Meyer-Olkin measure (KMO=0.90,
marvelous according to Kaiser, 1974) indicates the suitability of the sample size for the factor
analysis.
The Bartlett’s test of sphericity is significantly large (χ (153)=2581.3, p<0.01), which implies
that the correlation matrix is not an identity matrix (the correlations between items were
sufficiently large). Examining the scree plot, and following the Kaiser’s criterion, a total of three
factors explaining 72.3% of the variance were extracted. The interpretation of the variables
clustered in the rotated component matrix (Table 51), results in the following factors:
• Component 1. Criminal Prosecution.
• Component 2. Involvement in Collaborative Activities.
• Component 3. Resource Allocation.

114
Table 51: Summary of Exploratory and Confirmatory Factor Analysis for law enforcement agency (N=175).
Component Measurement Model Item 1. 2 3 Communality Std. Coefficient t-Value Effort of Prosecutor to punish criminals 0.87 0.16 0.13 0.79 0.8 13.49 Quick arrest and process in court 0.81 0.13 0.22 0.73 0.77 10.61 Rigid criminal punishment 0.81 0.12 0.29 0.75 0.94 13.1 Slow criminal return to target 0.78 0.15 0.24 0.69 0.83 11.97 Penalty sentence 0.73 0.15 0.17 0.58 0.84 12.57 Increased confidence for law enforcement efforts 0.71 0.19 0.35 0.66 0.93 13.88 Law enforcement resource allocation 0.64 0.17 0.48 0.68 0.84 11.95 Efforts of law enforcement agency to arrest criminals 0.58 0.19 0.56 0.69 0.78 10.34 Security knowledge is improved by joining security activities 0.13 0.91 0.16 0.88 0.62 7.64 Security activities enhance security 0.12 0.90 0.15 0.84 0.87 13.13 Security activities improve collaboration among stakeholders 0.25 0.85 0.09 0.79 0.92 12.89 Importance of collaboration with law enforcement agency 0.00 0.85 0.17 0.75 0.84 12.26 Always joined security activities 0.20 0.84 0.03 0.75 0.97 13.62 Collaboration with law enforcement agency improves security 0.22 0.82 0.10 0.74 1.09 15.79 Security reporting highest priority 0.29 0.15 0.77 0.70 1.17 16.49 High security reporting frequency 0.17 0.02 0.77 0.62 1.03 14.11 Confidence in proper prosecution after reporting 0.41 0.18 0.71 0.71 1.00 12.43 Reporting incidents increases police resource allocation 0.43 0.38 0.59 0.67 0.93 12.48 Eigenvalues 5.10 4.86 3.04 % of Variance 28.37 27.03 16.9 α 0.93 0.94 0.83 CR 0.92 0.83 0.85 AVE 0.71 0.67 1.07 Extraction Method: Principal Component Analysis. Rotation Method: Varimax with Kaiser Normalization. Model Fit Indices: normed = 3.44, Goodness of Fit Index = 0.82<(0.90), adjusted goodness of fit = 0.72 (<0.80), non-normed fit index = 0.94 (≥ 0.90), root mean square residual = 0.08 (≤ 0.10), root mean square error of approximation = 0.1 (≤ 0.10). All t-values are significant at p < 0.05 level.
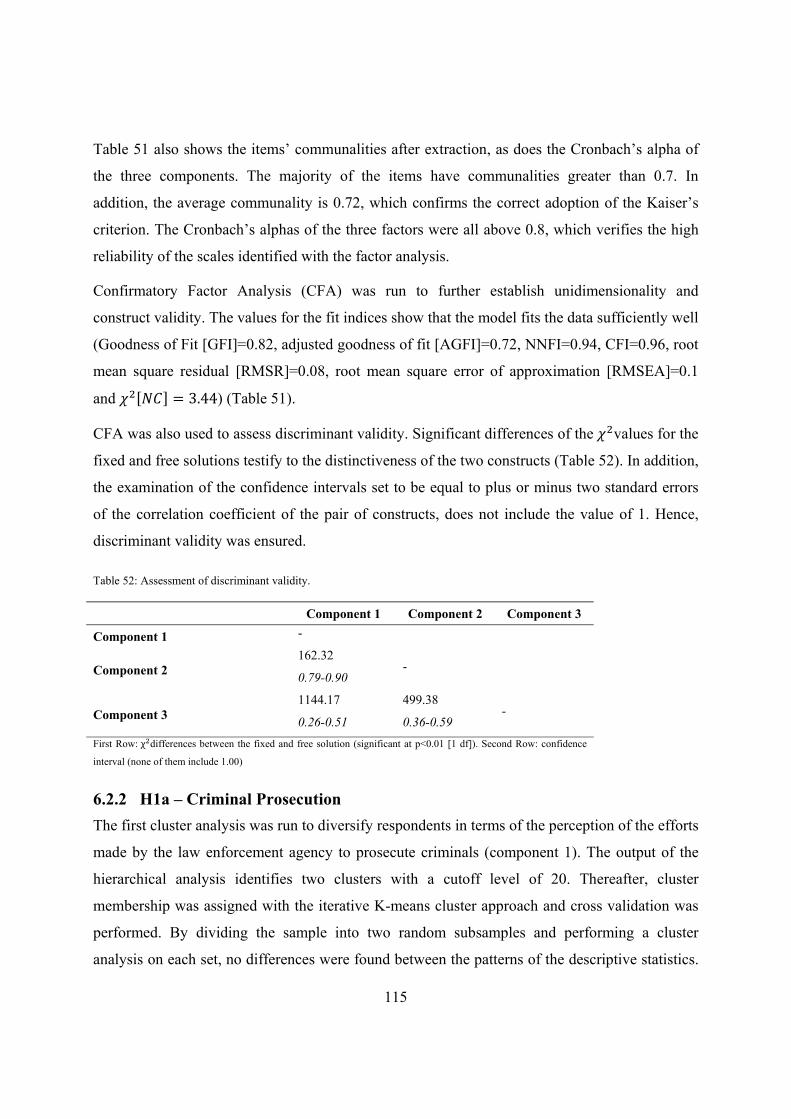
115
Table 51 also shows the items’ communalities after extraction, as does the Cronbach’s alpha of
the three components. The majority of the items have communalities greater than 0.7. In
addition, the average communality is 0.72, which confirms the correct adoption of the Kaiser’s
criterion. The Cronbach’s alphas of the three factors were all above 0.8, which verifies the high
reliability of the scales identified with the factor analysis.
Confirmatory Factor Analysis (CFA) was run to further establish unidimensionality and
construct validity. The values for the fit indices show that the model fits the data sufficiently well
(Goodness of Fit [GFI]=0.82, adjusted goodness of fit [AGFI]=0.72, NNFI=0.94, CFI=0.96, root
mean square residual [RMSR]=0.08, root mean square error of approximation [RMSEA]=0.1
and = 3.44) (Table 51).
CFA was also used to assess discriminant validity. Significant differences of the values for the
fixed and free solutions testify to the distinctiveness of the two constructs (Table 52). In addition,
the examination of the confidence intervals set to be equal to plus or minus two standard errors
of the correlation coefficient of the pair of constructs, does not include the value of 1. Hence,
discriminant validity was ensured.
Table 52: Assessment of discriminant validity.
Component 1 Component 2 Component 3
Component 1 -
Component 2 162.32
0.79-0.90 -
Component 3 1144.17
0.26-0.51
499.38
0.36-0.59 -
First Row: χ differences between the fixed and free solution (significant at p<0.01 [1 df]). Second Row: confidence
interval (none of them include 1.00)
6.2.2 H1a – Criminal Prosecution The first cluster analysis was run to diversify respondents in terms of the perception of the efforts
made by the law enforcement agency to prosecute criminals (component 1). The output of the
hierarchical analysis identifies two clusters with a cutoff level of 20. Thereafter, cluster
membership was assigned with the iterative K-means cluster approach and cross validation was
performed. By dividing the sample into two random subsamples and performing a cluster
analysis on each set, no differences were found between the patterns of the descriptive statistics.

116
Only one discriminant function ( = 0.79) significantly distinguishes the two groups, Λ =0.37, (8) = 167.27, < 0.001. Classification results show that overall 90.9% of the cross-
validated grouped cases were correctly classified. More specifically, 91.7% of the cluster 1 cases
and 90.1% of cluster 2 were correctly classified. The scores of the functions at group centroids
unveil that the first cluster has a positive perception of the efforts made by the law enforcement
agency to prosecute criminals, while the second has a negative perception. Table 53 reports the
average scores of the two groups in relation to the variables aggregated in this factor. According
to the table, the first group has scores between 3, Neither Agree nor Disagree and 4, Agree,
while the second group scores between 1, Strongly Disagree and 3, Neither Agree nor Disagree.
To check whether there were significant differences between the clusters, in terms of security
budget and attacks borne, a MANOVA was performed. In addition, univariate analysis and
discriminant analysis were performed to follow up the results of the MANOVA (Table 54).
According to Pillai’s trace, the groups’ means significantly differ, V = 0.07, (2, 168) =6.63, < 0.01 (Box’s test not significant, p>0.05). In other words, the perception of the efforts
made by the law enforcement agency has a significant effect on the security budget and number
of security incidents suffered by transportation companies.
Table 53: Summary of groups’ scores on the factor variables used in Component 1.
Group N Mean Std. Deviation
Effort of Prosecutor to punish criminals 1 84 3.34 0.66 2 91 1.98 0.68
Quick arrest and process in court 1 84 3.44 0.86 2 91 1.90 0.83
Rigid criminal punishment 1 84 3.37 0.78 2 91 1.81 0.74
Slow criminal return to target 1 84 3.49 0.76 2 91 2.13 0.83
Penalty sentence 1 84 3.38 0.75 2 91 2.16 1.00
Increased confidence for law enforcement efforts
1 84 3.56 0.83 2 91 2.36 0.92
Law enforcement resource allocation 1 84 3.43 0.94 2 91 2.07 0.85
Efforts of law enforcement agency to arrest criminals
1 84 3.41 0.88 2 91 2.31 0.90

117
Table 54: MANOVA results H1a.
Test Value F(2, 168) Significance Observed Power(a) Pillai's Trace 0.07 6.63 0.00 0.91 Wilks' Lambda 0.92 6.63 0.00 0.91 Hotelling's Trace 6.13 6.63 0.00 0.91 Roy's Largest Root 6.13 6.63 0.00 0.91 Between Subjects Effect Mean Square F(1,169) Significance Observed Power Security Budget 15.79 4.87 0.03 0.59 Security Incidents 2.20 12.32 0.00 0.93 a) Computed using alpha=0.05.
Moreover, separate univariate ANOVAs on the outcome variables revealed that the effort of the
law enforcement agency has significant effects both on the security budget, (1, 169) = 4.87,< 0.05 and the security incidents separately, (1, 169) = 12.32, < 0.01 (Table 54).
The discriminant analysis identifies one discriminant function that significantly differentiates the
groups of companies, Λ = 0.94, (2) = 9.52, < 0.01. The function correlates negatively with
the security budget ( = −0.46) and negatively with the number of security incidents ( =0.88). Hence, the position of the groups’ centroids in relation to the discriminant function shows
that the first group invests more on security and is affected by fewer security incidents.
Figure 36: Clusters means of security budget (left) and security incidents (right).
On the contrary, the second group, which had a negative perception of the efforts made by the
law enforcement agency, invest less in security and is more affected by security incidents. This
may also be depicted in Figure 36 where the means of the clusters are reported in relation to the
magnitude of security budget and security incidents. The first group invests on average
M=€6,383 (SD=€9,687) and has an average number of security incidents of M=4.69 (SD=6.85).
Cluster LEA Efforts Factor21
Mea
n S
ecur
ity B
udge
t
€8,000
€6,000
€4,000
€2,000
€0
Error Bars: 95% CICluster LEA Efforts Factor
21
Mea
n S
ecur
ity In
cide
nts
10
8
6
4
2
0
Error Bars: 95% CI

118
The second group has an average security budget of M=€4,250 (SD=€9,581) while it is subject
to a higher number of security incidents, M=7.81 (SD=7.53). Hence, the hypothesis is not
rejected.
6.2.3 H1b - Resource Allocation The second cluster analysis was run on the component related to the efforts made to allocate
resources to combat cargo crime (third component of factor analysis). The output of the
hierarchical analysis identifies two clusters with a cutoff level of 15. Cluster membership was
assigned with the iterative K-means cluster approach and cross validation was performed. By
dividing the sample into two random subsamples and performing a cluster analysis on each set,
no differences were found between the patterns of the descriptive statistics. The discriminant
analysis identified only one function that significantly distinguishes the groups, Λ =0.43, (4) = 143.26, < 0.001. Classification results show that overall 89.7% of the cross-
validated grouped cases were correctly classified. More specifically, 93.6% of the cluster 1 cases
and 85.2% of cluster 2 were correctly classified. Examining the groups’ centroids in relation to
this function it is possible to state that the first cluster has a negative perception about the impact
of reporting activities on the resources allocated by the law enforcement agency. The second
cluster is positively convinced that the correct amount of resources is allocated if organizations
report security incidents. In Table 55, the means of the second group score between 3.45 (3,
Neither Agree nor Disagree) and 4.04 (4, Agree and 5, Strongly Agree), while the first group has
all the variables scoring below 3, Neither Agree nor Disagree.
Table 55: Summary of groups’ scores in relation to the factor variables used in component 3 (N=175).
Group N Mean Std. Deviation
Security reporting frequency 1 94 2.61 0.96 2 81 4.04 0.71
Security reporting priority in organization 1 94 2.52 0.87 2 81 3.94 0.82
Confidence for prosecution after reporting 1 94 2.39 0.82 2 81 3.65 0.92
Relationship reporting and resource allocation 1 94 2.50 0.89 2 81 3.45 1.00
By performing a MANOVA it was discovered that the factor concerning the perception of the
resource allocation of the law enforcement agency has significant effects on the security budget

119
as well as on the number of incidents, Pillai’s trace V = 0.11, (2, 168) = 10.89, < 0.01
(Box’s M test not significant, p>0.05). Separate univariate ANOVAs also showed significant
relationships with the security budget (p<0.01) as well as with the amount of security incidents
(p<0.01). The discriminant analysis unveiled that one function significantly distinguishes the two
groups, Λ = 0.92, (2) = 14.44, < 0.01. This function correlates negatively with the number
of incidents variable ( = −0.61) and shows at the same time a positive correlation with the
security budget ( = 0.81).
Table 56: MANOVA Results H1b.
Value F (2,168) Significance Observed Power(a)
Pillai's Trace 0.11 10.89 0.00 0.99
Wilks' Lambda 0.88 10.89 0.00 0.99 Hotelling's Trace 0.13 10.89 0.00 0.99 Roy's Largest Root 0.13 10.89 0.00 0.99 Between Subjects Effect Mean Square F(1,169) Significance Observed Power(a)
Security Budget 55.60 18.49 0.00 0.99
Security Incidents 1.85 10.22 0.00 0.89 a) Computed using alpha=0.05.
Hence, examining the position of the groups’ centroids in relation to this function it was possible
to deduce that the first cluster had lower security budget and higher number of incidents
(Security Budget, M=€3,236, SD=€8,103; Security Incidents, M=7.43, SD=7.35). On the
contrary, the second cluster had higher security budget and suffered fewer security incidents
(Security Budget, M=€7,702, SD=€10,802; Security Incidents, M=4.95, SD=7.18) (Figure 37).
Hence, the second hypothesis, H1b is not rejected.
Figure 37: Clusters means of security budget (left) and security incidents (right).
Cluster Number of Case21
Mea
n Se
curit
y Bu
dget
€12,000
€10,000
€8,000
€6,000
€4,000
€2,000
€0
Error Bars: 95% CICluster Number of Case
21
Mea
n S
ecur
ity In
cide
nts
10
8
6
4
2
0
Error Bars: 95% CI

120
6.2.4 H1c - Involvement in Collaborative Activities
The final cluster analysis is conducted on the factor measuring the degree of involvement in
collaborative activities and seminars organized by the law enforcement agency. The output of the
hierarchical analysis identifies two clusters with a cutoff level of 12. Cluster membership was
assigned with the iterative K-means cluster approach and cross validation was successfully
verified. Two clusters are identified and the discriminant analysis identifies one function that
significantly distinguishes the two groups, Λ = 0.26, (6) = 226.26, < 0.001. The scores of
the groups’ centroids reveal that, contrarily to the first group, the second is not convinced of the
beneficial effects of collaborative activities organized by the law enforcement agency.
Classification results show that overall 95.4% of the cross-validated grouped cases were
correctly classified. More specifically, 97.1% of the cluster 1 cases and 92.9% of cluster 2 were
correctly classified. Likewise, the groups’ means in terms of the factor variables put into
evidence show consistent differences between the groups (Table 57). All the variables scored by
the first group are greater than 3, Neither Agree nor Disagree; the second group has scores very
close to 1, Strongly Disagree. In addition, it may be observed that many respondents belong to
the first group (N=105).
Table 57: Summary of factor variables’ scores of the two clusters.
Group N Mean Std. Deviation
Effect of security activities 1 105 3.43 0.78 2 70 1.51 0.65
Security knowledge improvement by joining security activities 1 105 3.63 0.78 2 70 1.60 0.69
Security activities’ influence on collaboration among stakeholders 1 105 3.53 0.79 2 70 1.58 0.62
Importance of collaboration with law enforcement agency 1 105 3.63 0.88 2 70 1.84 0.95
Presence frequency at security activities 1 105 3.19 0.89 2 70 1.47 0.61
Influence of collaboration with law enforcement agency 1 105 3.45 0.78 2 70 1.81 0.94
The MANOVA confirms that the involvement in collaborative activities has a significant effect
on the magnitude of security budget as well as on the number of security incidents, Pillai’s trace V = 0.09, (2, 168) = 8.49, < 0.01 (Box’s M test not significant, p>0.05). Separate
univariate ANOVAs show significant relationships only with the variable measuring the security
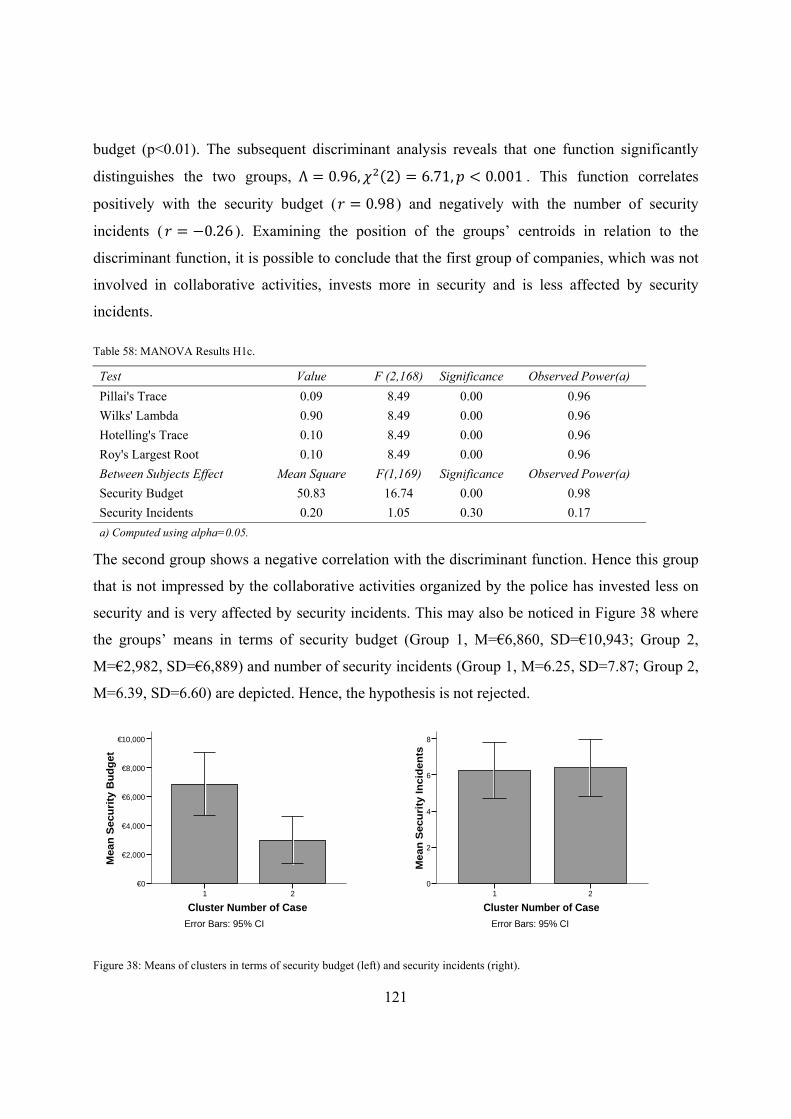
121
budget (p<0.01). The subsequent discriminant analysis reveals that one function significantly
distinguishes the two groups, Λ = 0.96, (2) = 6.71, < 0.001 . This function correlates
positively with the security budget ( = 0.98) and negatively with the number of security
incidents ( = −0.26 ). Examining the position of the groups’ centroids in relation to the
discriminant function, it is possible to conclude that the first group of companies, which was not
involved in collaborative activities, invests more in security and is less affected by security
incidents.
Table 58: MANOVA Results H1c.
Test Value F (2,168) Significance Observed Power(a) Pillai's Trace 0.09 8.49 0.00 0.96 Wilks' Lambda 0.90 8.49 0.00 0.96 Hotelling's Trace 0.10 8.49 0.00 0.96 Roy's Largest Root 0.10 8.49 0.00 0.96 Between Subjects Effect Mean Square F(1,169) Significance Observed Power(a) Security Budget 50.83 16.74 0.00 0.98 Security Incidents 0.20 1.05 0.30 0.17 a) Computed using alpha=0.05.
The second group shows a negative correlation with the discriminant function. Hence this group
that is not impressed by the collaborative activities organized by the police has invested less on
security and is very affected by security incidents. This may also be noticed in Figure 38 where
the groups’ means in terms of security budget (Group 1, M=€6,860, SD=€10,943; Group 2,
M=€2,982, SD=€6,889) and number of security incidents (Group 1, M=6.25, SD=7.87; Group 2,
M=6.39, SD=6.60) are depicted. Hence, the hypothesis is not rejected.
Figure 38: Means of clusters in terms of security budget (left) and security incidents (right).
Cluster Number of Case21
Mea
n Se
curit
y B
udge
t
€10,000
€8,000
€6,000
€4,000
€2,000
€0
Error Bars: 95% CICluster Number of Case
21
Mea
n S
ecur
ity In
cide
nts
8
6
4
2
0
Error Bars: 95% CI

122
6.3 Distribution and Transport Operators
6.3.1 Factor and Reliability Analysis Factor and reliability analysis is performed for the hypotheses formulated for this stakeholder but
with the exception of the third hypothesis, where only one question is used to measure the length
of the transportation chain.
A Principal Component Analysis with Varimax rotation was performed to discover underlying
dimensions in the variables used in the questionnaire. Neither the correlation coefficients nor the
determinant of the correlation matrix showed signs of multicollinearity problems. The Kaiser-
Meyer-Olkin measure indicates the suitability of the sample size for the factor analysis,
KMO=0.84, which is meritorious according to Kaiser (1974). In addition, the Bartlett’s test of
sphericity is significantly large ( (210)=2468.42, p<0.01) which implies that the correlation
matrix is not an identity matrix (the correlations between items were sufficiently large).
Examining the scree plot, and following Kaiser’s criterion, a total of five factors explaining
74.3% of the variance were extracted. The interpretation of the variables clustered in the rotated
component matrix (Table 59), results in the following factors:
1. Component 1. Willingness To Pay.
2. Component 2. Just In Time.
3. Component 3. On time deliveries and customer satisfaction worsening.
4. Component 4. Administrative costs of security routines.
5. Component 5. Working environment complexity due to security technologies.
Table 59 also shows the items’ communalities after extraction as well as the Cronbach’s alpha of
the three components. According to the table, all except two items have communalities greater
than 0.7. In addition, the average communality is 0.74, which confirms the correct adoption of
the Kaiser’s criterion. The Cronbach’s alphas of the first four factors were all above 0.8, which
verifies the high reliability of the scales identified with the factor analysis. Only the last item has
a lower alpha coefficient suggesting the removal of the component.

123
Table 59: Summary of Exploratory Factor Analysis for distribution and transportation actors (N=175).
Component Measurement Model
1 2 3 4 5 Communality Std. Coefficient t-Value
Freight rates increment acceptance 0.84 0.11 0.07 0.04 0.00 0.73 0.87 11.35 Marginal revenues too low to permit security investments 0.84 0.14 0.07 0.11 0.04 0.75 0.78 10.92 Magnitude of customers willing to pay for higher security 0.84 0.05 0.01 0.10 -0.01 0.72 1.04 13.49 Competitive advantage not compromised by higher security 0.76 0.10 0.03 0.10 -0.18 0.63 1.04 13.16 Security budget lack 0.72 0.23 0.22 -0.15 0.13 0.66 0.82 9.96 Security at low price 0.71 0.23 0.20 -0.10 0.19 0.64 0.91 11.87 Applications of JIT principles increase risk of security incidents 0.13 0.88 0.02 0.02 0.02 0.79 0.49 6.58 JIT and security have to be traded off 0.19 0.87 0.01 0.03 0.04 0.80 0.58 7.01 JIT increases goods flows on the network as well as security 0.22 0.84 -0.06 0.11 0.05 0.76 0.84 13.75 Doubts about increasing JIT or security 0.22 0.83 0.04 0.00 0.07 0.75 0.91 14.62 Security compromised by waiting time at terminals -0.06 0.66 0.23 -0.14 -0.09 0.52 0.83 13.54 Security compromised by high degree of JIT 0.41 0.46 -0.10 0.05 0.23 0.44 0.84 13.22 On time deliveries worsened 0.06 0.02 0.92 0.15 0.07 0.87 0.75 14 Customer Service worsened 0.11 -0.06 0.84 0.23 0.09 0.79 0.83 15.35 Increased delivery delays 0.18 0.14 0.82 0.15 0.26 0.82 0.83 8.56 Customer satisfaction more resource and time demanding 0.11 0.09 0.81 0.30 0.12 0.78 0.68 6.47 Administrative costs increased 0.13 -0.03 0.27 0.85 0.00 0.82 0.89 13.67 Labor costs increased 0.04 -0.02 0.42 0.83 -0.01 0.87 0.91 14.28 Increased number of routines to be followed by operators -0.01 0.07 0.19 0.72 0.54 0.85 0.87 11.35 Increased number of technologies to be learned 0.13 0.02 0.23 -0.06 0.87 0.82 0.78 10.92 Working environment too complex and resource demanding -0.11 0.11 0.23 0.49 0.71 0.82 1.04 13.49 Eigen Values 4.19 3.74 3.41 2.45 1.79
% of Variance 19.98 17.81 16.24 11.68 8.56
α 0.89 0.87 0.92 0.85 0.68
CR 0.90 0.87 0.75 0.85
AVE 0.83 0.58 0.60 0.81 -- Extraction Method: Principal Component Analysis. Rotation Method: Varimax with Kaiser Normalization. Model Fit Indices: normed = 3.44, Goodness of Fit Index = 0.82<(0.90), adjusted goodness of fit = 0.77 (<0.80), non-normed fit index = 0.93 (≥ 0.90), root mean square residual = 0.09 (≤ 0.10), root mean square error of approximation = 0.09 (≤ 0.10). All t-values are significant at p < 0.05 level.
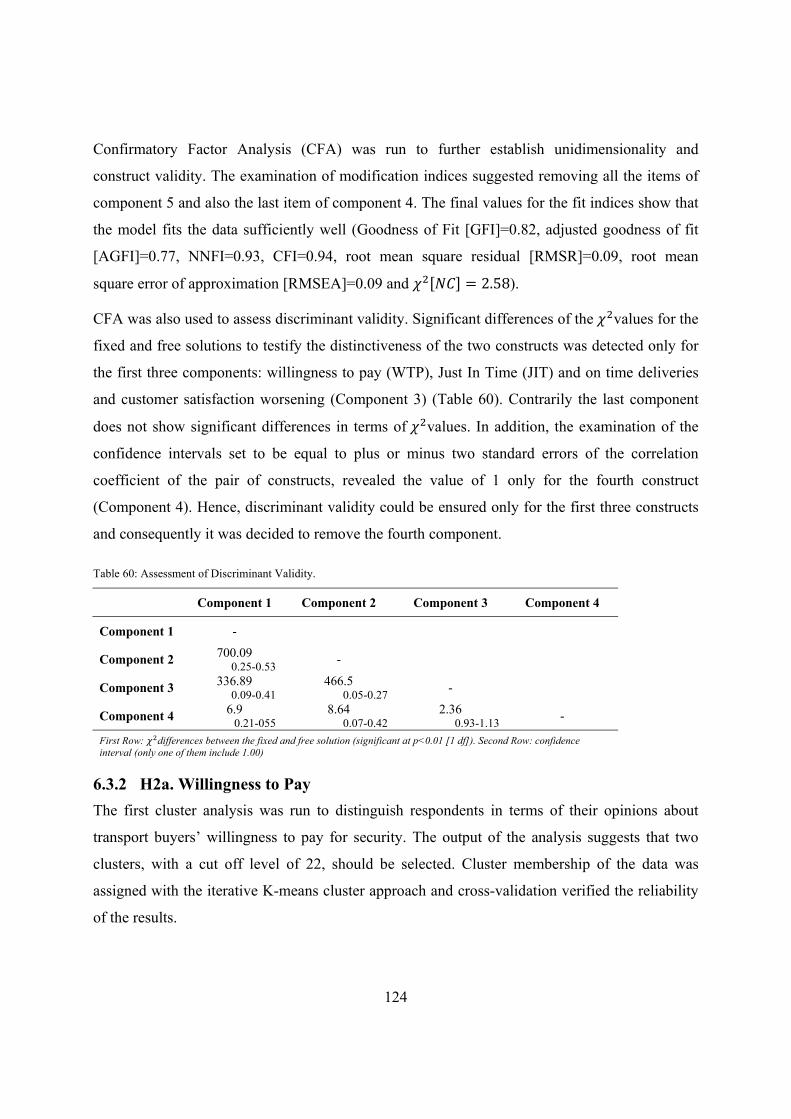
124
Confirmatory Factor Analysis (CFA) was run to further establish unidimensionality and
construct validity. The examination of modification indices suggested removing all the items of
component 5 and also the last item of component 4. The final values for the fit indices show that
the model fits the data sufficiently well (Goodness of Fit [GFI]=0.82, adjusted goodness of fit
[AGFI]=0.77, NNFI=0.93, CFI=0.94, root mean square residual [RMSR]=0.09, root mean
square error of approximation [RMSEA]=0.09 and = 2.58).
CFA was also used to assess discriminant validity. Significant differences of the values for the
fixed and free solutions to testify the distinctiveness of the two constructs was detected only for
the first three components: willingness to pay (WTP), Just In Time (JIT) and on time deliveries
and customer satisfaction worsening (Component 3) (Table 60). Contrarily the last component
does not show significant differences in terms of values. In addition, the examination of the
confidence intervals set to be equal to plus or minus two standard errors of the correlation
coefficient of the pair of constructs, revealed the value of 1 only for the fourth construct
(Component 4). Hence, discriminant validity could be ensured only for the first three constructs
and consequently it was decided to remove the fourth component.
Table 60: Assessment of Discriminant Validity.
Component 1 Component 2 Component 3 Component 4
Component 1 - Component 2 700.09
0.25-0.53 - Component 3 336.89
0.09-0.41 466.5
0.05-0.27 - Component 4 6.9
0.21-055 8.64
0.07-0.422.36
0.93-1.13 -
First Row: differences between the fixed and free solution (significant at p<0.01 [1 df]). Second Row: confidence interval (only one of them include 1.00)
6.3.2 H2a. Willingness to Pay The first cluster analysis was run to distinguish respondents in terms of their opinions about
transport buyers’ willingness to pay for security. The output of the analysis suggests that two
clusters, with a cut off level of 22, should be selected. Cluster membership of the data was
assigned with the iterative K-means cluster approach and cross-validation verified the reliability
of the results.

125
The clusters are significantly distinguished by only one discriminant function, Λ = 0.31, (1) = 202.33, < 0.001 . Classification results show that overall 98.3% of the
cross-validated grouped cases were correctly classified. More specifically, 95.7% of the cluster 1
cases and 98% of cluster 2 were correctly classified. The scores of the functions at group
centroids reveal that the first cluster is made of transportation companies whose customers are
used to accept freight rate increments. On the contrary, the second cluster has experience with
customers that are not willing to pay higher freight rates when security is enhanced. This is also
depicted in Table 61, where the scores on the factor variables of the first group range between 2,
Disagree and 3, Neither Agree nor Disagree. On the contrary, the second group has a much more
considerable perception that customers are not interested in paying for higher security (scores
between 3, Neither Agree nor Disagree and 5, Strongly Agree).
Table 61: Scores of the two groups in relation to the factor’s variables.
Group N Mean Std. Deviation Freight rate increment refusal 1 69 2.55 0.92
2 106 4.35 0.82 Marginal revenues too low to permit security investments 1 69 2.43 0.96
2 106 4.25 0.82 Low amount of customers willing to pay for higher security 1 69 2.55 0.98
2 106 4.32 0.64 Competitive advantage not compromised by higher security 1 69 2.46 1.01
2 106 3.92 0.93 Security budget lack 1 69 2.44 0.68
2 106 3.63 0.99 Security at low price 1 69 2.55 0.93
2 106 3.98 0.91
To check whether there were significant differences between these two clusters, in terms of
security budget and number of security incidents, a MANOVA was performed. None of the
multivariate tests gave signs of significant relationship between the dependent variables and the
willingness to pay factor used to differentiate the respondents, Pillai’s trace = 0.02, (2,168), > 0.05 (Table 62). Despite this, the separate univariate ANOVAs are not significant for
both the dependent variables (Table 62). Hence, the hypothesis, concerning the willingness to
pay of transport buyers as a factor diversifying transport operators in relation to their security
budgets and number of incidents, is rejected.

126
Table 62: MANOVA Results H2a.
Test Value F (2,168) Sig. Observed Power(a) Pillai's Trace 0.02 83.13 0.11 0.45 Wilks' Lambda 0.97 83.13 0.11 0.45 Hotelling's Trace 0.02 83.13 0.11 0.45 Roy's Largest Root 0.02 83.13 0.11 0.45 Between Subjects Effect Mean Square F(1,169) Significance Observed Power(a) Security Budget 173707321.1 1.87 0.17 0.27 Security Incidents 140.72 2.61 0.10 0.36 a) Computed using alpha=0.05.
6.3.3 H2b – Just In Time The hierarchical cluster analysis identified two clusters with a cut off level of 18. The subsequent
iterative K-means cluster determined the final cluster membership of the data. Moreover, the
reliability of the cluster analysis was confirmed by applying cross-validation techniques.
The two clusters are significantly distinguished by only one discriminant function, Λ =0.35, (1) = 177.49, < 0.001. The coefficient of the canonical function together with the
scores of the functions at group centroids reveal that the group of companies belonging to the
first cluster don’t experience the trade-off between security and JIT as a problem. On the
contrary, the second cluster has experience that the generic application of JIT principles may
compromise security. Classification results show that overall 97.8% of the cross-validated
grouped cases were correctly classified. More specifically, 96.4% of the cluster 1 cases and
98.3% of cluster 2 were correctly classified.
Table 63 illustrates the difference of the scores of the two groups in terms of the variables
aggregated in the factor. As can be seen, the first group has lower scores than the second. In
addition, the majority of respondents belong to the second group, which gives the impression that
often customers are not willing to pay for higher security.
The MANOVA analysis (Table 64) discovered that two groups identified significantly differ,
Pillai’s trace = 0.11, (2, 168) = 10.36, < 0.001 (Box’s M test not significant, p>0.05).
The separate univariate ANOVAs were also significant (p<0.05) (Table 64). By following up
the MANOVA with a discriminant analysis, one discriminant function was found to significantly
distinguish the clusters, Λ = 0.95, χ (2) = 8.34, < 0.05.

127
Table 63: Summary of factor variables’ scores of the two clusters.
Group N Mean Std. Deviation
Applications of JIT principles increase risk for security incidents 1 76 2.17 0.79 2 99 3.50 0.69
JIT and security have to be traded off 1 76 2.13 0.75 2 99 3.52 0.76
JIT increases goods flows on the network as well as security 1 76 2.17 0.68 2 99 3.57 0.70
Doubts about increasing JIT or security 1 76 2.07 0.80 2 99 3.40 0.74
Security compromised by waiting time at terminals 1 76 1.76 0.81 2 99 2.98 1.05
Security compromised by high degree of JIT 1 76 2.87 1.10 2 99 3.59 0.80
Table 64: MANOVA Results H2b.
Test Value F(2,168) Significance Observed Power(a) Pillai's Trace 0.11 10.36 0.00 0.98 Wilks' Lambda 0.89 10.36 0.00 0.98 Hotelling's Trace 0.12 10.36 0.00 0.98 Roy's Largest Root 0.12 10.36 0.00 0.98 Between Subjects Effect Mean Square F(1,169) Significance Observed Power(a) Security Budget 46.52 15.19 0.00 0.97 Security Incidents 2.24 12.79 0.00 0.94 a) Computed using alpha=0.05.
The correlations between the outcomes and the discriminant functions revealed that the security
budget positively correlated with the discriminant function ( = 0.49). Contrarily the number of
security incidents correlates in a negative manner ( = −0.86). The position of the groups’
centroids in relation to this discriminant function shows that the first cluster invests more in
security and is less affected by security incidents. The second cluster, experiencing that the
application of security jeopardizes their JIT efficiency, invests less and is more affected by
security incidents. The differences in terms of security budgets and security incidents of the two
groups may also be observed in Figure 39 where the first group shows a higher budget allocated
for security (Group 1, M=€6,498, SD=€10,020; Group 2, M=€4,338, SD=€9,324) and is affected
by fewer security incidents (Group 1, M=4.72, SD=7.21; Group 2, M=7.49, SD=7.28). Hence,
the hypothesis is tenable.

128
Figure 39: Means of clusters in relation to security budget (left) and number of security incidents (right).
6.3.4 H2c – Length of Distribution Network To test this hypothesis, only one variable was used to determine the length of the distribution
chain. Hence, no factor, reliability and cluster analysis was run. A MANOVA analysis, using
Pillai’s trace, unveiled that the length of the distribution network has significant effects on the
budget placed by industries to secure their assets as well as on the number of security incidents, = 0.14, (2, 163) = 3.16, < 0.01.
Table 65: MANOVA Results H2c.
Test Value F (2,163) Significance Observed Power(a) Pillai's Trace 0.14 3.16 0.00 0.97 Wilks' Lambda 0.86 3.21 0.00 0.97 Hotelling's Trace 0.16 3.27 0.00 0.97 Roy's Largest Root 0.14 5.93 0.00 0.98 Between Subjects Effect Mean Square F (4,164) Significance Observed Power(a) Security Budget 16.01 5.30 0.00 0.97 Security Incidents 0.14 0.71 0.58 0.23 a) Computed using alpha=0.05.
Separate univariate analysis, confirms the significance of distribution network length only on the
security budget, < 0.01, but not on the security incidents, > 0.05. Post-hoc tests reveal,
from the viewpoint of the magnitude of security budget, that:
1. Urban distribution networks significantly differ from national (p<0.05), continental (0.01)
and worldwide (0.05).
2. Regional distribution networks significantly differ from worldwide networks (p<0.05).
Cluster JIT21
Mea
n S
ecur
ity B
udge
t
€10,000
€8,000
€6,000
€4,000
€2,000
€0
Error Bars: 95% CICluster JIT
21
Mea
n S
ecur
ity In
cide
nts
10
8
6
4
2
0
Error Bars: 95% CI

129
3. National transportation networks significantly differ only from worldwide networks
(p<0.001)
Post-hoc tests, examining the relationship with the number of security incidents, don’t show any
significant differences among the groups. By running a discriminant analysis, two discriminant
functions significantly differentiate the length of distribution networks, Λ = 0.86, (8) =24.96, < 0.01. The correlations between outcomes and the discriminant functions indicate that
the security budget variable loads highly on the first function ( = 0.93), and the security
incidents on the second ( = 0.99). The consequent discriminant function plot shows that the
first function distinguishes urban, continental and worldwide from regional and national
transportation networks. The second function discriminates urban and regional from national,
continental and worldwide networks. The investments of the companies put into relation with the
distribution length variable may be observed also in Figure 40. According to the left diagram of
the figure it is possible to depict a positive relationship between the security budget and the
length of the distribution network. Also in the left diagram it is possible to distinguish regional
and national networks from the remaining three: urban, continental and worldwide. However,
according to this figure urban operators working in continental and worldwide contexts
experience on average more security incidents than those working in regional and national areas.
This implies that the higher investments in security don’t correspond to proportionate decrements
of security incidents. Hence, the hypothesis is not tenable.
Figure 40: Distribution lenght variable in relation to security budget (left) and number of incidents (right).
Distribution Lenght
WorldwideContinental
NationalRegional
Urban
Mea
n Se
curit
y B
udge
t
€40,000
€30,000
€20,000
€10,000
€0
Error Bars: 95% CIDistribution Lenght
WorldwideContinental
NationalRegional
Urban
Mea
n Se
curit
y In
cide
nts 25
20
15
10
5
0
Error Bars: 95% CI
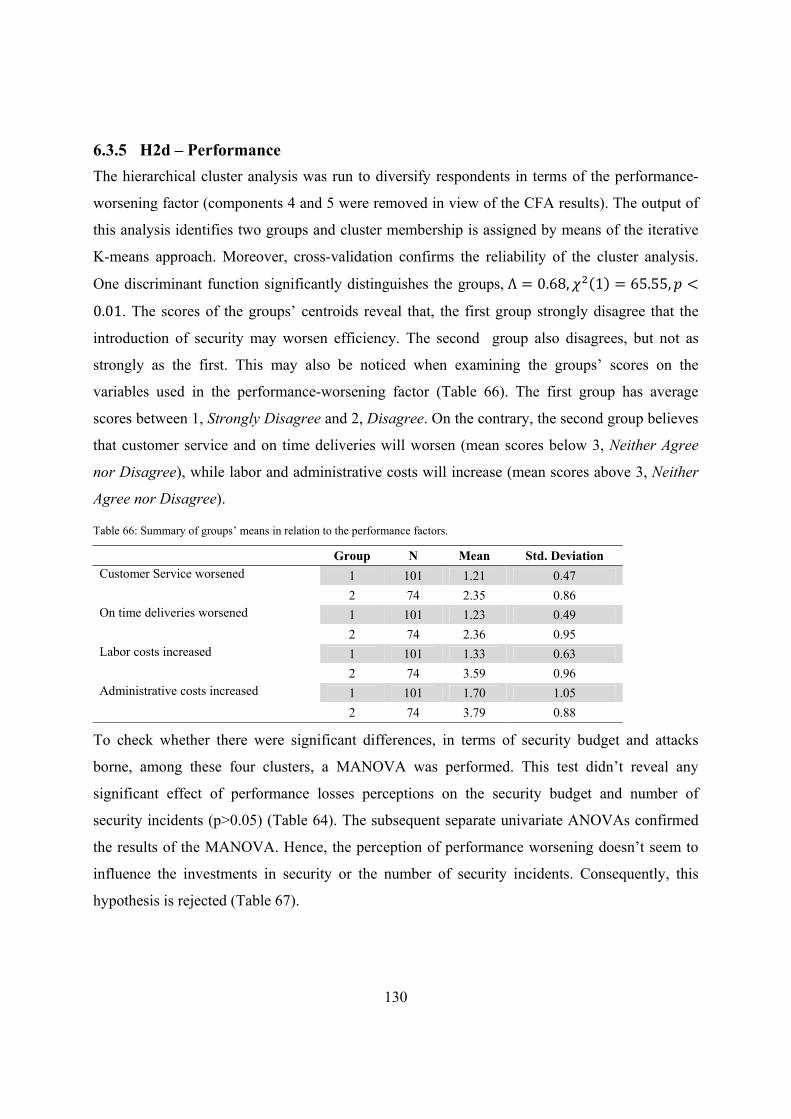
130
6.3.5 H2d – Performance The hierarchical cluster analysis was run to diversify respondents in terms of the performance-
worsening factor (components 4 and 5 were removed in view of the CFA results). The output of
this analysis identifies two groups and cluster membership is assigned by means of the iterative
K-means approach. Moreover, cross-validation confirms the reliability of the cluster analysis.
One discriminant function significantly distinguishes the groups, Λ = 0.68, (1) = 65.55, <0.01. The scores of the groups’ centroids reveal that, the first group strongly disagree that the
introduction of security may worsen efficiency. The second group also disagrees, but not as
strongly as the first. This may also be noticed when examining the groups’ scores on the
variables used in the performance-worsening factor (Table 66). The first group has average
scores between 1, Strongly Disagree and 2, Disagree. On the contrary, the second group believes
that customer service and on time deliveries will worsen (mean scores below 3, Neither Agree
nor Disagree), while labor and administrative costs will increase (mean scores above 3, Neither
Agree nor Disagree).
Table 66: Summary of groups’ means in relation to the performance factors.
Group N Mean Std. Deviation Customer Service worsened 1 101 1.21 0.47
2 74 2.35 0.86 On time deliveries worsened 1 101 1.23 0.49
2 74 2.36 0.95 Labor costs increased 1 101 1.33 0.63
2 74 3.59 0.96 Administrative costs increased 1 101 1.70 1.05
2 74 3.79 0.88
To check whether there were significant differences, in terms of security budget and attacks
borne, among these four clusters, a MANOVA was performed. This test didn’t reveal any
significant effect of performance losses perceptions on the security budget and number of
security incidents (p>0.05) (Table 64). The subsequent separate univariate ANOVAs confirmed
the results of the MANOVA. Hence, the perception of performance worsening doesn’t seem to
influence the investments in security or the number of security incidents. Consequently, this
hypothesis is rejected (Table 67).
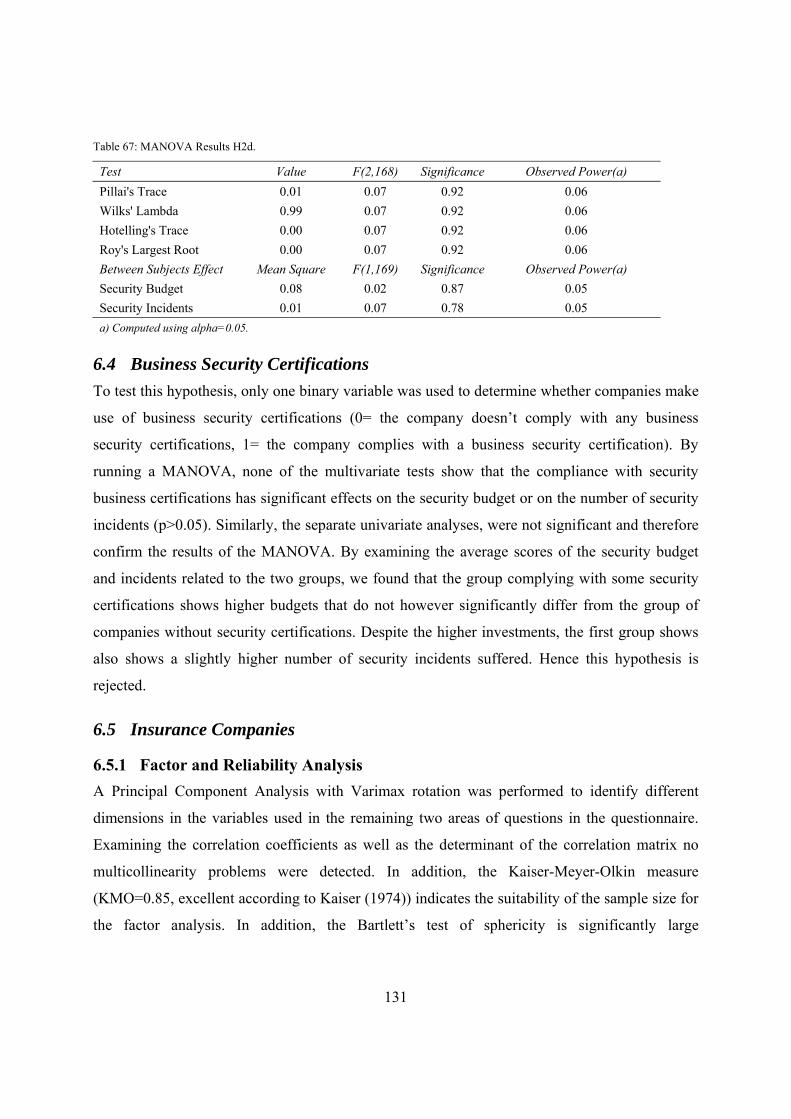
131
Table 67: MANOVA Results H2d.
Test Value F(2,168) Significance Observed Power(a) Pillai's Trace 0.01 0.07 0.92 0.06 Wilks' Lambda 0.99 0.07 0.92 0.06 Hotelling's Trace 0.00 0.07 0.92 0.06 Roy's Largest Root 0.00 0.07 0.92 0.06 Between Subjects Effect Mean Square F(1,169) Significance Observed Power(a) Security Budget 0.08 0.02 0.87 0.05 Security Incidents 0.01 0.07 0.78 0.05 a) Computed using alpha=0.05.
6.4 Business Security Certifications To test this hypothesis, only one binary variable was used to determine whether companies make
use of business security certifications (0= the company doesn’t comply with any business
security certifications, 1= the company complies with a business security certification). By
running a MANOVA, none of the multivariate tests show that the compliance with security
business certifications has significant effects on the security budget or on the number of security
incidents (p>0.05). Similarly, the separate univariate analyses, were not significant and therefore
confirm the results of the MANOVA. By examining the average scores of the security budget
and incidents related to the two groups, we found that the group complying with some security
certifications shows higher budgets that do not however significantly differ from the group of
companies without security certifications. Despite the higher investments, the first group shows
also shows a slightly higher number of security incidents suffered. Hence this hypothesis is
rejected.
6.5 Insurance Companies
6.5.1 Factor and Reliability Analysis A Principal Component Analysis with Varimax rotation was performed to identify different
dimensions in the variables used in the remaining two areas of questions in the questionnaire.
Examining the correlation coefficients as well as the determinant of the correlation matrix no
multicollinearity problems were detected. In addition, the Kaiser-Meyer-Olkin measure
(KMO=0.85, excellent according to Kaiser (1974)) indicates the suitability of the sample size for
the factor analysis. In addition, the Bartlett’s test of sphericity is significantly large
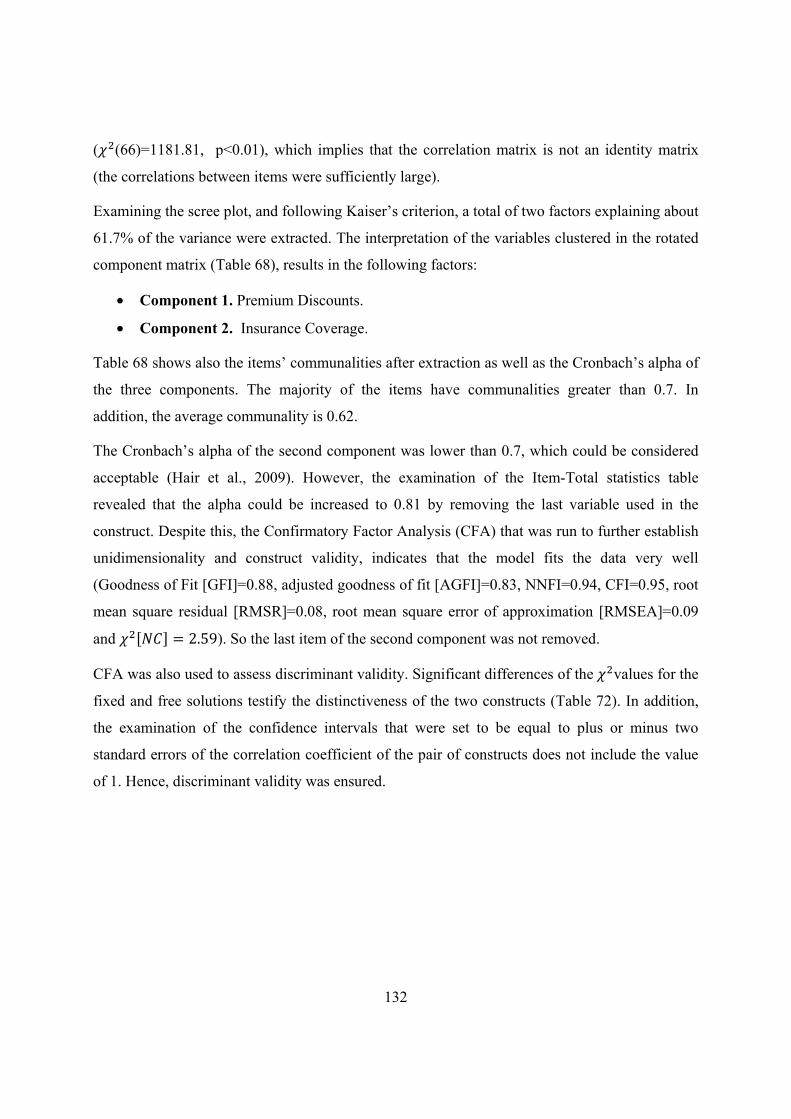
132
( (66)=1181.81, p<0.01), which implies that the correlation matrix is not an identity matrix
(the correlations between items were sufficiently large).
Examining the scree plot, and following Kaiser’s criterion, a total of two factors explaining about
61.7% of the variance were extracted. The interpretation of the variables clustered in the rotated
component matrix (Table 68), results in the following factors:
• Component 1. Premium Discounts.
• Component 2. Insurance Coverage.
Table 68 shows also the items’ communalities after extraction as well as the Cronbach’s alpha of
the three components. The majority of the items have communalities greater than 0.7. In
addition, the average communality is 0.62.
The Cronbach’s alpha of the second component was lower than 0.7, which could be considered
acceptable (Hair et al., 2009). However, the examination of the Item-Total statistics table
revealed that the alpha could be increased to 0.81 by removing the last variable used in the
construct. Despite this, the Confirmatory Factor Analysis (CFA) that was run to further establish
unidimensionality and construct validity, indicates that the model fits the data very well
(Goodness of Fit [GFI]=0.88, adjusted goodness of fit [AGFI]=0.83, NNFI=0.94, CFI=0.95, root
mean square residual [RMSR]=0.08, root mean square error of approximation [RMSEA]=0.09
and = 2.59). So the last item of the second component was not removed.
CFA was also used to assess discriminant validity. Significant differences of the values for the
fixed and free solutions testify the distinctiveness of the two constructs (Table 72). In addition,
the examination of the confidence intervals that were set to be equal to plus or minus two
standard errors of the correlation coefficient of the pair of constructs does not include the value
of 1. Hence, discriminant validity was ensured.

133
Table 68: Summary of exploratory Factor Analysis for insurance companies actor (N=175).
Component Measurement Model 1 2 Communality Std. Coefficient t-Value
Premium discounts agreements are never a loss of time 0.88 -0.14 0.80 0.69 9.09 Application of security routines gives premium discounts 0.86 -0.11 0.76 0.74 10.02 Premium discounts always offered if working actively with security 0.85 -0.18 0.77 0.63 7.37 Installation of security technologies gives premium discounts 0.83 -0.17 0.72 0.79 9.62 Easiness to agree on premium discounts 0.83 -0.16 0.72 0.96 11.7 Our organization gets premium discounts 0.80 -0.19 0.69 0.65 3.19 Insurances cover all economic losses -0.24 0.80 0.70 0.89 11.91 Comprehensive usage of insurance -0.23 0.74 0.60 0.91 12.84 Insurances cover security losses -0.15 0.73 0.55 1.07 14.29 Insurances cover direct and indirect security losses -0.24 0.70 0.55 0.94 12.76 Usage of captive insurances -0.13 0.65 0.42 1.01 13.47 Security incidents are always fully covered by insurances 0.05 0.39 0.15 0.97 13.8 Eigen Values 4.47 2.93 % of Variance 37.31 24.42 Alpha 0.92 0.68 CR 0.92 0.68 AVE 0.93 0.67 Extraction Method: Principal Component Analysis. Rotation Method: Varimax with Kaiser Normalization. Model Fit Indices: normed = 2.59, Goodness of Fit Index = 0.88<(0.90), adjusted goodness of fit = 0.83 (>0.80), non-normed fit index = 0.94 (≥ 0.90), root mean square residual = 0.08 (≤ 0.10), root mean square error of approximation = 0.09 (≤ 0.10). All t-values are significant at p < 0.05 level.
Table 69: Assessment of Discriminant Validity.
Component 1 Component 2
Component 1 -
Component 2 279.3 (-0.62)-(-0.35) -
First Row: differences between the fixed and free solution (significant at p<0.01 [1 df]). Second Row: confidence interval (only one of them include 1.00)

134
6.5.2 H4a – Insurance Coverage A hierarchical cluster analysis was run to diversify respondents in terms of the factor concerning
the exclusive usage of insurance to cover economic losses generated by security incidents. The
output of the analysis identifies two clusters, with a cut off level of 12. Cluster membership of
the data was assigned with the iterative K-means cluster approach and cross-validation verified
the reliability of the results.
The clusters are significantly distinguished by only one discriminant function, Λ = 0.37, (1) = 169.18, < 0.001 . Classification results show that overall 97.1% of the
cross-validated grouped cases were correctly classified. More specifically, 92.8% of the cluster 1
cases and 99.3% of cluster 2 were correctly classified. The scores of the functions at group
centroids reveal that the first cluster is made of transportation companies that don’t believe that
insurances premiums and excesses are the optimal way to cover security losses (instead of
security solutions). On the contrary, the second cluster believes that insurances may in general be
used to cover losses related to security incidents. This may also be depicted in Table 70 where
the scores of the first group are between 1, Strongly Disagree and 3, Neither Agree nor Disagree.
The scores of the second group are instead between 3, Neither Agree nor Disagree and 4, Agree.
Table 70: Summary of factor variables scores for the two groups.
Group N Mean Std. Deviation
Insurances cover security losses 1 69 2.54 0.90 2 106 3.75 0.84
Comprehensive usage of insurance 1 69 2.29 0.77 2 106 3.58 0.86
Usage of captive insurances 1 69 1.93 0.85 2 106 3.15 1.04
Insurances cover direct and indirect security losses 1 69 2.49 1.16 2 106 3.84 0.74
Insurances cover all economic losses 1 69 2.07 0.77 2 106 3.74 0.95
Security incidents are always fully covered by insurances 1 69 1.91 0.82 2 106 3.39 3.01
To check whether there were significant differences, in terms of security budget and attacks
borne, between these two clusters, a MANOVA was performed. None of the multivariate tests
was significant, indicating no significant effects of the usage of insurances on security budget

135
and security incidents (p>0.05). Separate univariate ANOVAs were also not significant. Hence,
the hypothesis is rejected (Table 71).
Table 71: MANOVA Results H4a.
Test Value F (2,168) Sig. Observed Power(a) Pillai's Trace 0.03 2.60 0.07 0.51 Wilks' Lambda 0.97 2.60 0.07 0.51 Hotelling's Trace 0.31 2.60 0.07 0.51 Roy's Largest Root 0.31 2.60 0.07 0.51 Between Subjects Effect Mean Square F(1,169) Significance Observed Power(a) Security Budget 141210389.5 1.51 0.22 0.23 Security Incidents 198.57 3.71 0.05 0.48 a) Computed using alpha=0.05.
6.5.3 H4b – Premium Discounts The cluster analysis was run to diversify respondents in terms of the factor concerning premium
discounts agreements between transportation and insurance companies. The output of the
analysis identifies two clusters with a cut off level of 22. Cluster membership of the data was
assigned with the iterative K-means cluster approach and cross-validation verified the reliability
of the results. A discriminant analysis was run to enhance the profile description of these two
clusters in terms of the premium discounts factor. Only one discriminant function significantly
distinguishes the two groups, Λ = 0.31, (1) = 201.95, < 0.01. Classification results show
that overall 99.4% of the cross-validated grouped cases were correctly classified. More
specifically, 97.6% of the cluster 1 cases and 100% of cluster 2 were correctly classified. The
scores of the functions at group centroids reveal that the second cluster is made of transportation
companies that easily obtain premium discounts when enhancing security. On the contrary, the
first cluster experiences their business relation with insurance companies as an unprofitable
activity that is not leading to premium discounts. According to Table 72 the second group scores
higher on the variables used in the premium discount factor. All the variables are above 3,
Neither Agree nor Disagree. On the contrary, the first group that has a tendency to not benefit
from premium discounts has scores between 2, Disagree and 3, Neither Agree nor Disagree.
Finally, it is also possible to notice that first group is smaller than the second.

136
Table 72: Summary of factor’s variables for the two clusters.
Group N Mean Std. Deviation
Our organization gets premium discounts 1 84 1.97 0.91 2 91 3.50 0.80
Easiness to agree on premium discounts 1 84 1.73 0.65 2 91 3.26 0.94
Premium discounts agreements are never a loss of time 1 84 1.86 0.85 2 91 3.62 0.87
Installation of security technologies gives premium discounts 1 84 2.02 0.85 2 91 3.68 0.79
Application of security routines gives premium discounts 1 84 1.94 0.87 2 91 3.73 0.73
Premium discounts always offered if working actively with security 1 84 1.93 0.82 2 91 3.56 0.76
To check whether there were significant differences, in terms of security budget and attacks
borne, between these two clusters, a MANOVA was performed. According to the Pillai’s trace,
the groups’ means significantly differ, V = 0.21, (2, 168) = 23.07, < 0.001 (Box’s M test
not significant, p>0.05).
Table 73: MANOVA Results H4b.
Test Value F (2,168) Significance Observed Power(a) Pillai's Trace 0.21 23.07 0.00 0.99 Wilks' Lambda 0.78 23.07 0.00 0.99 Hotelling's Trace 0.27 23.07 0.00 0.99 Roy's Largest Root 0.27 23.07 0.00 0.99 Between Subjects Effect Mean Square F(1,169) Significance Observed Power(a) Security Budget 119.33 45.36 0.00 0.99 Security Incidents 1.81 10.24 0.00 0.88 a) Computed using alpha=0.05.
Hence, the factor differentiating respondents in terms of premium discounts agreements has a
significant effect on the security budget and number of security incidents experienced by
transportation companies. Separate univariate ANOVAs on the outcome variables revealed that
the premium discount factor has significant effects both on the security budget, (1, 169) =119.33, < 0.001 and on the security incidents, (1, 169) = 10.24, < 0.001 . The
MANOVA was followed up with a discriminant analysis, which revealed one discriminant
function, Λ = 0.89, (2) = 19.14, < 0.001 . This function correlates positively with the
security budget (r=0.88) and negatively with the number of security incidents (r=-0.43). Hence,
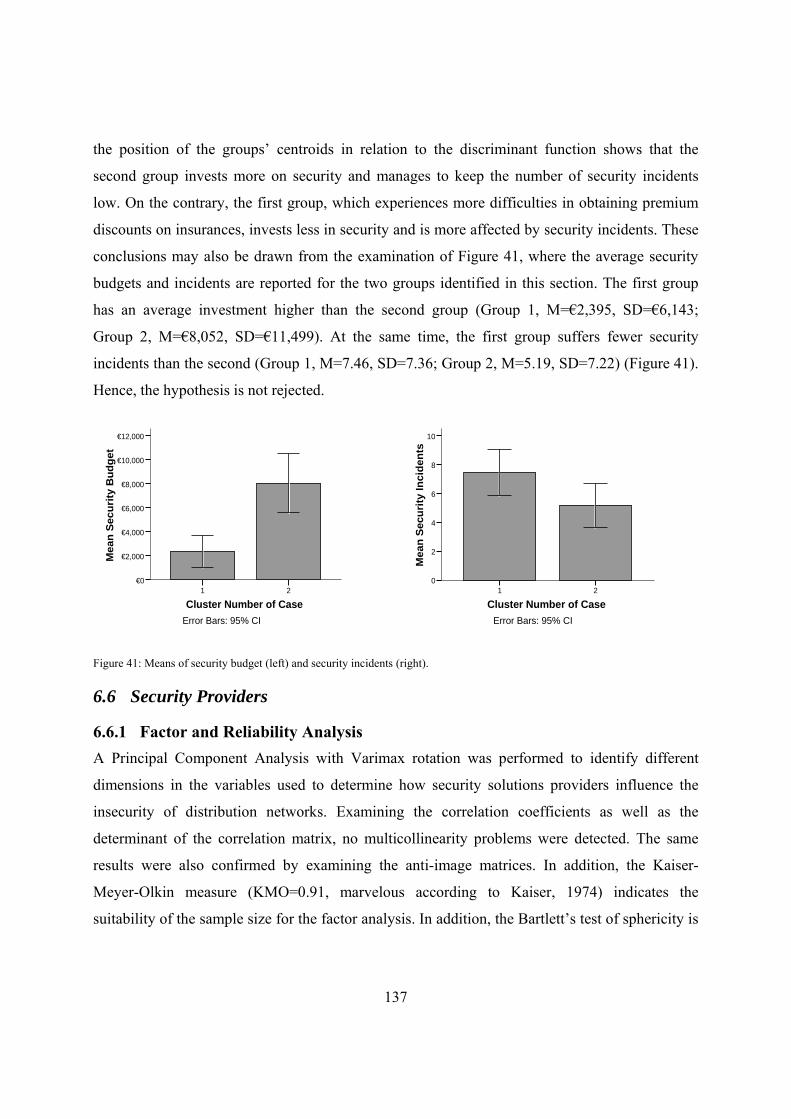
137
the position of the groups’ centroids in relation to the discriminant function shows that the
second group invests more on security and manages to keep the number of security incidents
low. On the contrary, the first group, which experiences more difficulties in obtaining premium
discounts on insurances, invests less in security and is more affected by security incidents. These
conclusions may also be drawn from the examination of Figure 41, where the average security
budgets and incidents are reported for the two groups identified in this section. The first group
has an average investment higher than the second group (Group 1, M=€2,395, SD=€6,143;
Group 2, M=€8,052, SD=€11,499). At the same time, the first group suffers fewer security
incidents than the second (Group 1, M=7.46, SD=7.36; Group 2, M=5.19, SD=7.22) (Figure 41).
Hence, the hypothesis is not rejected.
Figure 41: Means of security budget (left) and security incidents (right).
6.6 Security Providers
6.6.1 Factor and Reliability Analysis A Principal Component Analysis with Varimax rotation was performed to identify different
dimensions in the variables used to determine how security solutions providers influence the
insecurity of distribution networks. Examining the correlation coefficients as well as the
determinant of the correlation matrix, no multicollinearity problems were detected. The same
results were also confirmed by examining the anti-image matrices. In addition, the Kaiser-
Meyer-Olkin measure (KMO=0.91, marvelous according to Kaiser, 1974) indicates the
suitability of the sample size for the factor analysis. In addition, the Bartlett’s test of sphericity is
Cluster Number of Case21
Mea
n Se
curi
ty B
udge
t
€12,000
€10,000
€8,000
€6,000
€4,000
€2,000
€0
Error Bars: 95% CICluster Number of Case
21
Mea
n Se
curit
y In
cide
nts
10
8
6
4
2
0
Error Bars: 95% CI

138
significantly large ( (45)=1122.24, p<0.01) which implies that the correlation matrix is not an
identity matrix (the correlations between items were sufficiently large).
Examining the scree plot, and following Kaiser’s criterion, a total of three factors explaining
70.73% of the variance were extracted. The interpretation of the variables clustered in the rotated
component matrix (Table 74), results in the following factors:
• Component 1. Uncertainty of Security Prototypes.
• Component 2. Security Expensiveness.
Table 74 shows the items’ communalities after extraction as well as the Cronbach’s alpha of the
three components. Of the 10 items used in the factor analysis, 6 had communalities equal or
greater than 0.7. The remaining 4 items were below 0.7 but not lower than 0.64. In addition, the
average communality is 0.71, which confirms the correct adoption of the Kaiser’s criterion. The
Cronbach’s alphas of the three factors were all around 0.9, which verifies the high reliability of
the scales identified with the factor analysis.
A Confirmatory Factor Analysis (CFA) was run to further establish unidimensionality and
construct validity. The fit indices indicate that the model fits the data very well (Goodness of Fit
[GFI]=0.93, adjusted goodness of fit [AGFI]=0.88, NNFI=0.98, CFI=0.98, root mean square
residual [RMSR]=0.03, root mean square error of approximation [RMSEA]=0.07 and =1.96) (Table 74).
CFA was also used to assess discriminant validity. Significant differences of the values for the
fixed and free solutions testify to the distinctiveness of the two constructs (Table 75). In addition,
the examination of the confidence intervals that was set to be equal to plus or minus two standard
errors of the correlation coefficient of the pair of constructs, does not include the value of 1.
Hence, discriminant validity was ensured.
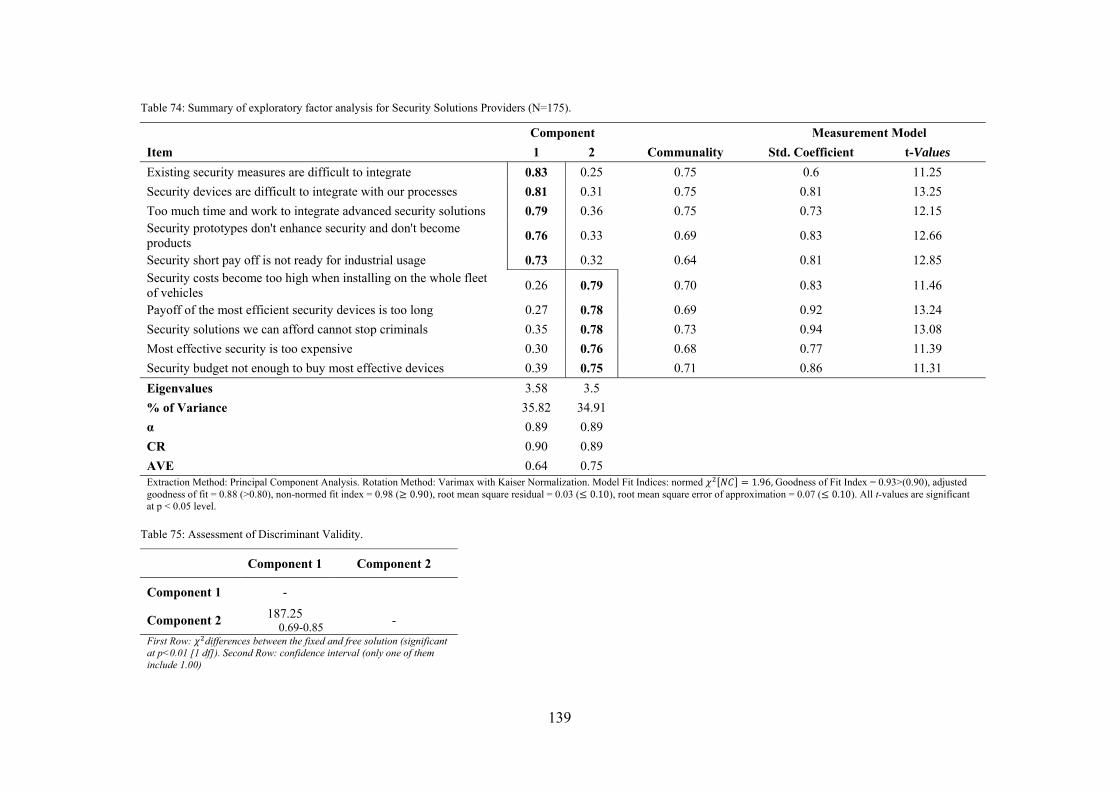
139
Table 74: Summary of exploratory factor analysis for Security Solutions Providers (N=175).
Component Measurement Model Item 1 2 Communality Std. Coefficient t-Values Existing security measures are difficult to integrate 0.83 0.25 0.75 0.6 11.25 Security devices are difficult to integrate with our processes 0.81 0.31 0.75 0.81 13.25 Too much time and work to integrate advanced security solutions 0.79 0.36 0.75 0.73 12.15 Security prototypes don't enhance security and don't become products 0.76 0.33 0.69 0.83 12.66
Security short pay off is not ready for industrial usage 0.73 0.32 0.64 0.81 12.85 Security costs become too high when installing on the whole fleet of vehicles 0.26 0.79 0.70 0.83 11.46
Payoff of the most efficient security devices is too long 0.27 0.78 0.69 0.92 13.24 Security solutions we can afford cannot stop criminals 0.35 0.78 0.73 0.94 13.08 Most effective security is too expensive 0.30 0.76 0.68 0.77 11.39 Security budget not enough to buy most effective devices 0.39 0.75 0.71 0.86 11.31 Eigenvalues 3.58 3.5 % of Variance 35.82 34.91 α 0.89 0.89 CR 0.90 0.89 AVE 0.64 0.75 Extraction Method: Principal Component Analysis. Rotation Method: Varimax with Kaiser Normalization. Model Fit Indices: normed = 1.96, Goodness of Fit Index = 0.93>(0.90), adjusted goodness of fit = 0.88 (>0.80), non-normed fit index = 0.98 (≥ 0.90), root mean square residual = 0.03 (≤ 0.10), root mean square error of approximation = 0.07 (≤ 0.10). All t-values are significant at p < 0.05 level.
Table 75: Assessment of Discriminant Validity.
Component 1 Component 2
Component 1 -
Component 2 187.25 0.69-0.85 -
First Row: differences between the fixed and free solution (significant at p<0.01 [1 df]). Second Row: confidence interval (only one of them include 1.00)

140
6.6.2 H5a. Uncertainty of Security Prototypes The initial hierarchical cluster analysis was run to diversify respondents in terms of their
perception about the impact of security prototypes on security as well as the problems
experienced concerning the integration of the systems within the organization. The output of the
analysis identifies two clusters with a cut off level of 10. The membership of the data with the
two clusters was assigned with the iterative K-means cluster approach. In addition, the reliability
of the cluster analysis was verified by means of cross-validation. The clusters are significantly
distinguished by one discriminant function, Λ = 0.46, (5) = 133.30, < 0.001 .
Classification results show that overall 98.3% of the cross-validated grouped cases were
correctly classified. 98.2% of the cases assigned to cluster 1 and 95.8% of cases to cluster 2 were
correctly classified. The scores of the functions at group centroids indicated that the first group
of companies agree with the fact that, in general, security prototypes are not effective against
transport crime and are difficult to integrate. On the contrary, the second group of companies
seems not to have experienced this issue.
Table 76: Scores of the two clusters on the variables used to measure the uncertainty of security prototypes.
Group N Mean Std. Deviation
Security short pay off is not ready for industrial usage 1 103 3.54 0.72 2 72 2.77 0.70
Too much time and work to integrate advanced security solutions
1 103 3.77 0.79 2 72 2.75 0.89
Security prototypes don't enhance security and don't become products
1 103 3.65 0.83 2 72 2.65 0.73
Existing security measures are difficult to integrate 1 103 3.67 0.78 2 72 2.33 0.77
Security devices are difficult to integrate with our processes 1 103 3.71 0.86 2 72 2.49 0.68
In Table 76, the means and standard deviations of the variables used for the first factor are
reported for each of the two groups. The first cluster is more pessimistic and has a pronounced
tendency to agree with the statements in the questionnaire (all the means are between 3, Neither
Agree nor Disagree, and 4, Agree).The second group of respondents has a moderate tendency to
disagree with the fact that security is not effective on crime and it may not likely be integrated in
their organization (means are between 2, Disagree and 3, Neither Agree nor Disagree).

141
To check whether there were significant differences between the clusters, in terms of security
budget and attacks borne, a MANOVA was performed. All of the multivariate tests available in
SPSS show that there is a significant difference between the groups (Table 77). In particular,
according to Pillai’s trace, the groups’ means significantly differ, V = 0.11, (2, 168) =10.23, < 0.001 . By running separate univariate ANOVAs, it was found that the groups
significantly differ only in terms of amount of security budget (p<0.01), but not in terms of
security incidents (Table 77). A discriminant analysis identified two discriminant functions that
significantly differentiated the two groups of companies, Λ = 0.92, (2) = 16.60, < 0.001.
The discriminant function strongly correlates in a positive manner with the security budget
variable ( = 0.95) and negatively with the variable measuring the security incidents ( =−0.22). Examining the position of the groups’ centroids in relation to the discriminant functions
makes it possible to draw the conclusion that the first group of companies invests less in security
and is more affected by security incidents.
Table 77: MANOVA results H5a.
Test Value F(2 ,168) Significance Observed Power (a) Pillai's Trace 0.11 10.29 0.00 0.98 Wilks' Lambda 0.89 10.29 0.00 0.98 Hotelling's Trace 0.12 10.29 0.00 0.98 Roy's Largest Root 0.12 10.29 0.00 0.98 Between Subjects effect Mean square F(1, 169) Significance Observed Power (a) Security Budget 57.07 19.03 0.00 0.99 Security Incidents 0.06 0.32 0.56 0.08 a) Computed using alpha=0.05.
Figure 42 illustrates the mean security budget (left diagram) and number of incidents (right
diagram) of the two clusters identified. Hence, the interpretation of the diagrams enhances the
results of the analysis by clearly depicting that the first group of companies invests less
(M=€3,036, SD=€7,416) than the second (M=€8,500, SD=€11,508). The same figure also shows
that the first group is slightly more affected by security incidents; however differences between
the groups are not significant (Group 1: M=6.83, SD=6.33; Group 2: M=6.26, SD=8.12). Despite
this, in view of the MANOVA results, the hypothesis is considered to be tenable.
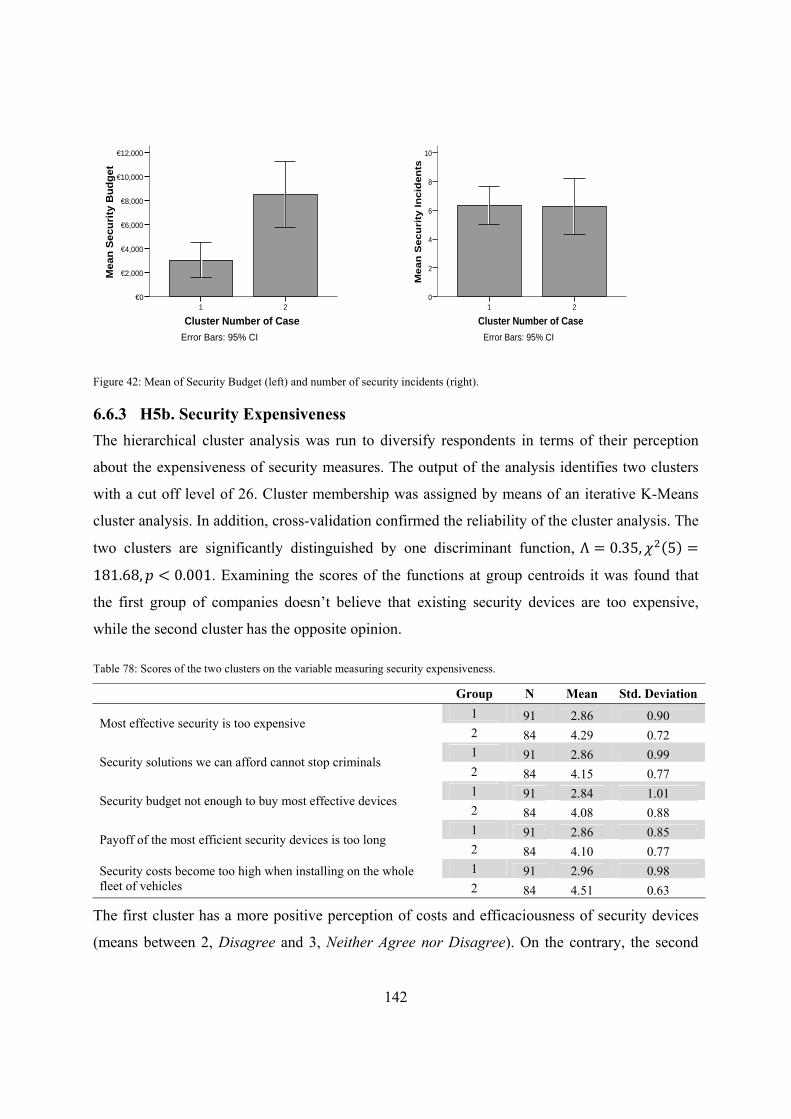
142
Figure 42: Mean of Security Budget (left) and number of security incidents (right).
6.6.3 H5b. Security Expensiveness The hierarchical cluster analysis was run to diversify respondents in terms of their perception
about the expensiveness of security measures. The output of the analysis identifies two clusters
with a cut off level of 26. Cluster membership was assigned by means of an iterative K-Means
cluster analysis. In addition, cross-validation confirmed the reliability of the cluster analysis. The
two clusters are significantly distinguished by one discriminant function, Λ = 0.35, (5) =181.68, < 0.001. Examining the scores of the functions at group centroids it was found that
the first group of companies doesn’t believe that existing security devices are too expensive,
while the second cluster has the opposite opinion.
Table 78: Scores of the two clusters on the variable measuring security expensiveness.
Group N Mean Std. Deviation
Most effective security is too expensive 1 91 2.86 0.90 2 84 4.29 0.72
Security solutions we can afford cannot stop criminals 1 91 2.86 0.99 2 84 4.15 0.77
Security budget not enough to buy most effective devices 1 91 2.84 1.01 2 84 4.08 0.88
Payoff of the most efficient security devices is too long 1 91 2.86 0.85 2 84 4.10 0.77
Security costs become too high when installing on the whole fleet of vehicles
1 91 2.96 0.98 2 84 4.51 0.63
The first cluster has a more positive perception of costs and efficaciousness of security devices
(means between 2, Disagree and 3, Neither Agree nor Disagree). On the contrary, the second
Cluster Number of Case21
Mea
n S
ecur
ity B
udge
t
€12,000
€10,000
€8,000
€6,000
€4,000
€2,000
€0
Error Bars: 95% CICluster Number of Case
21
Mea
n S
ecu
rity
Inci
den
ts
10
8
6
4
2
0
Error Bars: 95% CI

143
cluster is strongly convinced that existing security solutions are too expensive and not effective
against cargo crime (means are between 4, Agree and 5, Strongly Agree).
A MANOVA was run to determine whether there were significant differences between the
clusters, in terms of security budget and attacks suffered. Despite the differences of the groups’
means shown in Table 78, none of the multivariate tests showed significant differences between
the groups (p>0.05). In addition, the separate univariate ANOVAs were non-significant both in
terms of the security budget and of the number of security incidents, p>0.05.
Table 79: MANOVA results H5b.
Test Value F(2 ,168) Significance Observed Power (a) Pillai's Trace 0.02 1.75 0.17 0.36 Wilks' Lambda 0.98 1.75 0.17 0.36 Hotelling's Trace 0.21 1.75 0.17 0.36 Roy's Largest Root 0.21 1.75 0.17 0.36 Between Subjects effect Mean square F(1, 169) Significance Observed Power (a) Security Budget 268604123.6 2.90 0.09 0.39 Security Incidents 34.169 0.62 0.42 0.12 a) Computed using alpha=0.05.
6.7 Criminals
6.7.1 Factor and Reliability Analysis A Principal Component Analysis with Varimax rotation was performed to identify different
dimensions in the variables used to determine how the opportunistic behaviors of criminals may
influence the insecurity of transport networks. Examining the anti-image matrices, as well as the
correlation coefficients and the determinant of the correlation matrix no multicollinearity
problems were detected. The Kaiser-Meyer-Olkin measure (KMO=0.89, meritorious according
to Kaiser, 1974) indicates the suitability of the sample size for the factor analysis. In addition, the
Bartlett’s test of sphericity is significantly large ( (10)=505.12, p<0.01). Hence, the
correlations between items were sufficiently large indicating that the correlation matrix is not an
identity matrix. The scree plot, in accordance with the Kaiser’s criterion, revealed that only one
factor explaining about 71.6% of the variance could be extracted. This factor may be interpreted
as the perception of the companies about the opportunistic behavior of criminals. In other words
this factor explains the inefficacy of security against the skills of criminals who may quickly
learn and deceive devices as well as take advantage of insiders to penetrate a target and
144
perpetrate their attacks. The majority of the items had communality greater than 0.7 (Table 80).
In addition, the average communality is 0.71, which confirms the correct adoption of the
Kaiser’s criterion. The Cronbach’s alpha of the factor was 0.9, which indicated the high
reliability of the scale identified with the factor analysis (Table 80).
A Confirmatory Factor Analysis (CFA) was run to further establish unidimensionality and
construct validity. The fit indices indicate that the model fits the data optimally (Goodness of Fit
[GFI]=0.99, adjusted goodness of fit [AGFI]=0.98, NNFI=1.01, CFI=1, root mean square
residual [RMSR]=0.01, root mean square error of approximation [RMSEA]=0.00 and =0.44) (Table 80).
6.7.2 H6. Perception of Opportunistic Behavior A hierarchical cluster analysis was run to diversify respondents in terms of the perception about
the inefficiency of security against criminals’ skills in deceiving the security solutions (both
devices and routines). The output of the analysis identified two clusters with a cut off level of 16.
By means of the iterative K-means cluster analysis, group membership was assigned to the data.
In addition, cross-validation techniques ensured the reliability of the results. One discriminant
function, Λ = 0.35, (1) = 180.57, < 0.001. 97.3% of the cases belonging to cluster 1 and
94.5% of cases in cluster 2 were correctly classified by the discriminant function. Examining the
scores of the functions at group centroids it was found that the first group of companies,
contrarily to the second, doesn’t perceive the opportunistic behavior of criminals as an
unsolvable issue. The same conclusions may be achieved by examining the groups’ scores of the
variables used in the factor (Table 81).

145
Table 80: Summary of exploratory factor analysis for Criminals.
Component 1 Communality Measurement Model
Std. Coefficient t-Values Security protection doesn't stop criminals 0.89 0.78 0.87 13.95 No technologies or routines may efficiently stop cargo crime 0.87 0.75 0.84 11.89 Skilled criminal groups make security useless 0.84 0.71 0.88 12.2 Security solution is easily deceived by criminals 0.83 0.69 0.81 11.01 Use of insiders makes security useless 0.80 0.64 0.89 13.14 Eigenvalues 3.58 % of Variance 71.6 α 0.9 CR 0.89 AVE 0.73 Extraction Method: Principal Component Analysis. Rotation Method: Varimax with Kaiser Normalization. Model Fit Indices: normed = 0.44, Goodness of Fit Index = 0.99>(0.90), adjusted goodness of fit = 0.98 (>0.80), non-normed fit index = 1.01 (≥ 0.90), root mean square residual = 0.01 (≤ 0.10), root mean square error of approximation = 0.00 (≤ 0.10). All t-values are significant at p < 0.05 level.

146
Table 81: Scores of the two clusters on the variables measuring criminals’ behaviors.
Group N Mean Std. Deviation
Security Protection doesn't stop criminals 1 76 2.92 0.88 2 96 4.35 0.56
Security solution is easily deceived by criminals 1 74 2.69 0.81 2 96 4.23 0.75
Skilled criminal groups make security useless 1 74 2.73 0.93 2 93 4.25 0.78
Use of insiders makes security useless 1 76 2.70 0.94 2 91 4.18 0.77
No technologies or routines may efficiently stop cargo crime 1 73 2.64 0.82 2 93 4.27 0.68
A MANOVA was run to determine whether there were significant differences between these two
clusters, in terms of security budget and attacks borne (Table 82). According to Pillai’s trace, the
groups’ means significantly differ, V = 0.10, (2, 168) = 9.85, < 0.001 (Box’s M test not
significant, p>0.05). The separate univariate ANOVAs confirm that the factor differentiating the
two groups has a significant effect on the magnitude of investments made by the companies
(p<0.001) but not on the number of incidents experienced (p>0.05). The following discriminant
analysis unveiled one discriminant function that significantly differentiated the three groups of
companies, Λ = 0.91, (2) = 14.56, < 0.001.
Table 82: MANOVA results H6.
Test Value F(2,168) Significance Observed Power (a) Pillai's Trace 0.10 9.85 0.00 0.98 Wilks' Lambda 0.89 9.85 0.00 0.98 Hotelling's Trace 0.11 9.85 0.00 0.98 Roy's Largest Root 0.11 9.85 0.00 0.98 Between Subjects Effect Mean square F(1,169) Significance Observed Power (a) Security Budget 58.97 19.73 0.00 0.99 Security Incidents 0.38 2.07 0.15 0.30 a) Computed using alpha=0.05.
The discriminant function moderately correlates in a negative manner with the security incidents
variable ( = −0.27) and strongly correlates in a positive manner with the variable measuring
the security budget ( = 0.96). Hence, according to the position of the groups’ centroids in
relation to the discriminant functions it is possible to state that: the first cluster invests more in

147
security and is less affected by security incidents. The second cluster invests slightly less in
security and is more affected by security incidents.
Figure 43: Mean of security budget (left) and amount of security incidents (right).
In Figure 43, the mean of security budget and number of security incidents are put in relation to
the two clusters identified in this analysis. The first cluster of companies has greater investments
in security (M=€8,261, SD=€11,347) than the second (M= €2,882, SD=€7,288) and
consequently, it is less affected by security incidents (Cluster 1: M=5.60, SD=7.57; Cluster 2: M
= 6.87, SD = 7.17) (Figure 43).Hence, given these assumptions the hypothesis is not rejected.
6.8 Contract Regulatory Associations
6.8.1 Factor and Reliability Analysis A Principal Component Analysis with Varimax rotation was performed on the variables used to
measure how contract legislation complexity may influence the insecurity of distribution
networks. The absence of multicollinearity was verified by examining the determinant of the
correlation matrix as well as the anti-image matrices. To check the suitability of the sample size
the Kaiser-Meyer-Olkin was used, KMO=0.89, corresponding to meritorious (Kaiser, 1974).
Also the Bartlett’s test of sphericity confirmed that the correlation matrix was not an identity
matrix, (190)=3107.07, p<0.001.
A total of four factors explaining the 73.31% of the variance were extracted by following
Kaiser’s criterion. The interpretation of the variables clustered in the rotated component matrix
(Table 83), results in the following factors:
1. Component 1. Security Requirements Agreements.
Cluster Number of Case21
Mea
n Se
curi
ty B
udge
t
€12,000
€10,000
€8,000
€6,000
€4,000
€2,000
€0
Error Bars: 95% CICluster Number of Case
21
Mea
n S
ecur
ity In
cide
nts
10
8
6
4
2
0
Error Bars: 95% CI

148
2. Component 2. Contract Complexity.
3. Component 3. Risk Sharing.
4. Component 4. Security Requirements Specification.
All the items except three have communality greater than 0.7 (Table 83). In addition, the average
communality is 0.73, which confirms the correct adoption of Kaiser’s criterion. The Cronbach’s
alphas of the four factors were close to 0.9, which confirms the high reliability of the scales
identified with the factor analysis (Table 83).
An initial Confirmatory Factor Analysis (CFA) showed that the model was not fitting the data
well. Hence, by examining the modification indices it was decided to remove five items (). The
final CFA shows that the model fits the data sufficiently well (Goodness of Fit [GFI]=0.86,
adjusted goodness of fit [AGFI]=0.80, NNFI=0.96, CFI=0.97, root mean square residual
[RMSR]=0.08, root mean square error of approximation [RMSEA]=0.09 and = 2.45)
(Table 83).
CFA was also used to assess discriminant validity. Significant differences of the values for the
fixed and free solutions testify to the distinctiveness of the two constructs (Table 84). In addition,
the examination of the confidence interval that was set to be equal to plus or minus two standard
errors of the correlation coefficient of the pair of constructs, does not include the value of 1.
Hence, discriminant validity was ensured.

149
Table 83: Summary of Exploratory Factor Analysis for Contract Regulatory Associations.
Component Measurement Model
1 2 3 4 Communality Std. Coefficient t-Values Our organization and our customers have always had different opinions about security requirements in contracts 0.83 0.26 -0.13 -0.05 0.77 0.94 13.18
It has been difficult to agree on what security requirements to choose 0.81 0.29 -0.21 -0.12 0.76 1.06 15.31
Contract agreement about security requirements takes too much time and resources 0.81 0.23 -0.18 -0.13 0.80 0.95 13.93
It is difficult to determine the effect of security and thereafter agree in contracts 0.80 0.22 -0.05 -0.14 0.71 0.79 10.81
We avoid specifying security requirements since it is too complex 0.77 0.24 -0.28 -0.17 0.76 -- --
Contracts agreements demand too much time and resource 0.16 0.82 -0.19 -0.12 0.75 0.85 12.33
Prefer Verbal Agreements (due to contract complexity) 0.18 0.80 -0.34 0.00 0.79 1 13.66
Don't understand the importance of written agreements 0.32 0.79 -0.15 -0.15 0.78 0.97 12.49
Don't know how to use contracts in case of security incidents 0.37 0.78 -0.10 -0.09 0.77 0.96 --
Contracts with customers are too complex 0.35 0.72 -0.24 0.00 0.70 -- 12.41
Contract clarity about risk sharing standards -0.13 -0.23 0.87 0.12 0.85 0.63 7.49
Avoidance of unclear contracts with no risk sharing -0.15 -0.21 0.86 0.04 0.81 0.94 13.62
Importance pf sharing liabilities -0.17 -0.16 0.86 0.13 0.81 1.09 16.05
It is important to specify security requirements in contracts -0.09 -0.22 0.59 0.52 0.69 1.01 14.04
Usage of NSAB2000 to share risks -0.37 -0.21 0.56 0.35 0.63 -- --
Written contracts with liabilities sharing usage -0.26 -0.18 0.48 0.37 0.47 -- --
Our customers require the specification of security in contracts -0.05 -0.04 0.04 0.87 0.75 0.8 9.16
Our organization always proposes detailed descriptions of security in contracts -0.07 -0.06 0.11 0.87 0.77 1.1 13.2
We have easily agreed with our customers on specifying security requirements in contracts -0.13 -0.05 0.11 0.83 0.72 0.67 7.53
Always specify security requirements in contracts -0.19 -0.06 0.24 0.70 0.59 -- --
Eigenvalues 3.99 3.64 3.63 3.38
% of Variance 19.9 18.2 18.2 16.9
α 0.92 0.91 0.89 0.86
CR 0.90 0.88 0.88 0.76
AVE 0.88 0.89 0.87 0.76
Extraction Method: Principal Component Analysis. Rotation Method: Varimax with Kaiser Normalization. Model Fit Indices: normed = 2.45, Goodness of Fit Index = 0.86<(0.90), adjusted goodness of fit = 0.80 (>0.80), non-normed fit index = 0.96 (≥ 0.90), root mean square residual = 0.08 (≤ 0.10), root mean square error of approximation = 0.09 (≤ 0.10). All t-values are significant at p < 0.05 level.

150
Table 84: Assessment of Discriminant Validity.
Component 1 Component 2 Component 3 Component 4
Component 1 -
Component 2 285.81 0.56-076 -
Component 3 503.56 (-0.61)-(-0.35)
373.44 (-0.67)-(-0.44) -
Component 4 159 (-0.61)-(-0.34)
199.51 (-0.60)-(-0.32)
67.63 0.59-0.79 -
First Row: differences between the fixed and free solution (significant at p<0.01 [1 df]). Second Row: confidence interval (only one of them include 1.00)
6.8.2 H7a. Security Requirements Agreements A hierarchical cluster analysis was run to split the respondents into distinct homogeneous groups
in terms of the first component concerning the perceived complexity of specifying transport
security requirements in contracts. The results of the analysis identify two main clusters with a
cut off level of 13. An iterative K-means cluster analysis was run to assign cluster membership to
the data. In addition, cross-validation was exploited to ensure the reliability of the cluster
analysis. To enhance understanding of the profiles of these two clusters a discriminant analysis
was performed. This brought to light one discriminant function, Λ = 0.41, (1) = 152.00, <0.001. Examining the scores of the functions at group centroids it was found that the first group
of companies has not experienced any difficulties in specifying and agreeing on security
requirements in transport contract agreements. On the contrary, the second group reports having
more difficulties to perform this process. The scores on the factor variables of the first group are
between 1, Strongly Disagree and 2, Disagree, while the scores of the second group are between
3, Neither Agree nor Disagree and 4, Agree (Table 85).
Table 85: Summary of factor variables scores for the two groups.
Group N Mean Std. Deviation
It has been difficult to agree on what security requirements to choose 1 44 1.66 0.64 2 124 3.40 0.93
Contract agreement about security requirements takes too much time and resources
1 44 1.82 0.76 2 124 3.51 0.98
We avoid specifying security requirements since it is too complex 1 44 1.77 0.74 2 129 3.29 0.95
It is difficult to determine the effect of security and thereafter agree in contracts
1 43 1.74 0.62 2 125 3.54 0.83
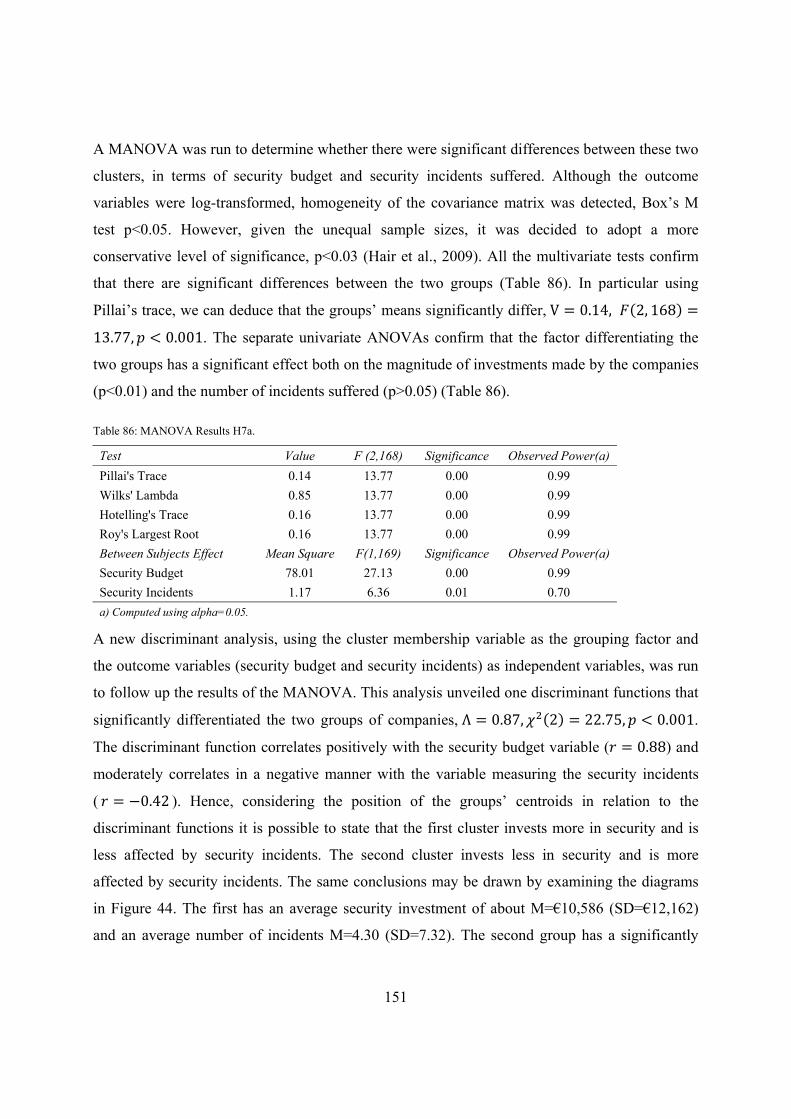
151
A MANOVA was run to determine whether there were significant differences between these two
clusters, in terms of security budget and security incidents suffered. Although the outcome
variables were log-transformed, homogeneity of the covariance matrix was detected, Box’s M
test p<0.05. However, given the unequal sample sizes, it was decided to adopt a more
conservative level of significance, p<0.03 (Hair et al., 2009). All the multivariate tests confirm
that there are significant differences between the two groups (Table 86). In particular using
Pillai’s trace, we can deduce that the groups’ means significantly differ, V = 0.14, (2, 168) =13.77, < 0.001. The separate univariate ANOVAs confirm that the factor differentiating the
two groups has a significant effect both on the magnitude of investments made by the companies
(p<0.01) and the number of incidents suffered (p>0.05) (Table 86).
Table 86: MANOVA Results H7a.
Test Value F (2,168) Significance Observed Power(a) Pillai's Trace 0.14 13.77 0.00 0.99 Wilks' Lambda 0.85 13.77 0.00 0.99 Hotelling's Trace 0.16 13.77 0.00 0.99 Roy's Largest Root 0.16 13.77 0.00 0.99 Between Subjects Effect Mean Square F(1,169) Significance Observed Power(a) Security Budget 78.01 27.13 0.00 0.99 Security Incidents 1.17 6.36 0.01 0.70 a) Computed using alpha=0.05.
A new discriminant analysis, using the cluster membership variable as the grouping factor and
the outcome variables (security budget and security incidents) as independent variables, was run
to follow up the results of the MANOVA. This analysis unveiled one discriminant functions that
significantly differentiated the two groups of companies, Λ = 0.87, (2) = 22.75, < 0.001.
The discriminant function correlates positively with the security budget variable ( = 0.88) and
moderately correlates in a negative manner with the variable measuring the security incidents
( = −0.42 ). Hence, considering the position of the groups’ centroids in relation to the
discriminant functions it is possible to state that the first cluster invests more in security and is
less affected by security incidents. The second cluster invests less in security and is more
affected by security incidents. The same conclusions may be drawn by examining the diagrams
in Figure 44. The first has an average security investment of about M=€10,586 (SD=€12,162)
and an average number of incidents M=4.30 (SD=7.32). The second group has a significantly
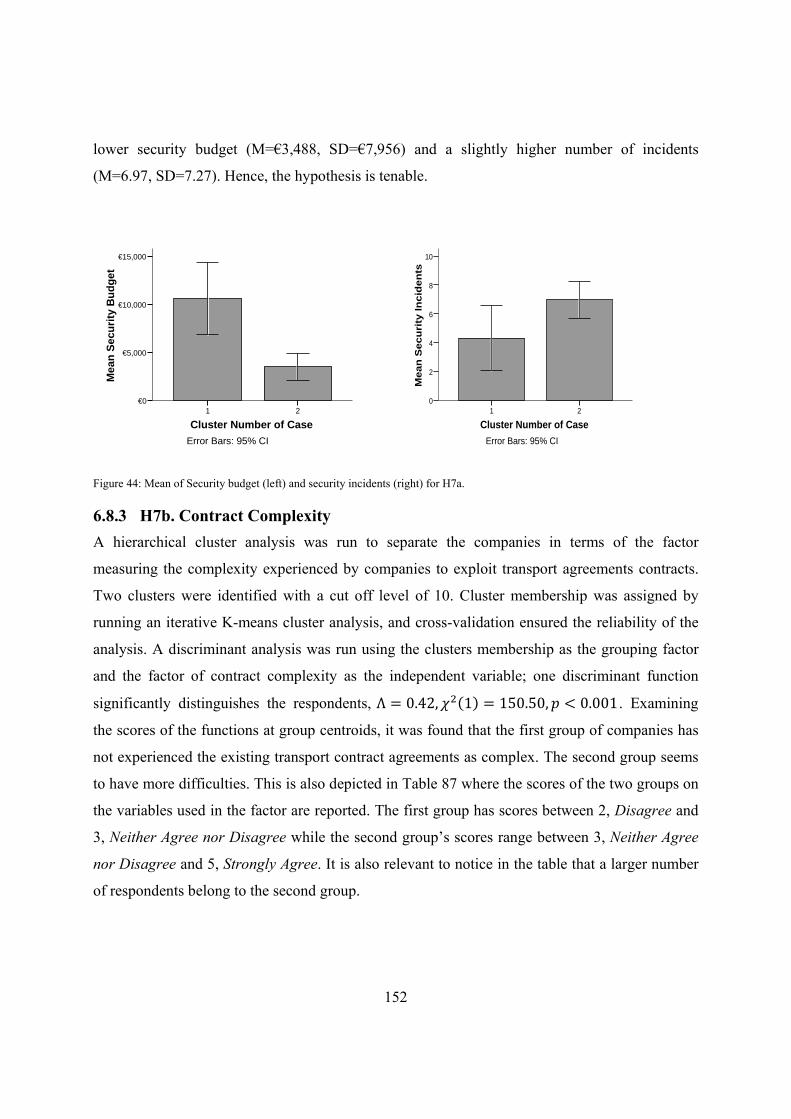
152
lower security budget (M=€3,488, SD=€7,956) and a slightly higher number of incidents
(M=6.97, SD=7.27). Hence, the hypothesis is tenable.
Figure 44: Mean of Security budget (left) and security incidents (right) for H7a.
6.8.3 H7b. Contract Complexity A hierarchical cluster analysis was run to separate the companies in terms of the factor
measuring the complexity experienced by companies to exploit transport agreements contracts.
Two clusters were identified with a cut off level of 10. Cluster membership was assigned by
running an iterative K-means cluster analysis, and cross-validation ensured the reliability of the
analysis. A discriminant analysis was run using the clusters membership as the grouping factor
and the factor of contract complexity as the independent variable; one discriminant function
significantly distinguishes the respondents, Λ = 0.42, (1) = 150.50, < 0.001 . Examining
the scores of the functions at group centroids, it was found that the first group of companies has
not experienced the existing transport contract agreements as complex. The second group seems
to have more difficulties. This is also depicted in Table 87 where the scores of the two groups on
the variables used in the factor are reported. The first group has scores between 2, Disagree and
3, Neither Agree nor Disagree while the second group’s scores range between 3, Neither Agree
nor Disagree and 5, Strongly Agree. It is also relevant to notice in the table that a larger number
of respondents belong to the second group.
Cluster Number of Case21
Mea
n Se
curit
y B
udge
t
€15,000
€10,000
€5,000
€0
Error Bars: 95% CICluster Number of Case
21M
ean
Sec
urity
Inci
dent
s
10
8
6
4
2
0
Error Bars: 95% CI

153
Table 87: Summary of factor variables scores.
Group N Mean Std. Deviation
Contract agreements demand too much time and resource
1 115 2.30 0.90 2 60 4.15 0.71
Prefer Verbal Agreements (due to contract complexity) 1 115 2.33 0.93 2 60 3.81 0.95
Don't understand the importance of written agreements 1 115 2.27 0.90 2 60 3.91 0.92
Don't know how to use contracts in case of security incidents
1 115 2.50 0.94 2 60 3.54 0.93
Contracts with customers are too complex 1 115 2.30 0.90 2 60 4.15 0.71
A MANOVA was run to determine whether there were significant differences between these two
clusters, in terms of security budget and security incidents suffered (Box’s M test not significant,
p>0.05). All the multivariate tests confirm that there are significant differences between the two
groups (p<0.001). In particular using Pillai’s trace, we can deduce that the groups’ means
significantly differ in terms of magnitude of investments and number of security incidents, V = 0.08, (2, 182) = 7.27, < 0.001 . Separate univariate ANOVAs show that the group
means differ significantly in term of the magnitude of security investments, p<0.001, but not in
terms of number of security incidents, p>0.05.
Table 88: MANOVA Results H7b.
Test Value F (2,182) Significance Observed Power(a) Pillai's Trace 0.08 7.27 0.00 0.93 Wilks' Lambda 0.92 7.27 0.00 0.93 Hotelling's Trace 0.08 7.27 0.00 0.93 Roy's Largest Root 0.08 7.27 0.00 0.93 Between Subjects Effect Mean Square F(1,169) Significance Observed Power(a) Security Budget 38.29 12.31 0.00 0.93 Security Incidents 0.00 0.00 0.99 0.05 a) Computed using alpha=0.05.
A final discriminant analysis was run to follow up the results from the MANOVA. One
discriminant function significantly distinguishes the groups, Λ = 0.94, (2) = 8.89, < 0.05.
This function correlates positively with the security budget ( = 0.99) and negatively with the
number of security incidents ( = −0.10). Examining the groups’ centroids scores in relation to
the discriminant function, it is possible to confirm that the first cluster invests more in security
and is less affected by security incidents. On the contrary the second group of companies, which
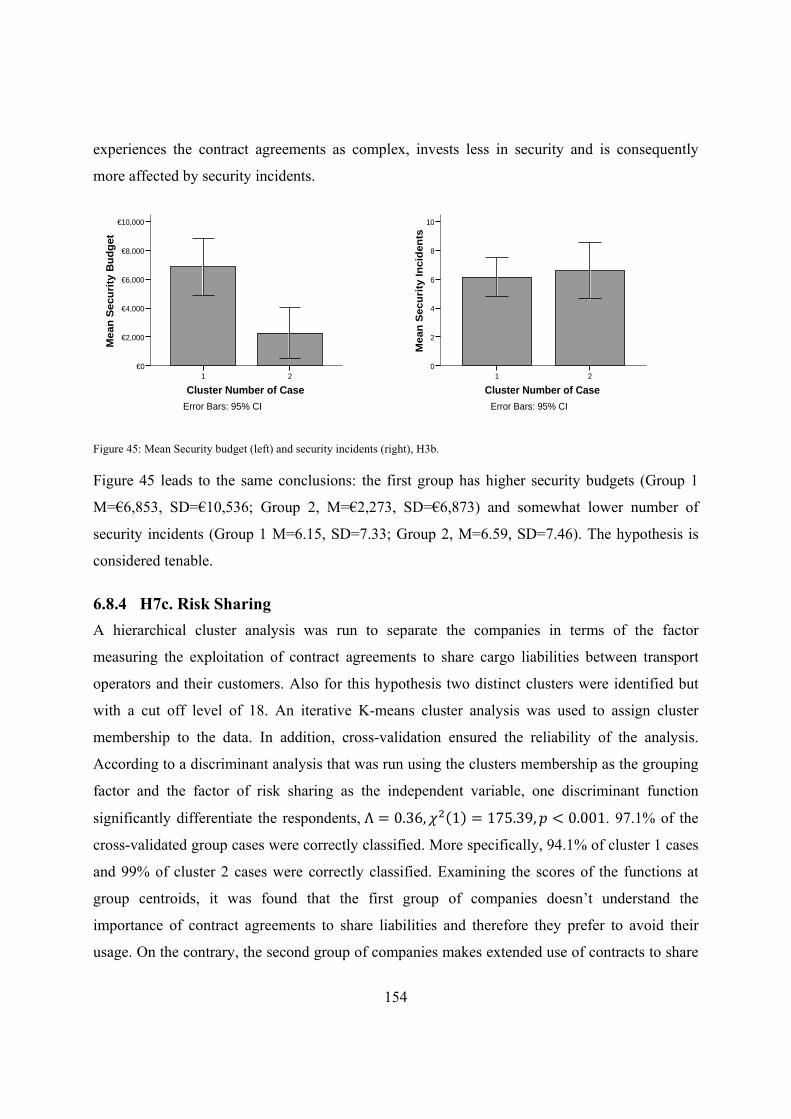
154
experiences the contract agreements as complex, invests less in security and is consequently
more affected by security incidents.
Figure 45: Mean Security budget (left) and security incidents (right), H3b.
Figure 45 leads to the same conclusions: the first group has higher security budgets (Group 1
M=€6,853, SD=€10,536; Group 2, M=€2,273, SD=€6,873) and somewhat lower number of
security incidents (Group 1 M=6.15, SD=7.33; Group 2, M=6.59, SD=7.46). The hypothesis is
considered tenable.
6.8.4 H7c. Risk Sharing A hierarchical cluster analysis was run to separate the companies in terms of the factor
measuring the exploitation of contract agreements to share cargo liabilities between transport
operators and their customers. Also for this hypothesis two distinct clusters were identified but
with a cut off level of 18. An iterative K-means cluster analysis was used to assign cluster
membership to the data. In addition, cross-validation ensured the reliability of the analysis.
According to a discriminant analysis that was run using the clusters membership as the grouping
factor and the factor of risk sharing as the independent variable, one discriminant function
significantly differentiate the respondents, Λ = 0.36, (1) = 175.39, < 0.001. 97.1% of the
cross-validated group cases were correctly classified. More specifically, 94.1% of cluster 1 cases
and 99% of cluster 2 cases were correctly classified. Examining the scores of the functions at
group centroids, it was found that the first group of companies doesn’t understand the
importance of contract agreements to share liabilities and therefore they prefer to avoid their
usage. On the contrary, the second group of companies makes extended use of contracts to share
Cluster Number of Case21
Mea
n Se
curit
y B
udge
t
€10,000
€8,000
€6,000
€4,000
€2,000
€0
Error Bars: 95% CICluster Number of Case
21
Mea
n S
ecur
ity In
cide
nts
10
8
6
4
2
0
Error Bars: 95% CI
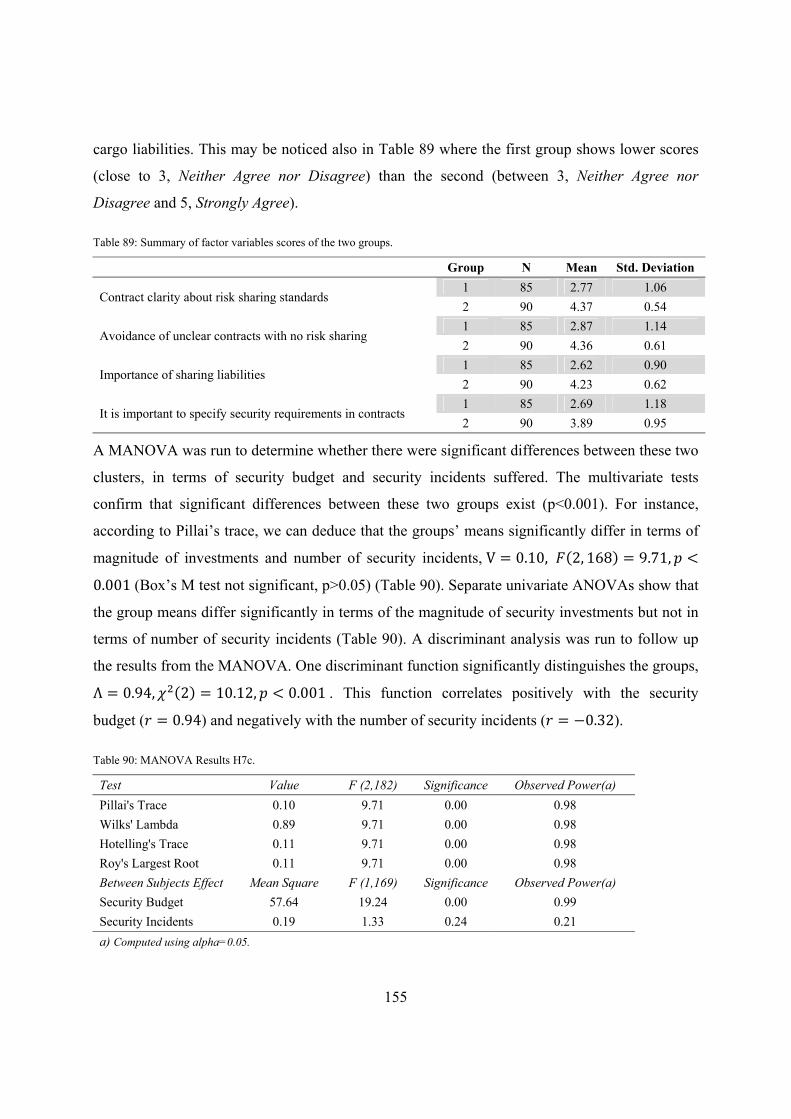
155
cargo liabilities. This may be noticed also in Table 89 where the first group shows lower scores
(close to 3, Neither Agree nor Disagree) than the second (between 3, Neither Agree nor
Disagree and 5, Strongly Agree).
Table 89: Summary of factor variables scores of the two groups.
Group N Mean Std. Deviation
Contract clarity about risk sharing standards 1 85 2.77 1.06 2 90 4.37 0.54
Avoidance of unclear contracts with no risk sharing 1 85 2.87 1.14 2 90 4.36 0.61
Importance of sharing liabilities 1 85 2.62 0.90 2 90 4.23 0.62
It is important to specify security requirements in contracts 1 85 2.69 1.18 2 90 3.89 0.95
A MANOVA was run to determine whether there were significant differences between these two
clusters, in terms of security budget and security incidents suffered. The multivariate tests
confirm that significant differences between these two groups exist (p<0.001). For instance,
according to Pillai’s trace, we can deduce that the groups’ means significantly differ in terms of
magnitude of investments and number of security incidents, V = 0.10, (2, 168) = 9.71, <0.001 (Box’s M test not significant, p>0.05) (Table 90). Separate univariate ANOVAs show that
the group means differ significantly in terms of the magnitude of security investments but not in
terms of number of security incidents (Table 90). A discriminant analysis was run to follow up
the results from the MANOVA. One discriminant function significantly distinguishes the groups, Λ = 0.94, (2) = 10.12, < 0.001 . This function correlates positively with the security
budget ( = 0.94) and negatively with the number of security incidents ( = −0.32).
Table 90: MANOVA Results H7c.
Test Value F (2,182) Significance Observed Power(a) Pillai's Trace 0.10 9.71 0.00 0.98 Wilks' Lambda 0.89 9.71 0.00 0.98 Hotelling's Trace 0.11 9.71 0.00 0.98 Roy's Largest Root 0.11 9.71 0.00 0.98 Between Subjects Effect Mean Square F (1,169) Significance Observed Power(a) Security Budget 57.64 19.24 0.00 0.99 Security Incidents 0.19 1.33 0.24 0.21 a) Computed using alpha=0.05.

156
Examining the scores of the two groups’ centroids in relation to the discriminant function it is
possible to confirm that the first cluster, which doesn’t make use of special contract agreements
to share risks, invests less in security and is more affected by security incidents. On the contrary
the second group of companies, which instead has a pronounced tendency to share cargo
liabilities, invests more in security and is consequently less affected by security incidents. The
same conclusions may be drawn by examining Figure 46. The second group has an average
investment higher than the first (Group 1 M=€3,027, SD=€6,657; Group 2, M=€7,441,
SD=€11,494) and is consequently affected by fewer security incidents (Group 1 M=6.86,
SD=7.19; Group 2, M=5.76, SD=7.52). The hypothesis is considered tenable.
Figure 46: Mean Security budget (left) and security incidents (right), H3c.
6.8.5 H7d. Security Requirements Specification Two clusters were identified by running the hierarchical cluster analysis in terms of the factor
measuring the exploitation of security requirements specifications in contract agreements (cut off
level 17). Cluster membership was assigned by means of an iterative K-means cluster analysis.
Moreover, cross-validation ensured the reliability of the cluster analysis. According to a
discriminant analysis that was run using the clusters membership as the grouping factor and the
last factor (usage of security requirements in contract agreements) as the independent variable,
one discriminant function significantly distinguishes the respondents, Λ = 0.33, χ (1) =186.75, p < 0.001. overall, 97.7% of cross-validated grouped cases were correctly classified;
94.7% of cluster 1 cases and 98.1% of cluster 2 cases were correctly classified. Examining the
scores of the functions at group centroids it was found that the first group of companies is not
Cluster Number of Case21
Mea
n S
ecur
ity B
udge
t
€8,000
€6,000
€4,000
€2,000
€0
Cluster Number of Case21
Mea
n S
ecur
ity In
cide
nts 6
4
2
0

157
making use of specific contract agreements to agree and specify security requirements to be used
in transport assignments (Table 91).
Table 91: Summary of factor variables scores in relation to the two groups.
Group N Mean Std. Deviation
Our customers require the specification of security in contracts 1 76 1.62 0.64 2 99 3.33 0.93
Our organization always proposes detailed descriptions of security in contracts
1 76 1.75 0.70 2 99 3.37 0.85
We have easily agreed with our customers on specifying security requirements in contracts
1 76 1.84 0.78 2 99 3.46 0.82
On the contrary, the second group of respondents is currently specifying security requirements in
contracts and most of all acknowledges their utility. Examining the distribution of the scores of
the factor variables (Table 91), it is possible to notice that the first group scores between 1,
Strongly Disagree and 2, Disagree, while the second group has scores higher than 3, Neither
Agree nor Disagree.
Table 92: MANOVA Results H7d.
Test Value F (2,182) Significance Observed Power(a) Pillai's Trace 0.02 1.98 0.14 0.40 Wilks' Lambda 0.97 1.98 0.14 0.40 Hotelling's Trace 0.02 1.98 0.14 0.40 Roy's Largest Root 0.02 1.98 0.14 0.40 Between Subjects Effect Mean Square F(1,169) Significance Observed Power(a) Security Budget 92226581.78 3.11 0.07 0.42 Security Incidents 54.29 0.88 0.34 0.15 a) Computed using alpha=0.05.
A MANOVA was run to determine whether there were significant differences between these two
clusters, in terms of security budget and security incidents suffered (Table 92) (Box’s M test not
significant, p>0.05). None of the multivariate tests show a significant impact of this factor.
Separate univariate ANOVAs show that the group means don’t differ significantly, either in
terms of the magnitude of security investments or in terms of number of security incidents (Table
92). Hence, the hypothesis is rejected.
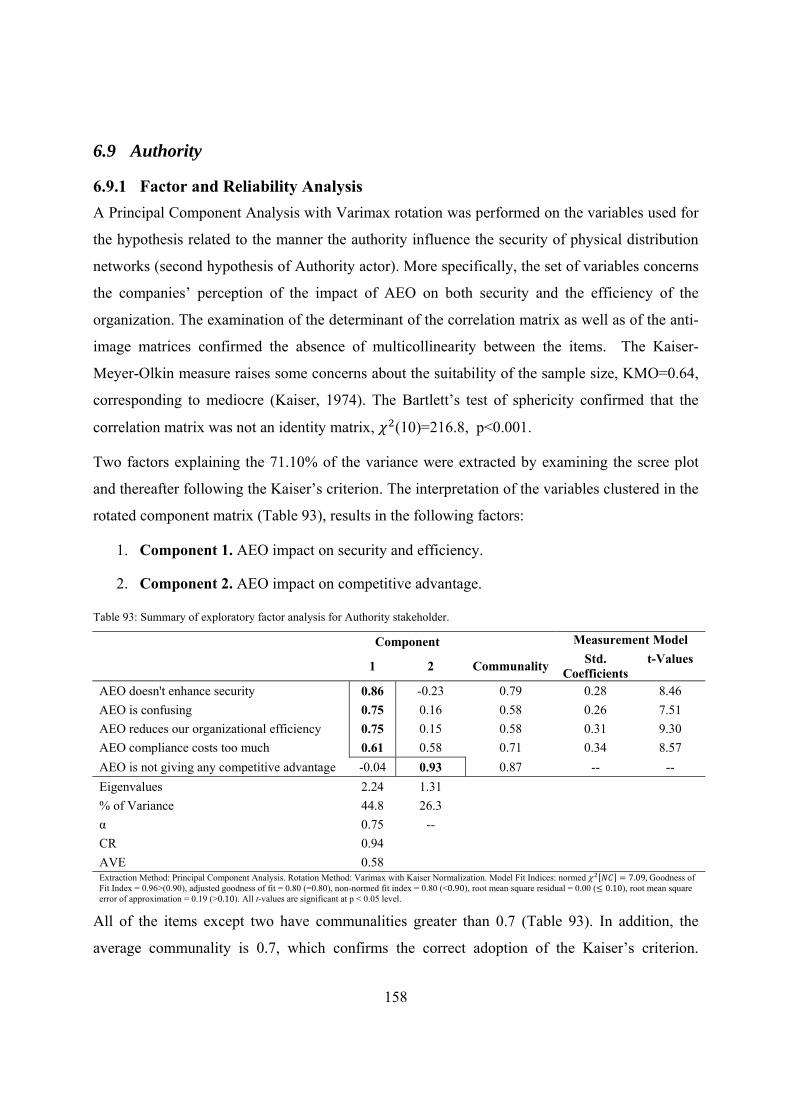
158
6.9 Authority
6.9.1 Factor and Reliability Analysis A Principal Component Analysis with Varimax rotation was performed on the variables used for
the hypothesis related to the manner the authority influence the security of physical distribution
networks (second hypothesis of Authority actor). More specifically, the set of variables concerns
the companies’ perception of the impact of AEO on both security and the efficiency of the
organization. The examination of the determinant of the correlation matrix as well as of the anti-
image matrices confirmed the absence of multicollinearity between the items. The Kaiser-
Meyer-Olkin measure raises some concerns about the suitability of the sample size, KMO=0.64,
corresponding to mediocre (Kaiser, 1974). The Bartlett’s test of sphericity confirmed that the
correlation matrix was not an identity matrix, (10)=216.8, p<0.001.
Two factors explaining the 71.10% of the variance were extracted by examining the scree plot
and thereafter following the Kaiser’s criterion. The interpretation of the variables clustered in the
rotated component matrix (Table 93), results in the following factors:
1. Component 1. AEO impact on security and efficiency.
2. Component 2. AEO impact on competitive advantage.
Table 93: Summary of exploratory factor analysis for Authority stakeholder.
Component Measurement Model
1 2 Communality Std. Coefficients
t-Values
AEO doesn't enhance security 0.86 -0.23 0.79 0.28 8.46 AEO is confusing 0.75 0.16 0.58 0.26 7.51 AEO reduces our organizational efficiency 0.75 0.15 0.58 0.31 9.30 AEO compliance costs too much 0.61 0.58 0.71 0.34 8.57 AEO is not giving any competitive advantage -0.04 0.93 0.87 -- -- Eigenvalues 2.24 1.31 % of Variance 44.8 26.3 α 0.75 -- CR 0.94 AVE 0.58 Extraction Method: Principal Component Analysis. Rotation Method: Varimax with Kaiser Normalization. Model Fit Indices: normed = 7.09, Goodness of Fit Index = 0.96>(0.90), adjusted goodness of fit = 0.80 (=0.80), non-normed fit index = 0.80 (<0.90), root mean square residual = 0.00 (≤ 0.10), root mean square error of approximation = 0.19 (>0.10). All t-values are significant at p < 0.05 level.
All of the items except two have communalities greater than 0.7 (Table 93). In addition, the
average communality is 0.7, which confirms the correct adoption of the Kaiser’s criterion.
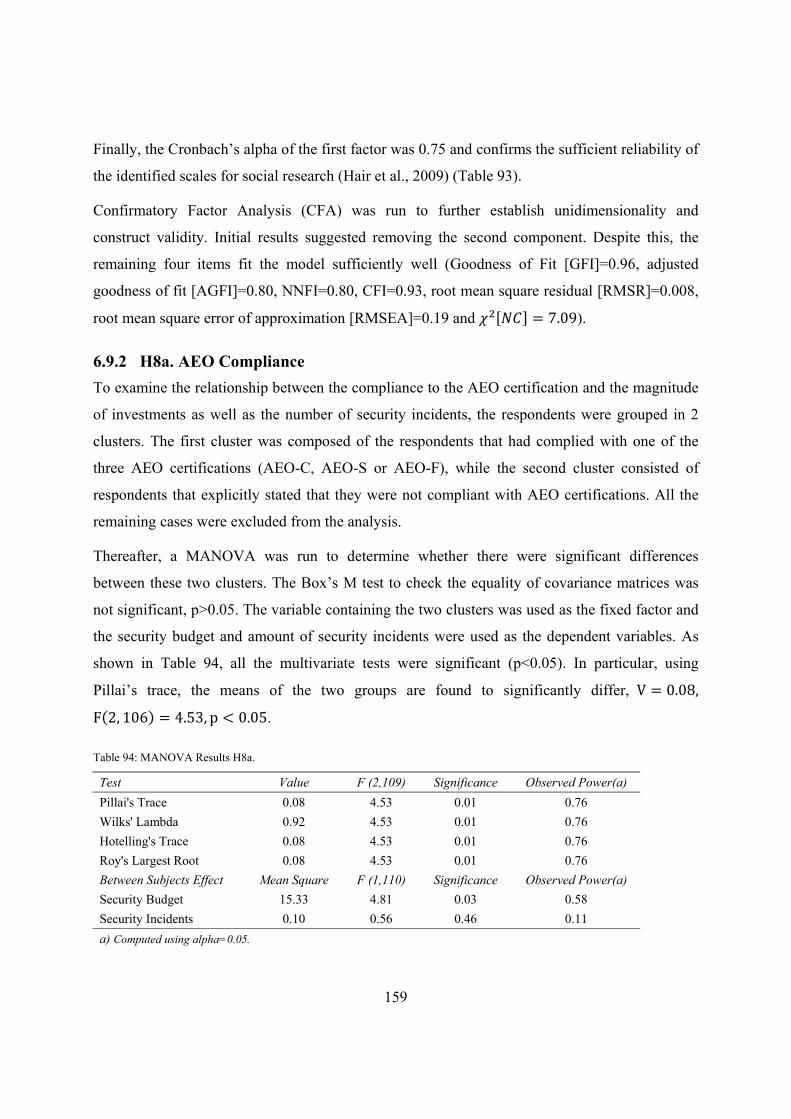
159
Finally, the Cronbach’s alpha of the first factor was 0.75 and confirms the sufficient reliability of
the identified scales for social research (Hair et al., 2009) (Table 93).
Confirmatory Factor Analysis (CFA) was run to further establish unidimensionality and
construct validity. Initial results suggested removing the second component. Despite this, the
remaining four items fit the model sufficiently well (Goodness of Fit [GFI]=0.96, adjusted
goodness of fit [AGFI]=0.80, NNFI=0.80, CFI=0.93, root mean square residual [RMSR]=0.008,
root mean square error of approximation [RMSEA]=0.19 and = 7.09).
6.9.2 H8a. AEO Compliance To examine the relationship between the compliance to the AEO certification and the magnitude
of investments as well as the number of security incidents, the respondents were grouped in 2
clusters. The first cluster was composed of the respondents that had complied with one of the
three AEO certifications (AEO-C, AEO-S or AEO-F), while the second cluster consisted of
respondents that explicitly stated that they were not compliant with AEO certifications. All the
remaining cases were excluded from the analysis.
Thereafter, a MANOVA was run to determine whether there were significant differences
between these two clusters. The Box’s M test to check the equality of covariance matrices was
not significant, p>0.05. The variable containing the two clusters was used as the fixed factor and
the security budget and amount of security incidents were used as the dependent variables. As
shown in Table 94, all the multivariate tests were significant (p<0.05). In particular, using
Pillai’s trace, the means of the two groups are found to significantly differ, V = 0.08,F(2, 106) = 4.53, p < 0.05.
Table 94: MANOVA Results H8a.
Test Value F (2,109) Significance Observed Power(a) Pillai's Trace 0.08 4.53 0.01 0.76 Wilks' Lambda 0.92 4.53 0.01 0.76 Hotelling's Trace 0.08 4.53 0.01 0.76 Roy's Largest Root 0.08 4.53 0.01 0.76 Between Subjects Effect Mean Square F (1,110) Significance Observed Power(a) Security Budget 15.33 4.81 0.03 0.58 Security Incidents 0.10 0.56 0.46 0.11 a) Computed using alpha=0.05.

160
Separate univariate ANOVAs show that the group means differ significantly in terms of the
magnitude of security investments (p<0.05) but not in terms of number of security incidents,
p>0.05. The results of the MANOVA were followed up with a discriminant analysis. One
discriminant function significantly differentiate the groups, Λ = 0.84, χ (2) = 19.63, p <0.001. This function correlates positively with the security budget and still positively, but not
strongly, with the number of security incidents. Hence, examining the scores of the two groups’
centroids in relation to the discriminant function it is possible to deduce that the first cluster,
which is made of companies not complying with the AEO, makes moderately lower security
investments. On the contrary, the second group of companies, which is compliant to one of the
three AEO certifications, invests considerably more in security. This is also illustrated in Figure
47 where the respondents are grouped according to their AEO compliance and related to the
average security investment and average number of security incidents (Figure 47). Companies
that are AEO compliant have considerable investments in security (M=€18,242, SD=€10,655)
compared to those companies that are not AEO certified (M=€4,236, SD=€8,448). Surprisingly,
AEO compliant companies are also slightly more affected by security incidents (M=8.29,
SD=9.35) than other companies not certified (M=6.32, SD=6.16). So the hypothesis is tenable
only partially since companies complying with the AEO have significantly higher security
budgets. However, the same companies are significantly more affected by security incidents.
Hence the hypothesis is rejected.
Figure 47: Mean of security investments (left) and number of incidents for companies complying or not with AEO.
6.9.3 H8b. AEO Security and Efficiency Impacts A hierarchical cluster analysis was run to identify distinct and homogeneous groups in terms of
the first component identified in the factor analysis: AEO impacts on security and efficiency.
AEO ComplianceAEO CompliantNot Compliant
Mea
n S
ecur
ity B
udge
t
30,000€
20,000€
10,000€
0€
Error Bars: 95% CIAEO Compliance
AEO CompliantNot Compliant
Mea
n S
ecur
ity In
cide
nts
20
15
10
5
0
Error Bars: 95% CI

161
Two groups were identified with a cut off level of 15. An iterative K-means cluster analysis was
used to assign cluster membership to the data. Finally, the cross-validation technique confirmed
the reliability of the cluster analysis. The groups were significantly distinguished by one
discriminant function, Λ = 0.44, χ (1) = 139.38, p < 0.001. Overall, 99.4% of cross-validated
grouped cases were correctly classified by the discriminant function. More specifically, 83.3% of
cluster 1 cases and 100% of cluster 2 cases were correctly classified. The first group has a
tendency to agree with the statements that AEO is confusing (M=4.38, SD=0.72) and doesn’t
enhance security (M=4.83, SD=0.41). This cluster has also a tendency to agree ct that AEO costs
too much (M=4.50, SD=0.55) and reduces organizational efficiency (M=4.00, SD=0.63) (Table
95). The second group is more or less neutral with some slight tendency to agree that AEO
doesn’t enhance security (M=3.25, SD=0.31) and costs too much (M=3.28, SD=0.37) (Table 95).
Table 95: Scores of the two clusters on the AEO set of variables (N=175).
Group N Mean Std. Deviation
AEO is confusing 1 6 4.38 0.72 2 169 3.27 0.36
AEO doesn't enhance security 1 6 4.83 0.41 2 169 3.25 0.31
AEO compliance costs too much 1 6 4.50 0.55 2 169 3.28 0.37
AEO reduces our organization’s efficiency 1 6 4.00 0.63 2 169 3.06 0.29
A MANOVA was performed to determine if there were any significant differences between
these two groups in terms of the outcome variables considered in this study (security budget and
number of security incidents). To check for the assumption of multivariate normality of the
dependent variables, the Box’s M test was used, p>0.05. None of the multivariate tests is
significant (Table 96). Separate univariate ANOVAs show that the group means don’t differ
significantly either in terms of the magnitude of the security budget or in terms of the number of
security incidents (Table 96). Hence, the hypothesis is not tenable.

162
Table 96: MANOVA Results H8b.
Test Value F(2,168) Significance Observed Power(a) Pillai's Trace 0.00 0.41 0.66 0.11 Wilks' Lambda 0.99 0.41 0.66 0.11 Hotelling's Trace 0.00 0.41 0.66 0.11 Roy's Largest Root 0.00 0.41 0.66 0.11 Between Subjects Effect Mean Square F(1,169) Significance Observed Power(a) Security Budget 1.79 0.53 0.46 0.11 Security Incidents 0.00 0.04 0.83 0.05 a) Computed using alpha=0.05.
163
7 Discussion
This chapter summarizes the survey’s findings that are technically described in the previous chapter
(Chapter 5). The findings are discussed for each of the actors considered in the physical distribution
security system (PDSS) presented in Chapter 3.
7.1 Research Results The purpose of this study is to enhance our understanding of the factors that influence physical
distribution security. More specifically, this investigation aims to understand what factors affect
the magnitude of security investments made by transportation firms as well as the number of
security incidents suffered. To accomplish this task an explorative investigation followed by a
survey study are performed.
The explorative study brought to light 19 hypotheses explaining how eight stakeholders
influence the security of physical distribution networks (Table 97). To test these hypotheses, a
questionnaire was developed and sent to 577 physical distribution carriers based in Sweden. The
survey had a final response rate of 36.4% (210 questionnaires). Findings demonstrate that today
many companies, about 39% of the respondents, are not investing in security although only a
minority, 18% of the respondents, is not affected by security incidents. This means that some
companies affected by security incidents don’t invest in security. In 2009, the average
investment made by the respondents was about M=€4,874. The variable gathering the number of
security incidents suffered by Swedish carriers shows that on average the respondents were
affected by 6.4 attacks in 2009.
Differences were found in terms of the average budget allocated and number of incidents
suffered by small, medium and large companies. Large companies invest, on average, more than
medium and small companies. At the same time, despite the greater investments, larger
companies are also more affected by security incidents than are medium and small companies
(Figure 31). By comparing the means of these groups, significant differences, in terms of
security budget and number of incidents, were found only between small and medium enterprises
or between small and large companies.

164
Table 97: stakeholders and hypotheses.
Actor Hypothesis
Law Enforcement Agency
H1a. Companies that perceive that criminals are not prosecuted are discouraged from improving security. H1b. Companies that perceive that the Swedish law enforcement agency is not allocating enough resources are discouraged from enhancing security.H1c. Companies that perceive as beneficial the collaboration in activities organized by the Swedish law enforcement agency are stimulated to improve security.
Distribution and Transport Operators
H2a. Companies that encounter difficulties in raising freight rates are discouraged from improving security. H2b. Companies applying JIT principles are discouraged from improving security. H2c. Companies that are part of international distribution networks are more interested in improving security. H2d. Companies believing that security measures may negatively affect their performance level don’t improve security.
Business Security Certifications H3. Companies complying with business certifications have higher security. Insurance Companies
H4a. Companies that make use of insurances to cover the economical losses of security incidents are less interested in improving security.H4b. Companies benefiting from premium discounts don‘t work actively with enacting security.
Security Providers H5a. Companies believing that security solutions are in a development stage and difficult
to integrate do not improve security. H5b. Companies believing that security solutions are too expensive compared to the value provided do not improve security.
Criminals H6. Companies perceiving the opportunistic behavior of criminals do not improve
security. Contract Regulatory Associations
H7a. Companies that experience difficulties in agreeing on security requirements are not encouraged to improve security. H7b. Companies that perceive the contract agreements as too complex are not encouraged to improve security. H7c. Companies that don’t share risks by means of contract agreements are not encouraged to improve security. H7d. Companies that do not specify security requirements are not encouraged to improve security.
Authority H8a. Transportation companies complying with the AEO certification have higher
security. H8b. Transportation companies that have a negative perception about the impact of AEO regulations on security and efficiency are discouraged from enhancing security.
According to non-parametric tests, a significant inverse relationship between the dependent
variables, the security budget and the security incidents (p<0.01) was found. In other words, the
higher the investments made by transport operators the fewer incidents suffered. Moreover, the

165
scatter diagram in Figure 30, representing the relationship between security budget and security
incidents in relation to the size of the company, demonstrates that this trend is much more
prevalent for small and medium companies (blue and green lines respectively). On the contrary,
large companies show a more flattened relationship between the variables (red line). In view of
these findings, it is possible to come to the conclusion that there are differences between small,
medium and large companies, not only in terms of average security investments and incidents
suffered (Figure 31) but also in terms of the linear relationship between security budget and
number of security incidents.
7.2 Law Enforcement Agency Three hypotheses related to the law enforcement agency were formulated in this study. These are
the following:
H1a. Companies that perceive that criminals are not prosecuted are discouraged from
improving security.
H1b. Companies that perceive that the Swedish law enforcement agency is not allocating enough
resources are discouraged from enhancing security.
H1c. Companies that perceive as beneficial the collaboration in activities organized by the
Swedish law enforcement agency are stimulated to improve security.
Examining the variables used to measure the perception of the work done by the law
enforcement agency, it is possible to depict a generic dissatisfaction. Hence, in general the
respondents believe that cargo criminals are not prosecuted and that the law enforcement agency
is not allocating enough resources to combat the problem. In addition, the majority of
respondents is not participating in collaborative activities and, most of all, is not convinced of the
beneficial effects of these initiatives.
The respondents were grouped into clusters built upon the positive or negative perception of
three factors: the perception of criminal prosecution, the perception of resource allocation and
finally the beneficial effect of collaborative activities. By checking the simultaneous relationship
between these groups and the two outcome variables, the security budget and the number of
security incidents, the three hypotheses were confirmed. The groups of respondents that were
convinced that 1) criminals are prosecuted (H1a), 2) the law enforcement agency is allocating

166
resources (H1b) and 3) are joining collaborative activities (H1c) are investing significantly more
on security and are consequently less affected by security incidents. Hence, it appears that
although there is an overall low appreciation of the efforts made by the law enforcement agency,
some companies have had positive experiences and their security investments are higher. In
addition, the increased magnitude of investments corresponds to a reduction of security
incidents.
In conclusion H1a, H1b and H1c are demonstrated to be tenable.
7.3 Distribution and Transport Operators The hypotheses formulated for these actors are four:
H2a. Companies that encounter difficulties in raising freight rates are discouraged from
improving security.
H2b. Companies applying JIT principles are discouraged from improving security.
H2c. Companies that are part of international distribution networks are more interested in
improving security.
H2d. Companies believing that security measures may negatively affect their performance level
don’t improve security.
Examining the descriptive statistics of the variables used for these stakeholders, it may be
noticed that the average acceptance of freight rate increments of transport buyers is very low,
about 1.3%. In addition, about 31% of the respondents declare that their customers are not
willing to accept any freight rate increment in exchange for improved security. The collected
responses show also that on very few occasions respondents have been able to obtain increments
of 10% and 20% when enhancing the protection of the cargo transported. In general the
respondents are neutral to the dilemma of trading off JIT with security and are consistently
convinced that efficiency won’t be significantly affected when enhancing security. Finally, of the
respondents about 44% move goods on a regional scale, followed by national (34.3%), urban
(10.3%), continental (8%) and worldwide (2.3%).
The mean and standard deviations of the variables used to measure the impact on performance of
security solutions range between 1, Strongly disagree and 3 (2.60), Neither Agree nor Disagree.
Hence, the respondents on average don’t agree that the introduction of security measures doesn’t

167
affect organizational performance. In addition, it appears that respondents perceive that the
security measures will have more impact on direct costs (administrative costs, labor costs etc.)
rather than on logistical efficiency (i.e. time delays, customer satisfaction, delivery precision
etc.). Finally, technological security measures (e.g. GPS track and trace, rigid curtains,
mechanical locks and fuel cap locks) have in general a very low effect on performance with the
exception of the variables measuring the working complexity of operators, number of routines to
be followed and learning processes. The screening of employees’ backgrounds has more
negative impacts on labor costs, administrative costs , number of routines to be learned by
operators and working complexity. In other words, this shows that respondents feel that security
technologies imply lower losses of efficiency compared to routines, even though some negative
impacts related to learning and working complexity were scored as relevant.
The hypotheses concerning the customers’ willingness to pay (H2a), the impact of distribution
length (H2c) as well as conflicts with the performance of transport operations (H2d), show no
significant relationships with the security investments and the number of security incidents.
Customers that managed to agree on freight rate increments did not show higher security
investments and lower security incidents in comparison with those who couldn’t raise their
prices (H2a). Results from the statistical analysis show that that the length of distribution chains
impacts the security budget and the number of security incidents. Higher security investments
have been made for longer distribution chains. However, while the increments of security budget
mitigate the number of incidents from urban to national distribution, the same doesn’t happen for
security incidents for continental and worldwide networks, which instead increase. Hence, this
hypothesis is rejected (H2c). Finally, the impact of security on performance doesn’t significantly
differentiate respondents in terms of security budget and security incidents, and this hypothesis is
also rejected (H2d).
The factor concerning the dilemma about the trade-off between JIT and security is strongly
related to the budget allocated and the security incidents suffered. In other words, the group of
respondents experiencing that the application of security jeopardizes their JIT efficiency invests
less and are more affected by security incidents. Hence, this hypothesis is supported (H2b).
In conclusion, H2a, H2c and H2d are rejected, while H2b is supported by the data.
168
7.4 Business Security Certifications Only one hypothesis has been formulated for this stakeholder:
H3. Companies complying with business certifications have higher security.
The compliance with business security certifications among Swedish physical distribution
carriers that answered the survey appears to be very low. More specifically, we discovered that
the majority of the companies don’t have any certification (49.1%), don’t know what they
comply with (17%) and finally preferred not to answer to this question (5.3%). Of the remaining
companies only 1.7% comply with TAPA EMEA, and 8.6% with ISO28000.
The results of the MANOVA analysis didn’t show any significant relationship between the
compliance with security certifications and the two outcome variables, security budget and
security incidents, and therefore hypothesis H3 is rejected.
7.5 Insurance Companies Two hypotheses have been formulated for insurance companies. These were the following:
H4a. Companies that make use of insurances to cover the economical losses of security incidents
are less interested in improving security.
H4b. Companies benefiting from premium discounts don‘t work actively with enacting security.
The variables measuring the adoption of insurances to cover security losses indicate that on
average in 2009 1) the respondents have fully insured 75% of their shipments against security
incidents, 2) in 23.8% of the shipments the goods owners lack insurance, 3) 13% of the
shipments have higher liability than what is stated in national standard regulations, and 4) 3.7%
of security losses are covered with captive insurances. Finally, on average, the respondents are
neutral when asked to judge if they believe that security insurances are the best way to cover
security losses (average scores are around 3, Neither Agree nor Disagree).
When it comes to the impact of premium discount, respondents complain moderately about
premium discounts that do not seem to be offered when enhancing security. On average, the
respondents have been offered premium discounts at around 3%; however almost 60 respondents
report that they are not receiving premium discount when implementing security measures. Yet a
good proportion of respondents affirm receiving premium discounts of 8% and 10%.

169
The MANOVA results show no significant effects concerning the impact of the usage of
insurance on the security investments and number of incidents. This implies that, contrarily to
what was hypothesized in H4a, companies are not using insurances in place of security
enhancements. Hence, this hypothesis is rejected. On the contrary, premium discounts seem to
have a positive effect on security investments. More specifically, the companies that receive
premium discounts have a marked tendency to invest more on security and thereafter to be less
affected by security incidents. This hypothesis is tenable (H4b).
In conclusion, H4a is rejected and H4b is tenable.
7.6 Security Providers The providers of security solutions are believed to affect the security of physical distribution
networks in two ways:
H5a. Companies believing that security solutions are in a development stage and difficult to
integrate do not improve security.
H5b. Companies believing that security solutions are too expensive compared to the value
provided do not improve security.
According to the analysis, the issue concerning the impact of the security devices on security as
well as the integration in the organization seems to be perceived as a problem. The variables
measuring the perception of the expensiveness of security devices have higher scores, indicating
a more pronounced tendency of respondents to perceive security solutions as too expensive. In
particular, the costs of installing security devices on the whole fleet of vehicles scores highest.
According to the MANOVA, only the first hypothesis was not rejected (H5a). More specifically,
the group of respondents that doesn’t agree with the fact that, in general, security prototypes are
still in a development stage, invests more on security and is less affected by security incidents.
On the contrary, no significant differences were found between groups of companies clustered in
terms of the perception of the expensiveness of security solutions. The MANOVA couldn’t
demonstrate that the companies not perceiving security devices as too expensive invest less on
security and are more affected by security incidents. Therefore the hypothesis had to be rejected
(H5b).
In conclusion, H5a is tenable and H5b is rejected.
170
7.7 Cargo Criminals The following hypothesis was formulated for this stakeholder:
H6. Companies perceiving the opportunistic behavior of criminals do not improve security.
Respondents have a slight tendency to agree that criminals have enhanced technical skills at their
disposal, and most of all have access to insiders in organizations to deceive security measures.
By clustering the respondents in accordance to the perception of this factor, it was possible to
find significant differences in terms of security budget and amount of incidents. Companies that
fear the opportunistic behavior of criminals invest less in security and are more subject to
security incidents. Hence, hypothesis H6 is supported.
7.8 Contract Regulatory Associations Four hypotheses related to contract regulatory associations, were formulated within this
investigation. These are the following:
H7a. Companies that experience difficulties in agreeing on security requirements are not
encouraged to improve security.
H7b. Companies that perceive the contract agreements as too complex are not encouraged to
improve security.
H7c. Companies that don’t share risks by means of contract agreements are not encouraged to
improve security.
H7d. Companies that do not specify security requirements are not encouraged to improve
security.
The importance to share liabilities, to avoid unclear contracts, use standard agreements etc. is
testified by the scores of the majority of the variables used to measure the usage of contract
agreements including liability sharing between buyers and sellers (Table 49). The scores of the
most of these variables are slightly above 3, Neither Agree nor Disagree. On the contrary, lower
scores are detected for the variables measuring the difficulty to agree on security requirements in
contract agreements. In particular, it seems that customers are not very often requiring the
specification of security in transportation contracts.
Multivariate techniques unveil that three of the four hypotheses formulated for this actor are
tenable. This implies that the factors related to 1) the usage of security requirements in contract
171
agreements (H7a), 2) the contract complexity (H7b) and 3) risk-sharing (H7c) had an impact on
the security investments allocated by companies as well as on the number of incidents suffered.
More specifically, the companies that perceive contracts as complex or are not sharing risks or
are not specifying security requirements in contracts invest less in security and are more affected
by security incidents. Contrarily, the process to agree and specify security requirements doesn’t
significantly affect security, either in terms of security budget or in terms of security incidents
suffered. Hence, this last hypothesis H7d is rejected.
In conclusion, H7a, H7b, H7c are tenable and H7d is rejected.
7.9 Authority Two hypotheses were formulated for the last stakeholder:
H8a. Transportation companies complying with the AEO certification have higher security.
H8b. Transportation companies that have a negative perception about the impact of AEO
regulations on security and efficiency are discouraged from enhancing security.
Descriptive statistics reveal that at the present there are still many companies that don’t have
knowledge of the AEO certification. The few companies AEO certified prefer to apply to AEO-
C (Customs Simplification), followed by AEO-F (Full) and AEO-S (Safety and Security).
Respondents believe that AEO may improve competitive advantage; on the other hand, they tend
to agree on the fact that the certification is still confusing, too costly and not effective in
enhancing security. The application of multivariate techniques reveals that AEO compliance
seems to have an impact on the security budget but not on the number of security incidents. By
examining the simultaneous relationship between this factor and the security budget and amount
of security incidents significant relationships were found. Despite this, the analysis of the mean
values of the outcome variables in relation to the two groups revealed that contrarily to the
hypothesis, the group of respondents that is AEO certified and that invests more on security is
also more affected by security incidents. Hence, it seems that the nature of the relationship
between AEO compliance and the security variables is not clear and there could be other
underlying dimensions influencing the results. Therefore the first hypothesis H8a was rejected.
To understand the reasons for such controversial results, the two clusters are grouped in terms of
the size variable (small, medium or large) (Figure 48). The second group that is composed of
only 8 companies has a more balanced amount of small, medium and large enterprises. The first

172
group, composed of 106 organizations, is instead dominated by small companies. Hence, due to
the positive relationship between the size of the company on the security budget and incidents it
may be hypothesized that the high number of small companies in the first group may have
tempered the average values of both security budget and number of incidents (Figure 48).
Figure 48: AEO compliant groups in relation to size of company.
The second hypothesis was tested by clustering the respondents in terms of their perception of
the AEO impact on security and efficiency and by measuring the simultaneous relationships of
these groups with the security budget and number of security incidents (H8b). The results of the
MANOVA didn’t show any significant differences between the groups. Hence, this hypothesis
was rejected (H8b).
In conclusion, both H8a and H8b are rejected.
AEO ComplianceAEO Compliant Not Compliant
Cou
nt
120
100
80
60
40
20
0
LargeMediumSmall
Small, Medium and Large enterprise (no
employees)
173
8 Conclusion
This section concludes the report by first briefly summarizing the results and next by highlighting the
scientific and practical contribution of the research performed. Findings and contributions of the
licentiate thesis are also included in this section. At the end of the chapter, proposals for future research
are expounded to readers.
8.1 Findings Summary Statistics indicate that today physical distribution networks are highly exposed to antagonistic
threats, turning them into high-revenue targets. Every day cargo is stolen, hijacked, and
counterfeited, and personnel working in transportation companies are exposed to the risk of
being seriously injured. Less often, we also witness episodes of terror attacks or food and
pharmaceuticals contamination that have horrendous consequences on our communities.
Logistics, transportation as well as security managers have wide access to handbooks,
certification programs (AEO, ISPS, ISO 28001), advanced security technologies etc., to enhance
the protection of their assets. Nevertheless, for various reasons, consistent actions are not being
properly taken by companies, resulting in an escalation of security incidents that today we may
observe in available statistics. Since this situation is not believed to be sustainable from either an
economic or a social responsibility viewpoint, this study wonders how companies are coping
with the protection of their assets. More specifically, this study has the ambition to enhance our
understanding of 1) what factors influence the security of physical distribution networks, 2) how
security in physical distribution networks may be enhanced and 3) how existing investmend and
risk models may be exploited to estimate the profitability of security solutions.
Doctoral Findings
What factors impact physical distribution security?
By performing an explorative study involving a literature review, observations, unstructured and
semi-structured interviews, eight actors interacting in an integrated Physical Distribution
Security System (PDSS) are brought to light (Table 98):
1. The Law Enforcement Agency.
2. Distribution and transport operators.
3. Business Security Certifications.

174
4. Insurance Companies.
5. Security Providers.
6. Criminals.
7. Contract Regulatory Associations.
8. Authority.
The mechanisms explaining how each actor influences security in physical distribution networks,
measured in terms of magnitude of security investments as well as number of security incidents,
are depicted in 19 hypotheses and tested with a survey study (Table 98).
The results of the survey study lead to the rejection of 9 hypotheses of the 19 formulated (Table
98). All the hypotheses related to the law enforcement agency are tenable. Three factors, the
prosecution of criminals (H1a), the resources allocated by the law enforcement agency (H1b) as
well as the collaborative activities (H1c), are significantly affecting the magnitude of
investments as well as the number of security incidents borne by industries (Table 98).
Transportation companies that have a positive perception of these factors show larger
investments in security and are less affected by security incidents. Companies with a negative
perception invest less in security and are more affected by security incidents.
Only one of the four hypotheses related to the distribution and transport operators is not rejected:
the JIT and security trade-off (H2b). Companies that perceive that JIT has to be traded off with
security invest less in security and are more often attacked by criminals (Table 98). A MANOVA
unveiled significant differences among groups of respondents clustered in accordance to the
length of distribution networks. However, it was found that longer distribution networks
correspond to higher security investments. Despite this, the analysis of average security incidents
revealed that urban operators working in continental and worldwide contexts experience on
average more security incidents than those working in regional and national areas. This implies
that the higher investments in security don’t correspond to proportionate reductions of security
incidents. Therefore the hypothesis H2c had to be rejected (Table 98). Finally, the customers’
willingness to pay (H2a) as well as the performance conflicts (H2d) factors do not significantly
impact the security investments and security incidents of companies.
The hypothesis related to the impact of compliance with security business certifications on the
outcome variables (security budget and security incidents) was rejected (H3). Hence, the
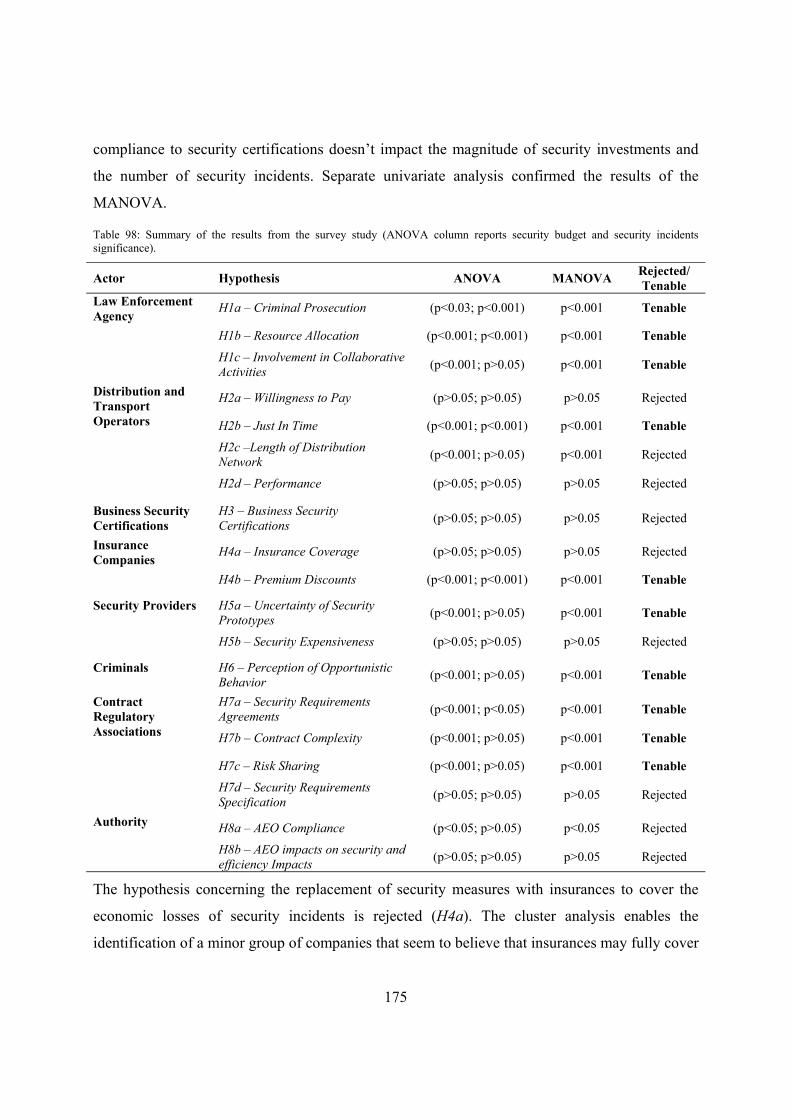
175
compliance to security certifications doesn’t impact the magnitude of security investments and
the number of security incidents. Separate univariate analysis confirmed the results of the
MANOVA.
Table 98: Summary of the results from the survey study (ANOVA column reports security budget and security incidents significance).
Actor Hypothesis ANOVA MANOVA Rejected/ Tenable
Law Enforcement Agency
H1a – Criminal Prosecution (p<0.03; p<0.001) p<0.001 Tenable
H1b – Resource Allocation (p<0.001; p<0.001) p<0.001 Tenable
H1c – Involvement in Collaborative Activities (p<0.001; p>0.05) p<0.001 Tenable
Distribution and Transport Operators
H2a – Willingness to Pay (p>0.05; p>0.05) p>0.05 Rejected
H2b – Just In Time (p<0.001; p<0.001) p<0.001 Tenable
H2c –Length of Distribution Network (p<0.001; p>0.05) p<0.001 Rejected
H2d – Performance (p>0.05; p>0.05) p>0.05 Rejected
Business Security Certifications
H3 – Business Security Certifications (p>0.05; p>0.05) p>0.05 Rejected
Insurance Companies H4a – Insurance Coverage (p>0.05; p>0.05) p>0.05 Rejected
H4b – Premium Discounts (p<0.001; p<0.001) p<0.001 Tenable
Security Providers H5a – Uncertainty of Security Prototypes (p<0.001; p>0.05) p<0.001 Tenable
H5b – Security Expensiveness (p>0.05; p>0.05) p>0.05 Rejected
Criminals H6 – Perception of Opportunistic Behavior (p<0.001; p>0.05) p<0.001 Tenable
Contract Regulatory Associations
H7a – Security Requirements Agreements (p<0.001; p<0.05) p<0.001 Tenable
H7b – Contract Complexity (p<0.001; p>0.05) p<0.001 Tenable
H7c – Risk Sharing (p<0.001; p>0.05) p<0.001 Tenable H7d – Security Requirements Specification (p>0.05; p>0.05) p>0.05 Rejected
Authority H8a – AEO Compliance (p<0.05; p>0.05) p<0.05 Rejected
H8b – AEO impacts on security and efficiency Impacts (p>0.05; p>0.05) p>0.05 Rejected
The hypothesis concerning the replacement of security measures with insurances to cover the
economic losses of security incidents is rejected (H4a). The cluster analysis enables the
identification of a minor group of companies that seem to believe that insurances may fully cover
176
the losses from security incidents. However, the investments made by these companies, as well
as the number of security incidents borne, don’t significantly differ from those who are aware of
insurance excesses or increments of the premium. Premium discounts impact significantly the
investments in security made by companies and the number of incidents suffered. The companies
that receive premium discounts invest more in security and are less affected by security
incidents. On the contrary, the companies that complain about the lack of premium discounts
invest less in security and are subject to a higher number of incidents. Thus, the hypothesis is
supported by the data (H4b).
The problem related to the difficulty to integrate and pay back advanced security prototypes has
an impact on security. According to the results from the survey, the companies that perceived
that the most effective security solutions were not ready yet for market implementation show
lower investments in security and are more affected by security incidents (H5a). On the contrary,
on average the respondents believe that most available security device are too expensive. Despite
this, the perception of the expensiveness of security solutions seems not to be determinant in the
allocation of security budget and the consequent number of security incidents suffered. Hence,
the hypothesis is rejected (H5b).
The hypothesis related to the opportunistic behavior of criminals is tenable (H6). The factor
concerning the fear of operators about criminals’ learning capabilities, access to technical and
economic resources and exploitation of insiders to perpetrate their attacks, may have an impact
on the security budget allocated by company and consequently on the number of security
incidents suffered. The operators that manifest discouragement about the criminals’ capacity to
deceive security solutions invest less in security and are more affected by security incidents.
Companies that don’t feel that criminals are unbeatable invest more in security and manage to
decrease the number of incidents.
Three of the four hypotheses formulated for the contract regulatory associations were confirmed
by the survey study. Hence, companies that 1) don’t specify security requirements in contracts
(H7a), 2) view transportation contracts as too complex (H7b), 3) don’t use risk sharing in
transport contract agreements (H7c) invest less in security and are more affected by security
incidents. On the contrary, the factor concerning the difficulties in agreeing on security
requirements doesn’t significantly diversify respondents, either in terms of security budget

177
allocated or in the number of security incidents suffered. Hence, the last hypothesis H7d is
rejected.
Finally, none of the hypotheses related to the Authority stakeholder is tenable. The relationship
between AEO compliance and security is rejected, likewise the influence of the perception of
AEO impacts on security and efficiency. The MANOVA results show that there are significant
differences in terms of security investments and security incidents between companies that are
compliant and those who are not compliant with AEO (H8a). However, contrarily to the
hypotheses, companies that comply with AEO or that have a positive perception of the
certification invest more in security but are still more affected by security incidents. Finally no
significant differences were found between companies grouped in terms of their perception of
the AEO impacts on security and efficiency. So hypothesis H8b is rejected. Two issues have to
be noted concerning the Authority stakeholder. First of all we experienced a strong imbalance
between the groups of companies (only 8 companies claimed to be AEO compliant). This
highlights the fact that most probably there are still too many companies that have no knowledge
of AEO and their real estimation of the impacts of AEO may be unreliable. At the same time,
given the novelty of AEO certification, it may be too early to see its real impacts on security.
Secondly, the examination of the size of the companies shows that in general small companies
are not compliant with AEO and also have a negative perception of the certification. This
suggests that the size of the companies is particularly influencial on the factors identified for the
authority stakeholder, AEO compliance and the perception of security and efficiency impacts.
Finally, according to the results of the survey, the Physical Distribution Security System
framework may be updated by removing the Business Security Certification and Authority
actors, since none of the hypotheses formulated could be considered to be tenable. Hence,
according to the updated model, 10 hypotheses and 6 stakeholders/entities influence the security
of physical distribution security.

178
Figure 49: The updated Physical Distribution Security System framework (PDSS) with only six actors.
Licentiate Findings
What are the fundamental stakeholders and interactions within and outside physical distribution
systems from a security perspective?
The findings are outlined in the Physical Distribution Security System (PDSS) in Figure 4, where
eight actors and 19 hypotheses are brought to light as factors influencing the security of physical
distribution networks. More details about this part are already given in the previous section.
What mitigation measures can be implemented today to enhance the security of physical
distribution operations?
This study has the ambition to provide supply chain and security managers with a comprehensive
overview of security solutions including authority regulations, managerial strategies, operative
routines and technical systems (Figure 7). A multi-layered approach is developed where 25
security routines, 28 technologies and 14 managerial strategies are positioned. This framework
may enhance the comprehension and classification of the results as well as it make easier to
identify weak spots in supply chains and related countermeasures. It also makes it possible for
Physical Distribution
Security
Distribution & Transport Operators
Insurance Companies
Security Providers
Cargo Criminals
Contract Regulatory
Associations
Law Enforcement
Agency

179
managers to benchmark their security approaches with those that have been collected in this
research.
How can existing investment and risk models be exploited to estimate the performance of
security solutions and support investment decisions?
This part is split into two sub-sections: the first shows the application of the Quantitative Risk
Assessment (QRA) methodology to evaluate the impact of transport security solutions; the
second demonstrates how the integration of Reliability Block Diagrams (RBD) may enable the
estimation of security measures combined into hybrid systems. The first part reports the
development of an investment model, based on Quantitative Risk Assessment, and its application
on a hypothetical transport assignment.
The second part shows how the combination of security devices may be quantitatively modeled
by combining the Quantitative Risk Assessment approach with Reliability Block Diagrams and
Monte Carlo techniques. This findings include a numerical example showing how to compare
costs and benefits, in the form of risk reductions, of technical security systems for road transport
(i.e. GPS, sound barrier etc.) operations against cargo theft. In particular, 7 security solutions and
their combination against 6 prominent European cargo threats are evaluated and classified in
terms of B/C ratios and NPVs.
8.2 Research Limitations Doctoral Limitations
Diverse limitations may be mentioned as factors influencing the findings of the survey
investigation. The definition and the items used to measure the security of the companies
surveyed is the first limitation. To measure the construct of security that is used in all the
hypotheses formulated in Chapter 4, it has been decided to choose two outcome variables
measuring the magnitude of investments in security and the number of security incidents. These
two measures are believed to provide a sufficient overview of the protection degree of a
company: the budget tells how much a company invests in protection measures and the second
measure tells how effective are the investments of the company in terms of successful security
attacks. However, some limitations should be considered: the first is the precision of the answers,
as we don’t really know if respondents keep track of security budget and number of incidents.
180
Hence, it is difficult to determine whether the numbers provided were rough guesses or were
extracted from accounting documentation or a security database developed by the company. In
addition, if the security budget was extracted from accounting documentation, it is not known
under which headings the companies report security expenditures in their documentation. The
second limitation concerns the fact that administrative costs related to security procedures may
have been difficult to estimate and therefore many companies were just including costs related to
investments in technical solutions. Hence, it is possible that the reported security budgets may
have some degree of uncertainty. Likewise, it is not known if and how well the companies are
keeping track of security incidents. It is well known that many companies have a tendency to
underestimate security incidents because they fear bad reputation, loss of market competitiveness
or insurance premium increments.
Another important limitation to be mentioned is that this investigation is a cross-sectional study
and therefore causality cannot be demonstrated. This implies that all the data presented in this
investigation are collected at a defined time and therefore causality between the factors and
security variables may not be demonstrated.
Finally, the sample used in this investigation is made of a proportionate combination of small,
medium and large enterprises. Hence, these results are not meant to represent medium-large
companies but the population of freight transportation companies in Sweden. According to
Cochran’s formula (Cochran, 1977), it is possible to affirm that the results presented may be
generalized to the population considered in this study with a confidence interval of ±6.71%
(Confidence Level 95%).
Licentiate Limitations
Limitations related to the collection of security measures to protect physical distribution
networks primarily concern the survey methodology. The group of 76 respondents used to collect
the data was made of a convenient sample taken from a research project run in Sweden. So,
despite the sufficient response rate, external validity is a relevant concern for the study.
Other limitations and concerns have arisen also from the study concerning the development of an
investment model. The dominant problem was the lack of statistical data related to the frequency
of the incidents as well as to the impact of the security measures on cargo threats. It appears that
organizations are not keen to compile security statistics or share them with external entities. The

181
main reasons are that such statistics could be used by the companies’ business partners to
demonstrate negligence and prove the liabilities for the damages related to security incidents. As
a consequence, to avert this chain of events, many companies prefer not to track their security
incidents or the impact of the security solutions. Other motivations include the fear of losing
market competitiveness because of bad reputation, or fear of increments of insurance premiums.
Hence, theft statistical data had to be retrieved from a Swedish database provided by the law
enforcement agency. However the degree of accuracy was so low that it was necessary to
combine it with the IIS database provided by TAPA EMEA. Likewise, the lack of a priori
statistics related to the impact of security solutions on cargo threats had to be remedied by
relying exclusively upon experts’ judgments. However, this process was experienced as
complicated and time demanding, since many security experts are mostly used to working with
qualitative tools and felt uncomfortable when asked to express quantitative assessments. In
addition, the collection of experts’ judgments revealed the importance of the number of scenarios
that has to be evaluated by the experts. Given n threats and m security solutions, the total number
of scenarios to be evaluated is given by × , which means that the number of scenarios grows
almost exponentially whenever n or m are increased. Hence, we recommend keeping the number
of security solutions and threats low; otherwise the use of experts could become practically
unfeasible.
Another important limitation of the tool is also its unfeasibility to model or forecast the behavior
of the antagonists. Unlikely safety accidents that are basically random occurrences, security
incidents are attacks perpetrated deliberately against a target (Ekwall, 2009). This means that
criminals have learning capabilities as well as access to technical and financial resources to
deceive the installed security devices. This implies that the investment calculation made in the
QRA, especially on long-term periods, may be misleading since the antagonists’ behavior is not
properly taken into account in the analysis. The RBD techniques may model the behavior of
criminals, since when devices are put in series the degree of security corresponds to the
protection degree of the weakest device. However, the long-term implications concerning the
learning process for deceiving the security measures are not taken into account.
Finally, the economic benefits considered in the investment models concern merely the annual
saved losses determined by threat reductions. However, some of the technologies considered in
this investigation may bring other benefits in the form of higher efficiency or higher
182
transportation quality. For instance, it is well known that track and trace technologies as well as
RFID systems can improve quick responses to variation of freight demand, visibility along
transportation networks and supply chains, or reduce stock outs and unsatisfied customer
demand etc. Hence, the inclusion of the monetary value of these factors may heavily influence
the outcomes of the QRA.
8.3 Research Contribution Overall this investigation offers an overview of the research driven within the supply chain and
transportation security area between 2008 and 2009. A total of 14 articles are identified and
classified into 5 areas: recommendations to enhance security, factors influencing security,
security impacts, research agendas and supply chain risk management.
Another contribution consists of the Physical Distribution Security System (PDSS) where
findings from literature search, interviews and observations are utilized to identify and formulate
a total of 19 hypotheses concerning the factors impacting physical distribution security in terms
of security budget and incidents. Thereafter, the hypotheses are systematically related to eight
actors whose interactions affect the physical distribution security. Finally, the theoretical validity
of the hypotheses is demonstrated by means of a survey study performed with 577 Swedish
physical carriers; 9 of the hypotheses are rejected and 10 are supported. Consequently only 6
actors may be retained in the model (Figure 49).
Finally, this investigation aims to provide a descriptive and empirical study within the supply
chain and transportation security area, a necessity that is also emphasized in existing research
agendas (Staake et al., 2009; Williams et al., 2008). Although some surveys have been conducted
in the field, there is still an imbalance between conceptual and normative studies. In addition, the
majority of these investigations don’t focus on physical distribution networks, but on the goods’
buyers and suppliers relationships.
Examining previous research, it may be found that researchers outside the logistics and supply
chain management discipline have identified the importance of the law enforcement agency but
no empirical data are provided to support its influence on security (Anderson, 2007; Badolato,
2000). Moreover, the importance of collaborative activities is not mentioned in previous
research.

183
The behavior and strategies of distribution and transport operators are also mentioned in previous
research. In particular, globalization, JIT trends and performance conflicts (Crone 2006;
Khemani 2007; Sheffi, 2001; Tarnef, 2006; Williams et al., 2008) are indicated as sources of
security risks. However, no empirical data are provided. It is instead demonstrated that
international sourcing is positively related to preferences for suppliers with higher security
competences (Voss et al., 2009a; Whipple et al., 2009), as well as 1) the positive relationship
between concerns over security incidents and preferences for advanced security and 2) the
positive relationship between concerns over security incidents and willingness to trade off price
for advanced security (Voss et al., 2009).
The relevance of criminals’ actions has also been highlighted by previous research (Ekwall,
2009). Ekwall (2009) identifies three elements characterizing cargo theft: a perpetrator, a supply
chain (the criminals’ target) and the lack of protective measures. Insufficient protection in one of
the links of a supply chain will determine a weak point and the consequent attack (crime
displacement effect). Also in this case, empirical data are not provided to demonstrate how the
behavior of criminals influences physical distribution security.
Contract agreements are also pointed out by diverse researchers. In particular, the importance of
security related partnerships, covering contractual agreements and risk and reward sharings
among actors is highlighted (Autry and Bobbitt, 2008; Voss et al., 2009b; Rice and Spayd, 2005;
Williams et al., 2009). However, only Voss et al. (2009b) provide empirical evidence. In
addition, none of the existing literature mentions the complexity of specifying the security
requirements in contracts.
Finally, many authors indicate the central role of authority certifications as a means to enhance
security in physical distribution (Sheffi, 2001; Rice and Spayd, 2005; Manuj and Mentzer, 2008;
Williams et al., 2009b; Rice and Caniato, 2003; Sheu et al., 2006). However, empirical evidence
is missing.
Hence, to our knowledge, this investigation contributes new factors impacting the security of
physical distribution networks that seem to be still unknown in the academic field. These are
formulated in the hypotheses belonging to the following stakeholders:
• The law enforcement agency.
• Insurance companies.

184
• Security Providers.
• Contract Regulatory Associations.
In addition, this investigation has the purpose to provide empirical evidence to formulated
concepts in previous research. As a result, some of the hypotheses are confirmed, others are
rejected and others present controversial results. The hypotheses that are confirmed are those
related to the impacts of JIT trade-off with security, the specification of security requirements in
contract agreements, and the influence of cargo criminals’ behaviors.
According to the findings of the MANOVA, the hypothesis concerning the customers’
willingness to pay is rejected, which is in opposition with the results of previously performed
survey studies. The hypothesis concerning the impact of the length of distribution networks is
also controversial if compared to previous research. This factor significantly affects security
investments and security budget. However, increments of the security budget don’t correspond to
decrement of security incidents (continental and worldwide distribution networks suffer more
incidents than national and regional networks). Finally, the hypotheses concerning the influence
of security regulations are not supported by the data. Companies that are favorable to and comply
with AEO show higher investments in security. However, the same companies are also affected
by a higher number of security incidents. Moreover the uncertainty about the impact of AEO on
security and efficiency has no significant impact on the security of the distribution impact.
The multi-layered logistics framewors is also an important scientific contribution. Previous
research puts in evidence the importance of increasing supply chain or distribution security either
by introducing mitigation measures or by joining security certifications. However many and
conflicting analyses and recommendations may be found in the literature, in various articles, and
handbooks on security. None of the known literature presents a comprehensive overview of
security solutions, classifies it and integrates it into a logistics-based framework as was done in
the licentiate study (Urciuoli, 2008; Urciuoli, 2009).
The experience related to the application of the investment model to a hypothetical case brings to
light substantial implications for researchers. Previous research within the field of transportation
and logistics lacks applications of tools developed in the safety and risk management discipline
to handle security risks. Hence, the licentiate thesis presents an experimentation of the

185
Quantitative Risk Assessment approach (Kaplan, 1997) and demonstrates its feasibility to
analyse investments in the transport security area.
In addition, the implementation of the Reliability Block Diagram techniques provides a
numerical example showing 1) how the combination of security devices may be evaluated
against cargo threats and 2) how to determine the profitability of the combined devices.
8.4 Practical Contribution This study provides an overview of the magnitude of security investments made by Swedish
physical carriers as well as the number of security incidents suffered. The findings of the survey
show that today the majority of transportation companies do not invest in security (39% of the
respondents), although a minor proportion of respondents (18%) claim to not have any problems
with security threats. At the same time, it is emphasized that companies that have higher
investments in security manage to effectively reduce the number of security incidents. This trend
is particularly accentuated for small and medium enterprises. As a consequence, managers of
these companies are strongly recommended to increase their security budgets to significantly
reduce security attacks. Managers of larger companies are instead recommended to 1) increase
their security budgets, 2) to enhance the understanding of the security threats they are subject to
and thereafter 3) to enhance their abilities to tailor their security investments.
This investigation also has the purpose to enhance our understanding of the factors that
significantly impact security investments in and attacks on transportation networks. The
identification of these factors facilitates the work of identifying actions and recommendations
that may effectively stimulate the increment of security budgets and at the same time reduce the
security incidents in distribution networks. The law enforcement agency together with the
national authority should outline a new legislation framework to improve the prosecution of
cargo criminals. At the same time, the police have to consistently increase the allocation of
resources. Finally, more companies should be engaged in the collaborative activities aiming to
enhance the understanding of security, existing threats and countermeasures, and collaboration
among stakeholders.
Distribution and transport stakeholders are recommended to strive to find out new routines and
procedures that may enhance security while not affecting the efficiency of Just in Time
operations. At the same time, this study shows that operators with longer distribution networks

186
invest more in security. However, the increments of security budgets don’t correspond to
proportionate reductions of security incidents. This implies that whenever cargo is moved across
national borders, as it usually does as a consequence of globalization, security incidents grow in
magnitude and most probably in typology. This suggests the hypothesis that security investments
require being higher and more tailored to crime trends in foreign countries. At the same time, to
eliminate weak points in transportation networks, operators working with urban transportation
are strongly recommended to increase their security investments.
Results from this study raise the hypothesis that security business certifications are not impacting
on the security and number of security incidents of companies. Hence, certification bodies are
recommended to spread the knowledge of their regulations and to intensify their work to
effectively enhance the security of their members.
Results reveal that premium discounts impact the budget allocated by companies to enhance
security as well as the number of incidents suffered. In addition, the findings also show that
today there are still too many companies that are not being offered premium discounts when
enhancing security. Hence, insurance companies are recommended to begin offering premium
discounts to gain advantage on their competitors on the transportation market. At the same time,
the enhancement of the protection of transport assets and operations will be consequently
affected.
Security solution providers are advised to enhance the development of security technologies that
may be easily integrated into organizations, which according to this investigation seems to be a
significant obstacle to investments.
Contract Regulatory Associations play a fundamental role in the security system identified in this
study. This stakeholder is recommended 1) to simplify transportation contracts since many
operators experience them as too complex, 2) to introduce the adoption of security requirements
in standard agreements and 3) to enhance the understanding of companies to share liabilities
related to security incidents. These actions are believed to support the increments in security
investments as well as the reduction of security risks.
Other findings of this investigation show that the AEO certification is still unknown to many
companies; therefore the national Customs are suggested to spread information about this
certification and stimulate companies to comply.
187
The investigation concerning the collection and classification of security solutions in a logistic
multi-layered framework has the ambition to provide supply chain and security managers with a
comprehensive overview of security solutions including authority regulations, managerial
strategies, operative routines and technical systems. It also enables managers to benchmark their
security approaches with those that have been collected in this research. In addition, the
developed multi-layered approach enhances the comprehension and classification of the results
and makes easier to identify weak spots in supply chains and related countermeasures. More
specifically, the analysis of the findings of this investigation allows proposing the following
recommendations for managers:
• Comply with compulsory regulations. Managers are recommended to follow up and
understand the upcoming compulsory regulations being issued by authorities around the
world. Compliance with these will ensure free-flow at Customs and will reduce
uncertainty delays.
• Increase the hardness of supply chains and eliminate weak spots. The multi-layered
logistics framework may be utilized by managers to enhance their understanding of how
to protect physical distribution networks, what elements (horizontal protection), what
layers (vertical protection) and consequently identify weak points and select proper
countermeasures.
• Exploit real time monitoring capabilities. If a security solution is not equipped with
real-time event alerts then decision makers will not be able to detect and respond in
proper time.
• Integrate security and supply chain management. It is fundamental to train and
educate professionals who are able to integrate and harmonize security solutions into
supply chains without affecting efficiency. This integration must be followed by the
education of logistics and supply chain managers within the security area including risk
management and assessment of antagonistic threats (or vice versa). Education should
comprise the entire risk management cycle from the identification and assessment of
risks, their mitigation actions followed by cost-effectiveness analyses, and the
implementation and follow up of security operations
• Ensure the comprehension of security across the whole supply chain. The results
collected with the survey revealed more than a simple collection of security solutions.
188
They disclose how main stakeholders involved in the security discussion are working
with security as well as a fundamental knowledge gap among them. Goods owners and
logistics service providers (LSP) show strong familiarity with security requirements and
security certifications (i.e. C-TPAT, AEO etc.). On the contrary, the interviewed railway
carriers merely have knowledge of security routines. Similarly, road transport carriers
have very scarce knowledge of security measures, and only a few of them are actively
working with customized security services. Thus, it is recommended that managers
ensure the comprehension of security across the whole supply chain (including all the
elements of the physical distribution network and all the layers of the logistics multi-
layered framework). Finally, future research should be carried out to confirm the
hypothesis of this knowledge gap and to discuss on its possible reasons.
The investigation related to the development of the investment model may support practitioners
with the quantification of the impact of security solutions. This approach may enhance their
ability to make decisions about what security solutions they should purchase to protect their
assets. Basically, through the collection of statistical data, causal modelling, experts’ judgements
and computer simulations, capital investment indexes such as B/C ratios and NPVs may be
computed. In addition, the adoption of probability distributions also enhances the understanding
of the degree of uncertainty of the outputs and gives decision makers more information about the
stability of the outcomes. Finally, unlike qualitative approaches that are widely used today
among practitioners, the quantification of the risk reductions may also be utilized by stakeholders
to 1) agree on freight rate increments, 2) agree on premium discounts, and 3) evaluate the impact
of existing business (i.e. TAPA EMEA) and authority certifications (i.e. AEO, C-TPAT, ISPS
etc.).
8.5 Future Research Several research ideas can be drawn from the investigations performed in this doctoral thesis.
These ideas are either closely linked to the survey study presented in this report or found in the
previous work performed in the licentiate thesis.
The first concerns the measures developed for the constructs used for security and the 19 factors
identified in this study. Most of these items were directly derived from the findings of the
explorative study (literature, interviews and observations). So future research should be

189
conducted to validate the indicators used in this investigation and to develop robust indicators to
measure these constructs. In particular, the security construct could be measured by means of the
routine activity theory according to which cargo theft is characterized by three elements: a
perpetrator, a supply chain (the criminals’ target) and lack of protective measures (Ekwall,
2009). Hence, the usage of these three indicators may be justified by a sound theoretical
background.
The survey used in this investigation is a cross-sectional study, which implies that causality
between the factors and the security variables cannot be demonstrated. Therefore, to be able to
test causality, future research should be carried out to perform experimental surveys according to
which the factors and the outcome variables are measured at two different points in time.
The results of this investigation may be generalized to the transportation sector in Sweden
(according to Cochran with a confidence level of ±6.71%). Therefore, to extend the external
validity of the findings, future research attempts should be made to include samples from other
countries.
Similar surveys could be performed to understand the factors driving security for other actors
belonging to the supply chain network, such as goods owners or logistics service providers.
These actors, for practical reasons, were excluded from this analysis, but are still relevant to gain
a complete picture of supply chain security. In addition, such a study could also be exploited to
analyze the security topic under the umbrella of the supply chain risk management construct.
Finally, this investigation reveals that on some occasions higher security investments don’t
correspond to lower security incidents (the distribution length factor as well as compliance with
AEO). As a consequence, future research should be devoted to enhance the understanding of this
controversial relationship and bring to light the underlying dimensions that have determined
these findings.
Other ideas for future research may be linked to the investigations performed in the licentiate
thesis. Future work could be performed to enhance the investment model or to experiment on
real case studies with the QRA and RBD techniques.
From a methodological viewpoint, the application of game theory could be an approach to model
the opportunistic behaviours of criminals and thereby improve the reliability of the profitability

190
indexes for long-term investment periods. Another approach to enhance the ability of the QRA to
model the behaviour of antagonists concerns the gathering of further transport security statistics
that could allow the observation and consequent learning of incident patterns as well as of
attackers’ behaviours. Thereafter, by integrating the QRA approach with economic game theory
it could be possible, first of all, to predict how attackers (cargo criminals) and defenders
(transportation companies) may behave under different security policies; and secondly what will
be the losses or revenues for each of the scenarios developed.
Future research could be performed by exploiting the QRA approach to simulate the impact of
security incidents on supply chains’ efficiency in terms of inventory costs, transportation costs,
number of stock outs, unsatisfied customer demand etc. Existing research has already developed
simulation models showing how supply chain disruptions determine loss of efficiency and
monetary costs to operators. However, since the majority of these works are addressed to safety
accidents, the investigation of the impacts of security incidents could be a relevant issue for
future research.
Finally, due to the lack of cargo crime statistical data, future research should be conducted to
develop tools and metrics to aid operators in the gathering of transport security statistics, in
particular statistics supporting risk management activities (i.e. including cargo crime statistics,
modus operandi, impact of security solutions etc.). The access to detailed statistics may also
facilitate the exploitation of experts’ judgements, especially when wider sets of transport security
scenarios have to be evaluated.

191
REFERENCES Abbott, G., Thomas, R., and Brandt, L. (2003), “Commercium Interrupts: Supply Chain
Responses to Disaster”, Acquisition Policy, Fort McNair, Washington, D.C. 20319-5062.
Agrell, P.J., Lindroth, R. and Norrman A. (2002), Risk, Information and incentives in telecom supply chains, International Journal Production Economics, Vol. 90, N° 1, pp. 1-16.
Aldenderfer, M.S. and Blashfield, R.K., (1984), Cluster Analysis, Series: quantitative applications on the social sciences, Sage Publications, Beverly Hills, CA.
Anderson, B. (2007), “Securing the Supply Chain – Prevent Cargo Theft”, Security, Vol. 44, N°5, pp. 56 - 58.
Armstrong, J. S. and Overton, T. S. (1977) “Estimating non-response bias in mail surveys”, Journal of Marketing Research, Vol. 14, No. 3, pp. 396-402.
Asbjørnslett, B.E. (2008), Assessing the Vulnerability of Supply Chains, Chapter 2, Supply Chain Risk – A Handbook of Assessment, Management and Performance, in International Series in Operations Research & Management Science, Springer US, September 2008.
Autry, C.W. and Bobbitt, L.M., (2008), “Supply Chain Security Orientation: conceptual development and a proposed framework”, The International Journal of Logistics Management, Vol. 19, No. 1, pp. 42 – 64.
Badolato, E.V. (2000), Smart moves against cargo theft, Security Management, Vol. 44, pp. 110-115.
Bergman, B., and Klefsjö, B. (2004), Quality from Customer Need to Customer Satisfaction, Studentlitteratur, Gothenburg.
CBP, (2006), Container Security Initiative, 2006-2011 Strategic Plan, U.S. CUSTOMS and BORDER PROTECTION, http://www.cbp.gov , August 2006.
CBP, (2008), C-TPAT: Customs Trade Partnership Against Terrorism, http://www.cbp.gov/xp/cgov/trade/cargo_security/ctpat/, March 2008.
CFSAN, (2003), Risk Assessment for Food Terrorism and Other Food Safety Concerns, Center for Food Safety and Applied Nutrition, Office of Regulations and Policy, available at http://www.cfsan.fda.gov/~dms/rabtact.html#iib, accessed 5th May 2009.
Chen, Y.H., Chen, S.L., and Wu, C.H., (2005), The impact of stowaways and illegal migrants by sea: a case study in Taiwan, in Proceedings of the International Association of Maritime Universities (IAMU), 24th – 26th October 2005, Ed. Detlef Nielsen, World Maritime University, Malmö, Sweden.
Christopher, M. and Peck, H., (2004), Building the resilient supply chain, The International Journal of Logistics Management, Vol. 15, No. 2, pp. 1 – 14.
Closs, D.J., and McGarrell, E.F., (2004), “Enhancing security throughout the supply chain”, Special Report Series, IBM Center for the business of government, April 2004, available at http://www.businessofgovernment.org/pdfs/Closs_report.pdf (November 2009).
Cochran, W.G., (1977), Sampling Techniques, John Wiley & Sons, Third edition, New York.

192
Coghlan, A. (2006), The medicines that could kill millions, New Scientist, Print Edition, available at http://www.newscientist.com/channel/health/mg19125683.900-the-medicines-that-could-kill-millions.html, accessed August 2008.
CP3 Group (2005), Benefits from implementation of the WCO framework of Standards to Secure and Facilitate Global Trade, http://www.cp3group.com/attachments/WCO_benefits.pdf (accessed April 2005).
CP3 Group (2006), AEO Guidelines, http://www.cp3group.com/attachments/AEO%20guidelines.pdf (accessed 2006).
Craighead, C.W., Blackhurst, J., Rungtusanatham, M.J., and Handfield, R.B. (2007), “The severity of supply chain disruptions: design characteristics and mitigation capabilities”, Decision Sciences, Vol. 38, No. 1, pp. 131-156.
Crone, M. (2006), “Are Global Supply Chain too Risky? A Practitioner's Perspective”, Supply Chain Management Review, Vol. 10, No. 4, pp. 28-30, 32 – 25.
Cupp, O.S., Walker, D.E., and Hillison, J. (2004), “Agro terrorism in the US: key security challenge for the 21st century”, Biosecurity and terrorism, Vol. 2, No. 2, pp. 97-105.
Czaja, R. and Blair, J. (2005), Designing Surveys – a guide to decisions and procedures, Sage Publications, London.
Denzin, N.K. (1970), The research act in sociology: A theoretical introduction to sociological methods, Butterworths, London.
Denzin, N.K., and Lincoln, Y.S. (2000), Handbook of Qualitative Research, Sage Publications, Thousands Oaks, US.
DNV, (2005), Securing the Supply Chain, Report for European Commission DG-TREN, October 2005.
Dunn, S.C., Seaker, R.F., and Waller, M.A. (1994), “Latent variables in business logistics research: scale development and validation”, Journal of Business Logistics, Vol. 15, No. 2, pp. 145 – 172.
Easterby-Smith, M., Thorpe, R., and Lowe, A., (1991), Management Research: An Introduction, London: Sage Publications, Inc.
Elkins, D., Handfield, R.B., Blackhurst, J. and Craighead, W. (2005) “18 Ways to Guard Against Disruption”, Supply Chain Management Review, Vol.9, No. 1, pp. 46-53.
Engler, M. (2007), “Major problems applying wireless security devices in supply chains”, paper presented at International Symposium on Maritime Safety, Security and Environmental Protection, 20th September 2007, Athens (Greece).
Ekwall, D. (2007), Antagonistic Gateways in the Transport Network in a Supply Chain Perspective, Licentiate Dissertation, Chalmers University, Gothenburg 2007.
Ekwall, D. (2009), Managing the Risk for Antagonistic Threats against the Transport Network, Doctorla Dissertation, Chalmers University, Gothenburg, 2009.
Ekwall, D. (2009a), “The Displacement Effect in cargo theft”, International Journal of Physical Distribution and Logistics Management, Vol. 39, No. 1, pp. 47-62.

193
Ekwall, D. and Lumsden, K. (2007), “Differences in stakeholder opinion regarding antagonistic gateways within the transport network”, paper presented at Nofoma, 2007, Reykjavik.
EU Commission (2007), “Authorized Economic Operators – GUIDELINES”, TAXUD/2006/1450 (accessed 29 June 2007).
EU Commission (2008), Public Consultation in preparation of a Legal Proposal to combat counterfeit medicines for Human Use - Key Ideas for better Protection of Patients against the risk of Counterfeit Medicines, avaialbe at http://ec.europa.eu/enterprise/pharmaceuticals/pharmacos/docs/doc2008/2008_03/consult_counterfeit_20080307.pdf, Brussels, accessed 11th March 2008.
European Parliament (2007), Organised theft of commercial vehicles and their loads in the European Union - Rep. No. 610, Directorate General for Internal Policies of the Union, Brussels: ACEA, June 2007.
FBI, (2009), Federal Bureau of Investigation – Amerithrax Investigation, available at http://www.fbi.gov/anthrax/amerithraxlinks.htm, accessed March 2009.
Forza, C. (2009), Surveys, in Researching Operations Management, edited by Christer Karlsson, Taylor & Francis, New York.
Franck, C. (2007), Framework for Supply Chain Risk Management, Supply Chain Forum: An International Journal, Vol. 8, N °2, pp. 2-13.
Giunipero, L.C, and Eltantawy, R.A. (2004), “Securing the upstream supply chain: a risk management approach”, International Journal of Physical Distribution and Logistics Management, Vol. 34, No. 9, pp. 698-713.
Glaser, B.G., and Strauss, A. (1967), The Discovery of Grounded Theory: Strategies for Qualitative Research, Chicago, IL:Aldine.
Gliner, J.A., and Morgan, G.A., (2000), Research Methods in applied settings – An integrated approach to design and analysis, Lawrence Erlbaum Associates, Mahwah.
Groves, R.M., Floyd, J.F.Jr, Couper, M.P., Lepkowski, J.M., Singer, E., and Tourangeau, R., (2004), Survey Methodology, John Wiley and Sons, New Jersey.
Haimes, Y.Y. (1998), Risk Modeling, Assessment, and Management, John Wiley & Sons.
Hair, J.F., Black, B., Barry, B., Anderson, R.E and Tatham, R.L., (2009), Multivariate Data Analysis, 7th Edition, Pearson Prentice Hall.
Hameri, A.P., and Hintsa, J. (2009), “Assessing the drivers of change for cross-border supply chains”, International Journal of Physical Distribution and Logistics Management, Vol. 39, No. 9, pp. 741 – 761.
Harland, C., Brenchley, R., and Walker, H., (2003), Risk in Supply Networks, Journal of Purchasing and Supply Management, Vol. 9, N°2, pp. 51 – 62.
Helmick, J.S., (2008), “Port and maritime security: A research perspective”, Journal of Transportation Security, Vol. 1, pp. 15 – 28.
Hess, K.M. and Wrobleski, H.M., (1996), Introduction to Private Security, 4th ed., West Publishing Company, Saint Paul, MN.

194
Hesse, M. and Rodrigue, J.-P., (2004), The Transport Geography of Logistics and Freight Distribution, Journal of Transport Geography, Vol. 12, N°3, pp. 171-184.
Iarossi, G., (2006), The Power of Survey Design: a users’ guide for managing surveys, interpreting results, and influencing respondents, The World Bank, Washington.
Inglese Hazon, (2008), Il Grande Dizionario Garzanti Hazon, Garzanti Linguistica, collana “I Grandi Dizionari”, 2008.
IMB, (2009), Piracy and armed robbery against ships, Annual Report, January 2009.
IMO, (2009), International Maritime Organization – Safe, Secure and Efficienty Shipping on clean oceans, available at http://www.imo.org/, accessed May 2009.
ISO, (2008), International Organization for Standardization (ISO) – International Standards for Business, Governments and Society, http://www.iso.org/iso/pressrelease.htm?refid=Ref1086, April 2008.
Johansson, H. (2003), Decision Analysis in Fire Safety Engineering - Analysing Investments in Fire Safety, Doctoral Dissertation, Lund 2003.
Jüttner, U., Peck, H., and Christopher, M., (2003), Supply Chain Risk Management: outlining an agenda for future research, International Journal of Logistics: Research and Applications, Vol. 6, N.4, pp. 197 – 210.
Jüttner, U., (2005), Supply chain risk management: understanding the business requirements from a practitioner perspective, International Journal of Logistics Management, Vol. 16, N.1, pp. 120 -141.
Kaiser,, H.F. (1960), An index of factorial simplicity, Psychometrika, Vol. 39, No. 1, pp. 31-36.
Kaplan, S. (1997), The Words of Risk Analysis, Risk Analysis, Vol.17, No. 4.
Khemani, K. (2007), Bringing Rigor to Risk Management, Supply Chain Management Review, Vol. 11, N°2, pp. 67.
Krisinformation, (2009), Glasbitar i livsmedel, available at http://www.krisinformation.se/web/Pages/Page____31016.aspx, accessed March 2009.
Lee, H.L. (2004), Supply Chain Security – Are you ready?, Stanford Global Supply Chain Management Forum, 3rd September 2004.
Lee, H.L. and Whang, S., (2005), “Higher supply chain security with lower costs: lessons from total quality management”, International Journal of Production Economics, Vol. 96, No. 3, pp. 289 – 300.
Liard, M. (2007). Cargo Container Security Tracking - RFID, Cellular and Satellite Communications for Supply Chain Management and National Security, ABI Research
Litwin, M.S., (1995), How to measure survey reliability and validity, Sage Publications, London.
Mangan, J., Lalwani, C. and Gardner, B., (2004), “Combining Quantitative and Qualitative methodologies in logistics research”, International Journal of Physical Distribution and Logistics Management, Vol. 34, No. 7, pp. 565 – 578.
195
Manuj, I. and Mentzer, J.T., (2008), “Global Supply Chain risk management strategies”, International Journal of Physical Distribution and Logistics Management, Vol. 38, No. 3, pp. 192 – 223.
Mason, N. (2004), The risks of stowaways, Loss Prevention, available at http://www.skuld.com/upload/News%20and%20Publications/Publications/Beacon/Beacon%202004%20183/The%20risks%20of%20stowaways.pdf, accessed 5th May 2009.
Mazeradi, A. and Ekwall, D. (2009). ”Impacts of the ISPS code on port activities – A case study on Swedish ports.” World Review of Intermodal Transportation Research, Vol. 2, No. 4, pp. 326-342.
Meixell, M.J. and Norbis, M., (2008), “A review of the transportation mode choice and carrier selection literature”, The International Journal of Logistics Management, Vol. 19, No. 2, pp. 183 -211.
Mentzer, John T., and Flint Daniel J. (1997), “Validity in Logistics Research”, Journal of Business Logistics, Vol. 18, N°1, pp. 199-216.
Moser, C.A., and Kalton, G., (1971), Survey Methods in Social Investigation, Heinemann Educational Book limited, London.
Mullai, Arben (2007), A Risk Analysis Framework for Maritime Transport of Packaged Dangerous Goods - A Validating Demonstration, Doctoral Dissertation, Department of Industrial Management and Logistics, Engineering Logistics.
Norrman, A. and Jansson, U. (2004), Ericsson's proactive supply chain risk management approach after a serious sub-supplier accident, International Journal of Physical Distribution and Logistics Management, Vol. 34, N°5, pp. 434-456.
Norrman, A., and Lindroth, R., (2004), Categorization of Supply Chain Risk and Risk Management, in Clare Brindley (Ed.) Supply Chain Risk, Ashgate, Berlington, 2004.
Näslund, D., (2002), “Logistics needs qualitative research: especially action research”, International Journal of Physical Distribution and Logistics Management, Vol.32, No. 5, pp. 321 - 338.
OECD, (2007), The economic impact of Counterfeiting and Piracy, Organization for Economic Cooperation and Development, available at http://www.oecd.org/dataoecd/13/12/38707619.pdf, accessed 5th May 2009.
Parentela, E., and Cheema, G. (2002), Risk Modeling for commercial goods transport, METRANS Transportation Center.
Paurlaj, A., (2008), Environmental Motivations: a Classification Scheme and its impact on Environmental Strategies, Business Strategy and the Environment, Vol. 18, No. 7, pp. 453 – 468.
Paulsson, U. (2007), On Managing Disruption Risks in the Supply Chain – the DRISC model, Doctoral Dissertation, Department of Industrial Management and Logistics, Engineering Logistics, Lund, 2007.

196
Peleg-Gillai, B., Bhat, G., and Sept, L. (2006), Innovators in Supply Chain Security - Better Security Drives Business Value, Stanford University - The Manufacturing Institute, The Manufacturing Innovation Series.
Prentice, B.E., (2007), “Tangible and intangible benefits of transportation security measures”, Journal of Transportation Security, Vol. 1, pp. 3 – 14.
Rausand M., and Høyland A. (2004), System Reliability Theory – Models, Statistical Methods, and Applications, Wiley Series in Probability and Statistics, New Jersey.
Rice, J.B. Jr., and Caniato, F. (2003), “Building a secure and resilient supply network”, Supply Chain Management Review, Vol. 7, No. 5, pp. 22-30.
Rice, J.B: Jr, and Spayd, P.W., (2005), “Investing in Supply Chain Security: Collateral Benefits”, Special Report Series, IBM Centre for Business of Government, May 2005, available at http://www.businessofgovernment.org/pdfs/Rice_Reprint_Report.pdf (November 2009).
Rodwell, S., Van Eeckhout, P., Reid, A., and Walendowski, J., (2007), Study: Effects of counterfeiting on EU SMEs and a review of various public and private IPR enforcement initiatives and resources, available at http://ec.europa.eu/enterprise/enterprise_policy/industry/doc/Counterfeiting_Main%20Report_Final.pdf, accessed 31st August 2007.
Rolandsson, B. and Ekwall, D. (2008). “Frames of Thefts at Work – Security Culture and the Organisation of responsibility in Transport Networks.” Security Journal advance online publication, November 17, 2008; doi:10.1057/sj.2008.4.
Sherman, L., and Sheth, J.N., (1977), Cluster Analysis and its applications in marketing research, in Multivariate Methods for Market and Survey research, Sheth JN (ed.), American Marketing Association, Chicago, pp. 193-208.
Sheu, C., Lee, L., and Niehoff, B., (2006), “A voluntary logistics security program and international supply chain partnership”, Supply Chain Management: An International Journal, Vol. 11, No. 4, pp- 363 – 374.
Sheffi, Y., (2001), Supply Chain Management under the Threat of International Terrorism, The international Journal of Logistics Management, Vol. 12, No. 2, pp. 1-11.
Staake, T., Thiesse, F. and Fleish, E., (2009), “The emergence of counterfeit trade: a literature review”, European Journal of Marketing, Vol. 43, No. 3/4, pp. 320 – 349.
Stevenson, D.B. (2005). “The impact of ISPS code on seafarers,” International Conference Security of Ships, Ports and Coasts, Halifax/Nova Scotia/Canada.
Strauss, A. and Corbin, J., (1990), Basics of Qualitative Research: Grounded Theory Procedures and Techniques, Newbury Park, CA: Sage Publications, Inc.
TAPA EMEA, (2009), TAPA EMEA – Transported Assets Protection Association, available at http://www.tapaemea.com/public/, accessed May 2009.
Talas, R., and Menachof, D., (2009), ‘The efficient trade-off between security and cost for sea ports: a conceptual model’, International Journal of Risk Assessment and Management, Vol. 13, No.1, pp. 46 – 59.
Tarnef, B. (2006), Combating Cargo Theft, American Agent & Broker, N°10, pp. 32 – 37.

197
Thibault M., Brooks M.R., and Button K.J. (2006), “The Response of the U.S. Maritime Industry to the New Container Security Initiatives”, Transportation Journal, Vol. 45, No. 1, pp. 5–15.
Thomas, D. (2006), Summary and Analysis of eye for transport’s survey: Cargo and Supply Chain Security Trends, Cargo and Supply Chain Security Report, 5th North American Cargo Security Forum.
Urciuoli, L. (2008), “Security in Physical Distribution – Causes, mitigation measures and an investment model”, Licentiate Dissertation, Lund University, Lund 2008.
Urciuoli, L. (2009), “Supply Chain Security – Mitigation measures and logistics multi-layered framework”, Journal of Transportation Security, Vol.3, No.1, pp. 1-28.
Urciuoli, L., and Ekwall, D. (2010), Comparing security and efficiency in logistics business operations – a survey to evaluate the impacts of security and customs certification programs. Submitted to the International Journal of Physical Distribution and Logistics Management.
Urciuoli, L., Sternberg, H., and Ekwall, D., (2010), The effects of security on transport performance, Selected Conference Proceedings World Conference on Transport research, Portugal.
Viswanadham, N., and Gaonkar, R.S., (2007), Risk Management in Global Supply Chain Networks, in Strategies and Tactics in Supply Chain Event Management, Springer, 2007.
Voss, M.D., Closs, D.J., Calantone, R.J., and Helferich, O.K., (2009), The Role of Security in the food supplier selection decision, Journal of Business Logistics, Vol. 30, No. 1, pp- 127 – 155.
Voss, M.D., Whipple, J.M. and Closs, D.J. (2009a), “The Role of Strategic Security: Internal and External Security Measures with Security Performance Implications”, Transportation Journal, Vol. 48, No. 2, pp. 5 – 23.
Wandel, S., Ruijgrok, C, and Nemoto, T. (1991), Relationships Among Shifts in Logistics, Transport, Traffic and Informatics - Driving Forces, Barriers, External Effects and Policy Options in Storhagen, N.G. & Huge, M., Logistiska framsteg, Studentlitteratur.
Williams, Z., Lueg, J.E. and LeMay, S.A. (2008), “Supply Chain Security: an overview and research agenda”, The International Journal of Logistics Management, Vol. 19, No. 2, pp. 254 – 281.
Whipple, J.M., Voss, M.D., and Closs, D.J., (2009), “Supply chain security practices in the food industries – Do firms operating globally and domestically differ?”, International Journal of Physical Distribution and Logistics Management, Vol. 39, No. 7, pp. 574 – 594.
Williams, Z., Ponder, N., and Autry, C.W. (2009a), “Supply Chain Security Culture: measure development and validation”, The International Journal of Logistics Management, Vol. 20, No. 2, pp. 243 – 260.
Williams, Z., Lueg, J.E., Taylor, R.D. and Cook, R. (2009b), “Why all the changes? An institutional theory approach to exploring the drivers of supply chain security (SCS)”, International Journal of Physical Distribution & Logistics Management, Vol. 39, No. 7, pp. 595 – 618.

198
Willys, H.H., and Ortiz, D.S. (2004), Evaluating the Security of the Global Containerized Supply Chain, RAND Corporation, Santa Monica, CA.

199
APPENDIX 1 – Glossary and Abbreviations AEO. Authorized Economic Operator.
AMR. Advance Manifest Rule.
ANOVA. Analysis of Variance.
B/C. Benefits/Costs Ratio.
CBP. Customs and Borders Protection.
CCTV. Closed Circuit Television.
CIM. International Convention concerning the carriage of goods by rail.
CRM. Convention relative au contrat de transport international de Marchandises par route.
CSI. Container Security Initiative.
C-TPAT. Customs Trade Partnership Against Terrorism.
EMEA. Europe Middle East Africa.
FIATA. International Federation of Freight Forwarders Associations.
FSR. Freight Security Requirements.
GSM. Global System for Mobile communication.
GPRS. General Packet Radio Service.
GPS. Global Positioning System.
ICC. International Chamber of Commerce.
IMB. International Maritime Bureau.
IMO. International Maritime Organization.
INCOTERMS. International Commercial Terms.
IR. Infrared.
ISO. International Organization for Standardization.

200
ISPS. International Ship and Port facility Security Code.
JIT. Just In Time.
KMO. Kaiser-Meyer-Olkin measure.
LSP. Logistics Service Provider.
MANOVA. Multivariate Analysis Of Variance.
NPV. Net Present Value.
NSAB. Nordiskt Speditörförbunds Allmänna Bestämmelser.
OECD. Organization of Economic Cooperation and Development.
PCA. Principal Component Analysis.
PDSS. Physical Distribution Security System.
QRA. Quantitative Risk Assessment.
RFID. Radio Frequency Identification.
ROI. Return Of Investment.
SOA. Service Oriented Architecture.
SOLAS. International Convention for the Safety of Life at Sea.
TAPA EMEA. Transported Asset Protection Association.
TQM. Total Quality Management.
TSR. Trucking Security Requirements.

201
APPENDIX 2 – Interview Questions Q1. Could you describe your company and your role within the company?
Q2. What is the vision and goal of your company from a security viewpoint?
Q3. What do you think are the main reasons behind the increased insecurity of supply/distribution chains?
Q3.1. According to your experience, can you describe how cargo criminals behave? Q12. What kind of agreements do you issue when you purchase/sell transportation services?
Q3.2. Do you perceive the standard agreements as complex? Has it ever happened that you preferred a verbal agreement?
Q3.3. Do you specify security requirements in the contracts? What is stated in the contracts in this case?
Q3.4. Is it possible that transport operators prefer to purchase property insurance, taking the risks to pay the premium’s excesses, instead of buying security measures? Do you have any other type of insurances besides the commercial?
Q3.5. Have you got premium reductions from insurances when implementing security solutions?
Q3.6. How do you cooperate with the law enforcement agencies? What do you think about their effort in combating cargo threats?
Q3.7. Do you have knowledge of the upcoming governmental regulations concerning supply chain security? If yes how are you working to meet the AEO requirements?
Q3.8. Do you know TAPA EMEA? Are you a TAPA EMEA member?
Q5. Can you describe the security solutions you have knowledge about?
Q6. Have you ever invested in security?
Q7. What have been/would be the main reasons for investing/not investing in security?
Q7.1. How do you internalize the costs for higher security?
Q7.2. Do you perform investment analyses when purchasing or implementing a security solution?
Q7.3. Do you have specific requirements for the payback period of such investments?

202
APPENDIX 3 – Swedish Business Register Table 99: standard variables included in Swedish Business Register.
Name Description CompanyName The Name of the Company or the Sole trader
FirmDesignation The Sole trader's firm (name of business) and for other legal forms the designation of the head office
StreetAddress Street Address Town Town PostalAddress Postal Address incl c/o address PostalCode Postal Code PostalTown Postal Town Telephone National dialling code + telephone number Email Email contact of the company MunicipalityCode Municipality code which refers to the unit's physical location MunicipalityName Municipality AregionCode Aregion (01-70), regional division based on municipality code AregionName Aregion (01-70), regional division based on municipality code MunHeadOffCode Code which refers to the municipality where the board has its seat MunHeadOffText Municipality where the board has its seat SizeClassCode Size class based on number of employees SizeClassText Size class based on number of employees Activity1 Primary Activity by SE-SIC 2007 Activity2 Subordinate Activity Activity3 Subordinate Activity Activity4 Subordinate Activity Activity5 Subordinate Activity StartupDate Date (yyyymmdd) of registration for VAT/employment taxes LegalFormCode Legal Form NumLocUn Number of local units the company has registred in Sweden NumFirms Number of firms the sole trader has registred
CenturyCode 19=Sole traders born in the 20th century 16=Other legal form than Sole trader
OrgNum
The company's unique identity number or the sole traders social security number excluding the last four digits

203
Table 100: Definition of companies’ categories in the Swedish Business Register.
TRANSPORTATION AND STORAGE DEFINITION
49200 Freight rail transport All freight transport by railway (not including storage, management of terminals and infrastructure, and cargo handling )
49410 Freight transport by road All freight transport by road (not including removal companies, water, timber and waste transportation, terminal operations, packaging and postal service )
50201 Scheduled sea and coastal freight water transport
Scheduled coastal and sea transportation of goods (not including scheduled archipelago goods transport, storage, terminal operations and management (harbours), cargo handling )
50202 Non-scheduled sea and coastal freight water transport
Non-scheduled coastal and sea transportation of goods (not including non-scheduled archipelago goods transportation, storage, terminal operations and management (harbours), cargo handling and cargo ships rental )
50401 Scheduled inland freight water transport
Scheduled inland waterways (rivers, canals, lakes etc.) freight transportation
50402 Non-scheduled inland freight water transport
Non-scheduled inland waterways (rivers, canals, lakes etc.) freight transportation
51211 Scheduled freight air transport Scheduled goods transportation by air.
51212 Non-scheduled freight air transport Non-scheduled goods transportation by air.
52200 Warehousing and storage Silos and granary administration, general warehouses, cold storage etc.
52219 Other service activities incidental to land transportation
Support services to inland transportation of passengers, animals and goods. It includes management of terminals (train stations, bus stations and goods terminals), train railway infrastructure, road infrastructure, taxi stations, shunting yards. Cargo handling is not included.
52220 Service activities incidental to water transportation
Support services to water transportation. This category includes organizations connected to the transportation of passengers, animals and goods by waterways, management of terminals, channels, navigation, pilotage, rescue services, salvage and towing, management of lighthouses. It doesn’t include Cargo handling, 3PLs/4PLs, and management of small boat ports.
52230 Service activities incidental to air transportation
Support services to air transportation including organizations connected to air transportation of passengers, animals and goods, management of airport terminals, airport and ATC (Air Traffic Control), airfield land services.
52241 Harbour cargo handling Cargo handling in harbours. This category includes loading and unloading of goods in the ports as well as stevedoring organizations. Management of terminals is not included.
52249 Other cargo handling Loading and unloading of goods and baggage (except in ports). Management of terminals and loading and unloading operations in ports are not included
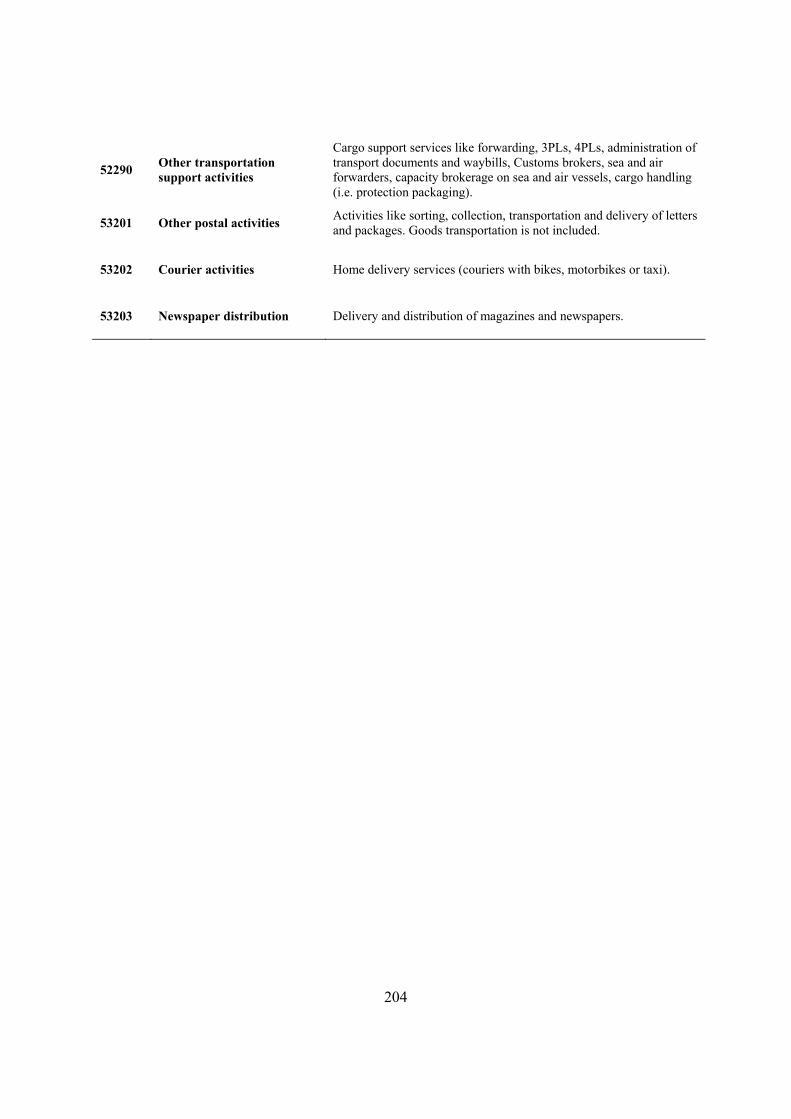
204
52290 Other transportation support activities
Cargo support services like forwarding, 3PLs, 4PLs, administration of transport documents and waybills, Customs brokers, sea and air forwarders, capacity brokerage on sea and air vessels, cargo handling (i.e. protection packaging).
53201 Other postal activities Activities like sorting, collection, transportation and delivery of letters and packages. Goods transportation is not included.
53202 Courier activities Home delivery services (couriers with bikes, motorbikes or taxi).
53203 Newspaper distribution Delivery and distribution of magazines and newspapers.
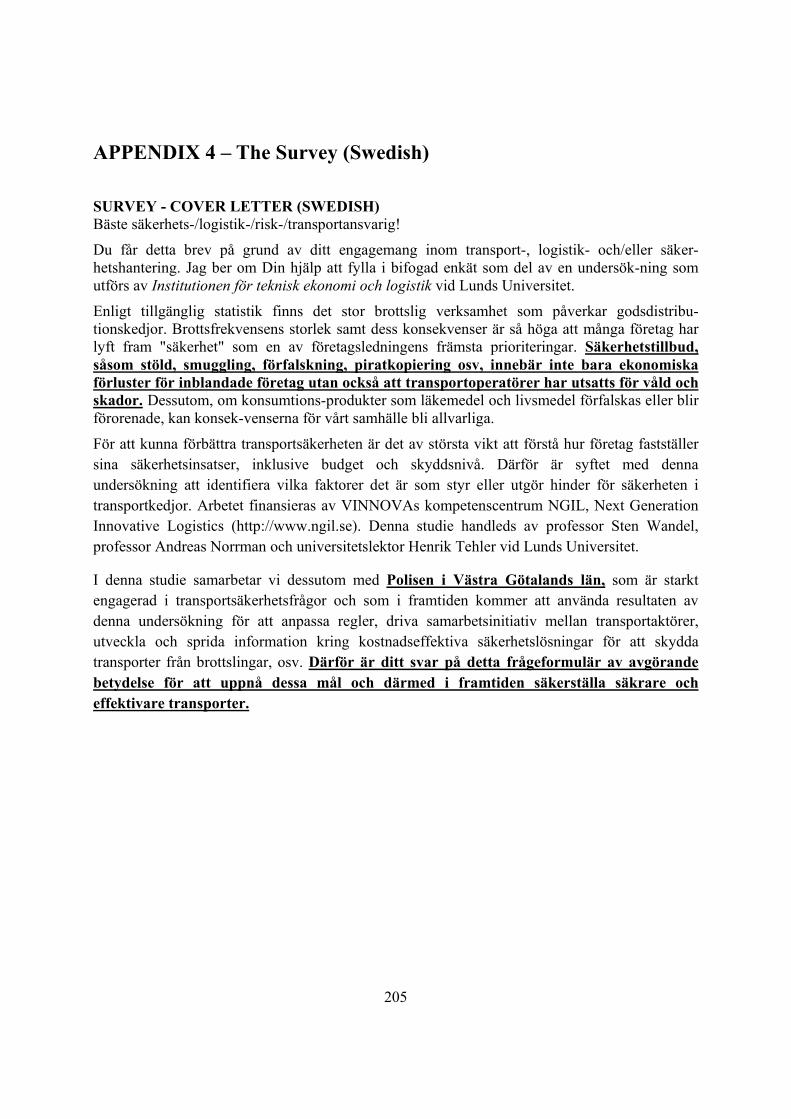
205
APPENDIX 4 – The Survey (Swedish)
SURVEY - COVER LETTER (SWEDISH) Bäste säkerhets-/logistik-/risk-/transportansvarig!
Du får detta brev på grund av ditt engagemang inom transport-, logistik- och/eller säker-hetshantering. Jag ber om Din hjälp att fylla i bifogad enkät som del av en undersök-ning som utförs av Institutionen för teknisk ekonomi och logistik vid Lunds Universitet.
Enligt tillgänglig statistik finns det stor brottslig verksamhet som påverkar godsdistribu-tionskedjor. Brottsfrekvensens storlek samt dess konsekvenser är så höga att många företag har lyft fram "säkerhet" som en av företagsledningens främsta prioriteringar. Säkerhetstillbud, såsom stöld, smuggling, förfalskning, piratkopiering osv, innebär inte bara ekonomiska förluster för inblandade företag utan också att transportoperatörer har utsatts för våld och skador. Dessutom, om konsumtions-produkter som läkemedel och livsmedel förfalskas eller blir förorenade, kan konsek-venserna för vårt samhälle bli allvarliga.
För att kunna förbättra transportsäkerheten är det av största vikt att förstå hur företag fastställer sina säkerhetsinsatser, inklusive budget och skyddsnivå. Därför är syftet med denna undersökning att identifiera vilka faktorer det är som styr eller utgör hinder för säkerheten i transportkedjor. Arbetet finansieras av VINNOVAs kompetenscentrum NGIL, Next Generation Innovative Logistics (http://www.ngil.se). Denna studie handleds av professor Sten Wandel, professor Andreas Norrman och universitetslektor Henrik Tehler vid Lunds Universitet.
I denna studie samarbetar vi dessutom med Polisen i Västra Götalands län, som är starkt engagerad i transportsäkerhetsfrågor och som i framtiden kommer att använda resultaten av denna undersökning för att anpassa regler, driva samarbetsinitiativ mellan transportaktörer, utveckla och sprida information kring kostnadseffektiva säkerhetslösningar för att skydda transporter från brottslingar, osv. Därför är ditt svar på detta frågeformulär av avgörande betydelse för att uppnå dessa mål och därmed i framtiden säkerställa säkrare och effektivare transporter.

206
VIKTIGT! Alla svar är konfidentiella. Ditt namn, namnet på ditt företag samt dina kontaktuppgifter kommer att hållas strikt konfidentiella, och de kommer inte att avslöjas för tredje part eller i någon typ av publikation eller media. Det tar mellan 15 och 20 minuter att fylla i enkäten. Vi vill ha ditt svar senast den 30:e april 2010. Som en uppskattning för din hjälp kommer du att få en kopia av resultaten av denna analys (var vänlig specificera i frågeformuläret den e-postadress som resultaten ska skickas till).
Använd svart eller blå bläckpenna för att fylla i enkäten. Sätt ett kryss för varje fråga om inget annat anges. Om du sätter ett kryss fel, fyll i den felaktiga rutan så att den blir helt fylld, och sätt ett nytt kryss i den rätta rutan. När du är färdig, lägg enkäten ovikt i det frankerade kuvertet som ingår i paketet du fick, klistra igen det och skicka allt via vanlig post.
Du är välkommen att kontakta författaren nedan om du har några kommentarer eller frågor.
Tack på förhand för din hjälp!
Vänliga hälsningar,
Luca Urciuoli
MSc (Eng), Lic.Tek. Luca Urciuoli Doktorand Inst för Teknisk Ekonomi och Logistik Teknisk logistik Tel. xxxx xx xx xx [email protected]

207
ALMÄNNA FRÅGOR Typ av företag: [1] Järnvägstransport [5] Posttransport [9] Vet ej
[2] Vägtransport [6] Kurir [10] Vill inte svara
[3] Sjötransport [7] Tidningsutdelare
[4] Flygtransport [8] Annat:
Företagets årliga försäljning (kronor): [1] Mindre än 500 000 [5] Från till 10 miljoner till 20 miljoner [9] Mer än 1 miljard
[2] Från 500,000 til 1 miljon [6] Från 20 miljoner till 100 miljoner [10] Vet ej
[3] Från 1 miljon till 5 miljoner [7] Från 100 miljoner till 500 miljoner [11] Vill inte svara
[4] Från 5 miljoner till 10 miljoner [8] Från 500 miljoner till 1 miljard
Antal anställda: [1] 0 anställda [4] 50 till 250 [7] Mer än 1000
[2] 1 till 10 [5] 251 till 500 [8] Vet ej
[3] 10 till 49 [6] 501 till 1000 [9] Vill inte svara
Position i företaget: [1] Logistikchef [4] VD/Ägare [7] Vill inte svara
[2] Transportplanerare [5] Driftschef [8] Annat
[3] Trafikledare [6] Säkerhetsansvarig
Huvudsakliga typer av produkter som transporteras (flera val är möjliga): [1] Livsmedel [4] Fordonselektronik [7] Annat:
[2] Kläder [5] Fordonskemikalier [8] Vet ej
[3] Läkemedel [6] Kemikalier [9] Vill inte svara
Ange i vilket län som din huvudverksamhet är placerad
[1] Blekinge län [10] Norrbottens län [19] Västerbottens län [2] Dalarnas län [11] Örebro län [20] Västernorrlands län [3] Gävleborgs län [12] Östergötlands län [21] Västmanlands län [4] Gotlands län [13] Skåne län [22] Västra Götalands län [5] Hallands län [14] Södermanlands län [23] Vill inte svara [6] Jämtlands län [15] Stockholms län [7] Jönköpings län [16] Uppsala län [8] Kalmar län [17] Värmlands län [9] Kronobergs län [18] Norrbottens län E-postadress (ange här din e-postadress om du vill ha en kopia av resultaten):
Ange här:
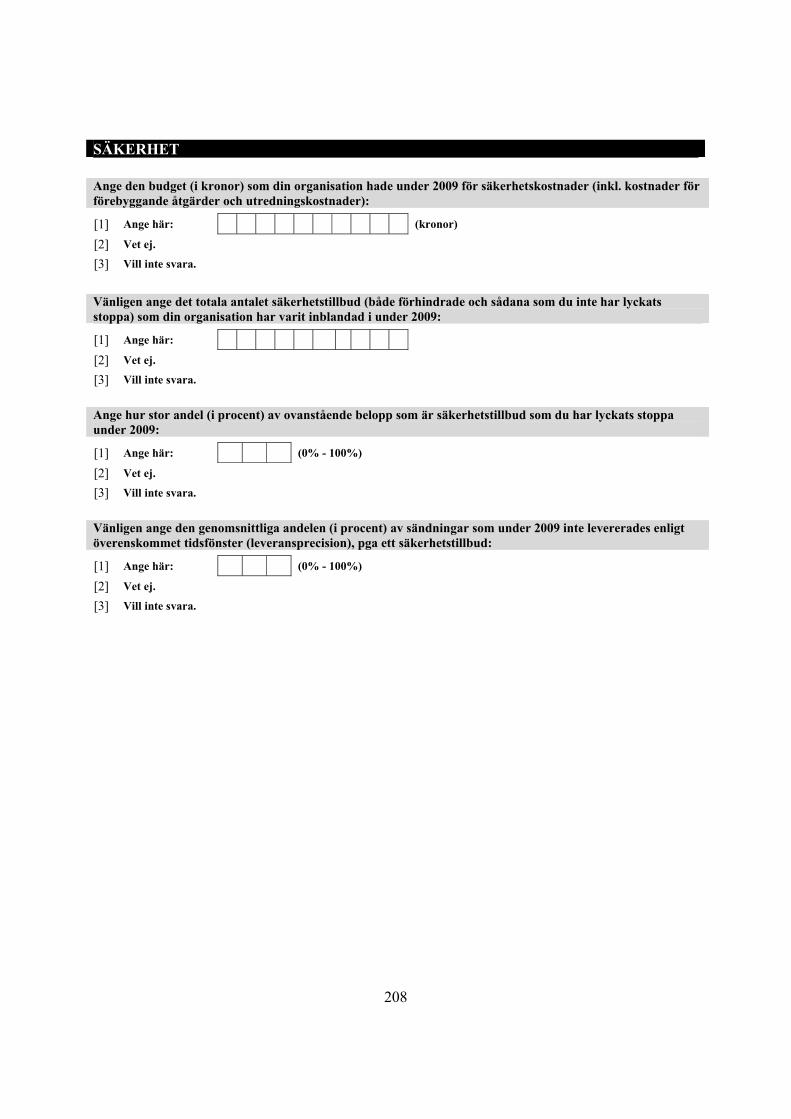
208
SÄKERHET Ange den budget (i kronor) som din organisation hade under 2009 för säkerhetskostnader (inkl. kostnader för förebyggande åtgärder och utredningskostnader):
[1] Ange här: (kronor)
[2] Vet ej.
[3] Vill inte svara.
Vänligen ange det totala antalet säkerhetstillbud (både förhindrade och sådana som du inte har lyckats stoppa) som din organisation har varit inblandad i under 2009:
[1] Ange här:
[2] Vet ej.
[3] Vill inte svara.
Ange hur stor andel (i procent) av ovanstående belopp som är säkerhetstillbud som du har lyckats stoppa under 2009:
[1] Ange här: (0% - 100%)
[2] Vet ej.
[3] Vill inte svara.
Vänligen ange den genomsnittliga andelen (i procent) av sändningar som under 2009 inte levererades enligt överenskommet tidsfönster (leveransprecision), pga ett säkerhetstillbud:
[1] Ange här: (0% - 100%)
[2] Vet ej.
[3] Vill inte svara.

209
BROTTSBEKÄMPANDE ARBETE
Under 2009...
Håller inte alls m
ed
Håller inte m
ed
Varken instäm
mer eller inte instäm
mer
Håller m
ed
Håller helt m
ed
Kan inte svara
har den svenska åklagarmyndighetens ansträngning att åtala transportbrottslingar varit mycket bra. [1] [2] [3] [4] [5] [6]
när brottslingar som angriper vår verksamhet har gripits, har det tagit lång tid innan de frigivits från fängelset. [1] [2] [3] [4] [5] [6]
har transportbrottslingar alltid snabbt gripits och ställts till svars på ett korrekt sätt av polis och åklagare. [1] [2] [3] [4] [5] [6]
har vårt förtroende för de ansträngningar som de brottsbekämpande myndigheterna vidtagit för att åtala brottslingar ökat. [1] [2] [3] [4] [5] [6]
har vi märkt att brottslingar som en gång gripits sedan har hållit sig borta från vår verksamhet. [1] [2] [3] [4] [5] [6]
har vi märkt att transportbrott alltid har fått hårda straff. [1] [2] [3] [4] [5] [6]
har vår organisation alltid rapporterat säkerhetstillbud till de brottsbekämpande myndigheterna. [1] [2] [3] [4] [5] [6]
har de brottsbekämpande myndigheternas insatser att gripa brottslingar varit mycket bra. [1] [2] [3] [4] [5] [6]
har de brottsbekämpande myndigheterna avsatt tillräckliga resurser för att bekämpa transportbrottslighet. [1] [2] [3] [4] [5] [6]
har vi alltid rapporterat säkerhetstillbud till de brottsbekämpande myndigheterna eftersom vi har förtroende för att lämpliga åtgärder mot brottslingar kommer att vidtas.
[1] [2] [3] [4] [5] [6]
hade rapportering av säkerhetstillbud högsta prioritet i vår organisation. [1] [2] [3] [4] [5] [6]
märkte vi att ju mer vi rapporterade säkerhetstillbud desto bättre har insatserna från de brottsbekämpande myndigheterna varit. [1] [2] [3] [4] [5] [6]
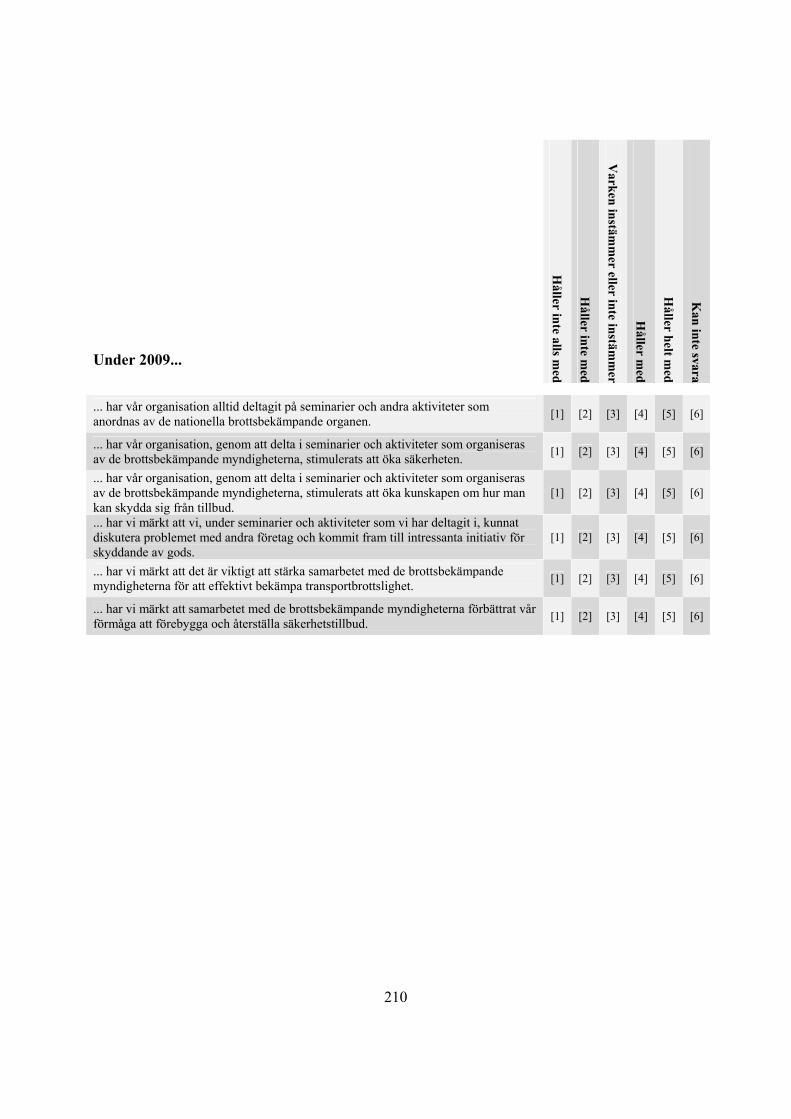
210
Under 2009...
Håller inte alls m
ed
Håller inte m
ed
Varken instäm
mer eller inte instäm
mer
Håller m
ed
Håller helt m
ed
Kan inte svara
... har vår organisation alltid deltagit på seminarier och andra aktiviteter som anordnas av de nationella brottsbekämpande organen. [1] [2] [3] [4] [5] [6]
... har vår organisation, genom att delta i seminarier och aktiviteter som organiseras av de brottsbekämpande myndigheterna, stimulerats att öka säkerheten. [1] [2] [3] [4] [5] [6]
... har vår organisation, genom att delta i seminarier och aktiviteter som organiseras av de brottsbekämpande myndigheterna, stimulerats att öka kunskapen om hur man kan skydda sig från tillbud.
[1] [2] [3] [4] [5] [6]
... har vi märkt att vi, under seminarier och aktiviteter som vi har deltagit i, kunnat diskutera problemet med andra företag och kommit fram till intressanta initiativ för skyddande av gods.
[1] [2] [3] [4] [5] [6]
... har vi märkt att det är viktigt att stärka samarbetet med de brottsbekämpande myndigheterna för att effektivt bekämpa transportbrottslighet. [1] [2] [3] [4] [5] [6]
... har vi märkt att samarbetet med de brottsbekämpande myndigheterna förbättrat vår förmåga att förebygga och återställa säkerhetstillbud. [1] [2] [3] [4] [5] [6]

211
DISTRIBUTIONS- OCH TRANSPORTOPERATÖRER När du förbättrar säkerheten, vad är den genomsnittliga prisökning som accepteras av dina kunder (vänligen hänvisa till den genomsnittliga prisökningen som ni har kommit överens om under 2009)?
[1] Ange här ökningen per sänding: (0% - 100%)
[2] Vet ej.
[3] Vill inte svara.
Under 2009...
Håller inte alls m
ed
Håller inte m
ed
Varken instäm
mer eller
inte instäm
mer
Håller m
ed
Håller helt m
ed
Kan inte svara
... begärde våra kunder ofta högre säkerhet men ville inte betala för det. [1] [2] [3] [4] [5] [6]
... märkte vi att det är svårt att införa säkerhetsåtgärder eftersom vi inte hade råd med dem. [1] [2] [3] [4] [5] [6]
... märkte vi att vi inte kunde höja våra priser eftersom kunderna inte var villiga att betala för säkerheten. [1] [2] [3] [4] [5] [6]
... insåg vi att de marginella intäkter som vi har i vår verksamhet gör det svårt att investera i säkerhet. [1] [2] [3] [4] [5] [6]
... har vår organisation fortsatt att vara konkurrenskraftig på marknaden trots att vi inte investerar i säkerhet. [1] [2] [3] [4] [5] [6]
... var andelen kunder som är villiga att betala för säkrare transporter mycket låg. [1] [2] [3] [4] [5] [6]
... har vi haft svårigheter att kontrollera säkerheten eftersom vår organisation har en hög grad av Just In Time (JIT). [1] [2] [3] [4] [5] [6]
... hände det ofta att fordon blev angripna medan de väntade på att lossa vid en terminal. [1] [2] [3] [4] [5] [6]
... har tillämpningen av JIT-principen ökat risken för brottsliga angrepp. [1] [2] [3] [4] [5] [6]
... har vi varit tvungna att balansera säkerhet mot JIT-effektivitet. [1] [2] [3] [4] [5] [6]
...har vi insett att JIT-principen ökar godsflödet på vägarna och därmed även antal säkerhetstillbud. [1] [2] [3] [4] [5] [6]
... var det stora dilemmat inom vår organisation om vi bör prioritera JIT-principen eller säkerhet. [1] [2] [3] [4] [5] [6]

212
Välj nedan det alternativ som bäst karaktäriserar den genomsnittliga sträcka som dina fordon kör: [1] Inom stad [5] Hela världen
[2] Inom regionen [6] Vet ej
[3] Inom landet [7] Vill inte svara
[4] Kontinentalt [8] Ej tillämpligt
Välj en av följande säkerhetsåtgärder (svar kopplas till efterföljande fråga):
[1] GPS Track and Trace [5] Kontroll av anställdas bakgrund [9] Fordons-/Containerlarm
[2] Mekaniska Lås [6] Elektroniska sigill. [10] Tanklockslås [3] Skåp med hårda väggar [7] VHF tracker [11] Annan: [4] Ljudbarriär [8] Startspärr för fordonet
Införandet av ovan vald säkerhetslösning kommer ...
Håller inte alls m
ed
Håller inte m
ed
Varken instäm
mer eller inte instäm
mer
Håller m
ed
Håller helt m
ed
Kan inte svara
... att negativt påverka kundtillfredsställelsen. [1] [2] [3] [4] [5] [6]
... att ha negativ inverkan på punktliga leveranser. [1] [2] [3] [4] [5] [6]
... öka våra kostnader för arbetskraft. [1] [2] [3] [4] [5] [6]
... öka våra administrativa kostnader. [1] [2] [3] [4] [5] [6]
... att göra vårt arbete för att tillfredsställa kunderna svårare. [1] [2] [3] [4] [5] [6]
... oundvikligen att öka leveransförseningar. [1] [2] [3] [4] [5] [6]
... oundvikligen att öka mängden rutiner som operatörerna måste följa. [1] [2] [3] [4] [5] [6]
... att göra transportoperatörernas arbetsmiljö för komplicerad och resurskrävande. [1] [2] [3] [4] [5] [6]
... oundvikligen att öka mängden teknik som operatörerna måste lära sig och använda varje dag. [1] [2] [3] [4] [5] [6]
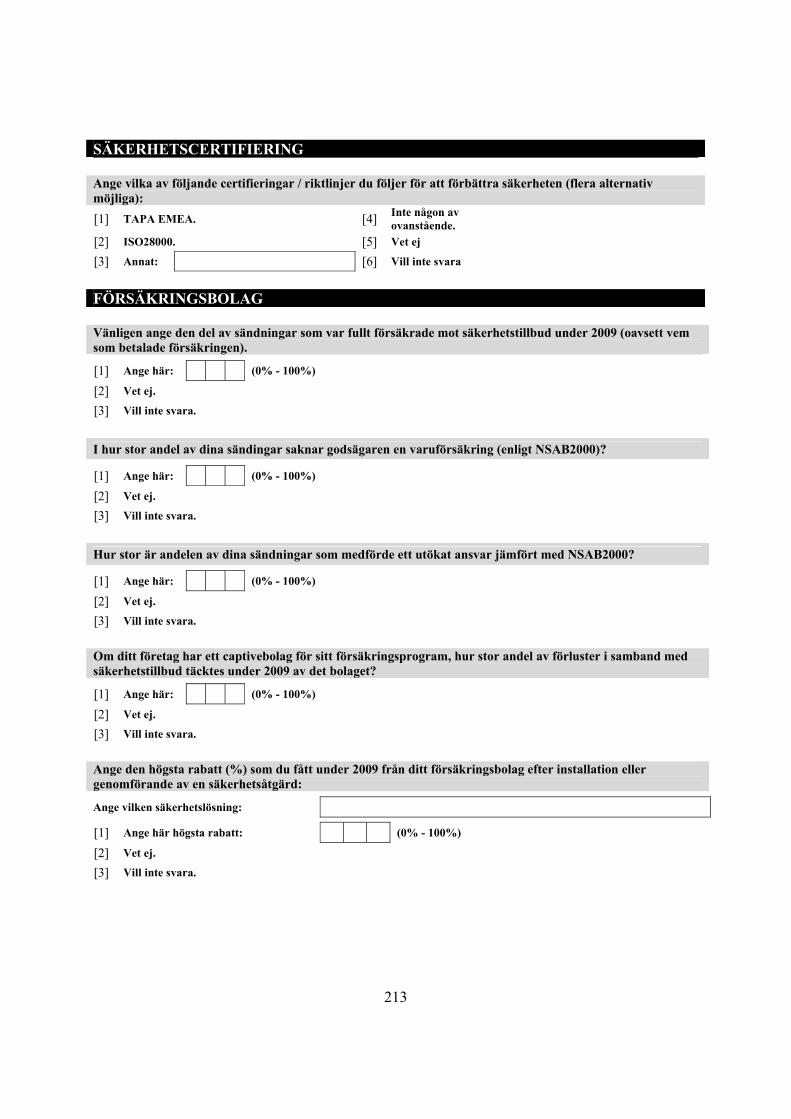
213
SÄKERHETSCERTIFIERING Ange vilka av följande certifieringar / riktlinjer du följer för att förbättra säkerheten (flera alternativ möjliga): [1] TAPA EMEA. [4] Inte någon av
ovanstående.
[2] ISO28000. [5] Vet ej
[3] Annat: [6] Vill inte svara
FÖRSÄKRINGSBOLAG Vänligen ange den del av sändningar som var fullt försäkrade mot säkerhetstillbud under 2009 (oavsett vem som betalade försäkringen).
[1] Ange här: (0% - 100%)
[2] Vet ej.
[3] Vill inte svara.
I hur stor andel av dina sändingar saknar godsägaren en varuförsäkring (enligt NSAB2000)?
[1] Ange här: (0% - 100%)
[2] Vet ej.
[3] Vill inte svara.
Hur stor är andelen av dina sändningar som medförde ett utökat ansvar jämfört med NSAB2000?
[1] Ange här: (0% - 100%)
[2] Vet ej.
[3] Vill inte svara.
Om ditt företag har ett captivebolag för sitt försäkringsprogram, hur stor andel av förluster i samband med säkerhetstillbud täcktes under 2009 av det bolaget?
[1] Ange här: (0% - 100%)
[2] Vet ej.
[3] Vill inte svara.
Ange den högsta rabatt (%) som du fått under 2009 från ditt försäkringsbolag efter installation eller genomförande av en säkerhetsåtgärd:
Ange vilken säkerhetslösning:
[1] Ange här högsta rabatt: (0% - 100%)
[2] Vet ej.
[3] Vill inte svara.

214
Håller inte alls m
ed
Håller inte m
ed
Varken instäm
mer eller inte instäm
mer
Håller m
ed
Håller helt m
ed
Kan inte svara
Försäkringar är den bästa lösningen för att täcka ekonomiska förluster vid säkerhetstillbud. [1] [2] [3] [4] [5] [6]
Vår organisation har omfattande användning av kommersiella försäkringar för att täcka förluster i samband med säkerhetstillbud. [1] [2] [3] [4] [5] [6]
För att täcka förluster i samband med säkerhetstillbud har vår organisation ett captivebolag för sitt försäkringsprogram. [1] [2] [3] [4] [5] [6]
Vår organisation använder sig av försäkringar för att täcka direkta och indirekta förluster orsakade av säkerhetstillbud. [1] [2] [3] [4] [5] [6]
Alla de ekonomiska förluster som uppkommer i samband med säkerhetstillbud omfattas av våra försäkringar. [1] [2] [3] [4] [5] [6]
Genom att teckna försäkringar kommer vi aldrig att förlora pengar i händelse av tillbud. [1] [2] [3] [4] [5] [6]
Vår organisation får premierabatter från försäkringsbolag när skyddsåtgärder genomförs. [1] [2] [3] [4] [5] [6]
Det är lätt att komma överens om premierabatter med försäkringsbolag. [1] [2] [3] [4] [5] [6]
Att diskutera premierabatter med vårt försäkringsbolag är aldrig en tids- och resursförlust. [1] [2] [3] [4] [5] [6]
Att installera säkerhetsteknik kommer att hjälpa organisationen att spara pengar på försäkringspremien. [1] [2] [3] [4] [5] [6]
Att genomföra säkerhetsrutiner gör att vår organisation sparar pengar på försäkringspremien. [1] [2] [3] [4] [5] [6]
Premierabatter erbjuds alltid organisationer som arbetar aktivt med säkerhet. [1] [2] [3] [4] [5] [6]
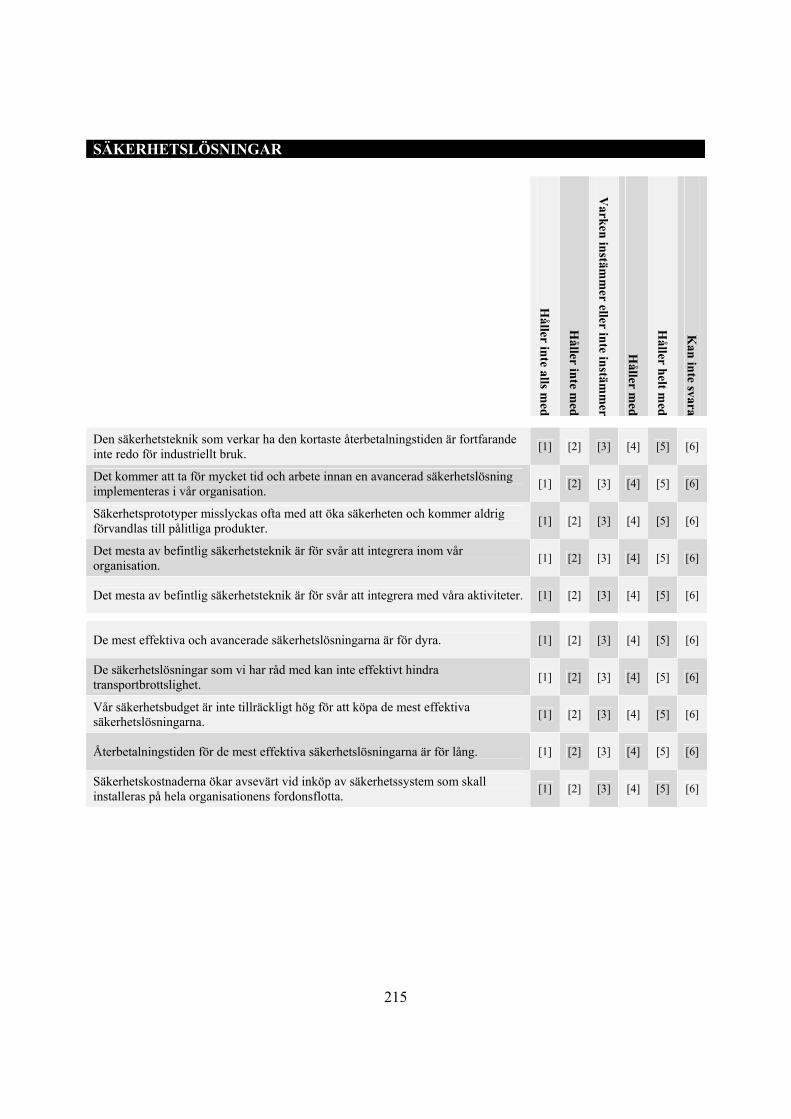
215
SÄKERHETSLÖSNINGAR
Håller inte alls m
ed
Håller inte m
ed
Varken instäm
mer eller inte instäm
mer
Håller m
ed
Håller helt m
ed
Kan inte svara
Den säkerhetsteknik som verkar ha den kortaste återbetalningstiden är fortfarande inte redo för industriellt bruk. [1] [2] [3] [4] [5] [6]
Det kommer att ta för mycket tid och arbete innan en avancerad säkerhetslösning implementeras i vår organisation. [1] [2] [3] [4] [5] [6]
Säkerhetsprototyper misslyckas ofta med att öka säkerheten och kommer aldrig förvandlas till pålitliga produkter. [1] [2] [3] [4] [5] [6]
Det mesta av befintlig säkerhetsteknik är för svår att integrera inom vår organisation. [1] [2] [3] [4] [5] [6]
Det mesta av befintlig säkerhetsteknik är för svår att integrera med våra aktiviteter. [1] [2] [3] [4] [5] [6]
De mest effektiva och avancerade säkerhetslösningarna är för dyra. [1] [2] [3] [4] [5] [6]
De säkerhetslösningar som vi har råd med kan inte effektivt hindra transportbrottslighet. [1] [2] [3] [4] [5] [6]
Vår säkerhetsbudget är inte tillräckligt hög för att köpa de mest effektiva säkerhetslösningarna. [1] [2] [3] [4] [5] [6]
Återbetalningstiden för de mest effektiva säkerhetslösningarna är för lång. [1] [2] [3] [4] [5] [6]
Säkerhetskostnaderna ökar avsevärt vid inköp av säkerhetssystem som skall installeras på hela organisationens fordonsflotta. [1] [2] [3] [4] [5] [6]

216
BROTTSLINGAR
Håller inte alls m
ed
Håller inte m
ed
Varken instäm
mer eller inte instäm
mer
Håller m
ed
Håller helt m
ed
Kan inte svara
Det spelar ingen roll hur mycket skydd vi upprättar på våra tillgångar, kriminella kommer alltid att hitta sätt att slå till mot oss. [1] [2] [3] [4] [5] [6]
Vår organisation har erfarenhet av att brottslingarna snabbt lär sig hur man kan överlista nya skyddsåtgärder. [1] [2] [3] [4] [5] [6]
De kriminella gruppernas organisation är alltför avancerad för att bekämpas endast med genomförande av säkerhetsåtgärder (både tekniska och icke tekniska). [1] [2] [3] [4] [5] [6]
De flesta av säkerhetstillbuden begås med hjälp av insiders som vet vilka säkerhetsåtgärder vi använder. [1] [2] [3] [4] [5] [6]
Idag finns det ingen optimal teknik eller metod för att effektivt hindra transportbrottslighet. [1] [2] [3] [4] [5] [6]
KONTRAKTLAGSTIFTNING Ange hur stor andel (%) av kontrakt som slutits av företaget under 2009, där ansvar fördelas mellan de inblandade parterna (annat än vad som beskrivits i NSAB2000).
[1] Ange här: (0% - 100%).
[2] Vet ej.
[3] Vill inte svara.
Vänligen ange den del av alla avtal som organisationen år 2009 endast slöt muntligt med kunderna.
[1] Ange här: (0% - 100%).
[2] Vet ej.
[3] Vill inte svara.
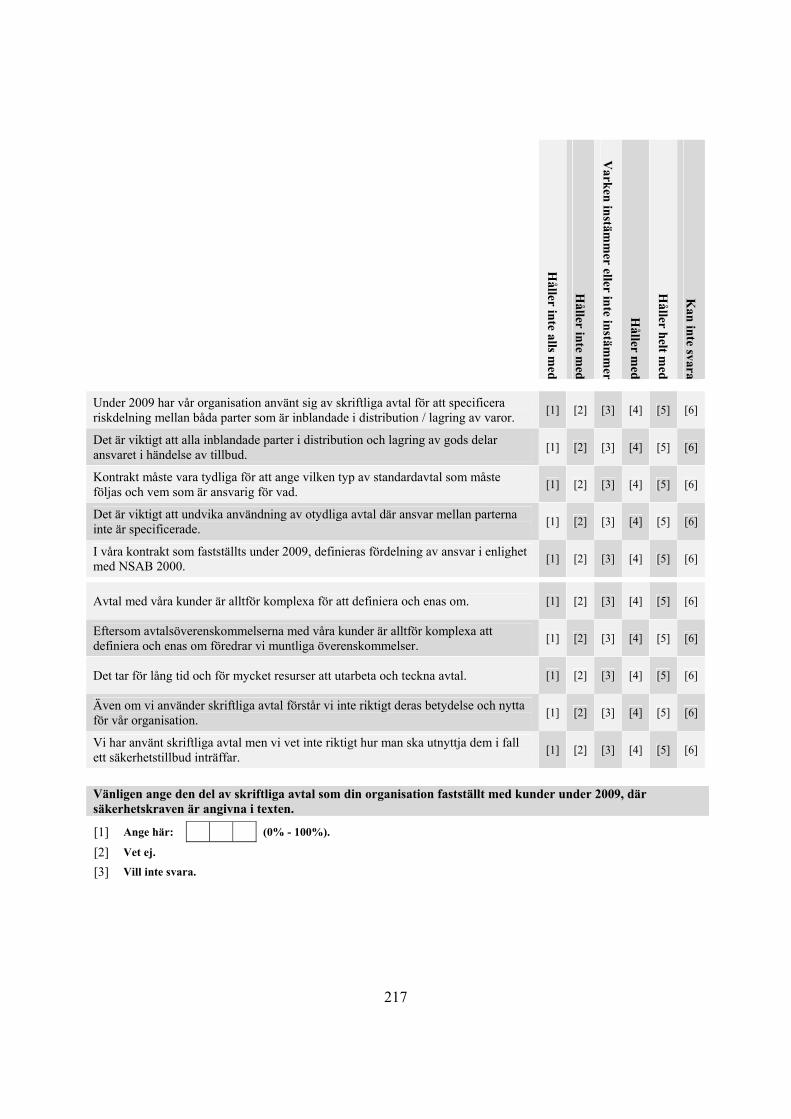
217
Håller inte alls m
ed
Håller inte m
ed
Varken instäm
mer eller inte instäm
mer
Håller m
ed
Håller helt m
ed
Kan inte svara
Under 2009 har vår organisation använt sig av skriftliga avtal för att specificera riskdelning mellan båda parter som är inblandade i distribution / lagring av varor. [1] [2] [3] [4] [5] [6]
Det är viktigt att alla inblandade parter i distribution och lagring av gods delar ansvaret i händelse av tillbud. [1] [2] [3] [4] [5] [6]
Kontrakt måste vara tydliga för att ange vilken typ av standardavtal som måste följas och vem som är ansvarig för vad. [1] [2] [3] [4] [5] [6]
Det är viktigt att undvika användning av otydliga avtal där ansvar mellan parterna inte är specificerade. [1] [2] [3] [4] [5] [6]
I våra kontrakt som fastställts under 2009, definieras fördelning av ansvar i enlighet med NSAB 2000. [1] [2] [3] [4] [5] [6]
Avtal med våra kunder är alltför komplexa för att definiera och enas om. [1] [2] [3] [4] [5] [6]
Eftersom avtalsöverenskommelserna med våra kunder är alltför komplexa att definiera och enas om föredrar vi muntliga överenskommelser. [1] [2] [3] [4] [5] [6]
Det tar för lång tid och för mycket resurser att utarbeta och teckna avtal. [1] [2] [3] [4] [5] [6]
Även om vi använder skriftliga avtal förstår vi inte riktigt deras betydelse och nytta för vår organisation. [1] [2] [3] [4] [5] [6]
Vi har använt skriftliga avtal men vi vet inte riktigt hur man ska utnyttja dem i fall ett säkerhetstillbud inträffar. [1] [2] [3] [4] [5] [6]
Vänligen ange den del av skriftliga avtal som din organisation fastställt med kunder under 2009, där säkerhetskraven är angivna i texten.
[1] Ange här: (0% - 100%).
[2] Vet ej.
[3] Vill inte svara.

218
Håller inte alls m
ed
Håller inte m
ed
Varken instäm
mer eller inte instäm
mer
Håller m
ed
Håller helt m
ed
Kan inte svara
Under 2009 har våra kunder alltid angett i avtalen vilka säkerhetskrav som bör tillämpas. [1] [2] [3] [4] [5] [6]
Det är viktigt att specificera säkerhetskraven för att klargöra skyddsgraden som behövs under distribution / lagring av varor. [1] [2] [3] [4] [5] [6]
Under 2009 har de flesta av våra kunder bett att specificera säkerhetskraven i avtalen. [1] [2] [3] [4] [5] [6]
Under 2009 har vår organisation alltid föreslagit detaljerad beskrivning av säkerhetskrav i avtal. [1] [2] [3] [4] [5] [6]
Under 2009 har både vår organisation och våra kunder enkelt kommit överens om hur man specificerar säkerhetskraven i avtalen. [1] [2] [3] [4] [5] [6]
Under 2009 har vi haft svårigheter att komma överens med våra partners om vilka säkerhetskrav som bör anges i avtal. [1] [2] [3] [4] [5] [6]
Överenskommelseprocessen om säkerhetskrav i avtal tar för mycket tid och resurser från vår organisation. [1] [2] [3] [4] [5] [6]
Vi föredrar att undvika att specificera säkerhetskrav i avtal eftersom det är alltför komplicerat. [1] [2] [3] [4] [5] [6]
Vi vet inte riktigt hur man ska specificera säkerhetskrav eftersom det är svårt att uppskatta effekterna på säkerhet för de utvalda åtgärderna. [1] [2] [3] [4] [5] [6]
Under 2009 har vi och våra kunder ofta haft olika åsikter om effekterna av befintliga lösningar på säkerhetshot. [1] [2] [3] [4] [5] [6]

219
TULLVERKET Vår organisation innehar eller förbereder sig inför följande certifiering: [1] AEO-C. [5] Vet ej.
[2] AEO-S. [6] Vill inte svara.
[3] AEO-F.
[4] Ingen av dem.
Håller inte alls m
ed
Håller inte m
ed
Varken instäm
mer eller inte instäm
mer
Håller m
ed
Håller helt m
ed
Kan inte svara
Vår organisation uppfattar AEO:s krav som förvirrande. [1] [2] [3] [4] [5] [6]
AEO-certifieringen kommer inte att öka vår säkerhet. [1] [2] [3] [4] [5] [6]
Förberedelsearbete för AEO-certifiering kommer att kosta oss för mycket tid och resurser i förhållande till de förmåner en AEO certifiering innebär. [1] [2] [3] [4] [5] [6]
Det kommer inte att vara nödvändigt att vara AEO certifierad ur ett konkurrensperspektiv. [1] [2] [3] [4] [5] [6]
De krav som finns i AEO-riktlinjerna minskar effektiviteten i vår verksamhet. [1] [2] [3] [4] [5] [6]
Nu är Du färdig, stort tack för dina svar!
Lägg enkäten ovikt i det frankerade kuvertet som ingår i paketet du fick, klistra igen det och skicka allt via vanlig post

220
REMINDER LETTER (Swedish) Bäste säkerhets-/logistik-/risk-/transportansvarig!
För en tid sedan fick du enkäten om Transportsäkerhet, där vi i samarbete med Polisen i Västra Götalands Län försöker förstå hur företag fastställer sina säkerhetsinsatser, inklusive budget och skyddsnivå. Syftet med undersökningen är att identifiera vilka faktorer det är som styr eller utgör hinder för säkerheten i transportkedjor.
En del har besvarat enkäten före det angivna slutdatumet (den 30 april 2010). Men tyvärr är svarsfrekvensen för låg för att vi skall kunna formulera signifikanta slutsatser. Enligt vår databas har vi tyvärr inte fått ditt svar än, och därför vill vi påminna dig om att fylla i och skicka enkäten snarast. Ditt svar på detta frågeformulär är av avgörande betydelse för att i framtiden säkerställa säkrare och effektivare transporter. VIKTIGT! Alla svar är konfidentiella. Ditt namn, namnet på ditt företag samt dina kontaktuppgifter kommer att hållas strikt konfidentiella, och de kommer inte att avslöjas för tredje part eller i någon typ av publikation eller media. Det tar mellan 15 och 20 minuter att fylla i enkäten. Vi vill ha ditt svar senast den 25 maj 2010. Som en uppskattning för din hjälp kommer du att få en kopia av resultaten av denna analys (var vänlig specificera i frågeformuläret den e-postadress som resultaten ska skickas till). Använd svart eller blå bläckpenna för att fylla i enkäten. Sätt ett kryss för varje fråga om inget annat anges. Om du sätter ett kryss fel, fyll i den felaktiga rutan så att den blir helt fylld och sätt ett nytt kryss i den rätta rutan. När du är färdig, lägg enkäten ovikt i det frankerade kuvertet som ingår i paketet du fick, klistra igen det och skicka allt via vanlig post. För att kunna öka svarsfrekvensen kan du välja mellan att använda den tryckta enkäten som finns bifogat i detta kuvert eller en webbenkät som du hittar på följande adress: http://www.surveymonkey.com/s/transportsecurity Har du redan skickat in dina svar, ber vi dig att bortse från denna påminnelse och tackar för din medverkan. Du är välkommen att kontakta författaren nedan om du har några kommentarer eller frågor. Tack på förhand för din hjälp! Vänliga hälsningar, Luca Urciuoli MSc (Eng), Lic.Tek. Luca Urciuoli Institutionen för Teknisk Ekonomi och Logistik Tel. xxxx xx xx xx, epost: [email protected]

221
APPENDIX 5 – The Survey (English) Dear security/logistics/risk/transportation manager
You are receiving this email because of your involvement in transportation, logistics, and/or security management. I am asking for your help to fill out the enclosed survey as part of an investigation that is being carried out by the Dept. of Industrial Management and Logistics, Engineering Logistics, at Lund University.
Available statistics report the existence of several criminal activities affecting physical distribution chains. The magnitude of their frequency as well as of the related consequences is so high that many firms have indicated “security” as one of their management’s top priorities. Security incidents like theft, smuggling, counterfeiting, piracy etc. don’t imply merely economic losses for the involved firms, but also increased violence and injuries for transport operators. In addition, in case consumable products like pharmaceutical or food are counterfeited or contaminated, the consequences for our society may become devastating.
In order to improve transport safety is of paramount importance to understand how companies determine their security efforts, including budget and protection degree. Therefore, the purpose of this study is to identify what factors control the security of transportation networks. This work is funded by the VINNOVA competence center NGIL, Next Generation Innovative Logistics (http://www.ngil.se) and is being supervised by Professor Sten Wandel, Professor Andreas Norrman and Ass. Professor Henrik Tehler at Lund University.
In this study, we also cooperate with the law enforcement agency of Västra Götaland county, which is strongly involved in transportation security issues and which in the future will use the results of this study to tailor regulations, pursue collaboration initiatives between transport operators, develop and disseminate information about cost-effective security solutions to protect shipments from criminals, and so on. Therefore, your response to this questionnaire is crucial to achieving these goals and thereafter to ensure more secure, safe and efficient transpiration in the future.
IMPORTANT! ALL RESPONSES ARE CONFIDENTIAL. Your name, the name of your company, as well as your contact information will be kept strictly confidential and will not be disclosed to any third person or in any kinds of publications or media. The survey should take between 15 – 20 minutes to complete. We would like to have your response no later than April 30, 2010. In appreciation for your help you will receive a summary of the findings of this analysis (please specify in the questionnaire to which email address the results should be sent).
Use black or blue ink pen to complete the survey. Put a cross for each question unless otherwise is indicated. If you put a cross by mistake, please fill in the wrong box so that it becomes completely full, and insert a new cross in the appropriate box. When finished, place the unfolded questionnaire in the prepaid envelope included in the package you received, seal it and send everything by regular mail.
You are welcome to contact the author below if you have any comments or questions.
222
Thanks in advance for your help!
Best Regards,
Luca Urciuoli
MSc (Eng), Lic.Eng. Luca Urciuoli PhD student Dept. of Industrial Management and Logistics Engineering Logistics Tel. xxxx xx xx xx [email protected]

223
Generic Questions Type of company: [1] Freight Rail Transport [5] Mail Transport [9] Don’t know
[2] Freight Road Transport [6] Courier [10] Don’t want to answer
[3] Freight Water Transport [7] Newspaper distribution
[4] Freight Air Transport [8] Other:
Company annual sales (sek): [1] Less than 500 000 [5] 10 million to 20 million [9] More than 1 billion
[2] 500,000 to 1 million [6] 20 million to 100 million [10] Don’t know
[3] 1 million to 5 million [7] 100 million to 500 million [11] Don’t want to answer
[4] 5 million to 10 million [8] 500 million to 1 billion
Number of employees: [1] 0 [4] 50 to 250 [7] More than 1000
[2] 1 to 10 [5] 251 to 500 [8] Don’t know
[3] 10 to 49 [6] 501 to 1000 [9] Don’t want to answer
Position in the company: [1] Logistics manager [4] CEO/Owner [7] Don’t want to answer
[2] Transport manager [5] Operations manager [8] Other
[3] Traffic manager [6] Security manager
Main types of products shipped (several choices are possible): [1] Food [4] Automotive electronics [7] Other
[2] Clothes [5] Automotive chemicals [8] Don’t know
[3] Pharmaceuticals [6] Chemicals [9] Don’t want to answer
Specify the county where your headquarters are located:
[1] Blekinge county [10] Norrbottens county [19] Västerbottens county [2] Dalarnas county [11] Örebro county [20] Västernorrlands county [3] Gävleborgs county [12] Östergötlands county [21] Västmanlands county [4] Gotlands county [13] Skåne county [22] Västra Götalands county [5] Hallands county [14] Södermanlands county [23] Don’t want to answer [6] Jämtlands county [15] Stockholms county [7] Jönköpings county [16] Uppsala county [8] Kalmar county [17] Värmlands county [9] Kronobergs county [18] Norrbottens county E-mail (specify here your e-mail if you want to receive an executive summary of the findings):
Specify here:

224
SECURITY Enter the budget (in sek) that your organization allocated for security expenditures in 2009 (incl. costs for security measures and investigation costs):
[1] Specify here: (sek)
[2] Don’t know.
[3] Don’t want to answer.
Enter the total number of security incidents (both stopped and not stopped) that your organization has borne in 2009:
[1] Specify here:
[2] Don’t know.
[3] Don’t want to answer.
Enter the proportion of security incidents (in percent) that you have managed to stop in 2009:
[1] Specify here: (0% - 100%)
[2] Don’t know.
[3] Don’t want to answer.
Enter the average proportion of shipments (in percent) that in 2009 were not delivered within the agreed time-window, because of security incidents:
[1] Specify here: (0% - 100%)
[2] Don’t know.
[3] Don’t want to answer.

225
Law Enforcement Agency
In 2009...
Strongly Disagree
Disagree
Neither A
gree nor Disagree
Agree
Strongly Disagree
Can’t answ
er
… the Swedish Prosecutor's effort to prosecute transport offenders was very good. [1] [2] [3] [4] [5] [6]
… when criminals who attacked our business were arrested, there has been a long time before they have been released from prison. [1] [2] [3] [4] [5] [6]
… cargo criminals have always been promptly captured and kept in custody by the Swedish police and the Prosecutor. [1] [2] [3] [4] [5] [6]
… our confidence in the efforts of law enforcement authorities to prosecute offenders has increased. [1] [2] [3] [4] [5] [6]
… we have noticed that criminals, once arrested stayed away from our operations. [1] [2] [3] [4] [5] [6]
… we have noticed that cargo crime has always been severely punished. [1] [2] [3] [4] [5] [6]
… our organization has always reported security incidents to the law enforcement agency. [1] [2] [3] [4] [5] [6]
… the law enforcement efforts to arrest criminals has been very good. [1] [2] [3] [4] [5] [6]
… the law enforcement agency has devoted sufficient resources to combat cargo crime. [1] [2] [3] [4] [5] [6]
… we have always reported security incidents to law enforcement authorities as we have confidence that appropriate action against offenders will be taken. [1] [2] [3] [4] [5] [6]
… reporting security incidents was a top priority in our organization. [1] [2] [3] [4] [5] [6]
… we noticed that the more we reported security incidents, the better the efforts of law enforcement authorities had been. [1] [2] [3] [4] [5] [6]

226
In 2009...
Strongly Disagree
Disagree
Neither A
gree nor Disagree
Agree
Strongly Disagree
Can’t answ
er
... our organization has always taken part in seminars and other activities organized by the national law enforcement agency. [1] [2] [3] [4] [5] [6]
... our organization, by participating in seminars and activities organized by the law enforcement authorities, was stimulated to increase security. [1] [2] [3] [4] [5] [6]
... our organization, by participating in seminars and activities organized by the law enforcement authorities, was stimulated to increase knowledge about how to protect themselves from such incidents.
[1] [2] [3] [4] [5] [6]
.. we have noticed that, during seminars and activities, we have been able to come up with interesting initiatives for protection of goods. [1] [2] [3] [4] [5] [6]
... We have noticed that it is important to strengthen cooperation with law enforcement authorities to combat cargo crime. [1] [2] [3] [4] [5] [6]
... we have noted that cooperation with law enforcement agency has improved our ability to prevent and recover security incidents. [1] [2] [3] [4] [5] [6]

227
DISTRIBUTION AND TRANSPORT OPERATOR When you improve security, what is the average price increase accepted by your customers (please refer to the average price increase that you have agreed upon in 2009)?
[1] Average price per shipment: (0% - 100%)
[2] Do not know. [3] Do not want to answer.
In 2009...
Strongly Disagree
Disagree
Neither A
gree nor Disagree
Agree
Strongly Disagree
Can’t answ
er
... we asked our customers often for higher security but they did not want to pay for it. [1] [2] [3] [4] [5] [6]
... we noticed that it is difficult to provide security because we could not afford it. [1] [2] [3] [4] [5] [6]
... we found that we could not raise our prices because customers were not willing to pay for security. [1] [2] [3] [4] [5] [6]
... we realized that the little income that we have in our business makes it difficult to invest in security. [1] [2] [3] [4] [5] [6]
... our organization has continued to be competitive in the market although we do not invest in security. [1] [2] [3] [4] [5] [6]
... the proportion of customers willing to pay for secured transports is very low. [1] [2] [3] [4] [5] [6]
... We have had difficulty controlling security because our organization has a high degree of Just In Time (JIT). [1] [2] [3] [4] [5] [6]
... it often happened that the vehicles were attacked while they were waiting to unload at a terminal. [1] [2] [3] [4] [5] [6]
... the application of JIT principles has increased the risk of criminal attacks. [1] [2] [3] [4] [5] [6]
... we have had to balance security against JIT effectiveness. [1] [2] [3] [4] [5] [6]
... we have learned that JIT principles increase the flow of goods on the roads and thereafter the number of security incidents. [1] [2] [3] [4] [5] [6]
... the great dilemma of our organization was whether we should prioritize JIT principles or security. [1] [2] [3] [4] [5] [6]

228
Please choose below the option that best characterizes the average distance that your vehicle fleet is running: [1] Urban [5] Worldwide
[2] Regional [6] Don’t know
[3] National [7] Don’t want to answer
[4] Continental [8] Not applicable
Choose one of the following security measures (response linked to subsequent terms):
[1] GPS Track and Trace [5] Employees background screening [9] Vehicle-/Container alarm
[2] Mechanical Lock [6] E-seal [10] Fuel cap lock [3] Rigid curtains [7] VHF tracer [11] Other: [4] Sound Barrier [8] Vehicle Immobilizer
The introduction of the security solution chosen above will ...
Strongly Disagree
Disagree
Neither A
gree nor Disagree
Agree
Strongly Disagree
Can’t answ
er
... adversely affect customer satisfaction. [1] [2] [3] [4] [5] [6]
... have a negative impact on timely delivery. [1] [2] [3] [4] [5] [6]
... increase our labor costs. [1] [2] [3] [4] [5] [6]
... increase our administrative costs. [1] [2] [3] [4] [5] [6]
... do our work to satisfy customers more difficult. [1] [2] [3] [4] [5] [6]
... inevitably increase the delivery delays. [1] [2] [3] [4] [5] [6]
... inevitably increase the number of procedures that operators must follow. [1] [2] [3] [4] [5] [6]
... make the transport operators' working environment too complex and resource intensive. [1] [2] [3] [4] [5] [6]
... inevitably increase the number of technology that operators must learn and use every day. [1] [2] [3] [4] [5] [6]

229
BUSINESS SECURITY CERTIFICATIONS Indicate which of the following certifications / guidelines you comply with to improve security (more than one answer is possible): [1] TAPA EMEA. [4] None of them.
[2] ISO28000. [5] Don’t know.
[3] Other: [6] Don’t want to answer.
INSURANCE COMPANIES Please indicate the proportion of shipments (in percent) that were fully insured against security incidents in 2009 (regardless of who paid the insurance).
[1] Specify here: (0% - 100%)
[2] Don’t know.
[3] Don’t want to answer.
What proportion of your shipments is not insured by goods owners (according to NSAB2000)?
[1] Specify here: (0% - 100%)
[2] Don’t know.
[3] Don’t want to answer.
What proportion of your shipments had an increased liability compared to NSAB2000 requirements?
[1] Specify here: (0% - 100%)
[2] Don’t know.
[3] Don’t want to answer.
If your company has a captive of its insurance program, what proportion of losses related to security incidents were covered in 2009 by the captive company?
[1] Specify here: (0% - 100%)
[2] Don’t know.
[3] Don’t want to answer.
Enter the maximum discount (%) that you received in 2009 from your insurance company after installing or implementing a security measure:
Specify what security measure:
[1] Specify here: (0% - 100%)
[2] Don’t know.
[3] Don’t want to answer.

230
Strongly Disagree
Disagree
Neither A
gree nor Disagree
Agree
Strongly Disagree
Can’t answ
er
Insurances are the best solution to cover the economic losses from security incidents. [1] [2] [3] [4] [5] [6]
Our organization makes extensive use of commercial insurance to cover losses related to security incidents. [1] [2] [3] [4] [5] [6]
In order to cover losses associated with security incidents, our organization has a captive company for its insurance program. [1] [2] [3] [4] [5] [6]
Our organization makes use of insurance to cover direct and indirect losses caused by security incidents. [1] [2] [3] [4] [5] [6]
All the financial losses caused by security incidents are covered by our insurances. [1] [2] [3] [4] [5] [6]
By purchasing insurances, we will never lose money in the event of incidents. [1] [2] [3] [4] [5] [6]
Our organization earns premium discounts from insurance companies when protective measures are implemented. [1] [2] [3] [4] [5] [6]
It is easy to agree on premium discounts with insurance companies. [1] [2] [3] [4] [5] [6]
Agreements on premium discounts with our insurance company are never a loss of time and resource. [1] [2] [3] [4] [5] [6]
Installing security technologies will help the organization to save money on insurance premium. [1] [2] [3] [4] [5] [6]
The implementation of security procedures saves money on insurance premium. [1] [2] [3] [4] [5] [6]
Premium Discounts are always offered to organizations that actively work with security. [1] [2] [3] [4] [5] [6]
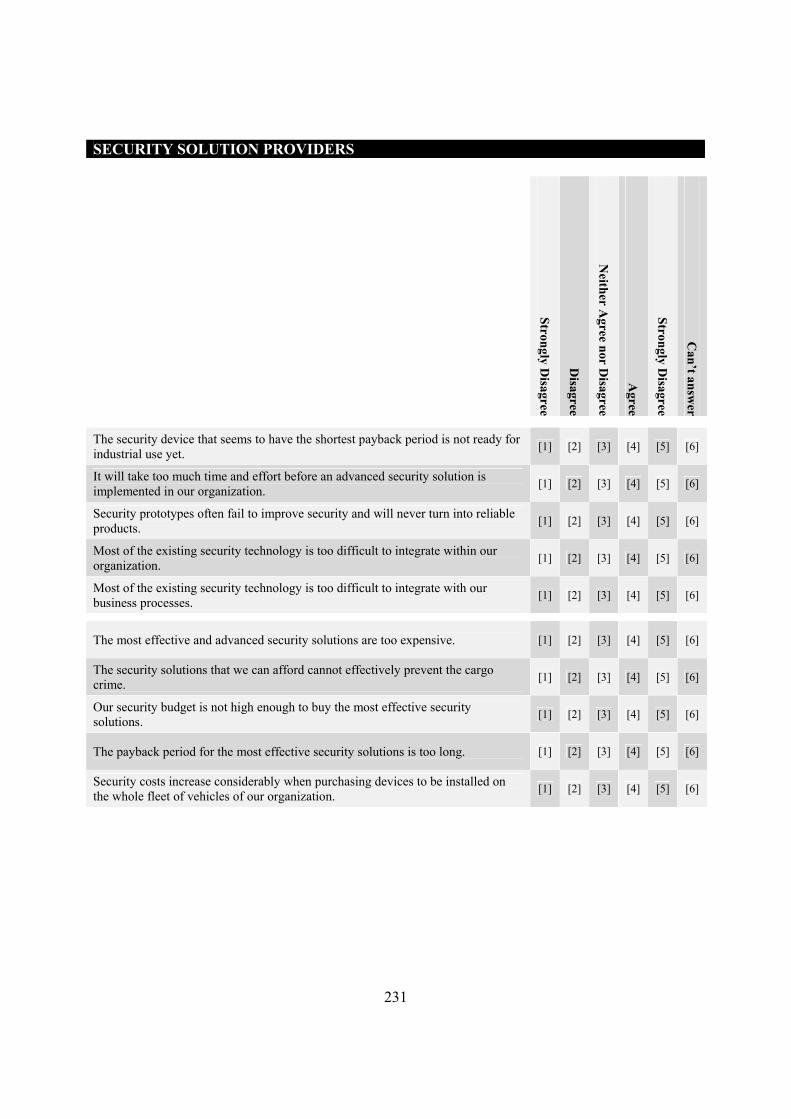
231
SECURITY SOLUTION PROVIDERS
Strongly Disagree
Disagree
Neither A
gree nor Disagree
Agree
Strongly Disagree
Can’t answ
er
The security device that seems to have the shortest payback period is not ready for industrial use yet. [1] [2] [3] [4] [5] [6]
It will take too much time and effort before an advanced security solution is implemented in our organization. [1] [2] [3] [4] [5] [6]
Security prototypes often fail to improve security and will never turn into reliable products. [1] [2] [3] [4] [5] [6]
Most of the existing security technology is too difficult to integrate within our organization. [1] [2] [3] [4] [5] [6]
Most of the existing security technology is too difficult to integrate with our business processes. [1] [2] [3] [4] [5] [6]
The most effective and advanced security solutions are too expensive. [1] [2] [3] [4] [5] [6]
The security solutions that we can afford cannot effectively prevent the cargo crime. [1] [2] [3] [4] [5] [6]
Our security budget is not high enough to buy the most effective security solutions. [1] [2] [3] [4] [5] [6]
The payback period for the most effective security solutions is too long. [1] [2] [3] [4] [5] [6]
Security costs increase considerably when purchasing devices to be installed on the whole fleet of vehicles of our organization. [1] [2] [3] [4] [5] [6]
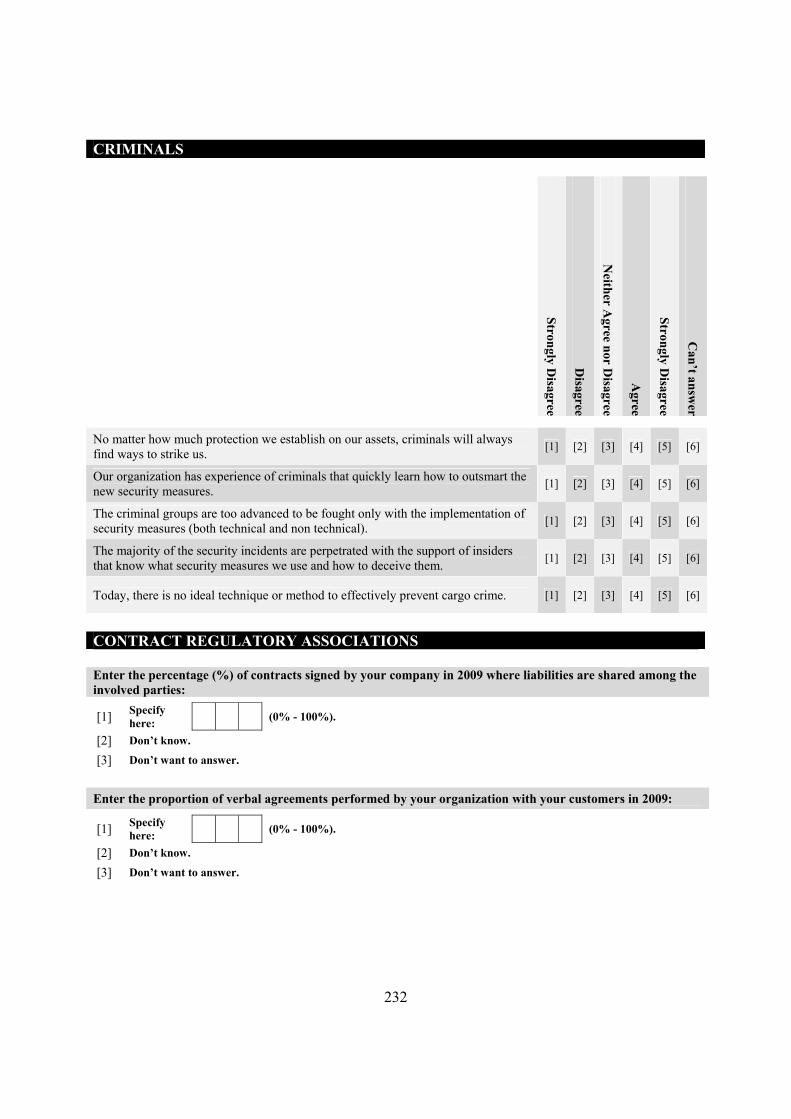
232
CRIMINALS
Strongly Disagree
Disagree
Neither A
gree nor Disagree
Agree
Strongly Disagree
Can’t answ
er
No matter how much protection we establish on our assets, criminals will always find ways to strike us. [1] [2] [3] [4] [5] [6]
Our organization has experience of criminals that quickly learn how to outsmart the new security measures. [1] [2] [3] [4] [5] [6]
The criminal groups are too advanced to be fought only with the implementation of security measures (both technical and non technical). [1] [2] [3] [4] [5] [6]
The majority of the security incidents are perpetrated with the support of insiders that know what security measures we use and how to deceive them. [1] [2] [3] [4] [5] [6]
Today, there is no ideal technique or method to effectively prevent cargo crime. [1] [2] [3] [4] [5] [6]
CONTRACT REGULATORY ASSOCIATIONS Enter the percentage (%) of contracts signed by your company in 2009 where liabilities are shared among the involved parties:
[1] Specify here: (0% - 100%).
[2] Don’t know.
[3] Don’t want to answer.
Enter the proportion of verbal agreements performed by your organization with your customers in 2009:
[1] Specify here: (0% - 100%).
[2] Don’t know.
[3] Don’t want to answer.

233
Strongly Disagree
Disagree
Neither A
gree nor Disagree
Agree
Strongly Disagree
Can’t answ
er
In 2009, our organization has made use of written agreements to specify risk-sharing between the parties involved in the distribution/storage of goods. [1] [2] [3] [4] [5] [6]
It is important that all parties involved in distribution and storage of goods share the responsibility in case of incidents. [1] [2] [3] [4] [5] [6]
Contracts must clearly indicate what standard agreements must be followed and who is responsible for what. [1] [2] [3] [4] [5] [6]
It is important to avoid the use of unclear agreements where the liability between the parties is not specified. [1] [2] [3] [4] [5] [6]
In our contracts established in 2009, the sharing of liabilities is defined in accordance with NSAB 2000. [1] [2] [3] [4] [5] [6]
Agreements with our customers are too complex to define and agree on. [1] [2] [3] [4] [5] [6]
Since the contract agreements with our customers are too complex to define and agree on, we prefer verbal agreements. [1] [2] [3] [4] [5] [6]
It takes too much time and too many resources to draw up and underwrite contracts. [1] [2] [3] [4] [5] [6]
Even if we use written agreements we do not understand their true meaning and benefit for our organization. [1] [2] [3] [4] [5] [6]
We have used written contracts but we do not really know how to use them in case a security incident occurs. [1] [2] [3] [4] [5] [6]
Please indicate the proportion of contract agreements (in percent) that your organization stipulated with its customers in 2009, in which security requirements are specified in the text:
[1] Specify here: (0% - 100%).
[2] Don’t know
[3] Don’t want to answer.

234
Strongly Disagree
Disagree
Neither A
gree nor Disagree
Agree
Strongly Disagree
Can’t answ
er
In 2009, our customers have always specified in contract agreements which security requirements should be applied. [1] [2] [3] [4] [5] [6]
It is important to specify security requirements in order to clarify the protection that is required for distribution/storage of goods. [1] [2] [3] [4] [5] [6]
In 2009, most of our customers asked to specify the security requirements in contract agreements. [1] [2] [3] [4] [5] [6]
In 2009, our organization has always proposed detailed descriptions of security requirements in contracts. [1] [2] [3] [4] [5] [6]
In 2009, both our organization and our customers have easily agreed on how to specify security requirements in contracts. [1] [2] [3] [4] [5] [6]
In 2009, we had difficulty getting along with our partners on the security requirements that should be specified in the agreement. [1] [2] [3] [4] [5] [6]
Agreement processes on the security requirements to be specified in contracts takes too much time and resources from our organization. [1] [2] [3] [4] [5] [6]
We prefer to avoid the specification of security requirements in contract agreements because it is too complicated. [1] [2] [3] [4] [5] [6]
We do not really know how to specify security requirements because it is difficult to estimate the impact on security of the measures selected. [1] [2] [3] [4] [5] [6]
In 2009, we and our customers often had different opinions about the performance of security solutions on cargo threats. [1] [2] [3] [4] [5] [6]

235
AUTHORITY Our organization complies with or is planning to comply with the following certifications: [1] AEO-C. [5] Don’t know
[2] AEO-S. [6] Don’t want to answer.
[3] AEO-F.
[4] None of them.
Strongly Disagree
Disagree
Neither A
gree nor Disagree
Agree
Strongly Disagree
Can’t answ
er
Our organization perceives the AEO's requirements as confusing. [1] [2] [3] [4] [5] [6]
The AEO certification will not increase the security of our organization. [1] [2] [3] [4] [5] [6]
Complying with the AEO certification will cost us too much time and resources in relation to the benefits. [1] [2] [3] [4] [5] [6]
It is not necessary to be AEO certified from a competitive advantage perspective. [1] [2] [3] [4] [5] [6]
The requirements of the AEO guidelines reduce the efficiency of our operations. [1] [2] [3] [4] [5] [6]
Now you have finished, many thanks for your contribution! You may now place the unfolded questionnaire in the prepaid envelope included in the package
you received, seal it and send everything by regular mail

236
REMINDER LETTER (English) Dear security/logistics/risk/transportation manager! Some time ago, you received a questionnaire concerning Transportation Security, according to which we, in cooperation with the Law Enforcement agency in Västra Götaland County, are trying to understand how companies determine their security efforts, including budget and protection degree. The purpose of the study is to identify what factors control the security of the transport chains.
Some have responded to the questionnaire before the deadline (30 April 2010). But unfortunately the response rate is too low to allow us to formulate significant conclusions. According to our database we have unfortunately not received your answer yet, and therefore we want to remind you to complete and return the questionnaire as soon as possible. Your response to this questionnaire is of vital importance to ensure more secure, safe and efficient transportation in the future. IMPORTANT! All responses are confidential. Your name, the name of your company, as well as your contact information will be kept strictly confidential and will not be disclosed to any third person or in any kind of publications and media. The survey should take between 15 – 20 minutes to complete. We would like to have your response no later than May 25, 2010. As an appreciation for your help you will receive a summary of the findings of this analysis (please specify in the questionnaire to which email address the results should be sent).
Use black or blue ink pen to complete the survey. Put a cross for each question unless otherwise is indicated. If you put a cross by mistake, please fill in the wrong box so that it becomes completely full, and insert a new cross in the appropriate box. When finished, place the unfolded questionnaire in the prepaid envelope included in the package you received, seal it and send everything by regular mail.
In order to increase the response rate, you can choose between using the printed questionnaire, which is enclosed in this envelope, or a web-survey which can be found at: http://www.surveymonkey.com/s/transportsecurity If you have already submitted your answer, please disregard this reminder and thank you for your participation. You are welcome to contact the author below if you have any comments or questions. Thanks in advance for your help!
Best Regards,
Luca Urciuoli MSc (Eng), Lic.Tek. Luca Urciuoli Institutionen för Teknisk Ekonomi och Logistik Tel. xxxx xx xx xx, epost: [email protected]
Related Documents