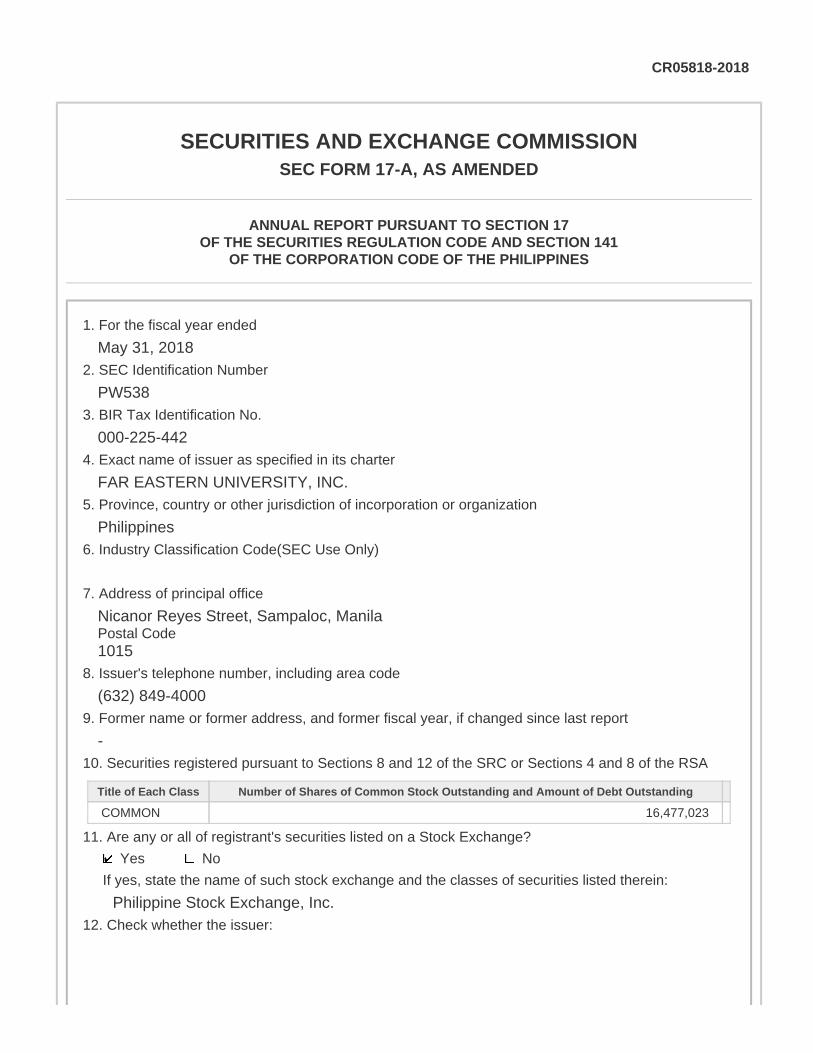
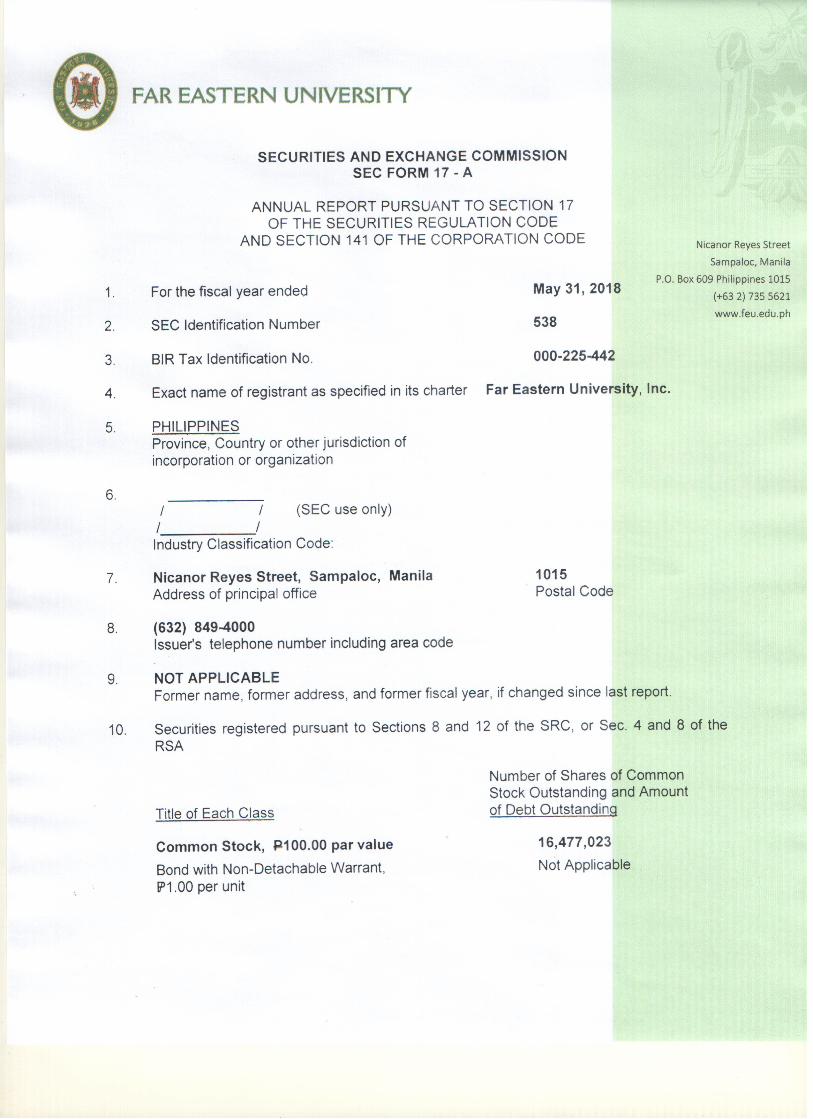
No Yes CR05818-2018 SECURITIES AND EXCHANGE COMMISSION SEC FORM 17-A, AS AMENDED ANNUAL REPORT PURSUANT TO SECTION 17 OF THE SECURITIES REGULATION CODE AND SECTION 141 OF THE CORPORATION CODE OF THE PHILIPPINES 1. For the fiscal year ended May 31, 2018 2. SEC Identification Number PW538 3. BIR Tax Identification No. 000-225-442 4. Exact name of issuer as specified in its charter FAR EASTERN UNIVERSITY, INC. 5. Province, country or other jurisdiction of incorporation or organization Philippines 6. Industry Classification Code(SEC Use Only) 7. Address of principal office Nicanor Reyes Street, Sampaloc, Manila Postal Code 1015 8. Issuer's telephone number, including area code (632) 849-4000 9. Former name or former address, and former fiscal year, if changed since last report - 10. Securities registered pursuant to Sections 8 and 12 of the SRC or Sections 4 and 8 of the RSA Title of Each Class Number of Shares of Common Stock Outstanding and Amount of Debt Outstanding COMMON 16,477,023 11. Are any or all of registrant's securities listed on a Stock Exchange? If yes, state the name of such stock exchange and the classes of securities listed therein: Philippine Stock Exchange, Inc. 12. Check whether the issuer:

Welcome message from author
This document is posted to help you gain knowledge. Please leave a comment to let me know what you think about it! Share it to your friends and learn new things together.
Transcript
No Yes
CR05818-2018
SECURITIES AND EXCHANGE COMMISSIONSEC FORM 17-A, AS AMENDED
ANNUAL REPORT PURSUANT TO SECTION 17OF THE SECURITIES REGULATION CODE AND SECTION 141
OF THE CORPORATION CODE OF THE PHILIPPINES
1. For the fiscal year ended
May 31, 20182. SEC Identification Number
PW5383. BIR Tax Identification No.
000-225-4424. Exact name of issuer as specified in its charter
FAR EASTERN UNIVERSITY, INC.5. Province, country or other jurisdiction of incorporation or organization
Philippines6. Industry Classification Code(SEC Use Only)
7. Address of principal office
Nicanor Reyes Street, Sampaloc, ManilaPostal Code1015
8. Issuer's telephone number, including area code
(632) 849-40009. Former name or former address, and former fiscal year, if changed since last report
-10. Securities registered pursuant to Sections 8 and 12 of the SRC or Sections 4 and 8 of the RSA
Title of Each Class Number of Shares of Common Stock Outstanding and Amount of Debt Outstanding
COMMON 16,477,023
11. Are any or all of registrant's securities listed on a Stock Exchange?
If yes, state the name of such stock exchange and the classes of securities listed therein:
Philippine Stock Exchange, Inc.12. Check whether the issuer:
No Yes
No Yes
No Yes
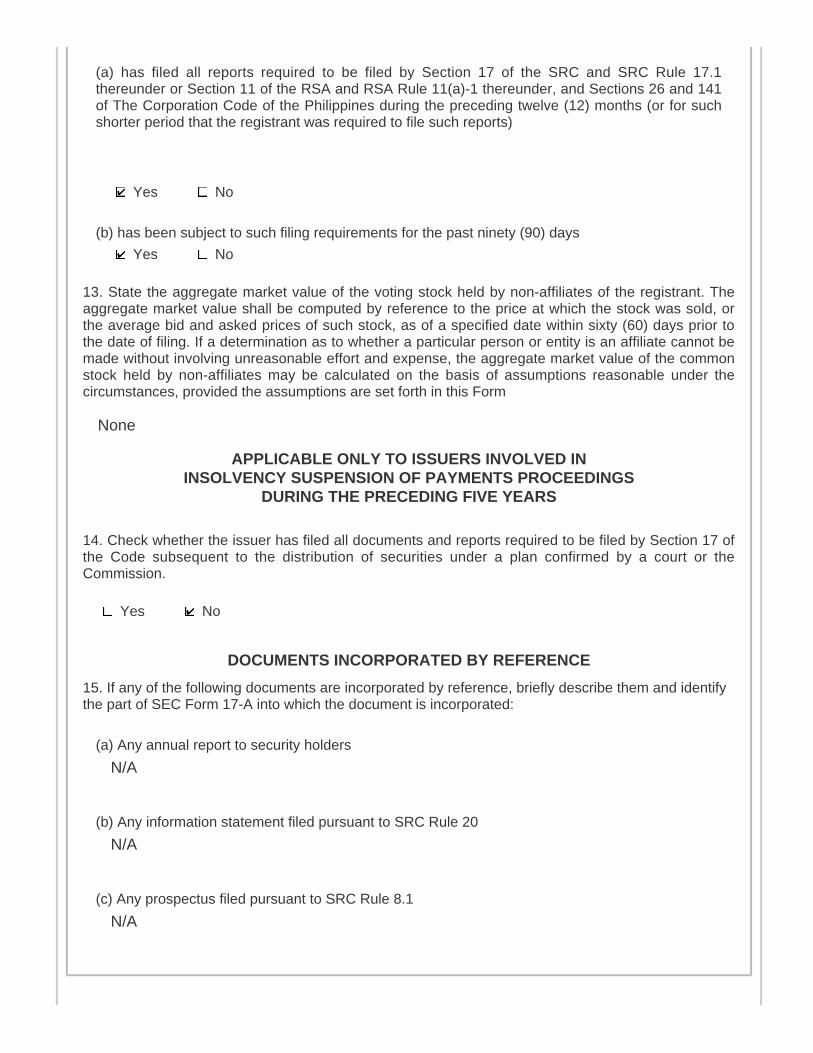
(a) has filed all reports required to be filed by Section 17 of the SRC and SRC Rule 17.1thereunder or Section 11 of the RSA and RSA Rule 11(a)-1 thereunder, and Sections 26 and 141of The Corporation Code of the Philippines during the preceding twelve (12) months (or for suchshorter period that the registrant was required to file such reports)
(b) has been subject to such filing requirements for the past ninety (90) days
13. State the aggregate market value of the voting stock held by non-affiliates of the registrant. Theaggregate market value shall be computed by reference to the price at which the stock was sold, orthe average bid and asked prices of such stock, as of a specified date within sixty (60) days prior tothe date of filing. If a determination as to whether a particular person or entity is an affiliate cannot bemade without involving unreasonable effort and expense, the aggregate market value of the commonstock held by non-affiliates may be calculated on the basis of assumptions reasonable under thecircumstances, provided the assumptions are set forth in this Form
None
APPLICABLE ONLY TO ISSUERS INVOLVED ININSOLVENCY SUSPENSION OF PAYMENTS PROCEEDINGS
DURING THE PRECEDING FIVE YEARS
14. Check whether the issuer has filed all documents and reports required to be filed by Section 17 ofthe Code subsequent to the distribution of securities under a plan confirmed by a court or theCommission.
DOCUMENTS INCORPORATED BY REFERENCE
15. If any of the following documents are incorporated by reference, briefly describe them and identifythe part of SEC Form 17-A into which the document is incorporated:
(a) Any annual report to security holders
N/A
(b) Any information statement filed pursuant to SRC Rule 20
N/A
(c) Any prospectus filed pursuant to SRC Rule 8.1
N/A
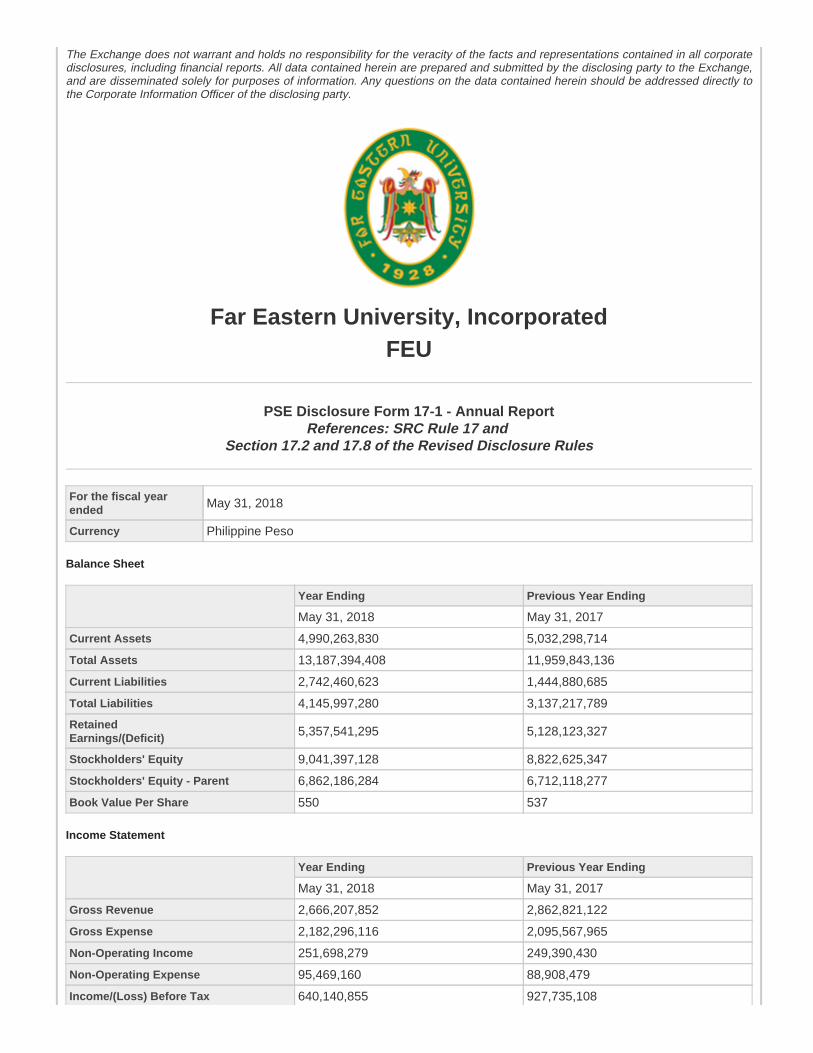
The Exchange does not warrant and holds no responsibility for the veracity of the facts and representations contained in all corporatedisclosures, including financial reports. All data contained herein are prepared and submitted by the disclosing party to the Exchange,and are disseminated solely for purposes of information. Any questions on the data contained herein should be addressed directly tothe Corporate Information Officer of the disclosing party.
Far Eastern University, IncorporatedFEU
PSE Disclosure Form 17-1 - Annual ReportReferences: SRC Rule 17 and
Section 17.2 and 17.8 of the Revised Disclosure Rules
For the fiscal yearended May 31, 2018
Currency Philippine Peso
Balance Sheet
Year Ending Previous Year Ending
May 31, 2018 May 31, 2017
Current Assets 4,990,263,830 5,032,298,714
Total Assets 13,187,394,408 11,959,843,136
Current Liabilities 2,742,460,623 1,444,880,685
Total Liabilities 4,145,997,280 3,137,217,789
RetainedEarnings/(Deficit) 5,357,541,295 5,128,123,327
Stockholders' Equity 9,041,397,128 8,822,625,347
Stockholders' Equity - Parent 6,862,186,284 6,712,118,277
Book Value Per Share 550 537
Income Statement
Year Ending Previous Year Ending
May 31, 2018 May 31, 2017
Gross Revenue 2,666,207,852 2,862,821,122
Gross Expense 2,182,296,116 2,095,567,965
Non-Operating Income 251,698,279 249,390,430
Non-Operating Expense 95,469,160 88,908,479
Income/(Loss) Before Tax 640,140,855 927,735,108
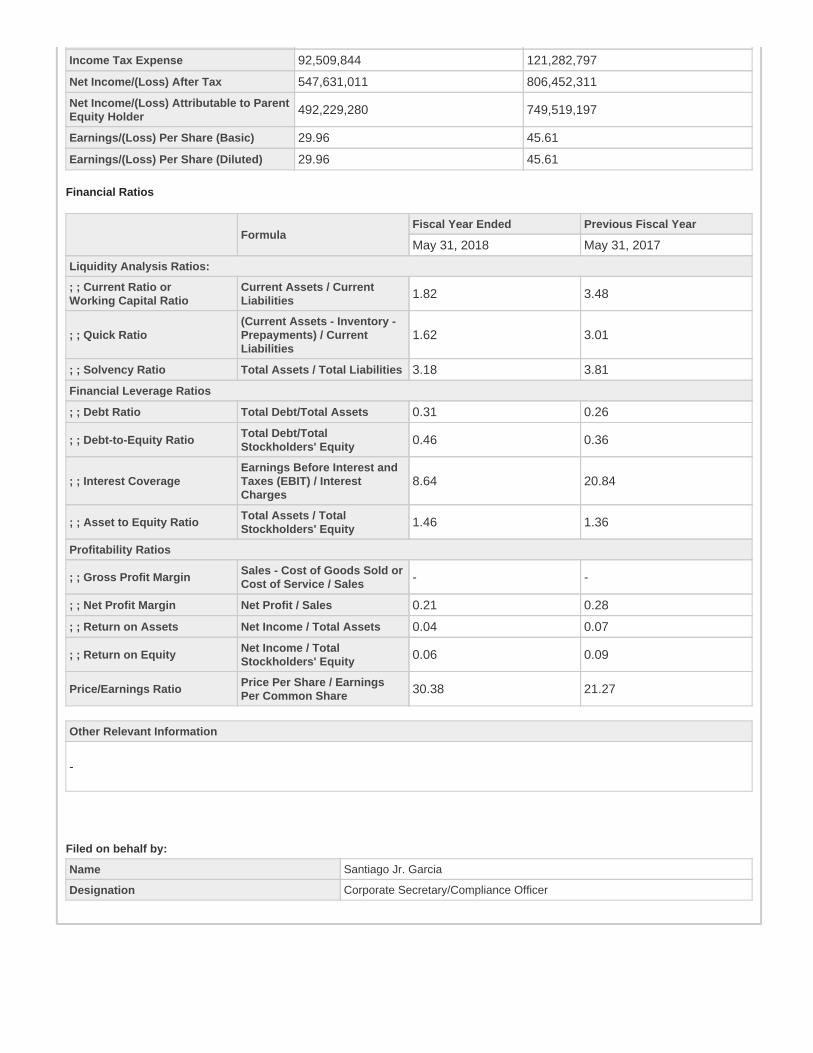
Income Tax Expense 92,509,844 121,282,797
Net Income/(Loss) After Tax 547,631,011 806,452,311
Net Income/(Loss) Attributable to ParentEquity Holder 492,229,280 749,519,197
Earnings/(Loss) Per Share (Basic) 29.96 45.61
Earnings/(Loss) Per Share (Diluted) 29.96 45.61
Financial Ratios
FormulaFiscal Year Ended Previous Fiscal Year
May 31, 2018 May 31, 2017
Liquidity Analysis Ratios:
; ; Current Ratio orWorking Capital Ratio
Current Assets / CurrentLiabilities 1.82 3.48
; ; Quick Ratio(Current Assets - Inventory -Prepayments) / CurrentLiabilities
1.62 3.01
; ; Solvency Ratio Total Assets / Total Liabilities 3.18 3.81
Financial Leverage Ratios
; ; Debt Ratio Total Debt/Total Assets 0.31 0.26
; ; Debt-to-Equity RatioTotal Debt/TotalStockholders' Equity 0.46 0.36
; ; Interest CoverageEarnings Before Interest andTaxes (EBIT) / InterestCharges
8.64 20.84
; ; Asset to Equity RatioTotal Assets / TotalStockholders' Equity 1.46 1.36
Profitability Ratios
; ; Gross Profit MarginSales - Cost of Goods Sold orCost of Service / Sales - -
; ; Net Profit Margin Net Profit / Sales 0.21 0.28
; ; Return on Assets Net Income / Total Assets 0.04 0.07
; ; Return on EquityNet Income / TotalStockholders' Equity 0.06 0.09
Price/Earnings RatioPrice Per Share / EarningsPer Common Share 30.38 21.27
Other Relevant Information
-
Filed on behalf by:
Name Santiago Jr. Garcia
Designation Corporate Secretary/Compliance Officer
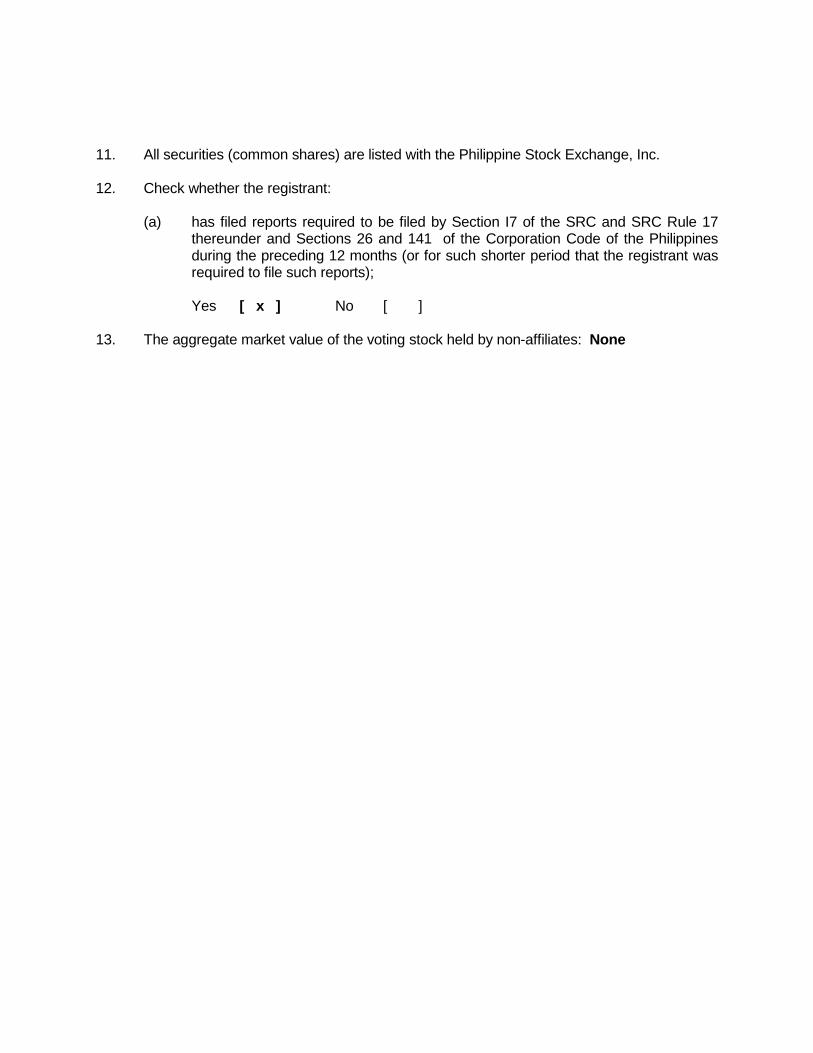
11. All securities (common shares) are listed with the Philippine Stock Exchange, Inc.
12. Check whether the registrant:
(a) has filed reports required to be filed by Section I7 of the SRC and SRC Rule 17thereunder and Sections 26 and 141 of the Corporation Code of the Philippinesduring the preceding 12 months (or for such shorter period that the registrant wasrequired to file such reports);
Yes [ x ] No [ ]
13. The aggregate market value of the voting stock held by non-affiliates: None
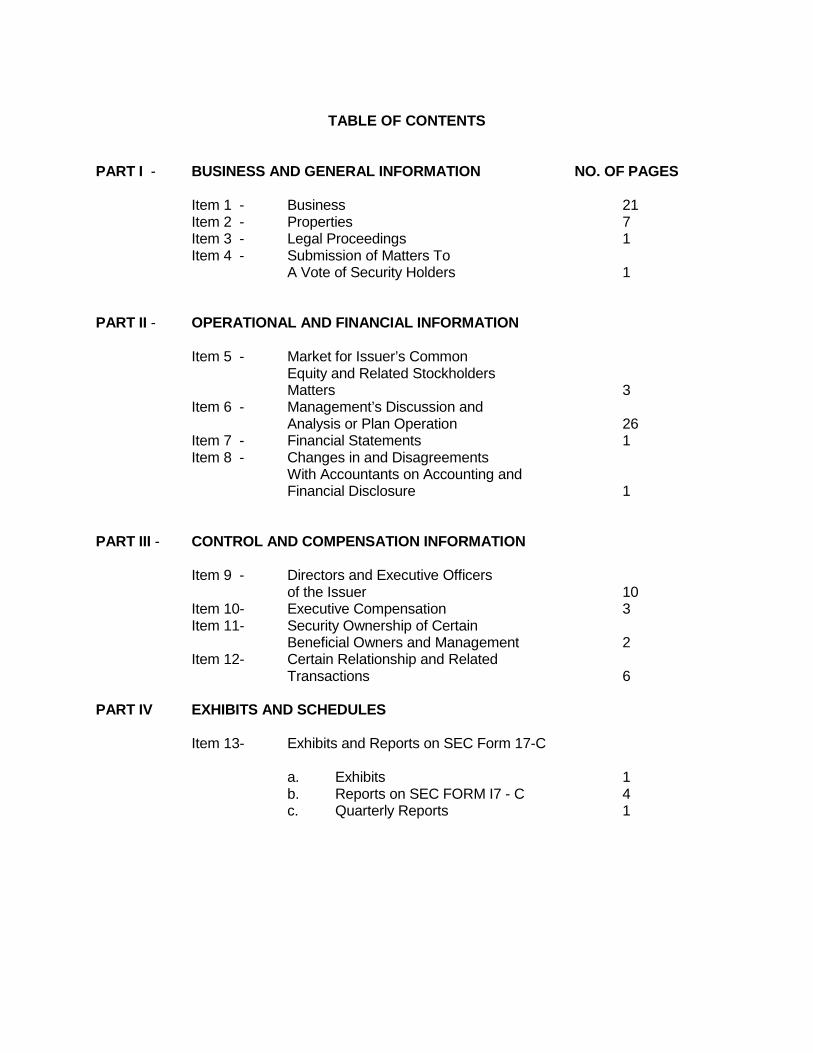
TABLE OF CONTENTS
PART I - BUSINESS AND GENERAL INFORMATION NO. OF PAGES
Item 1 - Business 21Item 2 - Properties 7Item 3 - Legal Proceedings 1Item 4 - Submission of Matters To
A Vote of Security Holders 1
PART II - OPERATIONAL AND FINANCIAL INFORMATION
Item 5 - Market for Issuer’s CommonEquity and Related StockholdersMatters 3
Item 6 - Management’s Discussion andAnalysis or Plan Operation 26
Item 7 - Financial Statements 1Item 8 - Changes in and Disagreements
With Accountants on Accounting andFinancial Disclosure 1
PART III - CONTROL AND COMPENSATION INFORMATION
Item 9 - Directors and Executive Officersof the Issuer 10
Item 10- Executive Compensation 3Item 11- Security Ownership of Certain
Beneficial Owners and Management 2Item 12- Certain Relationship and Related
Transactions 6
PART IV EXHIBITS AND SCHEDULES
Item 13- Exhibits and Reports on SEC Form 17-C
a. Exhibits 1b. Reports on SEC FORM I7 - C 4c. Quarterly Reports 1
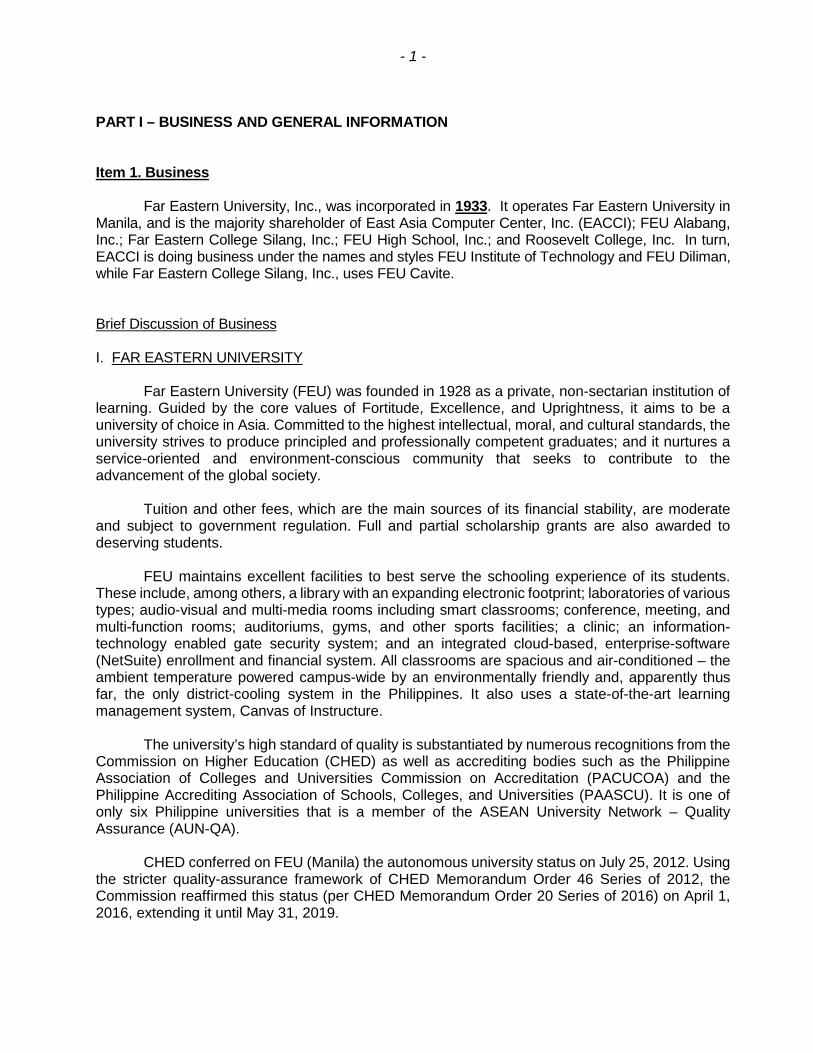
- 1 -
PART I – BUSINESS AND GENERAL INFORMATION
Item 1. Business
Far Eastern University, Inc., was incorporated in 1933. It operates Far Eastern University inManila, and is the majority shareholder of East Asia Computer Center, Inc. (EACCI); FEU Alabang,Inc.; Far Eastern College Silang, Inc.; FEU High School, Inc.; and Roosevelt College, Inc. In turn,EACCI is doing business under the names and styles FEU Institute of Technology and FEU Diliman,while Far Eastern College Silang, Inc., uses FEU Cavite.
Brief Discussion of Business
I. FAR EASTERN UNIVERSITY
Far Eastern University (FEU) was founded in 1928 as a private, non-sectarian institution oflearning. Guided by the core values of Fortitude, Excellence, and Uprightness, it aims to be auniversity of choice in Asia. Committed to the highest intellectual, moral, and cultural standards, theuniversity strives to produce principled and professionally competent graduates; and it nurtures aservice-oriented and environment-conscious community that seeks to contribute to theadvancement of the global society.
Tuition and other fees, which are the main sources of its financial stability, are moderateand subject to government regulation. Full and partial scholarship grants are also awarded todeserving students.
FEU maintains excellent facilities to best serve the schooling experience of its students.These include, among others, a library with an expanding electronic footprint; laboratories of varioustypes; audio-visual and multi-media rooms including smart classrooms; conference, meeting, andmulti-function rooms; auditoriums, gyms, and other sports facilities; a clinic; an information-technology enabled gate security system; and an integrated cloud-based, enterprise-software(NetSuite) enrollment and financial system. All classrooms are spacious and air-conditioned – theambient temperature powered campus-wide by an environmentally friendly and, apparently thusfar, the only district-cooling system in the Philippines. It also uses a state-of-the-art learningmanagement system, Canvas of Instructure.
The university’s high standard of quality is substantiated by numerous recognitions from theCommission on Higher Education (CHED) as well as accrediting bodies such as the PhilippineAssociation of Colleges and Universities Commission on Accreditation (PACUCOA) and thePhilippine Accrediting Association of Schools, Colleges, and Universities (PAASCU). It is one ofonly six Philippine universities that is a member of the ASEAN University Network – QualityAssurance (AUN-QA).
CHED conferred on FEU (Manila) the autonomous university status on July 25, 2012. Usingthe stricter quality-assurance framework of CHED Memorandum Order 46 Series of 2012, theCommission reaffirmed this status (per CHED Memorandum Order 20 Series of 2016) on April 1,2016, extending it until May 31, 2019.
- 2 -
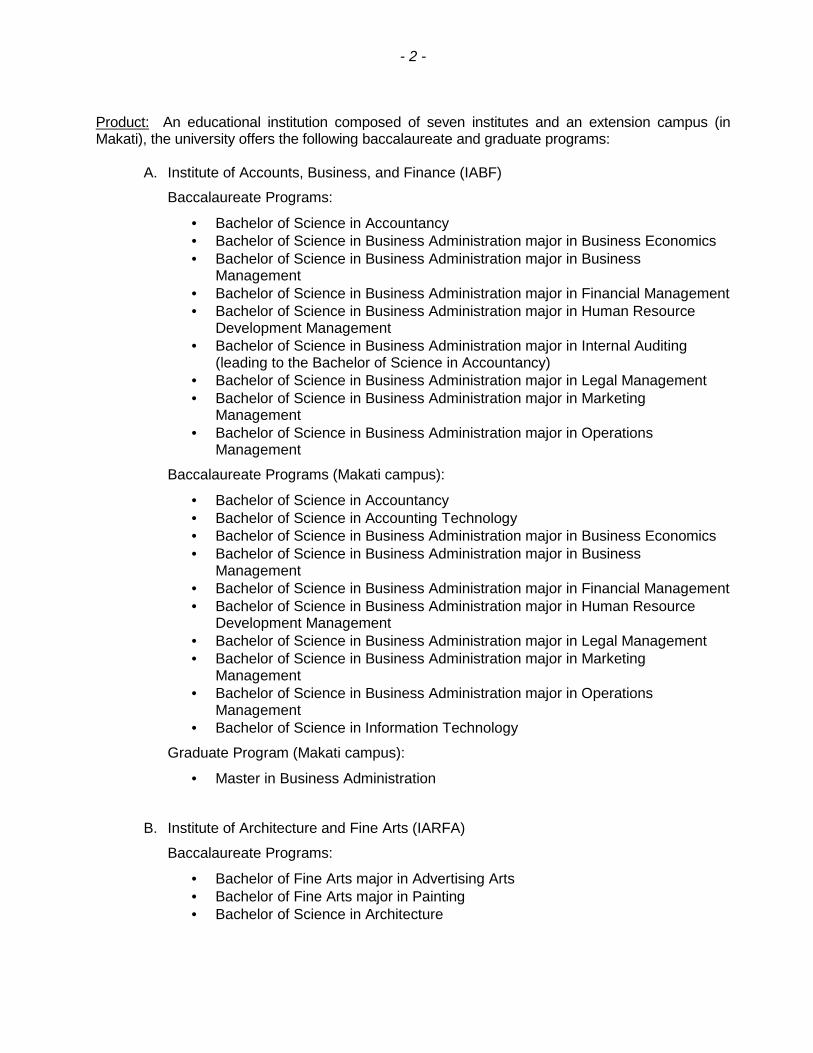
Product: An educational institution composed of seven institutes and an extension campus (inMakati), the university offers the following baccalaureate and graduate programs:
A. Institute of Accounts, Business, and Finance (IABF)
Baccalaureate Programs:
Bachelor of Science in Accountancy Bachelor of Science in Business Administration major in Business Economics Bachelor of Science in Business Administration major in Business
Management Bachelor of Science in Business Administration major in Financial Management Bachelor of Science in Business Administration major in Human Resource
Development Management Bachelor of Science in Business Administration major in Internal Auditing
(leading to the Bachelor of Science in Accountancy) Bachelor of Science in Business Administration major in Legal Management Bachelor of Science in Business Administration major in Marketing
Management Bachelor of Science in Business Administration major in Operations
Management
Baccalaureate Programs (Makati campus):
Bachelor of Science in Accountancy Bachelor of Science in Accounting Technology Bachelor of Science in Business Administration major in Business Economics Bachelor of Science in Business Administration major in Business
Management Bachelor of Science in Business Administration major in Financial Management Bachelor of Science in Business Administration major in Human Resource
Development Management Bachelor of Science in Business Administration major in Legal Management Bachelor of Science in Business Administration major in Marketing
Management Bachelor of Science in Business Administration major in Operations
Management Bachelor of Science in Information Technology
Graduate Program (Makati campus):
Master in Business Administration
B. Institute of Architecture and Fine Arts (IARFA)
Baccalaureate Programs:
Bachelor of Fine Arts major in Advertising Arts Bachelor of Fine Arts major in Painting Bachelor of Science in Architecture

- 3 -
C. Institute of Arts and Sciences (IAS)
Baccalaureate Programs:
Bachelor of Arts in Communication Bachelor of Arts in English Language Bachelor of Arts in Interdisciplinary Studies Bachelor of Arts in International Studies Bachelor of Arts in Literature Bachelor of Arts in Political Science Bachelor of Science in Applied Mathematics with Information Technology Bachelor of Science in Biology Bachelor of Science in Medical Technology Bachelor of Science in Psychology
Graduate Programs:
Doctor of Philosophy in Psychology major in Clinical Psychology Doctor of Philosophy in Psychology major in Forensic Psychology Doctor of Philosophy in Psychology major in Industrial Psychology Master of Arts in Communication Master of Arts major in Letters Master of Arts in Psychology specialization in Clinical Psychology Master of Arts in Psychology specialization in Industrial Psychology Master of Science in Biology
D. Institute of Education (IE)
Baccalaureate Programs:
Bachelor of Elementary Education major in General Education Bachelor of Elementary Education major in Preschool Education Bachelor of Elementary Education major in Special Education Bachelor of Physical Education major in School Physical Education Bachelor of Secondary Education major in English Bachelor of Secondary Education major in General Science Bachelor of Secondary Education major in Mathematics Bachelor of Bachelor of Secondary Education major in Sports and Recreational
Management
Certificate Program:
Teacher Certificate Program

- 4 -
Graduate Programs:
Doctor of Education major in Curriculum and Instruction Doctor of Education major in Educational Administration Doctor of Education major in Language and Literature Education Master of Arts in Education major in Curriculum and Instruction Master of Arts in Education major in Educational Administration Master of Arts in Education major in English Language Teaching Master of Arts in Education major in Literature and Language Education
(English) Master of Arts in Education major in Special Education Master in Physical Education
E. Institute of Law (IL)
Graduate Programs (Makati campus):
Bachelor of Laws Juris Doctor
F. Institute of Nursing (IN)
Baccalaureate Program:
Bachelor of Science in Nursing
Graduate programs:
Master of Arts in Nursing specialized in Community Health Master of Arts in Nursing specialized in Maternal-Child Health Master of Arts in Nursing specialized in Medical-Surgical Nursing Master of Arts in Nursing specialized in Mental Health and Psychiatric Nursing Master of Arts in Nursing specialized in Nursing Systems Administration
G. Institute of Tourism and Hotel Management (ITHM)
Baccalaureate Programs:
Bachelor of Science in Hotel and Restaurant Management Bachelor of Science in Tourism Management
All of these academic program offerings were approved and/or granted permits by the CHED, theLegal Education Board (in the case of the Bachelor of Laws and Juris Doctor programs), and otherrelevant government agencies.

- 5 -
Program Accreditations
Far Eastern University continuously strives for excellence in teaching, research and development,and extension work. Validations of this institutional effort include CHED’s citations of (a) the teacher-education programs of the IE as a Center of Excellence and (b) the Bachelor of Science in BusinessAdministration program of the IABF as a Center of Development.
Local Accreditations
Almost all of the academic programs in the Manila campus are accredited by PACUCOA. Thefollowing programs have PACUCOA Level IV accreditation status (the highest), for the periodDecember 2015 to December 2020:
Bachelor of Arts in Communication Bachelor of Elementary Education Bachelor of Science in Accountancy Bachelor of Science in Applied Mathematics with Information Technology Bachelor of Science in Biology Bachelor of Science in Business Administration Bachelor of Science in Psychology Bachelor of Secondary Education
The Bachelor of Science in Nursing is the only academic program in the Manila campus that isaccredited by PAASCU. It has Level III Reaccredited status for the period August 2018 to November2021.
Programs with PACUCOA Level II first-reaccreditation status are as follows:
o February 2017 ‒ February 2022:
Doctor of Education Master of Arts in Education Master of Arts in Psychology
o September 2015 ‒ September 2018
Bachelor of Arts in English Language Bachelor of Arts in Literature Bachelor of Arts in Political Science Bachelor of Science in Tourism Management
Programs with PACUCOA Level I formal-accreditation status are as follows:
o November 2016 ‒ September 2019
Bachelor of Arts in Hotel and Restaurant Management Bachelor of Arts in International Studies Bachelor of Fine Arts Bachelor of Science in Medical Technology
o February 2017 ‒ September 2020
Bachelor of Science in Architecture
- 6 -
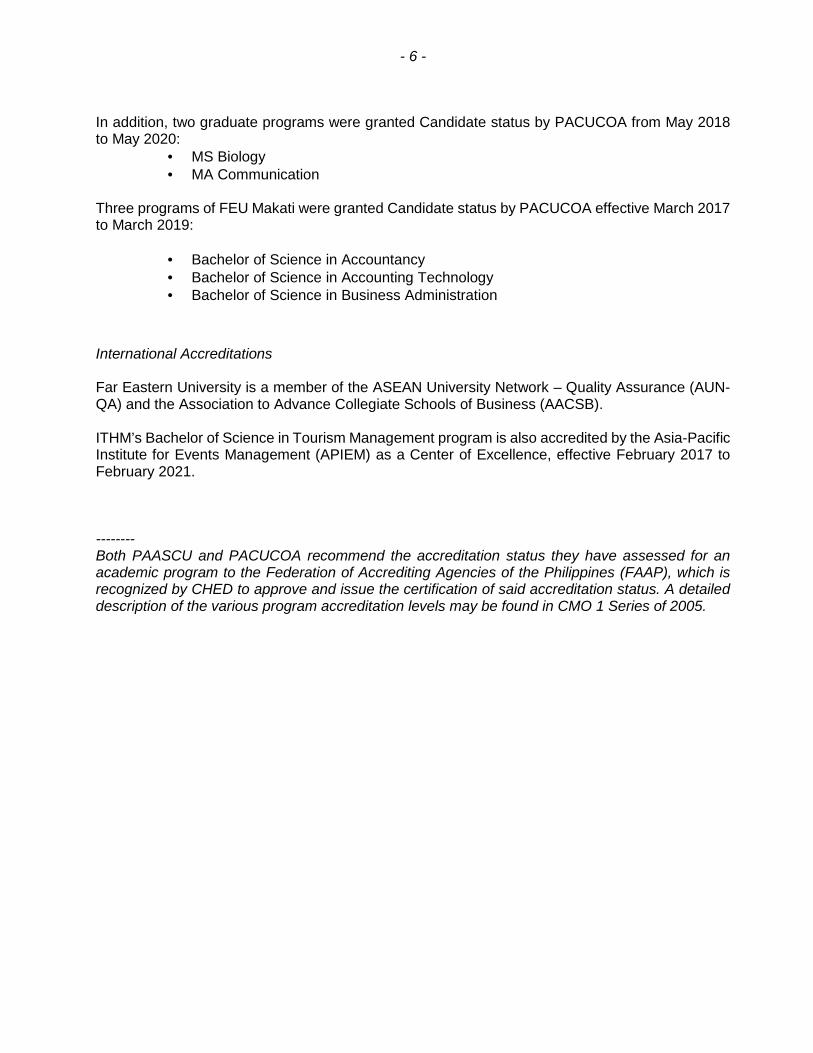
In addition, two graduate programs were granted Candidate status by PACUCOA from May 2018to May 2020:
MS Biology MA Communication
Three programs of FEU Makati were granted Candidate status by PACUCOA effective March 2017to March 2019:
Bachelor of Science in Accountancy Bachelor of Science in Accounting Technology Bachelor of Science in Business Administration
International Accreditations
Far Eastern University is a member of the ASEAN University Network ‒ Quality Assurance (AUN-QA) and the Association to Advance Collegiate Schools of Business (AACSB).
ITHM’s Bachelor of Science in Tourism Management program is also accredited by the Asia-PacificInstitute for Events Management (APIEM) as a Center of Excellence, effective February 2017 toFebruary 2021.
--------Both PAASCU and PACUCOA recommend the accreditation status they have assessed for anacademic program to the Federation of Accrediting Agencies of the Philippines (FAAP), which isrecognized by CHED to approve and issue the certification of said accreditation status. A detaileddescription of the various program accreditation levels may be found in CMO 1 Series of 2005.
- 7 -
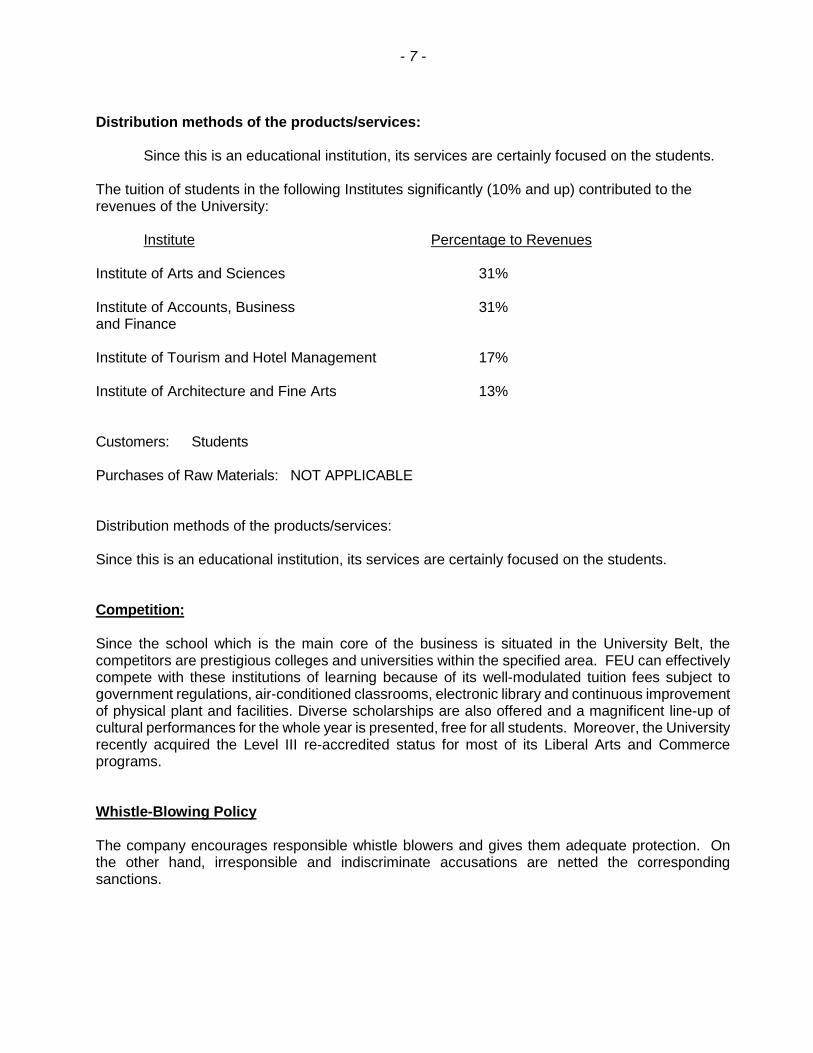
Distribution methods of the products/services:
Since this is an educational institution, its services are certainly focused on the students.
The tuition of students in the following Institutes significantly (10% and up) contributed to therevenues of the University:
Institute Percentage to Revenues
Institute of Arts and Sciences 31%
Institute of Accounts, Business 31%and Finance
Institute of Tourism and Hotel Management 17%
Institute of Architecture and Fine Arts 13%
Customers: Students
Purchases of Raw Materials: NOT APPLICABLE
Distribution methods of the products/services:
Since this is an educational institution, its services are certainly focused on the students.
Competition:
Since the school which is the main core of the business is situated in the University Belt, thecompetitors are prestigious colleges and universities within the specified area. FEU can effectivelycompete with these institutions of learning because of its well-modulated tuition fees subject togovernment regulations, air-conditioned classrooms, electronic library and continuous improvementof physical plant and facilities. Diverse scholarships are also offered and a magnificent line-up ofcultural performances for the whole year is presented, free for all students. Moreover, the Universityrecently acquired the Level III re-accredited status for most of its Liberal Arts and Commerceprograms.
Whistle-Blowing Policy
The company encourages responsible whistle blowers and gives them adequate protection. Onthe other hand, irresponsible and indiscriminate accusations are netted the correspondingsanctions.
- 8 -
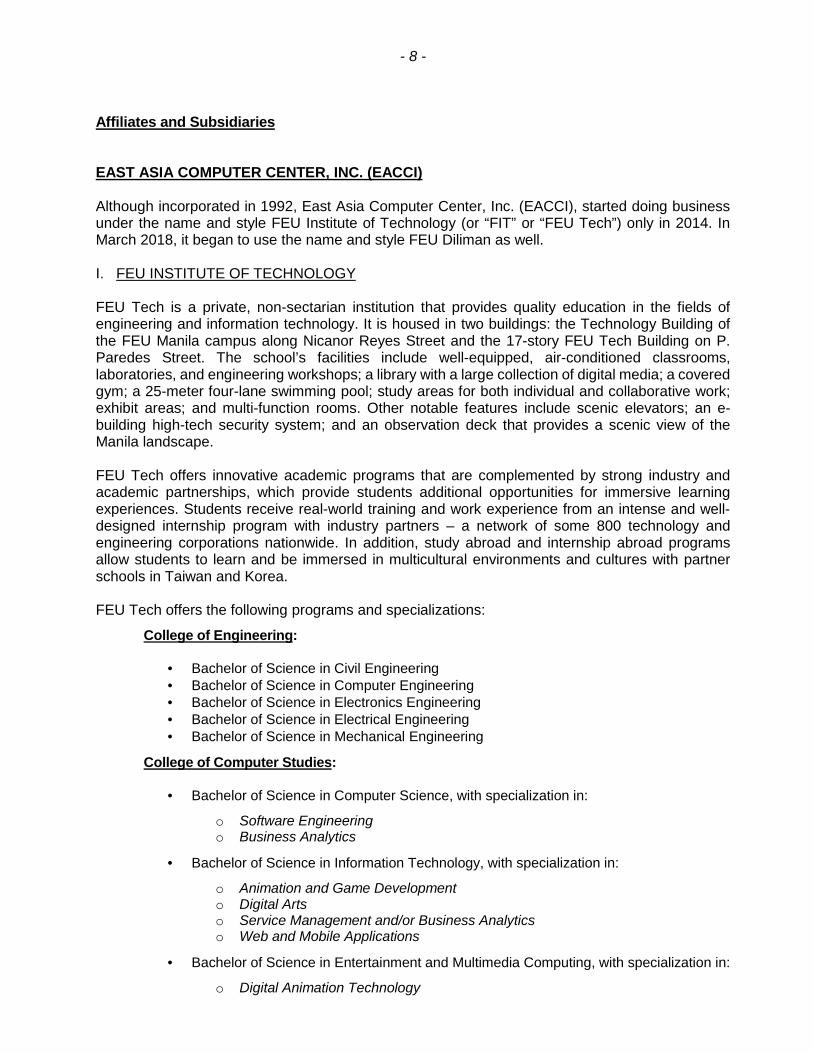
Affiliates and Subsidiaries
EAST ASIA COMPUTER CENTER, INC. (EACCI)
Although incorporated in 1992, East Asia Computer Center, Inc. (EACCI), started doing businessunder the name and style FEU Institute of Technology (or “FIT” or “FEU Tech”) only in 2014. InMarch 2018, it began to use the name and style FEU Diliman as well.
I. FEU INSTITUTE OF TECHNOLOGY
FEU Tech is a private, non-sectarian institution that provides quality education in the fields ofengineering and information technology. It is housed in two buildings: the Technology Building ofthe FEU Manila campus along Nicanor Reyes Street and the 17-story FEU Tech Building on P.Paredes Street. The school’s facilities include well-equipped, air-conditioned classrooms,laboratories, and engineering workshops; a library with a large collection of digital media; a coveredgym; a 25-meter four-lane swimming pool; study areas for both individual and collaborative work;exhibit areas; and multi-function rooms. Other notable features include scenic elevators; an e-building high-tech security system; and an observation deck that provides a scenic view of theManila landscape.
FEU Tech offers innovative academic programs that are complemented by strong industry andacademic partnerships, which provide students additional opportunities for immersive learningexperiences. Students receive real-world training and work experience from an intense and well-designed internship program with industry partners – a network of some 800 technology andengineering corporations nationwide. In addition, study abroad and internship abroad programsallow students to learn and be immersed in multicultural environments and cultures with partnerschools in Taiwan and Korea.
FEU Tech offers the following programs and specializations:
College of Engineering:
Bachelor of Science in Civil Engineering Bachelor of Science in Computer Engineering Bachelor of Science in Electronics Engineering Bachelor of Science in Electrical Engineering Bachelor of Science in Mechanical Engineering
College of Computer Studies:
Bachelor of Science in Computer Science, with specialization in:
o Software Engineeringo Business Analytics
Bachelor of Science in Information Technology, with specialization in:
o Animation and Game Developmento Digital Artso Service Management and/or Business Analyticso Web and Mobile Applications
Bachelor of Science in Entertainment and Multimedia Computing, with specialization in:
o Digital Animation Technology
- 9 -
II. FEU DILIMAN
FEU Diliman is a private, non-sectarian educational institution with a 10-hectare campus that islocated in in Mapayapa Village, Quezon City. Its offerings cover the full spectrum of kindergarten,grade school, junior high school, senior high school, and college.
For basic education, FEU Diliman delivers an advanced curriculum in English, Science, andMathematics, which integrates 21st-century skills development. Students are provided with holisticdevelopment through engagement in sports, culture, values formation, and socio-civic activities andprograms. Value-added courses are embedded primarily to prepare the FEU Diliman basiceducation graduates to pursue higher education in the top universities of the country.
For higher education, FEU Diliman is working toward becoming a professional institution that isrecognized for the business and information technology fusion of its academic programs.Professional core courses for technical proficiency and internship for real-world practice form thecore of the curriculum. Technology-driven, non-traditional delivery strategies allow higher levels ofstudent engagement and motivation to achieve the intended learning goals. Graduates areenvisioned to be technology-empowered, highly qualified, and principled professionals and leaderspoised to provide innovative solutions to the future challenges of their work places.
The college offerings of FEU Diliman include:
BS Accountancy BS Business Administration major in Marketing Management BS Business Administration major in Financial Management BS Business Administration major in Operations Management

- 10 -
III. FEU ALABANG, INC.
Founded on July 21, 2016, FEU Alabang, Inc., carries Far Eastern University’s mission to providequality education to the south of Metro Manila. It is located in Filinvest City, Alabang, one of themost progressive areas in Southern Metro Manila. Set to open in August 2018, the 1.8-hectarecampus will welcome students to its 17-story academic building, which will come equipped withmodern classrooms and laboratories, as well as a campus accented by lush green spaces andfeaturing a 200-seat chapel and gymnasium.
FEU Alabang will be offering the following programs:
Senior High School Science, Technology, Engineering, and Mathematics (STEM) Accountancy, Business, and Management (ABM) Humanities and Social Science (HUMSS) General Academic Strand (GAS)
College of Engineering Bachelor of Science in Civil Engineering Bachelor of Science in Computer Engineering Bachelor of Science in Electronics Engineering Bachelor of Science in Electrical Engineering Bachelor of Science in Mechanical Engineering Bachelor of Science in Manufacturing Engineering
College of Computer Studies and Multimedia Arts Bachelor of Arts in Multimedia Arts Bachelor of Science in Computer Science Bachelor of Science in Entertainment and Multimedia Computing
- 11 -
IV. FAR EASTERN COLLEGE SILANG, INC.
Established in 2009, Far Eastern College Silang, Inc., is doing business under the name and styleof FEU Cavite, and is the first subsidiary of Far Eastern University, Inc., outside Metro Manila. It islocated inside MetroGate Silang Estates, a gated community in Silang, Cavite, and hence servesas the “Home of the Tamaraws in the South. It admitted its first batch of pre-school, grade school,and college students in June 2010 and of senior high school students in 2016.
FEU Cavite aspires to be a school of choice in the Southern Tagalog region by pursuing the twingoals of inculcating a love for learning among its students and being an engine for the region’scommunity development. It seeks to develop its students as values-driven, service-oriented, andfuture-ready global citizens through a technology-empowered and individualized learning system.Its social mission is to fuel community growth by heritage preservation and environmentalstewardship.
FEU Cavite offers the following programs:
Basic Education Department (BED)
Pre-kindergarten Kindergarten Grade School Junior High School
Senior High School (SHS) Department
Academic Tracks Science, Technology, Engineering, and Mathematics Accountancy, Business Management Humanities and Social Sciences
Higher Education Department (HED)
Bachelor of Science in AccountancyBachelor of Science in Accounting TechnologyBachelor of Science in Business AdministrationBachelor in Elementary and Secondary EducationBachelor of Science in Hotel and Restaurant ManagementBachelor of Science in Information TechnologyBachelor of Science in Tourism ManagementBachelor of Science in PsychologyTESDA-accredited course on Bread and Pastry Production
- 12 -
V. FEU HIGH SCHOOL, INC.
Far Eastern University High School (FEU HS), Inc., was established as a subsidiary of Far EasternUniversity, Inc., in 2013 in response to Republic Act No. 10533, the “Enhanced Basic EducationAct of 2013,” which extended the Philippine basic education program to 13 years, adding Grades11 and 12 to the secondary education level. Nestled inside the FEU Manila Campus, FEU HSopened its doors to its first batch of senior high school students in June 2016.
Guided by the core values of Fortitude, Excellence, and Uprightness, FEU High School providesquality education that prepares its graduates for college, the world of work, and life. Its curriculumis student-centered, values-oriented, and competency-laden; its delivery methods technology-enabled, and its learning activities project-based.
FEU HS offers the following strands under the academic track of the senior high school program:Science, Technology, Engineering, and Mathematics (STEM); Accountancy, Business, andManagement (ABM); Humanities and Social Sciences (HUMSS); and the General Academic Strand(GAS).

- 13 -
VI. ROOSEVELT COLLEGE, INC.
Roosevelt College, Inc. (RCI), has a long history of establishing good-quality nonsectarian privatehigh schools, first as Marikina Academy in 1933 and as RCI starting 1946. Soon after its founding,the academy ranked among the top 20 of the 70 private high schools in the Philippines.
RCI became a member of the Far Eastern University (FEU) group of schools in May 2016 whenFEU purchased 79.72% of the outstanding capital stock of RCI and gained management control ofall its existing campuses as well as affiliated companies. Significantly contributing to the expansionof the FEU group’s geographic and demographic footprint and to the growth of its basic educationprogram, RCI is expected to carry forward FEU’s mark of offering quality educational programs andfacilities while improving its accessibility to more Filipino families.
RCI envisions the formation of a productive and responsible citizenry empowered througheducation. It offers the following degree programs and short programs:
Basic Education Program: K-12
Developmental Kindergarten for 4-year olds (RCI Cainta and RCI Rodriguez)
Special Science Program for Junior High School students with high aptitude in Science, Math,and English (RCI Cainta)
Senior High Schoolo Academic Track: ABM, HUMSS, and STEM strandso Tech-Vocational: Home Economics strand (RCI Rodriguez)
Tertiary Education (RCI Cainta except if otherwise indicated)
Undergraduate Programs AB Broadcasting
o AB Psychology (RCI Marikina)o Bachelor of Elementary Education with Specialization in Early Childhood Educationo Bachelor of Elementary Education with Specialization in Special Educationo Bachelor of Secondary Education Major in Englisho Bachelor of Secondary Education Major in Mathematicso Bachelor of Secondary Education Major in Music, Arts, Physical Education and
Healtho BS Information Technology (RCI Marikina)o BSBA Human Resources Management (RCI Marikina)o BSBA Operations Management (RCI Marikina)o BS Hotel and Restaurant Management
Graduate Programo MA in Education Major in Educational Managemento MA in Education Major in Educational Technologyo MA in Education Major in Teaching in the Early Gradeso MA in Education Major in Social Studieso MA in Education Major in Filipino Educationo MA in Education Major in Mathematics Educationo MA in Education Major in Science Educationo MA in Education Major in English Studies & Instructiono MA in Education Major in Guidance & Counsellingo MA in Education Major in Special Educationo Teacher Certificate Program
- 14 -
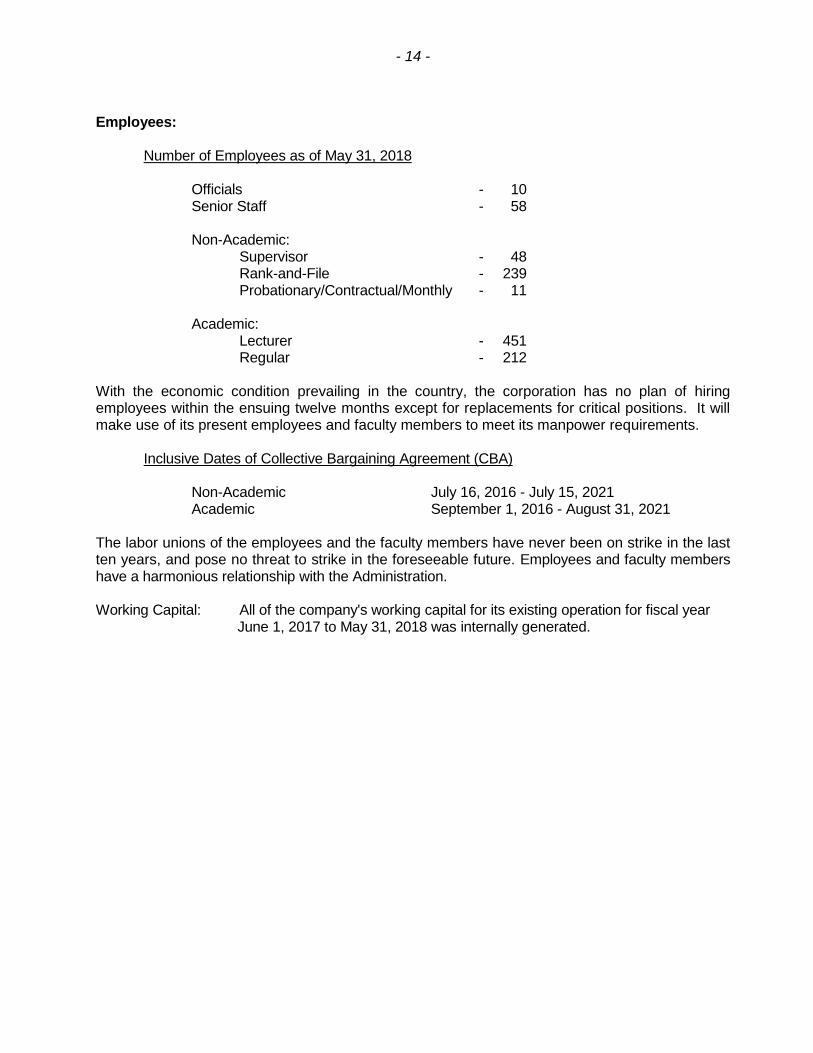
Employees:
Number of Employees as of May 31, 2018
Officials - 10Senior Staff - 58
Non-Academic:Supervisor - 48Rank-and-File - 239Probationary/Contractual/Monthly - 11
Academic:Lecturer - 451Regular - 212
With the economic condition prevailing in the country, the corporation has no plan of hiringemployees within the ensuing twelve months except for replacements for critical positions. It willmake use of its present employees and faculty members to meet its manpower requirements.
Inclusive Dates of Collective Bargaining Agreement (CBA)
Non-Academic July 16, 2016 - July 15, 2021Academic September 1, 2016 - August 31, 2021
The labor unions of the employees and the faculty members have never been on strike in the lastten years, and pose no threat to strike in the foreseeable future. Employees and faculty membershave a harmonious relationship with the Administration.
Working Capital: All of the company's working capital for its existing operation for fiscal yearJune 1, 2017 to May 31, 2018 was internally generated.
- 15 -
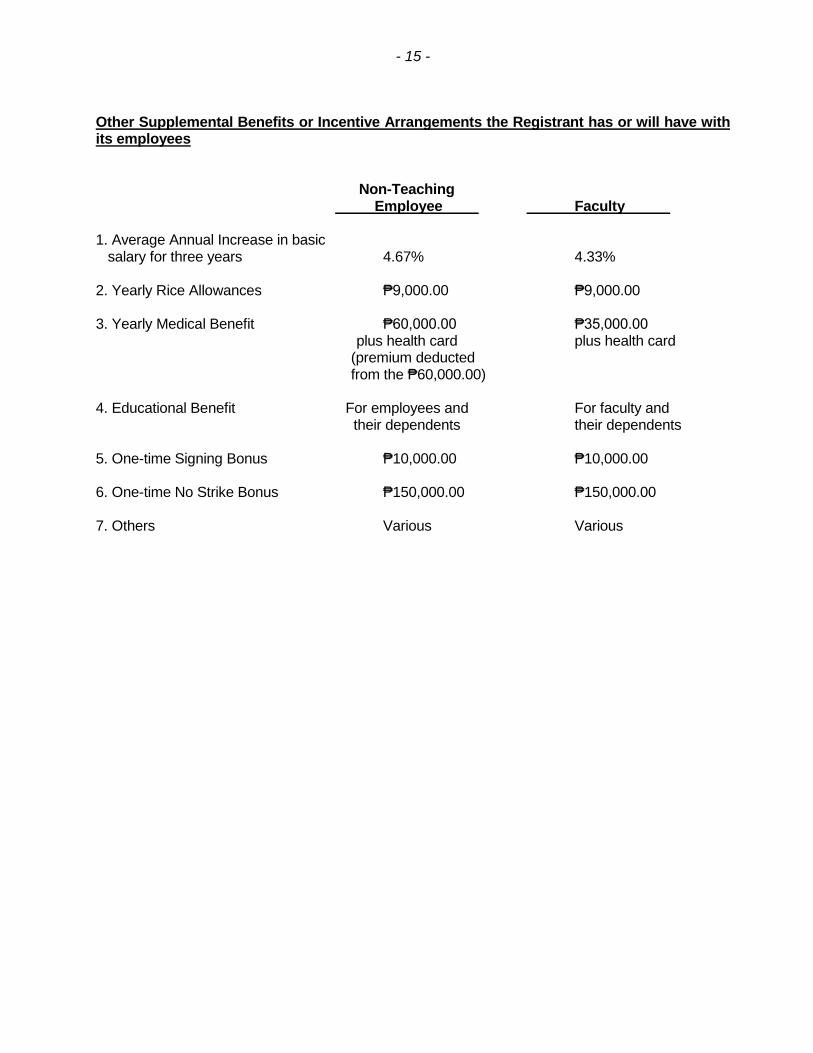
Other Supplemental Benefits or Incentive Arrangements the Registrant has or will have withits employees
Non-TeachingEmployee Faculty
1. Average Annual Increase in basicsalary for three years 4.67% 4.33%
2. Yearly Rice Allowances ₱9,000.00 ₱9,000.00
3. Yearly Medical Benefit ₱60,000.00 ₱35,000.00plus health card plus health card
(premium deductedfrom the ₱60,000.00)
4. Educational Benefit For employees and For faculty andtheir dependents their dependents
5. One-time Signing Bonus ₱10,000.00 ₱10,000.00
6. One-time No Strike Bonus ₱150,000.00 ₱150,000.00
7. Others Various Various
- 16 -
Risk Management and Objectives and Policies
The Group is exposed to certain financial risks in relation to financial instruments. Its main purposefor its dealings in financial instruments is to fund operational and capital expenditures. The BOThas the overall responsibility for the establishment and oversight of the Group’s risk managementframework. It has a risk management committee headed by an independent trustee that isresponsible for developing and monitoring the Group’s policies, which address risk managementareas. Management is responsible for monitoring compliance with the Group’s risk managementpolicies and procedures and for reviewing the adequacy of these policies in relation to the risksfaced by the Group.
The Group does not engage in trading of financial assets for speculative purposes nor does it writeoptions. The most significant financial risks to which the Group is exposed to are described in thesucceeding paragraphs.
Market Risk
Foreign Currency Risk
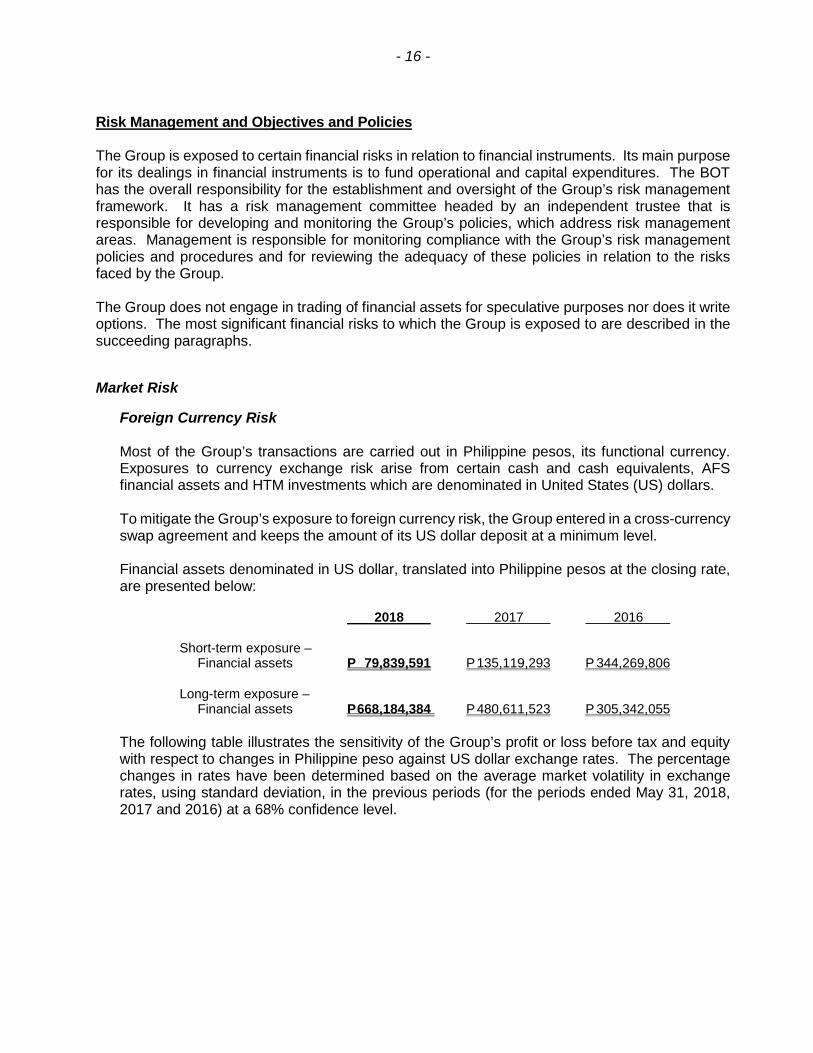
Most of the Group’s transactions are carried out in Philippine pesos, its functional currency.Exposures to currency exchange risk arise from certain cash and cash equivalents, AFSfinancial assets and HTM investments which are denominated in United States (US) dollars.
To mitigate the Group’s exposure to foreign currency risk, the Group entered in a cross-currencyswap agreement and keeps the amount of its US dollar deposit at a minimum level.
Financial assets denominated in US dollar, translated into Philippine pesos at the closing rate,are presented below:
2018 2017 2016
Short-term exposure –Financial assets P 79,839,591 P135,119,293 P 344,269,806
Long-term exposure –Financial assets P668,184,384 P480,611,523 P 305,342,055
The following table illustrates the sensitivity of the Group’s profit or loss before tax and equitywith respect to changes in Philippine peso against US dollar exchange rates. The percentagechanges in rates have been determined based on the average market volatility in exchangerates, using standard deviation, in the previous periods (for the periods ended May 31, 2018,2017 and 2016) at a 68% confidence level.
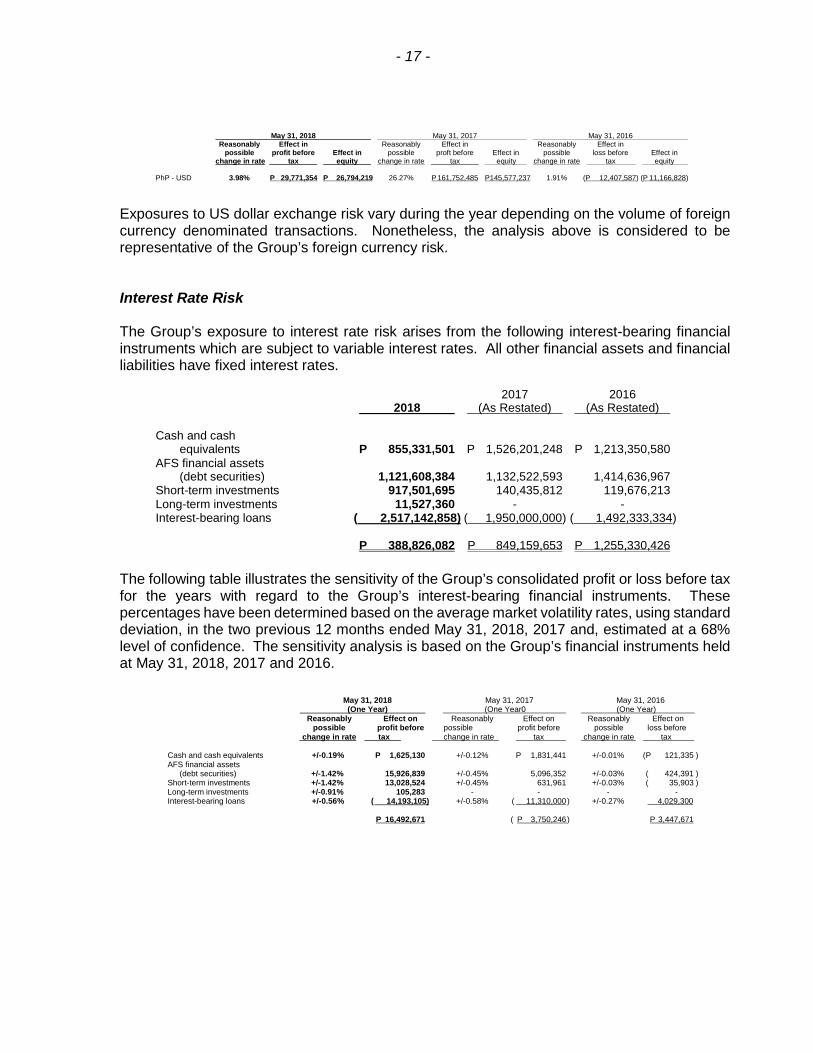
- 17 -
May 31, 2018 May 31, 2017 May 31, 2016Reasonably Effect in Reasonably Effect in Reasonably Effect in
possible profit before Effect in possible proft before Effect in possible loss before Effect inchange in rate tax equity change in rate tax equity change in rate tax equity
PhP - USD 3.98% P 29,771,354 P 26,794,219 26.27% P 161,752,485 P145,577,237 1.91% (P 12,407,587) (P 11,166,828)
Exposures to US dollar exchange risk vary during the year depending on the volume of foreigncurrency denominated transactions. Nonetheless, the analysis above is considered to berepresentative of the Group’s foreign currency risk.
Interest Rate Risk
The Group’s exposure to interest rate risk arises from the following interest-bearing financialinstruments which are subject to variable interest rates. All other financial assets and financialliabilities have fixed interest rates.
2017 20162018 (As Restated) (As Restated)
Cash and cashequivalents P 855,331,501 P 1,526,201,248 P 1,213,350,580
AFS financial assets(debt securities) 1,121,608,384 1,132,522,593 1,414,636,967
Short-term investments 917,501,695 140,435,812 119,676,213Long-term investments 11,527,360 - -Interest-bearing loans ( 2,517,142,858) ( 1,950,000,000) ( 1,492,333,334)
P 388,826,082 P 849,159,653 P 1,255,330,426
The following table illustrates the sensitivity of the Group’s consolidated profit or loss before taxfor the years with regard to the Group’s interest-bearing financial instruments. Thesepercentages have been determined based on the average market volatility rates, using standarddeviation, in the two previous 12 months ended May 31, 2018, 2017 and, estimated at a 68%level of confidence. The sensitivity analysis is based on the Group’s financial instruments heldat May 31, 2018, 2017 and 2016.
May 31, 2018 May 31, 2017 May 31, 2016(One Year) (One Year0 (One Year)
Reasonably Effect on Reasonably Effect on Reasonably Effect onpossible profit before possible profit before possible loss before
change in rate tax change in rate tax change in rate tax
Cash and cash equivalents +/-0.19% P 1,625,130 +/-0.12% P 1,831,441 +/-0.01% (P 121,335 )AFS financial assets
(debt securities) +/-1.42% 15,926,839 +/-0.45% 5,096,352 +/-0.03% ( 424,391 )Short-term investments +/-1.42% 13,028,524 +/-0.45% 631,961 +/-0.03% ( 35,903 )Long-term investments +/-0.91% 105,283 - - - -Interest-bearing loans +/-0.56% ( 14,193,105) +/-0.58% ( 11,310,000) +/-0.27% 4,029,300
P 16,492,671 ( P 3,750,246) P 3,447,671
- 18 -
Other Price Risk
The Group’s exposure to price risk arises from its investments in equity securities, which areclassified as part of the AFS Financial Assets account in the consolidated statements of financialposition. These consist of publicly-listed equity securities which are carried at fair value.
Management monitors its equity securities in its investment portfolio based on market indices.Material investments within the portfolio are managed on an individual basis.
For equity securities listed in the Philippines, an average volatility of 10.57%, 12.71% and 5.61%have been observed for the periods ended May 31, 2018, 2017 and 2016, respectively. If quotedprices for these securities increased or decreased by that percentage, other comprehensiveincome (loss) would have changed by P79.8 million, P105.6 million and P42.3 million for theperiods ended May 31, 2018, 2017 and 2016, respectively.
No sensitivity analysis was provided for government and corporate bonds, and investments inUITF classified as AFS financial assets as management deemed that the risk at the end of theperiod is not representative of a risk inherent in financial instruments.
The investments are considered medium to long-term strategic investments. In accordancewith the Group’s policies, no specific hedging activities are undertaken in relation to theseinvestments, except as discussed in Notes 10 and 11 of the consolidated financial statements,in connection with its investment in certain foreign currency denominated corporate debtinstruments which are also subject to a cross-currency swap agreement. The investments arecontinuously monitored to ensure that returns of these equity instruments are timely utilized orreinvested in the Group’s favor.
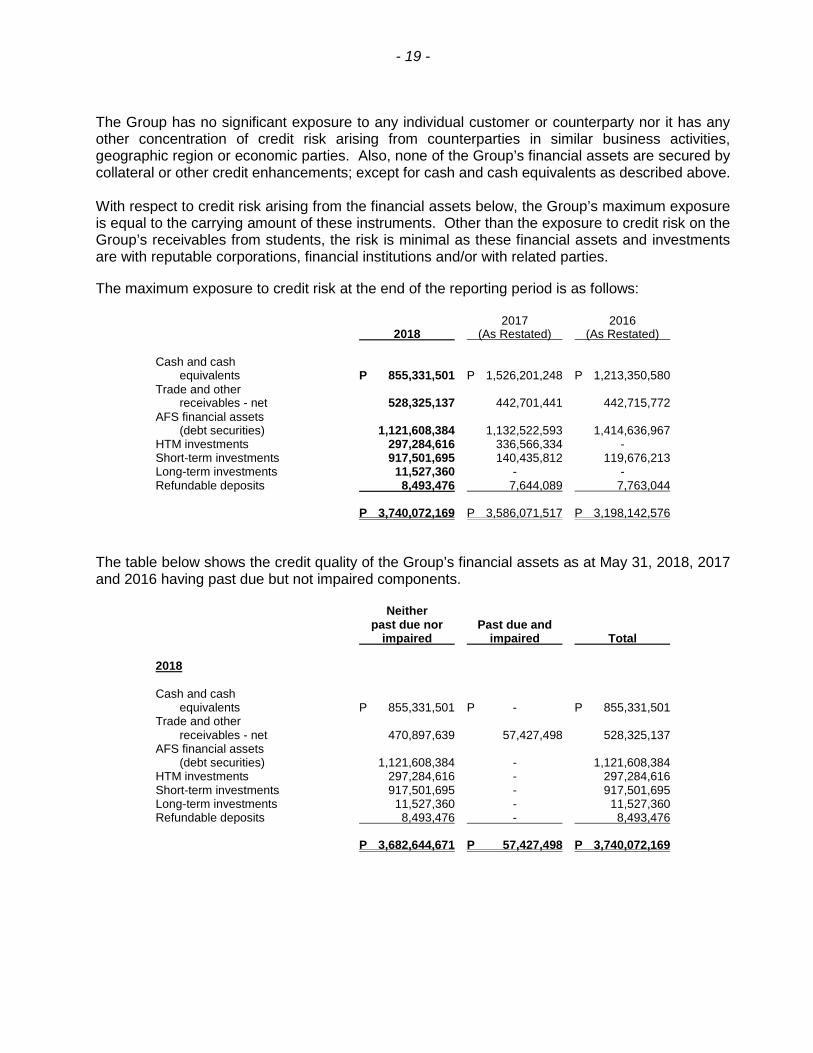
Credit Risk
Credit risk represents the loss that the Group would incur if the counterparty fails to perform itscontractual obligations. The credit risk for cash and cash equivalents, short-term investments(presented as part of Other Current Assets), AFS financial assets and HTM investments isconsidered negligible, since the counterparties are reputable financial institutions and privatecompanies with high quality external credit ratings. Included in the cash and cash equivalents arecash in banks and short-term placements. These are insured by the Philippine Deposit InsuranceCorporation up to a maximum coverage of P0.5 million for every depositor per banking institution.
The Group’s exposure to credit risk on its receivables related primarily to the inability of the debtorsto pay and students to fully settle the unpaid balance of tuition fees and other charges which areowed to the Group based on installment payment schemes. The Group has established controlsand procedures to minimize risks of non-collection. Students are not allowed to enroll in thefollowing semester unless the unpaid balance in the previous semester has been paid. The Groupalso withholds the academic records and clearance of the students with unpaid balances, thusensuring that collectability is reasonably assured. The Group’s exposure to credit risk on its otherreceivables from debtors and related parties is managed through close account monitoring andsetting limits.
- 19 -
The Group has no significant exposure to any individual customer or counterparty nor it has anyother concentration of credit risk arising from counterparties in similar business activities,geographic region or economic parties. Also, none of the Group’s financial assets are secured bycollateral or other credit enhancements; except for cash and cash equivalents as described above.
With respect to credit risk arising from the financial assets below, the Group’s maximum exposureis equal to the carrying amount of these instruments. Other than the exposure to credit risk on theGroup’s receivables from students, the risk is minimal as these financial assets and investmentsare with reputable corporations, financial institutions and/or with related parties.
The maximum exposure to credit risk at the end of the reporting period is as follows:
2017 20162018 (As Restated) (As Restated)
Cash and cashequivalents P 855,331,501 P 1,526,201,248 P 1,213,350,580
Trade and otherreceivables - net 528,325,137 442,701,441 442,715,772
AFS financial assets(debt securities) 1,121,608,384 1,132,522,593 1,414,636,967
HTM investments 297,284,616 336,566,334 -Short-term investments 917,501,695 140,435,812 119,676,213Long-term investments 11,527,360 - -Refundable deposits 8,493,476 7,644,089 7,763,044
P 3,740,072,169 P 3,586,071,517 P 3,198,142,576
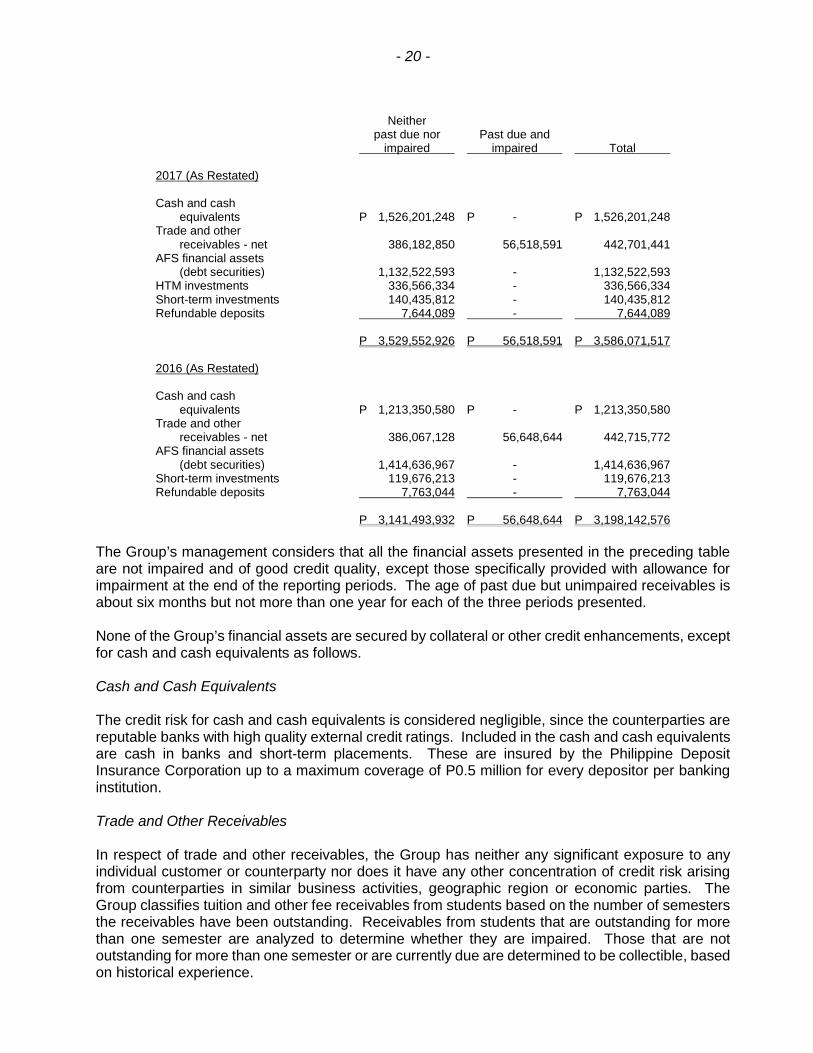
The table below shows the credit quality of the Group’s financial assets as at May 31, 2018, 2017and 2016 having past due but not impaired components.
Neitherpast due nor Past due and
impaired impaired Total
2018
Cash and cashequivalents P 855,331,501 P - P 855,331,501
Trade and otherreceivables - net 470,897,639 57,427,498 528,325,137
AFS financial assets(debt securities) 1,121,608,384 - 1,121,608,384
HTM investments 297,284,616 - 297,284,616Short-term investments 917,501,695 - 917,501,695Long-term investments 11,527,360 - 11,527,360Refundable deposits 8,493,476 - 8,493,476
P 3,682,644,671 P 57,427,498 P 3,740,072,169
- 20 -
Neitherpast due nor Past due and
impaired impaired Total
2017 (As Restated)
Cash and cashequivalents P 1,526,201,248 P - P 1,526,201,248
Trade and otherreceivables - net 386,182,850 56,518,591 442,701,441
AFS financial assets(debt securities) 1,132,522,593 - 1,132,522,593
HTM investments 336,566,334 - 336,566,334Short-term investments 140,435,812 - 140,435,812Refundable deposits 7,644,089 - 7,644,089
P 3,529,552,926 P 56,518,591 P 3,586,071,517
2016 (As Restated)
Cash and cashequivalents P 1,213,350,580 P - P 1,213,350,580
Trade and otherreceivables - net 386,067,128 56,648,644 442,715,772
AFS financial assets(debt securities) 1,414,636,967 - 1,414,636,967
Short-term investments 119,676,213 - 119,676,213Refundable deposits 7,763,044 - 7,763,044
P 3,141,493,932 P 56,648,644 P 3,198,142,576
The Group’s management considers that all the financial assets presented in the preceding tableare not impaired and of good credit quality, except those specifically provided with allowance forimpairment at the end of the reporting periods. The age of past due but unimpaired receivables isabout six months but not more than one year for each of the three periods presented.
None of the Group’s financial assets are secured by collateral or other credit enhancements, exceptfor cash and cash equivalents as follows.
Cash and Cash Equivalents
The credit risk for cash and cash equivalents is considered negligible, since the counterparties arereputable banks with high quality external credit ratings. Included in the cash and cash equivalentsare cash in banks and short-term placements. These are insured by the Philippine DepositInsurance Corporation up to a maximum coverage of P0.5 million for every depositor per bankinginstitution.
Trade and Other Receivables
In respect of trade and other receivables, the Group has neither any significant exposure to anyindividual customer or counterparty nor does it have any other concentration of credit risk arisingfrom counterparties in similar business activities, geographic region or economic parties. TheGroup classifies tuition and other fee receivables from students based on the number of semestersthe receivables have been outstanding. Receivables from students that are outstanding for morethan one semester are analyzed to determine whether they are impaired. Those that are notoutstanding for more than one semester or are currently due are determined to be collectible, basedon historical experience.
- 21 -
Financial Assets at FVTL and AFS Financial Assets
AFS financial assets and HTM investments are coursed through reputable financial institutions andprivate corporations duly approved by the BOT of the University and BOD of the subsidiaries.
Liquidity Risk
The Group manages liquidity risk by maintaining a balance between continuity of funding andflexibility. Treasury controls and procedures are in place to ensure that sufficient cash is maintainedto cover daily operational and working capital requirements. Management closely monitors theGroup’s future and contingent obligations and ensures that future cash collections are sufficient tomeet them in accordance with internal policies. The Group invests in short-term placements whenexcess cash is obtained from operations.
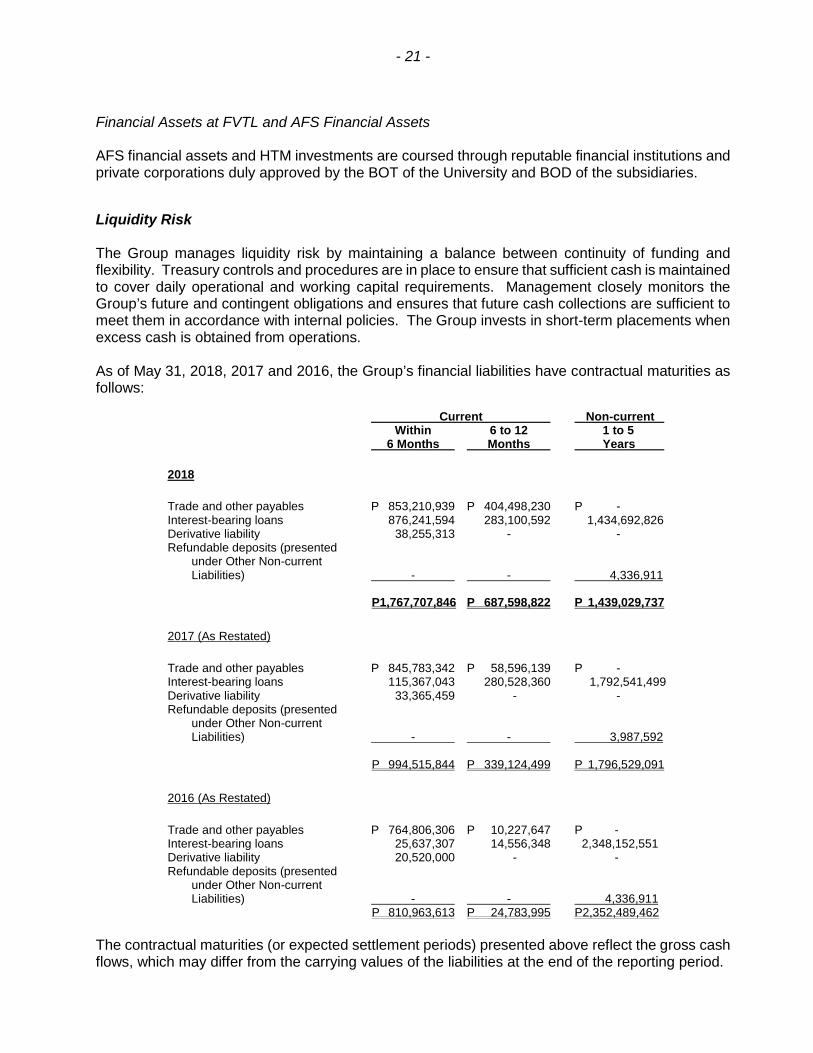
As of May 31, 2018, 2017 and 2016, the Group’s financial liabilities have contractual maturities asfollows:
Current Non-currentWithin 6 to 12 1 to 5
6 Months Months Years
2018
Trade and other payables P 853,210,939 P 404,498,230 P -Interest-bearing loans 876,241,594 283,100,592 1,434,692,826Derivative liability 38,255,313 - -Refundable deposits (presented
under Other Non-currentLiabilities) - - 4,336,911
P1,767,707,846 P 687,598,822 P 1,439,029,737
2017 (As Restated)
Trade and other payables P 845,783,342 P 58,596,139 P -Interest-bearing loans 115,367,043 280,528,360 1,792,541,499Derivative liability 33,365,459 - -Refundable deposits (presented
under Other Non-currentLiabilities) - - 3,987,592
P 994,515,844 P 339,124,499 P 1,796,529,091
2016 (As Restated)
Trade and other payables P 764,806,306 P 10,227,647 P -Interest-bearing loans 25,637,307 14,556,348 2,348,152,551Derivative liability 20,520,000 - -Refundable deposits (presented
under Other Non-currentLiabilities) - - 4,336,911
P 810,963,613 P 24,783,995 P2,352,489,462
The contractual maturities (or expected settlement periods) presented above reflect the gross cashflows, which may differ from the carrying values of the liabilities at the end of the reporting period.
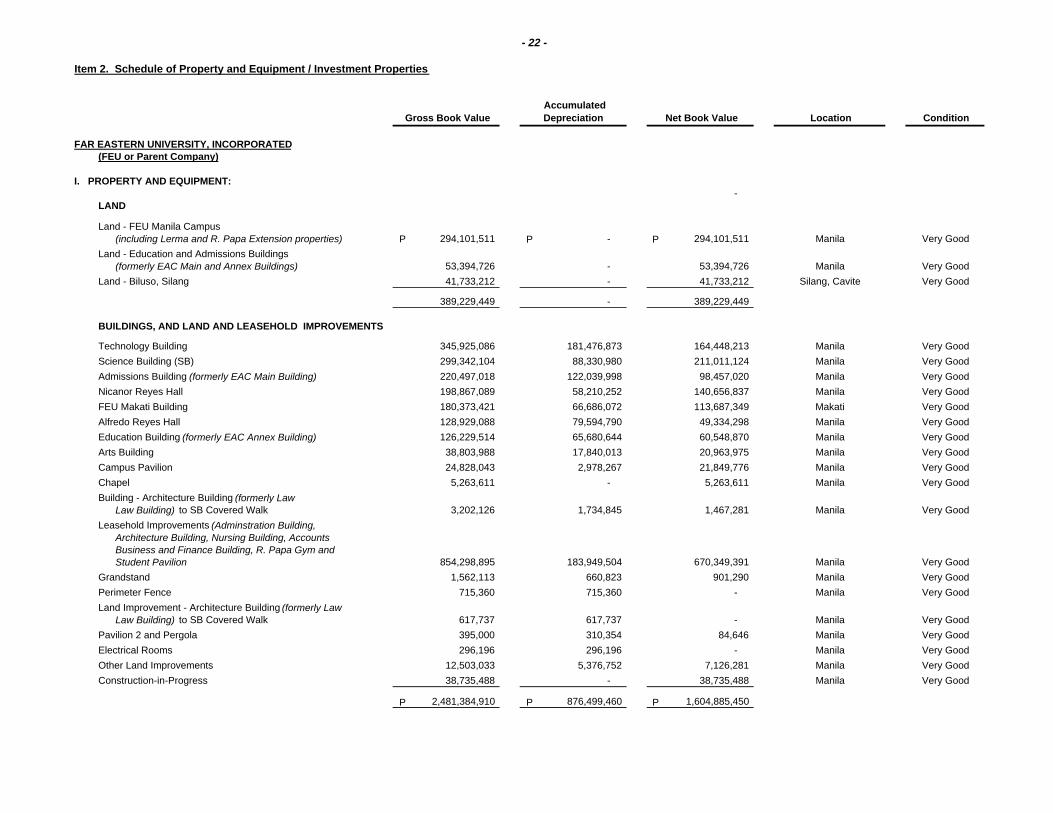
Item 2. Schedule of Property and Equipment / Investment Properties
Gross Book Value AccumulatedDepreciation Net Book Value Location Condition
FAR EASTERN UNIVERSITY, INCORPORATED(FEU or Parent Company)
I. PROPERTY AND EQUIPMENT:-
LAND
Land - FEU Manila Campus(including Lerma and R. Papa Extension properties) 294,101,511 - 294,101,511 Manila Very Good
Land - Education and Admissions Buildings(formerly EAC Main and Annex Buildings) 53,394,726 - 53,394,726 Manila Very Good
Land - Biluso, Silang 41,733,212 - 41,733,212 Silang, Cavite Very Good
389,229,449 - 389,229,449
BUILDINGS, AND LAND AND LEASEHOLD IMPROVEMENTS
Technology Building 345,925,086 181,476,873 164,448,213 Manila Very GoodScience Building (SB) 299,342,104 88,330,980 211,011,124 Manila Very GoodAdmissions Building (formerly EAC Main Building) 220,497,018 122,039,998 98,457,020 Manila Very GoodNicanor Reyes Hall 198,867,089 58,210,252 140,656,837 Manila Very GoodFEU Makati Building 180,373,421 66,686,072 113,687,349 Makati Very GoodAlfredo Reyes Hall 128,929,088 79,594,790 49,334,298 Manila Very GoodEducation Building (formerly EAC Annex Building) 126,229,514 65,680,644 60,548,870 Manila Very GoodArts Building 38,803,988 17,840,013 20,963,975 Manila Very GoodCampus Pavilion 24,828,043 2,978,267 21,849,776 Manila Very GoodChapel 5,263,611 - 5,263,611 Manila Very GoodBuilding - Architecture Building (formerly Law
Law Building) to SB Covered Walk 3,202,126 1,734,845 1,467,281 Manila Very GoodLeasehold Improvements (Adminstration Building,
Architecture Building, Nursing Building, AccountsBusiness and Finance Building, R. Papa Gym andStudent Pavilion 854,298,895 183,949,504 670,349,391 Manila Very Good
Grandstand 1,562,113 660,823 901,290 Manila Very GoodPerimeter Fence 715,360 715,360 - Manila Very GoodLand Improvement - Architecture Building (formerly Law
Law Building) to SB Covered Walk 617,737 617,737 - Manila Very GoodPavilion 2 and Pergola 395,000 310,354 84,646 Manila Very GoodElectrical Rooms 296,196 296,196 - Manila Very GoodOther Land Improvements 12,503,033 5,376,752 7,126,281 Manila Very GoodConstruction-in-Progress 38,735,488 - 38,735,488 Manila Very Good
2,481,384,910 876,499,460 1,604,885,450
- 22 -
P P P
P P P
Gross Book Value AccumulatedDepreciation Net Book Value Location Condition
FURNITURE, FIXTURES AND EQUIPMENTS
Information Technology 206,886,772 172,660,582 34,226,190 Manila Very GoodElectrical and Mechanical 153,709,820 123,391,749 30,318,071 Manila Very GoodFurnitures and Fixtures 102,843,990 76,715,655 26,128,335 Manila Very GoodLaboratory 51,101,533 36,437,981 14,663,552 Manila Very GoodTransportation 40,270,130 38,095,799 2,174,331 Manila Very GoodMuseum Collection 11,429,266 - 11,429,266 Manila Very GoodAthletic and Sports 4,914,491 2,347,128 2,567,363 Manila Very GoodMusical Instrument 4,070,620 2,987,439 1,083,181 Manila Very GoodTools 1,693,527 1,557,417 136,110 Manila Very GoodMiscellaneous Fixed Assets 103,703,682 103,703,682 - Manila Very Good
680,623,831 557,897,432 122,726,399
TOTAL PROPERTY AND EQUIPMENT 3,551,238,190 1,434,396,892 2,116,841,298
II. INVESTMENT PROPERTIES:
LAND
Land - Filinvest Alabang 1,076,829,849 - 1,076,829,849 Muntinlupa City Very Good
BUILDINGS
FEU Cavite Building I 205,592,198 60,363,411 145,228,787 Silang, Cavite Very GoodFEU Cavite Building II 222,844,542 64,780,539 158,064,003 Silang, Cavite Very Good
428,436,740 125,143,950 303,292,790
TOTAL INVESTMENT PROPERTIES 1,505,266,589 125,143,950 1,380,122,639
TOTAL FIXED ASSETS OF FEU 5,056,504,779 1,559,540,842 3,496,963,937
- 23 -
P P P
P P P
P P P
P P P
Gross Book Value AccumulatedDepreciation Net Book Value Location Condition
FERN REALTY CORPORATION (FRC)
I. INVESTMENT PROPERTIES:
LAND
Land - FEU Makati Campus 212,850,736 - 212,850,736 Makati City Very GoodLand - FEU Cavite Campus 113,703,104 - 113,703,104 Silang, Cavite Very GoodLand - FEU Campus Site I (Administration Building,
Nursing Building, Accounts Business and FinanceBuilding, Architecture Building and Open Spaces) 82,805,600 - 82,805,600 Manila Very Good
Land - FEU Campus Site II (Fern Building, FEU Instituteof Technology Building and R. Papa Gym) 67,253,504 - 67,253,504 Manila Very Good
Land - Ferndale Villas 6,810,000 - 6,810,000 Quezon City Very GoodLand - Sampaguita Ave., Quezon City 3,714,946 - 3,714,946 Quezon City Very Good
487,137,890 - 487,137,890
LAND IMPROVEMENTS 5,680,643 4,151,120 1,529,523 Various Very Good
BUILDINGS
FEU Buildings 98,443,463 39,531,889 58,911,574 Manila Very GoodFEU Cavite Dormitory 38,094,317 2,095,187 35,999,130 Silang, Cavite Very GoodFerndale Villas 29,879,244 870,701 29,008,543 Quezon City Very GoodRoxas Land Condominium 28,845,964 12,907,032 15,938,932 Makati City Very GoodSerendra Condominium 26,370,590 2,757,192 23,613,398 Taguig City Very GoodLerato Condominium 15,266,622 381,666 14,884,956 Makati City Very GoodFern College Building 12,614,023 5,304,905 7,309,118 Quezon City Very Good
249,514,223 63,848,572 185,665,651
BUILDING IMPROVEMENTS 14,891,189 10,731,482 4,159,707 Various Very Good
CONSTRUCTION IN PROGRESS 26,622,362 - 26,622,362
Makati City /Taguig City /Silang Cavite Very Good
TOTAL INVESTMENT PROPERTIES 783,846,307 78,731,174 705,115,133
II. TRANSPORTATION AND OTHER EQUIPMENT(OTHER CURRENT ASSETS)
Transportation Equipment 8,236,606 6,034,425 2,202,181 Manila Very GoodOffice Furniture and Other Equipment 4,933,399 2,456,988 2,476,411 Manila Very Good
TOTAL TRANSPORTATION AND OTHER EQUIPMENT 13,170,005 8,491,413 4,678,592
TOTAL FIXED ASSETS OF FRC 797,016,312 87,222,587 709,793,725
- 24 -
P P P
P P P
P P P
P P P
Gross Book Value AccumulatedDepreciation Net Book Value Location Condition
EAST ASIA COMPUTER CENTER, INC. (EACCI)
PROPERTY AND EQUIPMENT:
Buildings 1,006,763,485 190,022,062 816,741,423 Manila Very GoodMachinery and Equipment 41,278,555 37,788,540 3,490,015 Manila Very GoodLaboratory Tools 35,880,792 17,921,674 17,959,118 Manila Very GoodFurniture and Fixtures 22,782,382 12,639,182 10,143,200 Manila Very GoodBuilding improvements 11,664,801 2,397,771 9,267,030 Manila Very GoodComputer Equipment 14,418,329 7,808,326 6,610,003 Manila Very GoodLeasehold Improvements 6,030,564 1,061,981 4,968,583 Manila Very GoodConstruction-in-Progress 74,547,378 - 74,547,378 Manila / Quezon City Very Good
TOTAL FIXED ASSETS OF EACCI 1,213,366,286 269,639,536 943,726,750
FAR EASTERN COLLEGE - SILANG, INC. (FECSI)
PROPERTY AND EQUIPMENT:
Computer Equipment 27,013,629 18,650,406 8,363,223 Silang, Cavite Very GoodLeasehold Improvements 15,761,165 5,649,652 10,111,513 Silang, Cavite Very GoodFurnitures and Fixtures 10,213,566 7,649,623 2,563,943 Silang, Cavite Very GoodTools and Equipment 9,135,385 7,181,618 1,953,767 Silang, Cavite Very GoodLibrary Books 6,914,730 4,733,326 2,181,404 Silang, Cavite Very GoodTransportation Equipment 1,052,500 373,331 679,169 Silang, Cavite Very GoodConstruction-in-Progress 1,988,625 - 1,988,625 Silang, Cavite Very Good
TOTAL FIXED ASSETS OF FECSI 72,079,600 44,237,956 27,841,644
FEU HIGH SCHOOL, INC. (FEU High)
PROPERTY AND EQUIPMENT:
Leasehold Improvements 8,250,341 - 8,250,341 Manila Very GoodInformation Technology 8,529,872 4,758,856 3,771,016 Manila Very GoodFurniture and Fixtures 8,389,637 2,311,922 6,077,715 Manila Very GoodTransportation Equipment 1,677,000 167,700 1,509,300 Manila Very GoodElectrical and Mechanical 713,056 189,714 523,342 Manila Very GoodAthletic and Musical Instruments 385,138 91,610 293,528 Manila Very GoodLaboratory Equipment 297,350 90,899 206,451 Manila Very Good
TOTAL FIXED ASSETS OF FEU High 28,242,394 7,610,701 20,631,693
- 25 -
P P P
P P P
P P P
P P P
P P P
P P P
P PP
P PP
Gross Book Value AccumulatedDepreciation Net Book Value Location Condition
FEU ALABANG, INC. (FEUAI)
PROPERTY AND EQUIPMENT:
Construction-in-Progres (FEU Alabang Campus Buildings) 975,283,650 - 975,283,650 Muntinlupa City Very GoodOffice Equipment 38,300 9,575 28,725 Muntinlupa City Very Good
TOTAL FIXED ASSETS OF FEUAI 975,321,950 9,575 975,312,375
ROOSEVELT COLLEGE, INC. (RCI)
PROPERTY AND EQUIPMENT:
LAND
Cainta Campus 551,727,090 - 551,727,090 Cainta, Rizal Very GoodMarikina Campus 238,135,000 - 238,135,000 Marikina City Very GoodRodriguez Campus 64,341,000 - 64,341,000 Rodriguez, Rizal Very GoodSan Mateo Campus 40,816,000 - 40,816,000 San Mateo, Rizal Very GoodCubao Campus 105,300,000 - 105,300,000 Quezon City Very Good
1,000,319,090 - 1,000,319,090
BUILDINGS AND IMPROVEMENTS
Cainta Campus 92,138,854 88,921,826 3,217,028 Cainta, Rizal Very GoodMarikina Campus 81,789,846 81,283,239 506,607 Marikina City Very GoodRodriguez Campus 92,170,702 64,663,838 27,506,864 Rodriguez, Rizal Very GoodSan Mateo Campus 46,416,335 46,674,351 (258,016) San Mateo, Rizal Very GoodCubao Campus 12,360,807 12,313,137 47,670 Quezon City Very Good
324,876,544 293,856,392 31,020,152
FURNITURE, FIXTURES AND EQUIPMENTS
Classroom and Office Equipment 51,491,632 42,025,289 9,466,343Furniture and Fixtures 14,462,271 13,094,493 1,367,778Transportation Equipment 3,296,934 3,296,934 -
69,250,837 58,416,716 10,834,121 Various Campuses Very Good
CONSTRUCTION-IN-PROGRES 140,107,875 - 140,107,875 Various Campuses Very Good
TOTAL FIXED ASSETS OF RCI 1,534,554,346 352,273,108 1,182,281,238
TOTAL FIXED ASSETS OF THE GROUP 9,677,085,667 2,320,534,305 7,356,551,362
- 26 -
P P P
P P P
P P P
P P P
P P PP PP
P PP
P PP
PROPERTY LEASED BY FEU FROM FRC:
Annual Rental Current
Contract Period
Gymnasium Two (2) storey building made of concrete materials located at 9,927,658.27 April 1, 2018 toR. Papa St., Sampaloc, Manila plus applicable VAT March 31, 2019
Athletes' Quarters Ground floor (234.44 sq. meters) of a five (5) storey building 683,911.92 December 1, 2017 tomade of concrete materials located at P. Paredes corner plus applicable VAT November 30, 2018S.H. Loyola Streets, Sampaloc, Manila
Athletes' Quarters Portion of 2nd floor (790 sq. meters) of a five (5) storey building 2,801,255.52 December 1, 2017 tomade of concrete materials located at P. Paredes corner plus applicable VAT November 30, 2018S.H. Loyola Streets, Sampaloc, Manila
FEU Makati Campus Parcel of land (2,186 sq. meters) located at the Makati Central 8,967,701.35 December 1, 2017 toBusiness District bounded by Sen. Gil Puyat Avenue, plus applicable VAT November 30, 2018Malugay Street and Geronimo Street Makati City.
FEU Fern Bookstore Portion of Ground floor (48 sq. meters) of a five (5) storey building 115,188.29 February 11, 2017 tomade of concrete materials located at Sampaguita Avenue, plus applicable VAT January 10, 2018Barangay Pason Tamo, Quezon City.
FEU-Manila Buildings:
Eight (8) storey building made of concrete materials located at 62,052,477.03 July 1, 2017 toFEU Manila Campus, Nicanor Reyest St., Manila plus applicable VAT June 30, 2018
Nursing Building Eight (8) storey building made of concrete materials located at subject to 5%FEU Manila Campus, Nicanor Reyest St., Manila escalation yearly
Architecture Building (Law Building) Four (4) storey building made of concrete materials located atFEU Manila Campus, Nicanor Reyest St., Manila
Administration Building Four (4) storey building made of concrete materials located atFEU Manila Campus, Nicanor Reyest St., Manila
- 27 -
Accounts, Business and Finance Buidling(formerly Education Building)
PROPERTY LEASED BY FRC FROM FEU:Annual Rental Contract Date
FEU Foodcourt Mezzanine of the Technology Building with an area of 693 sq. meters 1,496,880.00 September 1, 2017 toplus applicable VAT August 31, 2018
PROPERTY LEASED BY FECSI FROM FEU:Annual Rental Contract Date
FEU - Cavite Buildings Two (2) concrete buildings located as Silang, Cavite 600,000.00 August 1, 2012 toplus applicable VAT July 31, 2022
on initial year,yearly rates to be
determined annually- or -
the amount equivalentto 5% of its grossannual revenues,
whichever is higher
PROPERTY LEASED BY EACCI (FEU INSTITUTE OF TECHNOLOGY) FROM FEU:Annual Rental Contract Date
Portions of Technology Building 4th to 7th floors and three (3) rooms of the 9th floor of the 24,480,705.60 July 1, 2017 toTechnology Building inclusive of VAT June 30, 2018
on initial year,yearly rates to be
determined annually
PROPERTY LEASED BY FEU HIGH SCHOOL, INC. FROM FEU:Annual Rental Contract Date
FEU Senior High School Buildings 35,515,764.96 June 1, 2017 to(Nursing Building and portion of the plus applicable VAT May 31, 2018Accounts, Business and Finance Building)
The lease contract shall not be deemed extended by implication beyond the contract period for any cause or reason whatsoever, but only by negotiationand written agreement of the LESSOR and the LESSEE.
Amount
Properties inteded to be acquired in the next 12 months: NONE NOT APPLICABLE
- 28 -
- 29 -
Item 3. Legal Proceedings
Hereunder is the list of the legal proceedings involving the company which is being handledby Atty. Enrico G. Gilera, the University Legal Counsel:
External Cases
Pending Court Cases as of 1 May 2018:
1. Ma. Corazon Abella vs. FEU, CA GR Case No. 142320
2. Jacqueline Alota vs. FEU, Supreme Court - G.R No.237928
3. Jacqueline Alota vs. FEU, NLRC-LAC 02-000691-18; NLRC-NCR Case No. 05-06747-17
4. Century Iron Work, Inc. vs. FEU, Supreme Court G.R. No. 217329
5. FEU-ELU vs. FEU, AC-826-RCMB-NCR-LVA-008-01-03-2016G.R. No. 238145, CA GR No. 146576
6. FEU-ELU vs. FEU, AC-022 RCMB-NCR-LVA-022-04-08-2016CA-G.R. SP No. 149408
7. Maricel Trinidad vs. FEU, NLRC-LAC No. 02-000691-18, NLRC NCR No. 05-06747-17
Involvement of Directors and Officers in Certain Legal Proceedings
None of the directors and officers of the registrant or any of its subsidiaries or affiliates wasinvolved during the past five (5) years in any bankruptcy proceeding. Neither have they beenconvicted by final judgment in any criminal proceeding or been subject to any order, judgment ordecree of competent jurisdiction, permanently or temporarily enjoining barring, suspending, orotherwise limiting their involvement in any type of business, securities, commodities, or bankingactivities, nor found by any court or administrative body to have violated a securities or commoditieslaw.
The registrant or any of its subsidiaries or affiliates is not a party to any pending legalproceedings in which any of their property is the subject.
Item 4. Submission of Matters to a Vote of Security Holders
The registrant is not a party to any voting trust agreement. No security holder of the Registrantholds a voting trust or any other similar agreement.
- 30 -
Part II - OPERATIONAL AND FINANCIAL INFORMATION
Item 5. Market for Registrants Common Equity and Related Stockholders Matters
DIVIDENDS DECLARED FOR THE FISCAL YEAR ENDED MAY 31, 2018
Dividends During the Year
Cash Dividend:
Date ofDeclaration Record Payment Amount
Cash dividend of ₱8.00 per share September 19, 2017 October 4, 2017 October 18, 2017 ₱ 131,816,184.00
Cash dividend of ₱8.00 per share February 20, 2018 March 6, 2018 March 20, 2018 131,816,184.00
₱ 263,632,368.00============
Stock Dividend:
No stock dividend for the period June 01, 2017 to May 31, 2018 was declared.
Dividend Policy
Cash dividend on common shares shall be paid based on the approval of the Board of Trustees upto the amount of the unrestricted retained earnings and available cash, while stock dividend oncommon shares shall be paid based on the approval of the Board of Trustees, ratified by thestockholders, based on the unrestricted retained earnings up to the approved authorized capitalstock.
Recent Sales of Unregistered Securities
Not a single common share is considered unregistered security. All shares are registered with thePhilippine Stock Exchange, Inc. Thus, checklist of requirements for Sale of Unregistered Securitiesis not applicable.
The Philippine Stock Exchange, Inc. is the principal market where the corporation’s common equityis traded.
- 31 -
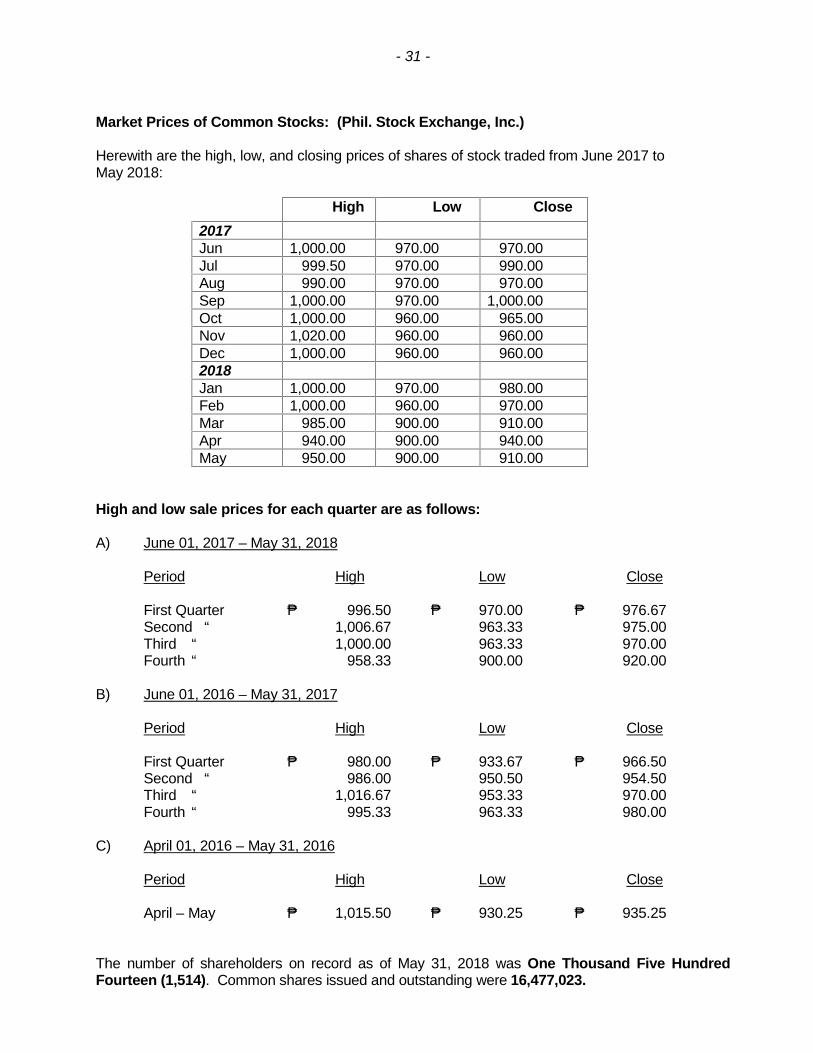
Market Prices of Common Stocks: (Phil. Stock Exchange, Inc.)
Herewith are the high, low, and closing prices of shares of stock traded from June 2017 toMay 2018:
High Low Close2017Jun 1,000.00 970.00 970.00Jul 999.50 970.00 990.00Aug 990.00 970.00 970.00Sep 1,000.00 970.00 1,000.00Oct 1,000.00 960.00 965.00Nov 1,020.00 960.00 960.00Dec 1,000.00 960.00 960.002018Jan 1,000.00 970.00 980.00Feb 1,000.00 960.00 970.00Mar 985.00 900.00 910.00Apr 940.00 900.00 940.00May 950.00 900.00 910.00
High and low sale prices for each quarter are as follows:
A) June 01, 2017 – May 31, 2018
Period High Low Close
First Quarter ₱ 996.50 ₱ 970.00 ₱ 976.67Second “ 1,006.67 963.33 975.00Third “ 1,000.00 963.33 970.00Fourth “ 958.33 900.00 920.00
B) June 01, 2016 – May 31, 2017
Period High Low Close
First Quarter ₱ 980.00 ₱ 933.67 ₱ 966.50Second “ 986.00 950.50 954.50Third “ 1,016.67 953.33 970.00Fourth “ 995.33 963.33 980.00
C) April 01, 2016 – May 31, 2016
Period High Low Close
April – May ₱ 1,015.50 ₱ 930.25 ₱ 935.25
The number of shareholders on record as of May 31, 2018 was One Thousand Five HundredFourteen (1,514). Common shares issued and outstanding were 16,477,023.
- 32 -
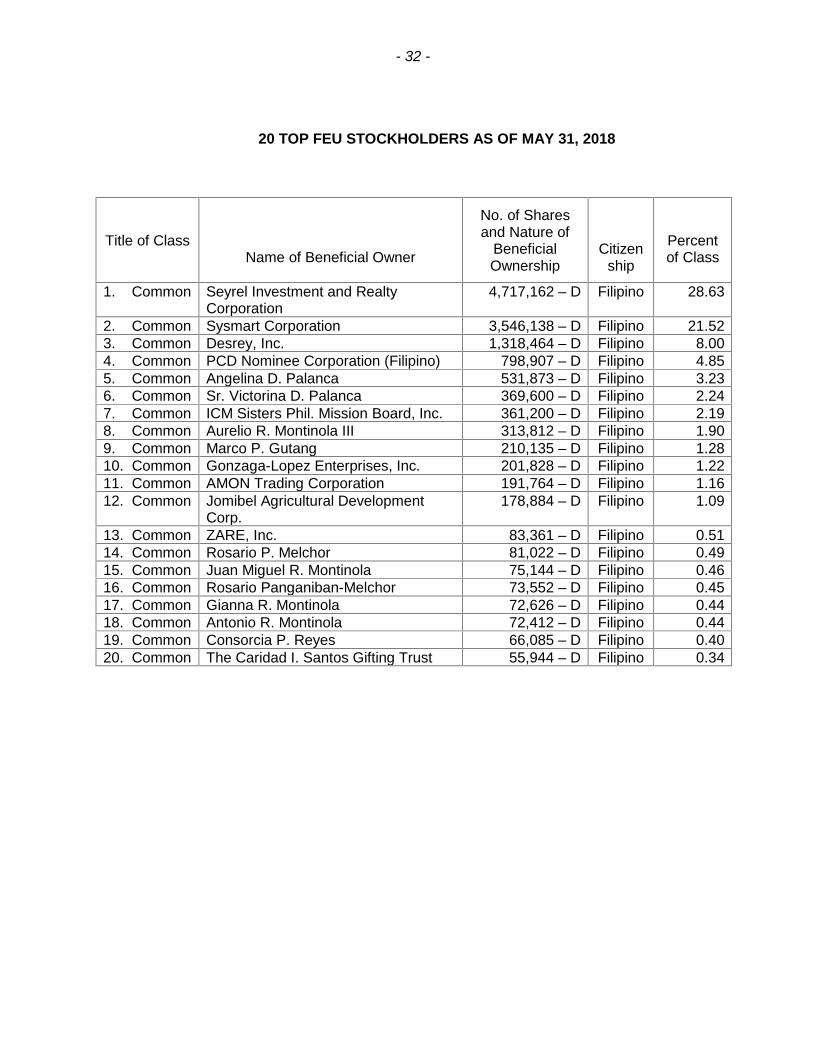
20 TOP FEU STOCKHOLDERS AS OF MAY 31, 2018
Title of ClassName of Beneficial Owner
No. of Sharesand Nature of
BeneficialOwnership
Citizenship
Percentof Class
1. Common Seyrel Investment and RealtyCorporation
4,717,162 – D Filipino 28.63
2. Common Sysmart Corporation 3,546,138 – D Filipino 21.523. Common Desrey, Inc. 1,318,464 – D Filipino 8.004. Common PCD Nominee Corporation (Filipino) 798,907 – D Filipino 4.855. Common Angelina D. Palanca 531,873 – D Filipino 3.236. Common Sr. Victorina D. Palanca 369,600 – D Filipino 2.247. Common ICM Sisters Phil. Mission Board, Inc. 361,200 – D Filipino 2.198. Common Aurelio R. Montinola III 313,812 – D Filipino 1.909. Common Marco P. Gutang 210,135 – D Filipino 1.2810. Common Gonzaga-Lopez Enterprises, Inc. 201,828 – D Filipino 1.2211. Common AMON Trading Corporation 191,764 – D Filipino 1.1612. Common Jomibel Agricultural Development
Corp.178,884 – D Filipino 1.09
13. Common ZARE, Inc. 83,361 – D Filipino 0.5114. Common Rosario P. Melchor 81,022 – D Filipino 0.4915. Common Juan Miguel R. Montinola 75,144 – D Filipino 0.4616. Common Rosario Panganiban-Melchor 73,552 – D Filipino 0.4517. Common Gianna R. Montinola 72,626 – D Filipino 0.4418. Common Antonio R. Montinola 72,412 – D Filipino 0.4419. Common Consorcia P. Reyes 66,085 – D Filipino 0.4020. Common The Caridad I. Santos Gifting Trust 55,944 – D Filipino 0.34
- 33 -
Item 6. Management’s Discussion and Analysis or Plan of Operation
As an academic institution, The Far Eastern University, Incorporated and its subsidiaries (TheGroup or FEU) is fully aware of the importance of education in nation building and to itsstudents who benefit from quality instruction, research and community extension.
The Group is committed to continuously uplift academic standards through updating of itscurricula, developing the faculty, improving the services to its students and providing the besteducational facilities.
Consolidated Financial Position
The consolidated financial position of the Group remains strong as of May 31, 2018 and 2017,and March 31, 2016.
The Group’s consolidated total assets as of March 31, 2016 reached P9,691.05 million, whichis composed of P4,227.41 million and P5,463.64 million, current and non-current assets,respectively. Total equity remains firm with portions attributable to the owners of the ParentCompany amounting to P6,569.2 and non-controlling interest (NCI) amounting toP1,651.58 million. Current and debt-to-equity ratios were at 5.65:1 and 18%, respectively.
As of May 31, 2017, consolidated total assets further increased to P11,959.84 million, whichwas 23.4% higher than the previous year’s P9,691.05 million. The increase is mainlyattributable to non-current assets which grew by 26.8%, from P5,463.64 million to P6,927.54million; current assets also went up by 19.0%, from P4,227.41 million as of March 31, 2016, toP5,032.3 million as of May 31, 2017. Consolidated total liabilities likewise soared by 113.4%to P3,137.22 million as of May 31, 2017 compared to the March 31, 2016 balance amountingto P1,470.27 million. Balances as of March 31, 2016 have increased in May 31, 2017, fromP747.85 million to P1,444.88 million, and from P722.42 million to P1,692.34 million, for bothcurrent and non-current liabilities, respectively. Total consolidated equity remains stable withportions attributable to the owners of the Parent Company and NCI at P6.712.12 million andP2,110.51 million, respectively.
Current and debt-to-equity ratios as of March 31, 2017, remains favorable at 3.48:1 and 36%,respectively.
As of the end of the current fiscal year, consolidated total assets have reached anothermilestone as it reached P13,187.39 million, which was 10.3% above the previous year’sbalance of P11,959.84 million. Non-current assets grew by 18.3%, from P6,927.54 million asof May 31, 2017 to P8,197.13 million as of May 31, 2018. Meanwhile, current assets slid by1%, from P5,032.3 million as of May 31, 2017 to P4,990.26 million as of May 31, 2018.
- 34 -
The growth in consolidated total assets is mainly from the results of operations during thecurrent year and additional creditor financing. Asset items that showed significant increasesfrom last year were Trade and Other Receivables and Other Current Assets. Property andequipment likewise registered a significant increase mainly due to the constructionsundertaken by FEU Alabang, Inc. and East Asia Computer Center, Inc. (EACCI), andimprovements by the University in its Manila campus.
Consolidated total liabilities increased by 32.2% to P4,146.0 million as of May 31, 2018compared to previous year’s P3,137.22 million. The increase is mainly attributable to thebalance of Trade and Other Payables as of fiscal year-end, Deferred Revenues which pertainto advance tuition collections and charges from students which is applicable to the comingschool year, and additional loans obtained during the fiscal year.
Current liabilities went up to P2,742.46 million from previous year’s P1,444.88 million, whilenon-current liabilities went down to P1,403.54 million from P1,692.34 million last year.
Consistent with the growth in consolidated total assets, consolidated total equity improved asit gained by 2.5%, from P8,822.63 million as of May 31, 2017 to P9,041.4 million as of May 31,2018. The Group’s consolidated equity is composed of the equity attributable to owners of theParent Company and NCI amounting to P6,862.19 million and P2,179.21 million, respectively.
The Group’s financial position remained strong with current ratio and quick ratio at 1.82:1 and1.62:1, respectively, and with a debt-to-equity ratio and equity-to-asset ratio at favorable levelsof 46% and 69%, respectively.
For the past four years, consolidated total asset growth is at an average annual rate of 13.3%or P1,283.49 million; consolidated total liabilities also increased at around P657.7 million or atan average rate 35.7% a year. For the same periods, consolidated total stockholders’ equitycontinues to build up at an annual average of P625.78 million or 8.5% a year (see Table 1).
Table 1
(Amounts in Million Philippine Peso)
Fiscal YearEnding
ConsolidatedTotal
Assets
Increase ConsolidatedTotal
Liabilities
Increase ConsolidatedNet
Assets
Increase
Amount % Amount % Amount %
March 31, 2014 P 8,053.45 P - - P 1,515.19 P - - P 6,538.26 P - -
March 31, 2015 9,090.88 1,037.43 12.9% 1,572.05 56.86 3.8% 7,518.83 980.57 15.0%
March 31, 2016 9,691.05 600.17 6.6% 1,470.27 (101.78) -6.5% 8,220.78 701.95 9.3%
May 31, 2017 11,959.84 2,268.80 23.4% 3,137.22 1,666.95 113.4% 8,822.63 601.84 7.3%
May 31, 2018 13,187.39 1,227.55 10.3% 4,146.00 1,008.78 32.2% 9,041.40 218.77 2.5%
Average P 1,283.49 13.3% P 657.70 35.7% P 625.78 8.5%
- 35 -
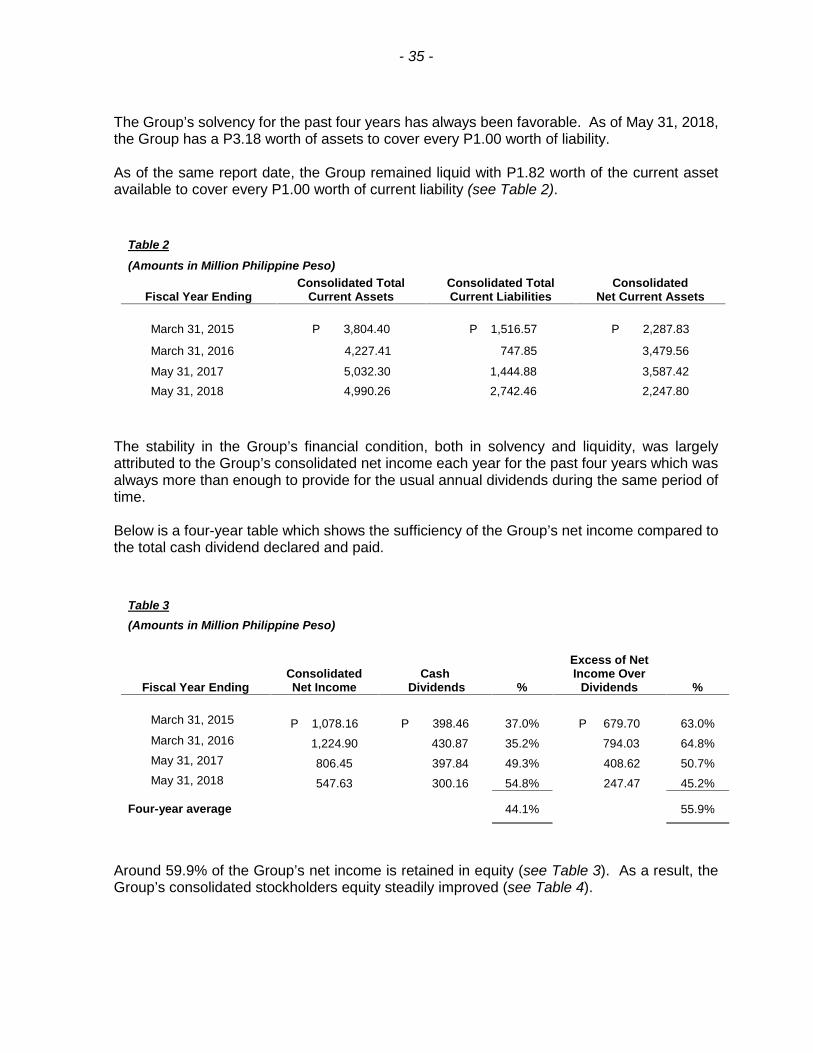
The Group’s solvency for the past four years has always been favorable. As of May 31, 2018,the Group has a P3.18 worth of assets to cover every P1.00 worth of liability.
As of the same report date, the Group remained liquid with P1.82 worth of the current assetavailable to cover every P1.00 worth of current liability (see Table 2).
Table 2
(Amounts in Million Philippine Peso)
Fiscal Year EndingConsolidated Total
Current AssetsConsolidated TotalCurrent Liabilities
ConsolidatedNet Current Assets
March 31, 2015 P 3,804.40 P 1,516.57 P 2,287.83
March 31, 2016 4,227.41 747.85 3,479.56
May 31, 2017 5,032.30 1,444.88 3,587.42May 31, 2018 4,990.26 2,742.46 2,247.80
The stability in the Group’s financial condition, both in solvency and liquidity, was largelyattributed to the Group’s consolidated net income each year for the past four years which wasalways more than enough to provide for the usual annual dividends during the same period oftime.
Below is a four-year table which shows the sufficiency of the Group’s net income compared tothe total cash dividend declared and paid.
Table 3(Amounts in Million Philippine Peso)
Fiscal Year EndingConsolidatedNet Income
CashDividends %
Excess of NetIncome Over
Dividends %
March 31, 2015 P 1,078.16 P 398.46 37.0% P 679.70 63.0%March 31, 2016 1,224.90 430.87 35.2% 794.03 64.8%May 31, 2017 806.45 397.84 49.3% 408.62 50.7%May 31, 2018 547.63 300.16 54.8% 247.47 45.2%
Four-year average 44.1% 55.9%
Around 59.9% of the Group’s net income is retained in equity (see Table 3). As a result, theGroup’s consolidated stockholders equity steadily improved (see Table 4).
- 36 -
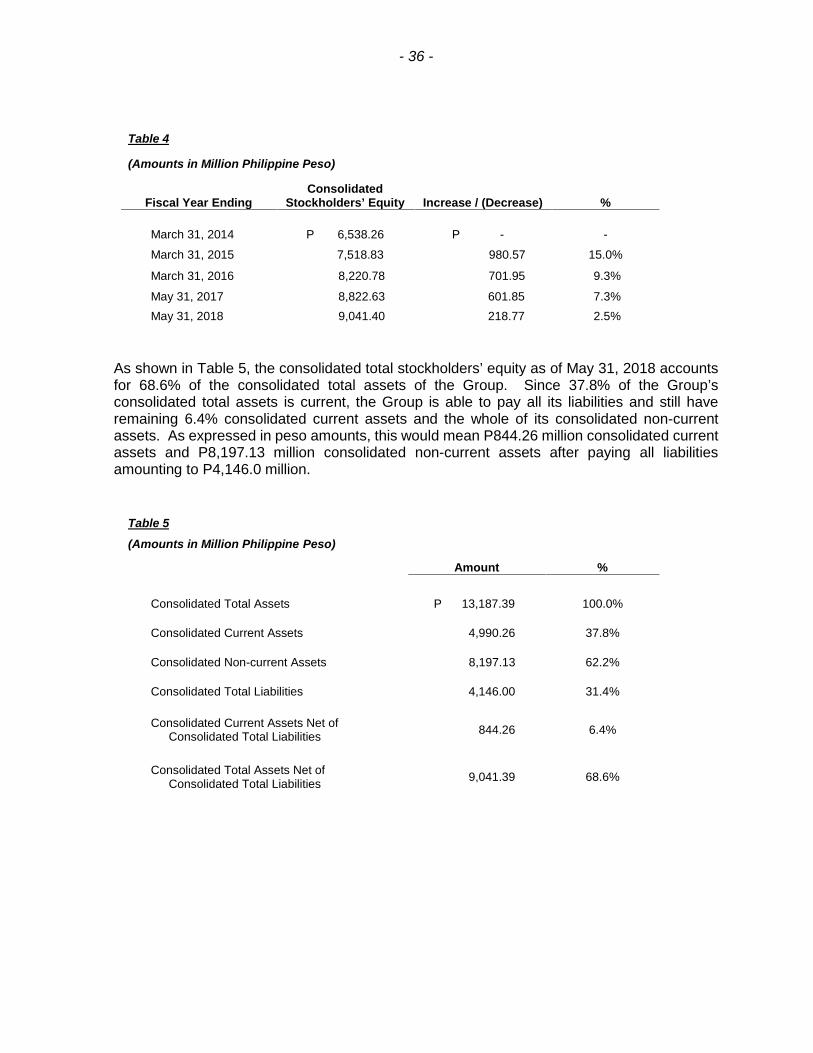
Table 4
(Amounts in Million Philippine Peso)
Fiscal Year EndingConsolidated
Stockholders’ Equity Increase / (Decrease) %
March 31, 2014 P 6,538.26 P - -
March 31, 2015 7,518.83 980.57 15.0%
March 31, 2016 8,220.78 701.95 9.3%
May 31, 2017 8,822.63 601.85 7.3%May 31, 2018 9,041.40 218.77 2.5%
As shown in Table 5, the consolidated total stockholders’ equity as of May 31, 2018 accountsfor 68.6% of the consolidated total assets of the Group. Since 37.8% of the Group’sconsolidated total assets is current, the Group is able to pay all its liabilities and still haveremaining 6.4% consolidated current assets and the whole of its consolidated non-currentassets. As expressed in peso amounts, this would mean P844.26 million consolidated currentassets and P8,197.13 million consolidated non-current assets after paying all liabilitiesamounting to P4,146.0 million.
Table 5
(Amounts in Million Philippine Peso)
Amount %
Consolidated Total Assets P 13,187.39 100.0%
Consolidated Current Assets 4,990.26 37.8%
Consolidated Non-current Assets 8,197.13 62.2%
Consolidated Total Liabilities 4,146.00 31.4%
Consolidated Current Assets Net ofConsolidated Total Liabilities 844.26 6.4%
Consolidated Total Assets Net ofConsolidated Total Liabilities 9,041.39 68.6%
- 37 -
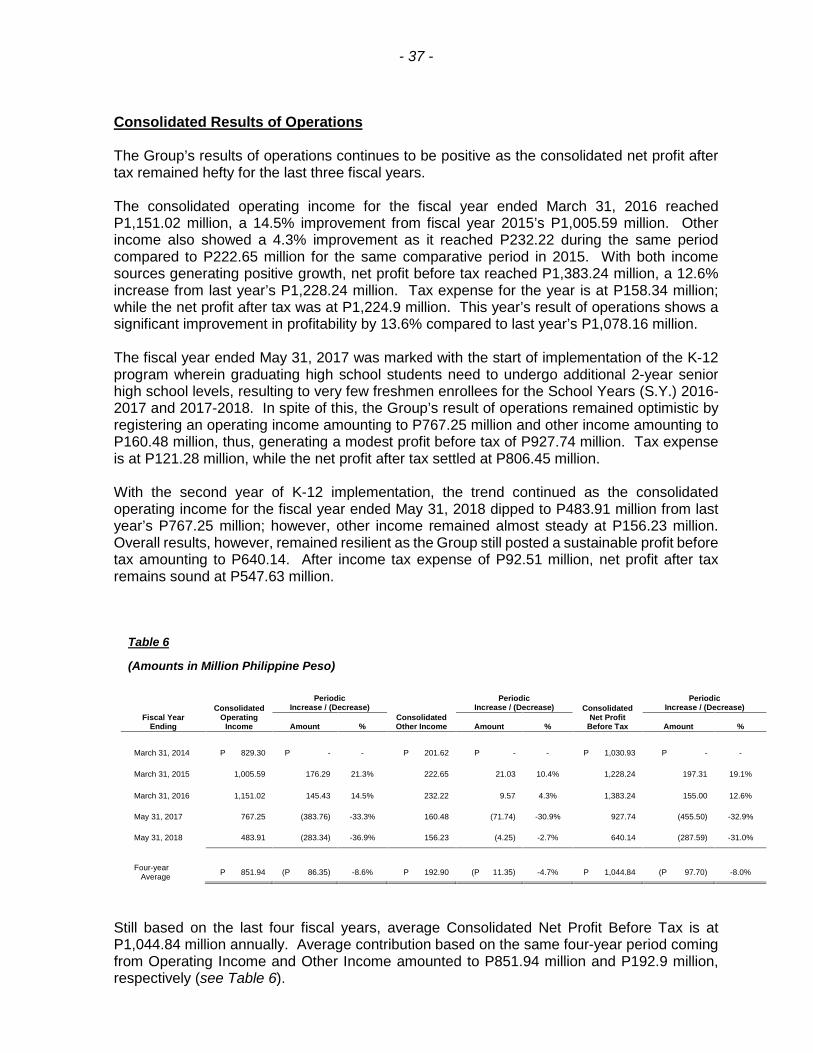
Consolidated Results of Operations
The Group’s results of operations continues to be positive as the consolidated net profit aftertax remained hefty for the last three fiscal years.
The consolidated operating income for the fiscal year ended March 31, 2016 reachedP1,151.02 million, a 14.5% improvement from fiscal year 2015’s P1,005.59 million. Otherincome also showed a 4.3% improvement as it reached P232.22 during the same periodcompared to P222.65 million for the same comparative period in 2015. With both incomesources generating positive growth, net profit before tax reached P1,383.24 million, a 12.6%increase from last year’s P1,228.24 million. Tax expense for the year is at P158.34 million;while the net profit after tax was at P1,224.9 million. This year’s result of operations shows asignificant improvement in profitability by 13.6% compared to last year’s P1,078.16 million.
The fiscal year ended May 31, 2017 was marked with the start of implementation of the K-12program wherein graduating high school students need to undergo additional 2-year seniorhigh school levels, resulting to very few freshmen enrollees for the School Years (S.Y.) 2016-2017 and 2017-2018. In spite of this, the Group’s result of operations remained optimistic byregistering an operating income amounting to P767.25 million and other income amounting toP160.48 million, thus, generating a modest profit before tax of P927.74 million. Tax expenseis at P121.28 million, while the net profit after tax settled at P806.45 million.
With the second year of K-12 implementation, the trend continued as the consolidatedoperating income for the fiscal year ended May 31, 2018 dipped to P483.91 million from lastyear’s P767.25 million; however, other income remained almost steady at P156.23 million.Overall results, however, remained resilient as the Group still posted a sustainable profit beforetax amounting to P640.14. After income tax expense of P92.51 million, net profit after taxremains sound at P547.63 million.
Still based on the last four fiscal years, average Consolidated Net Profit Before Tax is atP1,044.84 million annually. Average contribution based on the same four-year period comingfrom Operating Income and Other Income amounted to P851.94 million and P192.9 million,respectively (see Table 6).
Table 6
(Amounts in Million Philippine Peso)
Fiscal YearEnding
ConsolidatedOperating
Income
PeriodicIncrease / (Decrease)
ConsolidatedOther Income
PeriodicIncrease / (Decrease) Consolidated
Net ProfitBefore Tax
PeriodicIncrease / (Decrease)
Amount % Amount % Amount %
March 31, 2014 P 829.30 P - - P 201.62 P - - P 1,030.93 P - -
March 31, 2015 1,005.59 176.29 21.3% 222.65 21.03 10.4% 1,228.24 197.31 19.1%
March 31, 2016 1,151.02 145.43 14.5% 232.22 9.57 4.3% 1,383.24 155.00 12.6%
May 31, 2017 767.25 (383.76) -33.3% 160.48 (71.74) -30.9% 927.74 (455.50) -32.9%
May 31, 2018 483.91 (283.34) -36.9% 156.23 (4.25) -2.7% 640.14 (287.59) -31.0%
Four-yearAverage P 851.94 (P 86.35) -8.6% P 192.90 (P 11.35) -4.7% P 1,044.84 (P 97.70) -8.0%
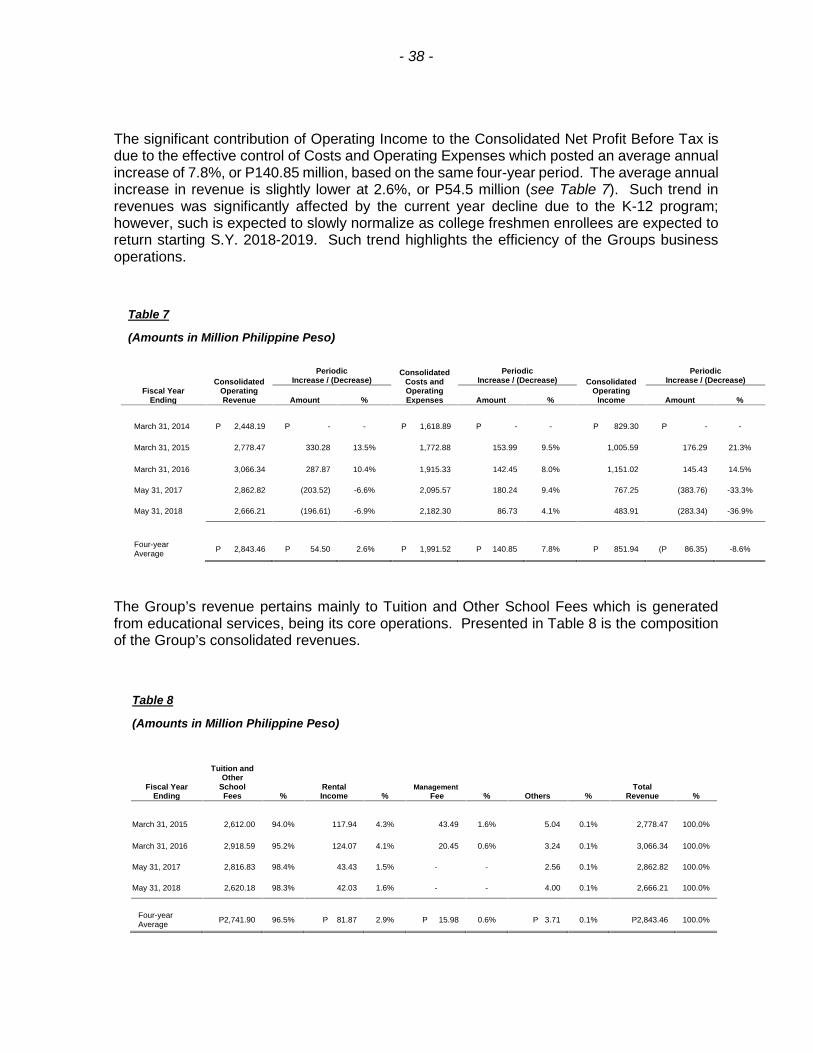
- 38 -
The significant contribution of Operating Income to the Consolidated Net Profit Before Tax isdue to the effective control of Costs and Operating Expenses which posted an average annualincrease of 7.8%, or P140.85 million, based on the same four-year period. The average annualincrease in revenue is slightly lower at 2.6%, or P54.5 million (see Table 7). Such trend inrevenues was significantly affected by the current year decline due to the K-12 program;however, such is expected to slowly normalize as college freshmen enrollees are expected toreturn starting S.Y. 2018-2019. Such trend highlights the efficiency of the Groups businessoperations.
The Group’s revenue pertains mainly to Tuition and Other School Fees which is generatedfrom educational services, being its core operations. Presented in Table 8 is the compositionof the Group’s consolidated revenues.
Table 7
(Amounts in Million Philippine Peso)
Fiscal YearEnding
ConsolidatedOperatingRevenue
PeriodicIncrease / (Decrease)
ConsolidatedCosts andOperatingExpenses
PeriodicIncrease / (Decrease) Consolidated
OperatingIncome
PeriodicIncrease / (Decrease)
Amount % Amount % Amount %
March 31, 2014 P 2,448.19 P - - P 1,618.89 P - - P 829.30 P - -
March 31, 2015 2,778.47 330.28 13.5% 1,772.88 153.99 9.5% 1,005.59 176.29 21.3%
March 31, 2016 3,066.34 287.87 10.4% 1,915.33 142.45 8.0% 1,151.02 145.43 14.5%
May 31, 2017 2,862.82 (203.52) -6.6% 2,095.57 180.24 9.4% 767.25 (383.76) -33.3%
May 31, 2018 2,666.21 (196.61) -6.9% 2,182.30 86.73 4.1% 483.91 (283.34) -36.9%
Four-yearAverage P 2,843.46 P 54.50 2.6% P 1,991.52 P 140.85 7.8% P 851.94 (P 86.35) -8.6%
Table 8
(Amounts in Million Philippine Peso)
Fiscal YearEnding
Tuition andOther
SchoolFees %
RentalIncome %
ManagementFee % Others %
TotalRevenue %
March 31, 2015 2,612.00 94.0% 117.94 4.3% 43.49 1.6% 5.04 0.1% 2,778.47 100.0%
March 31, 2016 2,918.59 95.2% 124.07 4.1% 20.45 0.6% 3.24 0.1% 3,066.34 100.0%
May 31, 2017 2,816.83 98.4% 43.43 1.5% - - 2.56 0.1% 2,862.82 100.0%
May 31, 2018 2,620.18 98.3% 42.03 1.6% - - 4.00 0.1% 2,666.21 100.0%
Four-yearAverage P2,741.90 96.5% P 81.87 2.9% P 15.98 0.6% P 3.71 0.1% P2,843.46 100.0%
- 39 -
A Look at What Lies Ahead
Moving forward, continuous cost efficiency will have to prevail.
Coming from the second year of K-12 implementation, Group enrollment is expected toimprove starting S.Y. 2018-2019 due to college freshmen enrollees, and the start of operationsof FEU Alabang. In the succeeding years, student population of the FEU schools are expectedto gradually normalize.
Fully aware of the importance to maintain a satisfactory level of enrollment, the Group iscommitted to continue the uplifting of the academic standards in its different schools. This willbe done through continuously updating of curricula, strengthening faculty competency,improving services to students and providing the best educational facilities. With a reasonabletuition fee hike, the Group is confident that it will maintain its market share in the industry.Further, with the constant effective and efficient management of its schools and other entitieswithin the Group, it expects to have a reasonable growth, or at least to maintain, itsconsolidated net income level.
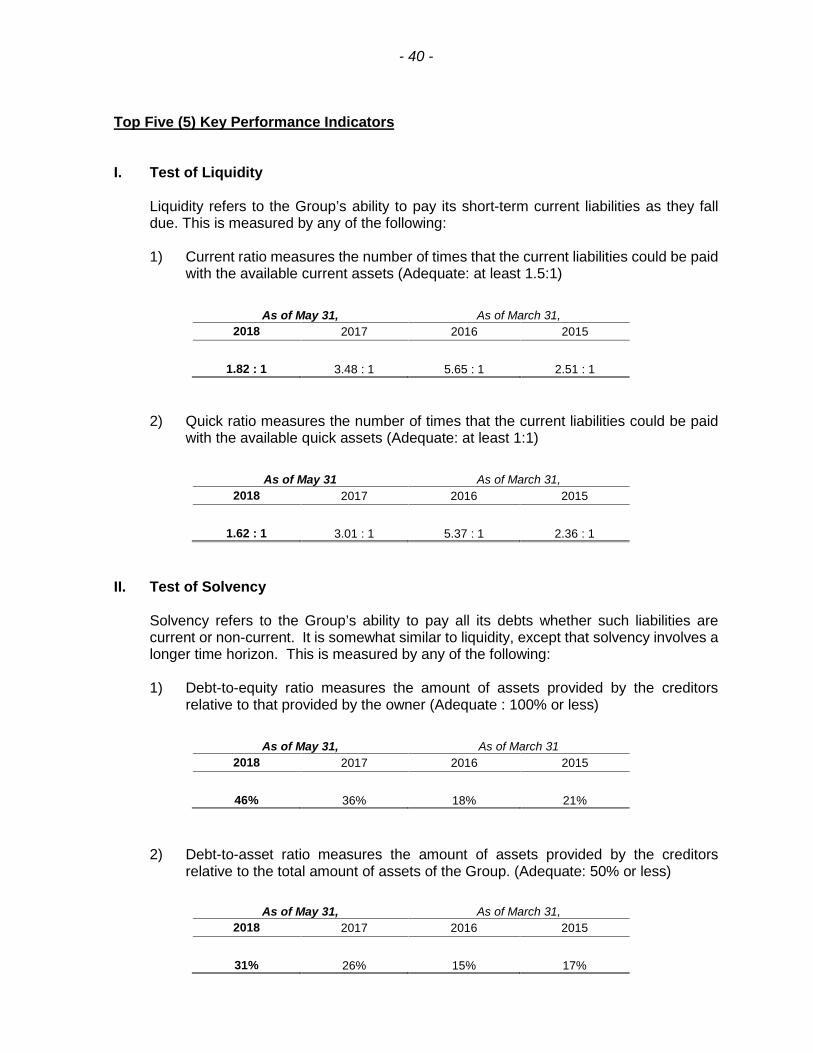
- 40 -
Top Five (5) Key Performance Indicators
I. Test of Liquidity
Liquidity refers to the Group’s ability to pay its short-term current liabilities as they falldue. This is measured by any of the following:
1) Current ratio measures the number of times that the current liabilities could be paidwith the available current assets (Adequate: at least 1.5:1)
As of May 31, As of March 31,2018 2017 2016 2015
1.82 : 1 3.48 : 1 5.65 : 1 2.51 : 1
2) Quick ratio measures the number of times that the current liabilities could be paidwith the available quick assets (Adequate: at least 1:1)
As of May 31 As of March 31,2018 2017 2016 2015
1.62 : 1 3.01 : 1 5.37 : 1 2.36 : 1
II. Test of Solvency
Solvency refers to the Group’s ability to pay all its debts whether such liabilities arecurrent or non-current. It is somewhat similar to liquidity, except that solvency involves alonger time horizon. This is measured by any of the following:
1) Debt-to-equity ratio measures the amount of assets provided by the creditorsrelative to that provided by the owner (Adequate : 100% or less)
As of May 31, As of March 312018 2017 2016 2015
46% 36% 18% 21%
2) Debt-to-asset ratio measures the amount of assets provided by the creditorsrelative to the total amount of assets of the Group. (Adequate: 50% or less)
As of May 31, As of March 31,2018 2017 2016 2015
31% 26% 15% 17%
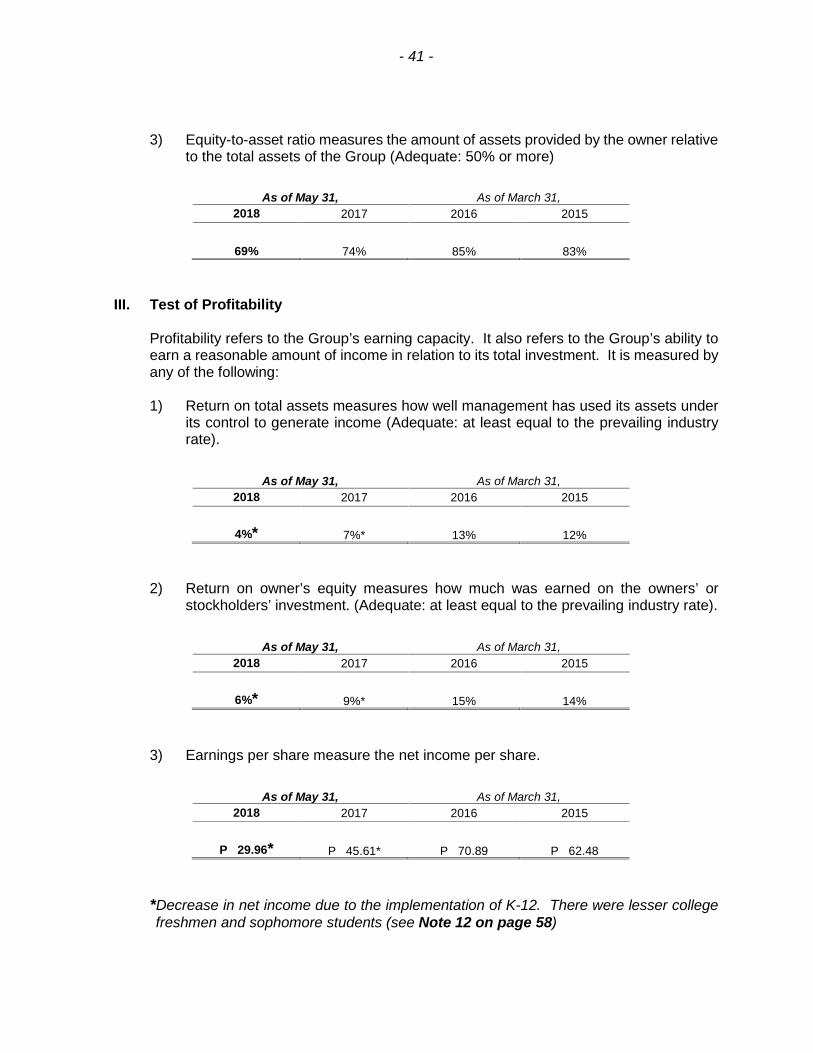
- 41 -
3) Equity-to-asset ratio measures the amount of assets provided by the owner relativeto the total assets of the Group (Adequate: 50% or more)
As of May 31, As of March 31,2018 2017 2016 2015
69% 74% 85% 83%
III. Test of Profitability
Profitability refers to the Group’s earning capacity. It also refers to the Group’s ability toearn a reasonable amount of income in relation to its total investment. It is measured byany of the following:
1) Return on total assets measures how well management has used its assets underits control to generate income (Adequate: at least equal to the prevailing industryrate).
As of May 31, As of March 31,2018 2017 2016 2015
4%* 7%* 13% 12%
2) Return on owner’s equity measures how much was earned on the owners’ orstockholders’ investment. (Adequate: at least equal to the prevailing industry rate).
As of May 31, As of March 31,2018 2017 2016 2015
6%* 9%* 15% 14%
3) Earnings per share measure the net income per share.
As of May 31, As of March 31,2018 2017 2016 2015
P 29.96* P 45.61* P 70.89 P 62.48
*Decrease in net income due to the implementation of K-12. There were lesser collegefreshmen and sophomore students (see Note 12 on page 58)

- 42 -
IV. Product/Service Standards
FEU – Manila (operated by FEU or the University)
1) FEU was awarded with Autonomous Status from April 1, 2016 toMay 31, 2019.
2) FEU gained the ASEAN University Network membership lastAugust 10, 2017.
3) The Philippine Association of Colleges and Universities Commission onAccreditation (PACUCOA) has granted Certificates of Level IV Status fromDecember 2015 to December 2020 to the following programs:
• Bachelor of Arts in Mass Communications• Bachelor of Science in Business Administration major in: Business Economics Financial Management Marketing Management Human Resource Development Management Operations Management Business Management Internal Auditing Legal Management
• Bachelor of Science in Accountancy• Bachelor of Science in Applied Math major in IT• Bachelor of Science in Biology• Bachelor of Science in Psychology• Bachelor of Elementary Education• Bachelor of Secondary Education
Also, PACUCOA has granted Level II Reaccredited Status from February2017 to February 2022 to the following programs:
• Master of Arts in Psychology• Master of Arts in Education• Doctor of Education

- 43 -
PACUCOA has granted Level II Reaccredited Status from 2018 to 2023 to thefollowing programs:
• Bachelor of Arts in English Language• Bachelor of Arts in Literature• Bachelor of Arts in Political Science• Bachelor of Science in Hotel and Restaurant Management
PACUCOA has granted Level I Status from February 2017 to February 2022to Bachelor of Science in Architecture.
PACUCOA has granted Level I Status from November 2016 to November2019 to the following programs:
• Bachelor of Science in Medical Technology• Bachelor of Science in Tourism Management• Bachelor of Arts in International Studies• Bachelor of Fine Arts
Moreover, PACUCOA has granted Candidate Status from March 2017 toMarch 2019 to the following programs of FEU-Makati:
• Bachelor of Science in Accountancy• Bachelor of Science in Accounting Technology• Bachelor of Science in Business Administration
The Philippine Accrediting Association of Schools, Colleges and Universities(PAASCU) granted Level III Status to Bachelor of Science in Nursingprogram until 2021.
Bachelor of Science in Business Administration was awarded Center ofDevelopment by the Commission on Higher Education from April 1, 2016 toDecember 31, 2018.
Teacher Education Program was awarded Center of Excellence by theCommission on Higher Education until December 31, 2018.
- 44 -
Teaching performance is constantly being monitored to maintain a superior level ofquality. Various incentives are given to faculty for teaching excellence.
Performance of FEU graduates in their respective Professional LicensureExaminations is generally better than national passing rates.
The following are the highlights of FEU’s performance in the recent boardexaminations.
9th Top Performing School in the August 2017 Medical TechnologistLicensure Examination
10th Top performing School in the November 2017 Nursing LicensureExaminations
3rd Top Performing School in the March 2018 Medical TechnologistLicensure Examinations
Other Top Performance of Individual Graduates
• Medical Technologist, August 2017 - 3rd, 7th and 9th Place
• Certified Public Accountant (CPA) LicensureExamination, October 2017 - 9th Place
• Psychometrician Licensure Examinations, - 3rd, 6th, 8th, 9th
October 2017 and 10th Place
• Architecture Licensure Examination,January 2018 - 10th Place
• Medical Technologist, March 2018 - 4th Place
• CPA, May 2018 - 5th Place
FEU Institute of Technology (operated by EACCI)
FEU Tech continuous to strive to remain as among the best educational institutionsproviding quality education in the fields of Engineering and Information Technology.
The PAASCU granted Level II Accredited Status to Information Technology andComputer Science programs until May 2020.
Moreover, Level I Accredited Status was granted by PAASCU to Civil Engineeringand Computer Engineering programs until April 2018.
- 45 -
Graduates of FEU Tech showed impressive performances in their respectiveProfessional Licensure Examinations as the results garnered are generally higherthan national passing rates. The following are the highlights of FEU Tech’sperformance in the recent board examinations:
Top Performance of Individual Graduates:
• Civil Engineering, November 2017 - 10th Place
• Electronics Engineering, April 2018 - 1st, 5th,, 7th and 9th Place
• Civil Engineering, May 2018 - 9th Place
FEU Cavite [operated by Far Eastern College - Silang, Inc. (FECSI)]
Like any other schools of the Group, FEU Cavite is operated and managed in linewith FEU’s quality standards and best practice
FEU Cavite achieved significant milestones that brought it closer to its aspirationsof achieving regulatory excellence, referring to compliance with governmentrequirements and standards; matched excellence, or having graduates who areequipped with the right knowledge, skills, and behaviors needed in moving to thenext level of learning and in being employed in fields of endeavor where they canbest contribute; and adaptive excellence, or having students equipped with criticalthinking skills that will help them face local and global demands.
FEU Cavite continued its pursuit of quality education through various faculty trainingprograms and student development activities that made work and educationalexperiences more fulfilling and enriching. Industry linkages and organizationalpartnerships were also continuously strengthened through benchmarking onevidenced-based best practices for curriculum improvement, programdevelopment, and other collaborative activities.
Overall, FEU Cavite has embarked on curricular and infrastructure projects toadvance its program offering. The projects include curriculum mapping, preparationfor use of Canvas as a new learning management system, alignment of syllabi tooutcomes-based education, curriculum revision, and program reviews. Additionalpersonnel were also hired in key non-academic service units alongside high-qualityteachers to serve the expanded population of senior high school.
FEU Senior High School (operated by FEU High)
FEU High was established to offer pre-school, grade school and high schooleducation programs, and various technical and vocational education and trainingprograms.
The FEU Senior High School offers four strands under the Academic Track of theDepartment of Education two-year senior high school program:

- 46 -
• Science, Technology, Engineering and Mathematics (STEM)• Accounting, Business and Management (ABM)• Humanities and Social Sciences (HUMSS)• General Academic Strand (GAS) – with sub-specializations of Tourism,
Arts and Design, and Sports and Health
The academic offerings are complemented with the following special programs thatfoster experiential learning and development of leadership, social skills, and serviceamong the students:
• FEU HS Integrated Enhancement and Reinforcement Classroom
Experience (FIERCE) – Summer Program;
• Student Training on Responsible Individuality and Development
Enhancement Sessions (STRIDES);
• Multiple Intelligence Learning Enhancement Sessions (MILES) – Club
Program;
• Student Alternative Integrated Learnings Sessions (SAILS) – Alternative
Classes; and,
• Student Academic Intervention Program (SAiVE)
FEU Senior High School aims at solidifying its ground as a premier senior highschool, true to the FEU brand of excellence but having its own distinct identity.
FEU Alabang (to be operated by FEU Alabang, Inc.)
FEU Alabang strengthens the Group’s commitment to give students a completeacademic experience. Being the sixth campus of FEU, it serves as the continuingrealization of Dr. Nicanor Reyes Sr.’s aspiration that all graduates of the FEUcommunity build rewarding careers in professions that will be beneficial to thecountry’s growth.
Set to become one of the pioneering academic institutions in the area, FEU Alabangoffers the following programs:
Senior High School
• Science, Technology, Engineering, and Mathematics (STEM)• Accountancy, Business, and Management (ABM)• Humanities and Social Science (HUMSS)• General Academic Strand (GAS)

- 47 -
College of Engineering
• Bachelor of Science in Civil Engineering• Bachelor of Science in Computer Engineering• Bachelor of Science in Electronics Engineering• Bachelor of Science in Electrical Engineering• Bachelor of Science in Mechanical Engineering• Bachelor of Science in Manufacturing Engineering
College of Computer Studies and Multimedia Arts
• Bachelor of Arts in Multimedia Arts• Bachelor of Science in Computer Science• Bachelor of Science in Entertainment and Multimedia Computing
Roosevelt College [operated by Roosevelt College, Inc. (RCI)]
Roosevelt College lays claim to a long history of establishing good-qualitynonsectarian private high schools, first as Marikina Academy in 1933 and as RCIstarting 1946. Soon after its founding, the academy ranked among the top 20 ofthe 70 private high schools in the Philippines. As it became a member of the FEUgroup of schools in 2016, RCI is expected to carry forward FEU’s mark of offeringquality educational programs and facilities, while improving its accessibility to moreFilipino families.
The previous academic year marked by the outstanding performance of studentsfrom different grade levels. Notable student accomplishments include the following:Center for Educational Management (CEM) post-tests, RCI students obtainedscores that are equal to or higher than the population mean of all CEM clients; astudent from RCI Cainta placed third in a national quiz contest, and a student fromRodriguez campus was named one of the Ten Outstanding Boy Scouts of thePhilippines.
In terms of accreditation, RCI campuses maintain evidence of continuous growth.The Rodriguez campus was granted Level II accreditation by PAASCU and is slatedfor an interim visit this school year. The Marikina and Cubao campuses wererecertified by the Private Education Assistance Committee (PEAC) in February2018, while the Cainta campus is due for PEAC visit in AY 2018-2019.
Roosevelt College Inc. offers the following degree programs and short programs:
• Basic Education Program: K-12
• Developmental Kindergarten for 4-year olds (RCI Cainta and RCIRodriguez)
• Special Science Program for Junior High School students with highaptitude in Science, Math, and English (RCI Cainta)

- 48 -
• Senior High School Academic Track: ABM, HUMSS, and STEM strands Tech-Vocational: Home Economics strand (RCI Rodriguez only)
• Tertiary Education (RCI Cainta only, except if otherwise indicated)
Undergraduate Programs
AB Broadcasting AB Psychology (RCI Marikina) Bachelor of Elementary Education with Specialization in Early Childhood
Education Bachelor of Elementary Education with Specialization in Special
Education Bachelor of Secondary Education Major in English Bachelor of Secondary Education Major in Mathematics Bachelor of Secondary Education Major in Music, Arts, Physical Education
and Health BS Information Technology (RCI Marikina) BSBA Human Resources Management (RCI Marikina) BSBA Operations Management (RCI Marikina) BS Hotel and Restaurant Management
Graduate Program
MA in Education Major in Educational Management MA in Education Major in Educational Technology MA in Education Major in Teaching in the Early Grades MA in Education Major in Social Studies MA in Education Major in Filipino Education MA in Education Major in Mathematics Education MA in Education Major in Science Education MA in Education Major in English Studies & Instruction MA in Education Major in Guidance & Counselling MA in Education Major in Special Education Teacher Certificate Program
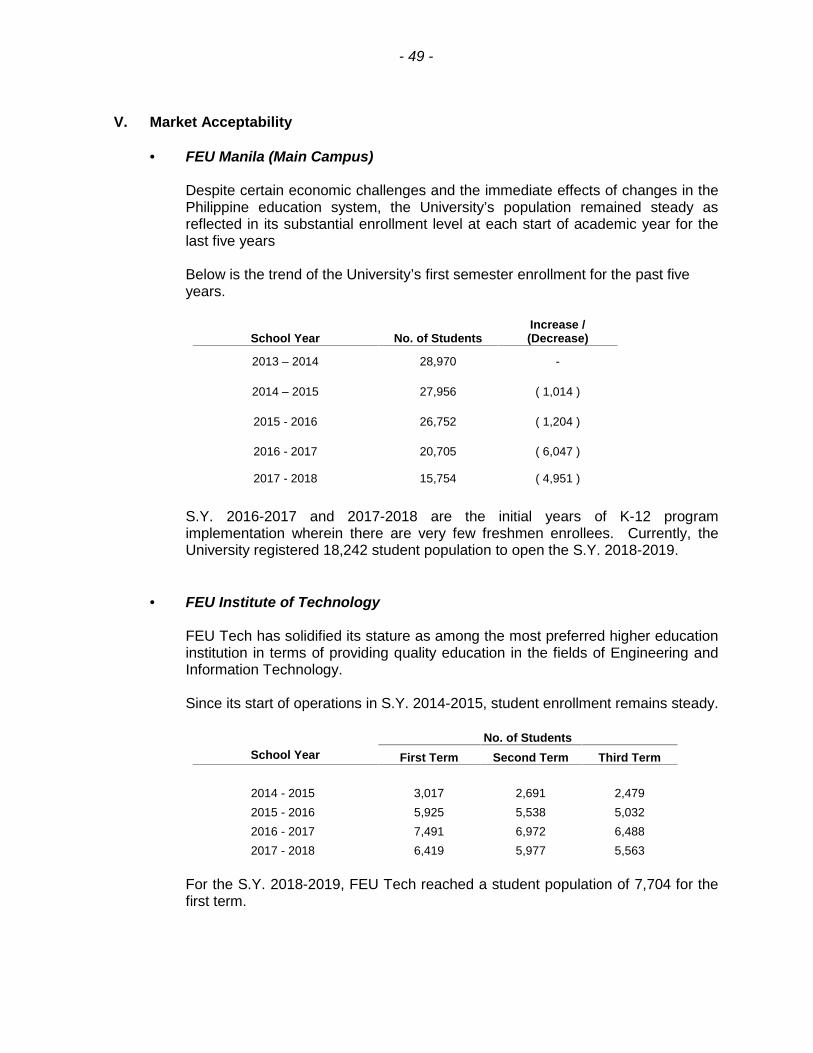
- 49 -
V. Market Acceptability
FEU Manila (Main Campus)
Despite certain economic challenges and the immediate effects of changes in thePhilippine education system, the University’s population remained steady asreflected in its substantial enrollment level at each start of academic year for thelast five years
Below is the trend of the University’s first semester enrollment for the past fiveyears.
School Year No. of StudentsIncrease /(Decrease)
2013 – 2014 28,970 -
2014 – 2015 27,956 ( 1,014 )
2015 - 2016 26,752 ( 1,204 )
2016 - 2017 20,705 ( 6,047 )
2017 - 2018 15,754 ( 4,951 )
S.Y. 2016-2017 and 2017-2018 are the initial years of K-12 programimplementation wherein there are very few freshmen enrollees. Currently, theUniversity registered 18,242 student population to open the S.Y. 2018-2019.
FEU Institute of Technology
FEU Tech has solidified its stature as among the most preferred higher educationinstitution in terms of providing quality education in the fields of Engineering andInformation Technology.
Since its start of operations in S.Y. 2014-2015, student enrollment remains steady.
No. of StudentsSchool Year First Term Second Term Third Term
2014 - 2015 3,017 2,691 2,4792015 - 2016 5,925 5,538 5,0322016 - 2017 7,491 6,972 6,4882017 - 2018 6,419 5,977 5,563
For the S.Y. 2018-2019, FEU Tech reached a student population of 7,704 for thefirst term.
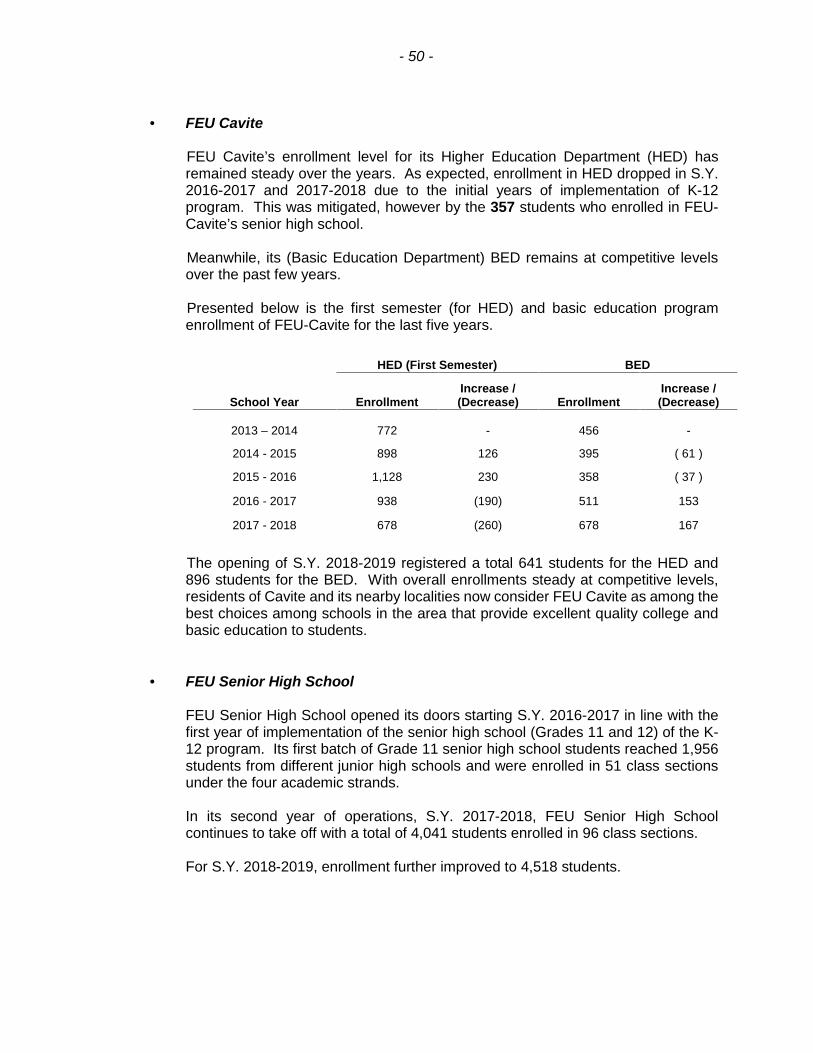
- 50 -
FEU Cavite
FEU Cavite’s enrollment level for its Higher Education Department (HED) hasremained steady over the years. As expected, enrollment in HED dropped in S.Y.2016-2017 and 2017-2018 due to the initial years of implementation of K-12program. This was mitigated, however by the 357 students who enrolled in FEU-Cavite’s senior high school.
Meanwhile, its (Basic Education Department) BED remains at competitive levelsover the past few years.
Presented below is the first semester (for HED) and basic education programenrollment of FEU-Cavite for the last five years.
HED (First Semester) BED
School Year EnrollmentIncrease /(Decrease) Enrollment
Increase /(Decrease)
2013 – 2014 772 - 456 -
2014 - 2015 898 126 395 ( 61 )
2015 - 2016 1,128 230 358 ( 37 )
2016 - 2017 938 (190) 511 153
2017 - 2018 678 (260) 678 167
The opening of S.Y. 2018-2019 registered a total 641 students for the HED and896 students for the BED. With overall enrollments steady at competitive levels,residents of Cavite and its nearby localities now consider FEU Cavite as among thebest choices among schools in the area that provide excellent quality college andbasic education to students.
FEU Senior High School
FEU Senior High School opened its doors starting S.Y. 2016-2017 in line with thefirst year of implementation of the senior high school (Grades 11 and 12) of the K-12 program. Its first batch of Grade 11 senior high school students reached 1,956students from different junior high schools and were enrolled in 51 class sectionsunder the four academic strands.
In its second year of operations, S.Y. 2017-2018, FEU Senior High Schoolcontinues to take off with a total of 4,041 students enrolled in 96 class sections.
For S.Y. 2018-2019, enrollment further improved to 4,518 students.
- 51 -
FEU Alabang
Set to open of its initial year of operations in S.Y. 2018-2019, FEU Alabang hasregistered an initial enrollment of 578 students for its tertiary programs and 1,124for its senior high school programs.
Roosevelt College
The Roosevelt College system with its campuses in eastern Metro Manila and Rizalarea have registered enrollments of 422 students for its tertiary programs, 1,087students for its senior high school programs and 2,992 students for its basiceducation programs.
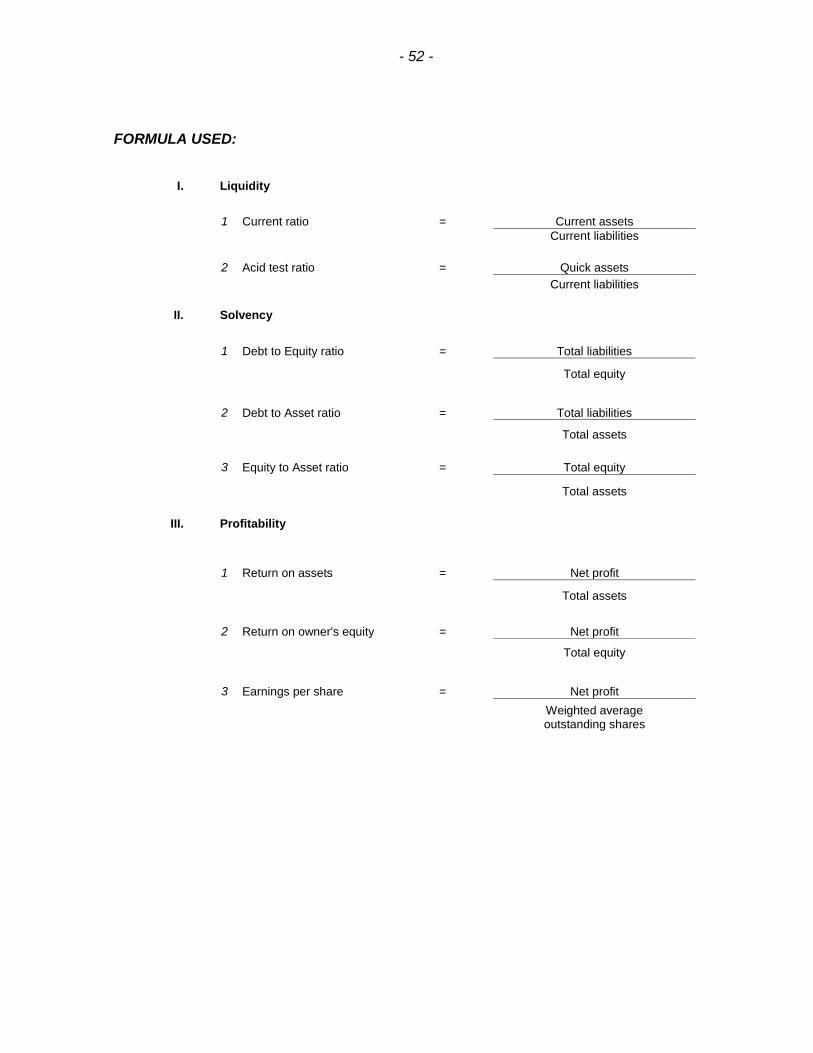
- 52 -
FORMULA USED:
I. Liquidity
1 Current ratio = Current assetsCurrent liabilities
2 Acid test ratio = Quick assetsCurrent liabilities
II. Solvency
1 Debt to Equity ratio = Total liabilities
Total equity
2 Debt to Asset ratio = Total liabilities
Total assets
3 Equity to Asset ratio = Total equity
Total assets
III. Profitability
1 Return on assets = Net profit
Total assets
2 Return on owner's equity = Net profit
Total equity
3 Earnings per share = Net profitWeighted averageoutstanding shares
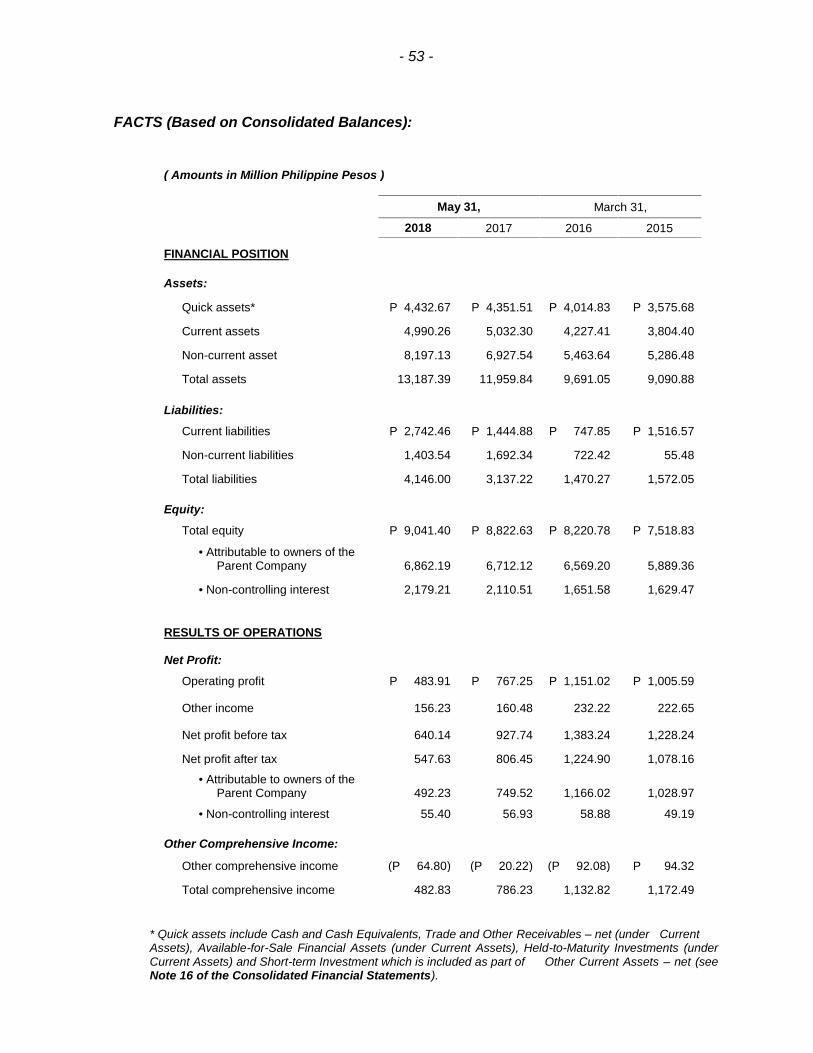
- 53 -
FACTS (Based on Consolidated Balances):
( Amounts in Million Philippine Pesos )
May 31, March 31,
2018 2017 2016 2015
FINANCIAL POSITION
Assets:
Quick assets* P 4,432.67 P 4,351.51 P 4,014.83 P 3,575.68
Current assets 4,990.26 5,032.30 4,227.41 3,804.40
Non-current asset 8,197.13 6,927.54 5,463.64 5,286.48
Total assets 13,187.39 11,959.84 9,691.05 9,090.88
Liabilities:
Current liabilities P 2,742.46 P 1,444.88 P 747.85 P 1,516.57
Non-current liabilities 1,403.54 1,692.34 722.42 55.48
Total liabilities 4,146.00 3,137.22 1,470.27 1,572.05
Equity:
Total equity P 9,041.40 P 8,822.63 P 8,220.78 P 7,518.83
• Attributable to owners of theParent Company 6,862.19 6,712.12 6,569.20 5,889.36
• Non-controlling interest 2,179.21 2,110.51 1,651.58 1,629.47
RESULTS OF OPERATIONS
Net Profit:
Operating profit P 483.91 P 767.25 P 1,151.02 P 1,005.59
Other income 156.23 160.48 232.22 222.65
Net profit before tax 640.14 927.74 1,383.24 1,228.24
Net profit after tax 547.63 806.45 1,224.90 1,078.16
• Attributable to owners of theParent Company 492.23 749.52 1,166.02 1,028.97
• Non-controlling interest 55.40 56.93 58.88 49.19
Other Comprehensive Income:
Other comprehensive income (P 64.80) (P 20.22) (P 92.08) P 94.32
Total comprehensive income 482.83 786.23 1,132.82 1,172.49
* Quick assets include Cash and Cash Equivalents, Trade and Other Receivables – net (under CurrentAssets), Available-for-Sale Financial Assets (under Current Assets), Held-to-Maturity Investments (underCurrent Assets) and Short-term Investment which is included as part of Other Current Assets – net (seeNote 16 of the Consolidated Financial Statements).
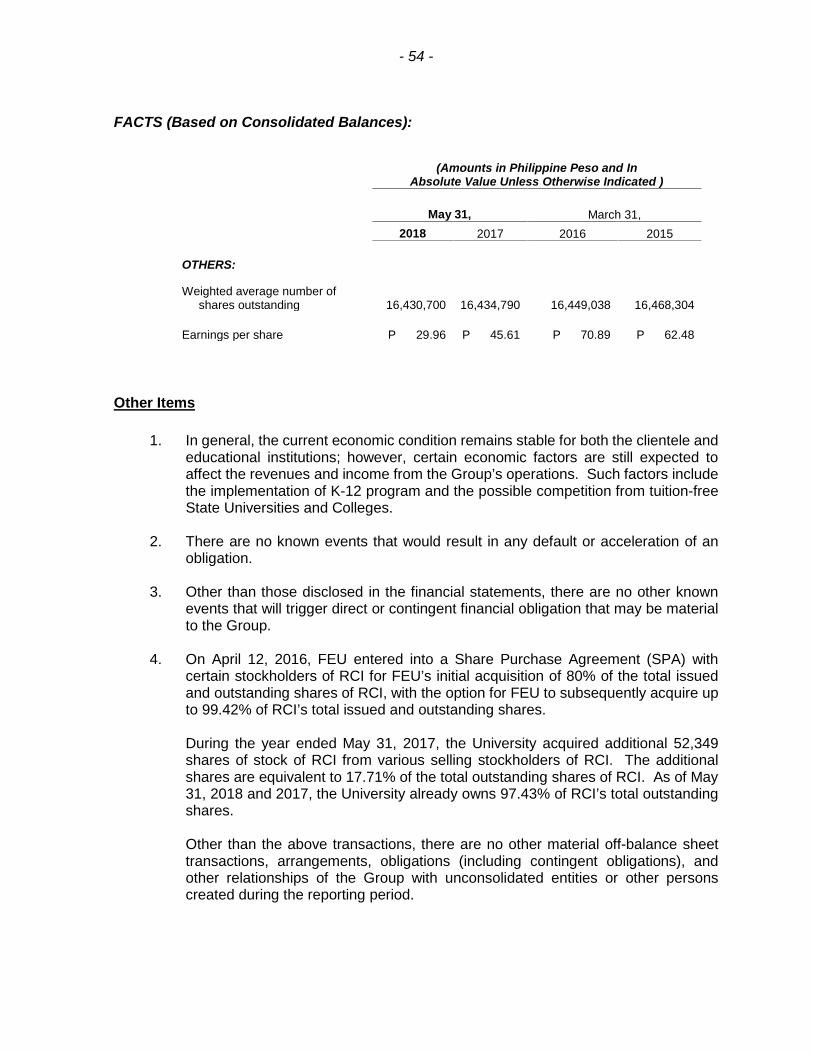
- 54 -
FACTS (Based on Consolidated Balances):
(Amounts in Philippine Peso and InAbsolute Value Unless Otherwise Indicated )
May 31, March 31,2018 2017 2016 2015
OTHERS:
Weighted average number ofshares outstanding 16,430,700 16,434,790 16,449,038 16,468,304
Earnings per share P 29.96 P 45.61 P 70.89 P 62.48
Other Items
1. In general, the current economic condition remains stable for both the clientele andeducational institutions; however, certain economic factors are still expected toaffect the revenues and income from the Group’s operations. Such factors includethe implementation of K-12 program and the possible competition from tuition-freeState Universities and Colleges.
2. There are no known events that would result in any default or acceleration of anobligation.
3. Other than those disclosed in the financial statements, there are no other knownevents that will trigger direct or contingent financial obligation that may be materialto the Group.
4. On April 12, 2016, FEU entered into a Share Purchase Agreement (SPA) withcertain stockholders of RCI for FEU’s initial acquisition of 80% of the total issuedand outstanding shares of RCI, with the option for FEU to subsequently acquire upto 99.42% of RCI’s total issued and outstanding shares.
During the year ended May 31, 2017, the University acquired additional 52,349shares of stock of RCI from various selling stockholders of RCI. The additionalshares are equivalent to 17.71% of the total outstanding shares of RCI. As of May31, 2018 and 2017, the University already owns 97.43% of RCI’s total outstandingshares.
Other than the above transactions, there are no other material off-balance sheettransactions, arrangements, obligations (including contingent obligations), andother relationships of the Group with unconsolidated entities or other personscreated during the reporting period.
- 55 -
5. The Group does not foresee any cash flow or liquidity problem in the next 12 monthsimmediately following the report date. The Group and each of the componententities can easily meet all its commitments with its present reserves and expectedearnings.
6. There are no significant elements of income or loss from continuing operations.
7. There are no sales of Unregistered or Exempt Securities including Recent Issuanceof Securities Constituting an Exempt Transaction.
8. FEU Makati Campus, which was opened in June 2010 and strategically located inthe heart of the Makati Central Business District, continues to offer undergraduatebusiness courses. Further, FEU Makati offers graduate programs for business andalso houses FEU’s Institute of Law.
For the fiscal year ending May 31, 2018, FEU Makati generated total Educationaland Other Income amounting to P89.3 million. Efficient administration keepoperating expenses at a manageable level of P22.3 million, which eventuallyyielded a net income of P67.0 million.
9. In January 2013, FEU established its new subsidiary FEU Alabang, Inc. The newsubsidiary will operate as an educational institution and will serve the market withinits vicinity and nearby communities.
As of May 31, 2018, FEU Alabang, Inc. has not yet commenced its normaloperations and still in its pre-operating stage; however, the construction of itscampus is substantially completed.
Operations of FEU Alabang, Inc., however, started in August 2018 for the S.Y.2018-2019 with an initial enrollment of 1,124 senior high school, and 578 collegestudents.
10. EACCI, under the trade name FEU Institute of Technology (FEU Tech), started itsoperations in 2015. FEU Tech is now in full operations. It offers various engineeringand information technology courses.
11. Seasonal aspects that have material effect on the financial statements:
For FEU Manila and FEU Cavite (Tertiary), there are three school terms within afiscal year: Summer Term (June to July for FEU Manila, while April to May for FEUCavite), First Semester (August to December for FEU Manila, while June to Octoberfor FEU Cavite) and Second Semester (January to May for FEU Manila andNovember to March for FEU Cavite).
The first semester has the highest number of students enrolled. The secondsemester enrollment is approximately at 90% of the first semester’s enrollment,while the summer term is the lowest at an approximate of 33%. The maximum load,in terms of subject units, of a student during the summer term is only nine units,compared to 21 to 24 units during the first and second semesters.
- 56 -
For the FEU Tech and FEU Alabang, there are three regular terms in a fiscal year:First Term (August to November), Second Term (November to March) and ThirdTerm (March to June).
The tuition fee increase, if any, usually takes effect during the first semester of aparticular school year. Thus, old rates are followed during the summer term whilenew rates are applied during the first and second semesters. Since the first quarteris from June to August, the resulting income for the first quarter is at the lowestamong the four quarters of the fiscal year.
12. The K-12 program of the government is anticipated to have an adverse effect onenrollment, particularly on S.Y. 2017-2018. With the enhancement of the current10-year basic education program, high school graduates need to undergo thesenior high school program for two years starting S.Y. 2016-2017 before being ableto move on to the college level. With this, it is expected that there will be no collegefreshmen enrollees for the S.Y. 2016-2017 and S.Y. 2017-2018.
To cushion the expected impact of K-12, FEU had organized a new subsidiary tooffer and conduct enhanced basic education programs, including junior and seniorhigh school. On June 2014, FEU High School, Inc. (FEU High) was incorporatedand registered with the Philippine Securities and Exchange Commission with theprimary purpose of offering pre-school, grade school and high school educationprograms and various technical and vocational education and training programs.FEU High started its operations beginning S.Y. 2016-2017.
With EACCI, RCI and FEU-Alabang’s operations, the Group is confident of not onlymaintaining the quality and high standards of its service offerings, but continuingthe development for further academic excellence of the FEU system.
13. On March 15, 2016, the University’s Board of Trustees (BOT) approved theamendment of its by-laws for the change in the University’s current fiscal year froma fiscal year beginning on April 1 and ending on March 31, to a fiscal year beginningon June 1 and ending on May 31. The amended by-laws was approved by the SECon June 29, 2016. The University’s application for change in fiscal year wasapproved by the Bureau of Internal Revenue (BIR) on June 30, 2016. Such changebecame effective on June 1, 2016.
14. The Group identifies its operating segments as its three major lines of businessnamely education, real estate and investment activities.
Also, the Group reports geographical segments in which campuses of FEU Schoolsare located.
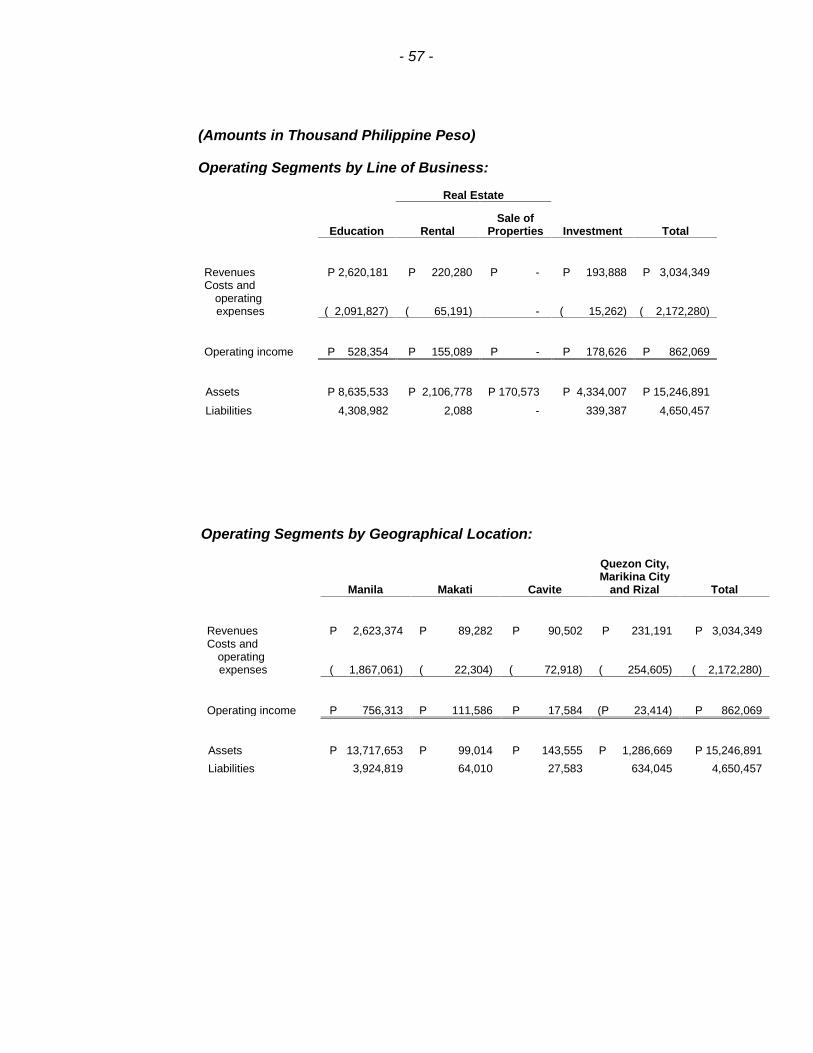
- 57 -
(Amounts in Thousand Philippine Peso)
Operating Segments by Line of Business:
Real Estate
Education RentalSale of
Properties Investment Total
Revenues P 2,620,181 P 220,280 P - P 193,888 P 3,034,349Costs and
operatingexpenses ( 2,091,827) ( 65,191) - ( 15,262) ( 2,172,280)
Operating income P 528,354 P 155,089 P - P 178,626 P 862,069
Assets P 8,635,533 P 2,106,778 P 170,573 P 4,334,007 P 15,246,891
Liabilities 4,308,982 2,088 - 339,387 4,650,457
Operating Segments by Geographical Location:
Manila Makati Cavite
Quezon City,Marikina City
and Rizal Total
Revenues P 2,623,374 P 89,282 P 90,502 P 231,191 P 3,034,349Costs and
operatingexpenses ( 1,867,061) ( 22,304) ( 72,918) ( 254,605) ( 2,172,280)
Operating income P 756,313 P 111,586 P 17,584 (P 23,414) P 862,069
Assets P 13,717,653 P 99,014 P 143,555 P 1,286,669 P 15,246,891Liabilities 3,924,819 64,010 27,583 634,045 4,650,457
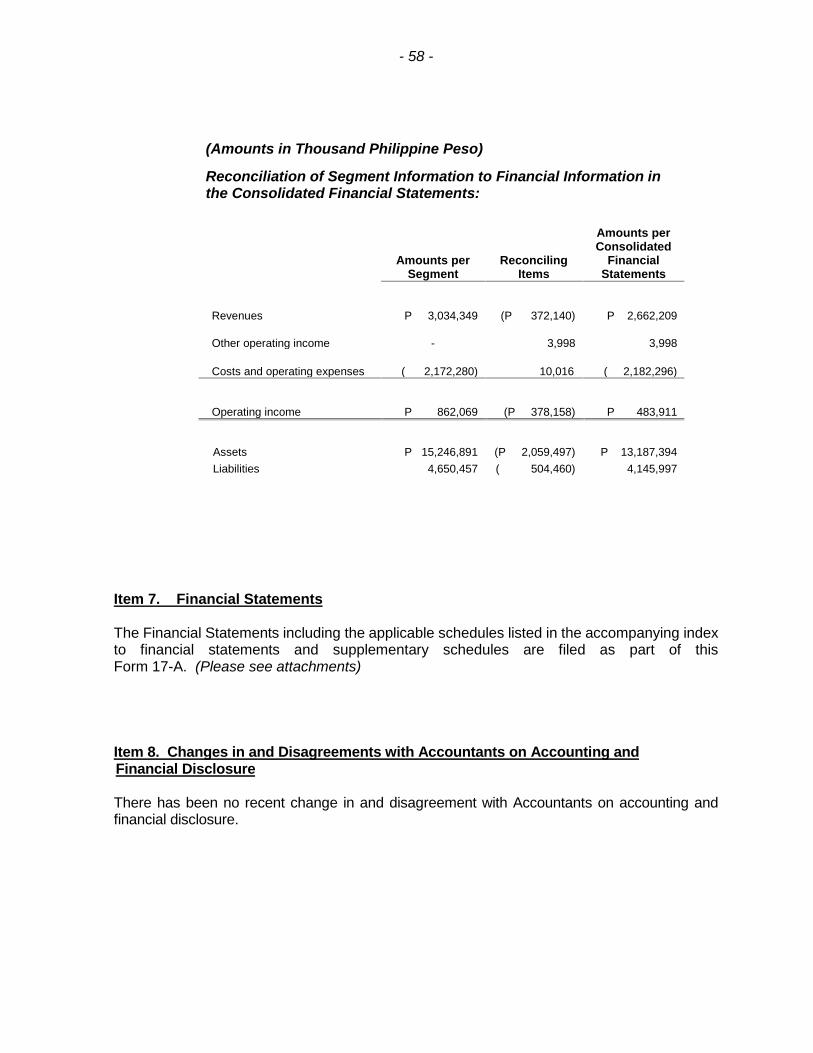
- 58 -
Item 7. Financial Statements
The Financial Statements including the applicable schedules listed in the accompanying indexto financial statements and supplementary schedules are filed as part of thisForm 17-A. (Please see attachments)
Item 8. Changes in and Disagreements with Accountants on Accounting andFinancial Disclosure
There has been no recent change in and disagreement with Accountants on accounting andfinancial disclosure.
(Amounts in Thousand Philippine Peso)
Reconciliation of Segment Information to Financial Information inthe Consolidated Financial Statements:
Amounts perSegment
ReconcilingItems
Amounts perConsolidated
FinancialStatements
Revenues P 3,034,349 (P 372,140) P 2,662,209
Other operating income - 3,998 3,998
Costs and operating expenses ( 2,172,280) 10,016 ( 2,182,296)
Operating income P 862,069 (P 378,158) P 483,911
Assets P 15,246,891 (P 2,059,497) P 13,187,394Liabilities 4,650,457 ( 504,460) 4,145,997
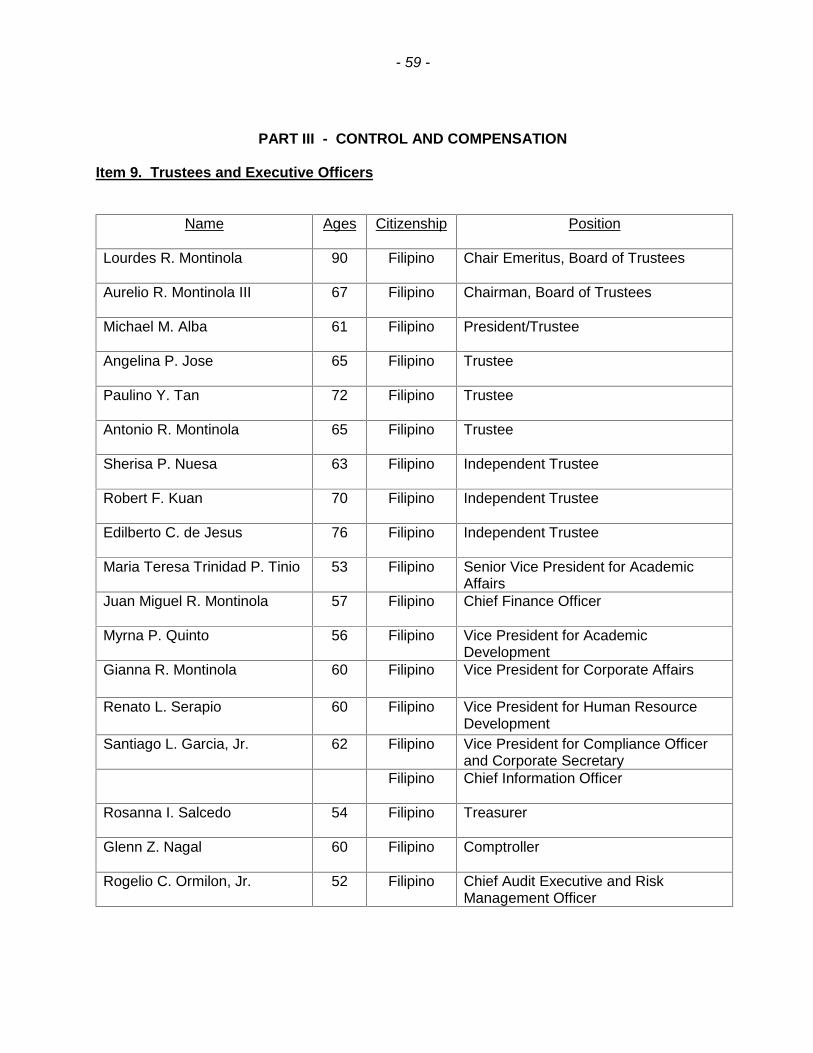
- 59 -
PART III - CONTROL AND COMPENSATION
Item 9. Trustees and Executive Officers
Name Ages Citizenship Position
Lourdes R. Montinola 90 Filipino Chair Emeritus, Board of Trustees
Aurelio R. Montinola III 67 Filipino Chairman, Board of Trustees
Michael M. Alba 61 Filipino President/Trustee
Angelina P. Jose 65 Filipino Trustee
Paulino Y. Tan 72 Filipino Trustee
Antonio R. Montinola 65 Filipino Trustee
Sherisa P. Nuesa 63 Filipino Independent Trustee
Robert F. Kuan 70 Filipino Independent Trustee
Edilberto C. de Jesus 76 Filipino Independent Trustee
Maria Teresa Trinidad P. Tinio 53 Filipino Senior Vice President for AcademicAffairs
Juan Miguel R. Montinola 57 Filipino Chief Finance Officer
Myrna P. Quinto 56 Filipino Vice President for AcademicDevelopment
Gianna R. Montinola 60 Filipino Vice President for Corporate Affairs
Renato L. Serapio 60 Filipino Vice President for Human ResourceDevelopment
Santiago L. Garcia, Jr. 62 Filipino Vice President for Compliance Officerand Corporate Secretary
Filipino Chief Information Officer
Rosanna I. Salcedo 54 Filipino Treasurer
Glenn Z. Nagal 60 Filipino Comptroller
Rogelio C. Ormilon, Jr. 52 Filipino Chief Audit Executive and RiskManagement Officer

- 60 -
TRUSTEES AND EXECUTIVE OFFICERS:
1. Lourdes R. Montinola, 90, Filipino: Chair Emeritus (August 2013 to present), Chair(June 1989 to August 2013), Far Eastern University, Inc.
Other Corporate Affiliations: Chair, Board of Directors, FERN Realty Corporation; Chair andPresident, FEU Educational Foundation, Inc.; Chair Emeritus, Nicanor Reyes EducationalFoundation, Inc.; Chair, Far Eastern College Silang, Inc.; Governor, Nicanor ReyesMemorial Foundation; Trustee, FEU-Dr. Nicanor Reyes Medical Foundation, Inc.; BoardMember, MEMORARE-Manila 1945 Foundation, Inc. and The English Speaking Union. Sheis also a Member of the Museum Foundation of the Philippines, Inc., the Oriental CeramicSociety, the Heritage Conservation Society, HABI: The Philippine Textile Council, Inc. andthe Asia Society Philippine Foundation, Inc.
Dr. Montinola holds a Bachelor of Arts degree (cum laude) from Marymount College, NewYork, U.S.A., and an M.A. in Cultural History from the Asean Graduate Institute of Arts. Shecompleted the Management Development Program for College and UniversityAdministrators in the Institute for Educational Management, Graduate School of Education,Harvard University, U.S.A. She obtained her Ph.D. in English: Creative Writing from theUniversity of the Philippines.
. 2. Aurelio Montinola III, 67, Filipino: Chairman of the Board of Trustees (August 2013 topresent), Vice Chairman (June 1989 to August 2013), Far Eastern University, Inc.
Other Corporate Affiliations: Chairman, Amon Trading Inc., East Asia Computer Center, Inc.,East Asia Educational Foundation, Inc., Nicanor Reyes Educational Foundation, Inc., WorldWildlife Fund Philippines, FEU High School, Inc., FEU Alabang, Inc., Roosevelt College,Inc., and National Golf Association of the Philippines; Vice Chairman, Philippine Businessfor Education Foundation (PBED); Director, BPI/MS Insurance Corporation; Trustee,Ramon Magsaysay Award Foundation; Member, Management Association of thePhilippines and Makati Business Club; and Independent Director, Xeleb Technologies, Inc.
He is also a Director of the Bank of the Philippine Islands, and Independent Director ofRoxas and Company Incorporated, both listed corporations.
He graduated with a BS Management Engineering degree at the Ateneo de ManilaUniversity in 1973, and received his MBA at Harvard Business School in 1977. He wasawarded the 2005 and 2009 Asian Banker Leadership Award for the Philippines and theMAP Management Man of the Year Award in 2012.
3. Michael M. Alba, 61, Filipino: President and Member of the Board of Trustees,Far Eastern University, Inc. (October 2012 to present)
He is President concurrently of East Asia Computer Center, Inc.; Far Eastern CollegeSilang, Inc.; FEU Alabang, Inc.; FEU High School, Inc.; Roosevelt College, Inc.; East AsiaEducational Foundation, Inc.; and Nicanor Reyes Educational Foundation, Inc.; andGovernor, Nicanor Reyes Memorial Foundation. His affiliations include, among others: FEUPublic Policy Center (Chairman); Philippine Association of Colleges and Universities (BoardMember; Chair, Research Committee); Association of Southeast Asian Institutions of HigherLearning, National Council of the Philippines (Chairman); Presidents’ Forum of Southeastand South Asia and Taiwan Universities (Member, Steering Committee); Foundation forInformation Technology Education and Development (President); Philippine Economic
- 61 -
Society (Lifetime Member and President, 2007); Action for Economic Reforms (Fellow); andManagement Association of the Philippines (Member).
He obtained his AB (Economics) degree from the Ateneo de Manila University in 1978, MA(Economics) degree from the University of the Philippines (Diliman) School of Economics in1987, and PhD (Applied Economics) degree from Stanford University in 1993.
4. Angelina Palanca Jose, 65, Filipino: Trustee (June 1990 to present) and SpecialProjects (February 2017 to present), Far Eastern University, Inc.
Other Corporate Affiliations: Member, Board of Directors, FERN Realty Corporation andFEU Alabang, Inc.; Trustee, Nicanor Reyes Educational Foundation, Inc.; Treasurer andTrustee, FEU Educational Foundation, Inc.; Corporate Secretary and Governor, NicanorReyes Memorial Foundation; Member, Executive Committee, Far Eastern University, Inc.;Corporate Secretary and Director, Far Eastern College Silang, Inc.; Chair, Angel C. PalancaPeace Program Foundation, Inc.; and Chair, Board of Trustees, (April 2014 – April 2015and April 2017 to present) and Enrolled Member (2013 – 2016) Ahon Sa Hirap, Inc.
She was also the Corporate Secretary of Far Eastern University from February 1998 toJanuary 2017.
Ms. Jose obtained her Bachelor of Science degree, major in Economics, from the Universityof the Philippines (Dean’s Medal).
5. Paulino Y. Tan, 72, Filipino: Trustee, Far Eastern University, Inc. (June 1991 topresent)
Other Corporate Affiliations: At present, Member of the Board of Directors/Trustees of thefollowing companies: Nicanor Reyes Educational Foundation, Inc., FEU EducationalFoundation, Inc., East Asia Educational Foundation, Inc., East Asia Computer Center, Inc.,Lyceum of Batangas, Lyceum of Laguna, SM (Shoemart) Foundation, Inc., Asia PacificTechnology Educational Foundation, FERN Realty Corporation, Far Eastern College Silang,Inc., FEU High School, Inc., FEU Alabang, Inc., Asia Pacific College, Roosevelt College,Inc. and Foundation for Information Technology Education and Development , Inc.
Dr. Tan obtained the Degree of Bachelor in Science in Chemical Engineering from De LaSalle University. He obtained both his M.S. and Ph.D. in Chemical Engineering from theUniversity of Notre Dame, Indiana, U.S.A.
6. Antonio R. Montinola, 65, Filipino: Trustee, Far Eastern University, Inc.(November 2013 to present)
Other Corporate Affiliations: Chairman, President and Director – Round Royal, Inc.;President and Director FERN Realty Corporation, Monti-Rey, Inc. and Juliana ManagementCo., Inc.; Vice Chairman, Treasurer and Director, AMON Trading Corp., Director,Southwestern Cement Ventures, Inc., Far Eastern College Silang, Inc., and Nicanor ReyesEducation Foundation, Inc.; and Trustee, FEU Educational Foundation, Inc.
Sports Affiliations: Member, Board of Managing Directors, Universities Athletic Associationof the Philippines (UAAP); Team Manager, FEU Tamaraws; Member, Manila Golf Club;Member, Tagaytay Midlands Golf Club; Member, The Rockwell Club.
- 62 -
He worked with Procter & Gamble and Jardine Davies, Inc. in the Philippines and withGeneral Mills Corp., based in Minneapolis, Minnesota, U.S.A.
Mr. Montinola holds an A. B. Economics Degree (honors course) from Ateneo de ManilaUniversity (1973) and an M.B.A. from Stanford University, Palo Alto, California, U.S.A.(1978).
7. Sherisa P. Nuesa, 63, Filipino: Independent Trustee, Far Eastern University (August2010 to present).
Other Corporate Affiliations: President and Board Director, ALFM Mutual Funds Group andIndependent Director, Generika/Actimed Group, East Asia Computer Center, Inc., FERNRealty Corporation and Far Eastern College Silang, Inc. She is also an Independent Trusteeof East Asia Educational Foundation. She is a Trustee of Institute of Corporate Directors(ICD), Financial Executives Institute of the Philippines (FINEX) and Judicial ReformInitiative. She also serves as a Senior Adviser to the Boards of Vicsal DevelopmentCorporation and Metro Retail Stores Group, Inc.
She is also an Independent Director of Manila Water Company and Integrated Micro-Electronics, Inc., both listed corporations.
She graduated with the degree of Bachelor of Science in Commerce (summa cum laude) atFar Eastern University in 1974 and received her Master in Business Administration degreefrom the Ateneo - Regis Graduate School of Business in 2010. She also attended post-graduate management programs at Harvard Business School and Stanford University. Shereceived the ING -FINEX CFO of the Year award in 2008.
8. Robert F. Kuan, 70, Filipino: Independent Trustee, Far Eastern University, Inc.(September 2004 to present)
Other Corporate Affiliations: Trustee, St. Luke’s Medical Center, Quezon City (Chairman,1996-2011), St. Luke’s Medical Center, Global City, Inc. (Chairman, 2009-2011), St. Luke’sCollege of Medicine–William H. Quasha Memorial, Brent International School of Manila andBrent International School Subic, Inc., and AIM Scientific Research Foundation, Inc.;Chairman, Brent International School Baguio, Inc., Brent Schools, Inc., Willis TowersWatson Insurance Brokers Philippines, Inc. and St. Theodore of Tarsus Hospital in Sagada,Inc.; Independent Director, China Bank Savings, Inc., Planter’s Development Bank, SEAOILPhilippines, Inc., CBC Capital Corporation, Inc. and China Bank Securities Corporation;Independent Trustee, Roosevelt College, Inc.
He is also an Independent Director of China Banking Corporation, a listed corporation.
Mr. Kuan graduated from the University of the Philippines (1970) with a degree of Bachelorof Science in Business Administration. In 1975, he earned his Masters in BusinessManagement from the Asian Institute of Management (AIM). In 1993, he took up the TopManagement Program at AIM, a program exclusively for company Presidents and ChiefExecutive Officers. He was a TOFIL (The Outstanding Filipino) Awardee in 2003 in the fieldof Business & Entrepreneurship; Agora Awardee for Entrepreneurship and Triple-AAwardee of AIM; Outstanding Alumnus Awardee in the field of Business given by the AlumniAssociation of the University of the Philippines (UP) and Distinguished Alumnus Awardeegiven by the College of Business Administration of the University of the Philippines (UP).
- 63 -
9. Edilberto C. De Jesus, 76, Filipino: Independent Trustee, Far Eastern University, Inc.(August 2012 to present)
Other Corporate Affiliations: Member, Board of Directors, Cagayan de Oro College andPhinma Corp.; Member, Board of Trustees, Philippine Normal University and Foundation forLiberty and Prosperity; Member, Makati Business Club and of the Advisory Board ofPhilippine Business for Education; Fellow, Institute of Corporate Directors; ProfessorEmeritus, Asian Institute of Management and Independent Trustee, Nicanor ReyesEducational Foundation, Inc. and Roosevelt College, Inc.
He obtained a BA Honors Degree in the Humanities, cum laude at the Ateneo de ManilaUniversity in 1962, and received his M. Phil. (1969) and Ph.D. degrees (1972) from YaleUniversity. He served as president of: Far Eastern University (1995-2002); University of theCordilleras (2008-2009); Asian Institute of Management (2009-2012); and SecretariatDirector, Southeast Asia Ministers of Education Organization in Bangkok (2005-2007). Healso served in the Cabinet of President Corazon Aquino as Deputy Peace Commissionerand Presidential Adviser on Rural Development (1987-1992) and as Secretary of Educationin the Cabinet of President Gloria Arroyo (2002-2004).
10. Maria Teresa Trinidad P. Tinio, 53, Filipino: Senior Vice President for AcademicAffairs, Far Eastern University, Inc. (June 2011 to present)
PhD Southeast Asian Literature, National University of Singapore; Master of English, majorin Literature and Cultural Studies, Ateneo de Manila University with academic units from theNew School for Social Research, New York City; AB Humanities, Ateneo de ManilaUniversity.
Research focus in Philippine Literature, Sociolinguistics, and the Politics of Language inSoutheast Asia. Publications include contributions to the CCP Encyclopaedia of the Arts,the Loyola Schools Review, Philippine Studies, and The Politics of English in Asia:Language Policy and Cultural Expression in South and Southeast Asia and the AsiaPacific published by John Benjamins (The Netherlands).
11. Juan Miguel R. Montinola, 57, Filipino: Chief Finance Officer, Far Eastern University,Inc. (September 2010 to present)
Other Corporate Affiliations: Chair, FEU Health, Welfare and Retirement Fund Plan andFoundation for Information Technology Education and Development, Inc.; President, AmonTrading Corporation; Board Member of FERN Realty Corporation, East Asia ComputerCenter, Inc., Far Eastern College Silang, Inc., East Asia Educational Foundation, Inc., FEUEducational Foundation, Inc., Nicanor Reyes Memorial Foundation, Nicanor ReyesEducational Foundation, Inc., FEU Alabang, Inc, FEU High School, Inc., Urban Program forLivelihood Finance and Training and Roosevelt College, Inc. Member of the ExecutiveCommittees of many of the organizations he serves as Director.
Mr. Montinola was Chief Executive Officer and Country Manager of Lafarge Cementi SA,Italy, from 2006 to 2008, and President and CEO of Republic Cement Corporation from1996 to 2006. During this period he served concurrently as Senior Vice President forCommercial Business from 2002 to 2006, and SVP for Procurement from 2001 to 2002, ofLafarge Cement Services, Inc.
- 64 -
Prior to 1996, Mr. Montinola held various positions in Republic Cement Corporation andserved as a member of the Board of Directors in different organizations.
Mr. Montinola has an MBA from International Institute of Management Development,Switzerland, and an AB Economics degree from College of William & Mary, Virginia, USA.
12. Myrna P. Quinto, 56, Filipino: Vice President for Academic Development,Far Eastern University, Inc. (April 2014 to present)
Other Corporate Affiliations: She is a member of the Biology Teachers Association (BIOTA),Philippine Society of Microbiology (PSM), and the Association of Systematic Biologists ofthe Philippines (ASBP).
Among her relevant trainings abroad are the Educational Leadership Training in NTU,Singapore, the ASEAN University Network (AUN) Quality Assurance Training in Thailand,and the month-long CHED Training Program on the Internationalization of Philippine HigherEducation held in Canada, in partnership with the Canadian Bureau of InternationalEducation.
Dr. Myrna P. Quinto is a B.S. Biology graduate from the College of the Holy Spirit. Shefinished her Master of Arts in Education major in Biology at the University of the Philippinesand her Doctor of Philosophy in Science Education major in Biology at De La SalleUniversity, Manila, Philippines.
13. Gianna R. Montinola, 60, Filipino: Vice President Corporate Affairs, Far EasternUniversity, Inc. (November 2013 to present)
Concurrently Director and Corporate Secretary of FERN Realty Corporation, East AsiaComputer Center, Inc. and Amon Trading Corporation; Trustee and Corporate Secretary,East Asia Educational Foundation, Inc.; Director of Far Eastern College Silang, Inc., andRobinsons True Serve Hardware Phils, Inc. Trustee and Secretary, Foundation forInformation Technology Education and Development, Inc. Co-founder of non-profitorganizations Hands On Manila Foundation, Inc. and Peace Tech, Inc. Associate lawyer ofthe Quisumbing Torres Law Office (an affiliate of the Baker & McKenzie Law Office, U.S.A.)from 1986 to 1992. Philippine Honorary Consul to the Republic of Peru from 1992 to 1996,Marketing and Business Development manager of Rockwell Land Corporation from 1996 to1998.
She earned a Bachelor of Arts degree in International Relations from Mount HolyokeCollege, U.S.A. and a Bachelor of Laws (Ll.B.) degree, with honors, from the Ateneo deManila College of Law. She obtained a Masters degree in Public Administration from theJohn F. Kennedy School of Government at Harvard University, U.S.A.

- 65 -
14. Renato L. Serapio, 60, Filipino: Vice President for Human ResourceDevelopment, Far Eastern University, Inc. (October 2015 to present)
Other Corporate Affiliations: Accredited Fellow in People Management by the Society ofFellows in People Management of the People Management Association of the Philippines,and a Certified Executive Coach from AIMS International. He is also a certified assessor ofHarrison Profiles and a certified facilitator of Steven Covey’s 7 Habits of Highly EffectivePeople.
Past affiliations: Board Member of the Society of Fellows in People Management, 2012 to2014; President, Puso ng Siemens Foundation, 2001 to 2008; Vice President, PhilippineSociety of Fellows in Personnel Management, 2004 to 2006; Director, PhilippineSociety for Training and Development, April - December 2001; Chairperson – Regional HRCouncil, Siemens Asia Pacific, 2001 - 2002; Chairman, Research Committee, PersonnelManagement Association of the Philippines, January- December 1994.
Mr. Serapio received his Bachelor of Science in Industrial Management Engineering with aminor in Mechanical Engineering from De La Salle University in 1978 and completedthe Advance Management Development, Siemens Management Learning/The FuquaSchool of Business - Duke University, North Carolina August 2000 to May 2001. He alsoreceived his Certificate of Professional Designation in Systems Analysis from the UCLAExtension School, University of California Los Angeles in 1987.
15. Santiago L. Garcia, Jr. , 62, Filipino: Corporate Secretary and Vice-President forCompliance, Far Eastern University, Inc. (February 2017 to present)
Other Corporate Affiliations: Corporate Secretary of East Asia Computer Center, Inc. (doingbusiness under the trade names FEU Institute of Technology, and FEU Diliman), East AsiaEducational Foundation, Inc., FEU Alabang, Inc., FEU High School, Inc., Nicanor ReyesEducational Foundation, Inc. (also known as FEU-FERN College), and UP Law 80Foundation, Inc. He is also a member of the Board of Trustees of UP Law 80 Foundation,Inc.
He graduated with an AB Political Science degree at San Beda College [now San BedaUniversity] (Mendiola, Manila) in 1976, and received his Bachelor of Laws degree from theCollege of Law of the University of the Philippines (Diliman, Quezon City) in 1980. Hepassed the Bar Examinations given by the Supreme Court of the Philippines in November1980.
16. Edward R. Kilakiga, 43, Filipino: Vice President, Facilities and Technical Services(July 2017 - Present ), Far Eastern University, Inc.
Other affiliations: President, Philippine Society of Mechanical Engineers, Quezon CityChapter (PSME QCC) - Jan. 2017 to Present; Auditor, Institute of Integrated ElectricalEngineers (IIEE), Metro Manila Region, Metro West Chapter - Jan 2018 to Present;Mission Director, Brotherhood of Christian Businessmen and Professionals, ManilaChapter - Dec. 2017 to Present; Member, Institute of Hotel Engineers Association of thePhilippines (IHEAP); Secretary, Institute of Hotel Engineers Association of thePhilippines (2015).
- 66 -
He graduated with a degree of BS Mechanical Engineering in 2009, BS ElectricalEngineering in 1999 and Electrical Technology, in 1994 at Rizal Technological University.He is a Professional Electrical Engineer, a Professional Mechanical Engineer, a RegisteredMaster Plumber and a Registered Master Electrician.
He received a Lorezono Ruiz Award for National Discipline in 1991 by AY Foundation Inc,Guadalupe Catholic School, Makati City.
17. Rosanna Esguerra-Salcedo, 54, Filipino: Treasurer, Far Eastern University, Inc.(September 2014 to present)
Other Corporate Affiliations: Treasurer of FEU Alabang, Inc., Vice President for Finance ofRoosevelt College, Inc. and a Member of the Credit Management Association of thePhilippines.
Before joining FEU, she worked at the Bayan Telecommunications, Inc., were she managednumerous departments: initially as Head of General Accounting and Accounts Payable,then, Budget Department and Revenue Accounting, and as Head of Billing and Collection.She also served as the Head of Treasury and Internal Audit of Mariwasa Manufacturing, Inc.for five years.
Prior to joining the private sector, she worked for SGV & Co. both as an External SeniorAuditor and Tax Senior Auditor.
Ms. Salcedo is a Certified Public Accountant. She obtained her BSBA Major in Accounting,cum laude, from the University of the East. She also completed her Management LeadershipProgram at the Asian Institute of Management.
18. Glenn Z. Nagal, 60, Filipino: Comptroller, Far Eastern University, Inc. (1996 to present)
Other Corporate Affiliation: Director and Treasurer, FEU High School, Inc.
Work experience: External Auditor, Carlos J. Valdes and Company; Examiner,Central Bank of the Philippines; Internal Audit Manager, Far Eastern University;Chief Accountant and Budget Director, Far Eastern University; Compliance Officer,Far Eastern University; and Accounting Professor, Far Eastern University.
A Certified Public Accountant by profession, Mr. Nagal graduated with the degree ofBachelor of Science in Commerce, major in Accounting from Far Eastern University.
19. Rogelio C. Ormilon, Jr., 52, Filipino: Chief Audit Executive and Risk ManagementOfficer (September 2015 to present), Far Eastern University, Inc.
Work experience: Audit Director at R.G. Manabat & Co./KPMG Philippines; Audit SeniorManager at Isla Lipana & Co./PwC Philippines; Audit Senior Manager at Ernst & Young Ltd.Auckland, New Zealand; and Compliance Officer, Far Eastern University (September 2015to January 2017).
He graduated with the degree of B.S. Business Administration, Major in Accounting fromPhilippine School of Business Administration, Quezon City Campus in 1987 and obtainedhis Master in Management at the Asian Institute of Management in 2004. He is also aCertified Public Accountant.

- 67 -
The term of office of a Trustee is one (1) year or until his/her successor is elected and qualified.The members of the Board of Trustees of the Corporation are elected at the Annual Stockholders'Meeting to hold office until the next succeeding annual meeting, or up to the time their respectivesuccessors shall have been elected and qualified.
The officers are appointed or elected annually by the Board of Trustees at its organizational meeting,each to hold office until the next meeting of the Board the following year or until a successor shallhave been elected, appointed and qualified.
Significant Employees
The corporation considers its entire work force as significant employees. Everyone is expected towork together as a team to achieve the corporation’s goals and objectives.
Family Relationships
Dr. Lourdes R. Montinola, Chair Emeritus is the mother of Mr. Aurelio R. Montinola III, Chairman,Mr. Antonio R. Montinola, Trustee, Mr. Juan Miguel R. Montinola, Chief Finance Officer andAtty. Gianna R. Montinola, Vice President for Corporate Affairs.
Training and/or Continuing Education Programs of Trustees
The continuing education programs for directors: programs and seminars and roundtables attendedduring the year are as follows:
Name of Director/Officer Date of Training Program Name of Training Institution
Sherisa P. Nuesa August 11, 2017 Corporate Governance andRisk Management Summit
Institute of Corporate Directors(ICD)
Lourdes R. Montinola March 29, 2016 Corporate GovernanceSeminar
Risks, Opportunities, Assessmentand Management (ROAM), Inc.
Aurelio R. Montinola III August 21, 2017 Corporate Governance andRisk Management Summit
Institute of Corporate Directors(ICD)
Angelina P. Jose March 29, 2016 Corporate GovernanceSeminar
Risks, Opportunities, Assessmentand Management (ROAM), Inc.
Rosanna E. Salcedo March 29, 2016 Corporate GovernanceSeminar
Risks, Opportunities, Assessmentand Management (ROAM), Inc.
Edilberto C. de Jesus May 10, 2017 Distinguished CorporateGovernance Speaker Series
Institute of Corporate Directors(ICD)
Juan Miguel R. Montinola June 10, 2016 Corporate GovernanceSeminar
Risks, Opportunities, Assessmentand Management (ROAM), Inc.
Maria Teresa Trinidad P.Tinio June 10, 2016 Corporate Governance
SeminarRisks, Opportunities, Assessmentand Management (ROAM), Inc.
Myrna P. Quinto June 10, 2016 Corporate GovernanceSeminar
Risks, Opportunities, Assessmentand Management (ROAM), Inc.
Rogelio C. Ormilon, Jr. June 10, 2016 Corporate GovernanceSeminar
Risks, Opportunities, Assessmentand Management (ROAM), Inc.
Renato L. Serapio June 10, 2016 Corporate GovernanceSeminar
Risks, Opportunities, Assessmentand Management (ROAM), Inc.
Michael M. Alba August 3, 2016 Corporate GovernanceSeminar
Securities and ExchangeCommission
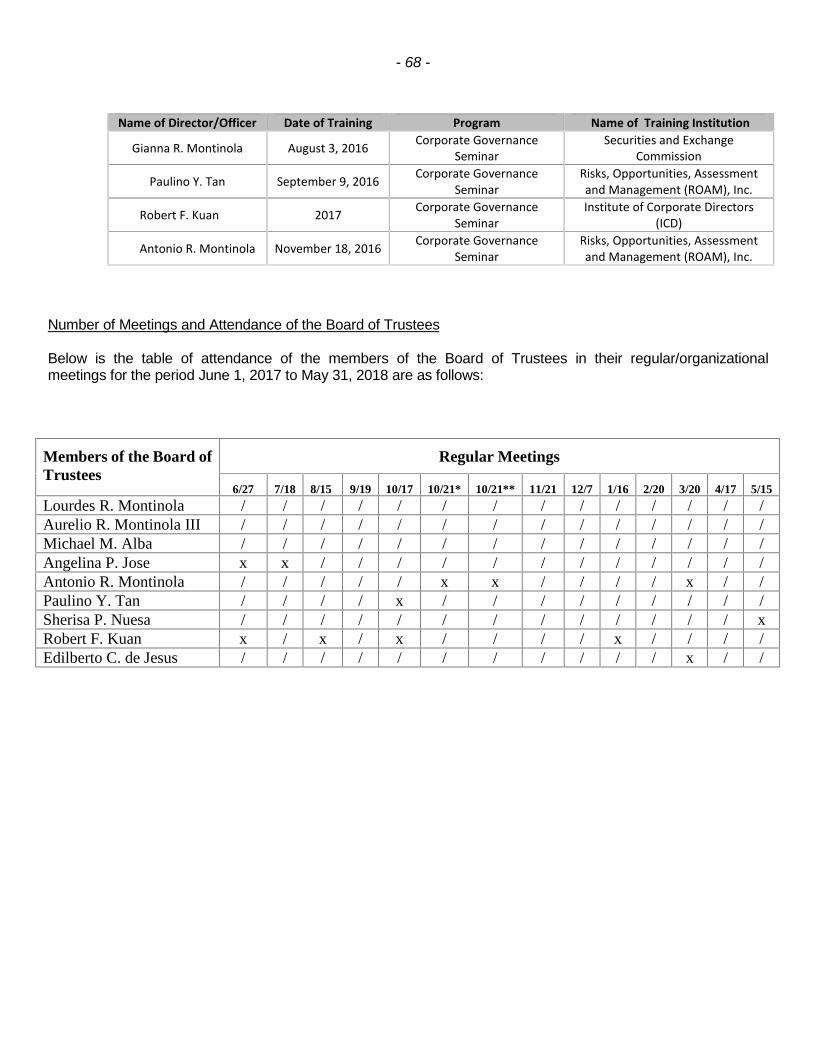
- 68 -
Name of Director/Officer Date of Training Program Name of Training Institution
Gianna R. Montinola August 3, 2016 Corporate GovernanceSeminar
Securities and ExchangeCommission
Paulino Y. Tan September 9, 2016 Corporate GovernanceSeminar
Risks, Opportunities, Assessmentand Management (ROAM), Inc.
Robert F. Kuan 2017 Corporate GovernanceSeminar
Institute of Corporate Directors(ICD)
Antonio R. Montinola November 18, 2016 Corporate GovernanceSeminar
Risks, Opportunities, Assessmentand Management (ROAM), Inc.
Number of Meetings and Attendance of the Board of Trustees
Below is the table of attendance of the members of the Board of Trustees in their regular/organizationalmeetings for the period June 1, 2017 to May 31, 2018 are as follows:
Members of the Board ofTrustees
Regular Meetings
6/27 7/18 8/15 9/19 10/17 10/21* 10/21** 11/21 12/7 1/16 2/20 3/20 4/17 5/15
Lourdes R. Montinola / / / / / / / / / / / / / /Aurelio R. Montinola III / / / / / / / / / / / / / /Michael M. Alba / / / / / / / / / / / / / /Angelina P. Jose x x / / / / / / / / / / / /Antonio R. Montinola / / / / / x x / / / / x / /Paulino Y. Tan / / / / x / / / / / / / / /Sherisa P. Nuesa / / / / / / / / / / / / / xRobert F. Kuan x / x / x / / / / x / / / /Edilberto C. de Jesus / / / / / / / / / / / x / /
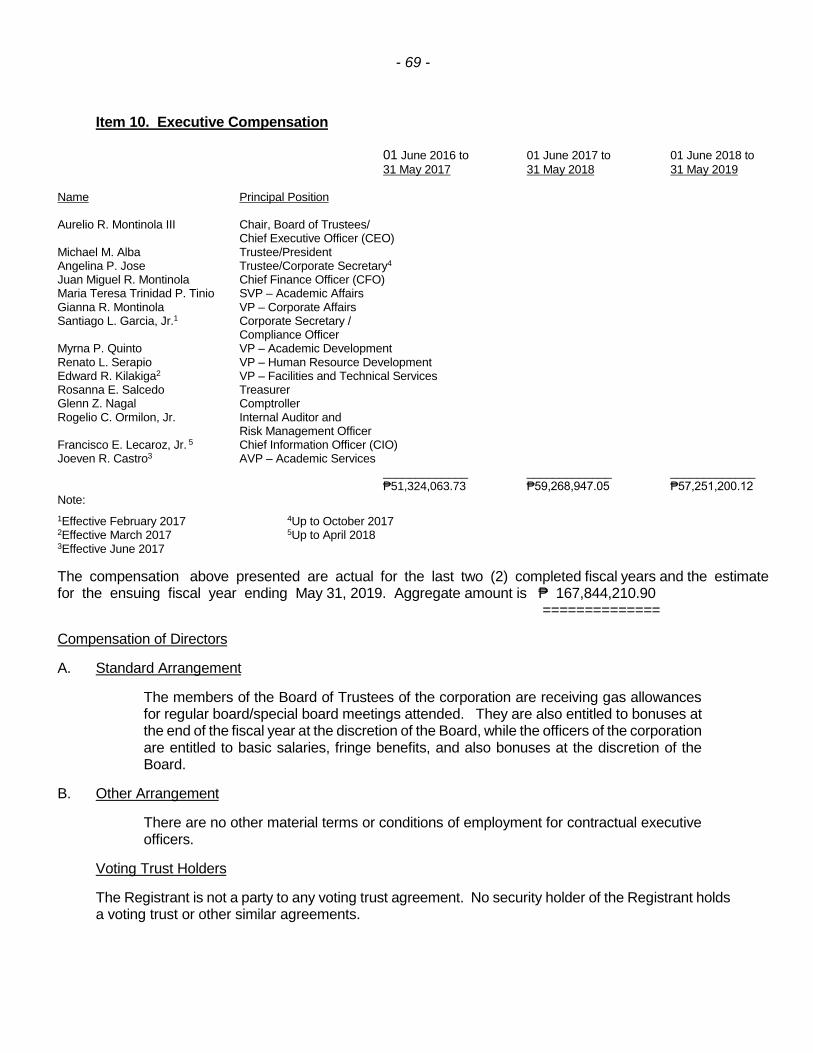
- 69 -
Item 10. Executive Compensation
01 June 2016 to 01 June 2017 to 01 June 2018 to31 May 2017 31 May 2018 31 May 2019
Name Principal Position
Aurelio R. Montinola III Chair, Board of Trustees/Chief Executive Officer (CEO)
Michael M. Alba Trustee/PresidentAngelina P. Jose Trustee/Corporate Secretary4
Juan Miguel R. Montinola Chief Finance Officer (CFO)Maria Teresa Trinidad P. Tinio SVP – Academic AffairsGianna R. Montinola VP – Corporate AffairsSantiago L. Garcia, Jr.1 Corporate Secretary /
Compliance OfficerMyrna P. Quinto VP – Academic DevelopmentRenato L. Serapio VP – Human Resource DevelopmentEdward R. Kilakiga2 VP – Facilities and Technical ServicesRosanna E. Salcedo TreasurerGlenn Z. Nagal ComptrollerRogelio C. Ormilon, Jr. Internal Auditor and
Risk Management OfficerFrancisco E. Lecaroz, Jr. 5 Chief Information Officer (CIO)Joeven R. Castro3 AVP – Academic Services
_____________ _____________ _____________₱51,324,063.73 ₱59,268,947.05 ₱57,251,200.12
Note:1Effective February 2017 4Up to October 20172Effective March 2017 5Up to April 20183Effective June 2017
The compensation above presented are actual for the last two (2) completed fiscal years and the estimatefor the ensuing fiscal year ending May 31, 2019. Aggregate amount is ₱ 167,844,210.90
==============
Compensation of Directors
A. Standard Arrangement
The members of the Board of Trustees of the corporation are receiving gas allowancesfor regular board/special board meetings attended. They are also entitled to bonuses atthe end of the fiscal year at the discretion of the Board, while the officers of the corporationare entitled to basic salaries, fringe benefits, and also bonuses at the discretion of theBoard.
B. Other Arrangement
There are no other material terms or conditions of employment for contractual executiveofficers.
Voting Trust Holders
The Registrant is not a party to any voting trust agreement. No security holder of the Registrant holdsa voting trust or other similar agreements.
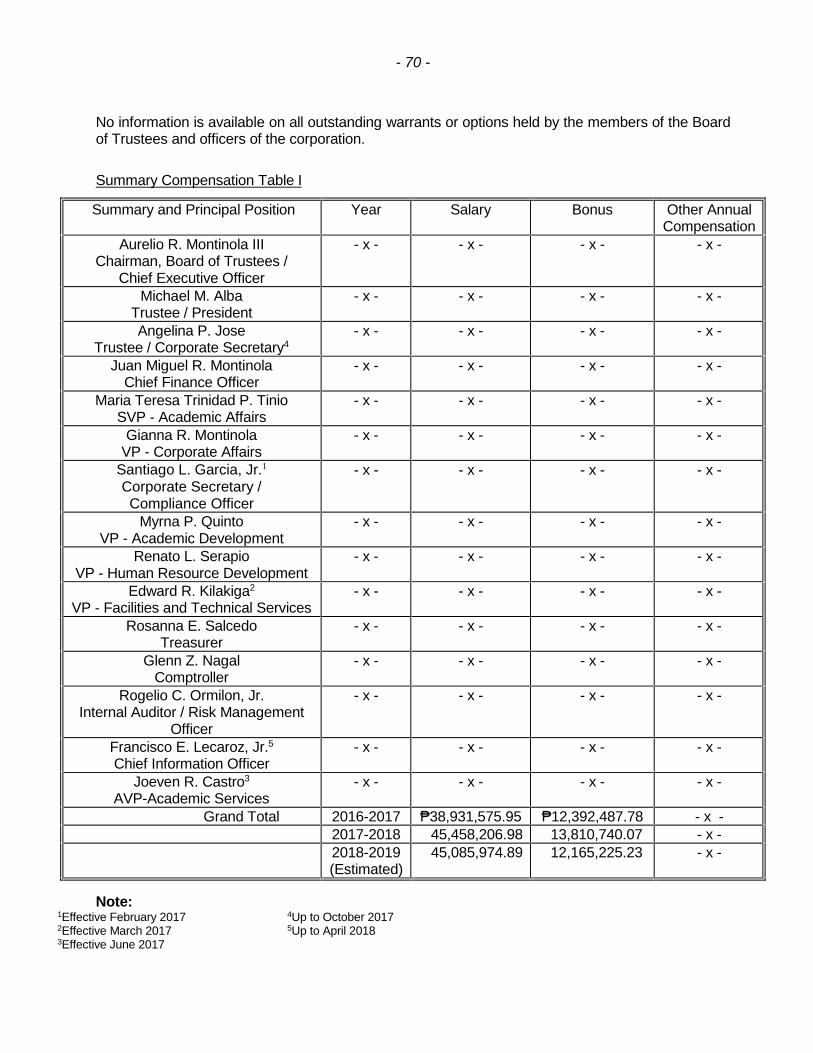
- 70 -
No information is available on all outstanding warrants or options held by the members of the Boardof Trustees and officers of the corporation.
Summary Compensation Table I
Note:1Effective February 2017 4Up to October 20172Effective March 2017 5Up to April 20183Effective June 2017
Summary and Principal Position Year Salary Bonus Other AnnualCompensation
Aurelio R. Montinola IIIChairman, Board of Trustees /
Chief Executive Officer
- x - - x - - x - - x -
Michael M. AlbaTrustee / President
- x - - x - - x - - x -
Angelina P. JoseTrustee / Corporate Secretary4
- x - - x - - x - - x -
Juan Miguel R. MontinolaChief Finance Officer
- x - - x - - x - - x -
Maria Teresa Trinidad P. TinioSVP - Academic Affairs
- x - - x - - x - - x -
Gianna R. MontinolaVP - Corporate Affairs
- x - - x - - x - - x -
Santiago L. Garcia, Jr.1
Corporate Secretary /Compliance Officer
- x - - x - - x - - x -
Myrna P. QuintoVP - Academic Development
- x - - x - - x - - x -
Renato L. SerapioVP - Human Resource Development
- x - - x - - x - - x -
Edward R. Kilakiga2
VP - Facilities and Technical Services- x - - x - - x - - x -
Rosanna E. SalcedoTreasurer
- x - - x - - x - - x -
Glenn Z. NagalComptroller
- x - - x - - x - - x -
Rogelio C. Ormilon, Jr.Internal Auditor / Risk Management
Officer
- x - - x - - x - - x -
Francisco E. Lecaroz, Jr.5Chief Information Officer
- x - - x - - x - - x -
Joeven R. Castro3
AVP-Academic Services- x - - x - - x - - x -
Grand Total 2016-2017 ₱38,931,575.95 ₱12,392,487.78 - x -2017-2018 45,458,206.98 13,810,740.07 - x -2018-2019(Estimated)
45,085,974.89 12,165,225.23 - x -
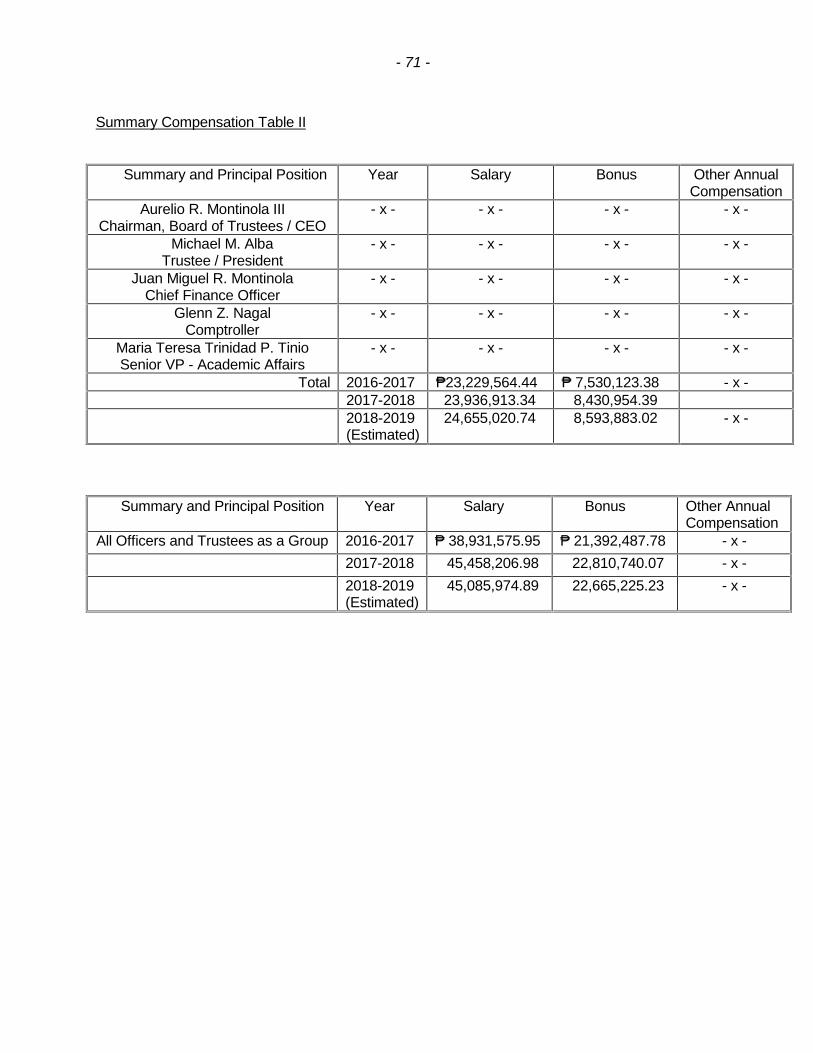
- 71 -
Summary Compensation Table II
Summary and Principal Position Year Salary Bonus Other AnnualCompensation
Aurelio R. Montinola IIIChairman, Board of Trustees / CEO
- x - - x - - x - - x -
Michael M. AlbaTrustee / President
- x - - x - - x - - x -
Juan Miguel R. MontinolaChief Finance Officer
- x - - x - - x - - x -
Glenn Z. NagalComptroller
- x - - x - - x - - x -
Maria Teresa Trinidad P. TinioSenior VP - Academic Affairs
- x - - x - - x - - x -
Total 2016-2017 ₱23,229,564.44 ₱ 7,530,123.38 - x -2017-2018 23,936,913.34 8,430,954.392018-2019(Estimated)
24,655,020.74 8,593,883.02 - x -
Summary and Principal Position Year Salary Bonus Other AnnualCompensation
All Officers and Trustees as a Group 2016-2017 ₱ 38,931,575.95 ₱ 21,392,487.78 - x -2017-2018 45,458,206.98 22,810,740.07 - x -2018-2019(Estimated)
45,085,974.89 22,665,225.23 - x -
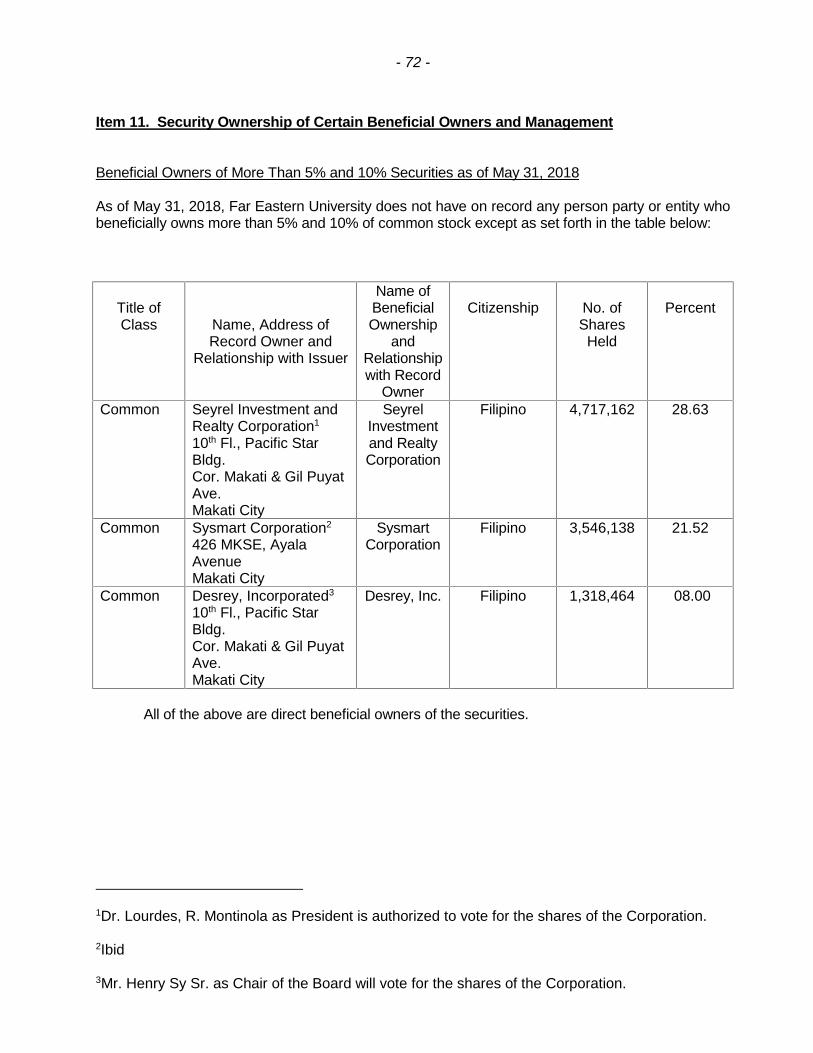
- 72 -
Item 11. Security Ownership of Certain Beneficial Owners and Management
Beneficial Owners of More Than 5% and 10% Securities as of May 31, 2018
As of May 31, 2018, Far Eastern University does not have on record any person party or entity whobeneficially owns more than 5% and 10% of common stock except as set forth in the table below:
Title ofClass Name, Address of
Record Owner andRelationship with Issuer
Name ofBeneficialOwnership
andRelationshipwith Record
Owner
Citizenship No. ofShares
Held
Percent
Common Seyrel Investment andRealty Corporation1
10th Fl., Pacific StarBldg.Cor. Makati & Gil PuyatAve.Makati City
SeyrelInvestmentand RealtyCorporation
Filipino 4,717,162 28.63
Common Sysmart Corporation2
426 MKSE, AyalaAvenueMakati City
SysmartCorporation
Filipino 3,546,138 21.52
Common Desrey, Incorporated3
10th Fl., Pacific StarBldg.Cor. Makati & Gil PuyatAve.Makati City
Desrey, Inc. Filipino 1,318,464 08.00
All of the above are direct beneficial owners of the securities.
1Dr. Lourdes, R. Montinola as President is authorized to vote for the shares of the Corporation.
2Ibid
3Mr. Henry Sy Sr. as Chair of the Board will vote for the shares of the Corporation.
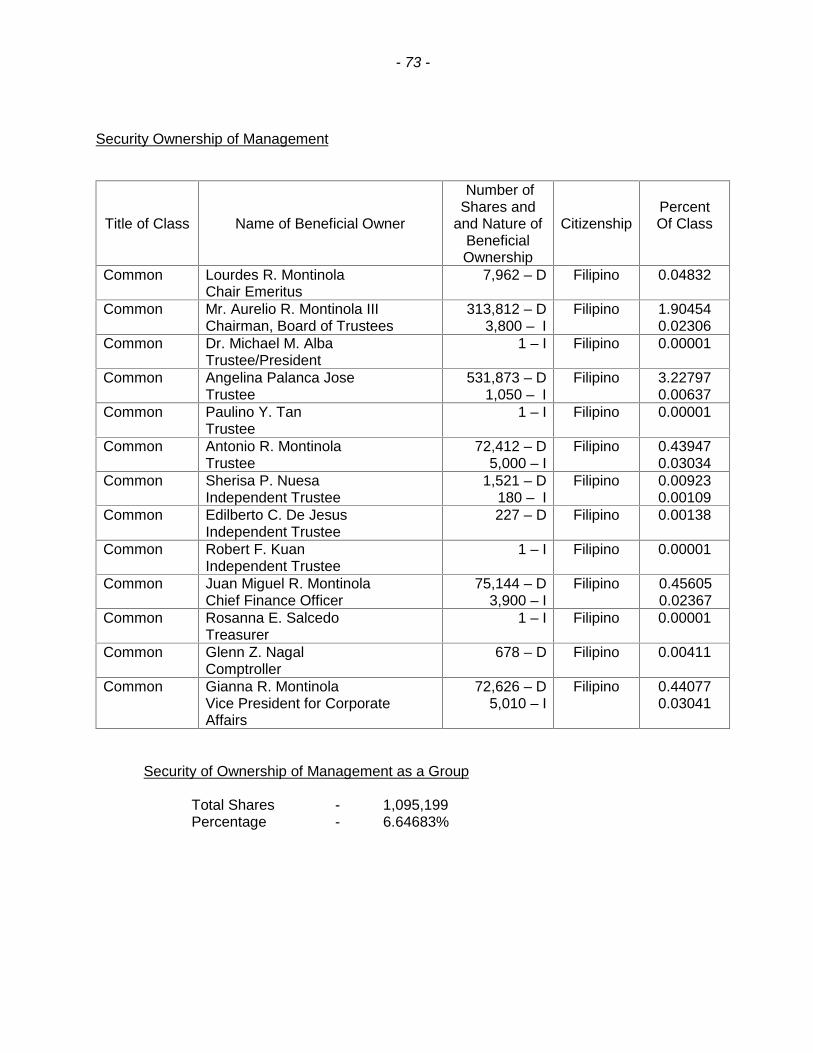
- 73 -
Security Ownership of Management
Title of Class Name of Beneficial Owner
Number ofShares and
and Nature ofBeneficialOwnership
CitizenshipPercentOf Class
Common Lourdes R. MontinolaChair Emeritus
7,962 – D Filipino 0.04832
Common Mr. Aurelio R. Montinola IIIChairman, Board of Trustees
313,812 – D3,800 – I
Filipino 1.904540.02306
Common Dr. Michael M. AlbaTrustee/President
1 – I Filipino 0.00001
Common Angelina Palanca JoseTrustee
531,873 – D1,050 – I
Filipino 3.227970.00637
Common Paulino Y. TanTrustee
1 – I Filipino 0.00001
Common Antonio R. MontinolaTrustee
72,412 – D5,000 – I
Filipino 0.439470.03034
Common Sherisa P. NuesaIndependent Trustee
1,521 – D180 – I
Filipino 0.009230.00109
Common Edilberto C. De JesusIndependent Trustee
227 – D Filipino 0.00138
Common Robert F. KuanIndependent Trustee
1 – I Filipino 0.00001
Common Juan Miguel R. MontinolaChief Finance Officer
75,144 – D3,900 – I
Filipino 0.456050.02367
Common Rosanna E. SalcedoTreasurer
1 – I Filipino 0.00001
Common Glenn Z. NagalComptroller
678 – D Filipino 0.00411
Common Gianna R. MontinolaVice President for CorporateAffairs
72,626 – D5,010 – I
Filipino 0.440770.03041
Security of Ownership of Management as a Group
Total Shares - 1,095,199Percentage - 6.64683%
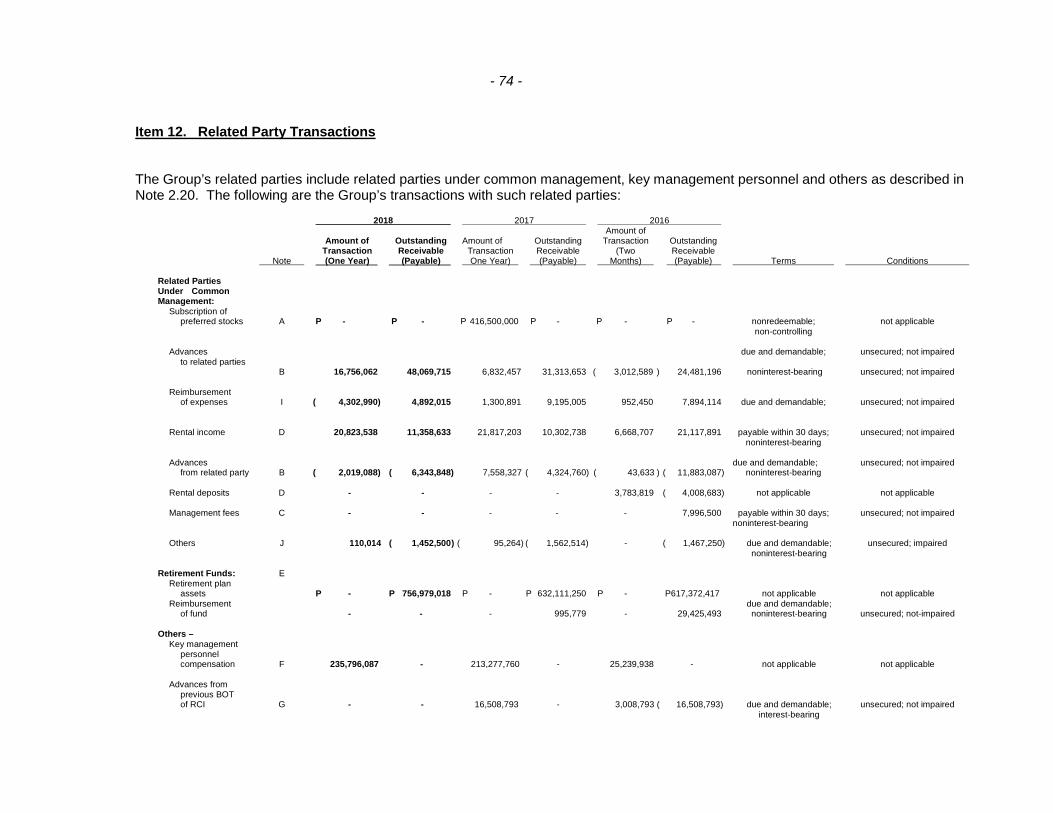
Item 12. Related Party Transactions
The Group’s related parties include related parties under common management, key management personnel and others as described inNote 2.20. The following are the Group’s transactions with such related parties:
2018 2017 2016Amount of
Amount of Outstanding Amount of Outstanding Transaction OutstandingTransaction Receivable Transaction Receivable (Two Receivable
Note (One Year) (Payable) One Year) (Payable) Months) (Payable) Terms Conditions
Related PartiesUnder CommonManagement:
Subscription ofpreferred stocks A P - P - P 416,500,000 P - P - P - nonredeemable; not applicable
non-controlling
Advances due and demandable; unsecured; not impairedto related parties
B 16,756,062 48,069,715 6,832,457 31,313,653 ( 3,012,589 ) 24,481,196 noninterest-bearing unsecured; not impaired
Reimbursementof expenses I ( 4,302,990) 4,892,015 1,300,891 9,195,005 952,450 7,894,114 due and demandable; unsecured; not impaired
Rental income D 20,823,538 11,358,633 21,817,203 10,302,738 6,668,707 21,117,891 payable within 30 days; unsecured; not impairednoninterest-bearing
Advances due and demandable; unsecured; not impairedfrom related party B ( 2,019,088) ( 6,343,848) 7,558,327 ( 4,324,760) ( 43,633 ) ( 11,883,087) noninterest-bearing
Rental deposits D - - - - 3,783,819 ( 4,008,683) not applicable not applicable
Management fees C - - - - - 7,996,500 payable within 30 days; unsecured; not impairednoninterest-bearing
Others J 110,014 ( 1,452,500) ( 95,264) ( 1,562,514) - ( 1,467,250) due and demandable; unsecured; impairednoninterest-bearing
Retirement Funds: ERetirement plan
assets P - P 756,979,018 P - P 632,111,250 P - P617,372,417 not applicable not applicableReimbursement due and demandable;
of fund - - - 995,779 - 29,425,493 noninterest-bearing unsecured; not-impaired
Others –Key management
personnelcompensation F 235,796,087 - 213,277,760 - 25,239,938 - not applicable not applicable
Advances fromprevious BOTof RCI G - - 16,508,793 - 3,008,793 ( 16,508,793) due and demandable; unsecured; not impaired
interest-bearing
- 74 -
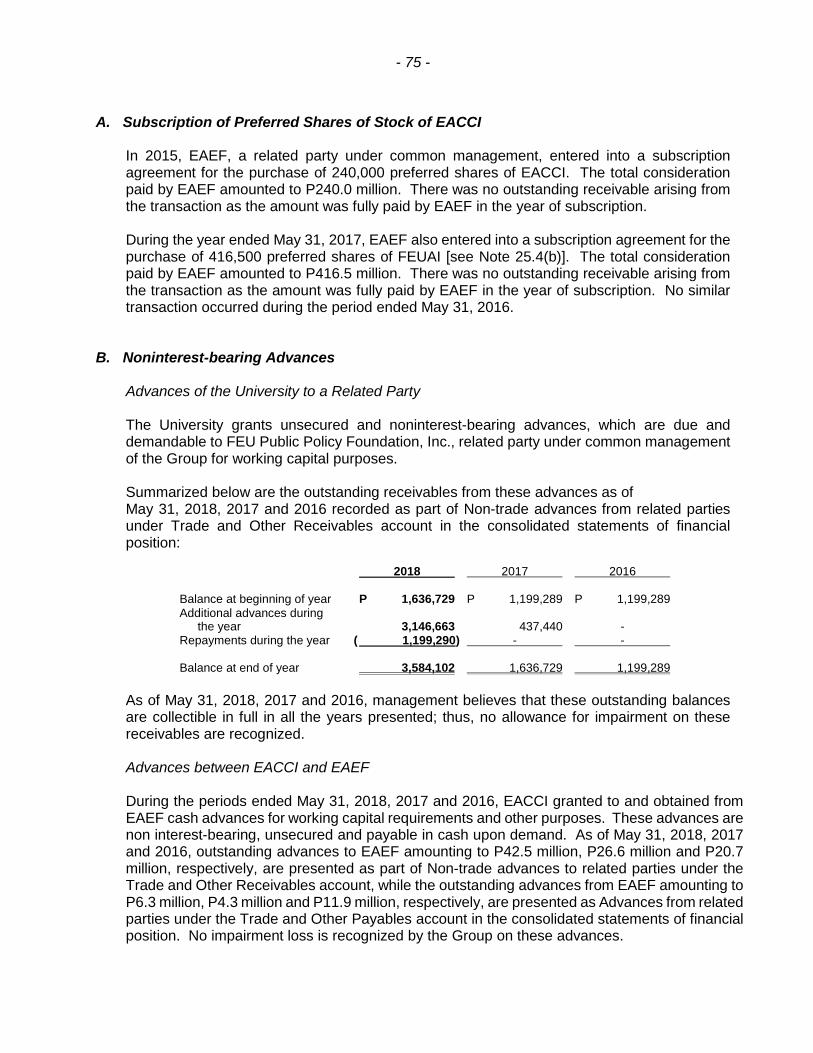
- 75 -
A. Subscription of Preferred Shares of Stock of EACCI
In 2015, EAEF, a related party under common management, entered into a subscriptionagreement for the purchase of 240,000 preferred shares of EACCI. The total considerationpaid by EAEF amounted to P240.0 million. There was no outstanding receivable arising fromthe transaction as the amount was fully paid by EAEF in the year of subscription.
During the year ended May 31, 2017, EAEF also entered into a subscription agreement for thepurchase of 416,500 preferred shares of FEUAI [see Note 25.4(b)]. The total considerationpaid by EAEF amounted to P416.5 million. There was no outstanding receivable arising fromthe transaction as the amount was fully paid by EAEF in the year of subscription. No similartransaction occurred during the period ended May 31, 2016.
B. Noninterest-bearing Advances
Advances of the University to a Related Party
The University grants unsecured and noninterest-bearing advances, which are due anddemandable to FEU Public Policy Foundation, Inc., related party under common managementof the Group for working capital purposes.
Summarized below are the outstanding receivables from these advances as ofMay 31, 2018, 2017 and 2016 recorded as part of Non-trade advances from related partiesunder Trade and Other Receivables account in the consolidated statements of financialposition:
2018 2017 2016
Balance at beginning of year P 1,636,729 P 1,199,289 P 1,199,289Additional advances during
the year 3,146,663 437,440 -Repayments during the year ( 1,199,290) - -
Balance at end of year 3,584,102 1,636,729 1,199,289
As of May 31, 2018, 2017 and 2016, management believes that these outstanding balancesare collectible in full in all the years presented; thus, no allowance for impairment on thesereceivables are recognized.
Advances between EACCI and EAEF
During the periods ended May 31, 2018, 2017 and 2016, EACCI granted to and obtained fromEAEF cash advances for working capital requirements and other purposes. These advances arenon interest-bearing, unsecured and payable in cash upon demand. As of May 31, 2018, 2017and 2016, outstanding advances to EAEF amounting to P42.5 million, P26.6 million and P20.7million, respectively, are presented as part of Non-trade advances to related parties under theTrade and Other Receivables account, while the outstanding advances from EAEF amounting toP6.3 million, P4.3 million and P11.9 million, respectively, are presented as Advances from relatedparties under the Trade and Other Payables account in the consolidated statements of financialposition. No impairment loss is recognized by the Group on these advances.
- 76 -
Advances of RCI to its Related Party
RCI grants noninterest-bearing and unsecured advances to Roosevelt College Center forTeacher Education, a related party under common management, for working capital purposes.These advances are generally collectible in cash and are due upon demand or throughoffsetting arrangement. The outstanding balance from these transactions which amounts toP2.0 million, P3.0 million and P2.7 million as of May 31, 2018, 2017 and 2016, respectively,are presented as part of Non-trade advances to related parties under the Trade and OtherReceivables account in the consolidated statements of financial position.
C. Management Services
The University provided management services to EAEF and FERN College, which agreed topay management fee computed at a certain percentage of the latter’s gross revenue subjectto certain conditions. Management fees earned amounted to P20.4 million for the period endedMarch 31, 2016 and is presented as Management Fees under Revenues in the consolidatedstatements of profit or loss. No similar income was earned for the periods ended May 31, 2017and 2016 as EACCI already took over the operations of EAEF during the said periods.
Outstanding receivables arising from this transaction amounted to P8.0 million and as of May31, 2016 (nil as of May 31, 2017) and are presented as part of Management fee receivableunder Trade and Other Receivables account in the consolidated statements of financialposition. No impairment loss is recognized by the University on these receivables.
D. Leases
Lease of Buildings to EAEF
The University leased out certain buildings to EAEF for a period of one to five years until May31, 2015. Upon expiration of the term of the contract, the University and EAEF had mutuallyagreed not to renew such lease agreement. Instead, as of May 31, 2018, 2017 and 2016, onlycertain floors of the buildings were leased out to EAEF.
Total rental income earned by the University and EACCI from EAEF, presented as part ofRental under Revenues in the consolidated statements of profit or loss, amounted toP2.8 million and P6.7 million for the periods ended May 31, 2017 and 2016, respectively.Outstanding receivable arising from the transaction amounted to P2.9 million, P3.3 million andP17.0 million as of May 31, 2018, 2017 and 2016, respectively, and is presented as Rentalreceivable under Trade and Other Receivables account in the consolidated statement offinancial position. There was no similar transaction in 2018 as EAEF has already transferredits students to EACCI through a memorandum of agreement in 2017.
Meanwhile, since the construction of the school building of EACCI was fully completed as ofMarch 31, 2015, EAEF and EACCI entered into a contract to lease certain floors of EACCI’snewly-constructed school building. The lease commenced on July 1, 2014 for a period of fiveyears with 5% annual escalation.
- 77 -
However, in May 2016, the lease agreement was pre-terminated. Accordingly, EACCIreversed the related accrued rent receivable arising from straight line recognition of leaseamounting to P7.0 million and is recorded as part of General expenses under costs andOperating Expenses in the 2016 consolidated statement of profit or loss.
Lease of Buildings to FERN College
FRC leased out certain buildings to FERN College effective from June 1, 2007 to May 31, 2017for an annual rental of P14.0 million or 10% of gross annual revenue, whichever is higher. InJanuary 2013, an amended lease agreement was executed by both parties which stated thatthe lease term shall now be from January 31, 2013 to December 31, 2023 for an annual rentalfee of P12.0 million or 10% of FERN College’s annual gross income, whichever is higher.
Total rental income of FRC from FERN College amounted to P19.4 million andP18.0 million for the years ended May 31, 2018 and 2017, which is recorded as part of Rentalunder Revenues in the consolidated statements of profit or loss. No similar income was earnedduring the two months ended May 31, 2016. Outstanding receivables from this transactionamount to P8.4 million, P7.0 million and P4.1 million as of May 31, 2018, 2017 and 2016,respectively, are presented as part of Rental receivable under the Trade and OtherReceivables account in the consolidated statements of financial position. No impairment lossis recognized by the Group on this receivable from FERN College.
Lease of Transportation Vehicle to FERN College
In 2012, FRC entered into a contract with FERN College for the lease of a bus to the latter fora fixed monthly rental of P0.1 million covering a term of five years.
The rental income earned from this transaction amounted to P1.4 million andP1.5 million for the years ended May 31, 2018 and 2017 and is presented as part of Rentalunder Revenues in the consolidated statements of profit or loss. No similar income was earnedduring the two months ended May 31, 2016. The Group recognized unearned rental incomein accordance with PAS 17 from FERN College amounting to P0.1 million and P0.9 million asof May 31, 2017 and 2016 (nil in 2018), respectively, and are presented as part of the DeferredRevenues account in the consolidated statements of financial position.
Rental Deposits
Outstanding rental deposits arose from the lease of building by EACCI to EAEF, whichamounted to P4.0 million as of May 31, 2016. These deposits are presented as part of OtherNon-Current Liabilities account in the consolidated statements of financial position.
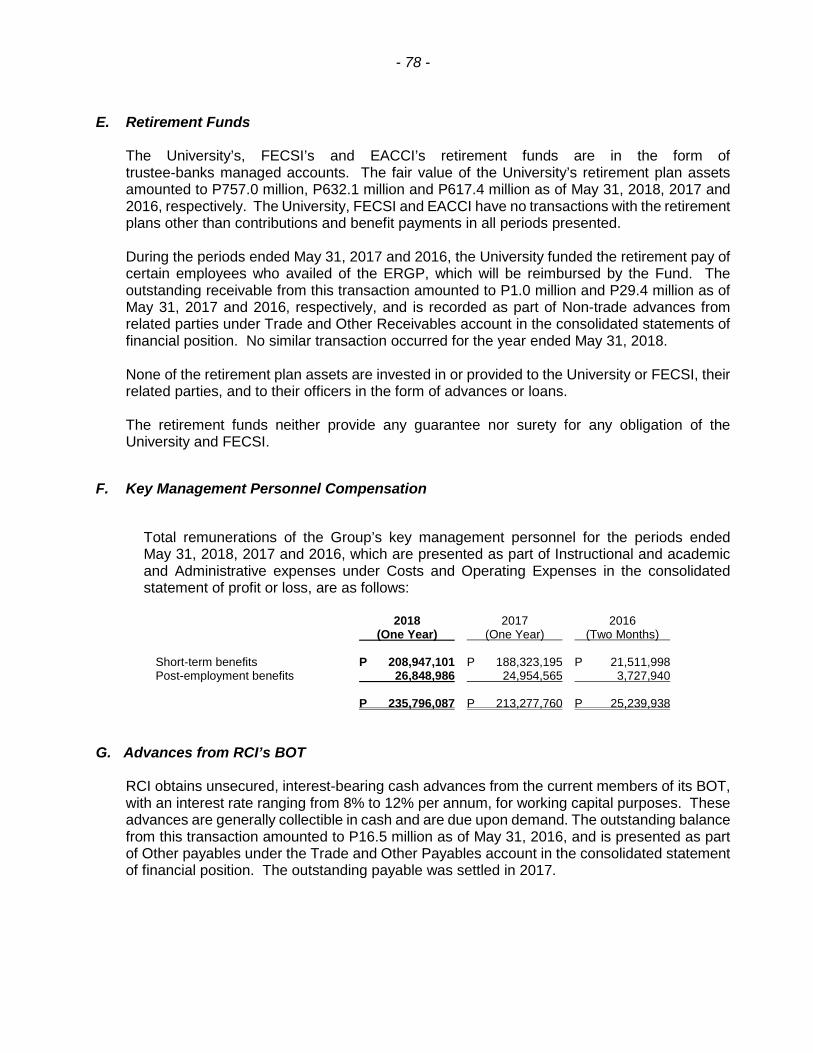
- 78 -
E. Retirement Funds
The University’s, FECSI’s and EACCI’s retirement funds are in the form oftrustee-banks managed accounts. The fair value of the University’s retirement plan assetsamounted to P757.0 million, P632.1 million and P617.4 million as of May 31, 2018, 2017 and2016, respectively. The University, FECSI and EACCI have no transactions with the retirementplans other than contributions and benefit payments in all periods presented.
During the periods ended May 31, 2017 and 2016, the University funded the retirement pay ofcertain employees who availed of the ERGP, which will be reimbursed by the Fund. Theoutstanding receivable from this transaction amounted to P1.0 million and P29.4 million as ofMay 31, 2017 and 2016, respectively, and is recorded as part of Non-trade advances fromrelated parties under Trade and Other Receivables account in the consolidated statements offinancial position. No similar transaction occurred for the year ended May 31, 2018.
None of the retirement plan assets are invested in or provided to the University or FECSI, theirrelated parties, and to their officers in the form of advances or loans.
The retirement funds neither provide any guarantee nor surety for any obligation of theUniversity and FECSI.
F. Key Management Personnel Compensation
Total remunerations of the Group’s key management personnel for the periods endedMay 31, 2018, 2017 and 2016, which are presented as part of Instructional and academicand Administrative expenses under Costs and Operating Expenses in the consolidatedstatement of profit or loss, are as follows:
2018 2017 2016(One Year) (One Year) (Two Months)
Short-term benefits P 208,947,101 P 188,323,195 P 21,511,998Post-employment benefits 26,848,986 24,954,565 3,727,940
P 235,796,087 P 213,277,760 P 25,239,938
G. Advances from RCI’s BOT
RCI obtains unsecured, interest-bearing cash advances from the current members of its BOT,with an interest rate ranging from 8% to 12% per annum, for working capital purposes. Theseadvances are generally collectible in cash and are due upon demand. The outstanding balancefrom this transaction amounted to P16.5 million as of May 31, 2016, and is presented as partof Other payables under the Trade and Other Payables account in the consolidated statementof financial position. The outstanding payable was settled in 2017.
- 79 -
H. Financial Guaranty for Subsidiaries’ Loans
In March 2017, the BOT approved that for and in consideration of the loan or credit facilitiesobtained by any subsidiary of the University, in which the University owns at least 75% of theoutstanding voting capital stock of such subsidiary, from a local commercial bank, theUniversity gives its full consent and authority to act as surety for the subsidiary’s obligationsarising from any loan or availments from any credit facilities granted by the said local bank infavor of the subsidiary, as well as any renewals, increases, extensions of existing obligationsobtained by or which may hereafter be obtained by the subsidiary from the local bank, whetherdirect or indirect, principal or secondary. In April 2018, RCI availed an unsecured term loan asa drawdown from the University’s credit facility with the local bank.
I. Reimbursement of Expenses
During the periods ended May 31, 2017 and 2016 (nil in 2018), the University billed EAEF forrelated services such as security and janitorial services, light and water and other utilities atcost. Accordingly, the outstanding receivable amounting to P4.9 million, P9.2 million and P7.9million as of May 31, 2018, 2017 and 2016, respectively, is presented as part of Non-tradeadvances to related parties under the Trade and Other Receivables account in the consolidatedstatements of financial position.
J. Others
Others include amounts due to non-controlling interest for to the unclaimed payments arisingfrom the fractional shares, treated as treasury stocks in 2007 and 2015 by FRC. Outstandingpayable to non-controlling interest amounted to P1.5 million as of May 31, 2018, 2017 and 2016,and is presented as part of Other payables to related parties under the Trade and OtherPayables account in the consolidated statements of financial position.
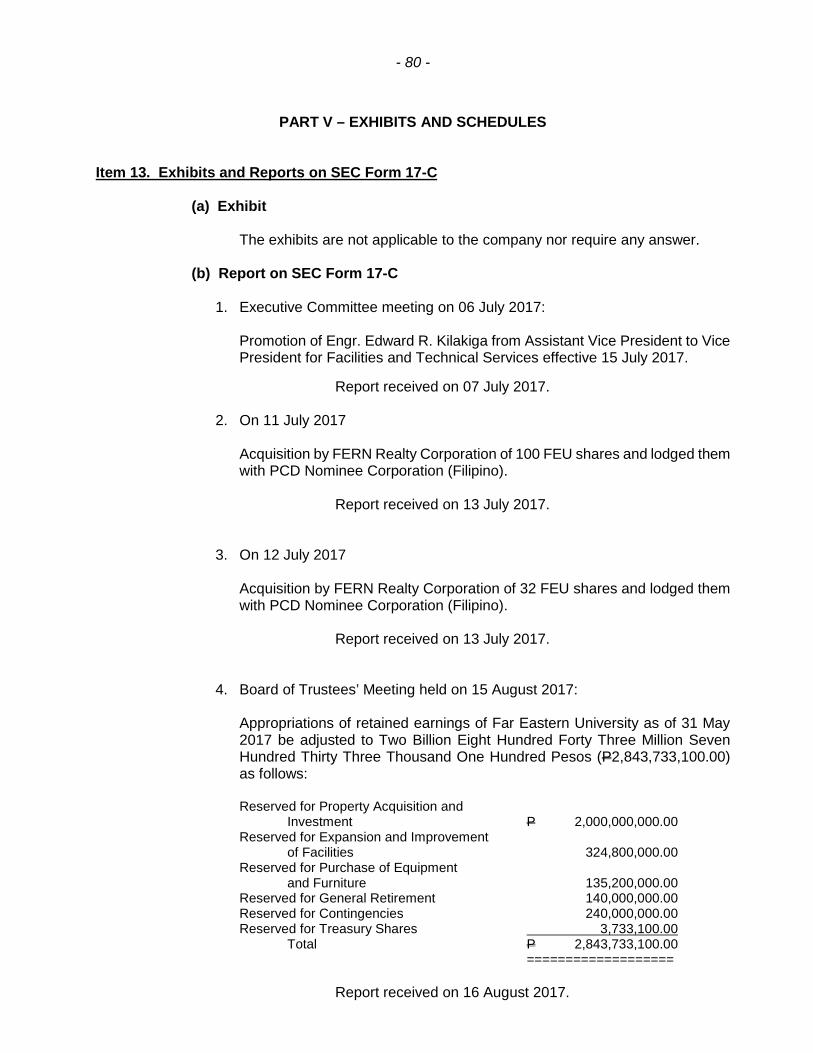
- 80 -
PART V – EXHIBITS AND SCHEDULES
Item 13. Exhibits and Reports on SEC Form 17-C
(a) Exhibit
The exhibits are not applicable to the company nor require any answer.
(b) Report on SEC Form 17-C
1. Executive Committee meeting on 06 July 2017:
Promotion of Engr. Edward R. Kilakiga from Assistant Vice President to VicePresident for Facilities and Technical Services effective 15 July 2017.
Report received on 07 July 2017.
2. On 11 July 2017
Acquisition by FERN Realty Corporation of 100 FEU shares and lodged themwith PCD Nominee Corporation (Filipino).
Report received on 13 July 2017.
3. On 12 July 2017
Acquisition by FERN Realty Corporation of 32 FEU shares and lodged themwith PCD Nominee Corporation (Filipino).
Report received on 13 July 2017.
4. Board of Trustees’ Meeting held on 15 August 2017:
Appropriations of retained earnings of Far Eastern University as of 31 May2017 be adjusted to Two Billion Eight Hundred Forty Three Million SevenHundred Thirty Three Thousand One Hundred Pesos (P2,843,733,100.00)as follows:
Reserved for Property Acquisition andInvestment P 2,000,000,000.00
Reserved for Expansion and Improvementof Facilities 324,800,000.00
Reserved for Purchase of Equipmentand Furniture 135,200,000.00
Reserved for General Retirement 140,000,000.00Reserved for Contingencies 240,000,000.00Reserved for Treasury Shares 3,733,100.00
Total P 2,843,733,100.00===================
Report received on 16 August 2017.

- 81 -
5. On 13 September 2017
Acquisition by FERN Realty Corporation of 5,000 FEU shares and lodgedthem with PCD Nominee Corporation (Filipino).
Report received on 14 September 2017.
6. Board of Trustees’ meeting held on 19 September 2017:
Declaration of ₱8.00/share cash dividend on record as of 04 October 2017,payable on 18 October 2017.
Report received on 20 September 2017.
7. Annual Stockholders’ meeting held on 21 October 2017:
a. Minutes of the Annual Meeting held on 27 August 2016;
b.. Academic Report of the President for the academic year 2016-2017;
c. Annual Report covering the operations for the fiscal year 2016-2017;
d. Approval, ratification and confirmation of the acts and resolutions of theBoard of Trustees, Board Management Committees, and Managementand other officers of Far Eastern University taken or adopted since theAnnual Meeting of Stockholders last 27 August 2016 until 21 October2017;
e. Election of members of the Board of Trustees including independenttrustees for the fiscal year 2017-2018;
f. Re-Appointment of Punongbayan and Araullo as External Auditor for thefiscal year 2016-2017; and
Report received on 24 October 2017.
8. Organizational Meeting of the Board of Trustees held on 21 October 2017:
a. Election of Corporate and University Officials for the term year 2017-
2018:
b. Composition of the Executive Committee;
c. Composition of the Audit Committee;
d. Composition of the Corporate Governance Committee;
e. Composition of the Nomination Committee;
f. Composition of the Risk Management Committee; and
g. Composition of the Talent Management Committee
Report received on 24 October 2017.

- 82 -
9. On 30 January 2018:
Acquisition by FERN Realty Corporation of 61 FEU shares and lodged themwith PCD Nominee Corporation (Filipino).
Report received on 31 January 2018.
10. On 15 February 2018:
Acquisition by FERN Realty Corporation of 579 FEU shares and lodged themwith PCD Nominee Corporation (Filipino).
Report received on 19 February 2018.
11. Board of Trustees’ Meeting held on 20 February 2018:
Declaration of ₱8.00 per share cash dividend on record as of 06 March 2018payable on 20 March 2018.
Report received on 21 February 2018.
12. Board of Trustees’ Meeting held on 17 April 2018:
Resignation of Mr. Francisco Enriquez Lecaroz, Jr., Chief Information Officer,effective 01 May 2018.
Report received on 18 April 2018.
13. Board of Trustees’ Meeting held on 15 May 2018:
BDO UNIBANK, INC. (the Bank) offered the Corporation the renewal of itsfinancial credit accommodation and increase its line to up to FOUR BILLIONPESOS, Philippine currency (P4,000,000,000.00) which will be utilized forthe improvement of facilities of the FEU System of Schools;
Authorization of the Board of Trustees of the Corporation on the acceptanceof the Bank’s offer for the purpose of financing the Corporation’s CapitalExpenditure requirements, strategic investments and general corporatefunding requirements, under such terms and conditions which the Bank mayprescribe;
- 83 -
Authorization for any two of the following Trustees/Officers of the Corporationto sign all papers and documents needed and necessary to carry into effectthe aforesaid purpose or undertaking for the benefit and to the credit of theCorporation :
Aurelio R. Montinola III ChairmanMichael M. Alba PresidentAngelina P. Jose TrusteeJuan Miguel R. Montinola Chief Finance OfficerRosanna E. Salcedo TreasurerGianna R. Montinola Vice President
for Corporate Affairs
Report received on 16 May 2018.
(c) Quarterly Reports:
Ended August 31, 2017Received October 13, 2017
Ended November 30, 2017Received January 12, 2018
Ended February 28, 2018Received April 13, 2018
- 84 -
Business and General Information
I. Industry Profile
The following are the dominant characteristics of the education industry:
- The business of higher education in the country is in the hands of the private sector.
- There is an uneven distribution of colleges and universities across the regions. Thisconnotes a problem of unequal access to higher education. This is evidenced bythe high concentration of state and private colleges and universities in the NationalCapital Region and Southern Tagalog Regions.
- Statistics show a high mismatch between education and occupation.
- The number of graduates in fields like commerce and business administrationcontinues to increase even if unemployment among these graduates is on the rise.
- Far Eastern University’s market is made up of the working class and the middleincome group. FEU is situated in Manila, particularly in the area popularly known asthe University Belt. It has a new campus in the heart of Makati. To be competitive,the university must continuously improve its products and at the same time maintainreasonable tuition fees.
II. Group of related services which contribute 10% or more to revenues
1. Institute of Arts and Sciences 31%2. Institute of Accounts, Business 31%
and Finance3. Institute of Tourism and
Hotel Management 17%4. Institute of Architecture and Fine Arts 13%
III. Teaching services are rendered to students who come and enroll.
IV. No patents, trademarks, copyrights, licenses, franchises, concessions, and royaltyagreements are held by the company.
V. All courses offered are with CHED recognition.
VI. Standard set by CHED encourages the University to continuously improve its quality ofteaching and its facilities.
Operational and Financial Information
Dividend payments are normally restricted by reserves and appropriations made by thecompany, and by the amount needed to ensure smooth and unhampered operations duringthe year.
Control and Compensation InformationNo warrants or options are given by the corporation.

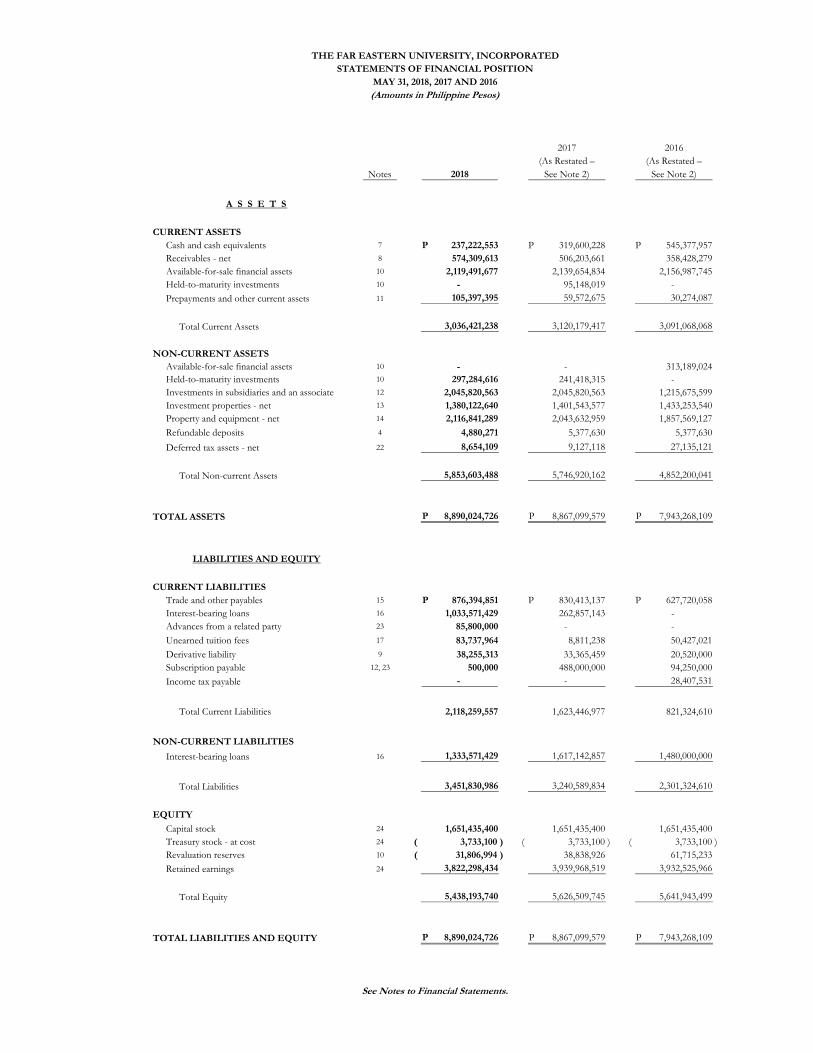
2017 2016
(As Restated – (As Restated –
Notes 2018 See Note 2) See Note 2)
A S S E T S
CURRENT ASSETS
Cash and cash equivalents 7 237,222,553 P 319,600,228 P 545,377,957 P
Receivables - net 8 574,309,613 506,203,661 358,428,279
Available-for-sale financial assets 10 2,119,491,677 2,139,654,834 2,156,987,745
Held-to-maturity investments 10 - 95,148,019 -
Prepayments and other current assets 11 105,397,395 59,572,675 30,274,087
Total Current Assets 3,036,421,238 3,120,179,417 3,091,068,068
NON-CURRENT ASSETS
Available-for-sale financial assets 10 - - 313,189,024
Held-to-maturity investments 10 297,284,616 241,418,315 -
Investments in subsidiaries and an associate 12 2,045,820,563 2,045,820,563 1,215,675,599
Investment properties - net 13 1,380,122,640 1,401,543,577 1,433,253,540
Property and equipment - net 14 2,116,841,289 2,043,632,959 1,857,569,127
Refundable deposits 4 4,880,271 5,377,630 5,377,630
Deferred tax assets - net 22 8,654,109 9,127,118 27,135,121
Total Non-current Assets 5,853,603,488 5,746,920,162 4,852,200,041
TOTAL ASSETS 8,890,024,726 P 8,867,099,579 P 7,943,268,109 P
LIABILITIES AND EQUITY
CURRENT LIABILITIES
Trade and other payables 15 876,394,851 P 830,413,137 P 627,720,058 P
Interest-bearing loans 16 1,033,571,429 262,857,143 -
Advances from a related party 23 85,800,000 - -
Unearned tuition fees 17 83,737,964 8,811,238 50,427,021
Derivative liability 9 38,255,313 33,365,459 20,520,000
Subscription payable 12, 23 500,000 488,000,000 94,250,000
Income tax payable - - 28,407,531
Total Current Liabilities 2,118,259,557 1,623,446,977 821,324,610
NON-CURRENT LIABILITIES
Interest-bearing loans 16 1,333,571,429 1,617,142,857 1,480,000,000
Total Liabilities 3,451,830,986 3,240,589,834 2,301,324,610
EQUITY
Capital stock 24 1,651,435,400 1,651,435,400 1,651,435,400
Treasury stock - at cost 24 3,733,100 )( 3,733,100 )( 3,733,100 )(
Revaluation reserves 10 31,806,994 )( 38,838,926 61,715,233
Retained earnings 24 3,822,298,434 3,939,968,519 3,932,525,966
Total Equity 5,438,193,740 5,626,509,745 5,641,943,499
TOTAL LIABILITIES AND EQUITY 8,890,024,726 P 8,867,099,579 P 7,943,268,109 P
THE FAR EASTERN UNIVERSITY, INCORPORATED
See Notes to Financial Statements.
(Amounts in Philippine Pesos)
MAY 31, 2018, 2017 AND 2016
STATEMENTS OF FINANCIAL POSITION
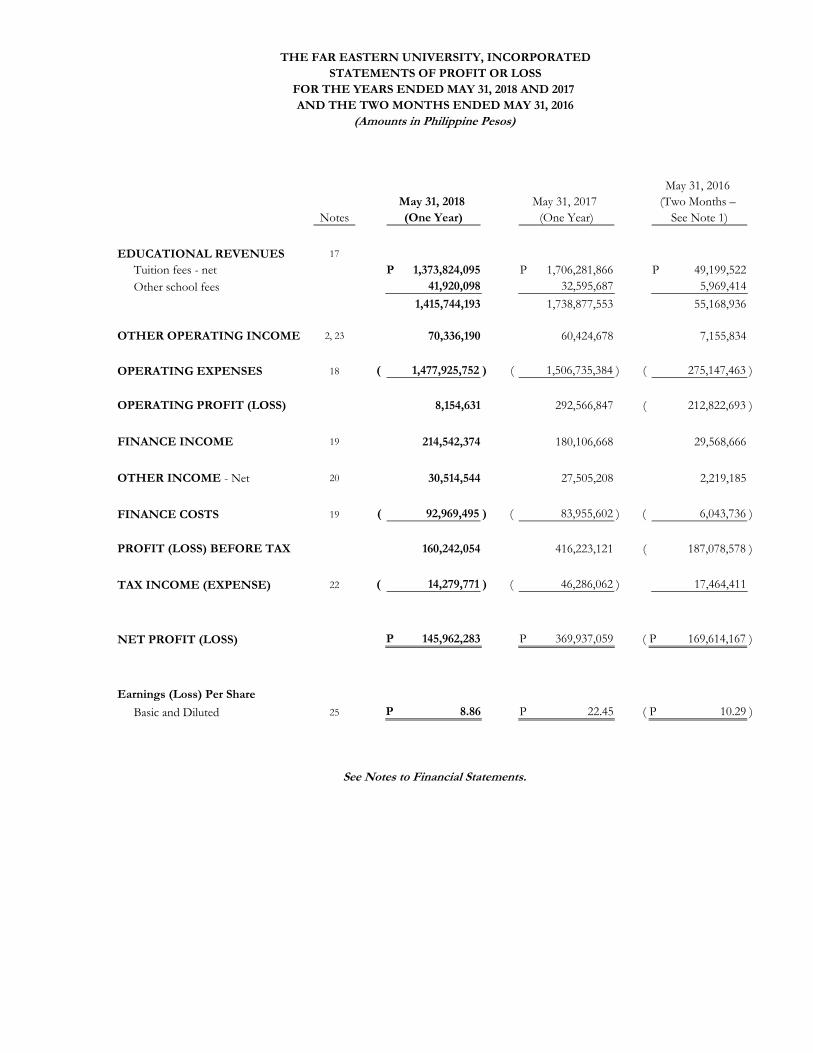
May 31, 2016
May 31, 2018 May 31, 2017 (Two Months –
Notes (One Year) (One Year) See Note 1)
EDUCATIONAL REVENUES 17
Tuition fees - net 1,373,824,095 P 1,706,281,866 P 49,199,522 P
Other school fees 41,920,098 32,595,687 5,969,414
1,415,744,193 1,738,877,553 55,168,936
OTHER OPERATING INCOME 2, 23 70,336,190 60,424,678 7,155,834
OPERATING EXPENSES 18 1,477,925,752 )( 1,506,735,384 )( 275,147,463 )(
OPERATING PROFIT (LOSS) 8,154,631 292,566,847 212,822,693 )(
FINANCE INCOME 19 214,542,374 180,106,668 29,568,666
OTHER INCOME - Net 20 30,514,544 27,505,208 2,219,185
FINANCE COSTS 19 92,969,495 )( 83,955,602 )( 6,043,736 )(
PROFIT (LOSS) BEFORE TAX 160,242,054 416,223,121 187,078,578 )(
TAX INCOME (EXPENSE) 22 14,279,771 )( 46,286,062 )( 17,464,411
NET PROFIT (LOSS) 145,962,283 P 369,937,059 P 169,614,167 )( P
Earnings (Loss) Per Share
Basic and Diluted 25 8.86 P 22.45 P 10.29 )( P
See Notes to Financial Statements.
(Amounts in Philippine Pesos)
FOR THE YEARS ENDED MAY 31, 2018 AND 2017
STATEMENTS OF PROFIT OR LOSS
THE FAR EASTERN UNIVERSITY, INCORPORATED
AND THE TWO MONTHS ENDED MAY 31, 2016
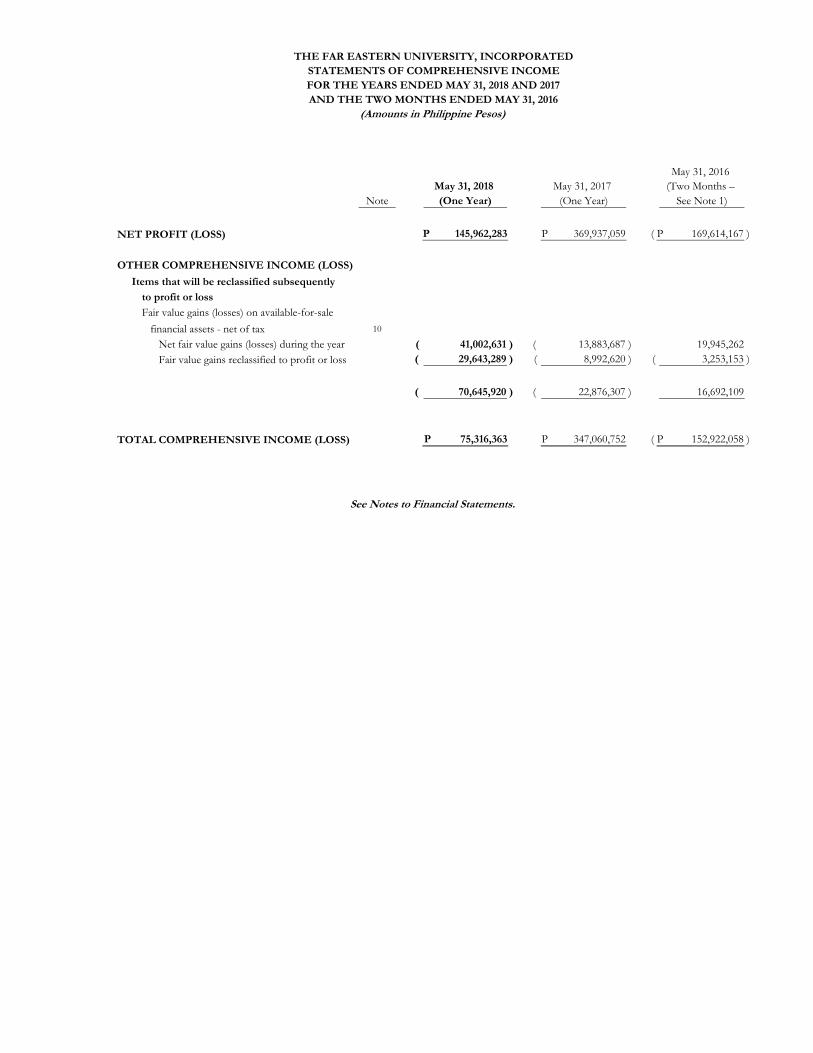
May 31, 2016
May 31, 2018 May 31, 2017 (Two Months –
Note (One Year) (One Year) See Note 1)
NET PROFIT (LOSS) 145,962,283 P 369,937,059 P 169,614,167 )( P
OTHER COMPREHENSIVE INCOME (LOSS)
Items that will be reclassified subsequently
to profit or loss
Fair value gains (losses) on available-for-sale
financial assets - net of tax 10
Net fair value gains (losses) during the year 41,002,631 )( 13,883,687 )( 19,945,262
Fair value gains reclassified to profit or loss 29,643,289 )( 8,992,620 )( 3,253,153 )(
70,645,920 )( 22,876,307 )( 16,692,109
TOTAL COMPREHENSIVE INCOME (LOSS) 75,316,363 P 347,060,752 P 152,922,058 )( P
(Amounts in Philippine Pesos)
FOR THE YEARS ENDED MAY 31, 2018 AND 2017
STATEMENTS OF COMPREHENSIVE INCOME
THE FAR EASTERN UNIVERSITY, INCORPORATED
AND THE TWO MONTHS ENDED MAY 31, 2016
See Notes to Financial Statements.
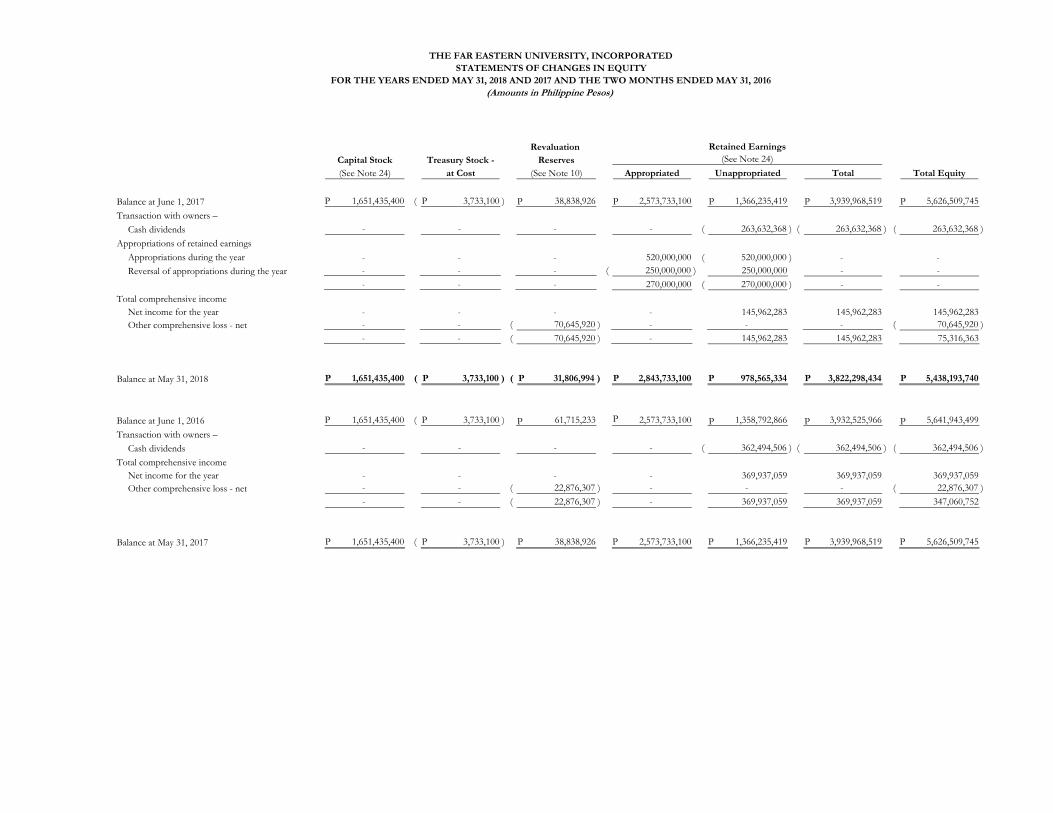
Revaluation
Capital Stock Treasury Stock - Reserves
(See Note 24) at Cost (See Note 10) Appropriated Unappropriated Total Total Equity
Balance at June 1, 2017 1,651,435,400 P 3,733,100 )( P 38,838,926 2,573,733,100 1,366,235,419 3,939,968,519 5,626,509,745
Transaction with owners –
Cash dividends - - - - 263,632,368 )( 263,632,368 )( 263,632,368 )(
Appropriations of retained earnings
Appropriations during the year - - - 520,000,000 520,000,000 )( - -
Reversal of appropriations during the year - - - 250,000,000 )( 250,000,000 - -
- - - 270,000,000 270,000,000 )( - -
Total comprehensive income
Net income for the year - - - - 145,962,283 145,962,283 145,962,283
Other comprehensive loss - net - - 70,645,920 )( - - - 70,645,920 )(
- - 70,645,920 )( - 145,962,283 145,962,283 75,316,363
Balance at May 31, 2018 1,651,435,400 P 3,733,100 )( P 31,806,994 )( P 2,843,733,100 P 978,565,334 P 3,822,298,434 P 5,438,193,740 P
Balance at June 1, 2016 1,651,435,400 P 3,733,100 )( P 61,715,233 2,573,733,100 1,358,792,866 3,932,525,966 5,641,943,499
Transaction with owners –
Cash dividends - - - - 362,494,506 )( 362,494,506 )( 362,494,506 )(
Total comprehensive income
Net income for the year - - - - 369,937,059 369,937,059 369,937,059
Other comprehensive loss - net - - 22,876,307 )( - - - 22,876,307 )(
- - 22,876,307 )( - 369,937,059 369,937,059 347,060,752
Balance at May 31, 2017 1,651,435,400 P 3,733,100 )( P 38,838,926 P 2,573,733,100 P 1,366,235,419 P 3,939,968,519 P 5,626,509,745 P
Retained Earnings
(See Note 24)
THE FAR EASTERN UNIVERSITY, INCORPORATED
STATEMENTS OF CHANGES IN EQUITY
FOR THE YEARS ENDED MAY 31, 2018 AND 2017 AND THE TWO MONTHS ENDED MAY 31, 2016
(Amounts in Philippine Pesos)
P P P P
P P P P P
P
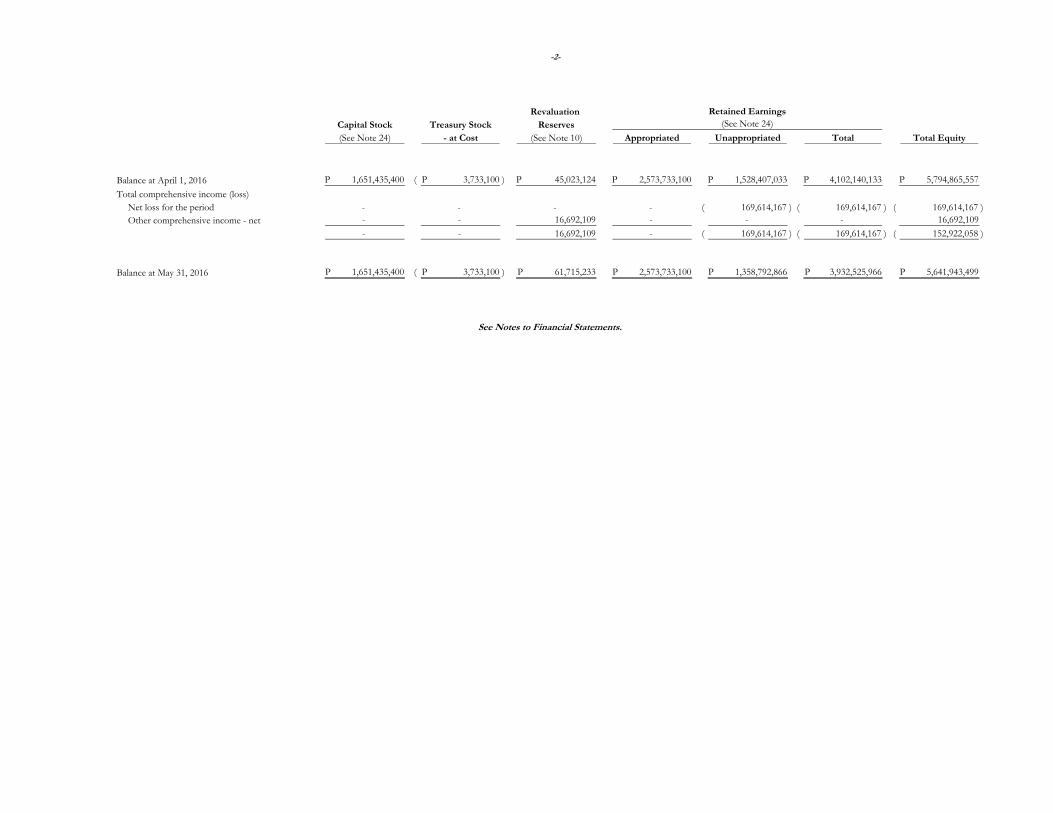
-2-
Revaluation
Capital Stock Treasury Stock Reserves
(See Note 24) - at Cost (See Note 10) Appropriated Unappropriated Total Total Equity
Balance at April 1, 2016 1,651,435,400 P 3,733,100 )( P 45,023,124 P 2,573,733,100 P 1,528,407,033 P 4,102,140,133 P 5,794,865,557 P
Total comprehensive income (loss)
Net loss for the period - - - - 169,614,167 )( 169,614,167 )( 169,614,167 )(
Other comprehensive income - net - - 16,692,109 - - - 16,692,109
- - 16,692,109 - 169,614,167 )( 169,614,167 )( 152,922,058 )(
Balance at May 31, 2016 1,651,435,400 P 3,733,100 )( P 61,715,233 P 2,573,733,100 P 1,358,792,866 P 3,932,525,966 P 5,641,943,499 P
See Notes to Financial Statements.
(See Note 24)
Retained Earnings
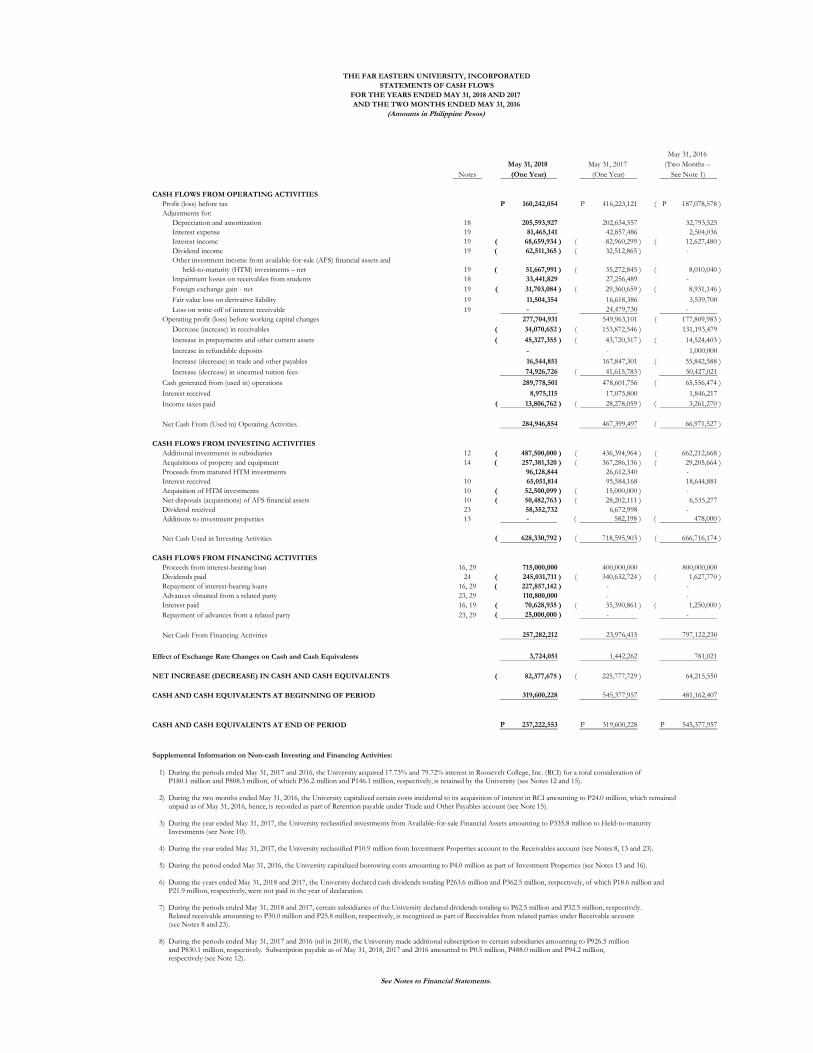
May 31, 2016
May 31, 2018 May 31, 2017 (Two Months –
Notes (One Year) (One Year) See Note 1)
CASH FLOWS FROM OPERATING ACTIVITIES
Profit (loss) before tax 160,242,054 P 416,223,121 P 187,078,578 )( P
Adjustments for:
Depreciation and amortization 18 205,593,927 202,634,557 32,793,525
Interest expense 19 81,465,141 42,857,486 2,504,036
Interest income 19 68,659,934 )( 82,960,299 )( 12,627,480 )(
Dividend income 19 62,511,365 )( 32,512,865 )( -
Other investment income from available-for-sale (AFS) financial assets and
held-to-maturity (HTM) investments – net 19 51,667,991 )( 35,272,845 )( 8,010,040 )(
Impairment losses on receivables from students 18 33,441,829 27,256,489 -
Foreign exchange gain - net 19 31,703,084 )( 29,360,659 )( 8,931,146 )(
Fair value loss on derivative liability 19 11,504,354 16,618,386 3,539,700
Loss on write-off of interest receivable 19 - 24,479,730 -
Operating profit (loss) before working capital changes 277,704,931 549,963,101 177,809,983 )(
Decrease (increase) in receivables 34,070,652 )( 153,872,546 )( 131,193,479
Increase in prepayments and other current assets 45,327,355 )( 43,720,317 )( 14,524,403 )(
Increase in refundable deposits - - 1,000,000
Increase (decrease) in trade and other payables 16,544,851 167,847,301 55,842,588 )(
Increase (decrease) in unearned tuition fees 74,926,726 41,615,783 )( 50,427,021
Cash generated from (used in) operations 289,778,501 478,601,756 65,556,474 )(
Interest received 8,975,115 17,075,800 1,846,217
Income taxes paid 13,806,762 )( 28,278,059 )( 3,261,270 )(
Net Cash From (Used in) Operating Activities 284,946,854 467,399,497 66,971,527 )(
CASH FLOWS FROM INVESTING ACTIVITIES
Additional investments in subsidiaries 12 487,500,000 )( 436,394,964 )( 662,212,668 )(
Acquisitions of property and equipment 14 257,381,320 )( 367,286,136 )( 29,205,664 )(
Proceeds from matured HTM investments 96,128,844 26,612,340 -
Interest received 10 65,051,814 95,584,168 18,644,881
Acquisition of HTM investments 10 52,500,099 )( 15,000,000 )( -
Net disposals (acquisitions) of AFS financial assets 10 50,482,763 )( 28,202,111 )( 6,535,277
Dividend received 23 58,352,732 6,672,998 -
Additions to investment properties 13 - 582,198 )( 478,000 )(
Net Cash Used in Investing Activities 628,330,792 )( 718,595,903 )( 666,716,174 )(
CASH FLOWS FROM FINANCING ACTIVITIES
Proceeds from interest-bearing loan 16, 29 715,000,000 400,000,000 800,000,000
Dividends paid 24 245,031,711 )( 340,632,724 )( 1,627,770 )(
Repayment of interest-bearing loans 16, 29 227,857,142 )( - -
Advances obtained from a related party 23, 29 110,800,000 - -
Interest paid 16, 19 70,628,935 )( 35,390,861 )( 1,250,000 )(
Repayment of advances from a related party 23, 29 25,000,000 )( - -
Net Cash From Financing Activities 257,282,212 23,976,415 797,122,230
Effect of Exchange Rate Changes on Cash and Cash Equivalents 3,724,051 1,442,262 781,021
NET INCREASE (DECREASE) IN CASH AND CASH EQUIVALENTS 82,377,675 )( 225,777,729 )( 64,215,550
CASH AND CASH EQUIVALENTS AT BEGINNING OF PERIOD 319,600,228 545,377,957 481,162,407
CASH AND CASH EQUIVALENTS AT END OF PERIOD 237,222,553 P 319,600,228 P 545,377,957 P
Supplemental Information on Non-cash Investing and Financing Activities:
THE FAR EASTERN UNIVERSITY, INCORPORATED
AND THE TWO MONTHS ENDED MAY 31, 2016
See Notes to Financial Statements.
(Amounts in Philippine Pesos)
FOR THE YEARS ENDED MAY 31, 2018 AND 2017
STATEMENTS OF CASH FLOWS
1) During the periods ended May 31, 2017 and 2016, the University acquired 17.73% and 79.72% interest in Roosevelt College, Inc. (RCI) for a total consideration of P180.1 million and P808.3 million, of which P36.2 million and P146.1 million, respectively, is retained by the University (see Notes 12 and 15).
2) During the two months ended May 31, 2016, the University capitalized certain costs incidental to its acquisition of interest in RCI amounting to P24.0 million, which remained unpaid as of May 31, 2016, hence, is recorded as part of Retention payable under Trade and Other Payables account (see Note 15).
3) During the year ended May 31, 2017, the University reclassified investments from Available-for-sale Financial Assets amounting to P335.8 million to Held-to-maturityInvestments (see Note 10).
4) During the year ended May 31, 2017, the University reclassified P10.9 million from Investment Properties account to the Receivables account (see Notes 8, 13 and 23).
5) During the period ended May 31, 2016, the University capitalized borrowing costs amounting to P4.0 million as part of Investment Properties (see Notes 13 and 16).
6) During the years ended May 31, 2018 and 2017, the University declared cash dividends totaling P263.6 million and P362.5 million, respectively, of which P18.6 million and P21.9 million, respectively, were not paid in the year of declaration.
7) During the periods ended May 31, 2018 and 2017, certain subsidiaries of the University declared dividends totaling to P62.5 million and P32.5 million, respectively. Related receivable amounting to P30.0 million and P25.8 million, respectively, is recognized as part of Receivables from related parties under Receivable account (see Notes 8 and 23).
8) During the periods ended May 31, 2017 and 2016 (nil in 2018), the University made additional subscription to certain subsidiaries amounting to P926.5 million and P830.1 million, respectively. Subscription payable as of May 31, 2018, 2017 and 2016 amounted to P0.5 million, P488.0 million and P94.2 million,respectively (see Note 12).
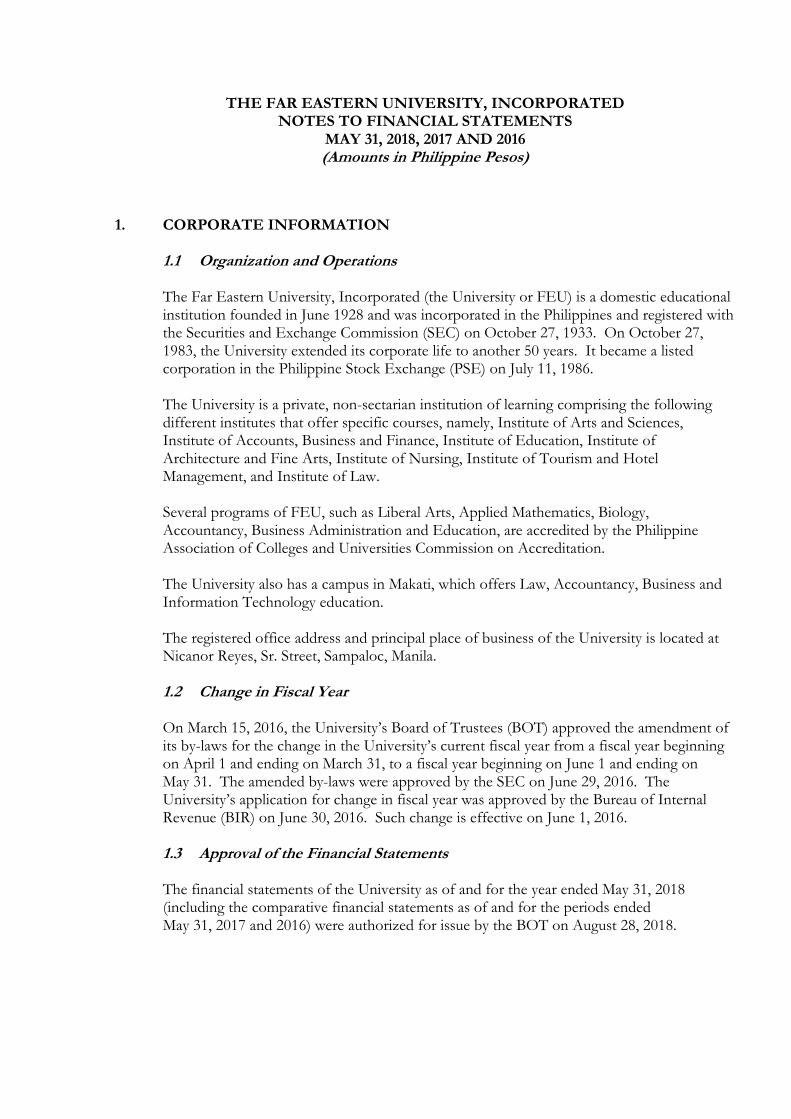
THE FAR EASTERN UNIVERSITY, INCORPORATED NOTES TO FINANCIAL STATEMENTS
MAY 31, 2018, 2017 AND 2016 (Amounts in Philippine Pesos)
1. CORPORATE INFORMATION 1.1 Organization and Operations The Far Eastern University, Incorporated (the University or FEU) is a domestic educational institution founded in June 1928 and was incorporated in the Philippines and registered with the Securities and Exchange Commission (SEC) on October 27, 1933. On October 27, 1983, the University extended its corporate life to another 50 years. It became a listed corporation in the Philippine Stock Exchange (PSE) on July 11, 1986. The University is a private, non-sectarian institution of learning comprising the following different institutes that offer specific courses, namely, Institute of Arts and Sciences, Institute of Accounts, Business and Finance, Institute of Education, Institute of Architecture and Fine Arts, Institute of Nursing, Institute of Tourism and Hotel Management, and Institute of Law. Several programs of FEU, such as Liberal Arts, Applied Mathematics, Biology, Accountancy, Business Administration and Education, are accredited by the Philippine Association of Colleges and Universities Commission on Accreditation. The University also has a campus in Makati, which offers Law, Accountancy, Business and Information Technology education. The registered office address and principal place of business of the University is located at Nicanor Reyes, Sr. Street, Sampaloc, Manila. 1.2 Change in Fiscal Year On March 15, 2016, the University’s Board of Trustees (BOT) approved the amendment of its by-laws for the change in the University’s current fiscal year from a fiscal year beginning on April 1 and ending on March 31, to a fiscal year beginning on June 1 and ending on May 31. The amended by-laws were approved by the SEC on June 29, 2016. The University’s application for change in fiscal year was approved by the Bureau of Internal Revenue (BIR) on June 30, 2016. Such change is effective on June 1, 2016. 1.3 Approval of the Financial Statements The financial statements of the University as of and for the year ended May 31, 2018 (including the comparative financial statements as of and for the periods ended May 31, 2017 and 2016) were authorized for issue by the BOT on August 28, 2018.
- 2 -
2. SUMMARY OF SIGNIFICANT ACCOUNTING POLICIES The significant accounting policies that have been used in the preparation of these financial statements are summarized below. These policies have been consistently applied to all the years presented, unless otherwise stated. 2.1 Basis of Preparation of Financial Statements (a) Statement of Compliance with Philippine Financial Reporting Standards
The financial statements of the University have been prepared in accordance with Philippine Financial Reporting Standards (PFRS). PFRS are adopted by the Financial Reporting Standards Council (FRSC) from the pronouncements issued by the International Accounting Standards Board (IASB), and approved by the Philippine Board of Accountancy. The financial statements have been prepared using the measurement bases specified by PFRS for each type of asset, liability, income and expense. The measurement bases are more fully described in the accounting policies that follow.
(b) Presentation of Financial Statements
The financial statements are presented in accordance with Philippine Accounting Standard (PAS) 1, Presentation of Financial Statements. The University presents the statement of comprehensive income separate from the statement of profit or loss. The University presents two comparative periods for the statement of financial position regardless whether the University has or does not have retrospective restatement of items in its financial statements, or reclassifies items in the financial statements.
(c) Functional and Presentation Currency
These financial statements are presented in Philippine pesos, the University’s functional and presentation currency, and all values represent absolute amounts except when otherwise indicated.
Items included in the financial statements of the University are measured using its functional currency. Functional currency is the currency of the primary economic environment in which the University operates.
(d) Retrospective Reclassification of Accounts
The University made retrospective reclassifications in its statements of financial position as of May 31, 2017 and 2016 relating to certain accounts to conform with the current presentation. These reclassifications did not result in any adjustment to the balances of total comprehensive income or total equity as previously reported.
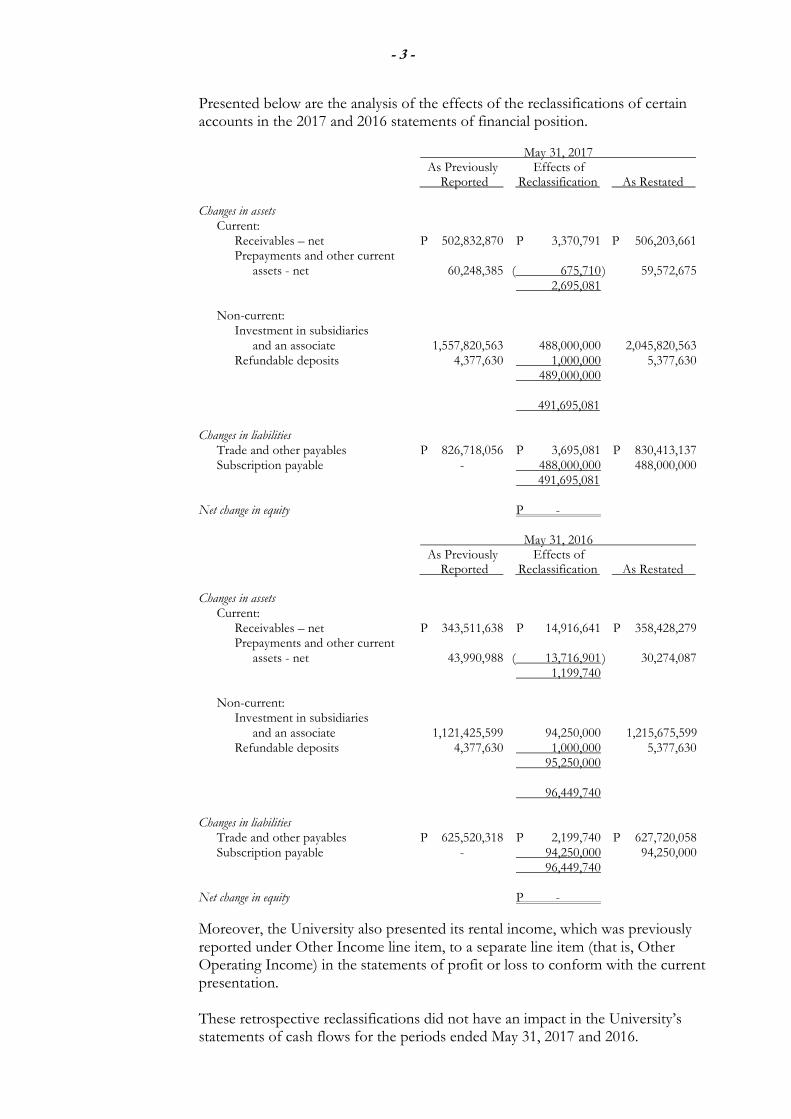
- 3 -
Presented below are the analysis of the effects of the reclassifications of certain accounts in the 2017 and 2016 statements of financial position.
May 31, 2017 As Previously Effects of Reported Reclassification As Restated
Changes in assets Current:
Receivables – net P 502,832,870 P 3,370,791 P 506,203,661 Prepayments and other current
assets - net 60,248,385 ( 675,710 ) 59,572,675 2,695,081
Non-current: Investment in subsidiaries
and an associate 1,557,820,563 488,000,000 2,045,820,563 Refundable deposits 4,377,630 1,000,000 5,377,630 489,000,000
491,695,081
Changes in liabilities Trade and other payables P 826,718,056 P 3,695,081 P 830,413,137 Subscription payable - 488,000,000 488,000,000
491,695,081
Net change in equity P - May 31, 2016
As Previously Effects of Reported Reclassification As Restated
Changes in assets Current:
Receivables – net P 343,511,638 P 14,916,641 P 358,428,279 Prepayments and other current
assets - net 43,990,988 ( 13,716,901 ) 30,274,087 1,199,740
Non-current: Investment in subsidiaries
and an associate 1,121,425,599 94,250,000 1,215,675,599 Refundable deposits 4,377,630 1,000,000 5,377,630 95,250,000
96,449,740
Changes in liabilities Trade and other payables P 625,520,318 P 2,199,740 P 627,720,058 Subscription payable - 94,250,000 94,250,000 96,449,740
Net change in equity P -
Moreover, the University also presented its rental income, which was previously reported under Other Income line item, to a separate line item (that is, Other Operating Income) in the statements of profit or loss to conform with the current presentation. These retrospective reclassifications did not have an impact in the University’s statements of cash flows for the periods ended May 31, 2017 and 2016.
- 4 -
2.2 Adoption of New and Amended PFRS
(a) Effective in Fiscal Year 2018 that are Relevant to the University
The University adopted the following amendments and annual improvements to PFRS, which are mandatorily effective for the annual periods beginning on or after January 1, 2017:
PAS 7 (Amendments) : Statement of Cash Flows – Disclosure Initiative PAS 12 (Amendments) : Income Taxes – Recognition of Deferred Tax Assets for Unrealized Losses
Annual Improvements to PFRS (2014-2016 Cycle) PFRS 12 : Disclosure of Interests in Other Entities – Scope Clarification on Disclosure of Summarized Financial Information for Interests Classified as Held for Sale
Discussed as follows are relevant information about these amendments and improvements:
(i) PAS 7 (Amendments), Statement of Cash Flows – Disclosure Initiative. The amendments are designed to improve the quality of information provided to users of financial statements about changes in an entity’s debt and related cash flows and non-cash changes. They require an entity to provide disclosures that enable users to evaluate changes in liabilities arising from financing activities. An entity applies its judgment when determining the exact form and content of the disclosures needed to satisfy this requirement. Moreover, they suggest a number of specific disclosures that may be necessary in order to satisfy the above requirement, including: (a) changes in liabilities arising from financing activities caused by changes in financing cash flows, foreign exchange rates or fair values, or obtaining or losing control of subsidiaries or other businesses; and, (b) a reconciliation of the opening and closing balances of liabilities arising from financing activities in the statement of financial position including those changes identified immediately above.
Management has applied these amendments in the current year and has not disclosed comparative figures as allowed by the transitional provisions. A reconciliation between the opening and closing balances of liabilities arising from financing activities, which includes both cash and non-cash changes, are presented in Note 29.
(ii) PAS 12 (Amendments), Income Taxes – Recognition of Deferred Tax Assets for Unrealized Losses. The focus of the amendments is to clarify how to account for deferred tax assets related to debt instruments measured at fair value, particularly where changes in the market interest rate decrease the fair value of a debt instrument below cost. The amendments provide guidance in the following areas where diversity in practice previously existed: (a) existence of a deductible temporary difference; (b) recovering an asset for more than its carrying amount; (c) probable future taxable profit against which deductible temporary differences are assessed for utilization; and, (d) combined versus separate assessment of deferred tax asset recognition for each deductible temporary difference. The application of these amendments has no significant impact on the University’s financial statements.
- 5 -
(iii) Annual Improvements to PFRS (2014 - 2016 Cycle) – PFRS 12, Disclosure of Interests in Other Entities – Scope Clarification on Disclosure of Summarized Financial Information for Interests Classified as Held for Sale. The amendment clarifies that the disclosure requirements of PFRS 12 applies to interest in other entities classified as held for sale with practical concession in the presentation of summarized financial information. The amendment states that an entity need not present summarized financial information for interests in subsidiaries, associates, or joint ventures that are classified as held for sale. The amendment did not result in additional or changes in the disclosures in the financial statements as the University has no interest in other entities that is classified as held for sale.
(b) Effective Subsequent to Fiscal Year 2018 but not Adopted Early
There are new PFRS, amendments, interpretations and annual improvements to existing standards effective for annual periods subsequent to fiscal year 2018, which are adopted by the FRSC. Management will adopt the following relevant pronouncements in accordance with their transitional provisions; and, unless otherwise stated, none of these are expected to have significant impact on the University’s financial statements:
(i) PAS 40 (Amendments), Investment Property – Reclassification to and from Investment
Property (effective from January 1, 2018). The amendments state that an entity shall transfer a property to, or from, investment property when, and only when, there is evidence of a change in use. A change of use occurs if property meets, or ceases to meet, the definition of investment property. A change in management’s intentions for the use of a property by itself does not constitute evidence of a change in use. The amendments also provided a non-exhaustive list of examples constituting change in use.
(ii) PFRS 9 (2014), Financial Instruments (effective from January 1, 2018). This new
standard on financial instruments will replace PAS 39, Financial Instruments: Recognition and Measurement, and PFRS 9 (2009, 2010 and 2013 versions). This standard contains, among others, the following:
• three principal classification categories for financial assets based on the business model on how an entity is managing its financial instruments;
• an expected credit loss (ECL) model in determining impairment of all financial assets that are not measured at fair value through profit or loss (FVTPL), which generally depends on whether there has been a significant increase in credit risk since initial recognition of a financial asset; and,
• a new model on hedge accounting that provides significant improvements principally by aligning hedge accounting more closely with the risk management activities undertaken by entities when hedging their financial and non-financial risk exposures.
- 6 -
In accordance with the financial asset classification principle of PFRS 9 (2014), a financial asset is classified and measured at amortized cost if the asset is held within a business model whose objective is to hold financial assets in order to collect the contractual cash flows that represent solely payments of principal and interest (SPPI) on the principal outstanding. Moreover, a financial asset is classified and subsequently measured at fair value through other comprehensive income (FVTOCI) if it meets the SPPI criterion and is held in a business model whose objective is achieved by both collecting contractual cash flows and selling the financial assets. All other financial assets are measured at FVTPL. In addition, PFRS 9 (2014) allows entities to make an irrevocable election to present subsequent changes in the fair value of an equity instrument that is not held for trading in other comprehensive income.
The accounting for embedded derivatives in host contracts that are financial assets is simplified by removing the requirement to consider whether or not they are closely related, and, in most arrangements, does not require separation from the host contract.
For liabilities, the standard retains most of the PAS 39 requirements which include amortized cost accounting for most financial liabilities, with bifurcation of embedded derivatives. The standard also requires changes in the fair value of an entity’s own debt instruments caused by changes in its own credit quality to be recognized in other comprehensive income rather than in profit or loss. Based on an assessment of the University’s financial assets and liabilities as at May 31, 2018, which has been limited to the facts and circumstances existing at that date, management has identified the following areas that are expected to be most impacted by the application of PFRS 9 (2014):
• On classification and measurement of the University’s financial assets, management holds most financial assets to collect the associated cash flows and is currently assessing the underlying types of cash flows to classify financial assets correctly. Management expects that all of the University’s financial assets currently classified as loans and receivables and held-to-maturity (HTM) investments will continue to be classified and accounted for at amortized cost.
• The University’s equity securities, including those investments in Unit Investment Trust Fund (UITF) whose underlying assets are in equity securities, currently classified as available-for-sale (AFS) financial assets will be measured at fair value with changes in fair value presented either in profit or loss or in other comprehensive income. To present changes in other comprehensive income requires making an irrevocable designation on initial recognition or at the date of transition.
• Government securities and corporate bonds currently classified as AFS financial assets have fixed interest rates and defined maturity dates (see Note 10.1). The University initially assessed that the contractual cash flows of these debt securities qualify under the SPPI test and under held-to-collect and sell business model. Thus, these debt securities will continue to be measured at fair value, with mark-to-market fluctuations recognized in OCI subject to recycling upon disposal of these securities.
- 7 -
• The ECL model will apply to the University’s certain receivables and debt securities under AFS financial assets and HTM investments. For tuition and other school fees receivables and other financial assets, the University will apply a simplified model of recognizing lifetime expected credit losses as these items do not have a significant financing component.
• The existing financial liabilities of the University are measured at amortized cost, except for its derivative liability which is measured at fair value. Upon adoption of PFRS 9 (2014), management has assessed that the classifications for the financial liabilities will be retained.
(iii) PFRS 15, Revenue from Contracts with Customers (effective from January 1, 2018). This standard will replace PAS 18, Revenue, and PAS 11, Construction Contracts, the related Interpretations on revenue recognition: International Financial Reporting Interpretations Committee (IFRIC) 13, Customer Loyalty Programmes, IFRIC 15, Agreement for the Construction of Real Estate, IFRIC 18, Transfers of Assets from Customers, and Standing Interpretations Committee 31, Revenue – Barter Transactions Involving Advertising Services. This new standard establishes a comprehensive framework for determining when to recognize revenue and how much revenue to recognize. The core principle in the said framework is for an entity to recognize revenue to depict the transfer of promised goods or services to the customer in an amount that reflects the consideration to which the entity expects to be entitled in exchange for those goods or services. Based on the University’s initial assessment of its revenue streams as at May 31, 2018, which has been limited to the facts and circumstances existing at that date, management determined that its significant source of revenue pertains to educational revenues, which will be in scope of PFRS 15.
(iv) IFRIC 22, Foreign Currency Transactions and Advance Consideration – Interpretation
on Foreign Currency Transactions and Advance Consideration (effective from January 1, 2018). The interpretation provides more detailed guidance on how to account for transactions that include the receipt or payment of advance consideration in a foreign currency. The Interpretation states that the date of the transaction, for the purpose of determining the exchange rate, is the date of initial recognition of the non-monetary asset (arising from advance payment) or liability (arising from advance receipt). If there are multiple payments or receipts in advance, a date of transaction is established for each payment or receipt.
Management has initially assessed that this interpretation has no material impact on the University’s financial statements.
(v) Annual Improvements to PFRS 2014-2016 Cycle. Among the improvements, PAS 28 (Amendments), Investment in Associates – Clarification on Fair Value through Profit or Loss Classification (effective from January 1, 2018) is relevant to the University. The amendments clarify that the option for venture capital organization, mutual funds and other similar entities to elect the fair value through profit or loss classification in measuring investments in associates and joint ventures shall be made at initial recognition, separately for each associate or joint venture.
Management has initially assessed that these amendments have no material impact on the University’s financial statements.
- 8 -
(vi) PAS 28 (Amendments), Investment in Associates – Long-term Interest in Associates and Joint Venture (effective from January 1, 2019). The amendments clarify that the scope exclusion in PFRS 9 (2014) applies only to ownership interests accounted for using the equity method. Thus, the amendments further clarify that long-term interests in an associate or joint venture – to which the equity method is not applied – must be accounted for under PFRS 9 (2014), which shall also include long-term interests that, in substance, form part of the entity’s net investment in an associate or joint venture. Management is currently assessing the impact of these amendments on the University’s financial statements.
(vii) PFRS 9 (Amendments), Financial Instruments – Prepayment Features with Negative Compensation (effective from January 1, 2019). The amendments clarify that prepayment features with negative compensation attached to financial instruments may still qualify under the SPPI test. As such, the financial assets containing prepayment features with negative compensation may still be classified at amortized cost or at FVTOCI.
(viii) PFRS 16, Leases (effective from January 1, 2019). The new standard will eventually replace PAS 17, Leases. For lessees, it requires to account for leases “on-balance sheet” by recognizing a “right-of-use” asset and a lease liability. The lease liability is initially measured as the present value of future lease payments. For this purpose, lease payments include fixed, non-cancellable payments for lease elements, amounts due under residual value guarantees, certain types of contingent payments and amounts due during optional periods to the extent that extension is reasonably certain. In subsequent periods, the “right-of-use” asset is accounted for similarly to a purchased asset and depreciated or amortized. The lease liability is accounted for similarly to a financial liability using the effective interest method. However, the new standard provides important reliefs or exemptions for short-term leases and leases of low value assets. If these exemptions are used, the accounting is similar to operating lease accounting under PAS 17 where lease payments are recognized as expenses on a straight-line basis over the lease term or another systematic basis (if more representative of the pattern of the lessee’s benefit).
For lessors, lease accounting is similar to PAS 17’s. In particular, the distinction between finance and operating leases is retained. The definitions of each type of lease, and the supporting indicators of a finance lease, are substantially the same as PAS 17’s. The basic accounting mechanics are also similar, but with some different or more explicit guidance in few areas. These include variable payments, sub-leases, lease modifications, the treatment of initial direct costs and lessor disclosures. Management is currently assessing the impact of this new standard on the University’s financial statements.
- 9 -
(ix) IFRIC 23, Uncertainty over Income Tax Treatments (effective from January 1, 2019). The interpretation provides clarification on the determination of taxable profit, tax bases, unused tax losses, unused tax credits, and tax rates when there is uncertainty over income tax treatments. The core principle of the interpretation requires the University to consider the probability of the tax treatment being accepted by the taxation authority. When it is probable that the tax treatment will be accepted, the determination of the taxable profit, tax bases, unused tax losses, unused tax credits, and tax rates shall be on the basis of the accepted tax treatment. Otherwise, the University has to use the most likely amount or the expected value, depending on the surrounding circumstances, in determining the tax accounts identified immediately above. Management is currently assessing the impact of this interpretation on the University’s financial statements.
(x) Annual Improvements to PFRS 2015-2017 Cycle (effective from January 1, 2019). Among the improvements, the following amendments are relevant to the University but had no material impact on its financial statements as these amendments merely clarify existing requirements:
• PAS 12 (Amendments), Income Taxes – Tax Consequences of Dividends. The amendments clarify that all income tax consequence of dividend payments should be recognized in profit or loss.
• PAS 23 (Amendments), Borrowing Costs – Eligibility for Capitalization. The amendments clarify that any specific borrowing which remains outstanding after the related qualifying asset is ready for its intended purpose, such borrowing will then form part of the entity’s general borrowings when calculating the capitalization rate for capitalization purposes.
• PFRS 3 (Amendments), Business Combinations, and PFRS 11 (Amendments), Joint Arrangements – Remeasurement of Previously Held Interests in a Joint Operation. The amendments clarify that previously held interest in a joint operation shall be remeasured when the University obtains control of the business. On the other hand, previously held interests in a joint operation shall not be remeasured when the University obtains joint control of the business.
(xi) PFRS 10 (Amendments), Consolidated Financial Statements, and PAS 28
(Amendments), Investments in Associates and Joint Ventures – Sale or Contribution of Assets between an Investor and its Associate or Joint Venture (effective date deferred indefinitely). The amendments to PFRS 10 require full recognition in the investor’s financial statements of gains or losses arising on the sale or contribution of assets that constitute a business as defined in PFRS 3, Business Combinations, between an investor and its associate or joint venture. Accordingly, the partial recognition of gains or losses (i.e., to the extent of the unrelated investor’s interests in an associate or joint venture) only applies to those sale or contribution of assets that do not constitute a business. Corresponding amendments have been made to PAS 28 to reflect these changes.
- 10 -
In addition, PAS 28 has been amended to clarify that when determining whether assets that are sold or contributed constitute a business, an entity shall consider whether the sale or contribution of those assets is part of multiple arrangements that should be accounted for as a single transaction.
2.3 Separate Financial Statements and Investments in Subsidiaries and an Associate
These financial statements are prepared as the University’s separate financial statements. The University also prepares consolidated financial statements as required under PFRS and is available for public use. Subsidiaries are entities over which the University has control. The University controls an entity when (i) it has power over the entity, (ii) it is exposed, or has rights to, variable returns from its involvement with the entity, and, (iii) it has the ability to affect those returns through its power over the entity. The University reassesses whether or not it controls an entity if facts and circumstances indicate that there are changes to one or more of the three elements of controls indicated above. An associate is an entity over which the University is able to exert significant influence but which is neither a subsidiary nor interest in a joint venture. The University’s investments in subsidiaries and an associate are accounted for in these separate financial statements at cost, less any impairment loss (see Note 2.14).
2.4 Financial Assets
Financial assets are recognized when the University becomes a party to the contractual terms of the financial instrument. For purposes of classifying financial assets, an instrument is considered as an equity instrument if it is non-derivative and meets the definition of equity for the issuer in accordance with the criteria of PAS 32, Financial Instruments: Presentation. All other non-derivative financial instruments are treated as debt instruments. (a) Classification and Measurement of Financial Assets
Financial assets other than those designated and effective as hedging instruments are classified into the following categories: financial assets at FVTPL, loans and receivables, HTM investments and AFS financial assets. Financial assets are assigned to the different categories by management on initial recognition, depending on the purpose for which the investments were acquired.
Regular purchases and sales of financial assets are recognized on their trade date. All financial assets that are not classified as at FVTPL are initially recognized at fair value plus any directly attributable transaction costs. Financial assets carried at FVTPL are initially recorded at fair value and the related transaction costs are recognized in profit or loss.
- 11 -
A more detailed description of categories of financial assets that are relevant to the University follows:
(i) Financial Assets at FVTPL
This category includes financial assets that are either classified as held for trading or that meets certain conditions and are designated by the entity to be carried at fair value through profit or loss upon initial recognition. All derivatives fall into this category, except for those designated and effective as hedging instruments. Assets in this category are classified as current if they are either held for trading or are expected to be realized within 12 months from the end of each reporting period. Financial assets at FVTPL are measured at fair value, and changes therein are recognized in profit or loss. Financial assets (except derivatives and financial instruments originally designated as financial assets at fair value through profit or loss) may be reclassified out of FVTPL category if they are no longer held for the purpose of being sold or repurchased in the near term. The University enters into a cross-currency swap agreement to manage its risks associated with fluctuations in foreign currency denominated investments in corporate bonds. The host instruments were classified as AFS financial assets for the period ended March 31, 2016, which were subsequently reclassified to HTM investments during the year ended May 31, 2017 (see Note 10.2). Such derivative financial instruments are initially recognized at fair value on the date on which the derivative contract is entered into and are subsequently remeasured at fair value. Derivatives are carried as assets when the fair value is favorable to the University and as liabilities when the fair value is favorable to the counterparty (see Note 2.8). Thus, if derivative asset is recognized, it is presented as Financial Asset at FVTPL; otherwise, it is presented as Derivative Liability in the statement of financial position.
The University’s derivative instruments provide economic hedges under the University’s policies but are not designated as accounting hedges. Consequently, any gains or losses arising from changes in fair value are taken up directly in profit or loss for the period [see Note 3.2(b)].
(ii) Loans and Receivables Loans and receivables are non-derivative financial assets with fixed or determinable payments that are not quoted in an active market. They arise when the University provides money, goods or services directly to a debtor with no intention of trading the receivables. They are included in current assets, except for those with maturities beyond 12 months after the end of each reporting period, which are classified as non-current assets. The University’s financial assets categorized as loans and receivables are presented as Cash and Cash Equivalents, Receivables (excluding advances to employees), as part of Other Current Assets (with respect to short-term investments) and Refundable Deposits in the statement of financial position. Cash and cash equivalents include cash on hand, demand deposits and short-term, highly liquid investments with original maturities of three months or less, readily convertible to known amounts of cash and which are subject to insignificant risk of changes in value. Loans and receivables are subsequently measured at amortized cost using the effective interest method, less impairment loss, if any.
- 12 -
(iii) HTM Investments
This category includes non-derivative financial assets with fixed or determinable payments and a fixed date of maturity that the University has the positive intention and ability to hold to maturity. Investments intended to be held for an undefined period are not included in this classification. If the University were to sell other than an insignificant amount of HTM investments, the whole category would be tainted and reclassified to AFS financial assets. The University currently holds corporate bonds designated into this category. Subsequent to initial recognition, HTM investments are measured at amortized cost using the effective interest method, less impairment losses, if any.
(iv) AFS Financial Assets
This category includes non-derivative financial assets that are either designated to this category or do not qualify for inclusion in any of the other categories of financial assets. They are included in non-current assets in the statement of financial position unless management intends to dispose of the investment within 12 months from the reporting period.
All financial assets within this category are subsequently measured at fair value, except for equity instruments that do not have a quoted market price in an active market and whose fair value cannot be reliably measured which are measured at cost, less impairment loss, if any. Gains and losses from changes in fair value of AFS financial assets are recognized in other comprehensive income, net of any income tax effects, and are reported as part of the Revaluation Reserves account in equity. Interest and dividend income, impairment losses and foreign exchange differences on monetary assets are recognized in profit or loss.
When the financial asset is disposed of or is determined to be impaired, that is, when there is a significant or prolonged decline in the fair value of the security below its cost, the cumulative fair value gains or losses recognized in other comprehensive income is reclassified from equity to profit or loss and is presented as reclassification adjustment within other comprehensive income even though the financial asset has not been derecognized.
(b) Impairment of Financial Assets
The University assesses at the end of each reporting period whether there is objective evidence that a financial asset or group of financial assets is impaired. The University recognizes impairment loss based on the category of financial assets as follows: (i) Carried at Amortized Cost – Loans and Receivables and HTM Investments If there is objective evidence that an impairment loss on loans and receivables or HTM investments carried at cost has been incurred, the amount of the impairment loss is determined as the difference between the asset’s carrying amount and the present value of estimated future cash flows (excluding future credit losses that have not been incurred), discounted at the financial asset’s original effective interest rate or current effective interest rate determined under the contract if the loan has a variable interest rate.
- 13 -
The carrying amount of the asset shall be reduced either directly or through the use of an allowance account. The amount of the loss shall be recognized in profit or loss. If in a subsequent period, the amount of the impairment loss decreases and the decrease can be related objectively to an event occurring after the impairment was recognized (such as an improvement in the debtor’s credit rating), the previously recognized impairment loss is reversed by adjusting the allowance account. The reversal shall not result in a carrying amount of the financial asset that exceeds what the amortized cost would have been had the impairment not been recognized at the date of the impairment is reversed. The amount of the reversal is recognized in profit or loss.
(ii) Carried at Fair Value – AFS Financial Assets
When a decline in the fair value of an AFS financial asset has been recognized in other comprehensive income and there is objective evidence that the asset is impaired, the cumulative loss – measured as the difference between the acquisition cost (net of any principal repayment and amortization) and current fair value, less any impairment loss on that financial asset previously recognized in profit or loss – is reclassified from Revaluation Reserves to profit or loss as a reclassification adjustment even though the financial asset has not been derecognized.
Impairment losses recognized in profit or loss on equity instruments are not reversed through profit or loss. Reversal of impairment losses is recognized in other comprehensive income, except for financial assets that are debt securities which are recognized in profit or loss only if the reversal can be objectively related to an event occurring after the impairment loss was recognized.
(c) Items of Income and Expense Related to Financial Assets
All income and expenses, except those arising from operating activities, relating to financial assets that are recognized in profit or loss, are presented as part of Finance Income or Finance Costs in the statement of profit or loss.
Non-compounding interest, dividend income and other cash flows resulting from holding financial assets are recognized in profit or loss when earned, regardless of how the related carrying amount of financial assets is measured.
(d) Derecognition of Financial Assets
The financial assets (or where applicable, a part of a financial asset or part of a group of financial assets) are derecognized when the contractual rights to receive cash flows from the financial instruments expire, or when the financial assets and all substantial risks and rewards of ownership have been transferred to another party. If the University neither transfers nor retains substantially all the risks and rewards of ownership and continues to control the transferred asset, the University recognizes its retained interest in the asset and an associated liability for amounts it may have to pay. If the University retains substantially all the risks and rewards of ownership of a transferred financial asset, the University continues to recognize the financial asset and also recognizes a collateralized borrowing for the proceeds received.
- 14 -
2.5 Prepayments and Other Assets
Prepayments and other current assets pertain to other resources controlled by the University as a result of past events. They are recognized in the financial statements when it is probable that the future economic benefits will flow to the University and the asset has a cost or value that can be measured reliably.
Where future economic benefits are expected to flow to the University beyond one year after the end of the reporting period, these other assets are classified under the non-current category.
2.6 Property and Equipment
Except for land which is stated at cost less any impairment in value, property and equipment are stated at cost less accumulated depreciation, amortization and impairment in value, if any.
The cost of an asset comprises its purchase price and directly attributable costs of bringing the asset to working condition for its intended use. Expenditures for additions, major improvements and renewals are capitalized; expenditures for repairs and maintenance are charged to expense as incurred.
Depreciation and amortization are computed on a straight-line basis over the estimated useful lives of the assets as follows:
Building and improvements 20 years Furniture and equipment 3 - 6 years Miscellaneous equipment 5 years
Leasehold improvements are amortized over 20 years regardless of the term of lease contract which is usually shorter than the expected useful life of the improvements because it is highly probable that the lease contract will be renewed before the end of such contract [see Note 3.1(c)]. Construction in progress represents properties under construction and is stated at cost. This includes cost of construction, borrowing costs, if any, and other direct costs (see Note 2.16). The account is not depreciated until such time that the assets are completed and available for use.
An asset’s carrying amount is written down immediately to its recoverable amount if the asset’s carrying amount is greater than its estimated recoverable amount (see Note 2.14).
The residual values, estimated useful lives and method of depreciation and amortization of property and equipment are reviewed and adjusted, if appropriate, at the end of each reporting period.
Fully depreciated and amortized assets are retained in the accounts until they are no longer in use and no further charge for depreciation and amortization is made in respect of those assets.
An item of property and equipment, including the related accumulated depreciation, amortization and impairment losses, if any, is derecognized upon disposal or when no future economic benefits are expected to arise from the continued use of the asset. Any gain or loss arising on derecognition of the asset (calculated as the difference between the net disposal proceeds and the carrying amount of the item) is included in profit or loss in the year the item is derecognized.
- 15 -
2.7 Investment Properties Investment properties are measured initially at acquisition cost. Subsequently, investment properties, except land, are carried at cost less accumulated depreciation and impairment in value, if any. Depreciation of investment properties, which consist of building and improvements, is computed using the straight-line method over its estimated useful life of 20 years. Land is carried at cost less impairment in value, if any. Investment properties include construction in progress which represents properties under construction and is stated at cost. This includes cost of construction, applicable borrowing costs (see Note 2.16) and other direct costs. The account is not depreciated until such time that the assets are completed and available for use.
Transfers are made to and from investment property when, and only when, there is a change in use, evidenced by the end or commencement of owner-managed, commencement of an operating lease to another party, by the end of construction or development, or commencement of development with a view to sell. For the transfer from investment property to owner-occupied property, the cost of property for subsequent accounting is its carrying value at the date of change in use.
If an owner-occupied property becomes an investment property, the University accounts for such property in accordance with the policy stated under Property and Equipment up to the date of change in use (see Note 2.6).
Investment property is derecognized upon disposal or when permanently withdrawn from use and no future economic benefit is expected from its disposal. Any gain or loss on the retirement or disposal of an investment property is recognized in profit or loss in the year of retirement or disposal. An asset’s carrying amount is written down immediately to its recoverable amount if the asset’s carrying amount is greater than its estimated recoverable amount (see Note 2.14).
2.8 Financial Liabilities
Financial liabilities, which include interest-bearing loans, trade and other payables [except tax-related liabilities and National Service Training Program (NSTP) trust fund], advances from a related party, derivative liability and subscription payable, are recognized when the University becomes a party to the contractual terms of the instrument. Trade and other payables account include deposits payable which represents funds collected from students or entities and are held by the University. The University has no control over its use and disburses the funds only upon instruction of the student or entity that made the deposit. This account also includes Trust funds which represent restricted funds of the University that are intended for student’s NSTP and other specific educational purposes [see Note 2.11(a)]. The University administers the use of these funds based on the specific purpose such funds are identified with. Interest-bearing loans are availed for capital expenditures and to provide general corporate funding requirements. Financial liabilities are recognized initially at their fair values and subsequently measured at amortized cost, except derivative liability which is consistently measured at fair value, using the effective interest method for those with maturities beyond one year, less settlement payments.
- 16 -
Dividend distributions to shareholders are recognized as financial liabilities upon declaration by the University.
Financial liabilities are classified as current liabilities if payment is due to be settled within one year or less after the end of the reporting period, or the University does not have an unconditional right to defer settlement of the liability for at least 12 months after the end of the reporting period. Otherwise, these are presented as non-current liabilities.
Financial liabilities are derecognized from the statement of financial position only when the obligations are extinguished either through discharge, cancellation or expiration. The difference between the carrying amount of the financial liability derecognized and the consideration paid or payable is recognized in profit or loss.
2.9 Offsetting Financial Instruments Financial assets and financial liabilities are offset and the resulting net amount, considered as a single financial asset or financial liability, is reported in the statement of financial position when there is a legally enforceable right to set-off the recognized amounts and there is an intention to settle on a net basis, or realize the asset and settle the liability simultaneously. The right of set-off must be available at the end of the reporting period, that is, it is not contingent on future event. It must also be enforceable in the normal course of business, in the event of default, and in the event of insolvency or bankruptcy; and, must be legally enforceable for both entity and all counterparties to the financial instruments.
2.10 Provisions and Contingencies Provisions are recognized when present obligations will probably lead to an outflow of economic resources and they can be estimated reliably even if the timing or amount of the outflow may still be uncertain. A present obligation arises from the presence of a legal or constructive obligation that has resulted from past events.
Provisions are measured at the estimated expenditure required to settle the present obligation, based on the most reliable evidence available at the end of the reporting period, including the risks and uncertainties associated with the present obligation. Where there are a number of similar obligations, the likelihood that an outflow will be required in settlement is determined by considering the class of obligations as a whole. When time value of money is material, long-term provisions are discounted to their present values using a pretax rate that reflects market assessments and the risks specific to the obligation. The increase in the provision due to passage of time is recognized as interest expense. Provisions are reviewed at the end of each reporting period and adjusted to reflect the current best estimate. In those cases, where the possible outflow of economic resource as a result of present obligations is considered improbable or remote, or the amount to be provided for cannot be measured reliably, no liability is recognized in the financial statements. Similarly, possible inflows of economic benefits to the University that do not yet meet the recognition criteria of an asset are considered contingent assets, hence, are not recognized in the financial statements. On the other hand, any reimbursement that the University can be virtually certain to collect from a third party with respect to the obligation is recognized as a separate asset not exceeding the amount of the related provision.
2.11 Revenue and Expense Recognition Revenue is measured by reference to the fair value of consideration received or receivable by the University for services rendered, excluding value-added tax (VAT) and discounts.
- 17 -
Revenue is recognized to the extent that the revenue can be reliably measured; it is probable that the economic benefits will flow to the University; and, the costs incurred or to be incurred can be measured reliably.
In addition, the following specific recognition criteria must also be met before revenue is recognized:
(a) Educational revenues – Revenue is recognized in profit or loss over the corresponding school term. Tuition fee received in advance and applicable to a school term after the reporting period is not recognized in profit or loss until the next reporting period and is presented as Unearned Tuition Fees account in the statement of financial position. Revenues from NSTP trust fund (see Note 2.8) are recognized upon fulfillment of conditions attached to the fund and/or extent that the related expenses have been incurred. Restricted funds for which restrictions and conditions have not yet been met are classified as trust funds (liability) recorded as part of the Trade and Other Payables account in the statement of financial position.
(b) Rental – Revenue from operating lease is recognized over the lease term using the
straight-line method. This is presented as Other Operating Income in the statement of profit or loss.
(c) Income from sale of books and other educational-related merchandise – Revenue is recognized when the risks and rewards of ownership of the goods have been passed to the buyer. This is generally when the customer has acknowledged delivery of goods. The sale of this merchandise is made exclusively for the University’s students.
(d) Interest – Income is recognized as the interest accrues taking into account the effective yield on the asset.
(e) Dividends – Revenue is recognized when the University’s right to receive payment is established.
Cost and expenses are recognized in profit or loss upon utilization of goods or services or at the date such cost and expenses are incurred. All finance costs are reported in profit or loss on an accrual basis, except capitalized borrowing costs which are included as part of the cost of the related qualifying asset (see Note 2.16).
2.12 Leases
The University accounts for its leases as follows:
(a) University as Lessee
Leases which do not transfer to the University substantially all the risks and benefits of ownership of the asset are classified as operating leases. Operating lease payments (net of any incentive received from the lessor) are recognized as expense in profit or loss on a straight-line basis over the lease term. Associated costs, such as maintenance and insurance, are expensed as incurred.
(b) University as Lessor
Leases which do not transfer to the lessee substantially all the risks and benefits of ownership of the asset are classified as operating leases. Lease income from operating leases is recognized in profit or loss on a straight-line basis over the lease term.
- 18 -
The University determines whether an arrangement is, or contains, a lease based on the substance of the arrangement. It makes an assessment of whether the fulfillment of the arrangement is dependent on the use of a specific asset or assets and the arrangement conveys a right to use the asset.
2.13 Foreign Currency Transactions and Translation
The accounting records of the University are maintained in Philippine pesos. Foreign currency transactions during the year are translated into the functional currency at exchange rates which approximate those prevailing on transaction dates.
Foreign currency gains and losses resulting from the settlement of such transactions and from the translation at year-end exchange rates of monetary assets and liabilities denominated in foreign currencies are recognized in profit or loss.
Changes in the fair value of monetary financial assets denominated in foreign currency classified as AFS financial assets are analyzed between translation differences resulting from changes in the amortized cost of the security and other changes in the carrying amount of the security. Translation differences related to changes in amortized cost are recognized in profit or loss, and other changes in the carrying amount are recognized in other comprehensive income.
2.14 Impairment of Non-financial Assets The University’s investments in subsidiaries and an associate, property and equipment, investment properties and other non-financial assets are tested for impairment whenever events or changes in circumstances indicate that the carrying amount may not be recoverable.
For purposes of assessing impairment, assets are grouped at the lowest levels for which there are separately identifiable cash flows (cash-generating units). As a result, some assets are tested individually for impairment and some are tested at cash-generating unit level. An impairment loss is recognized for the amount by which the asset’s or cash-generating unit’s carrying amount exceeds its recoverable amount. The recoverable amount is the higher of fair value reflecting market conditions less costs to sell, and value in use, based on an internal evaluation of discounted cash flows. In determining value in use, management estimates the expected future cash flows from each cash-generating unit and determines the suitable interest rate in order to calculate the present value of those cash flows. The data used for impairment testing procedures are directly linked to the University’s latest approved budget, adjusted as necessary to exclude the effects of asset enhancements. Discount factors are determined individually for each cash-generating unit and reflect management’s assessment of respective risk profiles, such as market and asset-specific risk factors. Impairment loss is charged pro-rata to the other assets in the cash-generating unit. All assets are subsequently reassessed for indications that an impairment loss previously recognized may no longer exist. An impairment loss is reversed if the asset’s or cash generating unit’s recoverable amount exceeds its carrying amount.
- 19 -
2.15 Employee Benefits The University provides post-employment benefits to employees through a defined contribution plan subject to compliance to a minimum guarantee required by Republic Act (RA) 7641, The Retirement Pay Law, which is accounted for as a defined benefit plan, and various compensations mandated by law. Such application of the minimum guarantee prescribed by RA 7641 is based on the interpretations issued by the Philippine Interpretations Committee (PIC) in its Question and Answer on PAS 19 – Accounting for Employee Benefits Under a Defined Benefit Contribution Plan Subject to the Requirements of RA 7641.
(a) Post-employment Benefits
The University maintains a defined contribution plan that covers all regular full-time employees. Under its plan, the University pays fixed contributions based on the employees’ monthly salaries. The University, however, is covered by RA 7641, which provides for its qualified employees a defined benefit minimum guarantee. The defined benefit minimum guarantee is equivalent to a certain percentage of the monthly salary payable to an employee at normal retirement age with the required credited years of service based on the provisions of RA 7641.
Accordingly, the University recognizes its post-employment benefit obligation based on the higher of the defined benefit obligation relating to the minimum guarantee and the obligation arising from the defined contribution plan. For defined benefit minimum guarantee plan, the liability is determined based on the present value of the excess of the projected defined benefit obligation over the projected defined contribution obligation at the end of the reporting period. The defined benefit obligation is calculated annually by a qualified independent actuary using the projected unit credit method. The University determines the net interest expense (income) on the defined benefit liability (asset) for the period by applying the discount rate used to measure the defined benefit obligation at the beginning of the annual period to the net defined benefit liability (asset), taking into account any changes in the net defined benefit liability (asset) during the period as a result of contributions and benefit payments. Net interest expense and other expenses related to the defined benefit plan are recognized in profit or loss.
The defined contribution, on the other hand, is measured at the fair value of the defined contribution assets upon which the defined contribution benefits depend, with an adjustment for margin on asset returns, if any, where this is reflected in the defined contribution benefits.
When the benefits of a plan are changed or when a plan is curtailed, the resulting change in benefit that relates to past service or the gain or loss on curtailment is recognized immediately in profit or loss. The University recognizes gains or losses on the settlement of a defined benefit plan when the settlement occurs.
(b) Termination Benefits
Termination benefits are payable when employment is terminated by the University before the normal retirement date, or whenever an employee accepts voluntary redundancy in exchange for these benefits. The University recognizes termination benefits when it is demonstrably committed to either: (a) terminating the employment of current employees according to a detailed formal plan without possibility of withdrawal; or, (b) providing termination benefits as a result of an offer made to encourage voluntary redundancy. Benefits falling due more than 12 months after the reporting period are discounted to their present value.
- 20 -
(c) Bonuses
The University recognizes a liability and an expense for bonuses. The University recognizes a provision where it is contractually obliged to pay the benefits, or where there is a past practice that has created a constructive obligation.
(d) Compensated Absences
Compensated absences are recognized for the number of paid leave days (including holiday entitlement) remaining at the end of the reporting period. These are included in the Trade and Other Payables account in the statement of financial position at the undiscounted amount that the University expects to pay as a result of the unused entitlement.
2.16 Borrowing Costs
Borrowing costs are recognized as expenses in the period in which they are incurred, except to the extent that they are capitalized. Borrowing costs that are directly attributable to the acquisition, construction or production of a qualifying asset (i.e., an asset that takes a substantial period of time to get ready for its intended use or sale) are capitalized as part of cost of such asset. The capitalization of borrowing costs commences when expenditures for the asset and borrowing costs are being incurred and activities that are necessary to prepare the asset for its intended use or sale are in progress. Capitalization ceases when substantially all such activities are complete.
2.17 Income Taxes Tax expense recognized in profit or loss comprises the sum of current tax and deferred tax not recognized in other comprehensive income or directly in equity, if any. Current tax assets or current tax liabilities comprise those claims from, or obligations to, fiscal authorities relating to the current or prior reporting period, that are uncollected or unpaid at the end of the reporting period. They are calculated using the tax rates and tax laws applicable to the fiscal periods to which they relate, based on the taxable profit for the year. All changes to current tax assets or current tax liabilities are recognized as a component of tax expense in profit or loss.
Deferred tax is accounted for using the liability method on temporary differences at the end of the reporting period between the tax base of assets and liabilities and their carrying amounts for financial reporting purposes. Under the liability method, with certain exceptions, deferred tax liabilities are recognized for all taxable temporary differences and deferred tax assets are recognized for all deductible temporary differences and the carryforward of unused tax losses and unused tax credits to the extent that it is probable that taxable profit will be available against which the temporary differences can be utilized. Unrecognized deferred tax assets are reassessed at the end of each reporting period and are recognized to the extent that it has become probable that future taxable profit will be available to allow such deferred tax assets to be recovered.
Deferred tax assets and deferred tax liabilities are measured at the tax rates that are expected to apply to the period when the asset is realized or the liability is settled, provided such tax rates have been enacted or substantively enacted at the end of the reporting period.
The carrying amount of deferred tax assets is reviewed at the end of each reporting period and reduced to the extent that it is probable that sufficient taxable profit will be available to allow all or part of the deferred tax asset to be utilized.
- 21 -
The measurement of deferred tax assets and deferred tax liabilities reflects the tax consequences that would follow from the manner in which the University expects, at the end of the reporting period, to recover or settle the carrying amount of its assets and liabilities. Most changes in deferred tax assets or deferred tax liabilities are recognized as a component of tax expense in profit or loss. Only changes in deferred tax assets or deferred tax liabilities that relate to items recognized in other comprehensive income or directly in equity are recognized in other comprehensive income or directly in equity, respectively. Deferred tax assets and deferred tax liabilities are offset if the University has a legally enforceable right to set-off current tax assets against current tax liabilities and the deferred taxes relate to the same taxation authority.
2.18 Related Party Transactions and Relationships Related party transactions are transfers of resources, services or obligations between the University and its related parties, regardless of whether a price is charged.
Parties are considered to be related if one party has the ability to control the other party or exercise significant influence over the party in making financial and operating decisions. These parties include: (a) individuals owning, directly or indirectly through one or more intermediaries, control or are controlled by, or under common control with the University; (b) associates; (c) individuals owning, directly or indirectly, an interest in the voting power of the University that gives them significant influence over the University and close members of the family of any such individual; and, (d) certain funded retirement plans administered by an organization, through its Retirement Board. In considering each possible related party relationship, attention is directed to the substance of the relationship and not merely on the legal form.
2.19 Equity Capital stock represents the nominal value of shares that have been issued. Treasury stocks are stated at the cost of reacquiring such shares and are deducted from equity attributable to the University’s equity holders until the shares are cancelled, reissued or disposed of. Revaluation reserves comprise accumulated gains or losses arising from the revaluation of AFS financial assets. Retained earnings represent all current and prior period results of operations as reported in the statement of profit or loss, reduced by the amount of dividend declared. The appropriated portion represents the amount which is not available for distribution.
2.20 Earnings (Loss) Per Share Basic earnings (loss) per share is determined by dividing net profit (loss) by the weighted average number of shares subscribed and issued during the year after giving retroactive effect to stock dividend declared, stock split and reverse stock split during the current year, if any.
- 22 -
Diluted earnings (loss) per share is computed by adjusting the weighted average number of ordinary shares outstanding to assume conversion of dilutive potential shares. The University does not have dilutive potential shares outstanding that would require disclosure of diluted earnings per share in the statement of profit or loss.
2.21 Segment Reporting
Operating segments are reported in a manner consistent with the internal reporting provided to the University’s chief operating decision-maker. However, in the University’s separate financial statements, there are no operating segments that are organized and managed separately according to the nature of the services provided.
2.22 Events After the End of the Reporting Period
Any post-year-end event that provides additional information about the University’s financial position at the end of the reporting period (adjusting event) is reflected in the financial statements. Post year-end events that are not adjusting events are disclosed when material to the financial statements.
3. SIGNIFICANT ACCOUNTING JUDGMENTS AND ESTIMATES
The preparation of the University’s financial statements in accordance with PFRS requires management to make judgments and estimates that affect amounts reported in the financial statements and related notes. Judgments and estimates are continually evaluated and are based on historical experience and other factors, including expectations of future events that are believed to be reasonable under the circumstances. Actual results may ultimately vary from these estimates.
3.1 Critical Management Judgments in Applying Accounting Policies
In the process of applying the University’s accounting policies, management has made judgments, apart from those involving estimation. The following judgments have the most significant effect on the amounts recognized in the financial statements:
(a) Classification of Financial Assets as HTM Investments
In classifying non-derivative financial assets with fixed or determinable payments and fixed maturity, such as bonds and HTM investments, the University evaluates its intention and ability to hold such investments up to maturity. Management has confirmed its intention and determined its ability to hold the investments up to maturity. If the University fails to keep these investments to maturity other than for specific circumstances as allowed under the standard, it will be required to reclassify the whole class as AFS financial assets. In such a case, the investments would, therefore, be measured at fair value, not at amortized cost.
(b) Impairment of AFS Financial Assets
The determination when an investment is other-than-temporarily impaired requires significant judgment. In making this judgment, the University evaluates, among other factors, the significant and prolonged decline in the fair value of an investment below its cost, and the financial health of and near-term business outlook for the investee, including factors such as industry and sector performance, changes in technology and operational and financing cash flows. The management considers more than 20% decline in fair value as significant and continuous decline in value beyond nine months to be prolonged.
- 23 -
Based on the recent evaluation of information and circumstances affecting the University’s AFS Financial Assets, management concluded that the assets are not impaired as at May 31, 2018, 2017 and 2016. Future changes in those information and circumstance might significantly affect the carrying amount of the assets.
(c) Amortization of Leasehold Improvements The University’s leasehold improvements are amortized over 20 years, which is the estimated useful life of the asset (see Notes 2.6 and 14) regardless of the term of the lease contracts which is usually shorter than the expected useful life of the improvements because it is highly probable that the lease contract will be renewed before the end of such contract. A decision by management not to renew its lease agreement will result in a significant impact on its profit or loss in the period such decision is made.
(d) Distinction between Investment Properties and Owner-managed Properties
The University determines whether a property qualifies as investment property. In making its judgment, the University considers whether the property generates cash flows largely independent of the other assets held by an entity. Owner-managed properties generate cash flows that are attributable not only to the property but also to other assets used in the process of providing educational services.
Some properties comprise a portion that is held to earn rental or for capital appreciation and another portion that is held for use in the supply of services or for administrative purposes. If a portion can be sold separately (or leased out separately under finance lease), the University accounts for such portion separately. If the portion cannot be sold separately, the property is accounted for as investment property only if an insignificant portion is held for use in the supply of services or for administrative purposes. Judgment is applied in determining whether ancillary services are so significant that a property does not qualify as investment property. The University considers each property separately in making its judgment.
(e) Distinction between Operating and Finance Lease
The University has entered into various lease agreements as either a lessor or a lessee. Judgment was exercised by management to distinguish each lease agreement as either an operating or finance lease by looking at the transfer or retention of significant risk and rewards of ownership of the properties covered by the agreements. Failure to make the right judgment will result in either overstatement or understatement of assets and liabilities. Currently, all of the University’s lease agreements are determined to be operating leases.
(f) Recognition of Provisions and Contingencies
Judgment is exercised by management to distinguish between provisions and contingencies. Accounting policies on recognition and disclosure of provisions and contingencies are discussed in Note 2.10 and relevant disclosures are presented in Note 27.
- 24 -
3.2 Key Sources of Estimation Uncertainty The following are the key assumptions concerning the future, and other key sources of estimation uncertainty at the end of the reporting period, that have a significant risk of causing a material adjustment to the carrying amounts of assets and liabilities within the next reporting period:
(a) Estimating Impairment of Receivables
The University maintains an allowance for impairment loss on receivables at a level considered adequate to cover probable uncollectible receivables. The level of this allowance is evaluated by management on the basis of factors that affect the collectability of the accounts. These factors include, but are not limited to, history of the payment behavior of students and related parties, age of receivables and other external factors affecting the education industry. The University constantly reviews the age and status of receivables and identifies accounts that should be provided with allowance. The carrying value of receivables and the analysis of allowance for impairment on such financial assets are shown in Note 8.
(b) Determining Fair Value Measurement of Financial Assets other than Loans and Receivables
The University carries certain financial assets at fair value, which requires the extensive use of accounting estimates and judgment. In cases where active market quotes are not available, fair value is determined by reference to the current market value of another instrument which is substantially the same or is calculated based on the expected cash flows of the underlying net base of the instrument. The amount of changes in fair value would differ if the University utilized different valuation methods and assumptions. Any change in fair value of these financial assets would affect profit or loss and equity. The carrying values of the University’s AFS Financial Assets and the amounts of fair value changes recognized during the years on those assets are disclosed in Note 10. On the other hand, the carrying value of the cross-currency swap is disclosed in Note 9 while fair value gains or losses on cross-currency swap agreements are presented as Fair value gain or loss on financial asset at FVTPL under Finance Income or Finance Costs in the statement of profit or loss [see Note 2.4(a)].
(c) Estimating Useful Lives of Investment Properties and Property and Equipment
The University estimates the useful lives of investment properties and property and equipment based on the period over which the assets are expected to be available for use. The estimated useful lives of these assets are reviewed periodically and are updated if expectations differ from previous estimates due to physical wear and tear, technical or commercial obsolescence and legal or other limits on the use of the assets.
The carrying amounts of investment properties and property and equipment are presented in Notes 13 and 14, respectively. Based on management’s assessment as at May 31, 2018, 2017 and 2016, there is no change in the estimated useful lives of the assets during those periods. Actual results, however, may vary due to changes in factors mentioned above.
- 25 -
(d) Determining Fair Value of Investment Properties
Investment property is measured using the cost model. The fair value disclosed in Note 13 is determined by the University based on the appraisal report prepared by independent appraisers using the relevant valuation methodology as discussed in Note 6.4. For investment properties with appraisal conducted prior to the end of the current reporting period, management determines whether there are significant circumstances during the intervening period that may require adjustments or changes in the disclosure of fair value of those properties. A significant change in these elements may affect the prices and the value of the assets. As of May 31, 2018, 2017 and 2016 the University determined that there were no significant circumstances that may affect the fair value determination of investment properties.
(e) Estimating Impairment of Non-financial Assets
The University’s policy on estimating the impairment of non-financial assets is discussed in detail in Note 2.14. Though management believes that the assumptions used in the estimation of recoverable amounts are appropriate and reasonable, significant changes in these assumptions may materially affect the assessment of recoverable values and any resulting impairment loss could have a material adverse effect on the results of operations. Based on management assessment, no impairment loss is required to be recognized on the University’s investment properties, property and equipment, and investments in subsidiaries and an associate as of May 31, 2018, 2017 and 2016.
(f) Determining Recoverable Amount of Deferred Tax Assets
The University reviews its deferred tax assets at the end of each reporting period and reduces the carrying amount to the extent that it is no longer probable that sufficient taxable profit will be available to allow all or part of the deferred tax assets to be utilized. Management assessed that the deferred tax assets recognized as at May 31, 2018, 2017 and 2016 are fully recoverable because those will be fully utilized in the coming years. The carrying value of deferred tax assets as of those dates is disclosed in Note 22.
4. RISK MANAGEMENT OBJECTIVES AND POLICIES
The University is exposed to certain financial risks in relation to financial instruments. Its main purpose for its dealings in financial instruments is to fund operational and capital expenditures. The BOT has overall responsibility for the establishment and oversight of the University’s risk management framework. It has a risk management committee headed by an independent trustee that is responsible for developing and monitoring the University’s policies, which address risk management areas. Management is responsible for monitoring compliance with the University’s risk management policies and procedures and for reviewing the adequacy of these policies in relation to the risks faced by the University. The University does not engage in trading of financial assets for speculative purposes nor does it write options. The most significant financial risks to which the University is exposed to are described in the succeeding pages.
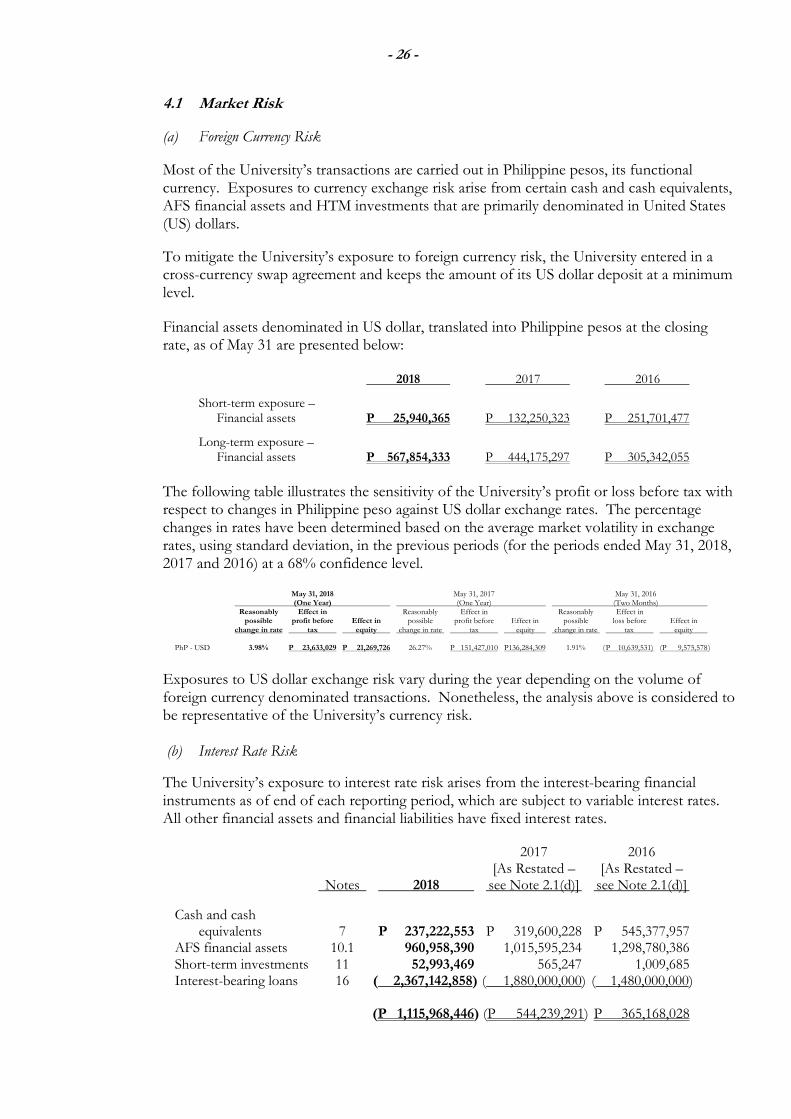
- 26 -
4.1 Market Risk
(a) Foreign Currency Risk
Most of the University’s transactions are carried out in Philippine pesos, its functional currency. Exposures to currency exchange risk arise from certain cash and cash equivalents, AFS financial assets and HTM investments that are primarily denominated in United States (US) dollars.
To mitigate the University’s exposure to foreign currency risk, the University entered in a cross-currency swap agreement and keeps the amount of its US dollar deposit at a minimum level.
Financial assets denominated in US dollar, translated into Philippine pesos at the closing rate, as of May 31 are presented below:
2018 2017 2016
Short-term exposure – Financial assets P 25,940,365 P 132,250,323 P 251,701,477
Long-term exposure – Financial assets P 567,854,333 P 444,175,297 P 305,342,055
The following table illustrates the sensitivity of the University’s profit or loss before tax with respect to changes in Philippine peso against US dollar exchange rates. The percentage changes in rates have been determined based on the average market volatility in exchange rates, using standard deviation, in the previous periods (for the periods ended May 31, 2018, 2017 and 2016) at a 68% confidence level.
May 31, 2018 May 31, 2017 May 31, 2016 (One Year) (One Year) (Two Months) Reasonably Effect in Reasonably Effect in Reasonably Effect in possible profit before Effect in possible profit before Effect in possible loss before Effect in change in rate tax equity change in rate tax equity change in rate tax equity PhP - USD 3.98% P 23,633,029 P 21,269,726 26.27% P 151,427,010 P136,284,309 1.91% ( P 10,639,531) (P 9,575,578 )
Exposures to US dollar exchange risk vary during the year depending on the volume of foreign currency denominated transactions. Nonetheless, the analysis above is considered to be representative of the University’s currency risk. (b) Interest Rate Risk
The University’s exposure to interest rate risk arises from the interest-bearing financial instruments as of end of each reporting period, which are subject to variable interest rates. All other financial assets and financial liabilities have fixed interest rates.
2017 2016 [As Restated – [As Restated – Notes 2018 see Note 2.1(d)] see Note 2.1(d)]
Cash and cash equivalents 7 P 237,222,553 P 319,600,228 P 545,377,957 AFS financial assets 10.1 960,958,390 1,015,595,234 1,298,780,386 Short-term investments 11 52,993,469 565,247 1,009,685 Interest-bearing loans 16 ( 2,367,142,858) ( 1,880,000,000) ( 1,480,000,000) ( P 1,115,968,446) (P 544,239,291) P 365,168,028
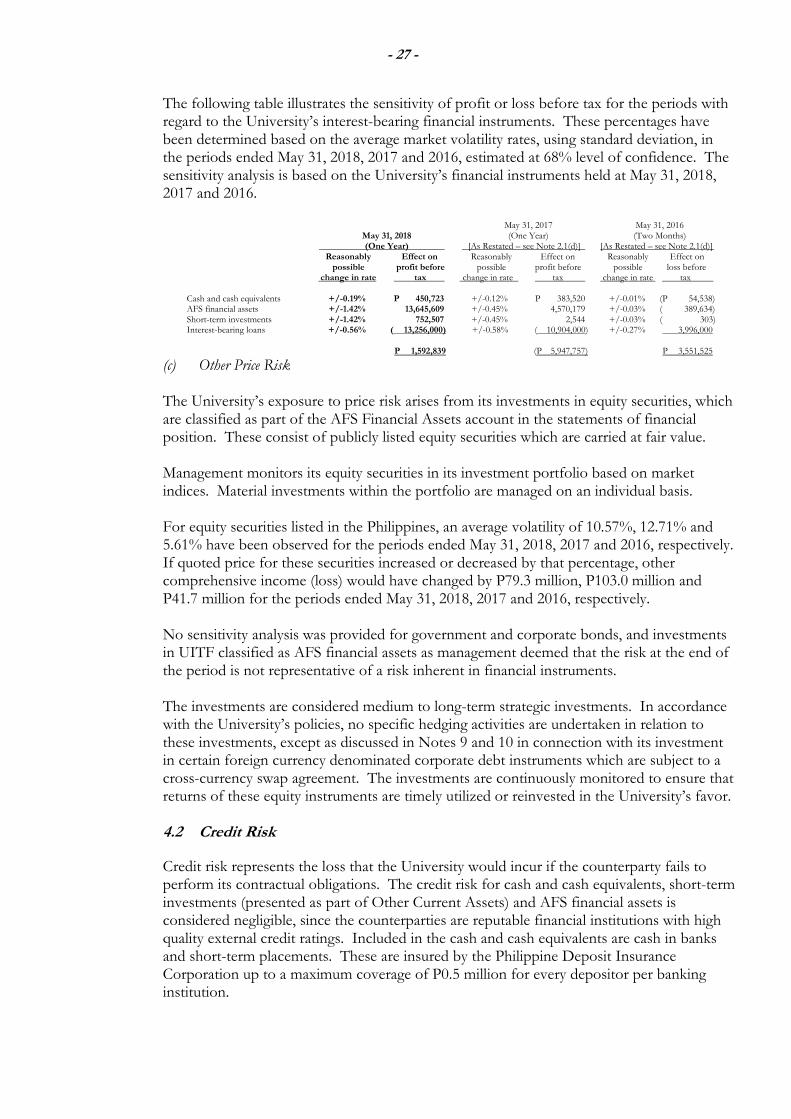
- 27 -
The following table illustrates the sensitivity of profit or loss before tax for the periods with regard to the University’s interest-bearing financial instruments. These percentages have been determined based on the average market volatility rates, using standard deviation, in the periods ended May 31, 2018, 2017 and 2016, estimated at 68% level of confidence. The sensitivity analysis is based on the University’s financial instruments held at May 31, 2018, 2017 and 2016.
May 31, 2017 May 31, 2016 May 31, 2018 (One Year) (Two Months) (One Year) [As Restated – see Note 2.1(d)] [As Restated – see Note 2.1(d)] Reasonably Effect on Reasonably Effect on Reasonably Effect on possible profit before possible profit before possible loss before change in rate tax change in rate tax change in rate tax Cash and cash equivalents +/-0.19% P 450,723 +/-0.12% P 383,520 +/-0.01% (P 54,538) AFS financial assets +/-1.42% 13,645,609 +/-0.45% 4,570,179 +/-0.03% ( 389,634) Short-term investments +/-1.42% 752,507 +/-0.45% 2,544 +/-0.03% ( 303) Interest-bearing loans +/-0.56% ( 13,256,000) +/-0.58% ( 10,904,000) +/-0.27% 3,996,000 P 1,592,839 (P 5,947,757) P 3,551,525
(c) Other Price Risk The University’s exposure to price risk arises from its investments in equity securities, which are classified as part of the AFS Financial Assets account in the statements of financial position. These consist of publicly listed equity securities which are carried at fair value.
Management monitors its equity securities in its investment portfolio based on market indices. Material investments within the portfolio are managed on an individual basis.
For equity securities listed in the Philippines, an average volatility of 10.57%, 12.71% and 5.61% have been observed for the periods ended May 31, 2018, 2017 and 2016, respectively. If quoted price for these securities increased or decreased by that percentage, other comprehensive income (loss) would have changed by P79.3 million, P103.0 million and P41.7 million for the periods ended May 31, 2018, 2017 and 2016, respectively.
No sensitivity analysis was provided for government and corporate bonds, and investments in UITF classified as AFS financial assets as management deemed that the risk at the end of the period is not representative of a risk inherent in financial instruments.
The investments are considered medium to long-term strategic investments. In accordance with the University’s policies, no specific hedging activities are undertaken in relation to these investments, except as discussed in Notes 9 and 10 in connection with its investment in certain foreign currency denominated corporate debt instruments which are subject to a cross-currency swap agreement. The investments are continuously monitored to ensure that returns of these equity instruments are timely utilized or reinvested in the University’s favor.
4.2 Credit Risk
Credit risk represents the loss that the University would incur if the counterparty fails to perform its contractual obligations. The credit risk for cash and cash equivalents, short-term investments (presented as part of Other Current Assets) and AFS financial assets is considered negligible, since the counterparties are reputable financial institutions with high quality external credit ratings. Included in the cash and cash equivalents are cash in banks and short-term placements. These are insured by the Philippine Deposit Insurance Corporation up to a maximum coverage of P0.5 million for every depositor per banking institution.
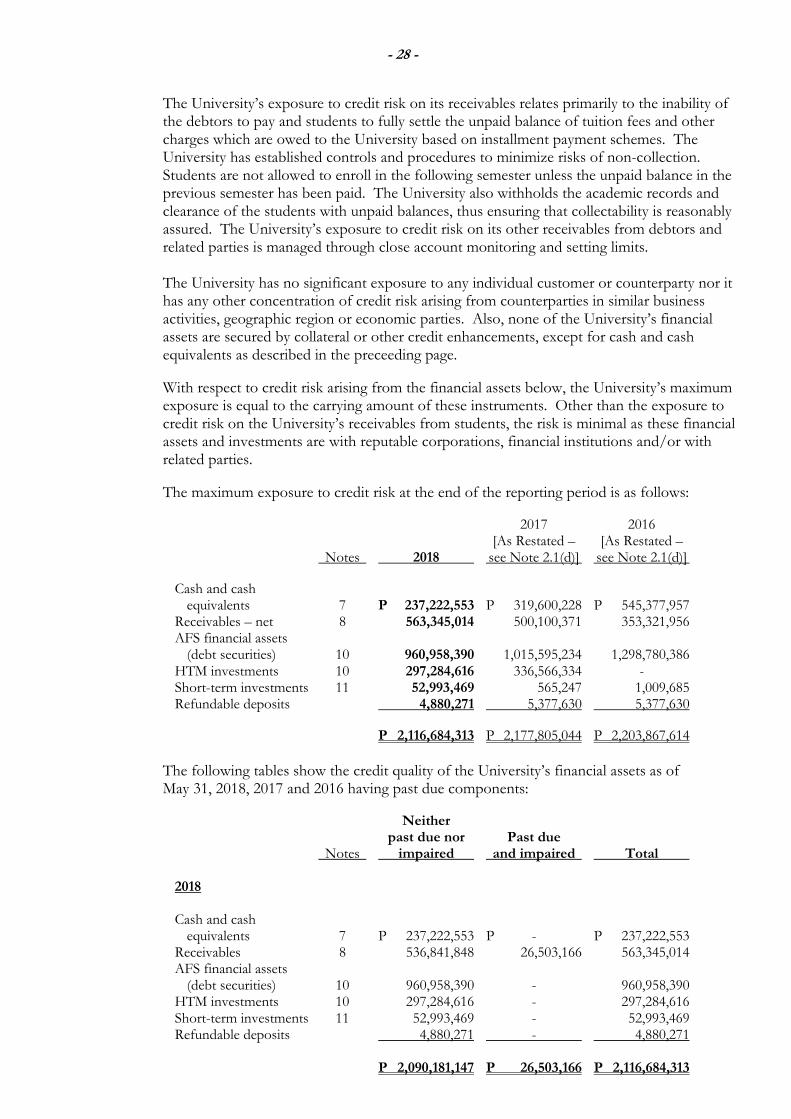
- 28 -
The University’s exposure to credit risk on its receivables relates primarily to the inability of the debtors to pay and students to fully settle the unpaid balance of tuition fees and other charges which are owed to the University based on installment payment schemes. The University has established controls and procedures to minimize risks of non-collection. Students are not allowed to enroll in the following semester unless the unpaid balance in the previous semester has been paid. The University also withholds the academic records and clearance of the students with unpaid balances, thus ensuring that collectability is reasonably assured. The University’s exposure to credit risk on its other receivables from debtors and related parties is managed through close account monitoring and setting limits. The University has no significant exposure to any individual customer or counterparty nor it has any other concentration of credit risk arising from counterparties in similar business activities, geographic region or economic parties. Also, none of the University’s financial assets are secured by collateral or other credit enhancements, except for cash and cash equivalents as described in the preceeding page.
With respect to credit risk arising from the financial assets below, the University’s maximum exposure is equal to the carrying amount of these instruments. Other than the exposure to credit risk on the University’s receivables from students, the risk is minimal as these financial assets and investments are with reputable corporations, financial institutions and/or with related parties.
The maximum exposure to credit risk at the end of the reporting period is as follows:
2017 2016 [As Restated – [As Restated – Notes 2018 see Note 2.1(d)] see Note 2.1(d)]
Cash and cash equivalents 7 P 237,222,553 P 319,600,228 P 545,377,957 Receivables – net 8 563,345,014 500,100,371 353,321,956 AFS financial assets (debt securities) 10 960,958,390 1,015,595,234 1,298,780,386 HTM investments 10 297,284,616 336,566,334 - Short-term investments 11 52,993,469 565,247 1,009,685 Refundable deposits 4,880,271 5,377,630 5,377,630
P 2,116,684,313 P 2,177,805,044 P 2,203,867,614
The following tables show the credit quality of the University’s financial assets as of May 31, 2018, 2017 and 2016 having past due components:
Neither past due nor Past due Notes impaired and impaired Total
2018
Cash and cash equivalents 7 P 237,222,553 P - P 237,222,553 Receivables 8 536,841,848 26,503,166 563,345,014 AFS financial assets (debt securities) 10 960,958,390 - 960,958,390 HTM investments 10 297,284,616 - 297,284,616 Short-term investments 11 52,993,469 - 52,993,469 Refundable deposits 4,880,271 - 4,880,271 P 2,090,181,147 P 26,503,166 P 2,116,684,313
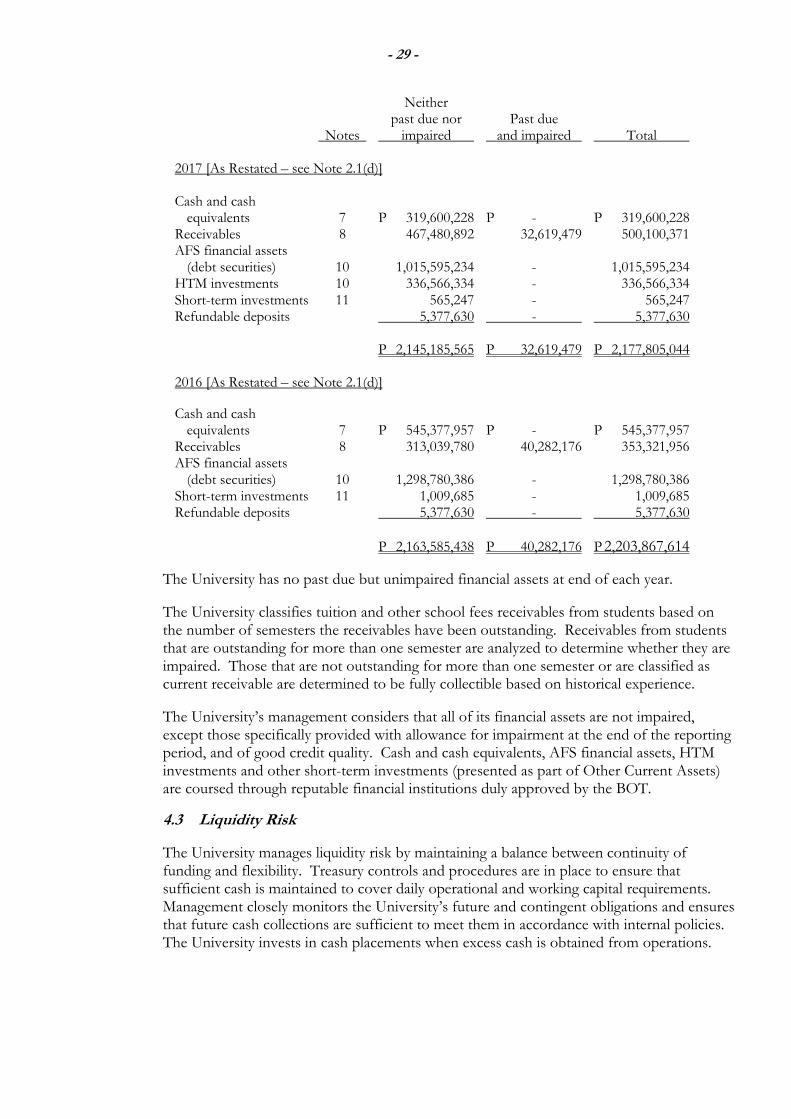
- 29 -
Neither past due nor Past due Notes impaired and impaired Total
2017 [As Restated – see Note 2.1(d)]
Cash and cash equivalents 7 P 319,600,228 P - P 319,600,228 Receivables 8 467,480,892 32,619,479 500,100,371 AFS financial assets (debt securities) 10 1,015,595,234 - 1,015,595,234 HTM investments 10 336,566,334 - 336,566,334 Short-term investments 11 565,247 - 565,247 Refundable deposits 5,377,630 - 5,377,630 P 2,145,185,565 P 32,619,479 P 2,177,805,044
2016 [As Restated – see Note 2.1(d)]
Cash and cash equivalents 7 P 545,377,957 P - P 545,377,957 Receivables 8 313,039,780 40,282,176 353,321,956 AFS financial assets (debt securities) 10 1,298,780,386 - 1,298,780,386 Short-term investments 11 1,009,685 - 1,009,685 Refundable deposits 5,377,630 - 5,377,630
P 2,163,585,438 P 40,282,176 P 2,203,867,614
The University has no past due but unimpaired financial assets at end of each year.
The University classifies tuition and other school fees receivables from students based on the number of semesters the receivables have been outstanding. Receivables from students that are outstanding for more than one semester are analyzed to determine whether they are impaired. Those that are not outstanding for more than one semester or are classified as current receivable are determined to be fully collectible based on historical experience.
The University’s management considers that all of its financial assets are not impaired, except those specifically provided with allowance for impairment at the end of the reporting period, and of good credit quality. Cash and cash equivalents, AFS financial assets, HTM investments and other short-term investments (presented as part of Other Current Assets) are coursed through reputable financial institutions duly approved by the BOT.
4.3 Liquidity Risk
The University manages liquidity risk by maintaining a balance between continuity of funding and flexibility. Treasury controls and procedures are in place to ensure that sufficient cash is maintained to cover daily operational and working capital requirements. Management closely monitors the University’s future and contingent obligations and ensures that future cash collections are sufficient to meet them in accordance with internal policies. The University invests in cash placements when excess cash is obtained from operations.
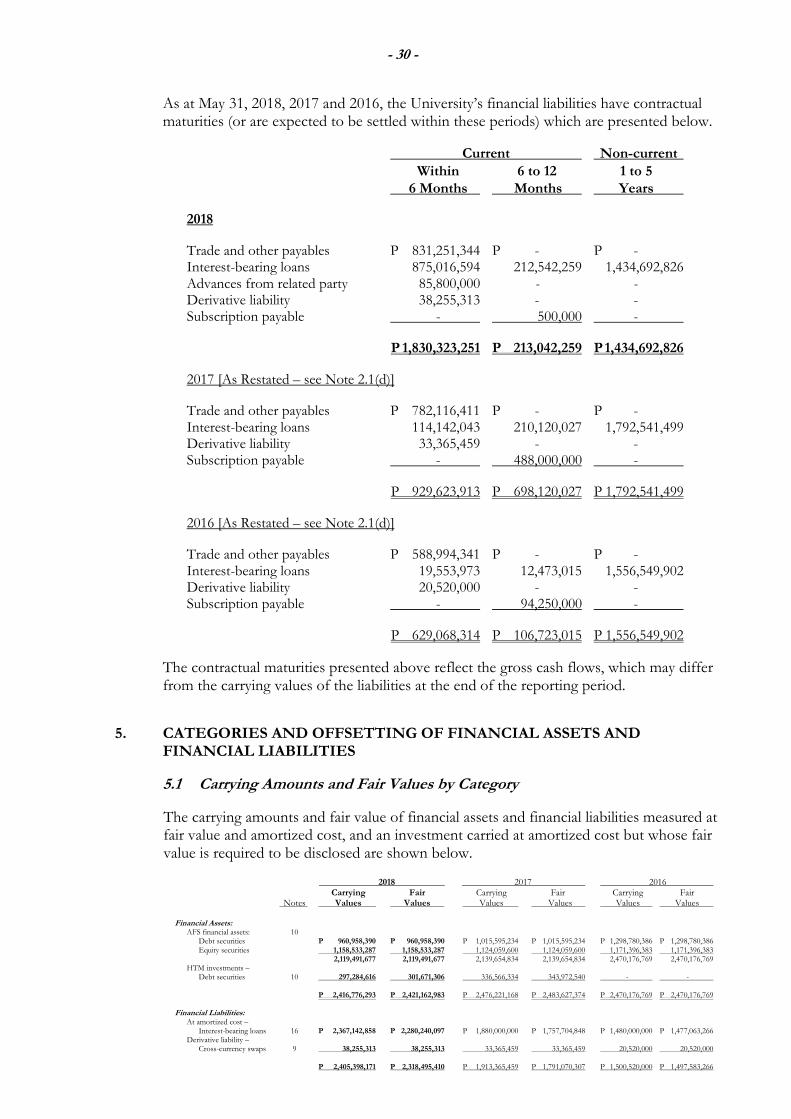
- 30 -
As at May 31, 2018, 2017 and 2016, the University’s financial liabilities have contractual maturities (or are expected to be settled within these periods) which are presented below. Current Non-current
Within 6 to 12 1 to 5 6 Months Months Years
2018
Trade and other payables P 831,251,344 P - P - Interest-bearing loans 875,016,594 212,542,259 1,434,692,826 Advances from related party 85,800,000 - - Derivative liability 38,255,313 - - Subscription payable - 500,000 -
P 1,830,323,251 P 213,042,259 P 1,434,692,826
2017 [As Restated – see Note 2.1(d)]
Trade and other payables P 782,116,411 P - P - Interest-bearing loans 114,142,043 210,120,027 1,792,541,499 Derivative liability 33,365,459 - - Subscription payable - 488,000,000 -
P 929,623,913 P 698,120,027 P 1,792,541,499
2016 [As Restated – see Note 2.1(d)]
Trade and other payables P 588,994,341 P - P - Interest-bearing loans 19,553,973 12,473,015 1,556,549,902 Derivative liability 20,520,000 - - Subscription payable - 94,250,000 -
P 629,068,314 P 106,723,015 P 1,556,549,902
The contractual maturities presented above reflect the gross cash flows, which may differ from the carrying values of the liabilities at the end of the reporting period.
5. CATEGORIES AND OFFSETTING OF FINANCIAL ASSETS AND FINANCIAL LIABILITIES
5.1 Carrying Amounts and Fair Values by Category
The carrying amounts and fair value of financial assets and financial liabilities measured at fair value and amortized cost, and an investment carried at amortized cost but whose fair value is required to be disclosed are shown below.
2018 2017 2016 Carrying Fair Carrying Fair Carrying Fair Notes Values Values Values Values Values Values Financial Assets: AFS financial assets: 10 Debt securities P 960,958,390 P 960,958,390 P 1,015,595,234 P 1,015,595,234 P 1,298,780,386 P 1,298,780,386 Equity securities 1,158,533,287 1,158,533,287 1,124,059,600 1,124,059,600 1,171,396,383 1,171,396,383 2,119,491,677 2,119,491,677 2,139,654,834 2,139,654,834 2,470,176,769 2,470,176,769 HTM investments – Debt securities 10 297,284,616 301,671,306 336,566,334 343,972,540 - - P 2,416,776,293 P 2,421,162,983 P 2,476,221,168 P 2,483,627,374 P 2,470,176,769 P 2,470,176,769 Financial Liabilities: At amortized cost –
Interest-bearing loans 16 P 2,367,142,858 P 2,280,240,097 P 1,880,000,000 P 1,757,704,848 P 1,480,000,000 P 1,477,063,266 Derivative liability –
Cross-currency swaps 9 38,255,313 38,255,313 33,365,459 33,365,459 20,520,000 20,520,000 P 2,405,398,171 P 2,318,495,410 P 1,913,365,459 P 1,791,070,307 P 1,500,520,000 P 1,497,583,266
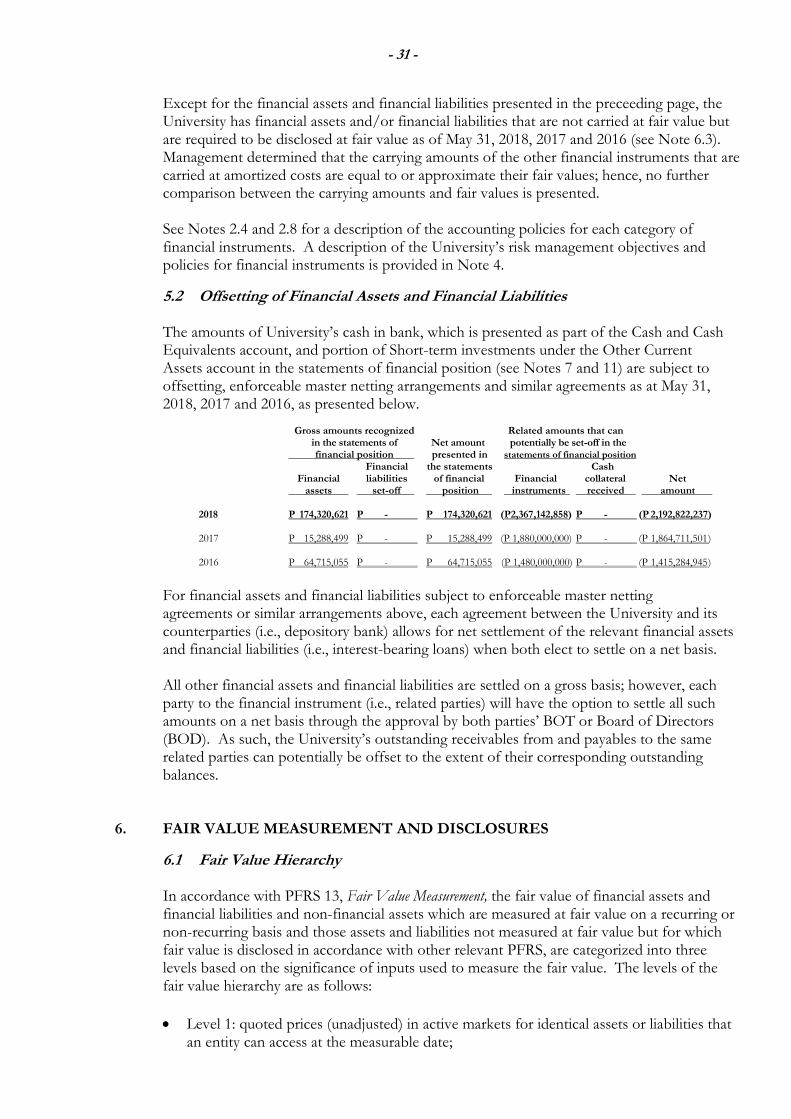
- 31 -
Except for the financial assets and financial liabilities presented in the preceeding page, the University has financial assets and/or financial liabilities that are not carried at fair value but are required to be disclosed at fair value as of May 31, 2018, 2017 and 2016 (see Note 6.3). Management determined that the carrying amounts of the other financial instruments that are carried at amortized costs are equal to or approximate their fair values; hence, no further comparison between the carrying amounts and fair values is presented.
See Notes 2.4 and 2.8 for a description of the accounting policies for each category of financial instruments. A description of the University’s risk management objectives and policies for financial instruments is provided in Note 4.
5.2 Offsetting of Financial Assets and Financial Liabilities The amounts of University’s cash in bank, which is presented as part of the Cash and Cash Equivalents account, and portion of Short-term investments under the Other Current Assets account in the statements of financial position (see Notes 7 and 11) are subject to offsetting, enforceable master netting arrangements and similar agreements as at May 31, 2018, 2017 and 2016, as presented below.
Gross amounts recognized Related amounts that can
in the statements of Net amount potentially be set-off in the financial position presented in statements of financial position Financial the statements Cash Financial liabilities of financial Financial collateral Net assets set-off position instruments received amount 2018 P 174,320,621 P - P 174,320,621 (P2,367,142,858) P - (P 2,192,822,237) 2017 P 15,288,499 P - P 15,288,499 (P 1,880,000,000) P - (P 1,864,711,501 ) 2016 P 64,715,055 P - P 64,715,055 (P 1,480,000,000) P - (P 1,415,284,945 )
For financial assets and financial liabilities subject to enforceable master netting agreements or similar arrangements above, each agreement between the University and its counterparties (i.e., depository bank) allows for net settlement of the relevant financial assets and financial liabilities (i.e., interest-bearing loans) when both elect to settle on a net basis.
All other financial assets and financial liabilities are settled on a gross basis; however, each party to the financial instrument (i.e., related parties) will have the option to settle all such amounts on a net basis through the approval by both parties’ BOT or Board of Directors (BOD). As such, the University’s outstanding receivables from and payables to the same related parties can potentially be offset to the extent of their corresponding outstanding balances.
6. FAIR VALUE MEASUREMENT AND DISCLOSURES
6.1 Fair Value Hierarchy
In accordance with PFRS 13, Fair Value Measurement, the fair value of financial assets and financial liabilities and non-financial assets which are measured at fair value on a recurring or non-recurring basis and those assets and liabilities not measured at fair value but for which fair value is disclosed in accordance with other relevant PFRS, are categorized into three levels based on the significance of inputs used to measure the fair value. The levels of the fair value hierarchy are as follows:
• Level 1: quoted prices (unadjusted) in active markets for identical assets or liabilities that an entity can access at the measurable date;
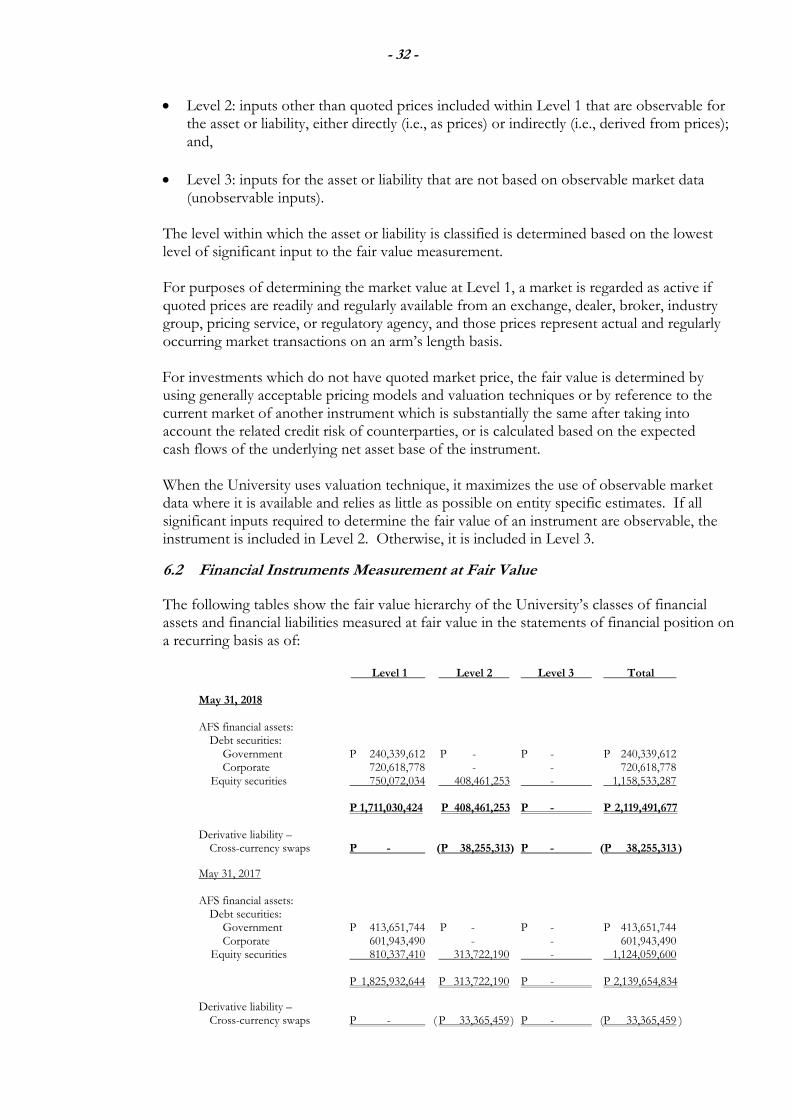
- 32 -
• Level 2: inputs other than quoted prices included within Level 1 that are observable for the asset or liability, either directly (i.e., as prices) or indirectly (i.e., derived from prices); and,
• Level 3: inputs for the asset or liability that are not based on observable market data (unobservable inputs).
The level within which the asset or liability is classified is determined based on the lowest level of significant input to the fair value measurement.
For purposes of determining the market value at Level 1, a market is regarded as active if quoted prices are readily and regularly available from an exchange, dealer, broker, industry group, pricing service, or regulatory agency, and those prices represent actual and regularly occurring market transactions on an arm’s length basis.
For investments which do not have quoted market price, the fair value is determined by using generally acceptable pricing models and valuation techniques or by reference to the current market of another instrument which is substantially the same after taking into account the related credit risk of counterparties, or is calculated based on the expected cash flows of the underlying net asset base of the instrument.
When the University uses valuation technique, it maximizes the use of observable market data where it is available and relies as little as possible on entity specific estimates. If all significant inputs required to determine the fair value of an instrument are observable, the instrument is included in Level 2. Otherwise, it is included in Level 3.
6.2 Financial Instruments Measurement at Fair Value
The following tables show the fair value hierarchy of the University’s classes of financial assets and financial liabilities measured at fair value in the statements of financial position on a recurring basis as of:
Level 1 Level 2 Level 3 Total May 31, 2018 AFS financial assets:
Debt securities: Government P 240,339,612 P - P - P 240,339,612 Corporate 720,618,778 - - 720,618,778 Equity securities 750,072,034 408,461,253 - 1,158,533,287
P 1,711,030,424 P 408,461,253 P - P 2,119,491,677
Derivative liability – Cross-currency swaps P - (P 38,255,313) P - (P 38,255,313 )
May 31, 2017 AFS financial assets:
Debt securities: Government P 413,651,744 P - P - P 413,651,744 Corporate 601,943,490 - - 601,943,490 Equity securities 810,337,410 313,722,190 - 1,124,059,600
P 1,825,932,644 P 313,722,190 P - P 2,139,654,834
Derivative liability – Cross-currency swaps P - ( P 33,365,459 ) P - (P 33,365,459 )
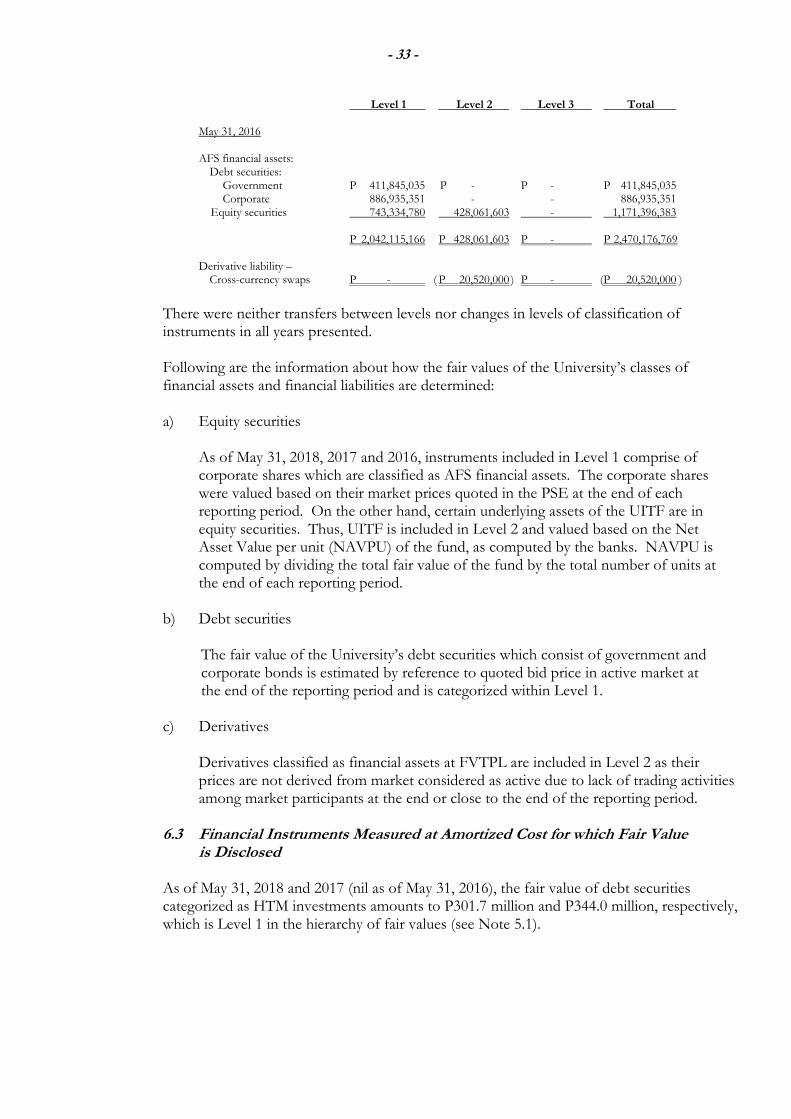
- 33 -
Level 1 Level 2 Level 3 Total May 31, 2016 AFS financial assets:
Debt securities: Government P 411,845,035 P - P - P 411,845,035 Corporate 886,935,351 - - 886,935,351 Equity securities 743,334,780 428,061,603 - 1,171,396,383
P 2,042,115,166 P 428,061,603 P - P 2,470,176,769
Derivative liability – Cross-currency swaps P - ( P 20,520,000 ) P - (P 20,520,000 )
There were neither transfers between levels nor changes in levels of classification of instruments in all years presented.
Following are the information about how the fair values of the University’s classes of financial assets and financial liabilities are determined: a) Equity securities
As of May 31, 2018, 2017 and 2016, instruments included in Level 1 comprise of corporate shares which are classified as AFS financial assets. The corporate shares were valued based on their market prices quoted in the PSE at the end of each reporting period. On the other hand, certain underlying assets of the UITF are in equity securities. Thus, UITF is included in Level 2 and valued based on the Net Asset Value per unit (NAVPU) of the fund, as computed by the banks. NAVPU is computed by dividing the total fair value of the fund by the total number of units at the end of each reporting period.
b) Debt securities
The fair value of the University’s debt securities which consist of government and corporate bonds is estimated by reference to quoted bid price in active market at the end of the reporting period and is categorized within Level 1.
c) Derivatives
Derivatives classified as financial assets at FVTPL are included in Level 2 as their prices are not derived from market considered as active due to lack of trading activities among market participants at the end or close to the end of the reporting period.
6.3 Financial Instruments Measured at Amortized Cost for which Fair Value is Disclosed As of May 31, 2018 and 2017 (nil as of May 31, 2016), the fair value of debt securities categorized as HTM investments amounts to P301.7 million and P344.0 million, respectively, which is Level 1 in the hierarchy of fair values (see Note 5.1).
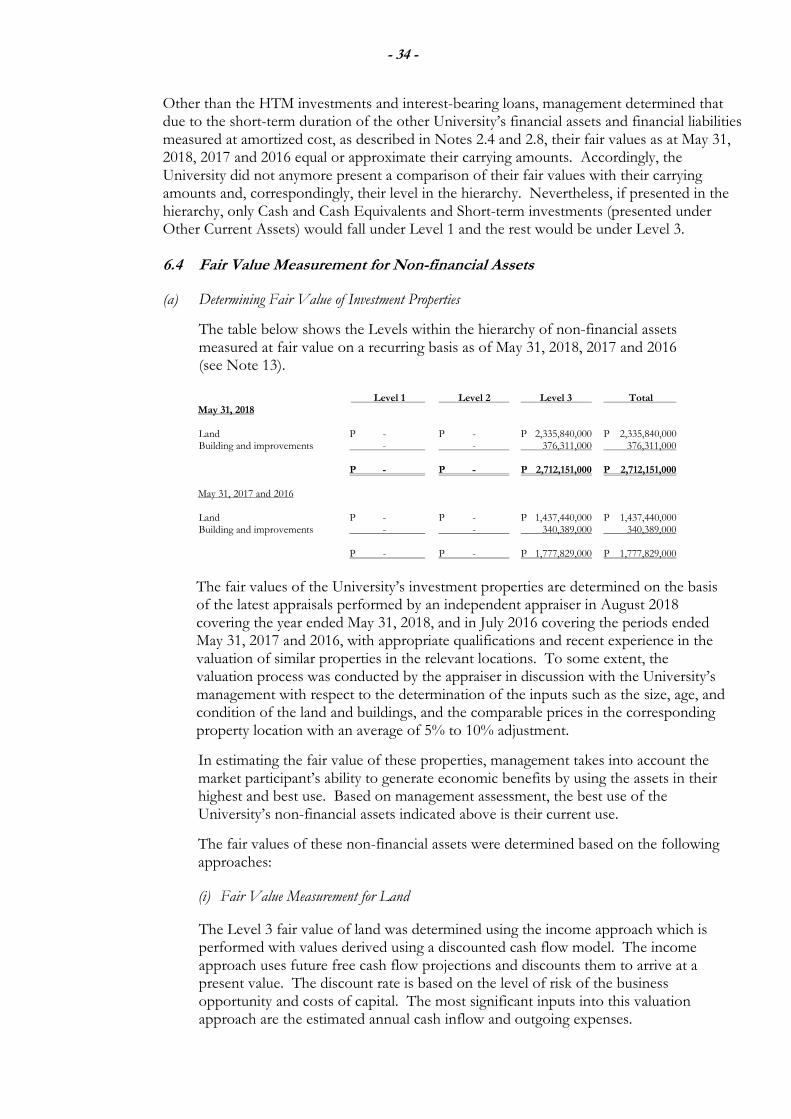
- 34 -
Other than the HTM investments and interest-bearing loans, management determined that due to the short-term duration of the other University’s financial assets and financial liabilities measured at amortized cost, as described in Notes 2.4 and 2.8, their fair values as at May 31, 2018, 2017 and 2016 equal or approximate their carrying amounts. Accordingly, the University did not anymore present a comparison of their fair values with their carrying amounts and, correspondingly, their level in the hierarchy. Nevertheless, if presented in the hierarchy, only Cash and Cash Equivalents and Short-term investments (presented under Other Current Assets) would fall under Level 1 and the rest would be under Level 3.
6.4 Fair Value Measurement for Non-financial Assets
(a) Determining Fair Value of Investment Properties
The table below shows the Levels within the hierarchy of non-financial assets measured at fair value on a recurring basis as of May 31, 2018, 2017 and 2016 (see Note 13).
Level 1 Level 2 Level 3 Total May 31, 2018 Land P - P - P 2,335,840,000 P 2,335,840,000 Building and improvements - - 376,311,000 376,311,000
P - P - P 2,712,151,000 P 2,712,151,000 May 31, 2017 and 2016
Land P - P - P 1,437,440,000 P 1,437,440,000 Building and improvements - - 340,389,000 340,389,000
P - P - P 1,777,829,000 P 1,777,829,000
The fair values of the University’s investment properties are determined on the basis of the latest appraisals performed by an independent appraiser in August 2018 covering the year ended May 31, 2018, and in July 2016 covering the periods ended May 31, 2017 and 2016, with appropriate qualifications and recent experience in the valuation of similar properties in the relevant locations. To some extent, the valuation process was conducted by the appraiser in discussion with the University’s management with respect to the determination of the inputs such as the size, age, and condition of the land and buildings, and the comparable prices in the corresponding property location with an average of 5% to 10% adjustment.
In estimating the fair value of these properties, management takes into account the market participant’s ability to generate economic benefits by using the assets in their highest and best use. Based on management assessment, the best use of the University’s non-financial assets indicated above is their current use.
The fair values of these non-financial assets were determined based on the following approaches: (i) Fair Value Measurement for Land
The Level 3 fair value of land was determined using the income approach which is performed with values derived using a discounted cash flow model. The income approach uses future free cash flow projections and discounts them to arrive at a present value. The discount rate is based on the level of risk of the business opportunity and costs of capital. The most significant inputs into this valuation approach are the estimated annual cash inflow and outgoing expenses.
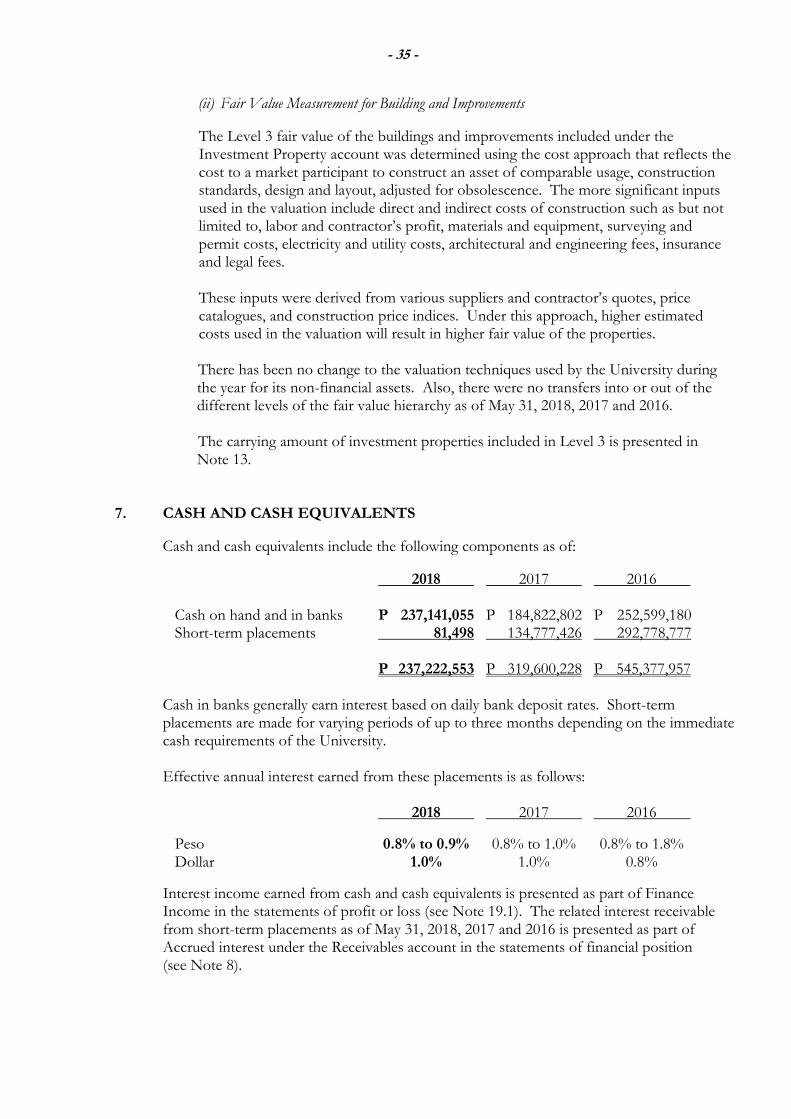
- 35 -
(ii) Fair Value Measurement for Building and Improvements
The Level 3 fair value of the buildings and improvements included under the Investment Property account was determined using the cost approach that reflects the cost to a market participant to construct an asset of comparable usage, construction standards, design and layout, adjusted for obsolescence. The more significant inputs used in the valuation include direct and indirect costs of construction such as but not limited to, labor and contractor’s profit, materials and equipment, surveying and permit costs, electricity and utility costs, architectural and engineering fees, insurance and legal fees. These inputs were derived from various suppliers and contractor’s quotes, price catalogues, and construction price indices. Under this approach, higher estimated costs used in the valuation will result in higher fair value of the properties.
There has been no change to the valuation techniques used by the University during the year for its non-financial assets. Also, there were no transfers into or out of the different levels of the fair value hierarchy as of May 31, 2018, 2017 and 2016. The carrying amount of investment properties included in Level 3 is presented in Note 13.
7. CASH AND CASH EQUIVALENTS
Cash and cash equivalents include the following components as of:
2018 2017 2016 Cash on hand and in banks P 237,141,055 P 184,822,802 P 252,599,180 Short-term placements 81,498 134,777,426 292,778,777 P 237,222,553 P 319,600,228 P 545,377,957
Cash in banks generally earn interest based on daily bank deposit rates. Short-term placements are made for varying periods of up to three months depending on the immediate cash requirements of the University. Effective annual interest earned from these placements is as follows:
2018 2017 2016
Peso 0.8% to 0.9% 0.8% to 1.0% 0.8% to 1.8% Dollar 1.0% 1.0% 0.8%
Interest income earned from cash and cash equivalents is presented as part of Finance Income in the statements of profit or loss (see Note 19.1). The related interest receivable from short-term placements as of May 31, 2018, 2017 and 2016 is presented as part of Accrued interest under the Receivables account in the statements of financial position (see Note 8).
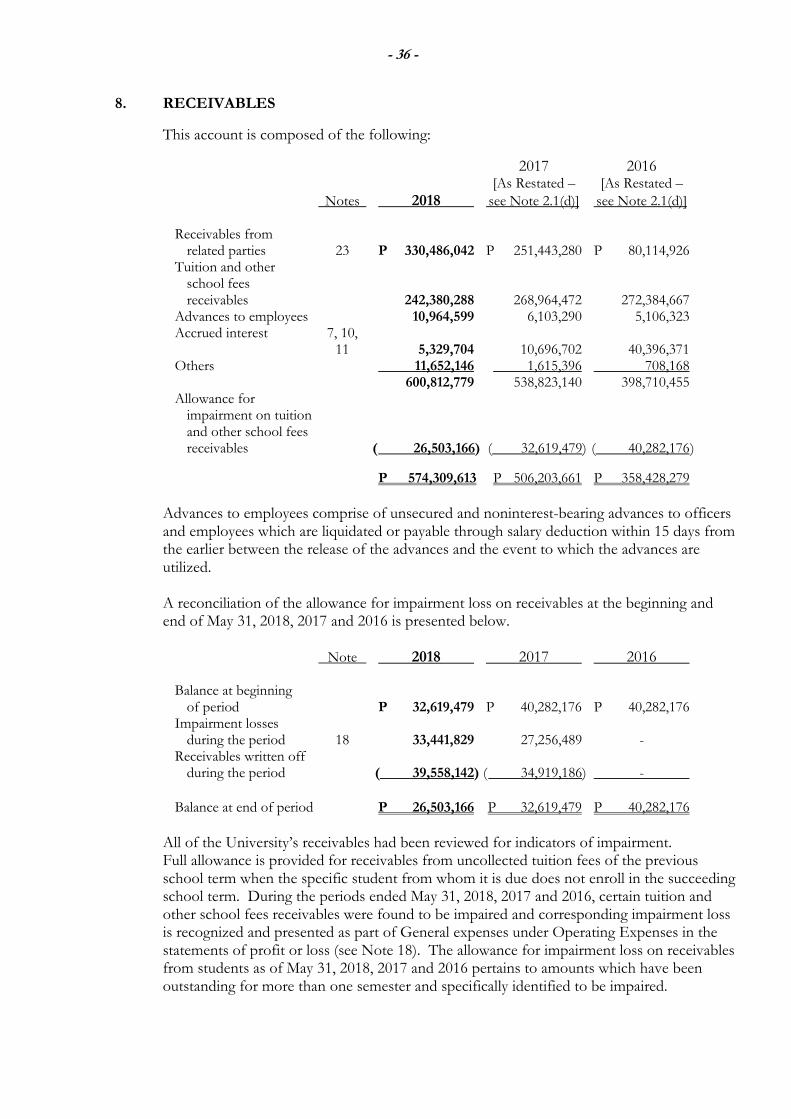
- 36 -
8. RECEIVABLES
This account is composed of the following:
2017 2016 [As Restated – [As Restated –
Notes 2018 see Note 2.1(d)] see Note 2.1(d)] Receivables from related parties 23 P 330,486,042 P 251,443,280 P 80,114,926 Tuition and other school fees receivables 242,380,288 268,964,472 272,384,667 Advances to employees 10,964,599 6,103,290 5,106,323 Accrued interest 7, 10, 11 5,329,704 10,696,702 40,396,371 Others 11,652,146 1,615,396 708,168 600,812,779 538,823,140 398,710,455 Allowance for impairment on tuition and other school fees receivables ( 26,503,166) ( 32,619,479) ( 40,282,176 )
P 574,309,613 P 506,203,661 P 358,428,279
Advances to employees comprise of unsecured and noninterest-bearing advances to officers and employees which are liquidated or payable through salary deduction within 15 days from the earlier between the release of the advances and the event to which the advances are utilized. A reconciliation of the allowance for impairment loss on receivables at the beginning and end of May 31, 2018, 2017 and 2016 is presented below.
Note 2018 2017 2016 Balance at beginning of period P 32,619,479 P 40,282,176 P 40,282,176 Impairment losses during the period 18 33,441,829 27,256,489 - Receivables written off during the period ( 39,558,142) ( 34,919,186) -
Balance at end of period P 26,503,166 P 32,619,479 P 40,282,176 All of the University’s receivables had been reviewed for indicators of impairment. Full allowance is provided for receivables from uncollected tuition fees of the previous school term when the specific student from whom it is due does not enroll in the succeeding school term. During the periods ended May 31, 2018, 2017 and 2016, certain tuition and other school fees receivables were found to be impaired and corresponding impairment loss is recognized and presented as part of General expenses under Operating Expenses in the statements of profit or loss (see Note 18). The allowance for impairment loss on receivables from students as of May 31, 2018, 2017 and 2016 pertains to amounts which have been outstanding for more than one semester and specifically identified to be impaired.
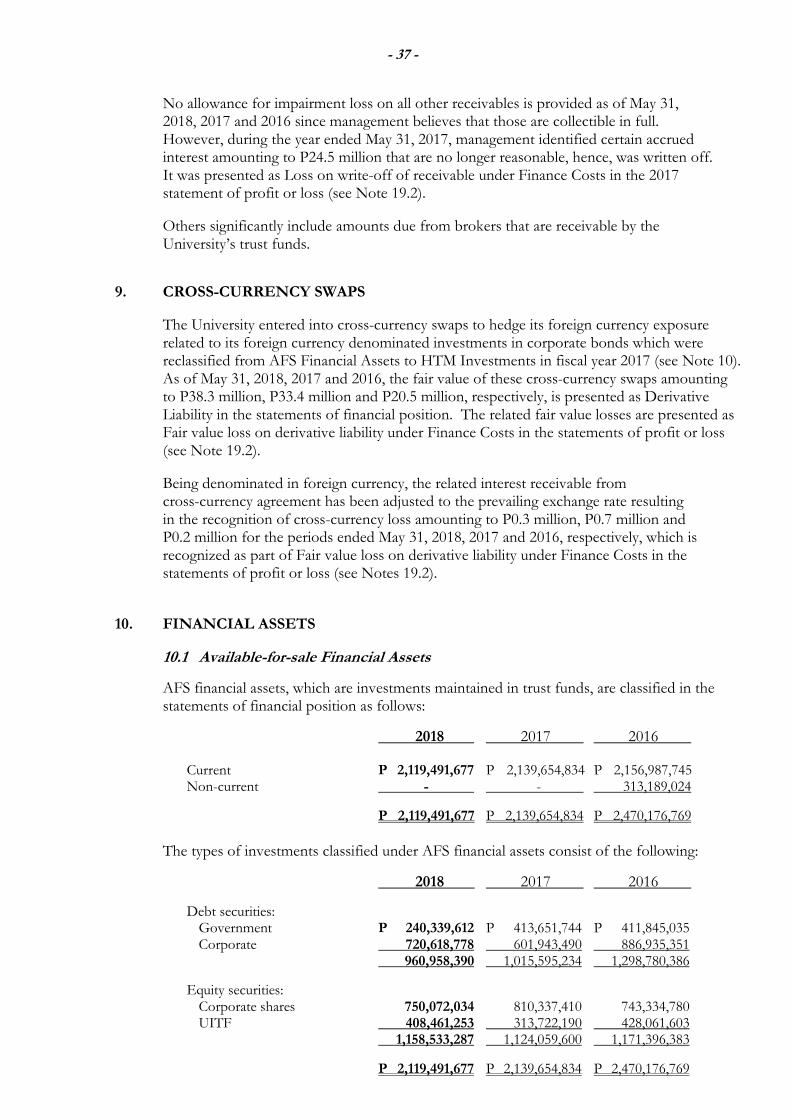
- 37 -
No allowance for impairment loss on all other receivables is provided as of May 31, 2018, 2017 and 2016 since management believes that those are collectible in full. However, during the year ended May 31, 2017, management identified certain accrued interest amounting to P24.5 million that are no longer reasonable, hence, was written off. It was presented as Loss on write-off of receivable under Finance Costs in the 2017 statement of profit or loss (see Note 19.2).
Others significantly include amounts due from brokers that are receivable by the University’s trust funds.
9. CROSS-CURRENCY SWAPS
The University entered into cross-currency swaps to hedge its foreign currency exposure related to its foreign currency denominated investments in corporate bonds which were reclassified from AFS Financial Assets to HTM Investments in fiscal year 2017 (see Note 10). As of May 31, 2018, 2017 and 2016, the fair value of these cross-currency swaps amounting to P38.3 million, P33.4 million and P20.5 million, respectively, is presented as Derivative Liability in the statements of financial position. The related fair value losses are presented as Fair value loss on derivative liability under Finance Costs in the statements of profit or loss (see Note 19.2).
Being denominated in foreign currency, the related interest receivable from cross-currency agreement has been adjusted to the prevailing exchange rate resulting in the recognition of cross-currency loss amounting to P0.3 million, P0.7 million and P0.2 million for the periods ended May 31, 2018, 2017 and 2016, respectively, which is recognized as part of Fair value loss on derivative liability under Finance Costs in the statements of profit or loss (see Notes 19.2).
10. FINANCIAL ASSETS
10.1 Available-for-sale Financial Assets
AFS financial assets, which are investments maintained in trust funds, are classified in the statements of financial position as follows:
2018 2017 2016 Current P 2,119,491,677 P 2,139,654,834 P 2,156,987,745 Non-current - - 313,189,024
P 2,119,491,677 P 2,139,654,834 P 2,470,176,769
The types of investments classified under AFS financial assets consist of the following:
2018 2017 2016
Debt securities: Government P 240,339,612 P 413,651,744 P 411,845,035 Corporate 720,618,778 601,943,490 886,935,351 960,958,390 1,015,595,234 1,298,780,386
Equity securities: Corporate shares 750,072,034 810,337,410 743,334,780 UITF 408,461,253 313,722,190 428,061,603 1,158,533,287 1,124,059,600 1,171,396,383
P 2,119,491,677 P 2,139,654,834 P 2,470,176,769
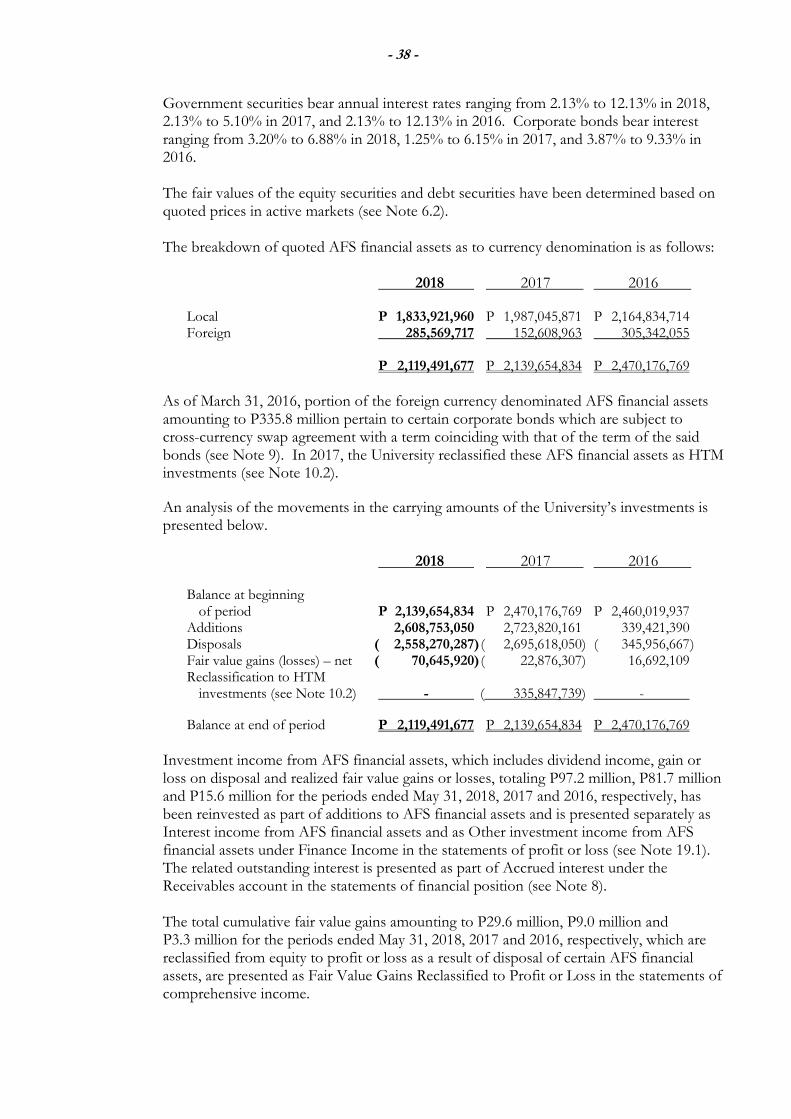
- 38 -
Government securities bear annual interest rates ranging from 2.13% to 12.13% in 2018, 2.13% to 5.10% in 2017, and 2.13% to 12.13% in 2016. Corporate bonds bear interest ranging from 3.20% to 6.88% in 2018, 1.25% to 6.15% in 2017, and 3.87% to 9.33% in 2016.
The fair values of the equity securities and debt securities have been determined based on quoted prices in active markets (see Note 6.2). The breakdown of quoted AFS financial assets as to currency denomination is as follows:
2018 2017 2016 Local P 1,833,921,960 P 1,987,045,871 P 2,164,834,714 Foreign 285,569,717 152,608,963 305,342,055
P 2,119,491,677 P 2,139,654,834 P 2,470,176,769
As of March 31, 2016, portion of the foreign currency denominated AFS financial assets amounting to P335.8 million pertain to certain corporate bonds which are subject to cross-currency swap agreement with a term coinciding with that of the term of the said bonds (see Note 9). In 2017, the University reclassified these AFS financial assets as HTM investments (see Note 10.2).
An analysis of the movements in the carrying amounts of the University’s investments is presented below.
2018 2017 2016 Balance at beginning of period P 2,139,654,834 P 2,470,176,769 P 2,460,019,937 Additions 2,608,753,050 2,723,820,161 339,421,390 Disposals ( 2,558,270,287) ( 2,695,618,050) ( 345,956,667 ) Fair value gains (losses) – net ( 70,645,920) ( 22,876,307) 16,692,109 Reclassification to HTM investments (see Note 10.2) - ( 335,847,739) -
Balance at end of period P 2,119,491,677 P 2,139,654,834 P 2,470,176,769
Investment income from AFS financial assets, which includes dividend income, gain or loss on disposal and realized fair value gains or losses, totaling P97.2 million, P81.7 million and P15.6 million for the periods ended May 31, 2018, 2017 and 2016, respectively, has been reinvested as part of additions to AFS financial assets and is presented separately as Interest income from AFS financial assets and as Other investment income from AFS financial assets under Finance Income in the statements of profit or loss (see Note 19.1). The related outstanding interest is presented as part of Accrued interest under the Receivables account in the statements of financial position (see Note 8). The total cumulative fair value gains amounting to P29.6 million, P9.0 million and P3.3 million for the periods ended May 31, 2018, 2017 and 2016, respectively, which are reclassified from equity to profit or loss as a result of disposal of certain AFS financial assets, are presented as Fair Value Gains Reclassified to Profit or Loss in the statements of comprehensive income.
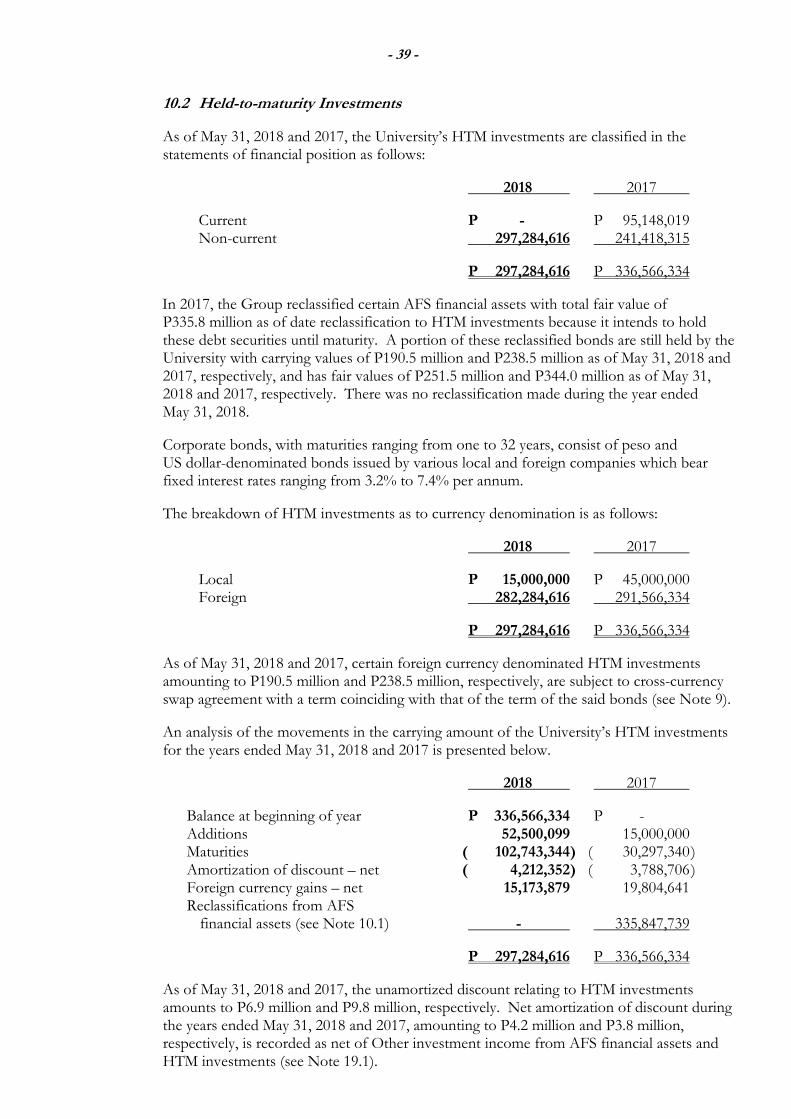
- 39 -
10.2 Held-to-maturity Investments
As of May 31, 2018 and 2017, the University’s HTM investments are classified in the statements of financial position as follows:
2018 2017
Current P - P 95,148,019 Non-current 297,284,616 241,418,315
P 297,284,616 P 336,566,334
In 2017, the Group reclassified certain AFS financial assets with total fair value of P335.8 million as of date reclassification to HTM investments because it intends to hold these debt securities until maturity. A portion of these reclassified bonds are still held by the University with carrying values of P190.5 million and P238.5 million as of May 31, 2018 and 2017, respectively, and has fair values of P251.5 million and P344.0 million as of May 31, 2018 and 2017, respectively. There was no reclassification made during the year ended May 31, 2018.
Corporate bonds, with maturities ranging from one to 32 years, consist of peso and US dollar-denominated bonds issued by various local and foreign companies which bear fixed interest rates ranging from 3.2% to 7.4% per annum.
The breakdown of HTM investments as to currency denomination is as follows:
2018 2017
Local P 15,000,000 P 45,000,000 Foreign 282,284,616 291,566,334
P 297,284,616 P 336,566,334
As of May 31, 2018 and 2017, certain foreign currency denominated HTM investments amounting to P190.5 million and P238.5 million, respectively, are subject to cross-currency swap agreement with a term coinciding with that of the term of the said bonds (see Note 9).
An analysis of the movements in the carrying amount of the University’s HTM investments for the years ended May 31, 2018 and 2017 is presented below.
2018 2017
Balance at beginning of year P 336,566,334 P - Additions 52,500,099 15,000,000 Maturities ( 102,743,344 ) ( 30,297,340 ) Amortization of discount – net ( 4,212,352 ) ( 3,788,706 ) Foreign currency gains – net 15,173,879 19,804,641 Reclassifications from AFS financial assets (see Note 10.1) - 335,847,739
P 297,284,616 P 336,566,334
As of May 31, 2018 and 2017, the unamortized discount relating to HTM investments amounts to P6.9 million and P9.8 million, respectively. Net amortization of discount during the years ended May 31, 2018 and 2017, amounting to P4.2 million and P3.8 million, respectively, is recorded as net of Other investment income from AFS financial assets and HTM investments (see Note 19.1).
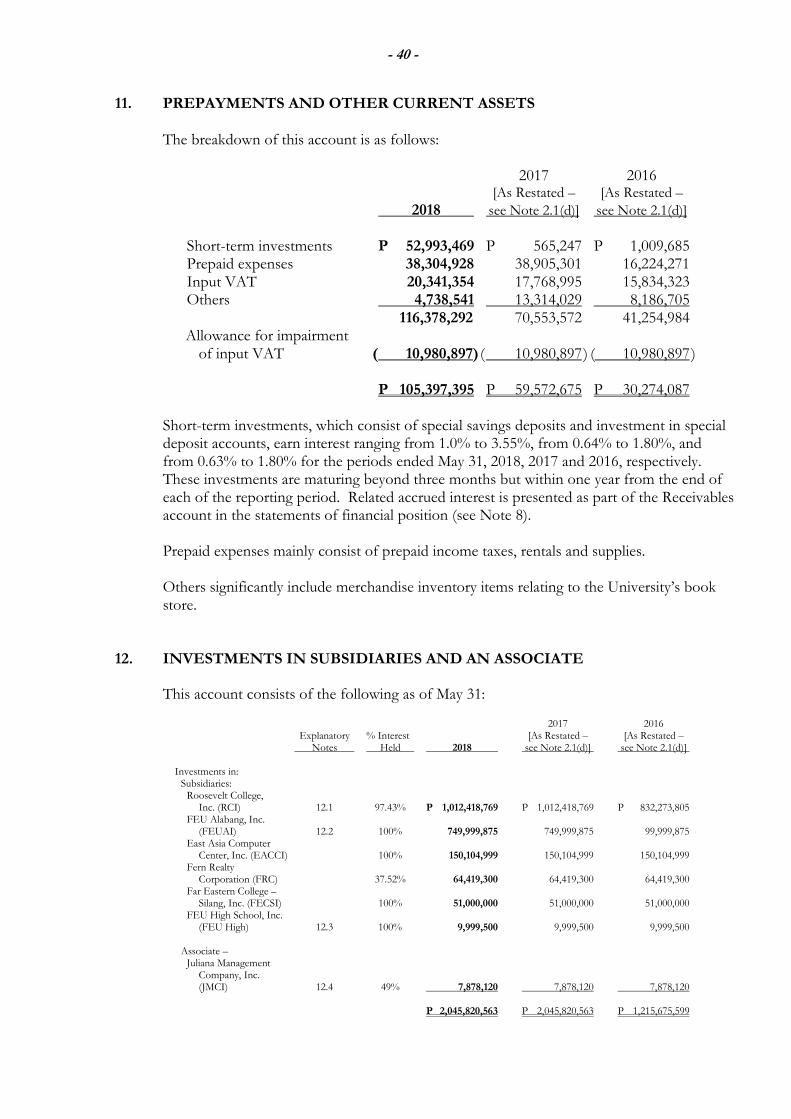
- 40 -
11. PREPAYMENTS AND OTHER CURRENT ASSETS
The breakdown of this account is as follows:
2017 2016 [As Restated – [As Restated –
2018 see Note 2.1(d)] see Note 2.1(d)]
Short-term investments P 52,993,469 P 565,247 P 1,009,685 Prepaid expenses 38,304,928 38,905,301 16,224,271 Input VAT 20,341,354 17,768,995 15,834,323 Others 4,738,541 13,314,029 8,186,705 116,378,292 70,553,572 41,254,984 Allowance for impairment of input VAT ( 10,980,897) ( 10,980,897 ) ( 10,980,897 ) P 105,397,395 P 59,572,675 P 30,274,087 Short-term investments, which consist of special savings deposits and investment in special deposit accounts, earn interest ranging from 1.0% to 3.55%, from 0.64% to 1.80%, and from 0.63% to 1.80% for the periods ended May 31, 2018, 2017 and 2016, respectively. These investments are maturing beyond three months but within one year from the end of each of the reporting period. Related accrued interest is presented as part of the Receivables account in the statements of financial position (see Note 8). Prepaid expenses mainly consist of prepaid income taxes, rentals and supplies. Others significantly include merchandise inventory items relating to the University’s book store.
12. INVESTMENTS IN SUBSIDIARIES AND AN ASSOCIATE
This account consists of the following as of May 31:
2017 2016 Explanatory % Interest [As Restated – [As Restated – Notes Held 2018 see Note 2.1(d)] see Note 2.1(d)]
Investments in: Subsidiaries: Roosevelt College, Inc. (RCI) 12.1 97.43% P 1,012,418,769 P 1,012,418,769 P 832,273,805 FEU Alabang, Inc. (FEUAI) 12.2 100% 749,999,875 749,999,875 99,999,875 East Asia Computer Center, Inc. (EACCI) 100% 150,104,999 150,104,999 150,104,999 Fern Realty Corporation (FRC) 37.52% 64,419,300 64,419,300 64,419,300 Far Eastern College – Silang, Inc. (FECSI) 100% 51,000,000 51,000,000 51,000,000 FEU High School, Inc. (FEU High) 12.3 100% 9,999,500 9,999,500 9,999,500 Associate – Juliana Management Company, Inc. (JMCI) 12.4 49% 7,878,120 7,878,120 7,878,120 P 2,045,820,563 P 2,045,820,563 P 1,215,675,599
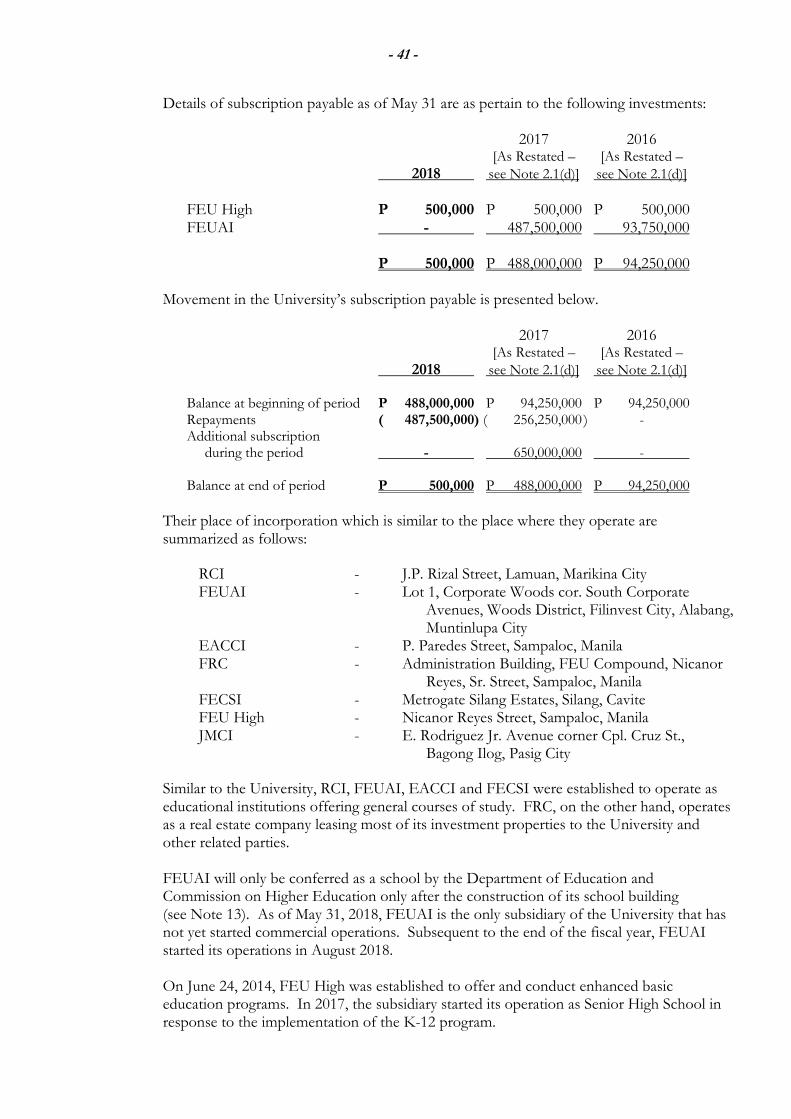
- 41 -
Details of subscription payable as of May 31 are as pertain to the following investments:
2017 2016 [As Restated – [As Restated – 2018 see Note 2.1(d)] see Note 2.1(d)]
FEU High P 500,000 P 500,000 P 500,000 FEUAI - 487,500,000 93,750,000 P 500,000 P 488,000,000 P 94,250,000 Movement in the University’s subscription payable is presented below. 2017 2016 [As Restated – [As Restated – 2018 see Note 2.1(d)] see Note 2.1(d)]
Balance at beginning of period P 488,000,000 P 94,250,000 P 94,250,000 Repayments ( 487,500,000) ( 256,250,000 ) - Additional subscription during the period - 650,000,000 - Balance at end of period P 500,000 P 488,000,000 P 94,250,000
Their place of incorporation which is similar to the place where they operate are summarized as follows:
RCI - J.P. Rizal Street, Lamuan, Marikina City FEUAI - Lot 1, Corporate Woods cor. South Corporate
Avenues, Woods District, Filinvest City, Alabang, Muntinlupa City
EACCI - P. Paredes Street, Sampaloc, Manila FRC - Administration Building, FEU Compound, Nicanor
Reyes, Sr. Street, Sampaloc, Manila FECSI - Metrogate Silang Estates, Silang, Cavite FEU High - Nicanor Reyes Street, Sampaloc, Manila
JMCI - E. Rodriguez Jr. Avenue corner Cpl. Cruz St., Bagong Ilog, Pasig City
Similar to the University, RCI, FEUAI, EACCI and FECSI were established to operate as educational institutions offering general courses of study. FRC, on the other hand, operates as a real estate company leasing most of its investment properties to the University and other related parties. FEUAI will only be conferred as a school by the Department of Education and Commission on Higher Education only after the construction of its school building (see Note 13). As of May 31, 2018, FEUAI is the only subsidiary of the University that has not yet started commercial operations. Subsequent to the end of the fiscal year, FEUAI started its operations in August 2018.
On June 24, 2014, FEU High was established to offer and conduct enhanced basic education programs. In 2017, the subsidiary started its operation as Senior High School in response to the implementation of the K-12 program.
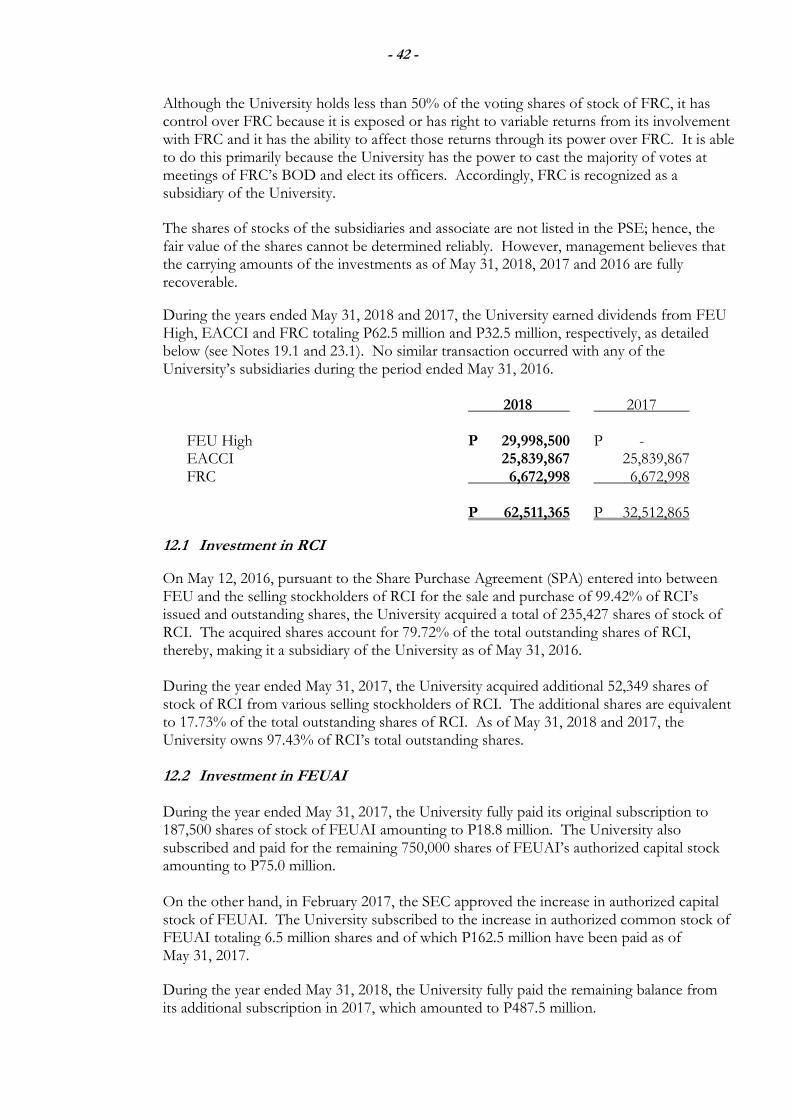
- 42 -
Although the University holds less than 50% of the voting shares of stock of FRC, it has control over FRC because it is exposed or has right to variable returns from its involvement with FRC and it has the ability to affect those returns through its power over FRC. It is able to do this primarily because the University has the power to cast the majority of votes at meetings of FRC’s BOD and elect its officers. Accordingly, FRC is recognized as a subsidiary of the University.
The shares of stocks of the subsidiaries and associate are not listed in the PSE; hence, the fair value of the shares cannot be determined reliably. However, management believes that the carrying amounts of the investments as of May 31, 2018, 2017 and 2016 are fully recoverable.
During the years ended May 31, 2018 and 2017, the University earned dividends from FEU High, EACCI and FRC totaling P62.5 million and P32.5 million, respectively, as detailed below (see Notes 19.1 and 23.1). No similar transaction occurred with any of the University’s subsidiaries during the period ended May 31, 2016.
2018 2017
FEU High P 29,998,500 P - EACCI 25,839,867 25,839,867 FRC 6,672,998 6,672,998 P 62,511,365 P 32,512,865
12.1 Investment in RCI
On May 12, 2016, pursuant to the Share Purchase Agreement (SPA) entered into between FEU and the selling stockholders of RCI for the sale and purchase of 99.42% of RCI’s issued and outstanding shares, the University acquired a total of 235,427 shares of stock of RCI. The acquired shares account for 79.72% of the total outstanding shares of RCI, thereby, making it a subsidiary of the University as of May 31, 2016. During the year ended May 31, 2017, the University acquired additional 52,349 shares of stock of RCI from various selling stockholders of RCI. The additional shares are equivalent to 17.73% of the total outstanding shares of RCI. As of May 31, 2018 and 2017, the University owns 97.43% of RCI’s total outstanding shares. 12.2 Investment in FEUAI During the year ended May 31, 2017, the University fully paid its original subscription to 187,500 shares of stock of FEUAI amounting to P18.8 million. The University also subscribed and paid for the remaining 750,000 shares of FEUAI’s authorized capital stock amounting to P75.0 million. On the other hand, in February 2017, the SEC approved the increase in authorized capital stock of FEUAI. The University subscribed to the increase in authorized common stock of FEUAI totaling 6.5 million shares and of which P162.5 million have been paid as of May 31, 2017. During the year ended May 31, 2018, the University fully paid the remaining balance from its additional subscription in 2017, which amounted to P487.5 million.
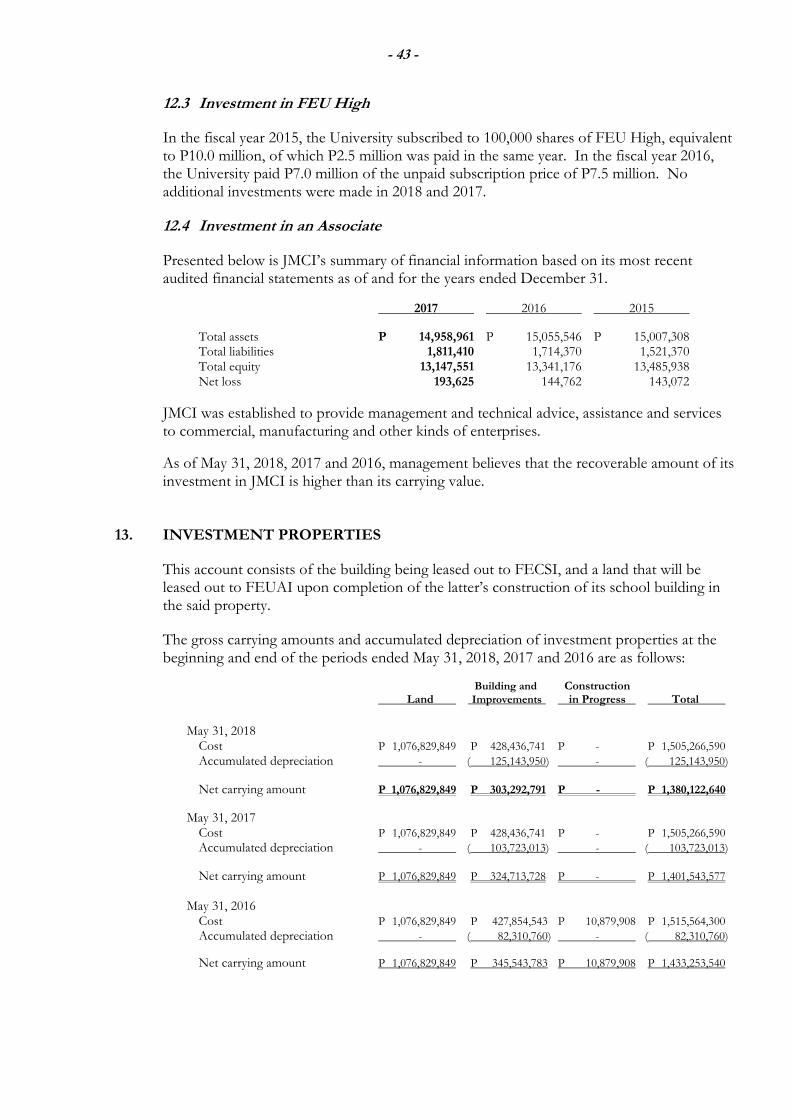
- 43 -
12.3 Investment in FEU High In the fiscal year 2015, the University subscribed to 100,000 shares of FEU High, equivalent to P10.0 million, of which P2.5 million was paid in the same year. In the fiscal year 2016, the University paid P7.0 million of the unpaid subscription price of P7.5 million. No additional investments were made in 2018 and 2017.
12.4 Investment in an Associate
Presented below is JMCI’s summary of financial information based on its most recent audited financial statements as of and for the years ended December 31.
2017 2016 2015
Total assets P 14,958,961 P 15,055,546 P 15,007,308 Total liabilities 1,811,410 1,714,370 1,521,370 Total equity 13,147,551 13,341,176 13,485,938 Net loss 193,625 144,762 143,072
JMCI was established to provide management and technical advice, assistance and services to commercial, manufacturing and other kinds of enterprises.
As of May 31, 2018, 2017 and 2016, management believes that the recoverable amount of its investment in JMCI is higher than its carrying value.
13. INVESTMENT PROPERTIES
This account consists of the building being leased out to FECSI, and a land that will be leased out to FEUAI upon completion of the latter’s construction of its school building in the said property.
The gross carrying amounts and accumulated depreciation of investment properties at the beginning and end of the periods ended May 31, 2018, 2017 and 2016 are as follows:
Building and Construction Land Improvements in Progress Total
May 31, 2018 Cost P 1,076,829,849 P 428,436,741 P - P 1,505,266,590
Accumulated depreciation - ( 125,143,950) - ( 125,143,950)
Net carrying amount P 1,076,829,849 P 303,292,791 P - P 1,380,122,640
May 31, 2017
Cost P 1,076,829,849 P 428,436,741 P - P 1,505,266,590
Accumulated depreciation - ( 103,723,013) - ( 103,723,013)
Net carrying amount P 1,076,829,849 P 324,713,728 P - P 1,401,543,577
May 31, 2016 Cost P 1,076,829,849 P 427,854,543 P 10,879,908 P 1,515,564,300
Accumulated depreciation - ( 82,310,760) - ( 82,310,760)
Net carrying amount P 1,076,829,849 P 345,543,783 P 10,879,908 P 1,433,253,540
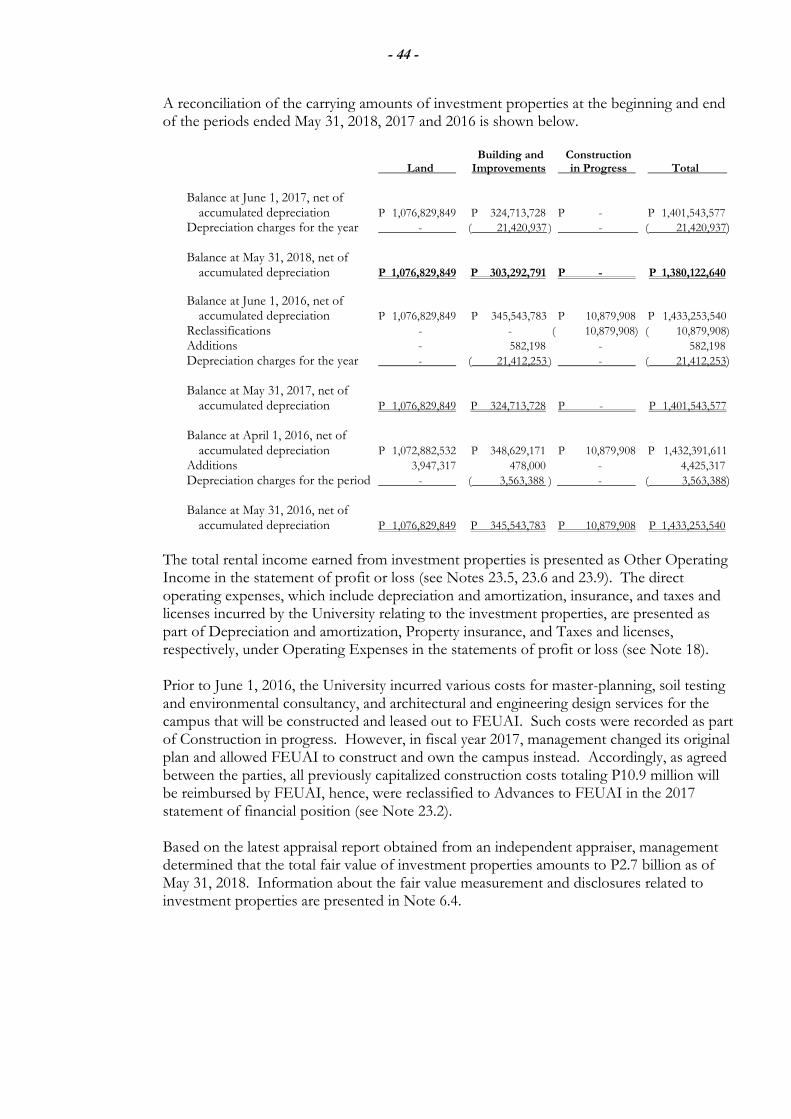
- 44 -
A reconciliation of the carrying amounts of investment properties at the beginning and end of the periods ended May 31, 2018, 2017 and 2016 is shown below.
Building and Construction Land Improvements in Progress Total
Balance at June 1, 2017, net of accumulated depreciation P 1,076,829,849 P 324,713,728 P - P 1,401,543,577 Depreciation charges for the year - ( 21,420,937 ) - ( 21,420,937) Balance at May 31, 2018, net of accumulated depreciation P 1,076,829,849 P 303,292,791 P - P 1,380,122,640
Balance at June 1, 2016, net of accumulated depreciation P 1,076,829,849 P 345,543,783 P 10,879,908 P 1,433,253,540
Reclassifications - - ( 10,879,908) ( 10,879,908)
Additions - 582,198 - 582,198 Depreciation charges for the year - ( 21,412,253 ) - ( 21,412,253) Balance at May 31, 2017, net of accumulated depreciation P 1,076,829,849 P 324,713,728 P - P 1,401,543,577 Balance at April 1, 2016, net of accumulated depreciation P 1,072,882,532 P 348,629,171 P 10,879,908 P 1,432,391,611 Additions 3,947,317 478,000 - 4,425,317 Depreciation charges for the period - ( 3,563,388 ) - ( 3,563,388) Balance at May 31, 2016, net of accumulated depreciation P 1,076,829,849 P 345,543,783 P 10,879,908 P 1,433,253,540
The total rental income earned from investment properties is presented as Other Operating Income in the statement of profit or loss (see Notes 23.5, 23.6 and 23.9). The direct operating expenses, which include depreciation and amortization, insurance, and taxes and licenses incurred by the University relating to the investment properties, are presented as part of Depreciation and amortization, Property insurance, and Taxes and licenses, respectively, under Operating Expenses in the statements of profit or loss (see Note 18).
Prior to June 1, 2016, the University incurred various costs for master-planning, soil testing and environmental consultancy, and architectural and engineering design services for the campus that will be constructed and leased out to FEUAI. Such costs were recorded as part of Construction in progress. However, in fiscal year 2017, management changed its original plan and allowed FEUAI to construct and own the campus instead. Accordingly, as agreed between the parties, all previously capitalized construction costs totaling P10.9 million will be reimbursed by FEUAI, hence, were reclassified to Advances to FEUAI in the 2017 statement of financial position (see Note 23.2). Based on the latest appraisal report obtained from an independent appraiser, management determined that the total fair value of investment properties amounts to P2.7 billion as of May 31, 2018. Information about the fair value measurement and disclosures related to investment properties are presented in Note 6.4.
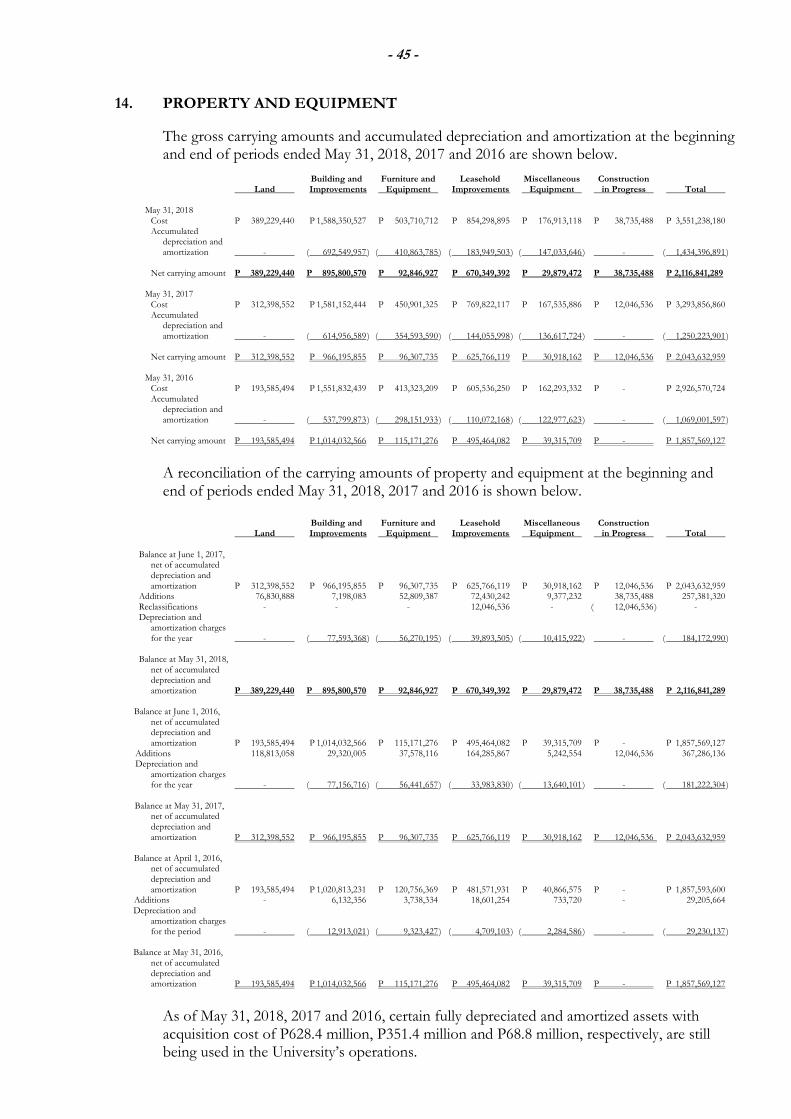
- 45 -
14. PROPERTY AND EQUIPMENT
The gross carrying amounts and accumulated depreciation and amortization at the beginning and end of periods ended May 31, 2018, 2017 and 2016 are shown below.
Building and Furniture and Leasehold Miscellaneous Construction Land Improvements Equipment Improvements Equipment in Progress Total May 31, 2018 Cost P 389,229,440 P 1,588,350,527 P 503,710,712 P 854,298,895 P 176,913,118 P 38,735,488 P 3,551,238,180 Accumulated depreciation and amortization - ( 692,549,957 ) ( 410,863,785 ) ( 183,949,503 ) ( 147,033,646 ) - ( 1,434,396,891 ) Net carrying amount P 389,229,440 P 895,800,570 P 92,846,927 P 670,349,392 P 29,879,472 P 38,735,488 P 2,116,841,289 May 31, 2017 Cost P 312,398,552 P 1,581,152,444 P 450,901,325 P 769,822,117 P 167,535,886 P 12,046,536 P 3,293,856,860 Accumulated depreciation and amortization - ( 614,956,589 ) ( 354,593,590 ) ( 144,055,998 ) ( 136,617,724 ) - ( 1,250,223,901 ) Net carrying amount P 312,398,552 P 966,195,855 P 96,307,735 P 625,766,119 P 30,918,162 P 12,046,536 P 2,043,632,959 May 31, 2016 Cost P 193,585,494 P 1,551,832,439 P 413,323,209 P 605,536,250 P 162,293,332 P - P 2,926,570,724 Accumulated depreciation and amortization - ( 537,799,873 ) ( 298,151,933 ) ( 110,072,168 ) ( 122,977,623 ) - ( 1,069,001,597 ) Net carrying amount P 193,585,494 P 1,014,032,566 P 115,171,276 P 495,464,082 P 39,315,709 P - P 1,857,569,127
A reconciliation of the carrying amounts of property and equipment at the beginning and end of periods ended May 31, 2018, 2017 and 2016 is shown below.
Building and Furniture and Leasehold Miscellaneous Construction Land Improvements Equipment Improvements Equipment in Progress Total Balance at June 1, 2017, net of accumulated depreciation and amortization P 312,398,552 P 966,195,855 P 96,307,735 P 625,766,119 P 30,918,162 P 12,046,536 P 2,043,632,959 Additions 76,830,888 7,198,083 52,809,387 72,430,242 9,377,232 38,735,488 257,381,320 Reclassifications - - - 12,046,536 - ( 12,046,536 ) - Depreciation and amortization charges for the year - ( 77,593,368 ) ( 56,270,195 ) ( 39,893,505 ) ( 10,415,922 ) - ( 184,172,990 ) Balance at May 31, 2018, net of accumulated depreciation and amortization P 389,229,440 P 895,800,570 P 92,846,927 P 670,349,392 P 29,879,472 P 38,735,488 P 2,116,841,289 Balance at June 1, 2016, net of accumulated depreciation and amortization P 193,585,494 P 1,014,032,566 P 115,171,276 P 495,464,082 P 39,315,709 P - P 1,857,569,127 Additions 118,813,058 29,320,005 37,578,116 164,285,867 5,242,554 12,046,536 367,286,136 Depreciation and amortization charges for the year - ( 77,156,716 ) ( 56,441,657 ) ( 33,983,830 ) ( 13,640,101 ) - ( 181,222,304 ) Balance at May 31, 2017, net of accumulated depreciation and amortization P 312,398,552 P 966,195,855 P 96,307,735 P 625,766,119 P 30,918,162 P 12,046,536 P 2,043,632,959 Balance at April 1, 2016, net of accumulated depreciation and amortization P 193,585,494 P 1,020,813,231 P 120,756,369 P 481,571,931 P 40,866,575 P - P 1,857,593,600 Additions - 6,132,356 3,738,334 18,601,254 733,720 - 29,205,664 Depreciation and amortization charges for the period - ( 12,913,021 ) ( 9,323,427 ) ( 4,709,103 ) ( 2,284,586 ) - ( 29,230,137 ) Balance at May 31, 2016, net of accumulated depreciation and amortization P 193,585,494 P 1,014,032,566 P 115,171,276 P 495,464,082 P 39,315,709 P - P 1,857,569,127
As of May 31, 2018, 2017 and 2016, certain fully depreciated and amortized assets with acquisition cost of P628.4 million, P351.4 million and P68.8 million, respectively, are still being used in the University’s operations.
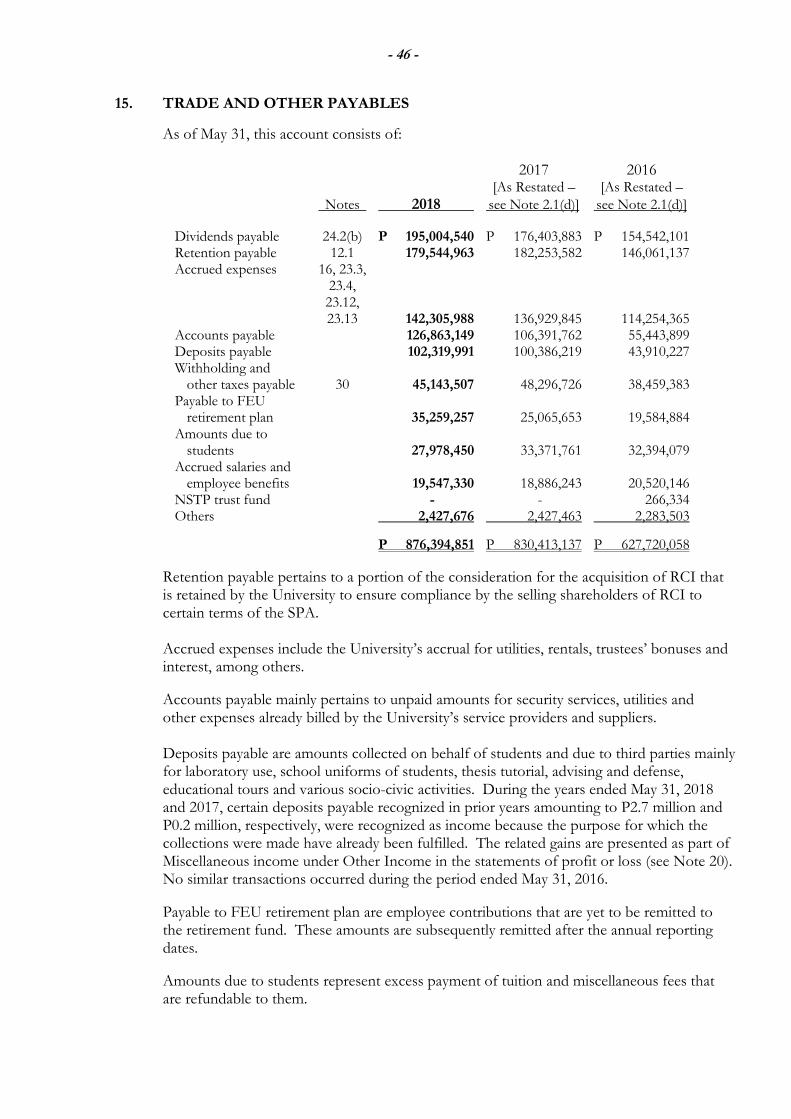
- 46 -
15. TRADE AND OTHER PAYABLES
As of May 31, this account consists of:
2017 2016 [As Restated – [As Restated – Notes 2018 see Note 2.1(d)] see Note 2.1(d)]
Dividends payable 24.2(b) P 195,004,540 P 176,403,883 P 154,542,101 Retention payable 12.1 179,544,963 182,253,582 146,061,137 Accrued expenses 16, 23.3, 23.4, 23.12, 23.13 142,305,988 136,929,845 114,254,365 Accounts payable 126,863,149 106,391,762 55,443,899 Deposits payable 102,319,991 100,386,219 43,910,227 Withholding and other taxes payable 30 45,143,507 48,296,726 38,459,383
Payable to FEU retirement plan 35,259,257 25,065,653 19,584,884 Amounts due to students 27,978,450 33,371,761 32,394,079 Accrued salaries and employee benefits 19,547,330 18,886,243 20,520,146
NSTP trust fund - - 266,334 Others 2,427,676 2,427,463 2,283,503
P 876,394,851 P 830,413,137 P 627,720,058
Retention payable pertains to a portion of the consideration for the acquisition of RCI that is retained by the University to ensure compliance by the selling shareholders of RCI to certain terms of the SPA. Accrued expenses include the University’s accrual for utilities, rentals, trustees’ bonuses and interest, among others.
Accounts payable mainly pertains to unpaid amounts for security services, utilities and other expenses already billed by the University’s service providers and suppliers.
Deposits payable are amounts collected on behalf of students and due to third parties mainly for laboratory use, school uniforms of students, thesis tutorial, advising and defense, educational tours and various socio-civic activities. During the years ended May 31, 2018 and 2017, certain deposits payable recognized in prior years amounting to P2.7 million and P0.2 million, respectively, were recognized as income because the purpose for which the collections were made have already been fulfilled. The related gains are presented as part of Miscellaneous income under Other Income in the statements of profit or loss (see Note 20). No similar transactions occurred during the period ended May 31, 2016.
Payable to FEU retirement plan are employee contributions that are yet to be remitted to the retirement fund. These amounts are subsequently remitted after the annual reporting dates.
Amounts due to students represent excess payment of tuition and miscellaneous fees that are refundable to them.
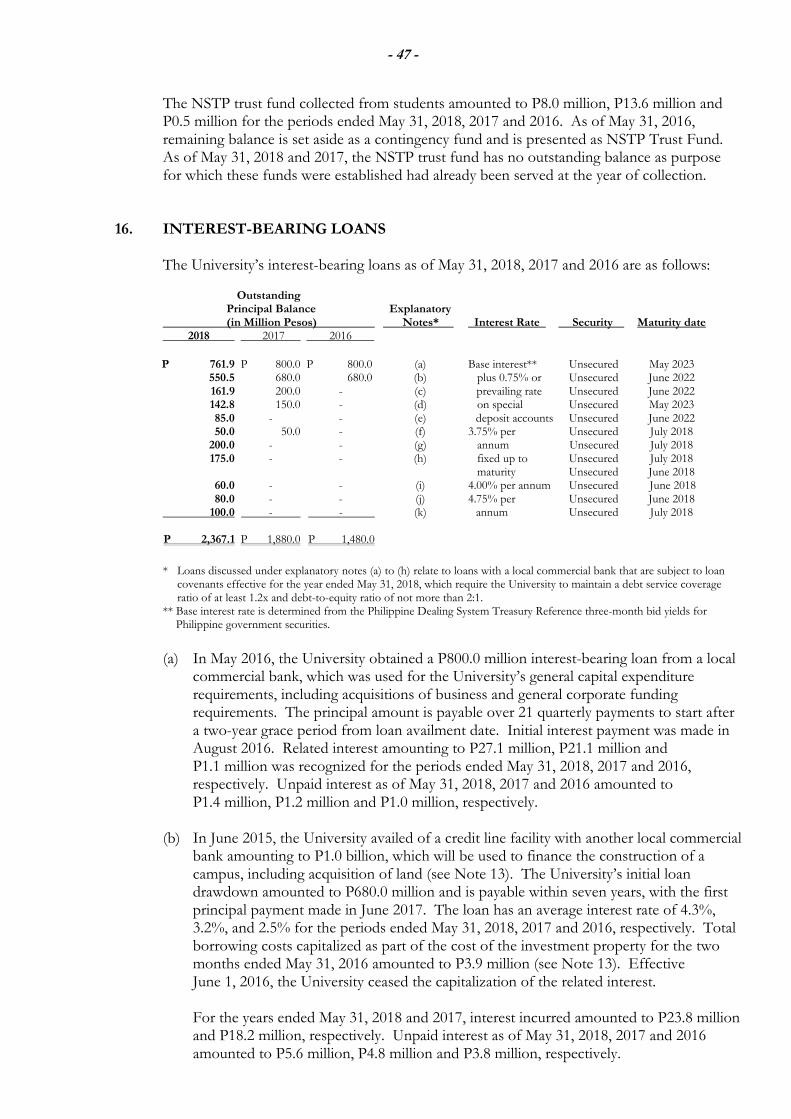
- 47 -
The NSTP trust fund collected from students amounted to P8.0 million, P13.6 million and P0.5 million for the periods ended May 31, 2018, 2017 and 2016. As of May 31, 2016, remaining balance is set aside as a contingency fund and is presented as NSTP Trust Fund. As of May 31, 2018 and 2017, the NSTP trust fund has no outstanding balance as purpose for which these funds were established had already been served at the year of collection.
16. INTEREST-BEARING LOANS
The University’s interest-bearing loans as of May 31, 2018, 2017 and 2016 are as follows:
Outstanding Principal Balance Explanatory
(in Million Pesos) Notes* Interest Rate Security Maturity date 2018 2017 2016
P 761.9 P 800.0 P 800.0 (a) Base interest** Unsecured May 2023
550.5 680.0 680.0 (b) plus 0.75% or Unsecured June 2022 161.9 200.0 - (c) prevailing rate Unsecured June 2022 142.8 150.0 - (d) on special Unsecured May 2023 85.0 - - (e) deposit accounts Unsecured June 2022 50.0 50.0 - (f) 3.75% per Unsecured July 2018 200.0 - - (g) annum Unsecured July 2018 175.0 - - (h) fixed up to Unsecured July 2018 maturity Unsecured June 2018 60.0 - - (i) 4.00% per annum Unsecured June 2018 80.0 - - (j) 4.75% per Unsecured June 2018 100.0 - - (k) annum Unsecured July 2018 P 2,367.1 P 1,880.0 P 1,480.0
* Loans discussed under explanatory notes (a) to (h) relate to loans with a local commercial bank that are subject to loan
covenants effective for the year ended May 31, 2018, which require the University to maintain a debt service coverage ratio of at least 1.2x and debt-to-equity ratio of not more than 2:1.
** Base interest rate is determined from the Philippine Dealing System Treasury Reference three-month bid yields for Philippine government securities. (a) In May 2016, the University obtained a P800.0 million interest-bearing loan from a local
commercial bank, which was used for the University’s general capital expenditure requirements, including acquisitions of business and general corporate funding requirements. The principal amount is payable over 21 quarterly payments to start after a two-year grace period from loan availment date. Initial interest payment was made in August 2016. Related interest amounting to P27.1 million, P21.1 million and P1.1 million was recognized for the periods ended May 31, 2018, 2017 and 2016, respectively. Unpaid interest as of May 31, 2018, 2017 and 2016 amounted to P1.4 million, P1.2 million and P1.0 million, respectively.
(b) In June 2015, the University availed of a credit line facility with another local commercial
bank amounting to P1.0 billion, which will be used to finance the construction of a campus, including acquisition of land (see Note 13). The University’s initial loan drawdown amounted to P680.0 million and is payable within seven years, with the first principal payment made in June 2017. The loan has an average interest rate of 4.3%, 3.2%, and 2.5% for the periods ended May 31, 2018, 2017 and 2016, respectively. Total borrowing costs capitalized as part of the cost of the investment property for the two months ended May 31, 2016 amounted to P3.9 million (see Note 13). Effective June 1, 2016, the University ceased the capitalization of the related interest. For the years ended May 31, 2018 and 2017, interest incurred amounted to P23.8 million and P18.2 million, respectively. Unpaid interest as of May 31, 2018, 2017 and 2016 amounted to P5.6 million, P4.8 million and P3.8 million, respectively.
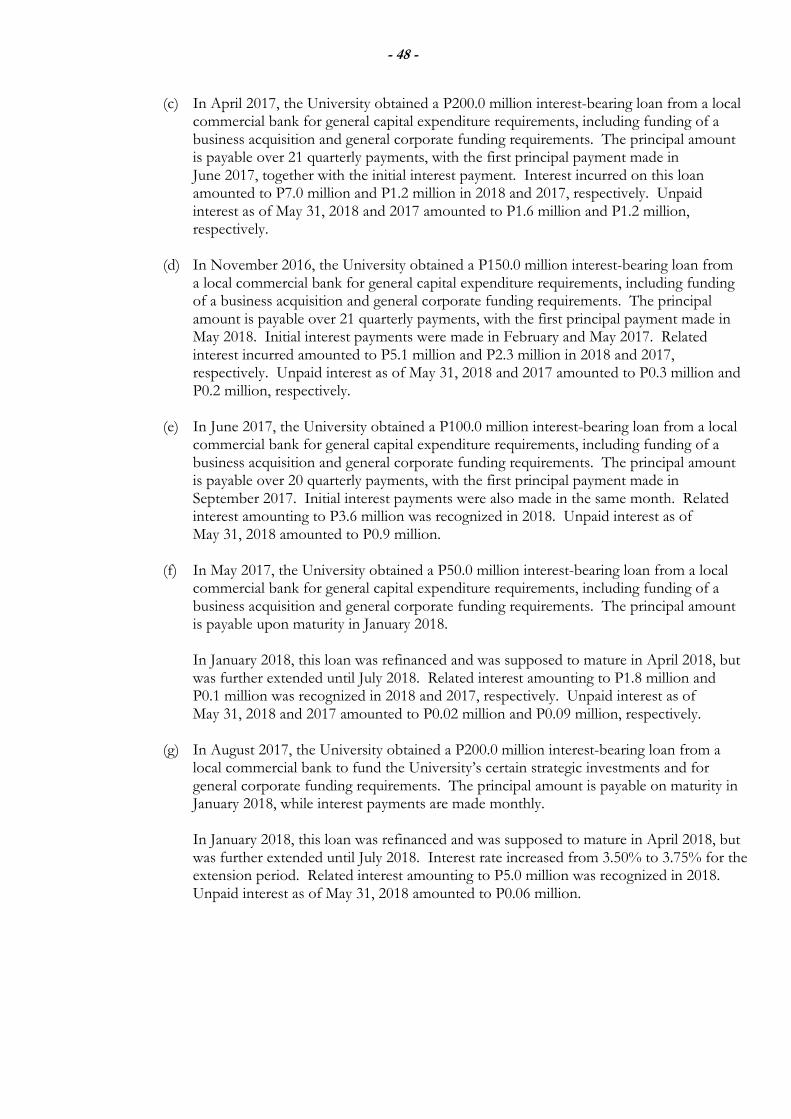
- 48 -
(c) In April 2017, the University obtained a P200.0 million interest-bearing loan from a local commercial bank for general capital expenditure requirements, including funding of a business acquisition and general corporate funding requirements. The principal amount is payable over 21 quarterly payments, with the first principal payment made in June 2017, together with the initial interest payment. Interest incurred on this loan amounted to P7.0 million and P1.2 million in 2018 and 2017, respectively. Unpaid interest as of May 31, 2018 and 2017 amounted to P1.6 million and P1.2 million, respectively.
(d) In November 2016, the University obtained a P150.0 million interest-bearing loan from
a local commercial bank for general capital expenditure requirements, including funding of a business acquisition and general corporate funding requirements. The principal amount is payable over 21 quarterly payments, with the first principal payment made in May 2018. Initial interest payments were made in February and May 2017. Related interest incurred amounted to P5.1 million and P2.3 million in 2018 and 2017, respectively. Unpaid interest as of May 31, 2018 and 2017 amounted to P0.3 million and P0.2 million, respectively.
(e) In June 2017, the University obtained a P100.0 million interest-bearing loan from a local
commercial bank for general capital expenditure requirements, including funding of a business acquisition and general corporate funding requirements. The principal amount is payable over 20 quarterly payments, with the first principal payment made in September 2017. Initial interest payments were also made in the same month. Related interest amounting to P3.6 million was recognized in 2018. Unpaid interest as of May 31, 2018 amounted to P0.9 million.
(f) In May 2017, the University obtained a P50.0 million interest-bearing loan from a local
commercial bank for general capital expenditure requirements, including funding of a business acquisition and general corporate funding requirements. The principal amount is payable upon maturity in January 2018.
In January 2018, this loan was refinanced and was supposed to mature in April 2018, but was further extended until July 2018. Related interest amounting to P1.8 million and P0.1 million was recognized in 2018 and 2017, respectively. Unpaid interest as of May 31, 2018 and 2017 amounted to P0.02 million and P0.09 million, respectively.
(g) In August 2017, the University obtained a P200.0 million interest-bearing loan from a
local commercial bank to fund the University’s certain strategic investments and for general corporate funding requirements. The principal amount is payable on maturity in January 2018, while interest payments are made monthly.
In January 2018, this loan was refinanced and was supposed to mature in April 2018, but was further extended until July 2018. Interest rate increased from 3.50% to 3.75% for the extension period. Related interest amounting to P5.0 million was recognized in 2018. Unpaid interest as of May 31, 2018 amounted to P0.06 million.
- 49 -
(h) In October 2017, the University obtained a P175.0 million interest-bearing loan from a local commercial bank to fund certain investments and for general working capital requirements. The principal amount is payable on maturity in January 2018, while interest payments are made monthly.
In January 2018, this loan was refinanced and was supposed to mature in April 2018, but was further extended until July 2018. Interest rate increased from 3.50% to 3.75% for the extension period. Related interest amounting to P4.1 million was recognized in 2018. Unpaid interest as of May 31, 2018 amounted to P0.1 million.
(i) In December 2017, the University obtained a P60.0 million interest-bearing loan from a local commercial bank for additional working capital. The principal amount is payable on maturity in March 2018, while interest payments are made monthly. The loan does not have any significant or restrictive covenants. In March 2018, this loan was refinanced and will mature in June 2018. Interest rate increased from 3.75% to 4.00% for the extension period. Related interest amounting to P1.1 million was recognized in 2018, while the unpaid interest as of May 31, 2018 amounted to P0.2 million.
(j) In March 2018, the University obtained an P80.0 million interest-bearing loan from a
local commercial bank for additional working capital. The principal amount is payable on maturity in June 2018, while interest payments are made monthly. The loan does not have any significant or restrictive covenants. Related interest amounting to P0.6 million was recognized in 2018. Unpaid interest as of May 31, 2018 amounted to P0.1 million.
(k) In April 2018, the University obtained a P100.0 million interest-bearing loan from a local
commercial bank for additional working capital. The principal amount is payable on maturity in July 2018, while interest payments are made monthly. The loan does not have any significant or restrictive covenants. Related interest amounting to P0.5 million was incurred in 2018. Unpaid interest as of May 31, 2018 amounted to P0.1 million.
The total interest incurred by the University on all of these loans are presented as part of Interest expense under Finance Costs in the statements of profit or loss (see Note 19.2), while any outstanding interest payable is recognized as part of Accrued expenses under the Trade and Other Payables account in the statements of financial position (see Note 15). There are no assets used and/or required as collaterals as of May 31, 2018, 2017 and 2016 for the University’s interest-bearing loans and borrowings. As of May 31, 2018, 2017 and 2016, the University has complied with its loan covenants.
- 50 -
17. EDUCATIONAL REVENUES Details of net tuition and other school fees presented in the statements of profit or loss are as follows:
May 31, 2018 May 31, 2017 May 31, 2016 (One Year) (One Year) (Two Months) Tuition fees P 1,462,865,700 P 1,812,937,319 P 50,349,409 Less discounts: Scholarships 76,942,138 92,775,213 894,463 Family 8,871,802 6,915,741 255,424 Cash 3,227,665 6,964,499 - 89,041,605 106,655,453 1,149,887
Other school fees: Entrance fees 9,818,769 4,138,503 578,290 Transcript fees 9,193,844 7,194,043 1,283,461 Diplomas 5,232,683 2,948,640 296,877 Identification cards 4,994,414 5,854,911 72,795 Certification fee 4,125,136 3,547,894 548,214 Graduation and commencement fees 3,737,252 3,185,212 2,977,790 Registration fees 2,276,586 2,839,972 38,669 Miscellaneous 2,541,414 2,886,512 173,318 41,920,098 32,595,687 5,969,414
P 1,415,744,193 P 1,738,877,553 P 55,168,936
For the periods ended May 31, 2017 and 2016, the University collected tuition fees from students for summer classes of the respective academic years, which started after the reporting period. Such collections amounted to P8.8 million and P50.4 million as of May 31, 2017 and 2016, respectively. For the year ended May 31, 2018, the University has collected advance tuition fee payments amounting to P83.7 million from students who enrolled for the next academic year. These collections are presented as Unearned Tuition Fees in the statements of financial position. These are recognized as revenue in the following period upon completion of academic class instruction.
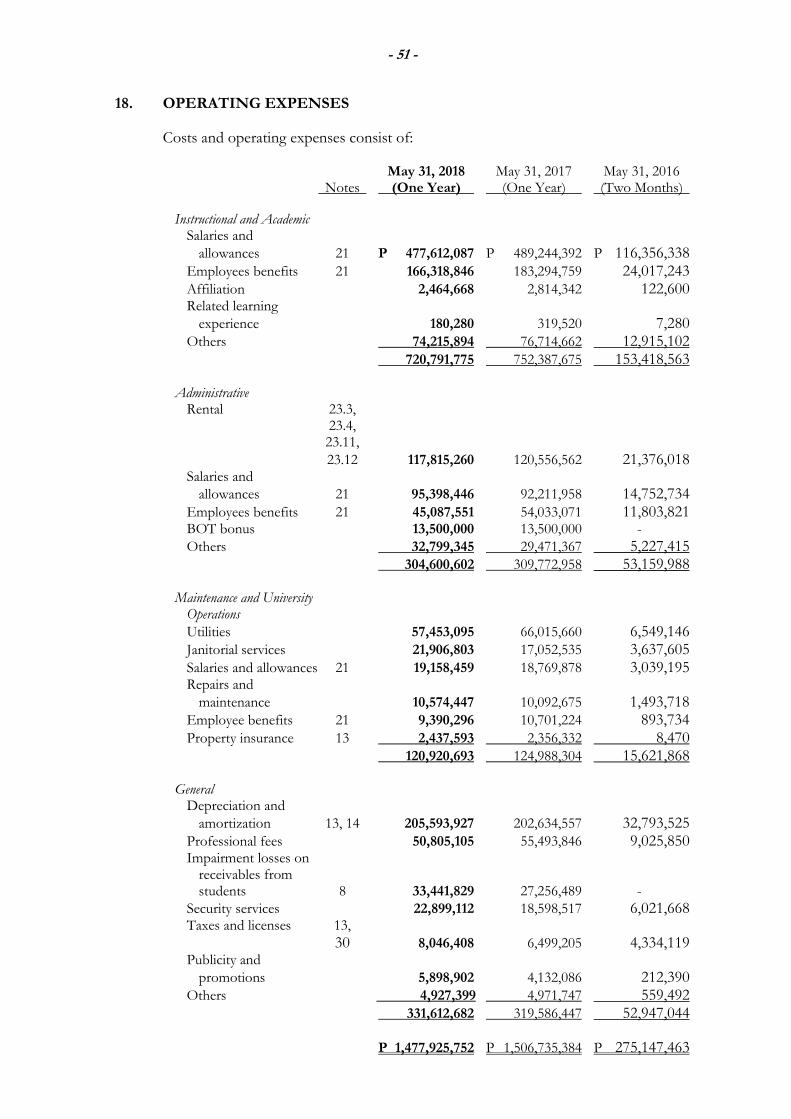
- 51 -
18. OPERATING EXPENSES Costs and operating expenses consist of:
May 31, 2018 May 31, 2017 May 31, 2016 Notes (One Year) (One Year) (Two Months)
Instructional and Academic Salaries and
allowances 21 P 477,612,087 P 489,244,392 P 116,356,338 Employees benefits 21 166,318,846 183,294,759 24,017,243 Affiliation 2,464,668 2,814,342 122,600 Related learning
experience 180,280 319,520 7,280 Others 74,215,894 76,714,662 12,915,102 720,791,775 752,387,675 153,418,563
Administrative
Rental 23.3, 23.4, 23.11,
23.12 117,815,260 120,556,562 21,376,018 Salaries and allowances 21 95,398,446 92,211,958 14,752,734 Employees benefits 21 45,087,551 54,033,071 11,803,821 BOT bonus 13,500,000 13,500,000 -
Others 32,799,345 29,471,367 5,227,415 304,600,602 309,772,958 53,159,988 Maintenance and University Operations
Utilities 57,453,095 66,015,660 6,549,146 Janitorial services 21,906,803 17,052,535 3,637,605 Salaries and allowances 21 19,158,459 18,769,878 3,039,195 Repairs and
maintenance 10,574,447 10,092,675 1,493,718 Employee benefits 21 9,390,296 10,701,224 893,734 Property insurance 13 2,437,593 2,356,332 8,470 120,920,693 124,988,304 15,621,868 General
Depreciation and
amortization 13, 14 205,593,927 202,634,557 32,793,525 Professional fees 50,805,105 55,493,846 9,025,850 Impairment losses on receivables from students 8 33,441,829 27,256,489 - Security services 22,899,112 18,598,517 6,021,668 Taxes and licenses 13, 30 8,046,408 6,499,205 4,334,119 Publicity and
promotions 5,898,902 4,132,086 212,390 Others 4,927,399 4,971,747 559,492 331,612,682 319,586,447 52,947,044 P 1,477,925,752 P 1,506,735,384 P 275,147,463
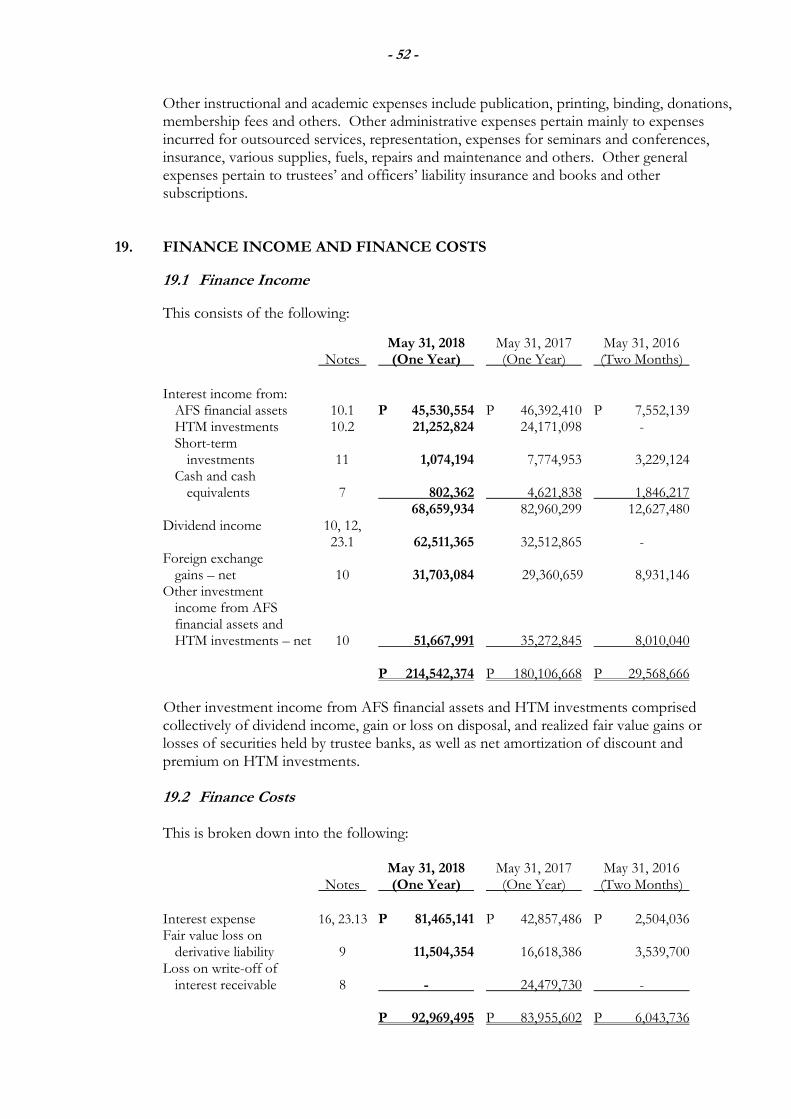
- 52 -
Other instructional and academic expenses include publication, printing, binding, donations, membership fees and others. Other administrative expenses pertain mainly to expenses incurred for outsourced services, representation, expenses for seminars and conferences, insurance, various supplies, fuels, repairs and maintenance and others. Other general expenses pertain to trustees’ and officers’ liability insurance and books and other subscriptions.
19. FINANCE INCOME AND FINANCE COSTS
19.1 Finance Income
This consists of the following:
May 31, 2018 May 31, 2017 May 31, 2016 Notes (One Year) (One Year) (Two Months)
Interest income from: AFS financial assets 10.1 P 45,530,554 P 46,392,410 P 7,552,139 HTM investments 10.2 21,252,824 24,171,098 - Short-term investments 11 1,074,194 7,774,953 3,229,124 Cash and cash equivalents 7 802,362 4,621,838 1,846,217 68,659,934 82,960,299 12,627,480 Dividend income 10, 12, 23.1 62,511,365 32,512,865 - Foreign exchange gains – net 10 31,703,084 29,360,659 8,931,146 Other investment income from AFS financial assets and HTM investments – net 10 51,667,991 35,272,845 8,010,040 P 214,542,374 P 180,106,668 P 29,568,666 Other investment income from AFS financial assets and HTM investments comprised collectively of dividend income, gain or loss on disposal, and realized fair value gains or losses of securities held by trustee banks, as well as net amortization of discount and premium on HTM investments. 19.2 Finance Costs
This is broken down into the following:
May 31, 2018 May 31, 2017 May 31, 2016 Notes (One Year) (One Year) (Two Months) Interest expense 16, 23.13 P 81,465,141 P 42,857,486 P 2,504,036 Fair value loss on derivative liability 9 11,504,354 16,618,386 3,539,700 Loss on write-off of interest receivable 8 - 24,479,730 - P 92,969,495 P 83,955,602 P 6,043,736
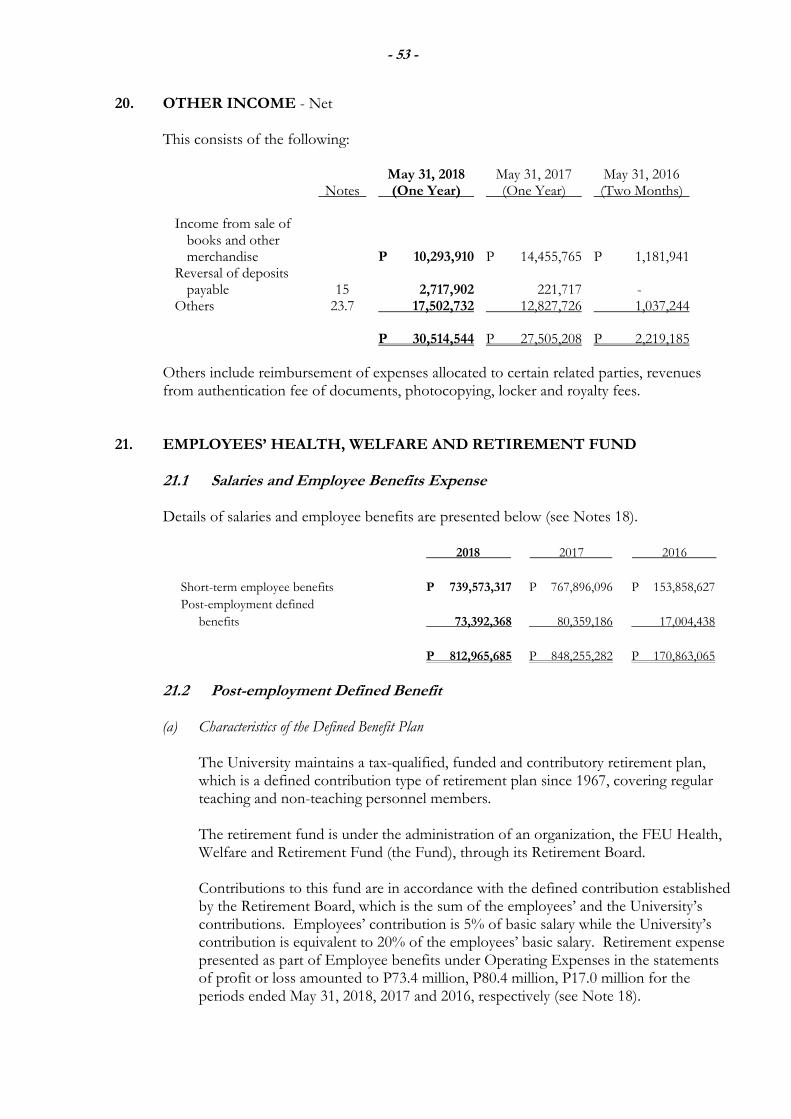
- 53 -
20. OTHER INCOME - Net This consists of the following:
May 31, 2018 May 31, 2017 May 31, 2016 Notes (One Year) (One Year) (Two Months) Income from sale of books and other merchandise P 10,293,910 P 14,455,765 P 1,181,941 Reversal of deposits payable 15 2,717,902 221,717 - Others 23.7 17,502,732 12,827,726 1,037,244
P 30,514,544 P 27,505,208 P 2,219,185
Others include reimbursement of expenses allocated to certain related parties, revenues from authentication fee of documents, photocopying, locker and royalty fees.
21. EMPLOYEES’ HEALTH, WELFARE AND RETIREMENT FUND
21.1 Salaries and Employee Benefits Expense
Details of salaries and employee benefits are presented below (see Notes 18).
2018 2017 2016
Short-term employee benefits P 739,573,317 P 767,896,096 P 153,858,627
Post-employment defined
benefits 73,392,368 80,359,186 17,004,438
P 812,965,685 P 848,255,282 P 170,863,065
21.2 Post-employment Defined Benefit (a) Characteristics of the Defined Benefit Plan
The University maintains a tax-qualified, funded and contributory retirement plan, which is a defined contribution type of retirement plan since 1967, covering regular teaching and non-teaching personnel members. The retirement fund is under the administration of an organization, the FEU Health, Welfare and Retirement Fund (the Fund), through its Retirement Board.
Contributions to this fund are in accordance with the defined contribution established by the Retirement Board, which is the sum of the employees’ and the University’s contributions. Employees’ contribution is 5% of basic salary while the University’s contribution is equivalent to 20% of the employees’ basic salary. Retirement expense presented as part of Employee benefits under Operating Expenses in the statements of profit or loss amounted to P73.4 million, P80.4 million, P17.0 million for the periods ended May 31, 2018, 2017 and 2016, respectively (see Note 18).
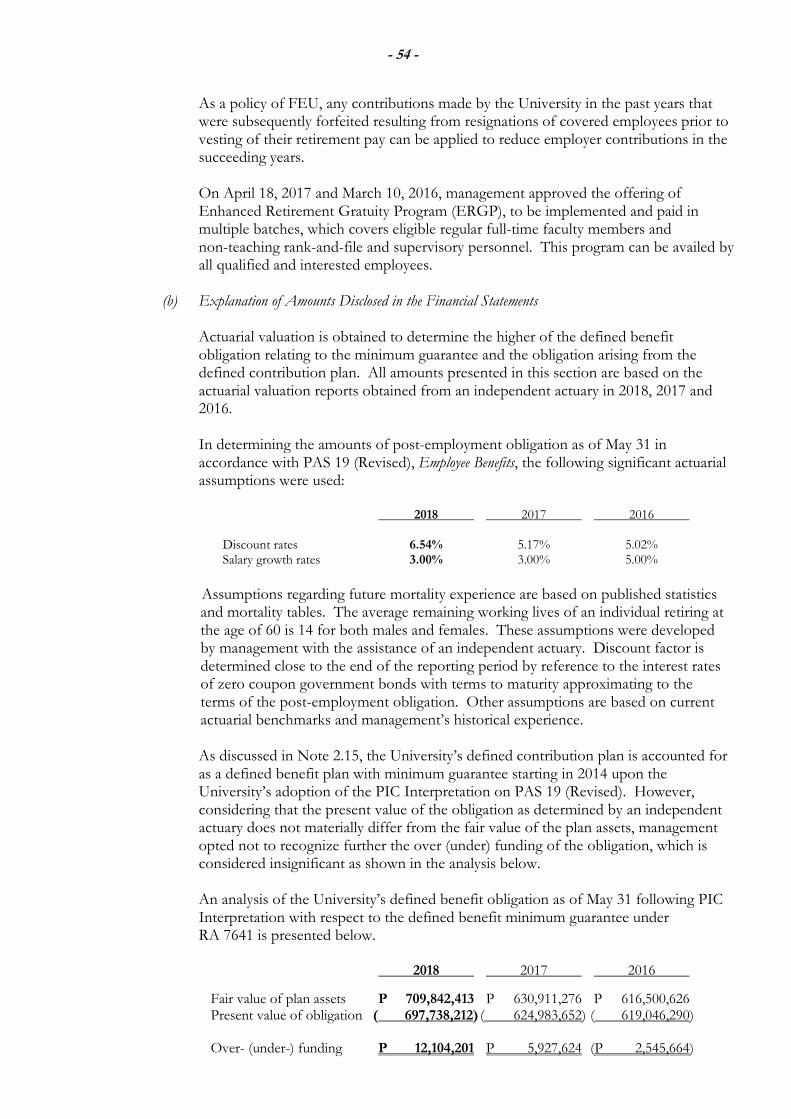
- 54 -
As a policy of FEU, any contributions made by the University in the past years that were subsequently forfeited resulting from resignations of covered employees prior to vesting of their retirement pay can be applied to reduce employer contributions in the succeeding years.
On April 18, 2017 and March 10, 2016, management approved the offering of Enhanced Retirement Gratuity Program (ERGP), to be implemented and paid in multiple batches, which covers eligible regular full-time faculty members and non-teaching rank-and-file and supervisory personnel. This program can be availed by all qualified and interested employees.
(b) Explanation of Amounts Disclosed in the Financial Statements
Actuarial valuation is obtained to determine the higher of the defined benefit obligation relating to the minimum guarantee and the obligation arising from the defined contribution plan. All amounts presented in this section are based on the actuarial valuation reports obtained from an independent actuary in 2018, 2017 and 2016. In determining the amounts of post-employment obligation as of May 31 in accordance with PAS 19 (Revised), Employee Benefits, the following significant actuarial assumptions were used:
2018 2017 2016
Discount rates 6.54% 5.17% 5.02% Salary growth rates 3.00% 3.00% 5.00%
Assumptions regarding future mortality experience are based on published statistics and mortality tables. The average remaining working lives of an individual retiring at the age of 60 is 14 for both males and females. These assumptions were developed by management with the assistance of an independent actuary. Discount factor is determined close to the end of the reporting period by reference to the interest rates of zero coupon government bonds with terms to maturity approximating to the terms of the post-employment obligation. Other assumptions are based on current actuarial benchmarks and management’s historical experience.
As discussed in Note 2.15, the University’s defined contribution plan is accounted for as a defined benefit plan with minimum guarantee starting in 2014 upon the University’s adoption of the PIC Interpretation on PAS 19 (Revised). However, considering that the present value of the obligation as determined by an independent actuary does not materially differ from the fair value of the plan assets, management opted not to recognize further the over (under) funding of the obligation, which is considered insignificant as shown in the analysis below. An analysis of the University’s defined benefit obligation as of May 31 following PIC Interpretation with respect to the defined benefit minimum guarantee under RA 7641 is presented below.
2018 2017 2016
Fair value of plan assets P 709,842,413 P 630,911,276 P 616,500,626 Present value of obligation ( 697,738,212) ( 624,983,652) ( 619,046,290) Over- (under-) funding P 12,104,201 P 5,927,624 (P 2,545,664)
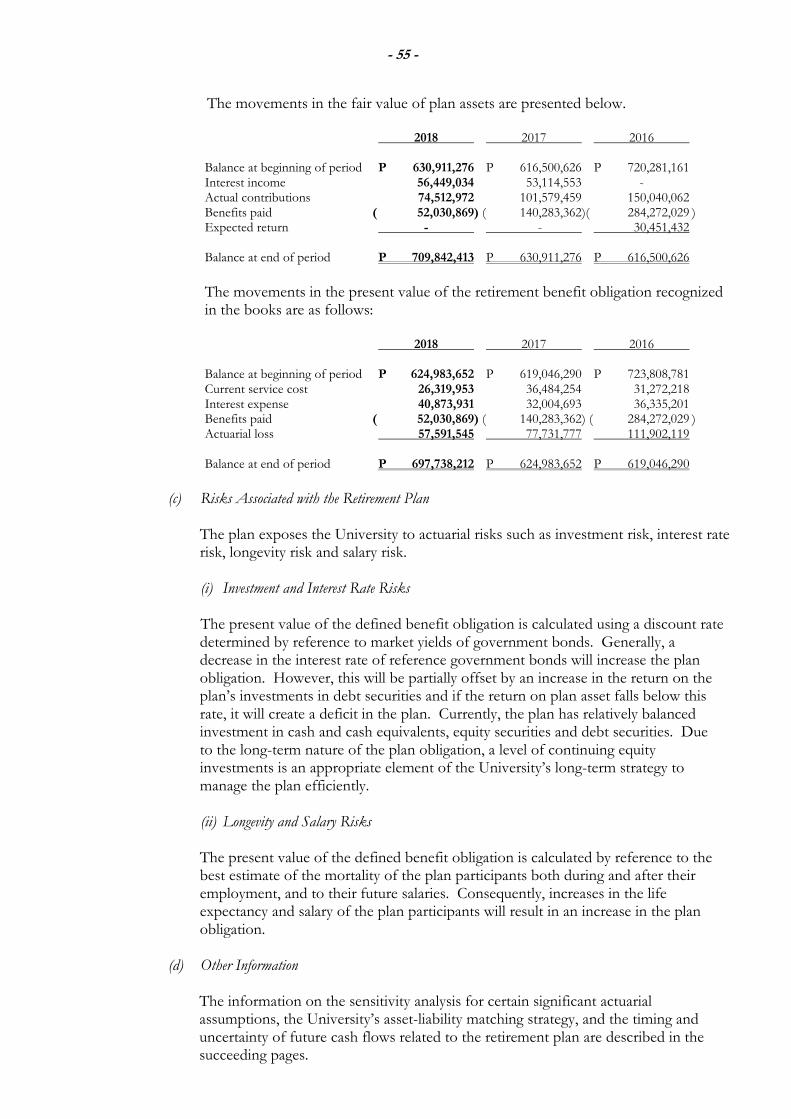
- 55 -
The movements in the fair value of plan assets are presented below. 2018 2017 2016 Balance at beginning of period P 630,911,276 P 616,500,626 P 720,281,161 Interest income 56,449,034 53,114,553 - Actual contributions 74,512,972 101,579,459 150,040,062 Benefits paid ( 52,030,869) ( 140,283,362)( 284,272,029 ) Expected return - - 30,451,432 Balance at end of period P 709,842,413 P 630,911,276 P 616,500,626
The movements in the present value of the retirement benefit obligation recognized in the books are as follows:
2018 2017 2016 Balance at beginning of period P 624,983,652 P 619,046,290 P 723,808,781 Current service cost 26,319,953 36,484,254 31,272,218 Interest expense 40,873,931 32,004,693 36,335,201 Benefits paid ( 52,030,869) ( 140,283,362) ( 284,272,029 ) Actuarial loss 57,591,545 77,731,777 111,902,119 Balance at end of period P 697,738,212 P 624,983,652 P 619,046,290
(c) Risks Associated with the Retirement Plan
The plan exposes the University to actuarial risks such as investment risk, interest rate risk, longevity risk and salary risk.
(i) Investment and Interest Rate Risks The present value of the defined benefit obligation is calculated using a discount rate determined by reference to market yields of government bonds. Generally, a decrease in the interest rate of reference government bonds will increase the plan obligation. However, this will be partially offset by an increase in the return on the plan’s investments in debt securities and if the return on plan asset falls below this rate, it will create a deficit in the plan. Currently, the plan has relatively balanced investment in cash and cash equivalents, equity securities and debt securities. Due to the long-term nature of the plan obligation, a level of continuing equity investments is an appropriate element of the University’s long-term strategy to manage the plan efficiently.
(ii) Longevity and Salary Risks The present value of the defined benefit obligation is calculated by reference to the best estimate of the mortality of the plan participants both during and after their employment, and to their future salaries. Consequently, increases in the life expectancy and salary of the plan participants will result in an increase in the plan obligation.
(d) Other Information
The information on the sensitivity analysis for certain significant actuarial assumptions, the University’s asset-liability matching strategy, and the timing and uncertainty of future cash flows related to the retirement plan are described in the succeeding pages.
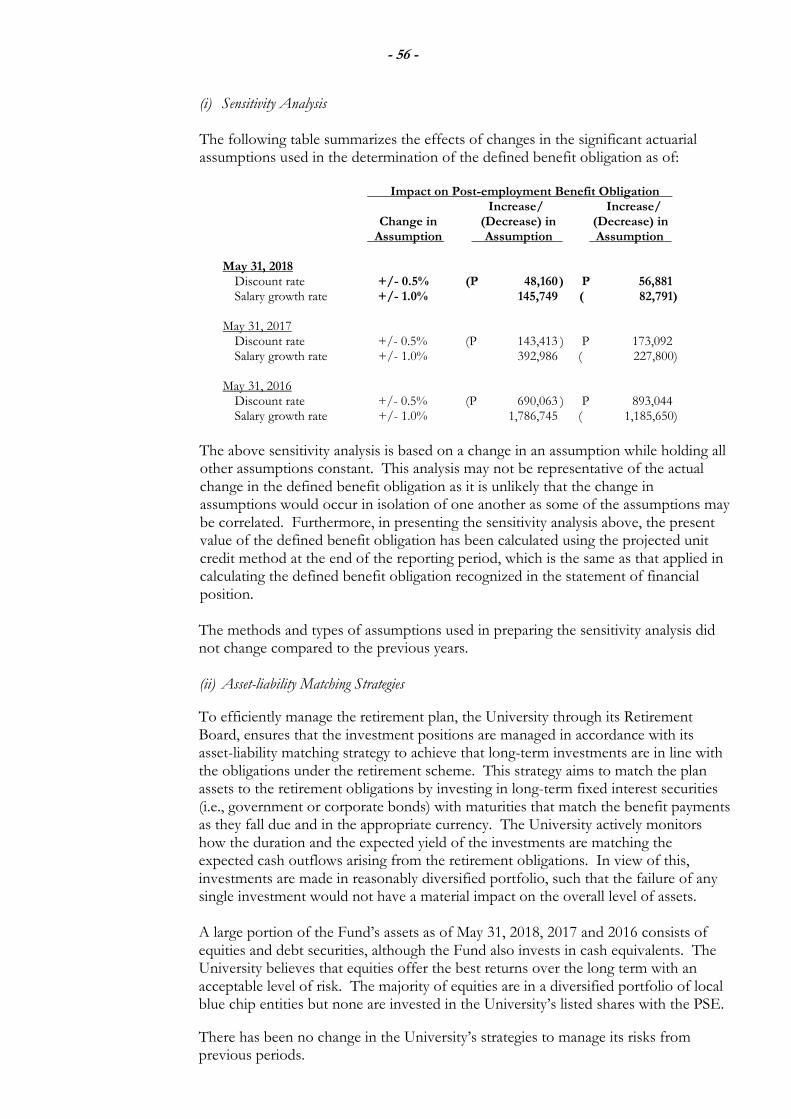
- 56 -
(i) Sensitivity Analysis The following table summarizes the effects of changes in the significant actuarial assumptions used in the determination of the defined benefit obligation as of:
Impact on Post-employment Benefit Obligation Increase/ Increase/ Change in (Decrease) in (Decrease) in Assumption Assumption Assumption May 31, 2018
Discount rate +/- 0.5% (P 48,160 ) P 56,881 Salary growth rate +/- 1.0% 145,749 ( 82,791)
May 31, 2017
Discount rate +/- 0.5% (P 143,413 ) P 173,092 Salary growth rate +/- 1.0% 392,986 ( 227,800)
May 31, 2016
Discount rate +/- 0.5% (P 690,063 ) P 893,044 Salary growth rate +/- 1.0% 1,786,745 ( 1,185,650)
The above sensitivity analysis is based on a change in an assumption while holding all other assumptions constant. This analysis may not be representative of the actual change in the defined benefit obligation as it is unlikely that the change in assumptions would occur in isolation of one another as some of the assumptions may be correlated. Furthermore, in presenting the sensitivity analysis above, the present value of the defined benefit obligation has been calculated using the projected unit credit method at the end of the reporting period, which is the same as that applied in calculating the defined benefit obligation recognized in the statement of financial position. The methods and types of assumptions used in preparing the sensitivity analysis did not change compared to the previous years.
(ii) Asset-liability Matching Strategies
To efficiently manage the retirement plan, the University through its Retirement Board, ensures that the investment positions are managed in accordance with its asset-liability matching strategy to achieve that long-term investments are in line with the obligations under the retirement scheme. This strategy aims to match the plan assets to the retirement obligations by investing in long-term fixed interest securities (i.e., government or corporate bonds) with maturities that match the benefit payments as they fall due and in the appropriate currency. The University actively monitors how the duration and the expected yield of the investments are matching the expected cash outflows arising from the retirement obligations. In view of this, investments are made in reasonably diversified portfolio, such that the failure of any single investment would not have a material impact on the overall level of assets.
A large portion of the Fund’s assets as of May 31, 2018, 2017 and 2016 consists of equities and debt securities, although the Fund also invests in cash equivalents. The University believes that equities offer the best returns over the long term with an acceptable level of risk. The majority of equities are in a diversified portfolio of local blue chip entities but none are invested in the University’s listed shares with the PSE.
There has been no change in the University’s strategies to manage its risks from previous periods.
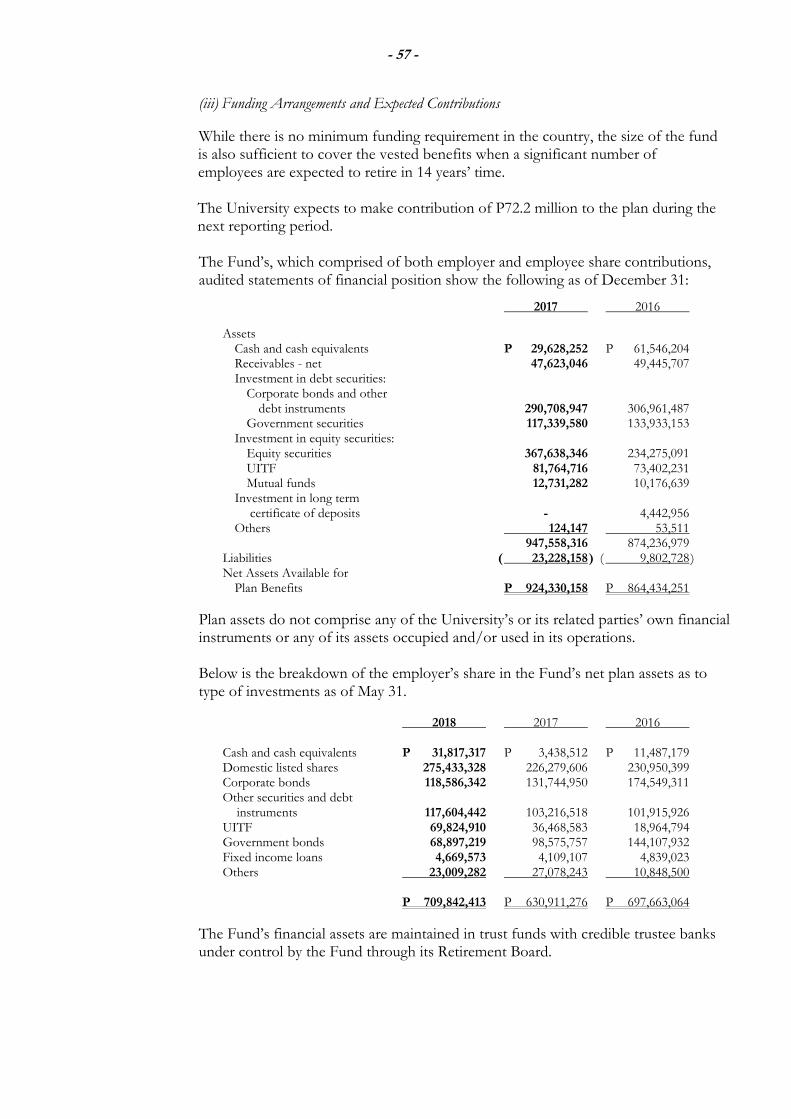
- 57 -
(iii) Funding Arrangements and Expected Contributions
While there is no minimum funding requirement in the country, the size of the fund is also sufficient to cover the vested benefits when a significant number of employees are expected to retire in 14 years’ time. The University expects to make contribution of P72.2 million to the plan during the next reporting period. The Fund’s, which comprised of both employer and employee share contributions, audited statements of financial position show the following as of December 31:
2017 2016
Assets Cash and cash equivalents P 29,628,252 P 61,546,204 Receivables - net 47,623,046 49,445,707
Investment in debt securities: Corporate bonds and other debt instruments 290,708,947 306,961,487 Government securities 117,339,580 133,933,153 Investment in equity securities: Equity securities 367,638,346 234,275,091 UITF 81,764,716 73,402,231 Mutual funds 12,731,282 10,176,639 Investment in long term certificate of deposits - 4,442,956 Others 124,147 53,511 947,558,316 874,236,979 Liabilities ( 23,228,158 ) ( 9,802,728 ) Net Assets Available for Plan Benefits P 924,330,158 P 864,434,251
Plan assets do not comprise any of the University’s or its related parties’ own financial instruments or any of its assets occupied and/or used in its operations.
Below is the breakdown of the employer’s share in the Fund’s net plan assets as to type of investments as of May 31.
2018 2017 2016 Cash and cash equivalents P 31,817,317 P 3,438,512 P 11,487,179 Domestic listed shares 275,433,328 226,279,606 230,950,399 Corporate bonds 118,586,342 131,744,950 174,549,311 Other securities and debt instruments 117,604,442 103,216,518 101,915,926 UITF 69,824,910 36,468,583 18,964,794 Government bonds 68,897,219 98,575,757 144,107,932 Fixed income loans 4,669,573 4,109,107 4,839,023 Others 23,009,282 27,078,243 10,848,500 P 709,842,413 P 630,911,276 P 697,663,064
The Fund’s financial assets are maintained in trust funds with credible trustee banks under control by the Fund through its Retirement Board.
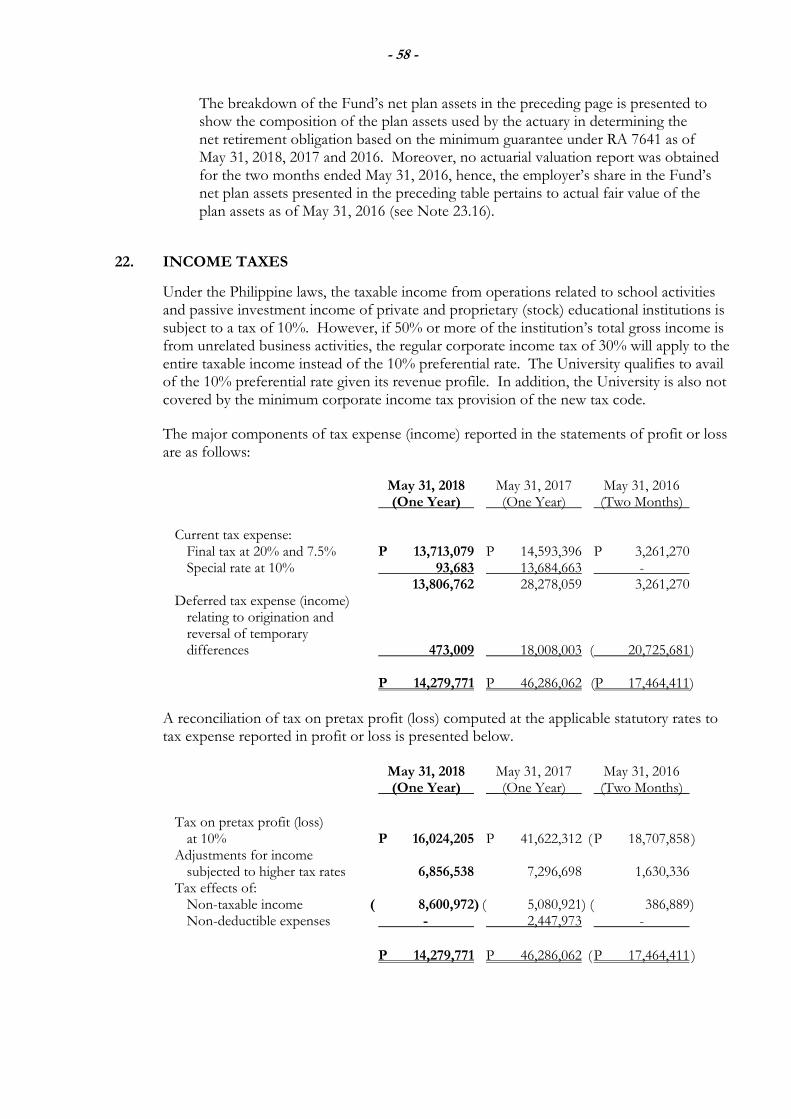
- 58 -
The breakdown of the Fund’s net plan assets in the preceding page is presented to show the composition of the plan assets used by the actuary in determining the net retirement obligation based on the minimum guarantee under RA 7641 as of May 31, 2018, 2017 and 2016. Moreover, no actuarial valuation report was obtained for the two months ended May 31, 2016, hence, the employer’s share in the Fund’s net plan assets presented in the preceding table pertains to actual fair value of the plan assets as of May 31, 2016 (see Note 23.16).
22. INCOME TAXES
Under the Philippine laws, the taxable income from operations related to school activities and passive investment income of private and proprietary (stock) educational institutions is subject to a tax of 10%. However, if 50% or more of the institution’s total gross income is from unrelated business activities, the regular corporate income tax of 30% will apply to the entire taxable income instead of the 10% preferential rate. The University qualifies to avail of the 10% preferential rate given its revenue profile. In addition, the University is also not covered by the minimum corporate income tax provision of the new tax code. The major components of tax expense (income) reported in the statements of profit or loss are as follows:
May 31, 2018 May 31, 2017 May 31, 2016 (One Year) (One Year) (Two Months) Current tax expense: Final tax at 20% and 7.5% P 13,713,079 P 14,593,396 P 3,261,270 Special rate at 10% 93,683 13,684,663 - 13,806,762 28,278,059 3,261,270 Deferred tax expense (income) relating to origination and reversal of temporary differences 473,009 18,008,003 ( 20,725,681 ) P 14,279,771 P 46,286,062 (P 17,464,411 ) A reconciliation of tax on pretax profit (loss) computed at the applicable statutory rates to tax expense reported in profit or loss is presented below.
May 31, 2018 May 31, 2017 May 31, 2016 (One Year) (One Year) (Two Months) Tax on pretax profit (loss) at 10% P 16,024,205 P 41,622,312 ( P 18,707,858 ) Adjustments for income subjected to higher tax rates 6,856,538 7,296,698 1,630,336 Tax effects of: Non-taxable income ( 8,600,972) ( 5,080,921) ( 386,889 ) Non-deductible expenses - 2,447,973 -
P 14,279,771 P 46,286,062 ( P 17,464,411 )
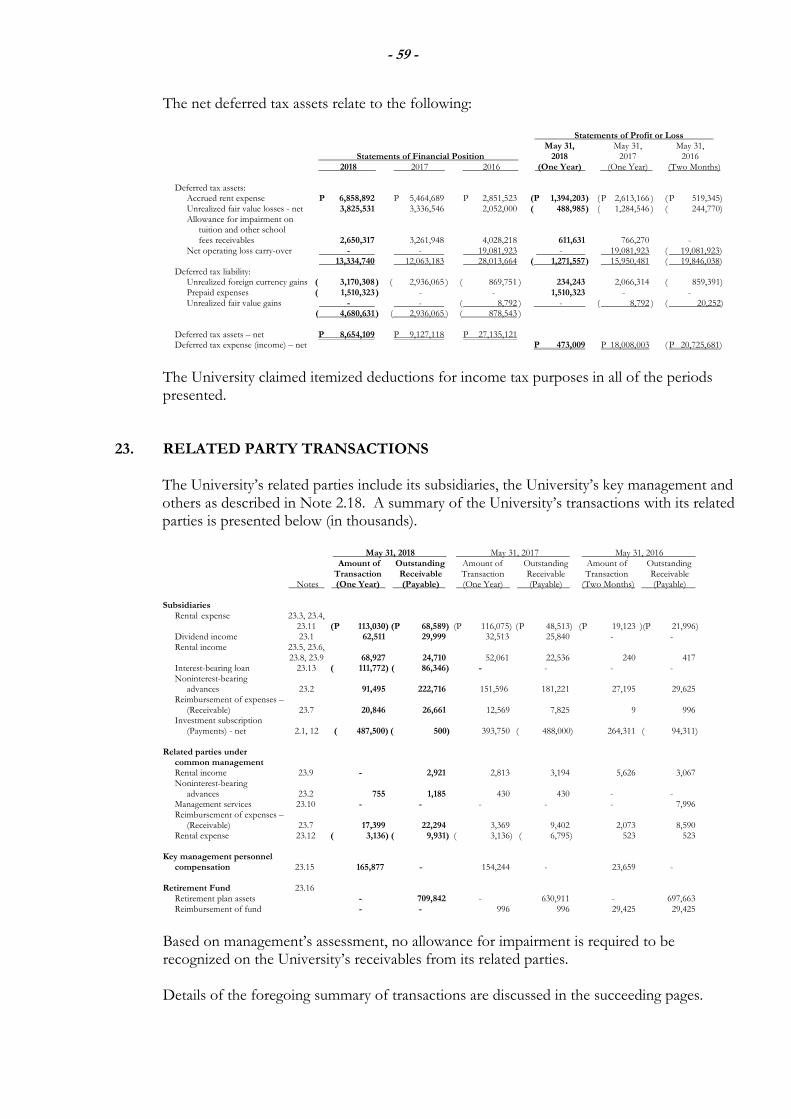
- 59 -
The net deferred tax assets relate to the following: Statements of Profit or Loss May 31, May 31, May 31, Statements of Financial Position 2018 2017 2016 2018 2017 2016 (One Year) (One Year) (Two Months) Deferred tax assets: Accrued rent expense P 6,858,892 P 5,464,689 P 2,851,523 (P 1,394,203 ) ( P 2,613,166 ) ( P 519,345) Unrealized fair value losses - net 3,825,531 3,336,546 2,052,000 ( 488,985 ) ( 1,284,546 ) ( 244,770) Allowance for impairment on tuition and other school fees receivables 2,650,317 3,261,948 4,028,218 611,631 766,270 - Net operating loss carry-over - - 19,081,923 - 19,081,923 ( 19,081,923) 13,334,740 12,063,183 28,013,664 ( 1,271,557 ) 15,950,481 ( 19,846,038) Deferred tax liability: Unrealized foreign currency gains ( 3,170,308 ) ( 2,936,065 ) ( 869,751 ) 234,243 2,066,314 ( 859,391) Prepaid expenses ( 1,510,323 ) - - 1,510,323 - - Unrealized fair value gains - - ( 8,792 ) - ( 8,792 ) ( 20,252) ( 4,680,631 ) ( 2,936,065 ) ( 878,543 ) Deferred tax assets – net P 8,654,109 P 9,127,118 P 27,135,121 Deferred tax expense (income) – net P 473,009 P 18,008,003 ( P 20,725,681)
The University claimed itemized deductions for income tax purposes in all of the periods presented.
23. RELATED PARTY TRANSACTIONS
The University’s related parties include its subsidiaries, the University’s key management and others as described in Note 2.18. A summary of the University’s transactions with its related parties is presented below (in thousands).
May 31, 2018 May 31, 2017 May 31, 2016 Amount of Outstanding Amount of Outstanding Amount of Outstanding Transaction Receivable Transaction Receivable Transaction Receivable Notes (One Year) (Payable) (One Year) (Payable) (Two Months) (Payable) Subsidiaries Rental expense 23.3, 23.4, 23.11 ( P 113,030) (P 68,589) (P 116,075) ( P 48,513) ( P 19,123 )(P 21,996 ) Dividend income 23.1 62,511 29,999 32,513 25,840 - - Rental income 23.5, 23.6, 23.8, 23.9 68,927 24,710 52,061 22,536 240 417 Interest-bearing loan 23.13 ( 111,772) ( 86,346) - - - - Noninterest-bearing advances 23.2 91,495 222,716 151,596 181,221 27,195 29,625 Reimbursement of expenses – (Receivable) 23.7 20,846 26,661 12,569 7,825 9 996 Investment subscription (Payments) - net 2.1, 12 ( 487,500) ( 500) 393,750 ( 488,000) 264,311 ( 94,311) Related parties under common management Rental income 23.9 - 2,921 2,813 3,194 5,626 3,067 Noninterest-bearing advances 23.2 755 1,185 430 430 - - Management services 23.10 - - - - - 7,996 Reimbursement of expenses – (Receivable) 23.7 17,399 22,294 3,369 9,402 2,073 8,590 Rental expense 23.12 ( 3,136) ( 9,931) ( 3,136) ( 6,795) 523 523 Key management personnel compensation 23.15 165,877 - 154,244 - 23,659 - Retirement Fund 23.16 Retirement plan assets - 709,842 - 630,911 - 697,663 Reimbursement of fund - - 996 996 29,425 29,425
Based on management’s assessment, no allowance for impairment is required to be recognized on the University’s receivables from its related parties.
Details of the foregoing summary of transactions are discussed in the succeeding pages.
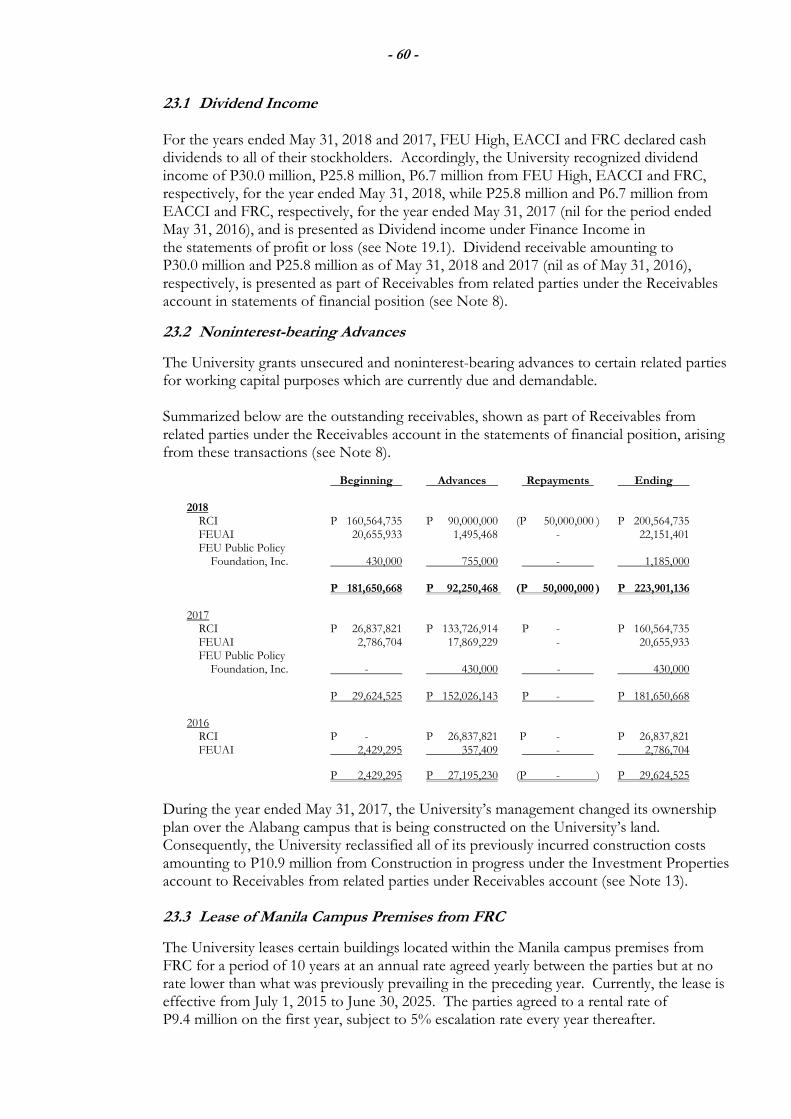
- 60 -
23.1 Dividend Income
For the years ended May 31, 2018 and 2017, FEU High, EACCI and FRC declared cash dividends to all of their stockholders. Accordingly, the University recognized dividend income of P30.0 million, P25.8 million, P6.7 million from FEU High, EACCI and FRC, respectively, for the year ended May 31, 2018, while P25.8 million and P6.7 million from EACCI and FRC, respectively, for the year ended May 31, 2017 (nil for the period ended May 31, 2016), and is presented as Dividend income under Finance Income in the statements of profit or loss (see Note 19.1). Dividend receivable amounting to P30.0 million and P25.8 million as of May 31, 2018 and 2017 (nil as of May 31, 2016), respectively, is presented as part of Receivables from related parties under the Receivables account in statements of financial position (see Note 8).
23.2 Noninterest-bearing Advances
The University grants unsecured and noninterest-bearing advances to certain related parties for working capital purposes which are currently due and demandable.
Summarized below are the outstanding receivables, shown as part of Receivables from
related parties under the Receivables account in the statements of financial position, arising from these transactions (see Note 8).
Beginning Advances Repayments Ending 2018 RCI P 160,564,735 P 90,000,000 (P 50,000,000 ) P 200,564,735 FEUAI 20,655,933 1,495,468 - 22,151,401 FEU Public Policy Foundation, Inc. 430,000 755,000 - 1,185,000 P 181,650,668 P 92,250,468 (P 50,000,000 ) P 223,901,136 2017 RCI P 26,837,821 P 133,726,914 P - P 160,564,735 FEUAI 2,786,704 17,869,229 - 20,655,933 FEU Public Policy Foundation, Inc. - 430,000 - 430,000 P 29,624,525 P 152,026,143 P - P 181,650,668 2016 RCI P - P 26,837,821 P - P 26,837,821 FEUAI 2,429,295 357,409 - 2,786,704
P 2,429,295 P 27,195,230 (P - ) P 29,624,525
During the year ended May 31, 2017, the University’s management changed its ownership plan over the Alabang campus that is being constructed on the University’s land. Consequently, the University reclassified all of its previously incurred construction costs amounting to P10.9 million from Construction in progress under the Investment Properties account to Receivables from related parties under Receivables account (see Note 13).
23.3 Lease of Manila Campus Premises from FRC
The University leases certain buildings located within the Manila campus premises from FRC for a period of 10 years at an annual rate agreed yearly between the parties but at no rate lower than what was previously prevailing in the preceding year. Currently, the lease is effective from July 1, 2015 to June 30, 2025. The parties agreed to a rental rate of P9.4 million on the first year, subject to 5% escalation rate every year thereafter.
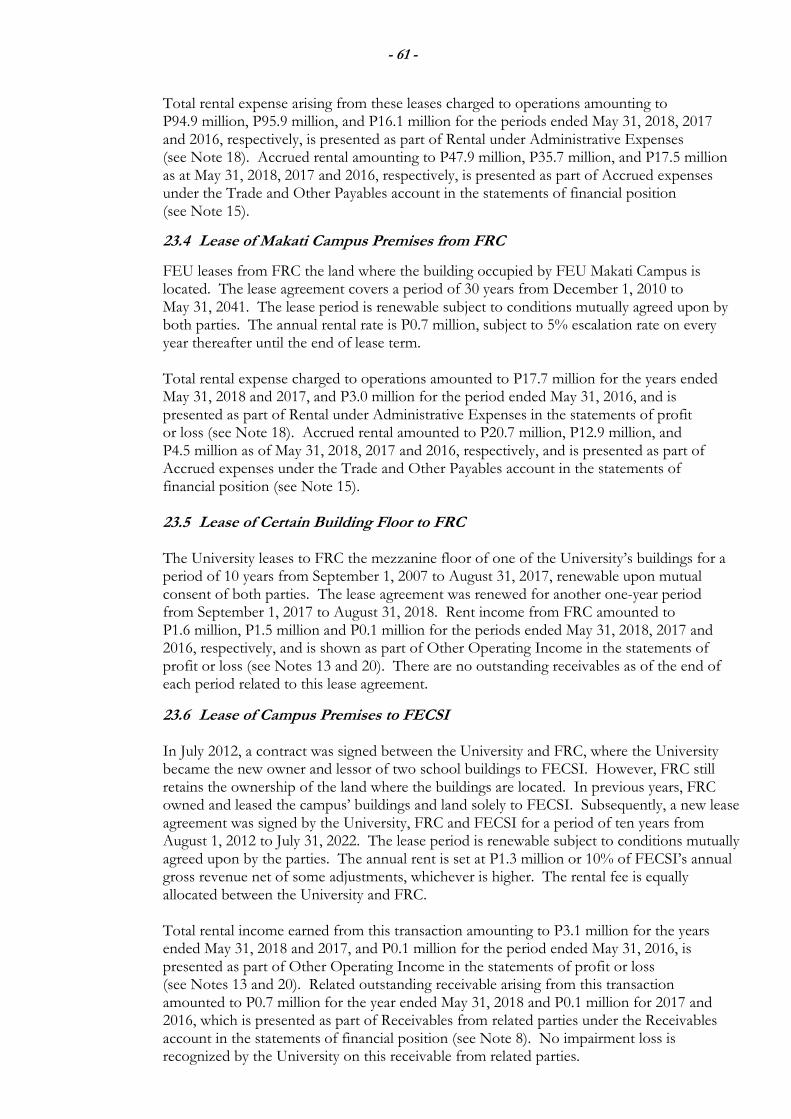
- 61 -
Total rental expense arising from these leases charged to operations amounting to P94.9 million, P95.9 million, and P16.1 million for the periods ended May 31, 2018, 2017 and 2016, respectively, is presented as part of Rental under Administrative Expenses (see Note 18). Accrued rental amounting to P47.9 million, P35.7 million, and P17.5 million as at May 31, 2018, 2017 and 2016, respectively, is presented as part of Accrued expenses under the Trade and Other Payables account in the statements of financial position (see Note 15).
23.4 Lease of Makati Campus Premises from FRC
FEU leases from FRC the land where the building occupied by FEU Makati Campus is located. The lease agreement covers a period of 30 years from December 1, 2010 to May 31, 2041. The lease period is renewable subject to conditions mutually agreed upon by both parties. The annual rental rate is P0.7 million, subject to 5% escalation rate on every year thereafter until the end of lease term. Total rental expense charged to operations amounted to P17.7 million for the years ended May 31, 2018 and 2017, and P3.0 million for the period ended May 31, 2016, and is presented as part of Rental under Administrative Expenses in the statements of profit or loss (see Note 18). Accrued rental amounted to P20.7 million, P12.9 million, and P4.5 million as of May 31, 2018, 2017 and 2016, respectively, and is presented as part of Accrued expenses under the Trade and Other Payables account in the statements of financial position (see Note 15). 23.5 Lease of Certain Building Floor to FRC
The University leases to FRC the mezzanine floor of one of the University’s buildings for a period of 10 years from September 1, 2007 to August 31, 2017, renewable upon mutual consent of both parties. The lease agreement was renewed for another one-year period from September 1, 2017 to August 31, 2018. Rent income from FRC amounted to P1.6 million, P1.5 million and P0.1 million for the periods ended May 31, 2018, 2017 and 2016, respectively, and is shown as part of Other Operating Income in the statements of profit or loss (see Notes 13 and 20). There are no outstanding receivables as of the end of each period related to this lease agreement.
23.6 Lease of Campus Premises to FECSI
In July 2012, a contract was signed between the University and FRC, where the University became the new owner and lessor of two school buildings to FECSI. However, FRC still retains the ownership of the land where the buildings are located. In previous years, FRC owned and leased the campus’ buildings and land solely to FECSI. Subsequently, a new lease agreement was signed by the University, FRC and FECSI for a period of ten years from August 1, 2012 to July 31, 2022. The lease period is renewable subject to conditions mutually agreed upon by the parties. The annual rent is set at P1.3 million or 10% of FECSI’s annual gross revenue net of some adjustments, whichever is higher. The rental fee is equally allocated between the University and FRC. Total rental income earned from this transaction amounting to P3.1 million for the years ended May 31, 2018 and 2017, and P0.1 million for the period ended May 31, 2016, is presented as part of Other Operating Income in the statements of profit or loss (see Notes 13 and 20). Related outstanding receivable arising from this transaction amounted to P0.7 million for the year ended May 31, 2018 and P0.1 million for 2017 and 2016, which is presented as part of Receivables from related parties under the Receivables account in the statements of financial position (see Note 8). No impairment loss is recognized by the University on this receivable from related parties.
- 62 -
23.7 Reimbursement of Expenses
During the periods ended May 31, 2017 and 2016 (nil in 2018), the University billed EAEF for related services such as security and janitorial services, light and water and other utilities at cost. Accordingly, the outstanding receivable amounting to P4.9 million, P9.2 million and P7.9 million as of May 31, 2018, 2017 and 2016, respectively, is presented as part of Receivables from related parties under the Receivables account in the statements of financial position (see Note 8). During the year ended May 31, 2018, the University billed FECSI for the salaries and other benefits of its duly appointed executive director at cost. Accordingly, the outstanding receivable amounting to P6.5 million as of May 31, 2018 is presented as part of Receivables from related parties under the Receivables account in the statement of financial position (see Note 8). No similar transaction occurred during the periods ended May 31, 2017 and 2016.
During the periods ended May 31, 2018, 2017 and 2016, the University billed FEU High for light, water and other allocated expenses at cost. Accordingly, the outstanding receivable amounting to P12.3 million, P2.3 million and P1.4 million as of May 31, 2018, 2017 and 2016, respectively, is presented as part of Receivables from related parties under the Receivables account in the statements of financial position (see Note 8).
During the years ended May 31, 2018 and 2017, the University billed RCI for consultants’ salaries, legal fees and other allocated expenses at cost. Accordingly, the outstanding receivable amounting to P4.2 million and P5.0 million as of May 31, 2018 and 2017, respectively, is presented as part of Receivables from related parties under the Receivables account in the statement of financial position (see Note 8). During the years ended May 31, 2018 and 2017, the University billed FEU Public Policy Foundation, Inc. for the salaries of its executive director and staff, and other allocated expenses at cost. Accordingly, the outstanding receivable amounting to P2.4 million as of May 31, 2018, and P0.2 million as of May 31, 2017 and 2016 is presented as part of Receivables from related parties under the Receivables account in the statements of financial position (see Note 8). During the periods ended May 31, 2018, 2017 and 2016, the University billed EACCI for light, water and other allocated expenses at cost. Accordingly, the outstanding receivable amounting to P3.6 million, P0.8 million and P0.5 million as of May 31, 2018, 2017 and 2016, respectively, is presented as part of Receivables from related parties under the Receivables account in the statements of financial position (see Note 8). During the year ended May 31, 2018, 2017 and 2016, the University billed FRC for various allocated expenses and for which the outstanding receivable amounting to P0.1 million is presented as part of Receivables from related parties under the Receivables account in the 2018 statement of financial position (see Note 8). During the years ended May 31, 2018, the University billed NREF for the salaries of its executive director, and other allocated expenses amounting to P15.0 million which outstanding receivable as of May 31, 2018 is presented as part of Receivables from related parties under the Receivables account in the statement of financial position (see Note 8).
- 63 -
23.8 Sub-lease of Buildings to FEU High
In June 2016, the University sub-leased its Nursing Building (being leased out from FRC) to FEU High for a period of one year until May 31, 2017. In June 2017, the University and FEU High entered into a new lease agreement for a period of one year until May 31, 2018, covering both the Nursing and the Accounts, Business and Finance Buildings. Total rental income from this transaction amounted to P39.8 million and P21.8 million for the years ended May 31, 2018 and 2017, respectively, and is presented as part of Other Operating Income in the statements of profit or loss for the years ended May 31, 2018 and 2017. Outstanding receivable arising from this transaction amounting to P22.0 million, P22.5 million and P0.1 million as of May 31, 2018, 2017 and 2016, respectively, is presented as part of Receivables from related parties under the Receivables account in the statements of financial position (see Note 8).
23.9 Lease of Certain Buildings to EAEF and EACCI
The University leases out certain buildings to EAEF for a period of one to five years until March 31, 2015. However, upon expiration of the term of the contract, the University and EAEF had mutually agreed not to renew such lease agreement (see Note 13). Instead, as of May 31, 2016, only certain floors of the buildings were leased out to EAEF.
Total rental income from EAEF, presented as part of Other Operating Income in the statements of profit or loss, amounted to P2.9 million and P5.6 million for the periods ended May 31, 2017 and 2016, respectively (see Note 20). Related receivables arising from this transaction as of May 31, 2018, 2017 and 2016 amounting to P2.9 million, P3.2 million and P3.1 million, respectively, is presented as part of Receivables from related parties under the Receivables account in the statements of financial position (see Note 8). Starting July 2016, upon take-over of EACCI of the EAEF’s operations, the lease of the buildings was transferred to the custody of EACCI. A new lease contract for a period of ten years until June 30, 2026 was entered into by the University and EACCI. Monthly rental of P2.1 million (exclusive of VAT) from July 2016 to February 2017 and P2.0 million (inclusive of VAT) for March 2017 onwards, was billed to EACCI. Total rental income from EACCI, presented as part of Other Operating Income in the statements of profit or loss, amounted to P24.5 and P25.7 million for the years ended May 31, 2018 and 2017, respectively (see Note 20). Outstanding receivables arising from this transaction amounting to P2.0 million as of May 31, 2018 is presented as part of Receivables from related parties under the Receivables account in the statement of financial position (see Note 8). No similar transaction occurred for the period ended May 31, 2017 and 2016. 23.10 Management Services The University provided management services to EAEF which agreed to pay management fee computed at a certain percentage of the latter’s gross revenue subject to certain conditions. There were no management fees earned during the periods ended May 31, 2018, 2017 and 2016 as EACCI already took over the operations of EAEF during the year ended May 31, 2017. Outstanding receivable arising from this transaction in prior years amounted to P8.0 million as of May 31, 2016 which is presented as part of Receivables from related parties under the Receivables account in the statements of financial position (see Note 8).
- 64 -
23.11 Lease of Facilities from EACCI The University conducts certain Physical Education classes using EACCI’s swimming facilities. Total rental expense charged to operations amounted to P0.5 million and P2.5 million for the years ended May 31, 2018 and 2017, respectively, (nil for the period ended May 31, 2016) and is presented as part of Rental under Administrative Expenses (see Note 18). There was no outstanding balance from this transaction as of May 31, 2018, 2017 and 2016.
23.12 Lease of Facilities from Nicanor Reyes Educational Foundation, Inc. (NREF) FEU leases from NREF certain sports facilities for use by the University’s athletes. The lease agreement covers a period of ten years from April 1, 2014 to March 31, 2024. The annual rental rate is determined every year subject to conditions mutually agreed upon by both parties. Total rental expense charged to operations amounted to P3.1 million, P3.1 million and P0.5 million for the periods ended May 31, 2018, 2017 and 2016, respectively, and is presented as part of Rental under Administrative Expenses (see Note 18). Outstanding payable arising from this transaction is presented as part of Accrued expenses under the Trade and Other Payables account in the statements of financial position (see Note 15). 23.13 Interest-bearing Loan from FEU High In November 2017, the University obtained a P75.8 million interest-bearing loan from FEU High. The loan bears interest based on a 91-day time deposit rate plus 0.10%. The loan has a term of 90 days. The agreement provides for a 3% late payment interest on any unpaid principal and interest, computed per annum from maturity date until full payment. The outstanding balance of this loan amounted to P50.8 million as of May 31, 2018 and is presented as part of Advances from a related party account in the 2018 statement of financial position. Related interest amounting to P0.9 million was recognized in profit or loss as part of Finance Costs in the 2018 statement of profit or loss (see Note 19.2). Accrued interest payable amounting to P0.5 million as of May 31, 2018 is presented as part of Accrued expenses under the Trade and Other Payables account in the 2018 statement of financial position (see Note 15). In May 2018, the University obtained another loan from FEU High amounting to P35.0 million. The loan bears an interest rate of 3% per annum. The loan will mature in July 2018 and the agreement provides for a 3% late payment interest on any unpaid principal and interest, computed per annum from maturity date until full payment. Related interest amounting to P0.1 million was recognized in profit or loss as part of Finance Costs in the 2018 statement of profit or loss (see Note 19.2). Accrued interest payable amounting to P0.1 million as of May 31, 2018 is presented as part of Accrued expenses under the Trade and Other Payables account in the 2018 statement of financial position (see Note 15).
- 65 -
23.14 Financial Guaranty for Subsidiaries’ Loans In March 2017 and January 2018, the BOT approved that for and in consideration of the loan or credit facilities obtained by any subsidiary of the University, in which the University owns at least 75% of the outstanding voting capital stock of such subsidiary, from a certain local commercial bank, the University gives its full consent and authority to act as surety up to P0.5 million for the subsidiary’s obligations arising from any loan or availments from any credit facilities granted by the said local bank in favor of the subsidiary, as well as any renewals, increases, extensions of existing obligations obtained by or which may hereafter be obtained by the subsidiary from the local bank, whether direct or indirect, principal or secondary. As of May 31, 2018 (nil as of May 31, 2017), RCI has availed a loan amounting to P70.0 million from the said local bank.
23.15 Key Management Personnel Compensation Total remuneration of the University’s key management personnel presented as part of Salaries and allowances and Employees benefits, which is part of Instructional and Academic expenses, under Operating Expenses (see Note 18) is as follows:
May 31, 2018 May 31, 2017 May 31, 2016 (One Year) (One Year) (Two Months) Salaries and short-term benefits P 142,468,082 P 132,725,170 P 20,336,298 Post-employment benefits 23,408,439 21,518,544 3,322,864 P 165,876,521 P 154,243,714 P 23,659,162
23.16 Retirement Fund
The University’s retirement fund is in the form of trustee-banks managed accounts. The fair value of the University’s retirement plan assets amounted to P709.8 million, P630.9 million and P697.7 million as of May 31, 2018, 2017 and 2016, respectively. Details of the retirement plan are presented in Note 21.2(d)(iii). The University has no transactions with the retirement plan other than contributions and benefit payments in all periods presented. During the periods ended May 31, 2017 and 2016, the University funded the retirement pay of certain employees who availed of the ERGP (see Note 21), which will be reimbursed by the Fund. The outstanding receivable from this transaction amounted to P1.0 million and P29.4 million as of May 31, 2017 and 2016 (nil as of May 31, 2018), respectively, and is recorded as part of Receivables from related parties under the Receivables account in the statements of financial position (see Note 8). None of the retirement plan assets are invested in or provided to the University and/or its related parties, except for advances or loans granted to the University’s officers. The retirement fund neither provides any guarantee nor surety for any obligation of the University.
- 66 -
24. EQUITY
24.1 Capital Stock
As of May 31, 2018, 2017 and 2016, the University has 20,000,000 shares of authorized capital stock, of which 16,477,023 were issued and outstanding, with par value of P100 per share.
Also, the University’s treasury stock acquired in prior years amounted to P3.7 million or 37,331 shares as of May 31, 2018, 2017 and 2016.
On July 11, 1986, the SEC approved the listing of the University’s common shares, its only listed securities, at an offer price of P100 per share. As of May 31, 2018, 2017 and 2016, there are 16,514,354 listed shares which include those held in treasury and shares held by the University’s related parties. The University has a total of 10,839,166, 10,834,034 and 10,816,929 listed shares, which is equivalent to 65.78%, 65.75% and 65.64%, held by related parties as at May 31, 2018, 2017 and 2016, respectively, while there are 5,637,857, 5,642,989 and 5,660,754 listed shares owned by the public which is equivalent to 34.22%, 34.25% and 34.36% of the total outstanding shares as at May 31, 2018, 2017 and 2016, respectively.
As of May 31, 2018, 2017 and 2016, the closing price of the University’s listed shares was P910 per share.
24.2 Retained Earnings
Significant transactions affecting Retained Earnings, which includes the amount equivalent to the cost of the University’s treasury shares of P3.7 million, are as follows:
(a) Appropriation of Retained Earnings
As of May 31, 2018, 2017 and 2016, the University’s Appropriated Retained Earnings consists of appropriations for:
2018 2017 2016 Property and investment P 2,000,000,000 P 2,250,000,000 P 2,250,000,000 acquisition Expansion of facilities 324,800,000 187,000,000 187,000,000 Contingencies 240,000,000 10,000,000 10,000,000 General retirement 140,000,000 90,000,000 90,000,000 Purchase of equipment and improvements 135,200,000 33,000,000 33,000,000 Treasury stock 3,733,100 3,733,100 3,733,100 P 2,843,733,100 P 2,573,733,100 P 2,573,733,100 The changes in the appropriated retained earnings during the year ended May 31, 2018 are shown below.
Balance at beginning of year P 2,573,733,100 Appropriations 520,000,000 Reversal of appropriations ( 250,000,000) Balance at end of year P 2,843,733,100
- 67 -
During the year ended May 31, 2018, the University made an additional appropriation, amounting to P520.0 million, for expansion of facilities, contingencies, general retirement and purchase of equipment and improvements. Such appropriation is expected to be realized within one year from the end of the reporting period. During the same year, the University reversed appropriations for property acquisition and investment amounting to P250.0 million as the purpose for which such appropriations were made had been completed. No changes were made in the appropriated retained earnings during the periods ended May 31, 2017 and 2016.
(b) Dividend Declaration
The BOT approved the following dividend declarations during the periods ended: Date of Declaration Record Payment/Issuance Amount
May 31, 2018
Cash dividend of P8 per share September 19, 2017 October 4, 2017 October 18, 2017 P 131,816,184 Cash dividend of P8 per share February 20, 2018 March 6, 2018 March 20, 2018 131,816,184
P 263,632,368 May 31, 2017 Cash dividend of P12 per share June 21, 2016 July 5, 2016 July 19, 2016 P 197,724,276 Cash dividend of P10 per share February 21, 2017 March 7, 2017 March 21, 2017 164,770,230
P 362,494,506
Unclaimed checks related to dividends declared as of May 31, 2018 and 2017 are presented as Dividends payable under the Trade and Other Payables account in the statements of financial position (see Note 15). No dividends were declared for the two months ended May 31, 2016.
25. EARNINGS (LOSS) PER SHARE
Earnings (loss) amounts were computed as follows:
May 31, 2018 May 31, 2017 May 31, 2016 (One Year) (One Year) (Two Months) Net profit (loss) P 145,962,283 P 369,937,059 (P 169,614,167 ) Divided by number of outstanding shares, net of treasury stock of 37,331 shares 16,477,023 16,477,023 16,477,023
Basic and diluted earnings (loss) per share P 8.86 P 22.45 ( P 10.29)
The weighted average number of outstanding shares is the same as the actual number of outstanding shares as of May 31, 2018, 2017 and 2016.
- 68 -
The University has no dilutive potential common shares as of May 31, 2018, 2017 and 2016; hence, the diluted earnings (loss) per share is the same as the basic earnings (loss) per share in all the periods presented.
26. EVENTS AFTER THE END OF THE REPORTING PERIOD
On August 28, 2018, the University’s BOT approved the following changes in the appropriation of retained earnings as of May 31, 2018:
May 31, 2018 Reversal August 28, 2018 Property and investment
acquisition P 2,000,000,000 (P 369,000,000 ) P 1,631,000,000 Expansion of facilities 324,800,000 ( 160,800,000 ) 164,000,000 Contingencies 240,000,000 ( 50,000,000 ) 190,000,000
General retirement 140,000,000 ( 50,000,000 ) 90,000,000 Purchase of equipment and improvements 135,200,000 ( 43,200,000 ) 92,000,000 Treasury stock 3,733,100 - 3,733,100 P 2,843,733,100 ( P 673,000,000 ) P 2,170,733,100
The foregoing post year-end event did not have any impact on its financial statements as of and for the year ended May 31, 2018.
27. COMMITMENTS AND CONTINGENCIES
The following are the significant commitments and contingencies involving the University:
27.1 Operating Lease Commitments – University as Lessee (a) Lease Agreement with FRC
The University is a lessee under operating leases covering certain buildings for a period of ten years from July 1, 2005 to June 30, 2015. In July 2015, the lease contract was renewed for another ten years, which will expire on June 30, 2025, subject to annual escalation rate of 5%.
The University also entered into other contracts of lease for the land where the building occupied by FEU Makati is located for a period of 30 years and for the lease of various sports facilities covering a gymnasium, football field and classrooms for a period of ten years, as discussed in Notes 23.4 and 23.3, respectively. The future minimum rentals payable under these non-cancellable operating leases as of May 31, 2018, 2017 and 2016 are as follows:
2018 2017 2016 Within one year P 98,273,575 P 93,515,870 P 94,075,321 After one year but not more than five years 548,535,457 526,513,278 511,915,548
More than five years 474,468,401 594,682,244 740,792,713 P 1,121,277,433 P 1,214,711,392 P 1,346,783,582
- 69 -
27.2 Operating Lease Commitments – University as Lessor The University leases out certain buildings to EAEF, EACCI, FEU High and FECSI and the mezzanine floor to FRC for a period of one to ten years (see Notes 13, 23.5, 23.6, 23.8 and 23.9).
Future minimum rental receivables as of May 31, excluding contingent rental, under these operating leases are as follows:
2018 2017 2016 Within one year P 22,816,026 P 22,816,026 P 35,196,560 After one year but not more than five years 89,831,091 89,831,091 -
More than five years 45,537,027 89,352,573 - P 158,184,144 P 201,999,690 P 35,196,560 The University is also a lessor in various lease contracts with third party lessees. The terms of the lease vary but does not exceed one year. Total rentals earned from these operating leases amounted to P1.4 million for the periods ended May 31, 2018 and 2016, and P5.5 million for the period ended May 31, 2017, which is presented as part of Other Operating Income in the statements of profit or loss.
27.3 Open Legal Cases
As of May 31, 2018, the University has a pending case against the local government of City of Manila where it is contesting the imposition of local business tax on the tuition fees collected. The University’s protest is grounded on the following premises: (i) the lack of specific provision in the Local Government Code and in the Local Tax Code of Manila authorizing the City of Manila to impose a business tax of 1% on tuition fees; (ii) prescription; and, (iii) violation of due process. The local business tax being contested covers taxable years 2009 to 2013.
Also, as of the same date, the University is a defendant in certain civil cases, which are pending before the National Labor Relations Commission, Court of Appeals and the Supreme Court.
As of May 31, 2018, no final decision has been rendered by the courts in the above-mentioned cases; hence, no provision for contingencies is recognized. The University’s management and its legal counsel believe that liabilities, if any, which may result from the outcome of these cases, will not materially affect the financial position and results of operations of the University.
27.4 Others
There are other contingencies that arise in the normal course of business that are not recognized in the University’s financial statements. Management believes that losses, if any, arising from these commitments and contingencies will not materially affect its financial statements, however, the University opted to appropriate portion of its retained earnings to cover for such contingencies (see Note 24.2).
- 70 -
28. CAPITAL MANAGEMENT OBJECTIVES, POLICIES AND PROCEDURES The University aims to provide returns on equity to shareholders while managing operational and strategic objectives. The University manages its capital structure and makes adjustments to it, in the light of changes in economic conditions. To maintain or adjust capital structure, the University may adjust the dividend payment to shareholders, return capital to shareholders or issue new shares. The University defines capital as paid-in capital stock and retained earnings, both appropriated and unappropriated. Other components of equity such as treasury stock and revaluation reserves are excluded from capital for purposes of capital management. The BOT has overall responsibility for monitoring of capital in proportion to risks. Profiles for capital ratios are set in the light of changes in the University’s external environment and the risks underlying the University’s business, operation and industry.
The University monitors capital on the basis of debt-to-equity ratio, which is calculated as total liabilities divided by total adjusted equity (comprised of capital stock and retained earnings). Capital for the reporting periods May 31, 2018, 2017 and 2016 and is summarized below.
May 31, 2017 May 31, 2016 [As Restated – [As Restated – May 31, 2018 see Note 2.1(d)] see Note 2.1(d)] (One Year) (One Year) (Two Months)
Total liabilities P 3,451,830,986 P 3,240,589,834 P 2,301,324,610 Total adjusted equity 5,473,733,834 5,591,403,919 5,583,961,366
Debt-to-equity ratio 0.63 : 1.00 0.58 : 1.00 0.41 : 1.00
The University’s goal in capital management is to maintain a lower liability compared with its adjusted equity or debt-to-equity structure ratio of not more than 1.00:1.00. This is in line with the University’s bank covenants related to its interest-bearing loans to a certain bank (see Note 16). The University has complied with its covenant obligations, including maintaining the required debt-to-equity ratios and debt service credit reserve (DSCR) which are both based on the University’s consolidated financial statements for all periods presented. There was no significant change in the University’s approach to capital management during the year.
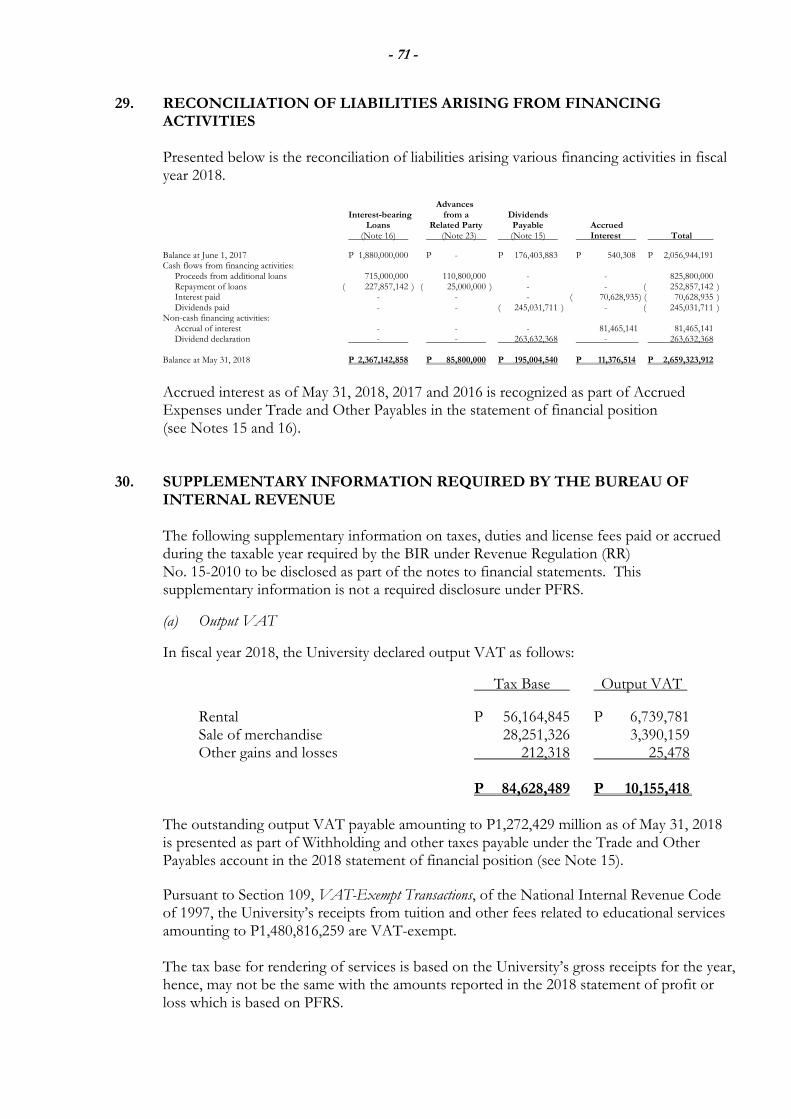
- 71 -
29. RECONCILIATION OF LIABILITIES ARISING FROM FINANCING ACTIVITIES
Presented below is the reconciliation of liabilities arising various financing activities in fiscal year 2018.
Advances Interest-bearing from a Dividends Loans Related Party Payable Accrued (Note 16) (Note 23) (Note 15) Interest Total
Balance at June 1, 2017 P 1,880,000,000 P - P 176,403,883 P 540,308 P 2,056,944,191 Cash flows from financing activities: Proceeds from additional loans 715,000,000 110,800,000 - - 825,800,000 Repayment of loans ( 227,857,142 ) ( 25,000,000 ) - - ( 252,857,142 ) Interest paid - - - ( 70,628,935 ) ( 70,628,935 ) Dividends paid - - ( 245,031,711 ) - ( 245,031,711 ) Non-cash financing activities: Accrual of interest - - - 81,465,141 81,465,141 Dividend declaration - - 263,632,368 - 263,632,368
Balance at May 31, 2018 P 2,367,142,858 P 85,800,000 P 195,004,540 P 11,376,514 P 2,659,323,912
Accrued interest as of May 31, 2018, 2017 and 2016 is recognized as part of Accrued Expenses under Trade and Other Payables in the statement of financial position (see Notes 15 and 16). 30. SUPPLEMENTARY INFORMATION REQUIRED BY THE BUREAU OF
INTERNAL REVENUE
The following supplementary information on taxes, duties and license fees paid or accrued during the taxable year required by the BIR under Revenue Regulation (RR) No. 15-2010 to be disclosed as part of the notes to financial statements. This supplementary information is not a required disclosure under PFRS.
(a) Output VAT
In fiscal year 2018, the University declared output VAT as follows:
Tax Base Output VAT
Rental P 56,164,845 P 6,739,781 Sale of merchandise 28,251,326 3,390,159 Other gains and losses 212,318 25,478
P 84,628,489 P 10,155,418
The outstanding output VAT payable amounting to P1,272,429 million as of May 31, 2018 is presented as part of Withholding and other taxes payable under the Trade and Other Payables account in the 2018 statement of financial position (see Note 15).
Pursuant to Section 109, VAT-Exempt Transactions, of the National Internal Revenue Code of 1997, the University’s receipts from tuition and other fees related to educational services amounting to P1,480,816,259 are VAT-exempt. The tax base for rendering of services is based on the University’s gross receipts for the year, hence, may not be the same with the amounts reported in the 2018 statement of profit or loss which is based on PFRS.
- 72 -
(b) Input VAT Pursuant to Section 109, the University is not allowed any tax credit of input VAT on its purchases related to educational services. The movements in Input VAT are summarized below: Balance at beginning of year P 17,768,995 Services lodged under cost of services 5,059,302 Applied against output VAT ( 2,486,943 ) Balance at end of year P 20,341,354 (c) Taxes on Importation The University did not have any importations in fiscal year 2018. (d) Excise Tax The University did not have any transactions in fiscal year 2018, which are subject to excise tax.
(e) Documentary Stamp Tax In fiscal year 2018, the University paid and accrued documentary stamp tax (DST) for the following transactions:
Loan agreement P 3,282,564 Miscellaneous 1,014,151
P 4,296,715
(f) Taxes and Licenses Details of taxes and licenses in fiscal year 2018 are as follows (see Note 18):
DST P 4,296,715 Real property tax 1,988,273 Municipal licenses and permits 1,731,349 Community tax 10,500 Miscellaneous 19,571
P 8,046,408
(g) Withholding Taxes
Details of total withholding taxes for the fiscal year ended May 31, 2018 are shown below.
Compensation P 135,591,792 Expanded 21,721,556 Final 8,034,612
P 165,347,960

- 73 -
(h) Deficiency Tax Assessments and Tax Cases
As of May 31, 2018, the University does not have any final deficiency tax assessments with the BIR nor does it have tax cases outstanding or pending in courts or bodies outside of the BIR in any of the open taxable years.
P W 0 0 0 0 0 5 3 8
F A R E A S T E R N U N I V E R S I T Y , I N C .
A N D S U B S I D I A R I E S
N I C A N O R R E Y E S , S R . S T R E E T ,
S A M P A L O C , M A N I L A
1 7 - A S E C
N I C A N O R R E Y E S , S R . S T R E E T ,
S A M P A L O C , M A N I L A
ATTY. SANTIAGO L. GARCIA, JR.
735 - 8686
Note: In case of death, resgination or cessation of office of the officer designated as contact person, such incident shall be reported to the Commission within thirty
(30) calendar days from the occurrence thereof with information and complete contact details of the new contact person designated.
Annual Meeting Fiscal Year
735 - [email protected]
N/A
-
Contact Person's Address
1,508THIRD SATURDAY OF
OCTOBERMay 31
CONTACT PERSON INFORMATIONThe designated contact person MUST be an Officer of the Corporation
Name of Contact Person Email Address Telephone Number/s Mobile Number
No. of StockholdersMonth/Day Month/Day
Form Type Department requiring the report Secondary License Type, If Applicable
COMPANY INFORMATIONCompany's Email Address Company's Telephone Number/s Mobile Number
N/A
Principal Office ( No./Street/Barangay/City/Town)Province)
COVER SHEETCOVER SHEETCOVER SHEETCOVER SHEETforforforfor
AUDITED FINANCIAL STATEMENTSAUDITED FINANCIAL STATEMENTSAUDITED FINANCIAL STATEMENTSAUDITED FINANCIAL STATEMENTS
SEC Registration Number
Company Name

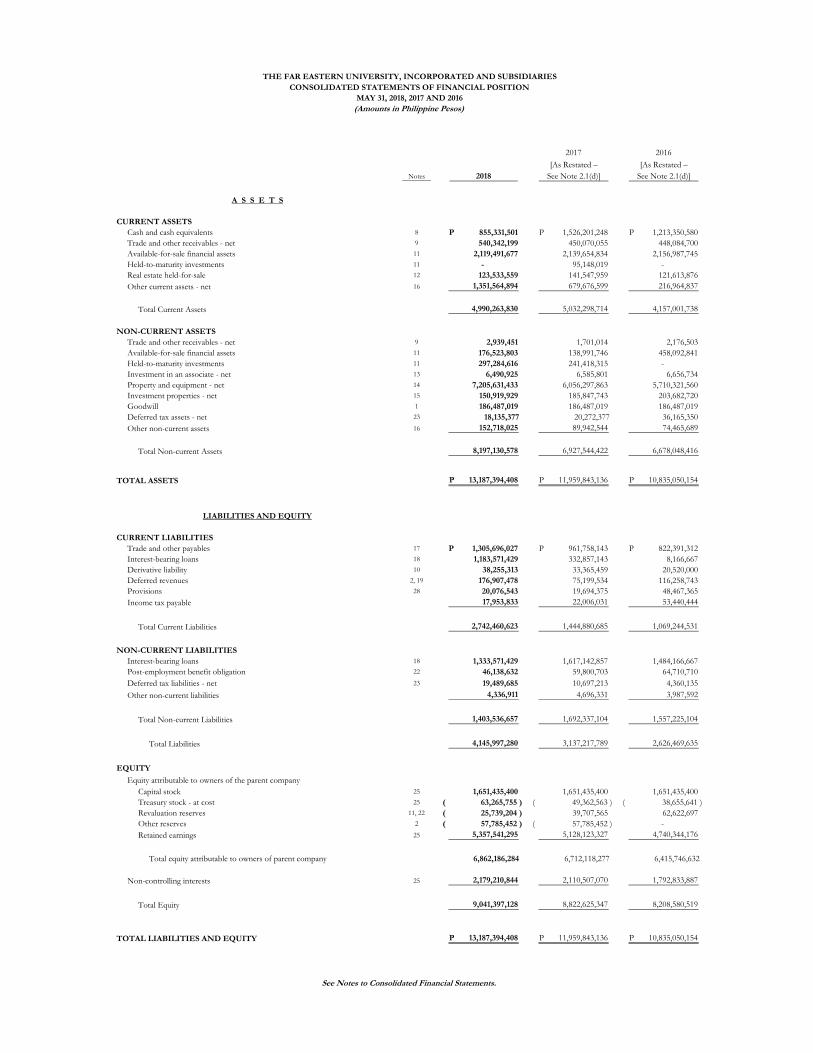
2017 2016
[As Restated – [As Restated –
Notes 2018 See Note 2.1(d)] See Note 2.1(d)]
A S S E T S
CURRENT ASSETS
Cash and cash equivalents 8 855,331,501 P 1,526,201,248 P 1,213,350,580 P
Trade and other receivables - net 9 540,342,199 450,070,055 448,084,700
Available-for-sale financial assets 11 2,119,491,677 2,139,654,834 2,156,987,745
Held-to-maturity investments 11 - 95,148,019 -
Real estate held-for-sale 12 123,533,559 141,547,959 121,613,876
Other current assets - net 16 1,351,564,894 679,676,599 216,964,837
Total Current Assets 4,990,263,830 5,032,298,714 4,157,001,738
NON-CURRENT ASSETS
Trade and other receivables - net 9 2,939,451 1,701,014 2,176,503
Available-for-sale financial assets 11 176,523,803 138,991,746 458,092,841
Held-to-maturity investments 11 297,284,616 241,418,315 -
Investment in an associate - net 13 6,490,925 6,585,801 6,656,734
Property and equipment - net 14 7,205,631,433 6,056,297,863 5,710,321,560
Investment properties - net 15 150,919,929 185,847,743 203,682,720
Goodwill 1 186,487,019 186,487,019 186,487,019
Deferred tax assets - net 23 18,135,377 20,272,377 36,165,350
Other non-current assets 16 152,718,025 89,942,544 74,465,689
Total Non-current Assets 8,197,130,578 6,927,544,422 6,678,048,416
TOTAL ASSETS 13,187,394,408 P 11,959,843,136 P 10,835,050,154 P
CURRENT LIABILITIES
Trade and other payables 17 1,305,696,027 P 961,758,143 P 822,391,312 P
Interest-bearing loans 18 1,183,571,429 332,857,143 8,166,667
Derivative liability 10 38,255,313 33,365,459 20,520,000
Deferred revenues 2, 19 176,907,478 75,199,534 116,258,743
Provisions 28 20,076,543 19,694,375 48,467,365
Income tax payable 17,953,833 22,006,031 53,440,444
Total Current Liabilities 2,742,460,623 1,444,880,685 1,069,244,531
NON-CURRENT LIABILITIES
Interest-bearing loans 18 1,333,571,429 1,617,142,857 1,484,166,667
Post-employment benefit obligation 22 46,138,632 59,800,703 64,710,710
Deferred tax liabilities - net 23 19,489,685 10,697,213 4,360,135
Other non-current liabilities 4,336,911 4,696,331 3,987,592
Total Non-current Liabilities 1,403,536,657 1,692,337,104 1,557,225,104
Total Liabilities 4,145,997,280 3,137,217,789 2,626,469,635
EQUITY
Equity attributable to owners of the parent company
Capital stock 25 1,651,435,400 1,651,435,400 1,651,435,400
Treasury stock - at cost 25 63,265,755 )( 49,362,563 )( 38,655,641 )(
Revaluation reserves 11, 22 25,739,204 )( 39,707,565 62,622,697
Other reserves 2 57,785,452 )( 57,785,452 )( -
Retained earnings 25 5,357,541,295 5,128,123,327 4,740,344,176
Total equity attributable to owners of parent company 6,862,186,284 6,712,118,277 6,415,746,632
Non-controlling interests 25 2,179,210,844 2,110,507,070 1,792,833,887
Total Equity 9,041,397,128 8,822,625,347 8,208,580,519
TOTAL LIABILITIES AND EQUITY 13,187,394,408 P 11,959,843,136 P 10,835,050,154 P
THE FAR EASTERN UNIVERSITY, INCORPORATED AND SUBSIDIARIES
CONSOLIDATED STATEMENTS OF FINANCIAL POSITION
MAY 31, 2018, 2017 AND 2016
(Amounts in Philippine Pesos)
See Notes to Consolidated Financial Statements.
LIABILITIES AND EQUITY
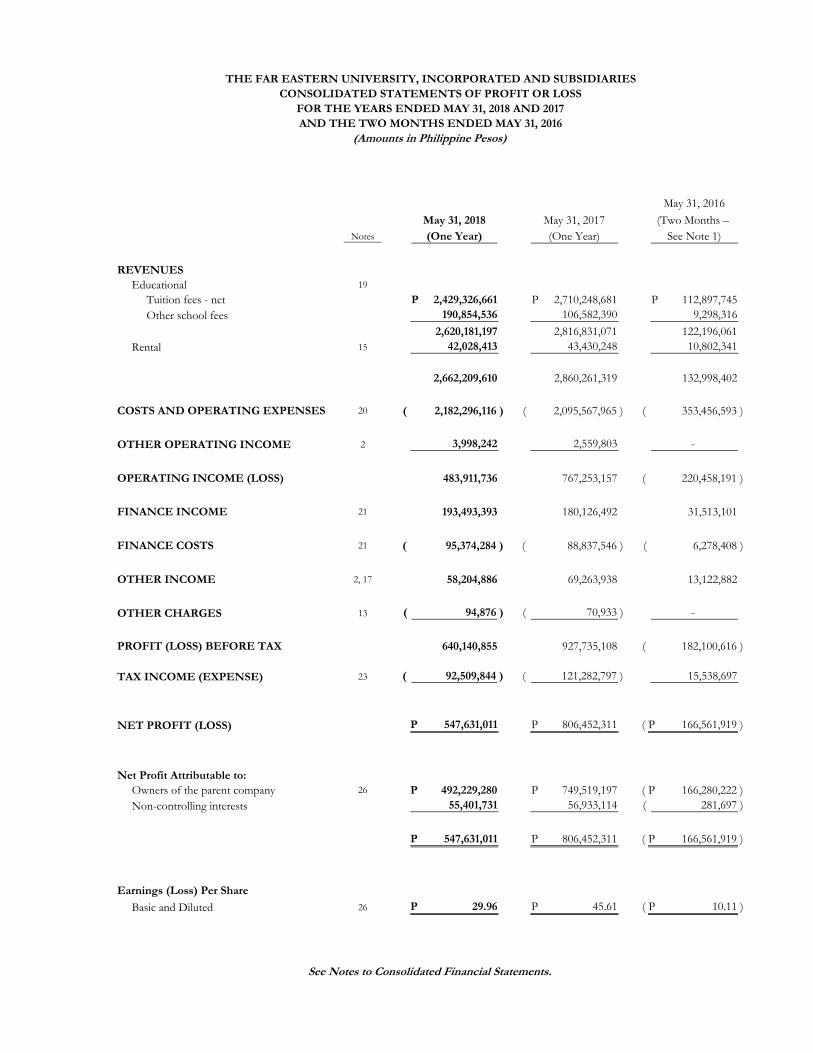
May 31, 2016
May 31, 2018 May 31, 2017 (Two Months –
Notes (One Year) (One Year) See Note 1)
REVENUES
Educational 19
Tuition fees - net 2,429,326,661 P 2,710,248,681 P 112,897,745 P
Other school fees 190,854,536 106,582,390 9,298,316
2,620,181,197 2,816,831,071 122,196,061
Rental 15 42,028,413 43,430,248 10,802,341
2,662,209,610 2,860,261,319 132,998,402
COSTS AND OPERATING EXPENSES 20 2,182,296,116 )( 2,095,567,965 )( 353,456,593 )(
OTHER OPERATING INCOME 2 3,998,242 2,559,803 -
OPERATING INCOME (LOSS) 483,911,736 767,253,157 220,458,191 )(
FINANCE INCOME 21 193,493,393 180,126,492 31,513,101
FINANCE COSTS 21 95,374,284 )( 88,837,546 )( 6,278,408 )(
OTHER INCOME 2, 17 58,204,886 69,263,938 13,122,882
OTHER CHARGES 13 94,876 )( 70,933 )( -
PROFIT (LOSS) BEFORE TAX 640,140,855 927,735,108 182,100,616 )(
TAX INCOME (EXPENSE) 23 92,509,844 )( 121,282,797 )( 15,538,697
NET PROFIT (LOSS) 547,631,011 P 806,452,311 P 166,561,919 )( P
Net Profit Attributable to:
Owners of the parent company 26 492,229,280 P 749,519,197 P 166,280,222 )( P
Non-controlling interests 55,401,731 56,933,114 281,697 )(
547,631,011 P 806,452,311 P 166,561,919 )( P
Earnings (Loss) Per Share
Basic and Diluted 26 29.96 P 45.61 P 10.11 )( P
See Notes to Consolidated Financial Statements.
THE FAR EASTERN UNIVERSITY, INCORPORATED AND SUBSIDIARIES
CONSOLIDATED STATEMENTS OF PROFIT OR LOSS
FOR THE YEARS ENDED MAY 31, 2018 AND 2017
(Amounts in Philippine Pesos)
AND THE TWO MONTHS ENDED MAY 31, 2016
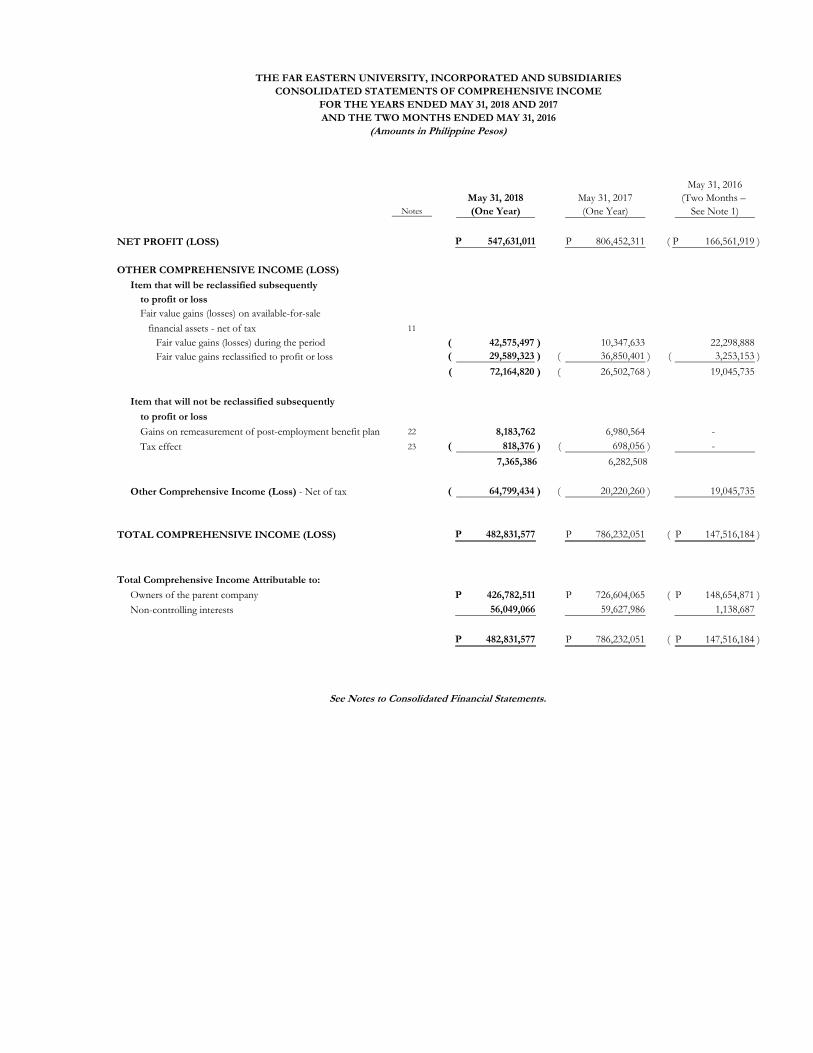
May 31, 2016
May 31, 2018 May 31, 2017 (Two Months –
Notes (One Year) (One Year) See Note 1)
NET PROFIT (LOSS) 547,631,011 P 806,452,311 P 166,561,919 )( P
OTHER COMPREHENSIVE INCOME (LOSS)
Item that will be reclassified subsequently
to profit or loss
Fair value gains (losses) on available-for-sale
financial assets - net of tax 11
Fair value gains (losses) during the period 42,575,497 )( 10,347,633 22,298,888
Fair value gains reclassified to profit or loss 29,589,323 )( 36,850,401 )( 3,253,153 )(
72,164,820 )( 26,502,768 )( 19,045,735
Item that will not be reclassified subsequently
to profit or loss
Gains on remeasurement of post-employment benefit plan 22 8,183,762 6,980,564 -
Tax effect 23 818,376 )( 698,056 )( -
7,365,386 6,282,508
Other Comprehensive Income (Loss) - Net of tax 64,799,434 )( 20,220,260 )( 19,045,735
TOTAL COMPREHENSIVE INCOME (LOSS) 482,831,577 P 786,232,051 P 147,516,184 )( P
Total Comprehensive Income Attributable to:
Owners of the parent company 426,782,511 P 726,604,065 P 148,654,871 )( P
Non-controlling interests 56,049,066 59,627,986 1,138,687
482,831,577 P 786,232,051 P 147,516,184 )( P
THE FAR EASTERN UNIVERSITY, INCORPORATED AND SUBSIDIARIES
CONSOLIDATED STATEMENTS OF COMPREHENSIVE INCOME
FOR THE YEARS ENDED MAY 31, 2018 AND 2017
AND THE TWO MONTHS ENDED MAY 31, 2016
(Amounts in Philippine Pesos)
See Notes to Consolidated Financial Statements.
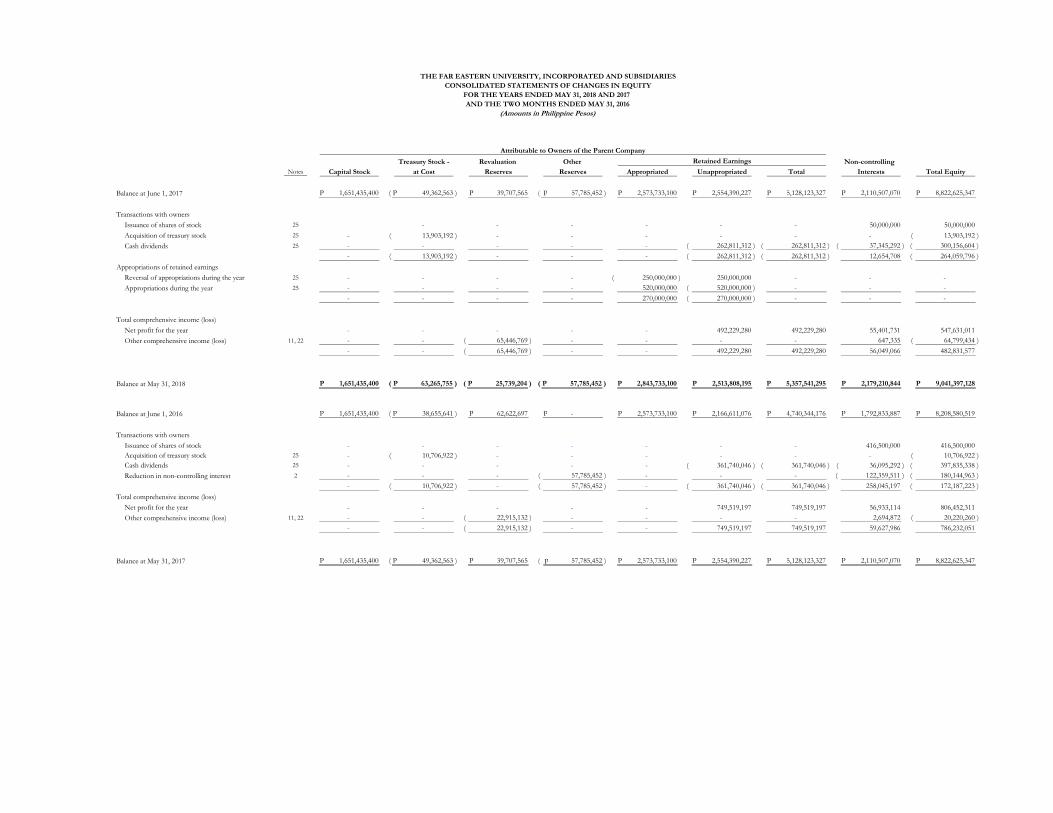
Treasury Stock - Revaluation Other Non-controlling
Notes Capital Stock at Cost Reserves Reserves Appropriated Unappropriated Total Interests Total Equity
Balance at June 1, 2017 1,651,435,400 P 49,362,563 )( P 39,707,565 P 57,785,452 )( P 2,573,733,100 P 2,554,390,227 P 5,128,123,327 P 2,110,507,070 P 8,822,625,347 P
Transactions with owners
Issuance of shares of stock 25 - - - - - - 50,000,000 50,000,000
Acquisition of treasury stock 25 - 13,903,192 )( - - - - - - 13,903,192 )(
Cash dividends 25 - - - - - 262,811,312 )( 262,811,312 )( 37,345,292 )( 300,156,604 )(
- 13,903,192 )( - - - 262,811,312 )( 262,811,312 )( 12,654,708 264,059,796 )(
Appropriations of retained earnings
Reversal of appropriations during the year 25 - - - - 250,000,000 )( 250,000,000 - - -
Appropriations during the year 25 - - - - 520,000,000 520,000,000 )( - - -
- - - - 270,000,000 270,000,000 )( - - -
Total comprehensive income (loss)
Net profit for the year - - - - - 492,229,280 492,229,280 55,401,731 547,631,011
Other comprehensive income (loss) 11, 22 - - 65,446,769 )( - - - - 647,335 64,799,434 )(
- - 65,446,769 )( - - 492,229,280 492,229,280 56,049,066 482,831,577
Balance at May 31, 2018 1,651,435,400 P 63,265,755 )( P 25,739,204 )( P 57,785,452 )( P 2,843,733,100 P 2,513,808,195 P 5,357,541,295 P 2,179,210,844 P 9,041,397,128 P
Balance at June 1, 2016 1,651,435,400 P 38,655,641 )( P 62,622,697 P - 2,573,733,100 P 2,166,611,076 P 4,740,344,176 P 1,792,833,887 P 8,208,580,519 P
Transactions with owners
Issuance of shares of stock - - - - - - - 416,500,000 416,500,000
Acquisition of treasury stock 25 - 10,706,922 )( - - - - - - 10,706,922 )(
Cash dividends 25 - - - - - 361,740,046 )( 361,740,046 )( 36,095,292 )( 397,835,338 )(
Reduction in non-controlling interest 2 - - - 57,785,452 )( - - - 122,359,511 )( 180,144,963 )(
- 10,706,922 )( - 57,785,452 )( - 361,740,046 )( 361,740,046 )( 258,045,197 172,187,223 )(
Total comprehensive income (loss)
Net profit for the year - - - - - 749,519,197 749,519,197 56,933,114 806,452,311
Other comprehensive income (loss) 11, 22 - - 22,915,132 )( - - - - 2,694,872 20,220,260 )(
- - 22,915,132 )( - - 749,519,197 749,519,197 59,627,986 786,232,051
Balance at May 31, 2017 1,651,435,400 P 49,362,563 )( P 39,707,565 P 57,785,452 )( 2,573,733,100 P 2,554,390,227 P 5,128,123,327 P 2,110,507,070 P 8,822,625,347 P
Retained Earnings
AND THE TWO MONTHS ENDED MAY 31, 2016
THE FAR EASTERN UNIVERSITY, INCORPORATED AND SUBSIDIARIES
FOR THE YEARS ENDED MAY 31, 2018 AND 2017
(Amounts in Philippine Pesos)
Attributable to Owners of the Parent Company
CONSOLIDATED STATEMENTS OF CHANGES IN EQUITY
P
P
P
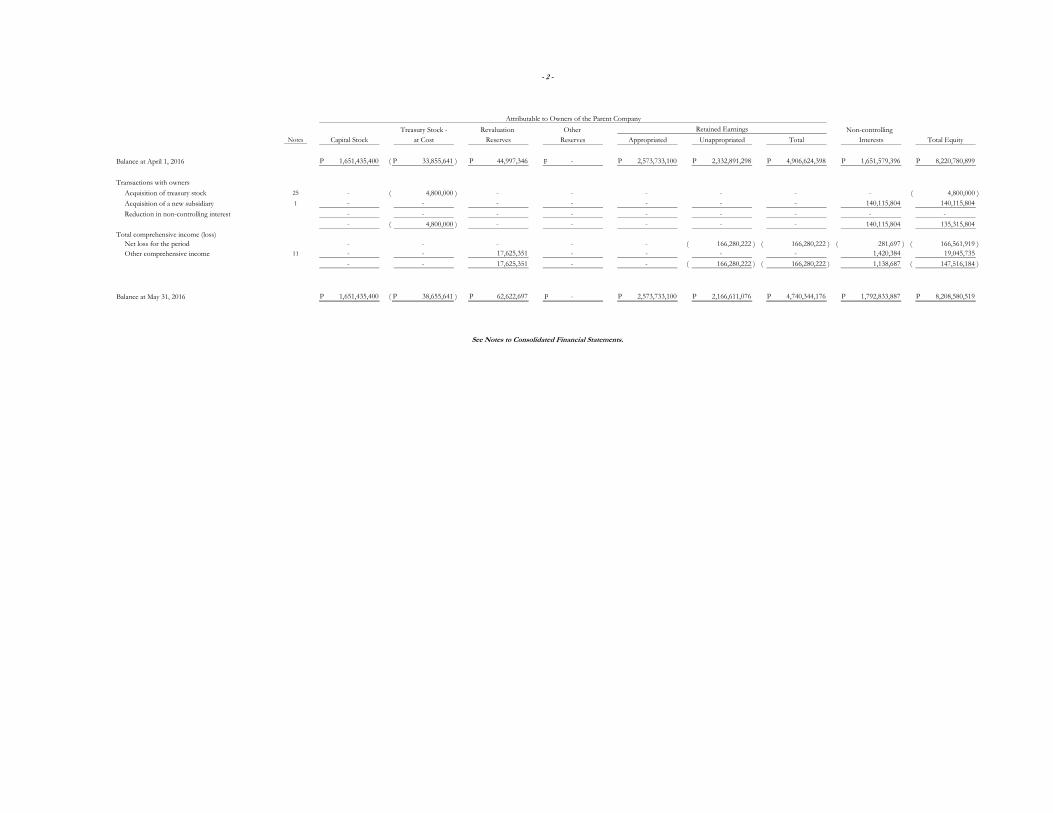
Treasury Stock - Revaluation Other Non-controlling
Notes Capital Stock at Cost Reserves Reserves Appropriated Unappropriated Total Interests Total Equity
Balance at April 1, 2016 1,651,435,400 P 33,855,641 )( P 44,997,346 P - 2,573,733,100 P 2,332,891,298 P 4,906,624,398 P 1,651,579,396 P 8,220,780,899 P
Transactions with owners
Acquisition of treasury stock 25 - 4,800,000 )( - - - - - - 4,800,000 )(
Acquisition of a new subsidiary 1 - - - - - - - 140,115,804 140,115,804
Reduction in non-controlling interest - - - - - - - - -
- 4,800,000 )( - - - - - 140,115,804 135,315,804
Total comprehensive income (loss)
Net loss for the period - - - - - 166,280,222 )( 166,280,222 )( 281,697 )( 166,561,919 )(
Other comprehensive income 11 - - 17,625,351 - - - - 1,420,384 19,045,735
- - 17,625,351 - - 166,280,222 )( 166,280,222 )( 1,138,687 147,516,184 )(
Balance at May 31, 2016 1,651,435,400 P 38,655,641 )( P 62,622,697 P - 2,573,733,100 P 2,166,611,076 P 4,740,344,176 P 1,792,833,887 P 8,208,580,519 P
See Notes to Consolidated Financial Statements.
Retained Earnings
- 2 -
Attributable to Owners of the Parent Company
P
P
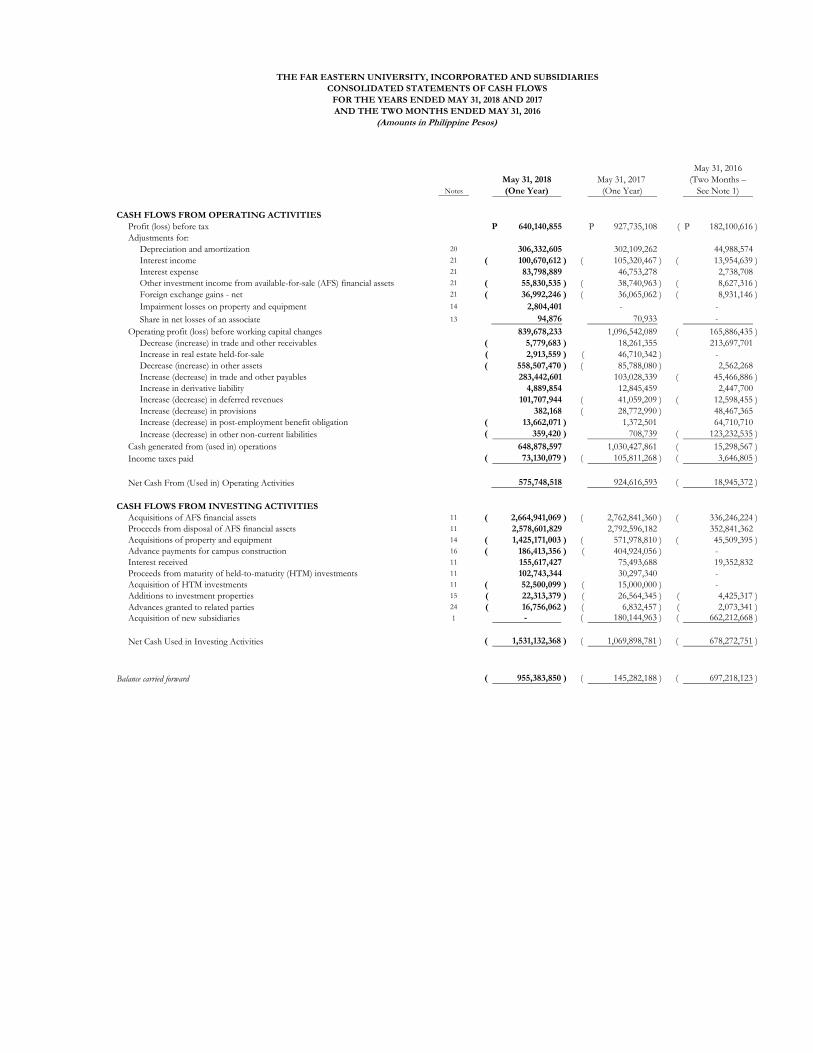
May 31, 2016
May 31, 2018 May 31, 2017 (Two Months –
Notes (One Year) (One Year) See Note 1)
CASH FLOWS FROM OPERATING ACTIVITIES
Profit (loss) before tax 640,140,855 P 927,735,108 P 182,100,616 )( P
Adjustments for:
Depreciation and amortization 20 306,332,605 302,109,262 44,988,574
Interest income 21 100,670,612 )( 105,320,467 )( 13,954,639 )(
Interest expense 21 83,798,889 46,753,278 2,738,708
Other investment income from available-for-sale (AFS) financial assets 21 55,830,535 )( 38,740,963 )( 8,627,316 )(
Foreign exchange gains - net 21 36,992,246 )( 36,065,062 )( 8,931,146 )(
Impairment losses on property and equipment 14 2,804,401 - -
Share in net losses of an associate 13 94,876 70,933 -
Operating profit (loss) before working capital changes 839,678,233 1,096,542,089 165,886,435 )(
Decrease (increase) in trade and other receivables 5,779,683 )( 18,261,355 213,697,701
Increase in real estate held-for-sale 2,913,559 )( 46,710,342 )( -
Decrease (increase) in other assets 558,507,470 )( 85,788,080 )( 2,562,268
Increase (decrease) in trade and other payables 283,442,601 103,028,339 45,466,886 )(
Increase in derivative liability 4,889,854 12,845,459 2,447,700
Increase (decrease) in deferred revenues 101,707,944 41,059,209 )( 12,598,455 )(
Increase (decrease) in provisions 382,168 28,772,990 )( 48,467,365
Increase (decrease) in post-employment benefit obligation 13,662,071 )( 1,372,501 64,710,710
Increase (decrease) in other non-current liabilities 359,420 )( 708,739 123,232,535 )(
Cash generated from (used in) operations 648,878,597 1,030,427,861 15,298,567 )(
Income taxes paid 73,130,079 )( 105,811,268 )( 3,646,805 )(
Net Cash From (Used in) Operating Activities 575,748,518 924,616,593 18,945,372 )(
CASH FLOWS FROM INVESTING ACTIVITIES
Acquisitions of AFS financial assets 11 2,664,941,069 )( 2,762,841,360 )( 336,246,224 )(
Proceeds from disposal of AFS financial assets 11 2,578,601,829 2,792,596,182 352,841,362
Acquisitions of property and equipment 14 1,425,171,003 )( 571,978,810 )( 45,509,395 )(
Advance payments for campus construction 16 186,413,356 )( 404,924,056 )( -
Interest received 11 155,617,427 75,493,688 19,352,832
Proceeds from maturity of held-to-maturity (HTM) investments 11 102,743,344 30,297,340 -
Acquisition of HTM investments 11 52,500,099 )( 15,000,000 )( -
Additions to investment properties 15 22,313,379 )( 26,564,345 )( 4,425,317 )(
Advances granted to related parties 24 16,756,062 )( 6,832,457 )( 2,073,341 )(
Acquisition of new subsidiaries 1 - 180,144,963 )( 662,212,668 )(
Net Cash Used in Investing Activities 1,531,132,368 )( 1,069,898,781 )( 678,272,751 )(
Balance carried forward 955,383,850 )( 145,282,188 )( 697,218,123 )(
THE FAR EASTERN UNIVERSITY, INCORPORATED AND SUBSIDIARIES
CONSOLIDATED STATEMENTS OF CASH FLOWS
FOR THE YEARS ENDED MAY 31, 2018 AND 2017
AND THE TWO MONTHS ENDED MAY 31, 2016
(Amounts in Philippine Pesos)
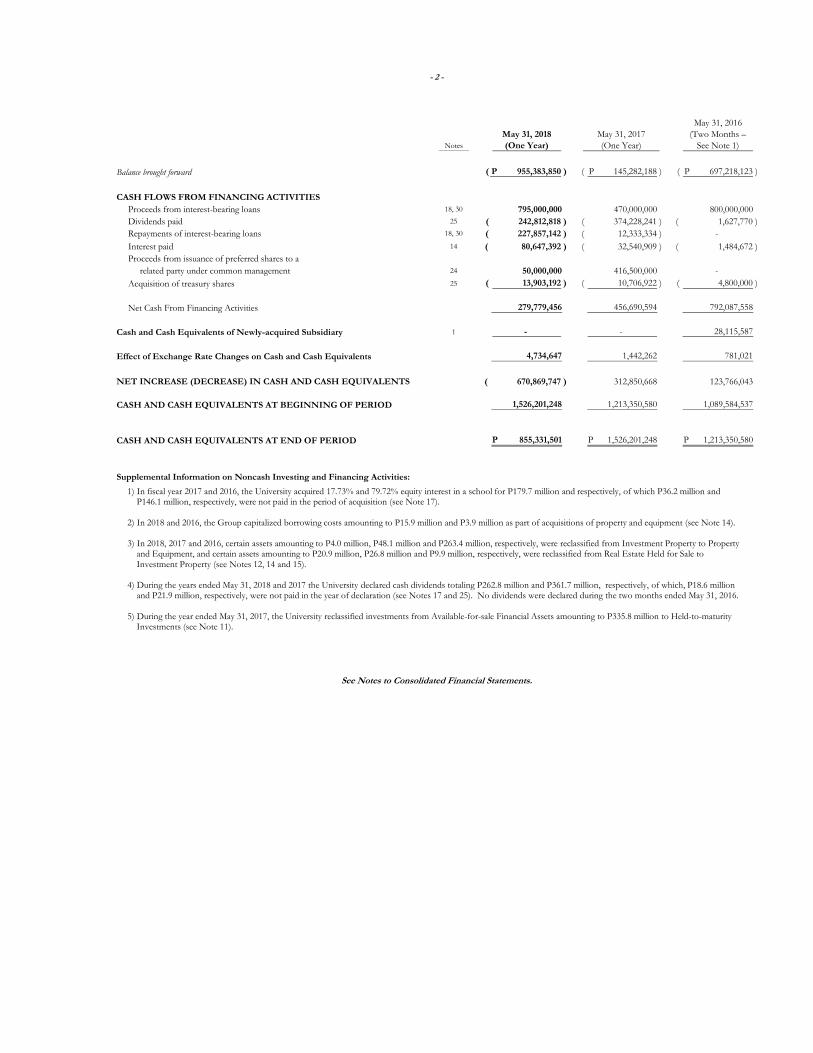
May 31, 2016
May 31, 2018 May 31, 2017 (Two Months –
Notes (One Year) (One Year) See Note 1)
Balance brought forward 955,383,850 )( P 145,282,188 )( P 697,218,123 )( P
CASH FLOWS FROM FINANCING ACTIVITIES
Proceeds from interest-bearing loans 18, 30 795,000,000 470,000,000 800,000,000
Dividends paid 25 242,812,818 )( 374,228,241 )( 1,627,770 )(
Repayments of interest-bearing loans 18, 30 227,857,142 )( 12,333,334 )( -
Interest paid 14 80,647,392 )( 32,540,909 )( 1,484,672 )(
Proceeds from issuance of preferred shares to a
related party under common management 24 50,000,000 416,500,000 -
Acquisition of treasury shares 25 13,903,192 )( 10,706,922 )( 4,800,000 )(
Net Cash From Financing Activities 279,779,456 456,690,594 792,087,558
Cash and Cash Equivalents of Newly-acquired Subsidiary 1 - - 28,115,587
Effect of Exchange Rate Changes on Cash and Cash Equivalents 4,734,647 1,442,262 781,021
NET INCREASE (DECREASE) IN CASH AND CASH EQUIVALENTS 670,869,747 )( 312,850,668 123,766,043
CASH AND CASH EQUIVALENTS AT BEGINNING OF PERIOD 1,526,201,248 1,213,350,580 1,089,584,537
CASH AND CASH EQUIVALENTS AT END OF PERIOD 855,331,501 P 1,526,201,248 P 1,213,350,580 P
Supplemental Information on Noncash Investing and Financing Activities:
See Notes to Consolidated Financial Statements.
- 2 -
1) In fiscal year 2017 and 2016, the University acquired 17.73% and 79.72% equity interest in a school for P179.7 million and respectively, of which P36.2 million andP146.1 million, respectively, were not paid in the period of acquisition (see Note 17).
2) In 2018 and 2016, the Group capitalized borrowing costs amounting to P15.9 million and P3.9 million as part of acquisitions of property and equipment (see Note 14).
3) In 2018, 2017 and 2016, certain assets amounting to P4.0 million, P48.1 million and P263.4 million, respectively, were reclassified from Investment Property to Propertyand Equipment, and certain assets amounting to P20.9 million, P26.8 million and P9.9 million, respectively, were reclassified from Real Estate Held for Sale to Investment Property (see Notes 12, 14 and 15).
4) During the years ended May 31, 2018 and 2017 the University declared cash dividends totaling P262.8 million and P361.7 million, respectively, of which, P18.6 millionand P21.9 million, respectively, were not paid in the year of declaration (see Notes 17 and 25). No dividends were declared during the two months ended May 31, 2016.
5) During the year ended May 31, 2017, the University reclassified investments from Available-for-sale Financial Assets amounting to P335.8 million to Held-to-maturityInvestments (see Note 11).
- 1 -
THE FAR EASTERN UNIVERSITY, INCORPORATED AND SUBSIDIARIES
NOTES TO CONSOLIDATED FINANCIAL STATEMENTS MAY 31, 2018, 2017 AND 2016 (Amounts in Philippine Pesos)
1. CORPORATE INFORMATION
1.1 Background of the University
The Far Eastern University, Incorporated (the University, FEU or parent company) is a domestic educational institution founded in June 1928, incorporated in the Philippines and was registered with the Securities and Exchange Commission (SEC) on October 27, 1933. On October 27, 1983, the University extended its corporate life to another 50 years. It became a listed corporation in the Philippine Stock Exchange (PSE) on July 11, 1986. The University is a private, non-sectarian institution of learning comprising the following institutes that offer specific courses, namely, Institute of Arts and Sciences; Institute of Accounts, Business and Finance; Institute of Education; Institute of Architecture and Fine Arts; Institute of Nursing; Institute of Tourism and Hotel Management; and, Institute of Law. Several programs of FEU, such as Liberal Arts, Applied Mathematics, Biology, Accountancy, Business Administration, Tourism, Fine Arts, and Education, are accredited by the Philippine Association of Colleges and Universities Commission on Accreditation. As at May 31, 2018, 2017 and 2016, the University holds interest in the following subsidiaries and associate which were all incorporated and are operating in the Philippines (see Notes 1.2 and 13):
Percentage of Effective Ownership Company Name 2018 2017 2016
Subsidiaries: East Asia Computer Center, Inc. (EACCI) 100% 100% 100% Far Eastern College – Silang, Inc. (FECSI) 100% 100% 100% FEU Alabang, Inc. (FEUAI) 100% 100% 100% FEU High School, Inc. (FEU High) 100% 100% 100% Roosevelt College, Inc. (RCI) 97.43% 97.43% 79.72% Roosevelt College Educational Enterprises (RCEE)* 97.43% 97.43% 79.72% Fern Realty Corporation (FRC) 37.52% 37.52% 37.52%
Associate – Juliana Management
Company, Inc. (JMCI) 49% 49% 49%
* Indirectly through the University’s ownership of RCI which owns 100% ownership interest in RCEE (see Note 1.2)
The parent company and its subsidiaries are collectively referred to herein as the Group.
- 2 -
Similar to the University, EACCI, FECSI, FEUAI and RCI were established to operate as educational institutions offering general courses of study. FRC, on the other hand, operates as a real estate company leasing most of its investment properties to the University and other related parties, while RCEE is presently engaged in selling educational school supplies and snacks in the campuses of RCI.
On June 24, 2014, FEU High was established to offer and conduct enhanced basic education programs. It is now offering various tracks for senior high school in response to the implementation of the K-12 program.
As at May 31, 2018, FEUAI is the only subsidiary of the University that has not yet started commercial operations, and will be conferred as a school by the Department of Education and Commission on Higher Education only after the construction of its school building (see Note 14). Subsequent to the end of the fiscal year, FEUAI started its operations in August 2018.
1.2 Acquisition of New Subsidiaries
On May 12, 2016, pursuant to the Share Purchase Agreement (SPA) entered into between FEU and the selling stockholders of RCI for the sale and purchase of 99.42% of RCI’s issued and outstanding shares, the University acquired a total of 235,427 shares of stock of RCI. The acquired shares account for 79.72% of the total outstanding shares of RCI, thereby, making it a subsidiary of the University as of May 31, 2016. During the year ended May 31, 2017, the University acquired additional 52,349 shares of stock of RCI from various selling stockholders of RCI. The additional shares are equivalent to 17.71% of the total outstanding shares of RCI. As of May 31, 2018 and 2017, the University already owns 97.43% of RCI’s total outstanding shares.
As of May 31, 2018, 2017 and 2016, RCI owns 100% ownership interest in RCEE which was incorporated in 1992.
As at the acquisition date, the fair value of the University’s share in RCI’s net identifiable assets amounts to P621.8 million resulting in the recognition of goodwill amounting to P186.5 million. The goodwill arising from the acquisition consists largely of the synergies and economies of scale expected from combining the operations of the University and RCI. The goodwill recognized is subject to annual impairment testing [see Notes 2.4, 2.16 and 3.2(e)].
The table presented in the succeeding page summarizes the consideration paid for the equity interest of RCI’s selling shareholders and the assets acquired and liabilities assumed, as well as the fair value at the acquisition date of the non-controlling interests (NCI) in RCI. For purposes of determining the goodwill, the University determined the fair value of the identified net assets as of May 12, 2017.
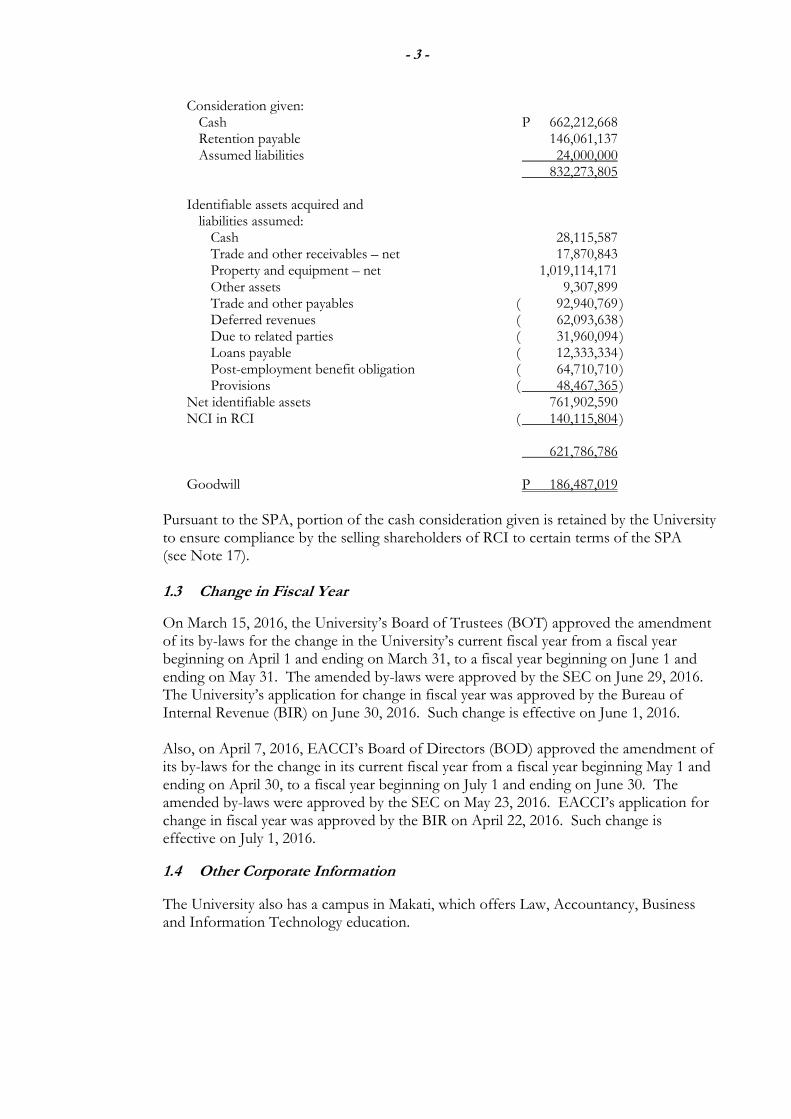
- 3 -
Consideration given: Cash P 662,212,668 Retention payable 146,061,137 Assumed liabilities 24,000,000 832,273,805
Identifiable assets acquired and liabilities assumed:
Cash 28,115,587 Trade and other receivables – net 17,870,843 Property and equipment – net 1,019,114,171 Other assets 9,307,899 Trade and other payables ( 92,940,769 ) Deferred revenues ( 62,093,638 ) Due to related parties ( 31,960,094 ) Loans payable ( 12,333,334 ) Post-employment benefit obligation ( 64,710,710 ) Provisions ( 48,467,365 ) Net identifiable assets 761,902,590 NCI in RCI ( 140,115,804 )
621,786,786
Goodwill P 186,487,019
Pursuant to the SPA, portion of the cash consideration given is retained by the University to ensure compliance by the selling shareholders of RCI to certain terms of the SPA (see Note 17). 1.3 Change in Fiscal Year
On March 15, 2016, the University’s Board of Trustees (BOT) approved the amendment of its by-laws for the change in the University’s current fiscal year from a fiscal year beginning on April 1 and ending on March 31, to a fiscal year beginning on June 1 and ending on May 31. The amended by-laws were approved by the SEC on June 29, 2016. The University’s application for change in fiscal year was approved by the Bureau of Internal Revenue (BIR) on June 30, 2016. Such change is effective on June 1, 2016. Also, on April 7, 2016, EACCI’s Board of Directors (BOD) approved the amendment of its by-laws for the change in its current fiscal year from a fiscal year beginning May 1 and ending on April 30, to a fiscal year beginning on July 1 and ending on June 30. The amended by-laws were approved by the SEC on May 23, 2016. EACCI’s application for change in fiscal year was approved by the BIR on April 22, 2016. Such change is effective on July 1, 2016.
1.4 Other Corporate Information
The University also has a campus in Makati, which offers Law, Accountancy, Business and Information Technology education.

- 4 -
The registered offices and principal places of business of the University and its subsidiaries and associate are as follows: FEU and FEU High - Nicanor Reyes, Sr. Street, Sampaloc, Manila EACCI - P. Paredes Street, Sampaloc, Manila FECSI - Metrogate Silang Estates, Silang, Cavite FEUAI - Lot 1, Corporate Woods cor. South Corporate
Avenues, Woods District, Filinvest City, Alabang, Muntinlupa City
FRC - Administration Building, FEU Compound, Nicanor Reyes, Sr. Street, Sampaloc, Manila
RCI - No. 54 J. P. Rizal Street, Lamuan, Marikina City RCEE - Roosevelt College Compound, Sumulong
Highway, Cainta, Rizal JMCI - E. Rodriguez Jr. Avenue corner Cpl. Cruz St., Bagong Ilog, Pasig City
1.5 Approval for Issuance of Consolidated Financial Statements
The consolidated financial statements of the Group as of and for the year ended May 31, 2018 (including the comparative consolidated financial statements as of and for the periods ended May 31, 2017 and 2016) were authorized for issue by the BOT on August 28, 2018.
2. SUMMARY OF SIGNIFICANT ACCOUNTING POLICIES
The significant accounting policies that have been used in the preparation of these consolidated financial statements are summarized below and in the succeeding pages. These policies have been consistently applied to all the years presented, unless otherwise stated.
2.1 Basis of Preparation of the Consolidated Financial Statements (a) Statement of Compliance with Philippine Financial Reporting Standards
The consolidated financial statements of the Group have been prepared in accordance with Philippine Financial Reporting Standards (PFRS). PFRS are adopted by the Financial Reporting Standards Council (FRSC) from the pronouncements issued by the International Accounting Standards Board, and approved by the Philippine Board of Accountancy. The consolidated financial statements have been prepared using the measurement bases specified by PFRS for each type of asset, liability, income and expense. The measurement bases are more fully described in the accounting policies that follow.
(b) Presentation of the Consolidated Financial Statements
The consolidated financial statements are presented in accordance with Philippine Accounting Standard (PAS) 1, Presentation of Financial Statements. The Group presents the consolidated statements of comprehensive income separate from the consolidated statements of profit or loss.
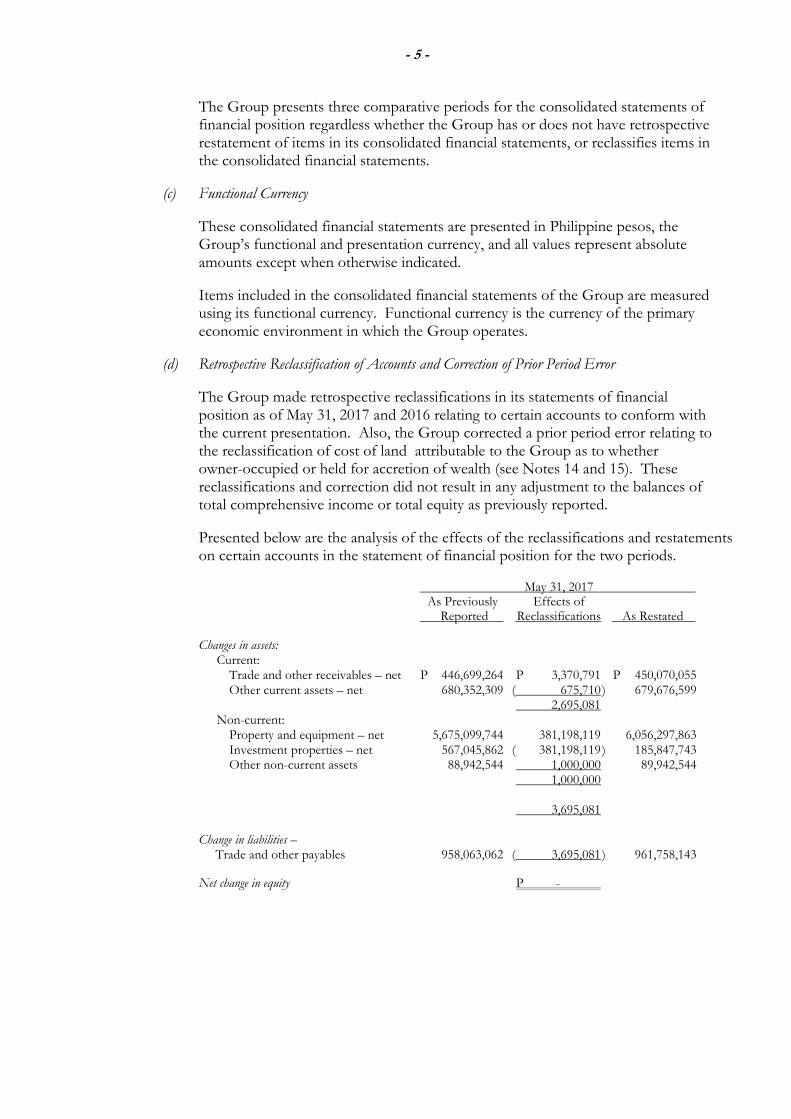
- 5 -
The Group presents three comparative periods for the consolidated statements of financial position regardless whether the Group has or does not have retrospective restatement of items in its consolidated financial statements, or reclassifies items in the consolidated financial statements.
(c) Functional Currency
These consolidated financial statements are presented in Philippine pesos, the Group’s functional and presentation currency, and all values represent absolute amounts except when otherwise indicated.
Items included in the consolidated financial statements of the Group are measured using its functional currency. Functional currency is the currency of the primary economic environment in which the Group operates.
(d) Retrospective Reclassification of Accounts and Correction of Prior Period Error
The Group made retrospective reclassifications in its statements of financial position as of May 31, 2017 and 2016 relating to certain accounts to conform with the current presentation. Also, the Group corrected a prior period error relating to the reclassification of cost of land attributable to the Group as to whether owner-occupied or held for accretion of wealth (see Notes 14 and 15). These reclassifications and correction did not result in any adjustment to the balances of total comprehensive income or total equity as previously reported.
Presented below are the analysis of the effects of the reclassifications and restatements on certain accounts in the statement of financial position for the two periods. May 31, 2017
As Previously Effects of Reported Reclassifications As Restated
Changes in assets: Current:
Trade and other receivables – net P 446,699,264 P 3,370,791 P 450,070,055 Other current assets – net 680,352,309 ( 675,710 ) 679,676,599
2,695,081 Non-current:
Property and equipment – net 5,675,099,744 381,198,119 6,056,297,863 Investment properties – net 567,045,862 ( 381,198,119 ) 185,847,743 Other non-current assets 88,942,544 1,000,000 89,942,544 1,000,000 3,695,081
Change in liabilities –
Trade and other payables 958,063,062 ( 3,695,081 ) 961,758,143
Net change in equity P -
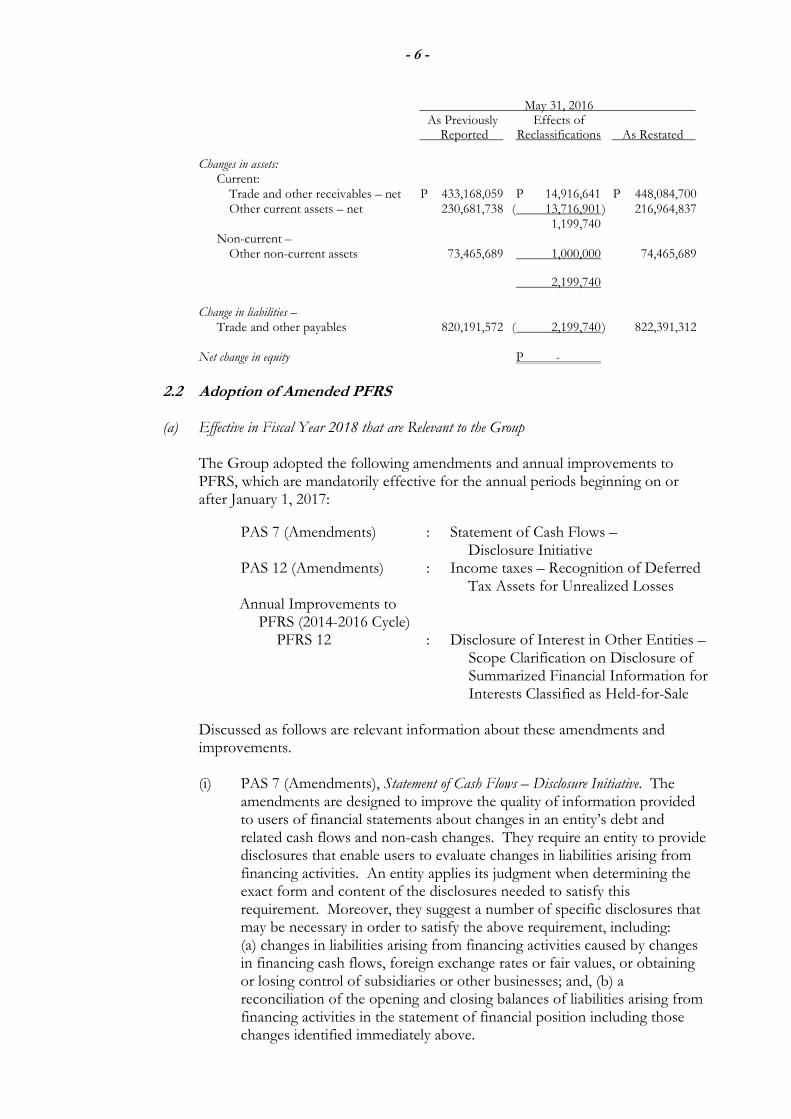
- 6 -
May 31, 2016 As Previously Effects of Reported Reclassifications As Restated
Changes in assets:
Current: Trade and other receivables – net P 433,168,059 P 14,916,641 P 448,084,700 Other current assets – net 230,681,738 ( 13,716,901 ) 216,964,837
1,199,740 Non-current –
Other non-current assets 73,465,689 1,000,000 74,465,689
2,199,740
Change in liabilities – Trade and other payables 820,191,572 ( 2,199,740 ) 822,391,312
Net change in equity P -
2.2 Adoption of Amended PFRS
(a) Effective in Fiscal Year 2018 that are Relevant to the Group
The Group adopted the following amendments and annual improvements to PFRS, which are mandatorily effective for the annual periods beginning on or after January 1, 2017:
PAS 7 (Amendments) : Statement of Cash Flows – Disclosure Initiative PAS 12 (Amendments) : Income taxes – Recognition of Deferred Tax Assets for Unrealized Losses Annual Improvements to PFRS (2014-2016 Cycle) PFRS 12 : Disclosure of Interest in Other Entities – Scope Clarification on Disclosure of Summarized Financial Information for Interests Classified as Held-for-Sale Discussed as follows are relevant information about these amendments and improvements. (i) PAS 7 (Amendments), Statement of Cash Flows – Disclosure Initiative. The
amendments are designed to improve the quality of information provided to users of financial statements about changes in an entity’s debt and related cash flows and non-cash changes. They require an entity to provide disclosures that enable users to evaluate changes in liabilities arising from financing activities. An entity applies its judgment when determining the exact form and content of the disclosures needed to satisfy this requirement. Moreover, they suggest a number of specific disclosures that may be necessary in order to satisfy the above requirement, including: (a) changes in liabilities arising from financing activities caused by changes in financing cash flows, foreign exchange rates or fair values, or obtaining or losing control of subsidiaries or other businesses; and, (b) a reconciliation of the opening and closing balances of liabilities arising from financing activities in the statement of financial position including those changes identified immediately above.
- 7 -
Management has applied these amendments in the current year and has not disclosed comparative figures as allowed by the transitional provisions. A reconciliation between the opening and closing balances of liabilities arising from financing activities, which includes both cash and non-cash changes, are presented in Note 30.
(ii) PAS 12 (Amendments), Income Taxes – Recognition of Deferred Tax Assets for Unrealized Losses. The focus of the amendments is to clarify how to account for deferred tax assets related to debt instruments measured at fair value, particularly where changes in the market interest rate decrease the fair value of a debt instrument below cost. The amendments provide guidance in the following areas where diversity in practice previously existed: (a) existence of a deductible temporary difference; (b) recovering an asset for more than its carrying amount; (c) probable future taxable profit against which deductible temporary differences are assessed for utilization; and, (d) combined versus separate assessment of deferred tax asset recognition for each deductible temporary difference. The application of these amendments has no significant impact on the Group’s consolidated financial statements.
(iii) Annual improvements to PFRS (2014 - 2016 Cycle) – PFRS 12, Disclosure of
Interests in Other Entities – Scope Clarification on Disclosure of Summarized Financial Information for Interests Classified as Held-for-Sale. The amendment clarifies that the disclosure requirements of PFRS 12 applies to interest in other entities classified as held for sale with practical concession in the presentation of summarized financial information. The amendment states that an entity need not present summarized financial information for interests in subsidiaries, associates, or joint ventures that are classified as held for sale. The amendment did not result in additional or changes in the disclosures in the consolidated financial statements as the Group has no interest in other entities that is classified as held for sale.
(b) Effective in Fiscal Year 2018 that are not Relevant to the Group
There are new PFRS, amendments and annual improvements to existing standards effective for annual periods subsequent to fiscal year 2018, which are adopted by the FRSC. Management will adopt the following relevant pronouncements in accordance with their transitional provisions; and, unless otherwise stated, none of these are expected to have significant impact on the Group’s consolidated financial statements:
(i) PAS 40 (Amendments), Investment Property – Reclassification to and from
Investment Property (effective from January 1, 2018). The amendments state that an entity shall transfer a property to, or from, investment property when, and only when, there is evidence of a change in use. A change of use occurs if property meets, or ceases to meet, the definition of investment property. A change in management’s intentions for the use of a property by itself does not constitute evidence of a change in use. The amendment also provided a non-exhaustive list of examples constituting change in use.
- 8 -
(ii) PFRS 9 (2014), Financial Instruments (effective from January 1, 2018). This new standard on financial instruments will replace PAS 39 (Financial Instruments: Recognition and Measurement) and PFRS 9 (2009, 2010 and 2013 versions). This standard contains, among others, the following:
• three principal classification categories for financial assets based on the business model on how an entity is managing its financial instruments;
• an expected loss model in determining impairment of all financial assets that are not measured at fair value through profit or loss (FVTPL), which generally depends on whether there has been a significant increase in credit risk since initial recognition of a financial asset; and,
• a new model on hedge accounting that provides significant improvements principally by aligning hedge accounting more closely with the risk management activities undertaken by entities when hedging their financial and non-financial risk exposures.
In accordance with the financial asset classification principle of PFRS 9 (2014), a financial asset is classified and measured at amortized cost if the asset is held within a business model whose objective is to hold financial assets in order to collect the contractual cash flows that represent solely payments of principal and interest (SPPI) on the principal outstanding. Moreover, a financial asset is classified and subsequently measured at fair value through other comprehensive income (FVTOCI) if it meets the SPPI criterion and is held in a business model whose objective is achieved by both collecting contractual cash flows and selling the financial assets. All other financial assets are measured at FVTPL.
In addition, PFRS 9 (2014) allows entities to make an irrevocable election to present subsequent changes in the fair value of an equity instrument that is not held for trading in other comprehensive income. The accounting for embedded derivatives in host contracts that are financial assets is simplified by removing the requirement to consider whether or not they are closely related, and, in most arrangements, does not require separation from the host contract.
For liabilities, the standard retains most of the PAS 39 requirements which include amortized cost accounting for most financial liabilities, with bifurcation of embedded derivatives. The standard also requires changes in the fair value of an entity’s own debt instruments caused by changes in its own credit quality to be recognized in other comprehensive income rather than in profit or loss.
- 9 -
Based on an assessment of the Group’s financial assets and liabilities as at May 31, 2018, which has been limited to the facts and circumstances existing at that date, management has identified the following areas that are expected to be most impacted by the application of PFRS 9 (2014):
• On classification and measurement of the Group’s financial assets, management holds most financial assets to collect the associated cash flows and is currently assessing the underlying types of cash flows to classify financial assets correctly. Management expects that all of the Group’s financial assets currently classified as loans and receivables and held-to-maturity (HTM) investments will continue to be classified and accounted for at amortized cost.
• The Group’s equity securities, including those investments in unit investment trust funds (UITF) whose underlying assets are in equity securities, currently classified as available-for-sale (AFS) financial assets will be measured at fair value with changes in fair value presented either in profit or loss or in other comprehensive income. To present changes in other comprehensive income requires making an irrevocable designation on initial recognition or at the date of transition.
• Government securities and corporate bonds currently classified as AFS financial assets have fixed interest rates and defined maturity dates (see Note 11). The Group initially assessed that the contractual cash flows of these debt securities qualify under the SPPI test and under held-to-collect and sell business model. Thus, these debt securities will continue to be measured at fair value, with mark-to-market fluctuations recognized in OCI subject to recycling upon disposal of these securities.
• The ECL model will apply to the Group’s certain receivables and debt securities under AFS financial assets and held-to-maturity investments. For tuition and other school fees receivables and other financial assets, the Group will apply a simplified model of recognizing lifetime expected credit losses as these items do not have a significant financing component.
• The existing financial liabilities of the Group is measured at amortized cost, except for its derivative liability which is measured at fair value. Upon adoption of PFRS 9 (2014), management has assessed that the classifications for the financial liabilities will be retained.
(iii) PFRS 15, Revenue from Contracts with Customers (effective from January 1, 2018).
This standard will replace PAS 18, Revenue, and PAS 11, Construction Contracts, the related Interpretations on revenue recognition: International Financial Reporting Interpretations Committee (IFRIC) 13, Customer Loyalty Programmes, IFRIC 15, Agreement for the Construction of Real Estate, IFRIC 18, Transfers of Assets from Customers, and Standing Interpretations Committee 31, Revenue – Barter Transactions Involving Advertising Services. This new standard establishes a comprehensive framework for determining when to recognize revenue and how much revenue to recognize. The core principle in the said framework is for an entity to recognize revenue to depict the transfer of promised goods or services to the customer in an amount that reflects the consideration to which the entity expects to be entitled in exchange for those goods or services.
- 10 -
Based on the Group’s initial assessment of its revenue streams as at May 31, 2018, which has been limited to the facts and circumstances existing at that date, management determined that its significant source of revenue pertains to educational revenues, which will be in scope of PFRS 15.
(iv) IFRIC 22, Foreign Currency Transactions and Advance Consideration – Interpretation
on Foreign Currency Transactions and Advance Consideration (effective from January 1, 2018). The interpretation provides more detailed guidance on how to account for transactions that include the receipt or payment of advance consideration in a foreign currency. The Interpretation states that the date of the transaction, for the purpose of determining the exchange rate, is the date of initial recognition of the non-monetary asset (arising from advance payment) or liability (arising from advance receipt). If there are multiple payments or receipts in advance, a date of transaction is established for each payment or receipt.
Management has initially assessed that this interpretation has no material
impact on the Group’s consolidated financial statements.
(v) Annual Improvements to PFRS 2014-2016 Cycle. Among the improvements, PAS 28 (Amendments), Investment in Associates – Clarification on Fair Value through Profit or Loss Classification (effective from January 1, 2018) is relevant to the University. The amendments clarify that the option for venture capital organization, mutual funds and other similar entities to elect the fair value through profit or loss classification in measuring investments in associates and joint ventures shall be made at initial recognition, separately for each associate or joint venture. Management has initially assessed that these amendments have no material impact on the Group’s consolidated financial statements.
(vi) PAS 28 (Amendments), Investment in Associates – Long-term Interest in
Associates and Joint Venture (effective from January 1, 2019). The amendments clarify that the scope exclusion in PFRS 9 (2014) applies only to ownership interests accounted for using the equity method. Thus, the amendments further clarify that long-term interests in an associate or joint venture – to which the equity method is not applied – must be accounted for under PFRS 9 (2014), which shall also include long-term interests that, in substance, form part of the entity’s net investment in an associate or joint venture. Management is currently assessing the impact of these amendments on the Group’s consolidated financial statements.
(vii) PFRS 9 (Amendments), Financial Instruments – Prepayment Features with
Negative Compensation (effective from January 1, 2019). The amendments clarify that prepayment features with negative compensation attached to financial instruments may still qualify under the SPPI test. As such, the financial assets containing prepayment features with negative compensation may still be classified at amortized cost or at FVTOCI. Management is currently assessing the impact of these amendments on the Group’s consolidated financial statements.
- 11 -
(viii) PFRS 16, Leases (effective from January 1, 2019). The new standard will eventually replace PAS 17, Leases.
For lessees, it requires to account for leases “on-balance sheet” by recognizing a “right-of-use” asset and a lease liability. The lease liability is initially measured as the present value of future lease payments. For this purpose, lease payments include fixed, non-cancellable payments for lease elements, amounts due under residual value guarantees, certain types of contingent payments and amounts due during optional periods to the extent that extension is reasonably certain. In subsequent periods, the “right-of-use” asset is accounted for similarly to a purchased asset and depreciated or amortized. The lease liability is accounted for similarly to a financial liability using the effective interest method. However, the new standard provides important reliefs or exemptions for short-term leases and leases of low value assets. If these exemptions are used, the accounting is similar to operating lease accounting under PAS 17 where lease payments are recognized as expenses on a straight-line basis over the lease term or another systematic basis (if more representative of the pattern of the lessee’s benefit).
For lessors, lease accounting is similar to PAS 17’s. In particular, the distinction between finance and operating leases is retained. The definitions of each type of lease, and the supporting indicators of a finance lease, are substantially the same as PAS 17’s. The basic accounting mechanics are also similar, but with some different or more explicit guidance in few areas. These include variable payments, sub-leases, lease modifications, the treatment of initial direct costs and lessor disclosures. Management is currently assessing the impact of this new standard on the Group’s consolidated financial statements.
(ix) IFRIC 23, Uncertainty over Income Tax Treatments (effective from January 1, 2019). The interpretation provides clarification on the determination of taxable profit, tax bases, unused tax losses, unused tax credits, and tax rates when there is uncertainty over income tax treatments. The core principle of the interpretation requires the Group to consider the probability of the tax treatment being accepted by the taxation authority. When it is probable that the tax treatment will be accepted, the determination of the taxable profit, tax bases, unused tax losses, unused tax credits, and tax rates shall be on the basis of the accepted tax treatment. Otherwise, the Group has to use the most likely amount or the expected value, depending on the surrounding circumstances, in determining the tax accounts identified immediately above. Management is currently assessing the impact of this interpretation on the Group’s consolidated financial statements.
(x) Annual Improvements to PFRS 2015-2017 Cycle (effective from
January 1, 2019). Among the improvements, the following amendments are relevant to the Group but had no material impact on its consolidated financial statements as these amendments merely clarify existing requirements:
• PAS 12 (Amendments), Income Taxes – Tax Consequences of Dividends. The amendments clarify that all income tax consequence of dividend payments should be recognized in profit or loss.
- 12 -
• PAS 23 (Amendments), Borrowing Costs – Eligibility for Capitalization. The amendments clarify that any specific borrowing which remains outstanding after the related qualifying asset is ready for its intended purpose, such borrowing will then form part of the entity’s general borrowings when calculating the capitalization rate for capitalization purposes.
• PFRS 3 (Amendments), Business Combinations, and PFRS 11 (Amendments), Joint Arrangements – Remeasurement of Previously Held Interests in a Joint Operation. The amendments clarify that previously held interest in a joint operation shall be remeasured when the Group obtains control of the business. On the other hand, previously held interests in a joint operation shall not be remeasured when the Group obtains joint control of the business.
(xi) PFRS 10 (Amendments), Consolidated Financial Statements, and PAS 28
(Amendments), Investments in Associates and Joint Ventures – Sale or Contribution of Assets between an Investor and its Associate or Joint Venture (effective date deferred indefinitely). The amendments to PFRS 10 require full recognition in the investor’s financial statements of gains or losses arising on the sale or contribution of assets that constitute a business as defined in PFRS 3, Business Combinations, between an investor and its associate or joint venture. Accordingly, the partial recognition of gains or losses (i.e., to the extent of the unrelated investor’s interests in an associate or joint venture) only applies to those sale or contribution of assets that do not constitute a business. Corresponding amendments have been made to PAS 28 to reflect these changes.
In addition, PAS 28 has been amended to clarify that when determining whether assets that are sold or contributed constitute a business, an entity shall consider whether the sale or contribution of those assets is part of multiple arrangements that should be accounted for as a single transaction.
2.3 Basis of Consolidation
The Group’s consolidated financial statements comprise the accounts of the University and its subsidiaries as enumerated in Note 1.1 after the elimination of intercompany transactions. All intercompany balances and transactions with subsidiaries, including income, expenses and dividends, are eliminated in full. Unrealized profits and losses from intercompany transactions that are recognized in assets are also eliminated in full. In addition, shares of stock of the parent company held by the subsidiaries are recognized as treasury stocks and are presented as deduction in the consolidated statement of changes in equity. Intercompany losses that indicate impairment are recognized in the consolidated financial statements.
The following subsidiaries prepare their financial statements for their respective reporting periods using consistent accounting principles as that of the University: March 31 - FEU High, FECSI, FRC and FEUAI May 31 - RCI and RCEE June 30 - EACCI
- 13 -
These subsidiaries follow their respective academic years (i.e., trimestral and semestral), hence, the use of different reporting dates (non-coterminous year-ends) as compared with that of the University. The University accounts for its investments in subsidiaries, an associate and NCIs as follows:
(a) Investments in Subsidiaries
Subsidiaries are entities over which the Group has control. The Group controls an entity when it is exposed, or has rights to, variable returns from its involvement with the entity and has the ability to affect those returns through its power over the entity. Subsidiaries are consolidated from the date the Group obtains control. The Group reassesses whether or not it controls an entity if facts and circumstances indicate that there are changes to one or more of the three elements of controls indicated above. Accordingly, entities are deconsolidated from the date that control ceases. The acquisition method is applied to account for acquired subsidiaries (see Note 2.4).
(b) Investment in an Associate
An associate is an entity over which the University is able to exercise significant influence but which is neither a subsidiary nor interest in a joint venture. Investment in an associate is initially recognized at cost and subsequently accounted for using the equity method.
Acquired investment in an associate is also subject to purchase accounting. However, any goodwill or fair value adjustment attributable to the share in the associate is included in the amount recognized as investment in an associate. All subsequent changes to the share in the equity of the associate are recognized in the carrying amount of the University’s investment.
Changes resulting from the profit or loss generated by the associate, if any, are reported as Other Income or Other Charges, respectively, in the Group’s consolidated statement of profit or loss and, therefore, affect the net results of operations of the Group.
Changes resulting from other comprehensive income of the associate or items recognized directly in the associate’s equity are recognized in consolidated other comprehensive income or equity of the Group, as applicable. However, when the University’s share of net losses in an associate equals or exceeds its interest in the associate, including any other unsecured receivables, the Group does not recognize further losses, unless it has incurred obligations or made payments on behalf of the associate. If the associate subsequently reports profits, the Group resumes recognizing its share of those profits only after its share of the profits exceeds the accumulated share of net losses that has previously not been recognized. Distributions received from the associate (e.g., dividends) are accounted for as a reduction of the carrying value of the investment.
- 14 -
In computing the University’s share in net profit or loss of the associate, unrealized gains or losses on transactions between the University and its associate are eliminated to the extent of the University’s interest in the associate. Where unrealized losses are eliminated, the underlying asset is also tested for impairment from a group perspective.
(c) Transactions with NCIs The Group’s transactions with NCIs that do not result in loss of control are
accounted for as equity transactions – that is, as transaction with the owners of the Group in their capacity as owners. The difference between the fair value of any consideration paid and the relevant share acquired of the carrying value of the net assets of the subsidiary is recognized in equity. Disposals of equity investments in NCIs result in gains and losses which the Group also recognizes in equity.
When the Group ceases to have control over a subsidiary, any retained interest in
the entity is remeasured to its fair value at the date when control is lost, with the change in carrying amount recognized in consolidated profit or loss. The fair value is the initial carrying amount for purposes of subsequently accounting for the retained interest as an associate, joint venture or financial asset. In addition, any amounts previously recognized in consolidated comprehensive income in respect of that entity are accounted for as if the Group had directly disposed of the related assets or liabilities. This may mean that amounts previously recognized in consolidated statement of other comprehensive income are reclassified to consolidated profit or loss.
2.4 Business Combinations
Business acquisitions are accounted for using the acquisition method of accounting. This requires recognizing and measuring the identifiable assets acquired, the liabilities assumed and any NCI in the acquiree. The consideration transferred for the acquisition of a subsidiary is the fair values of the assets transferred, the liabilities incurred and the equity interests issued by the University, if any. The consideration transferred also includes the fair value of any asset or liability resulting from a contingent consideration arrangement. Acquisition-related costs are expensed as incurred and subsequent change in the fair value of contingent consideration is recognized directly in consolidated profit or loss.
Identifiable assets acquired and liabilities and contingent liabilities assumed in a business combination are measured initially at their fair values at the acquisition date. On an acquisition-by-acquisition basis, the University recognizes any NCI in the acquiree, either at fair value or at the NCI’s proportionate share of the recognized amounts of acquiree’s identifiable net assets. Goodwill represents the excess of the cost of an acquisition over the fair value of the Group’s share of the net identifiable assets of the acquired subsidiary at the date of acquisition. Subsequent to initial recognition, goodwill is measured at cost less any accumulated impairment losses. Goodwill is tested annually for impairment and carried at cost less accumulated impairment losses. Impairment losses on goodwill are not reversed (see Note 2.16).
- 15 -
Gain on bargain purchase, which is the excess of the Group’s interest in the net fair value of net identifiable assets acquired over acquisition cost, is charged directly to income. For the purpose of impairment testing, goodwill is allocated to cash-generating units (CGU) or groups of cash-generating units that are expected to benefit from the business combination in which the goodwill arose (see Note 2.16). The cash-generating units or groups of cash-generating units are identified according to operating segment.
Gains and losses on disposal of an interest in a subsidiary include the carrying amount of goodwill relating to it.
If the business combination is achieved in stages, the acquirer is required to remeasure its previously held equity interest in the acquiree at its acquisition-date fair value and recognize the resulting gain or loss, if any, in the consolidated profit or loss or consolidated other comprehensive income, as appropriate. Any contingent consideration to be transferred by the Group is recognized at fair value at the acquisition date. Subsequent changes to the fair value of the contingent consideration that is deemed to be an asset or liability is recognized in accordance with PAS 37, Provisions, Contingent Liabilities and Contingent Assets, either in consolidated profit or loss or as a charge to consolidated other comprehensive income. Contingent consideration that is classified as equity is not remeasured, and its subsequent settlement is accounted for within equity.
2.5 Financial Assets
Financial assets are recognized when the Group becomes a party to the contractual terms of the financial instrument. For purposes of classifying financial assets, an instrument is considered as an equity instrument if it is non-derivative and meets the definition of equity for the issuer in accordance with the criteria of PAS 32, Financial Instruments: Presentation. All other non-derivative financial instruments are treated as debt instruments.
(a) Classification and Measurement of Financial Assets
Financial assets other than those designated and effective as hedging instruments are classified into the following categories: financial assets at FVTPL, loans and receivables, HTM investments AFS financial assets. Financial assets are assigned to the different categories by management on initial recognition, depending on the purpose for which the investments were acquired.
Regular purchases and sales of financial assets are recognized on their trade date. All financial assets that are not classified as at FVTPL are initially recognized at fair value plus any directly attributable transaction costs. Financial assets carried at FVTPL are initially recorded at fair value and the related transaction costs are recognized in consolidated profit or loss.
- 16 -
A more detailed description of the categories of financial assets that are relevant to the Group follows:
(i) Financial Assets at FVTPL
This category includes financial assets that are either classified as held for trading or that meets certain conditions and are designated by the entity to be carried at fair value through profit or loss upon initial recognition. All derivatives fall into this category, except for those designated and effective as hedging instruments. Assets in this category are classified as current if they are either held for trading or are expected to be realized within 12 months from the end of each reporting period.
Financial assets at FVTPL are measured at fair value, and changes therein are recognized in consolidated profit or loss. Financial assets (except derivatives and financial instruments originally designated as financial assets at fair value through profit or loss) may be reclassified out of FVTPL category if they are no longer held for the purpose of being sold or repurchased in the near term.
The Group entered into a cross-currency swap agreement to manage its risks associated with fluctuations in foreign currency-denominated investments in corporate bonds. The host instruments were classified as AFS financial assets as of May 31, 2016, which were subsequently reclassified to HTM investments during the year ended May 31, 2017 (see Note 11.2). Such derivative financial instruments are initially recognized at fair value on the date on which the derivative contract is entered into and are subsequently remeasured at fair value. Derivatives are carried as assets when the fair value is favorable to the Group and as liabilities when the fair value is favorable to the counterparty (see Note 2.10). Thus, if derivative asset is recognized, it is presented as Financial Asset at FVTPL; otherwise, it is presented as Derivative Liability in the consolidated statements of financial position. The Group’s derivative instruments provide economic hedges under the Group’s policies but are not designated as accounting hedges. Consequently, any gains or losses arising from changes in fair value are taken up directly in consolidated profit or loss for the period [see Note 3.2(b)].
(ii) Loans and Receivables
Loans and receivables are non-derivative financial assets with fixed or determinable payments that are not quoted in an active market. They arise when the Group provides money, goods or services directly to a debtor with no intention of trading the receivables. They are included in current assets, except for those with maturities greater than 12 months after the end of each reporting period, which are classified as non-current assets. The Group’s financial assets categorized as loans and receivables are presented as Cash and Cash Equivalents, Trade and Other Receivables (excluding advances to officers and employees), as part of Other Current Assets (with respect to short-term investments) and as part of Other Non-current Assets (with respect to refundable deposits) in the consolidated statement of financial position.
- 17 -
Cash and cash equivalents are defined as cash on hand, demand deposits and short-term, highly liquid investments with original maturities of three months or less, readily convertible to known amounts of cash and which are subject to insignificant risk of changes in value. Loans and receivables are subsequently measured at amortized cost using the effective interest method, less impairment loss, if any.
(iii) HTM Investments This category includes non-derivative financial assets with fixed or determinable payments and a fixed date of maturity that the Group has the positive intention and ability to hold to maturity. Investments intended to be held for an undefined period are not included in this classification. If the Group were to sell other than an insignificant amount of HTM investments, the whole category would be tainted and reclassified to AFS financial assets. The Group currently holds corporate bonds designated into this category. Subsequent to initial recognition, HTM investments are measured at amortized cost using the effective interest method, less impairment losses, if any.
(iv) AFS Financial Assets
This category includes non-derivative financial assets that are either designated to this category or do not qualify for inclusion in any of the other categories of financial assets. The Group’s AFS financial assets include listed equity securities, corporate and government bonds, and UITF. All financial assets within this category are subsequently measured at fair value, except for equity instruments that do not have a quoted market price in an active market and whose fair value cannot be reliably measured which are measured at cost, less impairment loss, if any. Gains and losses from changes in fair value of AFS financial assets are recognized in consolidated other comprehensive income, net of any income tax effects, and are reported as part of the Revaluation Reserves account in equity. Interest and dividend income, impairment losses and foreign exchange differences on monetary assets are recognized in consolidated profit or loss. When the financial asset is disposed of or is determined to be impaired, that is, when there is a significant or prolonged decline in the fair value of the security below its cost, the cumulative fair value gains or losses recognized in consolidated other comprehensive income is reclassified from equity to consolidated profit or loss and is presented as reclassification adjustment within consolidated other comprehensive income even though the financial asset has not been derecognized.
- 18 -
(b) Impairment of Financial Assets The Group assesses at the end of each reporting period whether there is objective evidence that a financial asset or group of financial assets is impaired. The Group recognizes impairment loss based on the category of financial assets as follows:
(i) Carried at Amortized Cost – Loans and Receivables and HTM Investments
If there is objective evidence that an impairment loss on loans and receivables or HTM investments carried at cost has been incurred, the amount of the impairment loss is determined as the difference between the assets’ carrying amount and the present value of estimated future cash flows (excluding future credit losses that have not been incurred), discounted at the financial asset’s original effective interest rate or current effective interest rate determined under the contract if the loan has a variable interest rate. The carrying amount of the asset shall be reduced either directly or through the use of an allowance account. The amount of loss shall be recognized in consolidated profit or loss.
If in a subsequent period, the amount of the impairment loss decreases and the decrease can be related objectively to an event occurring after the impairment was recognized (such as an improvement in the debtor’s credit rating), the previously recognized impairment loss is reversed by adjusting the allowance account. The reversal shall not result in a carrying amount of the financial asset that exceeds what the amortized cost would have been had the impairment not been recognized at the date of the impairment is reversed. The amount of the reversal is recognized in consolidated profit or loss.
(ii) Carried at Fair Value – AFS Financial Assets
When a decline in the fair value of an AFS financial asset has been recognized in consolidated other comprehensive income and there is objective evidence that the asset is impaired, the cumulative loss – measured as the difference between the acquisition cost (net of any principal repayment and amortization) and current fair value, less any impairment loss on that financial asset previously recognized in consolidated statements of profit or loss – is reclassified from Revaluation Reserves to consolidated profit or loss as a reclassification adjustment even though the financial asset has not been derecognized.
Impairment losses recognized in consolidated profit or loss on equity instruments are not reversed through consolidated profit or loss. Reversal of impairment losses is recognized in consolidated other comprehensive income, except for financial assets that are debt securities, which are recognized in consolidated profit or loss only if the reversal can be objectively related to an event occurring after the impairment loss was recognized.
- 19 -
(iii) Carried at Cost – AFS Financial Assets
If there is objective evidence of impairment for any of the unquoted equity instruments that is not carried at fair value because its fair value cannot be reliably measured, or on a derivative asset that is linked to and required to be settled by delivery of such an unquoted equity instrument, impairment loss is recognized. The amount of impairment loss is the difference between the carrying amount of the financial asset and the present value of estimated future cash flows discounted at the current market rate of return for a similar financial asset. Such impairment losses are not reversed.
(c) Items of Income and Expense Related to Financial Assets
All income and expenses, except those arising from operating activities, relating to financial assets that are recognized in consolidated profit or loss are presented as part of Finance Income or Finance Costs in the consolidated statement of profit or loss. Non-compounding interest, dividend income and other cash flows resulting from holding financial assets are recognized in consolidated profit or loss when earned, regardless of how the related carrying amount of financial assets is measured.
(d) Derecognition of Financial Assets
The financial assets (or where applicable, a part of a financial asset or part of a group of financial assets) are derecognized when the contractual rights to receive cash flows from the financial instruments expire, or when the financial assets and all substantial risks and rewards of ownership have been transferred to another party. If the Group neither transfers nor retains substantially all the risks and rewards of ownership and continues to control the transferred asset, the Group recognizes its retained interest in the asset and an associated liability for amounts it may have to pay. If the Group retains substantially all the risks and rewards of ownership of a transferred financial asset, the Group continues to recognize the financial asset and also recognizes a collateralized borrowing for the proceeds received.
2.6 Real Estate Held-for-Sale
Acquisition costs of raw land intended for future development, including other costs and expenses incurred to effect the transfer of title of the property as well as related property development costs are accumulated in this account.
Real estate held-for-sale is carried at the lower of cost and net realizable value. Net realizable value is the estimated selling price in the ordinary course of business, less estimated costs to complete and the estimated costs necessary to make the sale. Real estate held-for-sale is expected to be sold within the normal operating cycle of FRC. 2.7 Prepayments and Other Assets Prepayments and other assets pertain to other resources controlled by the Group as a result of past events. They are recognized in the consolidated financial statements when it is probable that the future economic benefits will flow to the Group and the asset has a cost or value that can be measured reliably.
- 20 -
Where future economic benefits are expected to flow to the Group beyond one year after the end of the reporting period, these other assets are classified under the non-current category.
2.8 Property and Equipment
Except for land, which is stated at cost less any impairment in value, property and equipment are stated at cost less accumulated depreciation, amortization and impairment in value, if any.
The cost of an asset comprises its purchase price and directly attributable costs of bringing the asset to working condition for its intended use. Expenditures for additions, major improvements and renewals are capitalized; expenditures for repairs and maintenance are charged to expense as incurred.
Depreciation and amortization are computed on the straight-line basis over the estimated useful lives of the assets as follows:
Building and improvements 20 years Furniture and equipment 3 – 6 years Miscellaneous equipment 5 years
Construction in progress represents properties under construction and is stated at cost. This includes cost of construction, borrowing costs and other direct costs (see Note 2.18). The account is not depreciated until such time that the assets are completed and available for use.
An asset’s carrying amount is written down immediately to its recoverable amount if the asset’s carrying amount is greater than its estimated recoverable amount (see Note 2.16).
The residual values, estimated useful lives and method of depreciation and amortization of property and equipment are reviewed and adjusted, if appropriate, at the end of each reporting period. Fully depreciated and amortized assets are retained in the accounts until they are no longer in use and no further charge for depreciation and amortization is made in respect of those assets.
An item of property and equipment, including the related accumulated depreciation, amortization and impairment losses, is derecognized upon disposal or when no future economic benefits are expected to arise from the continued use of the asset. Any gain or loss arising on derecognition of the asset (calculated as the difference between the net disposal proceeds and the carrying amount of the item) is included in consolidated profit or loss in the period the item is derecognized.
2.9 Investment Properties
Investment properties are measured initially at acquisition cost. Subsequently, investment properties, except land, are carried at cost less accumulated depreciation and amortization and impairment in value, if any. Depreciation of investment properties, which consists of building and improvements, is computed using the straight-line method over its estimated useful life of 20 years. Land is carried at cost less impairment in value, if any.
- 21 -
Investment properties include construction in progress which represents condominium units of FRC that are still under construction and are stated at cost. This includes cost of construction, applicable borrowing costs (see Note 2.18) and other direct costs. The account is not depreciated until such time that the assets are completed and available for use. Transfers are made to and from investment property when, and only when, there is a change in use, evidenced by the end or commencement of owner-managed, commencement of an operating lease to another party, by the end of construction or development, or commencement of development with a view to sell.
For a transfer from investment property to owner-occupied property or inventories, the cost of property for subsequent accounting is its carrying value at the date of change in use. If an owner-occupied property becomes an investment property, the Group accounts for such property in accordance with the policy stated under Property and Equipment up to the date of change in use (see Note 2.8).
Investment property is derecognized upon disposal or when permanently withdrawn from use and no future economic benefit is expected from its disposal. Any gain or loss on the retirement or disposal of an investment property is recognized in consolidated profit or loss in the year of retirement or disposal. An asset’s carrying amount is written down immediately to its recoverable amount if the asset’s carrying amount is greater than its estimated recoverable amount (see Note 2.16).
2.10 Financial Liabilities
Financial liabilities, which include trade and other payables [except tax-related liabilities, Deposits payable and National Service Training Program (NSTP) trust fund], interest-bearing loans, derivative liability and refundable deposits (presented under Other Non-current Liabilities) are recognized when the Group becomes a party to the contractual terms of the instrument. Trade and other payables account include deposits payable which represents funds collected from students or entities and are held by the Group. The Group has no control over its use and disburses the funds only upon instruction of the student or entity that made the deposit. This account also includes Trust funds which represent restricted funds of the University, FECSI and EACCI that are intended for student’s NSTP and other specific educational purposes [see also Note 2.13(a)]. The University, FECSI and EACCI administer the use of these NSTP trust funds based on the specific purpose for which such funds are identified with. Interest-bearing loans are availed for capital expenditures and to provide general corporate funding requirements. Financial liabilities are recognized initially at their fair values and subsequently measured at amortized cost, except derivative liability which is consistently measured at fair value, using the effective interest method for maturities beyond one year, less settlement payments.
Dividend distributions to shareholders are recognized as financial liabilities upon declaration by the Group’s BOD or BOT.
- 22 -
Financial liabilities are classified as current liabilities if payment is due to be settled within one year or less after the reporting period, or the Group does not have an unconditional right to defer settlement of the liability for at least 12 months after the reporting period. Otherwise, these are presented as non-current liabilities. Financial liabilities are derecognized from the consolidated statement of financial position only when the obligations are extinguished either through discharge, cancellation or expiration. The difference between the carrying amount of the financial liability derecognized and the consideration paid or payable is recognized in profit or loss.
2.11 Offsetting Financial Instruments
Financial assets and financial liabilities are offset and the resulting net amount, considered as a single financial asset or financial liability, is reported in the consolidated statement of financial position when there is a legally enforceable right to set-off the recognized amounts and there is an intention to settle on a net basis, or realize the asset and settle the liability simultaneously. The right of set-off must be available at the end of the reporting period, that is, it is not contingent on future event. It must also be enforceable in the normal course of business, in the event of default, and in the event of insolvency or bankruptcy; and, must be legally enforceable for both entity and all counterparties to the financial instruments. 2.12 Provisions and Contingencies
Provisions are recognized when present obligations will probably lead to an outflow of economic resources and they can be estimated reliably even if the timing or amount of the outflow may still be uncertain. A present obligation arises from the presence of a legal or constructive commitment that has resulted from past events.
Provisions are measured at the estimated expenditure required to settle the present obligation, based on the most reliable evidence available at the end of the reporting period, including the risks and uncertainties associated with the present obligation. Where there are a number of similar obligations, the likelihood that an outflow will be required in settlement is determined by considering the class of obligations as a whole. When time value of money is material, long-term provisions are discounted to their present values using a pretax rate that reflects market assessments and the risks specific to the obligation. The increase in the provision due to passage of time is recognized as interest expense. Provisions are reviewed at the end of each reporting period and adjusted to reflect the current best estimate.
In those cases where the possible outflow of economic resource as a result of present obligations is considered improbable or remote, or the amount to be provided for cannot be measured reliably, no liability is recognized in the consolidated financial statements. Similarly, possible inflows of economic benefits to the Group that do not yet meet the recognition criteria of an asset are considered contingent assets, hence, are not recognized in the consolidated financial statements. On the other hand, any reimbursement that the Group can be virtually certain to collect from a third party with respect to the obligation is recognized as a separate asset not exceeding the amount of the related provision.
- 23 -
2.13 Revenue and Expense Recognition Revenue is measured by reference to the fair value of consideration received or receivable by the Group for services rendered, excluding value-added tax (VAT) and discounts. Revenue is recognized to the extent that the revenue can be reliably measured; it is probable that the economic benefits will flow to the Group; and, the costs incurred or to be incurred can be measured reliably. In addition, the following specific recognition criteria must also be met before revenue is recognized:
(a) Tuition and other school fees – Revenue is recognized in consolidated profit or loss over the corresponding school term. Tuition fee received in advance and applicable to a school term after the reporting period is not recognized in consolidated profit or loss until the next reporting period and are presented as part of the Deferred Revenues account in the consolidated statement of financial position. Revenues from NSTP trust funds (see Note 2.10) are recognized upon fulfillment of conditions attached to the fund and/or up to the extent that the related expenses have been incurred. Restricted funds for which restrictions and conditions have not yet been met are recorded as NSTP trust fund under the Trade and Other Payables account in the consolidated statement of financial position.
(b) Rental – Revenue is recognized in the consolidated statement of profit or loss over the term of the lease using the straight-line method and, in certain cases, the amount determined using straight-line method or amount determined using a certain percentage of the lessee’s gross annual revenue, whichever is higher. Rent received in advance is initially recorded as part of the Deferred Revenues account in the consolidated statement of financial position.
(c) Management fees – Revenue is recognized on a monthly basis upon rendering of the
services.
(d) Sale of real estate – Revenue is recognized when the earnings process is virtually complete and collectibility of the entire sales price is reasonably assured. This is presented as Other Operating Income in the consolidated statement of profit or loss.
(e) Income from sale of books and other educational-related merchandise – Revenue is recognized
when the risks and rewards of ownership of the goods have passed to the buyer. This is generally when the customer has acknowledged delivery of goods. The sale of this merchandise is made exclusively for the students of the University and FECSI. This auxiliary income is presented as part of Other Income in the consolidated statements of profit or loss.
(f) Interest – Income is recognized as the interest accrues taking into account the
effective yield on the asset.
Cost and expenses are recognized in consolidated profit or loss upon utilization of goods or services or at the date such cost and expenses are incurred. All finance costs are reported in the consolidated profit or loss on an accrual basis, except capitalized borrowing costs which are included as part of the cost of the related qualifying asset, on an accrual basis (see Note 2.18).
- 24 -
2.14 Leases The Group accounts for its leases as follows:
(a) Group as Lessee
Leases which do not transfer to the Group substantially all the risks and benefits of ownership of the asset are classified as operating leases. Operating lease payments (net of any incentive received from the lessor) are recognized as expense in the consolidated statement of profit or loss on a straight-line basis over the lease term. Associated costs, such as maintenance and insurance, are expensed as incurred.
(b) Group as Lessor
Leases which do not transfer to the lessee substantially all the risks and benefits of ownership of the asset are classified as operating leases. Lease income from operating leases is recognized in the consolidated statement of profit or loss on a straight-line basis over the lease term.
The Group determines whether an arrangement is, or contains, a lease based on the substance of the arrangement. It makes an assessment of whether the fulfillment of the arrangement is dependent on the use of a specific asset or assets and the arrangement conveys a right to use the asset. 2.15 Foreign Currency Transactions and Translation
The accounting records of the Group are maintained in Philippine pesos. Foreign currency transactions during the year are translated into the functional currency at exchange rates which approximate those prevailing on transaction dates. Foreign currency gains and losses resulting from the settlement of such transactions and from the translation at year-end exchange rates of monetary assets and liabilities denominated in foreign currencies are recognized in the consolidated statement of profit or loss. Changes in the fair value of monetary financial assets denominated in foreign currency classified as AFS financial assets are analyzed between translation differences resulting from changes in the amortized cost of the security and other changes in the carrying amount of the security. Translation differences related to changes in amortized cost are recognized in consolidated profit or loss, and other changes in the carrying amount are recognized in consolidated other comprehensive income.
2.16 Impairment of Non-financial Assets
The Group’s investment in an associate, property and equipment, investment properties, and certain other non-financial assets are tested for impairment whenever events or changes in circumstances indicate that the carrying amount may not be recoverable. Goodwill, as indicated in Note 2.4, is tested for impairment annually. For purposes of assessing impairment, assets are grouped at the lowest levels for which there are separately identifiable cash flows CGU. As a result, some assets are tested individually for impairment and some are tested at CGU level.
- 25 -
An impairment loss is recognized in the consolidated profit or loss for the amount by which the asset’s or CGU’s carrying amount exceeds its recoverable amount. The recoverable amount is the higher of fair value, reflecting market conditions less costs to sell, and value in use, based on an internal evaluation of discounted cash flows. In determining value in use, management estimates the expected future cash flows from each CGU and determines the suitable interest rate in order to calculate the present value of those cash flows. The data used for impairment testing procedures are directly linked to the Group’s latest approved budget, adjusted as necessary to exclude the effects of asset enhancements. Discount factors are determined individually for each CGU and reflect management’s assessment of respective risk profiles, such as market and asset-specific risk factors. Impairment loss is charged pro-rata to the other assets in the CGU.
All assets, except goodwill for which impairment loss is not reversed (see Note 2.4), are subsequently reassessed for indications that an impairment loss previously recognized may no longer exist. An impairment loss is reversed if the asset’s or CGU’s recoverable amount exceeds its carrying amount.
2.17 Employee Benefits
The Group, except RCI, provides post-employment benefits to employees through a defined contribution plan subject to compliance to a minimum guarantee required by Republic Act (RA) No. 7641, The Retirement Pay Law, which is accounted for as a defined benefit plan, and various compensations mandated by law. Such application of the minimum guarantee prescribed by RA No. 7641 is based on the interpretations issued by the Philippine Interpretations Committee (PIC) in its Question and Answer on PAS 19 – Accounting for Employee Benefits Under a Defined Benefit Contribution Plan Subject to the Requirements of RA 7641.
(a) Post-employment Benefits
The Group maintains defined contribution and defined benefit plans. Under the defined contribution plan, the Group (except RCI) pays fixed contributions based on the employees’ monthly salaries.
RCI, which does not have a formal post-employment benefit plan, bases its determination of post-employment benefit obligation on RA No. 7641, which is considered a defined benefit plan. RA No. 7641 provides for a qualified employee a defined benefit minimum guarantee. The defined benefit minimum guarantee is equivalent to a certain percentage of the monthly salary payable to an employee at normal retirement age with the required credited years of service based on the provisions of RA No. 7641. The legal obligation for any benefits from this kind of post-employment plan remains with the entity even if plan assets, if any, for funding the defined benefit plan have been acquired.
The whole Group, however, is covered by RA No. 7641. Accordingly, the Group, except RCI, recognizes its post-employment benefit obligation based on the higher of the defined benefit obligation relating to the minimum guarantee required by RA No. 7641 and the obligation arising from the defined contribution plan. RCI accrues its post-employment benefit obligation solely based on minimum guarantee requirement of RA No. 7641.
- 26 -
For defined benefit plan, the liability recognized in the consolidated statement of financial position for a defined benefit plan is the present value of the defined benefit obligation (DBO) at the end of the reporting period. The DBO is calculated annually by an independent actuary using the projected unit credit method. The present value of the DBO is determined by discounting the estimated future cash outflows for expected benefit payments using a discount rate derived from the interest rates of zero coupon government bonds as published by Philippine Dealing & Exchange Corp., that are denominated in the currency in which the benefits will be paid and that have terms to maturity approximating to the terms of the related post-employment liability.
Remeasurements, comprising of actuarial gains and losses arising from experience adjustments and changes in actuarial assumptions and the return on plan assets (excluding amount included in net interest) are reflected immediately in the consolidated statement of financial position with a charge or credit recognized in consolidated other comprehensive income in the period in which they arise. Net interest expense and other expenses related to the defined benefit plan are recognized in the consolidated statement of profit or loss. The defined contribution, on the other hand, is measured at the fair value of the defined contribution assets upon which the defined contribution benefits depend, with an adjustment for margin on asset returns, if any, where this is reflected in the defined contribution benefits. When the benefits of a plan are changed or when a plan is curtailed, the resulting change in benefit that relates to past service or the gain or loss on curtailment is recognized immediately in consolidated profit or loss. The Group recognizes gains or losses on the settlement of a defined benefit plan when the settlement occurs.
(b) Termination Benefits
Termination benefits are payable when employment is terminated by the Group before the normal retirement date, or whenever an employee accepts voluntary redundancy in exchange for these benefits. The Group recognizes termination benefits when it is demonstrably committed to either: (i) terminating the employment of current employees according to a detailed formal plan without possibility of withdrawal; or, (ii) providing termination benefits as a result of an offer made to encourage voluntary redundancy. Benefits falling due more than 12 months after the reporting period are discounted to their present value.
(c) Bonuses
The Group recognizes a liability and an expense for bonuses. The Group recognizes a provision where it is contractually obliged to pay the benefits, or where there is a past practice that has created a constructive obligation.
(d) Compensated Absences
Compensated absences are recognized for the number of paid leave days (including holiday entitlement) remaining at the end of the reporting period. These are included in the Trade and Other Payables account in the consolidated statement of financial position at the undiscounted amount that the Group expects to pay as a result of the unused entitlement.
- 27 -
2.18 Borrowing Costs
Borrowing costs are recognized as expenses in the period in which they are incurred, except to the extent that they are capitalized. Borrowing costs that are directly attributable to the acquisition, construction or production of a qualifying asset (i.e., an asset that takes a substantial period of time to get ready for its intended use or sale) are capitalized as part of cost of such asset. The capitalization of borrowing costs commences when expenditures for the asset and borrowing costs are being incurred and activities that are necessary to prepare the asset for its intended use or sale are in progress. Capitalization ceases when substantially all such activities are complete. Investment income, if any, earned on the temporary investment of specific borrowings pending their expenditure on qualifying assets is deducted from the borrowing costs eligible for capitalization.
2.19 Income Taxes
Tax expense recognized in profit or loss comprises the sum of current tax and deferred tax not recognized in other comprehensive income or directly in equity, if any. Current tax assets or current tax liabilities comprise those claims from, or obligations to, fiscal authorities relating to the current or prior reporting period, that are uncollected or unpaid at the end of the reporting period. They are calculated using the tax rates and tax laws applicable to the fiscal periods to which they relate, based on the taxable profit for the year. All changes to current tax assets or liabilities are recognized as a component of tax expense in profit or loss.
Deferred tax is accounted for using the liability method on temporary differences at the end of the reporting period between the tax base of assets and liabilities and their carrying amounts for financial reporting purposes. Under the liability method, with certain exceptions, deferred tax liabilities are recognized for all taxable temporary differences and deferred tax assets are recognized for all deductible temporary differences and the carryforward of unused tax losses and unused tax credits to the extent that it is probable that taxable profit will be available against which the deductible temporary differences can be utilized. Unrecognized deferred tax assets are reassessed at the end of each reporting period and are recognized to the extent that it has become probable that future taxable profit will be available to allow such deferred tax assets to be recovered.
Deferred tax assets and deferred tax liabilities are measured at the tax rates that are expected to apply to the period when the asset is realized or the liability is settled provided such tax rates have been enacted or substantively enacted at the end of the reporting period. The carrying amount of deferred tax assets is reviewed at the end of each reporting period and reduced to the extent that it is probable that sufficient taxable profit will be available to allow all or part of the deferred tax asset to be utilized.
The measurement of deferred tax liabilities and deferred tax assets reflects the tax consequences that would follow from the manner in which the Group expects, at the end of the reporting period, to recover or settle the carrying amount of its assets and liabilities.
- 28 -
Most changes in deferred tax assets or deferred tax liabilities are recognized as a component of tax expense in the consolidated profit or loss. Only changes in deferred tax assets or liabilities that relate to items recognized in the consolidated other comprehensive income or directly in equity are recognized in the consolidated other comprehensive income or directly in equity, respectively.
Deferred tax assets and deferred tax liabilities are offset only if the University or any of its subsidiaries has a legally enforceable right to set-off current tax assets against current tax liabilities and the deferred taxes relate to the same taxation authority.
2.20 Related Party Transactions and Relationships
Related party transactions are transfers of resources, services or obligations between the Group and its related parties, regardless of whether a price is charged.
Parties are considered to be related if one party has the ability to control the other party or exercise significant influence over the party in making financial and operating decisions. These parties include: (a) individuals owning, directly or indirectly through one or more intermediaries, control or are controlled by, or under common control with the Group; (b) associates; (c) individuals owning, directly or indirectly, an interest in the voting power of the Group that gives them significant influence over the Group and close members of the family of any such individual; and, (d) certain funded retirement plans administered by an organization, through its Retirement Board.
In considering each possible related party relationship, attention is directed to the substance of the relationship and not merely on the legal form.
2.21 Equity
Capital stock represents the nominal value of shares that have been issued.
Treasury stocks are stated at the cost of reacquiring such shares and are deducted from equity attributable to the University’s equity holders until the shares are cancelled, reissued or disposed of. This also includes shares of the parent company held by a certain subsidiary (see Note 2.3).
Revaluation reserves comprise accumulated gains or losses arising from the revaluation of AFS financial assets and remeasurement of post-employment benefit plan. Other reserves refer to the amount attributable to the parent company arising from the changes in the ownership of the NCI in the Group. Retained earnings, both restricted and available for dividend declaration, represent all current and prior period results of operations as reported in the consolidated statement of profit or loss. The appropriated portion represents the amount which is not available for distribution. NCI represents the interests not held by the Group in FRC and RCI. It also includes the preferred shares of stock of EACCI and FEUAI issued to a stockholder outside of the Group but under the Group’s common management (see Note 25.4).
- 29 -
2.22 Earnings (Loss) Per Share
Basic earnings (loss) per share (EPS) is determined by dividing net profit or loss attributable to equity holders of the University by the weighted average number of shares subscribed and issued during the period after giving retroactive effect to stock dividend declared, stock split and reverse stock split during the current year, if any. Diluted EPS is computed by adjusting the weighted average number of ordinary shares outstanding to assume conversion of dilutive potential shares. The Group does not have dilutive potential shares outstanding that would require disclosure of diluted EPS in the consolidated statement of profit or loss.
2.23 Segment Reporting
Operating segments are reported in a manner consistent with the internal reporting provided to the Group’s strategic steering committee, its chief operating decision-maker. The strategic steering committee is responsible for allocating resources and assessing performance of the operating segments. In identifying its operating segments, management generally follows the Group’s products and service lines as disclosed in Note 7, which represent the main products and services provided by the Group.
Each of these operating segments is managed separately as each of these service lines requires different technologies and other resources, as well as marketing approaches. All intersegment transfers are carried out at arm’s length prices.
The measurement policies the Group uses for segment reporting under PFRS 8, Operating Segments, are the same as those used in its consolidated financial statements.
In addition, corporate assets which are not directly attributable to the business activities of any operating segment are not allocated to a segment. There have been no changes from prior periods in the measurement methods used to determine reported segment profit or loss. 2.24 Events After the End of the Reporting Period Any post-year-end event that provides additional information about the Group’s consolidated financial position at the end of the reporting period (adjusting event) is reflected in the consolidated financial statements. Post-year-end events that are not adjusting events, if any, are disclosed when material to the consolidated financial statements.
3. SIGNIFICANT ACCOUNTING JUDGMENTS AND ESTIMATES
The preparation of the Group’s consolidated financial statements in accordance with PFRS requires management to make judgments and estimates that affect the amounts reported in the consolidated financial statements and related notes. Judgments and estimates are continually evaluated and are based on historical experience and other factors, including expectations of future events that are believed to be reasonable under the circumstances. Actual results may ultimately differ from these estimates.
- 30 -
3.1 Critical Management Judgments in Applying Accounting Policies In the process of applying the Group’s accounting policies, management has made the following judgments, apart from those involving estimation. The following judgments have the most significant effect on the amounts recognized in the consolidated financial statements:
(a) Classification of Financial Assets as HTM Investments
In classifying non-derivative financial assets with fixed or determinable payments and fixed maturity, such as bonds, as HTM investments, the Group evaluates its intention and ability to hold such investments up to maturity. Management has confirmed its intention and determined its ability to hold the investments up to maturity. If the Group fails to keep these investments to maturity other than for specific circumstances as allowed under the standard, it will be required to reclassify the whole class as AFS financial assets. In such a case, the investments would, therefore, be measured at fair value, not at amortized cost.
(b) Impairment of AFS Financial Assets
The determination when an investment is other-than-temporarily impaired requires significant judgment. In making this judgment, the Group evaluates, among other factors, the duration and extent to which the fair value of an investment is less than its cost, and the financial health of and near-term business outlook for the investee, including factors such as industry and sector performance, changes in technology and operational and financing cash flows. The management considers more than 20% decline in fair value as significant and continuous decline in value beyond nine months to be prolonged. Based on the recent evaluation of information and circumstances affecting the Group’s AFS financial assets, management concluded that the assets are not impaired as at May 31, 2018, 2017 and 2016. Future changes in those information and circumstance might significantly affect the carrying amount of the assets.
(c) Determination of Control of Entities in which the University Holds Less than 50%
Management considers that the University has de facto control of FRC even though it holds less than 50% of the ordinary shares and voting rights in the latter. Although the University holds less than 50% of the voting shares of stock of FRC, it has control over FRC because it is exposed or has right to variable returns from its involvement with FRC and it has the ability to affect those returns through its power over FRC. It is able to do this primarily because the University has the power to cast the majority of votes at meetings of the BOD and elect officers of FRC. Accordingly, FRC is recognized as a subsidiary of the University (see Note 1.1).
On the other hand, JMCI is not considered a subsidiary because the Group does not
make financial or operational decisions for the benefit of JMCI. It only has significant influence over the entity.
- 31 -
(d) Amortization of Leasehold Improvements The Group’s leasehold improvements, are amortized over 20 years, which is the estimated useful life of the asset (see Notes 2.8 and 14) regardless of the term of the lease contracts which is usually shorter than the expected useful life of the improvements because it is highly probable that the lease contract will be renewed before the end of such contract. A decision by management not to renew its lease agreement will result in a significant impact on its consolidated profit or loss in the period such decision is made.
(e) Distinction between Investment Properties and Owner-managed Properties
The Group determines whether a property qualifies as investment property. In making its judgment, the Group considers whether the property generates cash flows largely independent of the other assets held by an entity. Owner-managed properties generate cash flows that are attributable not only to the property but also to other assets used in the process of providing educational services.
Some properties comprise a portion that is held to earn rental or for capital appreciation and another portion that is held for use in the supply of services or for administrative purposes. If a portion can be sold separately (or leased out separately under finance lease), the Group accounts for such portion separately. If the portion cannot be sold separately, the property is accounted for as investment property only if an insignificant portion is held for use in the supply of services or for administrative purposes. Judgment is applied in determining whether ancillary services are so significant that a property does not qualify as investment property. The Group considers each property separately in making its judgment.
(f) Distinction between Real Estate for Sale and Investment Properties
Real estate for sale comprise lots that are held for sale in the ordinary course of business (see Note 12). Meanwhile, investment properties (see Note 15) comprise of land and buildings which are not occupied substantially for use by, or in the operations of, the Group, nor for sale in the ordinary course of business, but are held primarily to earn rental income and capital appreciation. The Group considers management’s intention over these assets in making its judgement.
(g) Distinction between Operating and Finance Lease
The Group has entered into various lease agreements as either a lessor or a lessee. Judgment was exercised by management to distinguish each lease agreement as either an operating or finance lease by looking at the transfer or retention of significant risk and rewards of ownership of the properties covered by the agreements. Failure to make the right judgment will result in either overstatement or understatement of assets and liabilities. Currently, all of the Group’s lease agreements are determined to be operating leases.
- 32 -
(h) Recognition of Provisions and Contingencies
Judgment is exercised by management to distinguish between provisions and contingencies. Accounting policies on recognition and disclosure of provisions and contingencies are discussed in Note 2.12 and relevant disclosures are presented in Note 28.
3.2 Key Sources of Estimation Uncertainty
The following are the key assumptions concerning the future, and other key sources of estimation uncertainty at the end of the reporting period, that have a significant risk of causing a material adjustment to the carrying amounts of assets and liabilities within the next reporting period:
(a) Estimation of Impairment of Trade and Other Receivables
The Group maintains an allowance for impairment loss on receivables at a level considered adequate to cover probable uncollectible receivables. The level of this allowance is evaluated by management on the basis of factors that affect the collectability of the accounts. These factors include, but are not limited to, history of the students’ payment behavior, age of receivables and other external factors affecting the education industry. The Group constantly reviews the age and status of receivables and identifies accounts that should be provided with allowance. The methodology and assumptions used in estimating future cash flows are reviewed regularly by the Group to reduce any difference between loss estimates and actual loss experience. The carrying value of trade and other receivables and the analysis of allowance for impairment on such financial assets are shown in Note 9.
(b) Determination of Fair Value Measurement for Financial Instruments other than Loans and
Receivables
Management applies valuation techniques to determine the fair value of financial instruments where active market quotes are not available. This requires management to develop estimates and assumptions based on market inputs, using observable data that market participants would use in pricing the instrument. Where such data is not observable, management uses its best estimate. Estimated fair values of financial instruments may vary from the actual prices that would be achieved in an arm’s length transaction at the end of the reporting period.
The carrying values of the Group’s AFS financial assets and HTM investments and the amounts of fair value changes recognized during the years on those assets are disclosed in Note 11. On the other hand, the carrying value of the cross-currency swap is disclosed in Note 10 while fair value gains or losses on cross-currency swap agreements are presented as part of Fair value gains or losses on financial assets at FVTPL under Finance Income or Finance Costs in the consolidated statement of profit or loss (see Note 21).
(c) Estimation of Useful Lives of Property and Equipment and Investment Properties
The Group estimates the useful lives of property and equipment and investment properties based on the period over which the assets are expected to be available for use. The estimated useful lives of these assets are reviewed periodically and are updated if expectations differ from previous estimates due to physical wear and tear, technical or commercial obsolescence and legal or other limits on the use of the assets.
- 33 -
The carrying amounts of property and equipment and investment properties are presented in Notes 14 and 15, respectively. Based on management’s assessment as at May 31, 2018, 2017 and 2016, there is no change in the estimated useful lives of the assets during those years. Actual results, however, may vary due to changes in factors mentioned above.
(d) Determination of Fair Value of Investment Properties
Investment properties are measured using the cost model. The fair value disclosed in Note 15 is determined by the Group based on the appraisal report prepared by independent appraisers using the relevant valuation methodology as discussed in Note 6.4.
For investment properties with appraisal conducted prior to the end of the current reporting period, management determines whether there are significant circumstances during the intervening period that may require adjustments or changes in the disclosure of fair value of those properties.
For investment properties without appraisal report, the fair value disclosed in the consolidated financial statements is determined by the Group using the discounted cash flows valuation method since information on appraisal reports is not readily available. The Group uses assumptions that are mainly based on market conditions existing at the end of each reporting period.
The principal assumptions underlying management’s estimation of fair value are those related to the receipt of contractual rentals, expected future market rentals, and appropriate discount rates. These valuations are regularly compared to actual to market yield data, and actual transactions by the Group and those reported by the market. A significant change in these elements may affect the prices and the value of the assets. As of May 31, 2018, 2017 and 2016, the University determined that there were no significant circumstances that may affect the fair value determination of investment properties.
(e) Estimation of Impairment of Non-financial Assets
The Group’s policy on estimating the impairment of non-financial assets is discussed in detail in Note 2.16. Though management believes that the assumptions used in the estimation of recoverable amounts are appropriate and reasonable, significant changes in these assumptions may materially affect the assessment of recoverable values and any resulting impairment loss could have a material adverse effect on the results of operations.
Based on management’s assessment, no impairment loss is required to be recognized on the investment in an associate, investment properties, property and equipment, goodwill, and certain other non-financial assets as of May 31, 2018, 2017 and 2016. The Group recognized goodwill arising from the University’s acquisition of the net assets of RCI from which the University had expected future economic benefits and synergies that will result from combining the operations of the acquired school with that of the University (see Note 1.2). Goodwill is subject to annual impairment testing and whenever there is an indication of impairment.
- 34 -
For purposes of assessing impairment, the Group based on the value in use of the CGU (that is, RCI) to which the carrying value of goodwill is compared. This methodology is in accordance with PAS 36, Impairment of Assets. The management considers that the benefits of acquisition accrue to the University as a whole and not to a specific business unit nor department only.
In determining the value in use, discounted cash flows method was used. Some of the key assumptions that have been considered which have significant impact on the results of the determination of the value in use are as follows:
• RCI will continue as a going concern entity and will have sufficient financial resources to finance its working capital requirements to achieve its projected forecast and to support its business needs;
• RCI’s performance forecasts for the next five years from the end of each reporting period;
• in estimating the terminal value of the CGU, long-term growth rates at 6.00% and 6.50% (based on forecasted gross domestic product growth rate) as of May 31, 2018 and 2017, respectively, were used; and,
• in discounting the projected free cash flows, weighted average cost of capital of 5.43% and 4.15% was used in 2018 and 2017, respectively.
For the years ended May 31, 2018 and 2017, the Group has assessed that the recoverable amount of the goodwill (P1.9 billion and P2.7 billion as of May 31, 2018 and 2017, respectively) exceeds its carrying amount. Accordingly, no impairment loss is required to be recognized in 2018 and 2017.
(f) Determination of Recoverability of Deferred Tax Assets
The Group reviews its deferred tax assets at the end of each reporting period and reduces the carrying amount to the extent that it is no longer probable that sufficient taxable profit will be available to allow all or part of the deferred tax asset to be utilized. Management assessed that the deferred tax assets as at May 31, 2018, 2017 and 2016 are fully recoverable and will be fully utilized within the prescribed periods, except for the related benefits of net operating loss carryover (NOLCO) and other temporary differences of certain subsidiaries which are not recognized, because it expects that the Group will generate sufficient taxable profits in the future against which the assets can be applied (see Note 23).
(g) Valuation of Post-employment Defined Benefit Obligation
The determination of the obligation and cost of post-employment defined benefit is dependent on the selection of certain assumptions used by actuaries in calculating such amounts. Those assumptions include, among others, discount rates, expected rate of return on plan assets, salary rate increase, and employee turnover rate. A significant change in any of these actuarial assumptions may generally affect the recognized expense, other comprehensive income or losses and the carrying amount of the post-employment benefit obligation in the next reporting period. The amounts of post-employment benefit obligation and expense and an analysis of the movements in the estimated present value of post-employment defined benefit, as well as the significant assumptions used in estimating such obligation are presented in Note 22(b).
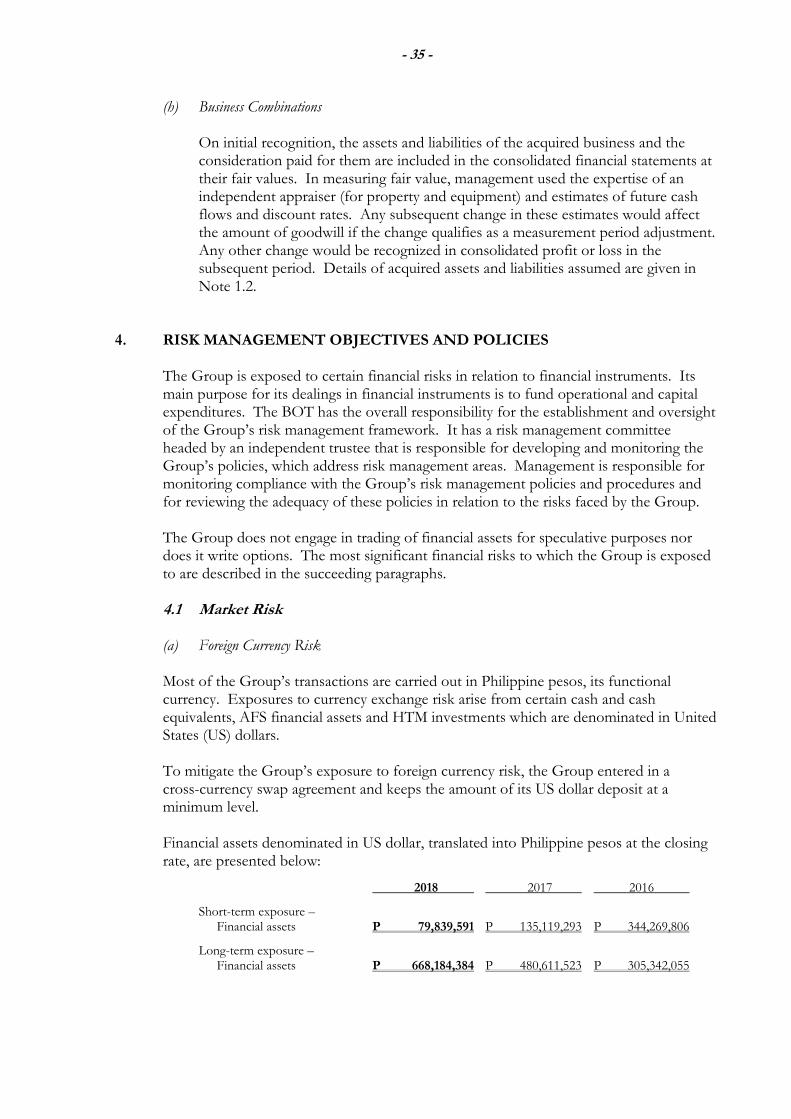
- 35 -
(h) Business Combinations
On initial recognition, the assets and liabilities of the acquired business and the consideration paid for them are included in the consolidated financial statements at their fair values. In measuring fair value, management used the expertise of an independent appraiser (for property and equipment) and estimates of future cash flows and discount rates. Any subsequent change in these estimates would affect the amount of goodwill if the change qualifies as a measurement period adjustment. Any other change would be recognized in consolidated profit or loss in the subsequent period. Details of acquired assets and liabilities assumed are given in Note 1.2.
4. RISK MANAGEMENT OBJECTIVES AND POLICIES The Group is exposed to certain financial risks in relation to financial instruments. Its main purpose for its dealings in financial instruments is to fund operational and capital expenditures. The BOT has the overall responsibility for the establishment and oversight of the Group’s risk management framework. It has a risk management committee headed by an independent trustee that is responsible for developing and monitoring the Group’s policies, which address risk management areas. Management is responsible for monitoring compliance with the Group’s risk management policies and procedures and for reviewing the adequacy of these policies in relation to the risks faced by the Group.
The Group does not engage in trading of financial assets for speculative purposes nor does it write options. The most significant financial risks to which the Group is exposed to are described in the succeeding paragraphs.
4.1 Market Risk
(a) Foreign Currency Risk
Most of the Group’s transactions are carried out in Philippine pesos, its functional currency. Exposures to currency exchange risk arise from certain cash and cash equivalents, AFS financial assets and HTM investments which are denominated in United States (US) dollars. To mitigate the Group’s exposure to foreign currency risk, the Group entered in a cross-currency swap agreement and keeps the amount of its US dollar deposit at a minimum level. Financial assets denominated in US dollar, translated into Philippine pesos at the closing rate, are presented below:
2018 2017 2016
Short-term exposure – Financial assets P 79,839,591 P 135,119,293 P 344,269,806
Long-term exposure – Financial assets P 668,184,384 P 480,611,523 P 305,342,055
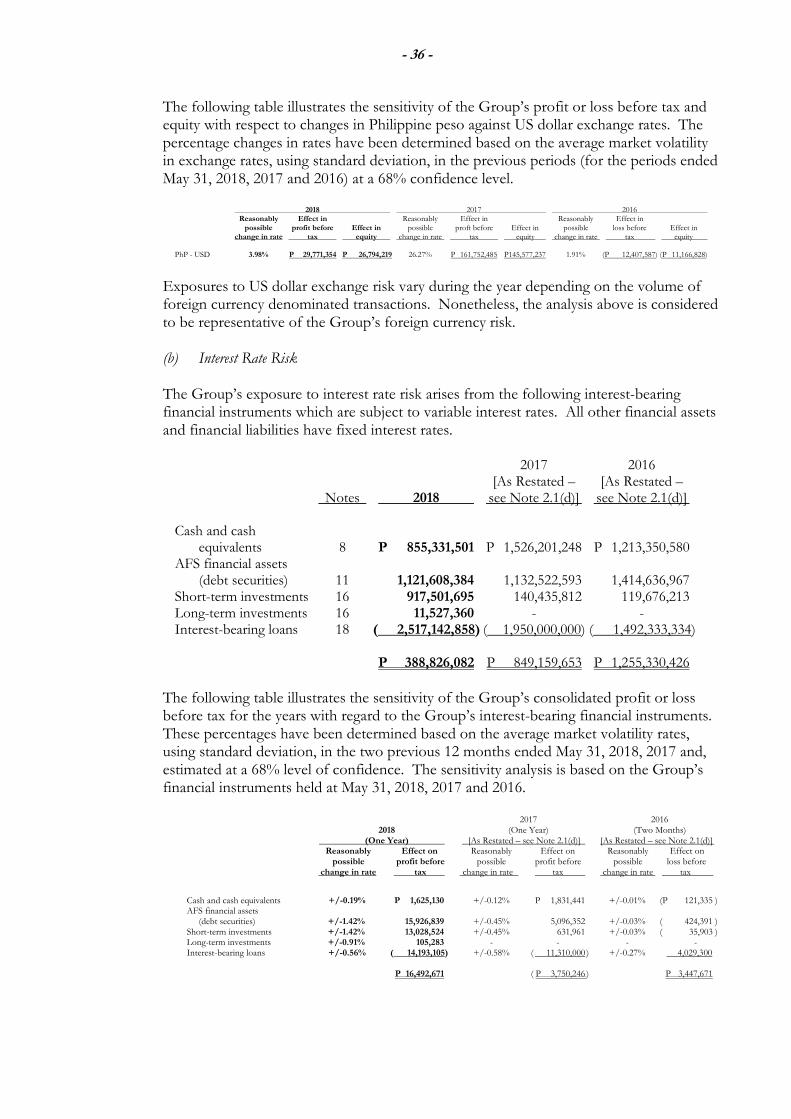
- 36 -
The following table illustrates the sensitivity of the Group’s profit or loss before tax and equity with respect to changes in Philippine peso against US dollar exchange rates. The percentage changes in rates have been determined based on the average market volatility in exchange rates, using standard deviation, in the previous periods (for the periods ended May 31, 2018, 2017 and 2016) at a 68% confidence level.
2018 2017 2016 Reasonably Effect in Reasonably Effect in Reasonably Effect in possible profit before Effect in possible proft before Effect in possible loss before Effect in change in rate tax equity change in rate tax equity change in rate tax equity PhP - USD 3.98% P 29,771,354 P 26,794,219 26.27% P 161,752,485 P 145,577,237 1.91% (P 12,407,587) (P 11,166,828)
Exposures to US dollar exchange risk vary during the year depending on the volume of foreign currency denominated transactions. Nonetheless, the analysis above is considered to be representative of the Group’s foreign currency risk.
(b) Interest Rate Risk
The Group’s exposure to interest rate risk arises from the following interest-bearing financial instruments which are subject to variable interest rates. All other financial assets and financial liabilities have fixed interest rates.
2017 2016 [As Restated – [As Restated – Notes 2018 see Note 2.1(d)] see Note 2.1(d)] Cash and cash equivalents 8 P 855,331,501 P 1,526,201,248 P 1,213,350,580 AFS financial assets (debt securities) 11 1,121,608,384 1,132,522,593 1,414,636,967 Short-term investments 16 917,501,695 140,435,812 119,676,213 Long-term investments 16 11,527,360 - -
Interest-bearing loans 18 ( 2,517,142,858) ( 1,950,000,000) ( 1,492,333,334) P 388,826,082 P 849,159,653 P 1,255,330,426 The following table illustrates the sensitivity of the Group’s consolidated profit or loss before tax for the years with regard to the Group’s interest-bearing financial instruments. These percentages have been determined based on the average market volatility rates, using standard deviation, in the two previous 12 months ended May 31, 2018, 2017 and, estimated at a 68% level of confidence. The sensitivity analysis is based on the Group’s financial instruments held at May 31, 2018, 2017 and 2016.
2017 2016 2018 (One Year) (Two Months) (One Year) [As Restated – see Note 2.1(d)] [As Restated – see Note 2.1(d)] Reasonably Effect on Reasonably Effect on Reasonably Effect on possible profit before possible profit before possible loss before change in rate tax change in rate tax change in rate tax
Cash and cash equivalents +/-0.19% P 1,625,130 +/-0.12% P 1,831,441 +/-0.01% (P 121,335 ) AFS financial assets (debt securities) +/-1.42% 15,926,839 +/-0.45% 5,096,352 +/-0.03% ( 424,391 ) Short-term investments +/-1.42% 13,028,524 +/-0.45% 631,961 +/-0.03% ( 35,903 ) Long-term investments +/-0.91% 105,283 - - - - Interest-bearing loans +/-0.56% ( 14,193,105) +/-0.58% ( 11,310,000 ) +/-0.27% 4,029,300 P 16,492,671 ( P 3,750,246 ) P 3,447,671
- 37 -
(c) Other Price Risk The Group’s exposure to price risk arises from its investments in equity securities, which are classified as part of the AFS financial assets account in the consolidated statements of financial position. These consist of publicly-listed equity securities which are carried at fair value.
Management monitors its equity securities in its investment portfolio based on market indices. Material investments within the portfolio are managed on an individual basis. For equity securities listed in the Philippines, an average volatility of 10.57%, 12.71% and 5.61% have been observed for the periods ended May 31, 2018, 2017 and 2016, respectively. If quoted prices for these securities increased or decreased by that percentage, other comprehensive income (loss) would have changed by P79.8 million, P105.6 million and P42.3 million for the periods ended May 31, 2018, 2017 and 2016, respectively.
No sensitivity analysis was provided for government and corporate bonds, and investments in UITF classified as AFS financial assets as management deemed that the risk at the end of the period is not representative of a risk inherent in financial instruments. The investments are considered medium to long-term strategic investments. In accordance with the Group’s policies, no specific hedging activities are undertaken in relation to these investments, except as discussed in Notes 10 and 11 in connection with its investment in certain foreign currency denominated corporate debt instruments which are also subject to a cross-currency swap agreement. The investments are continuously monitored to ensure that returns of these equity instruments are timely utilized or reinvested in the Group’s favor. 4.2 Credit Risk
Credit risk represents the loss that the Group would incur if the counterparty fails to perform its contractual obligations. The credit risk for cash and cash equivalents, short-term investments (presented as part of Other Current Assets), AFS financial assets and HTM investments is considered negligible, since the counterparties are reputable financial institutions and private companies with high quality external credit ratings. Included in the cash and cash equivalents are cash in banks and short-term placements. These are insured by the Philippine Deposit Insurance Corporation up to a maximum coverage of P0.5 million for every depositor per banking institution. The Group’s exposure to credit risk on its receivables related primarily to the inability of the debtors to pay and students to fully settle the unpaid balance of tuition fees and other charges which are owed to the Group based on installment payment schemes. The Group has established controls and procedures to minimize risks of non-collection. Students are not allowed to enroll in the following semester unless the unpaid balance in the previous semester has been paid. The Group also withholds the academic records and clearance of the students with unpaid balances, thus ensuring that collectability is reasonably assured. The Group’s exposure to credit risk on its other receivables from debtors and related parties is managed through close account monitoring and setting limits.
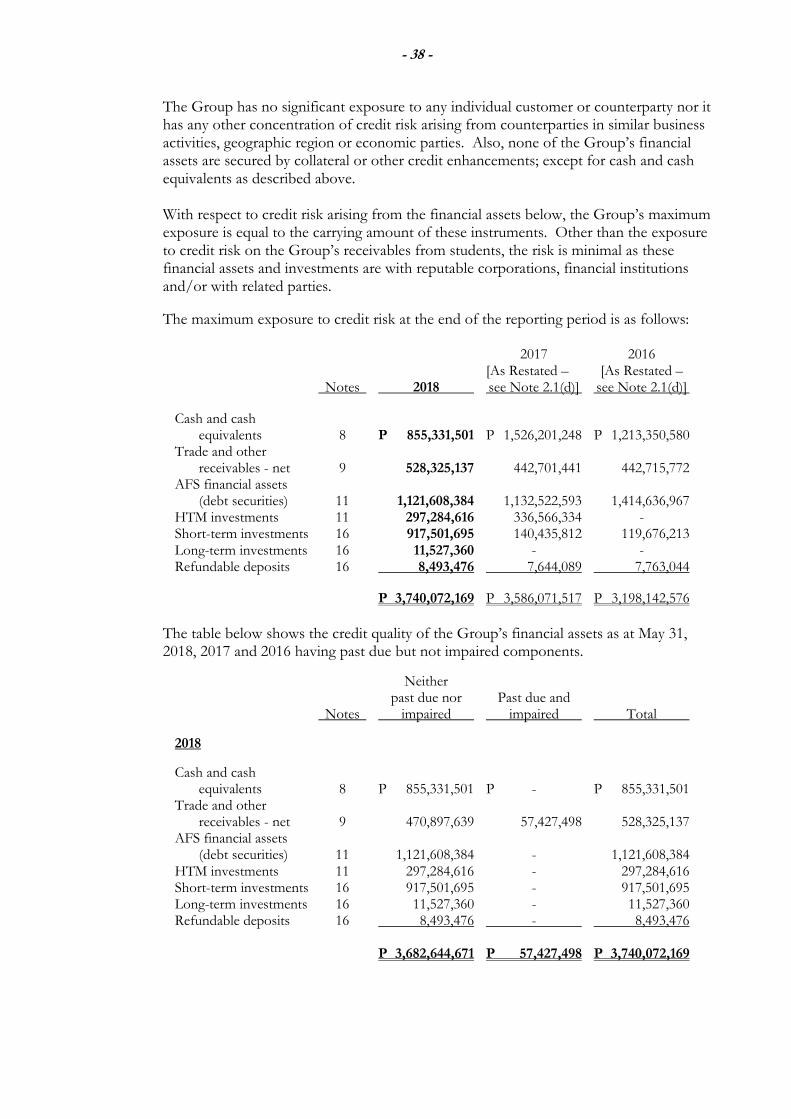
- 38 -
The Group has no significant exposure to any individual customer or counterparty nor it has any other concentration of credit risk arising from counterparties in similar business activities, geographic region or economic parties. Also, none of the Group’s financial assets are secured by collateral or other credit enhancements; except for cash and cash equivalents as described above.
With respect to credit risk arising from the financial assets below, the Group’s maximum exposure is equal to the carrying amount of these instruments. Other than the exposure to credit risk on the Group’s receivables from students, the risk is minimal as these financial assets and investments are with reputable corporations, financial institutions and/or with related parties.
The maximum exposure to credit risk at the end of the reporting period is as follows: 2017 2016 [As Restated – [As Restated –
Notes 2018 see Note 2.1(d)] see Note 2.1(d)]
Cash and cash equivalents 8 P 855,331,501 P 1,526,201,248 P 1,213,350,580 Trade and other receivables - net 9 528,325,137 442,701,441 442,715,772 AFS financial assets (debt securities) 11 1,121,608,384 1,132,522,593 1,414,636,967 HTM investments 11 297,284,616 336,566,334 - Short-term investments 16 917,501,695 140,435,812 119,676,213 Long-term investments 16 11,527,360 - - Refundable deposits 16 8,493,476 7,644,089 7,763,044
P 3,740,072,169 P 3,586,071,517 P 3,198,142,576
The table below shows the credit quality of the Group’s financial assets as at May 31, 2018, 2017 and 2016 having past due but not impaired components.
Neither past due nor Past due and Notes impaired impaired Total
2018
Cash and cash equivalents 8 P 855,331,501 P - P 855,331,501 Trade and other receivables - net 9 470,897,639 57,427,498 528,325,137 AFS financial assets (debt securities) 11 1,121,608,384 - 1,121,608,384 HTM investments 11 297,284,616 - 297,284,616
Short-term investments 16 917,501,695 - 917,501,695 Long-term investments 16 11,527,360 - 11,527,360
Refundable deposits 16 8,493,476 - 8,493,476 P 3,682,644,671 P 57,427,498 P 3,740,072,169
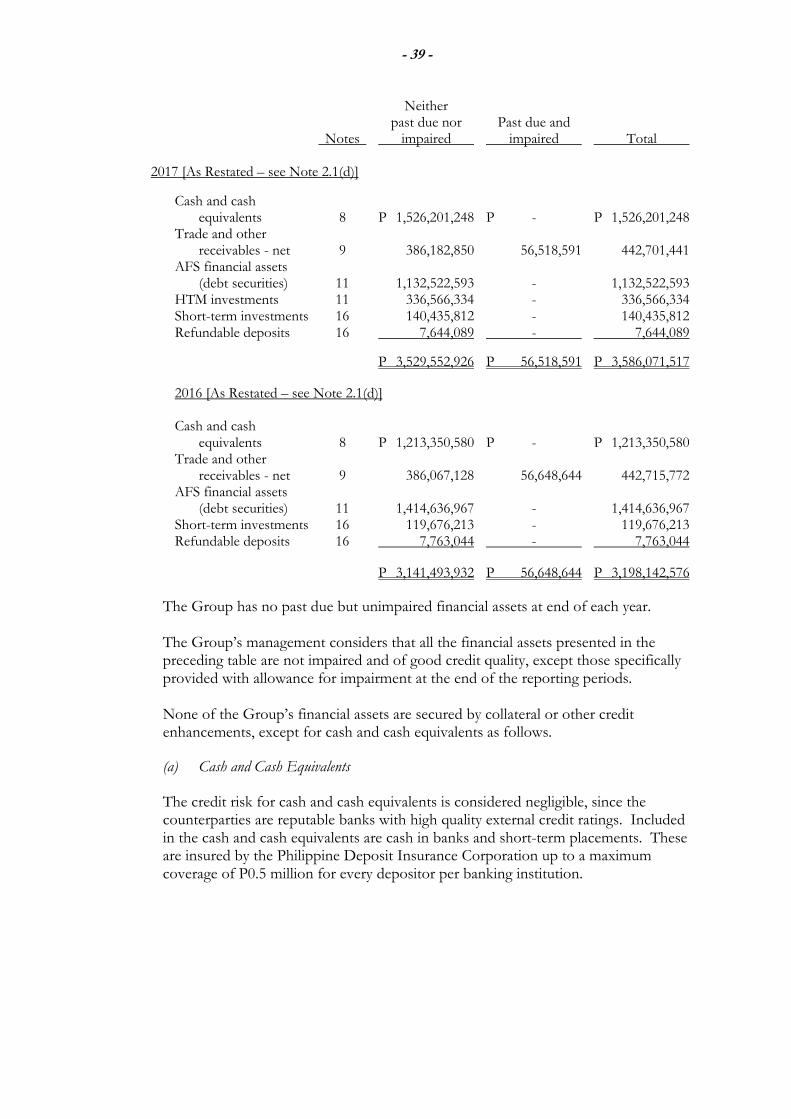
- 39 -
Neither past due nor Past due and Notes impaired impaired Total
2017 [As Restated – see Note 2.1(d)]
Cash and cash equivalents 8 P 1,526,201,248 P - P 1,526,201,248 Trade and other receivables - net 9 386,182,850 56,518,591 442,701,441 AFS financial assets (debt securities) 11 1,132,522,593 - 1,132,522,593 HTM investments 11 336,566,334 - 336,566,334 Short-term investments 16 140,435,812 - 140,435,812 Refundable deposits 16 7,644,089 - 7,644,089
P 3,529,552,926 P 56,518,591 P 3,586,071,517
2016 [As Restated – see Note 2.1(d)]
Cash and cash equivalents 8 P 1,213,350,580 P - P 1,213,350,580 Trade and other receivables - net 9 386,067,128 56,648,644 442,715,772 AFS financial assets (debt securities) 11 1,414,636,967 - 1,414,636,967 Short-term investments 16 119,676,213 - 119,676,213 Refundable deposits 16 7,763,044 - 7,763,044
P 3,141,493,932 P 56,648,644 P 3,198,142,576
The Group has no past due but unimpaired financial assets at end of each year. The Group’s management considers that all the financial assets presented in the preceding table are not impaired and of good credit quality, except those specifically provided with allowance for impairment at the end of the reporting periods.
None of the Group’s financial assets are secured by collateral or other credit enhancements, except for cash and cash equivalents as follows.
(a) Cash and Cash Equivalents
The credit risk for cash and cash equivalents is considered negligible, since the counterparties are reputable banks with high quality external credit ratings. Included in the cash and cash equivalents are cash in banks and short-term placements. These are insured by the Philippine Deposit Insurance Corporation up to a maximum coverage of P0.5 million for every depositor per banking institution.
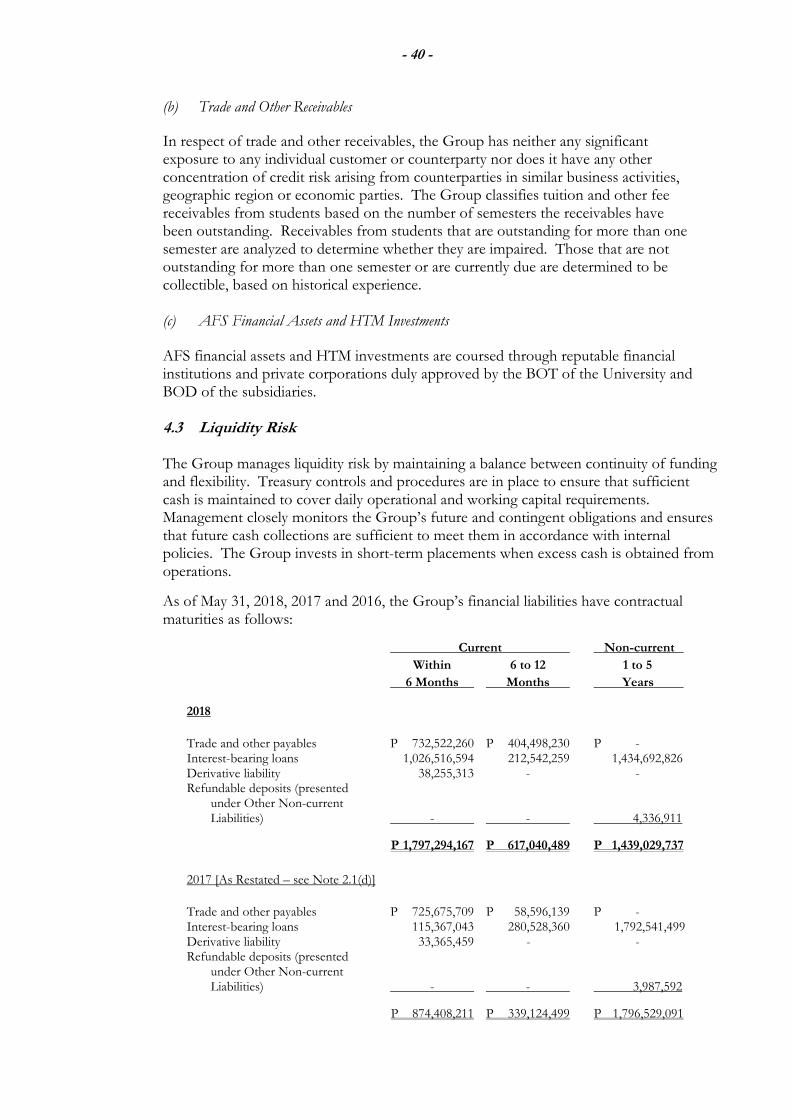
- 40 -
(b) Trade and Other Receivables
In respect of trade and other receivables, the Group has neither any significant exposure to any individual customer or counterparty nor does it have any other concentration of credit risk arising from counterparties in similar business activities, geographic region or economic parties. The Group classifies tuition and other fee receivables from students based on the number of semesters the receivables have been outstanding. Receivables from students that are outstanding for more than one semester are analyzed to determine whether they are impaired. Those that are not outstanding for more than one semester or are currently due are determined to be collectible, based on historical experience. (c) AFS Financial Assets and HTM Investments AFS financial assets and HTM investments are coursed through reputable financial institutions and private corporations duly approved by the BOT of the University and BOD of the subsidiaries.
4.3 Liquidity Risk The Group manages liquidity risk by maintaining a balance between continuity of funding and flexibility. Treasury controls and procedures are in place to ensure that sufficient cash is maintained to cover daily operational and working capital requirements. Management closely monitors the Group’s future and contingent obligations and ensures that future cash collections are sufficient to meet them in accordance with internal policies. The Group invests in short-term placements when excess cash is obtained from operations.
As of May 31, 2018, 2017 and 2016, the Group’s financial liabilities have contractual maturities as follows:
Current Non-current
Within 6 to 12 1 to 5
6 Months Months Years
2018
Trade and other payables P 732,522,260 P 404,498,230 P - Interest-bearing loans 1,026,516,594 212,542,259 1,434,692,826 Derivative liability 38,255,313 - - Refundable deposits (presented under Other Non-current Liabilities) - - 4,336,911
P 1,797,294,167 P 617,040,489 P 1,439,029,737
2017 [As Restated – see Note 2.1(d)]
Trade and other payables P 725,675,709 P 58,596,139 P - Interest-bearing loans 115,367,043 280,528,360 1,792,541,499 Derivative liability 33,365,459 - - Refundable deposits (presented under Other Non-current Liabilities) - - 3,987,592
P 874,408,211 P 339,124,499 P 1,796,529,091
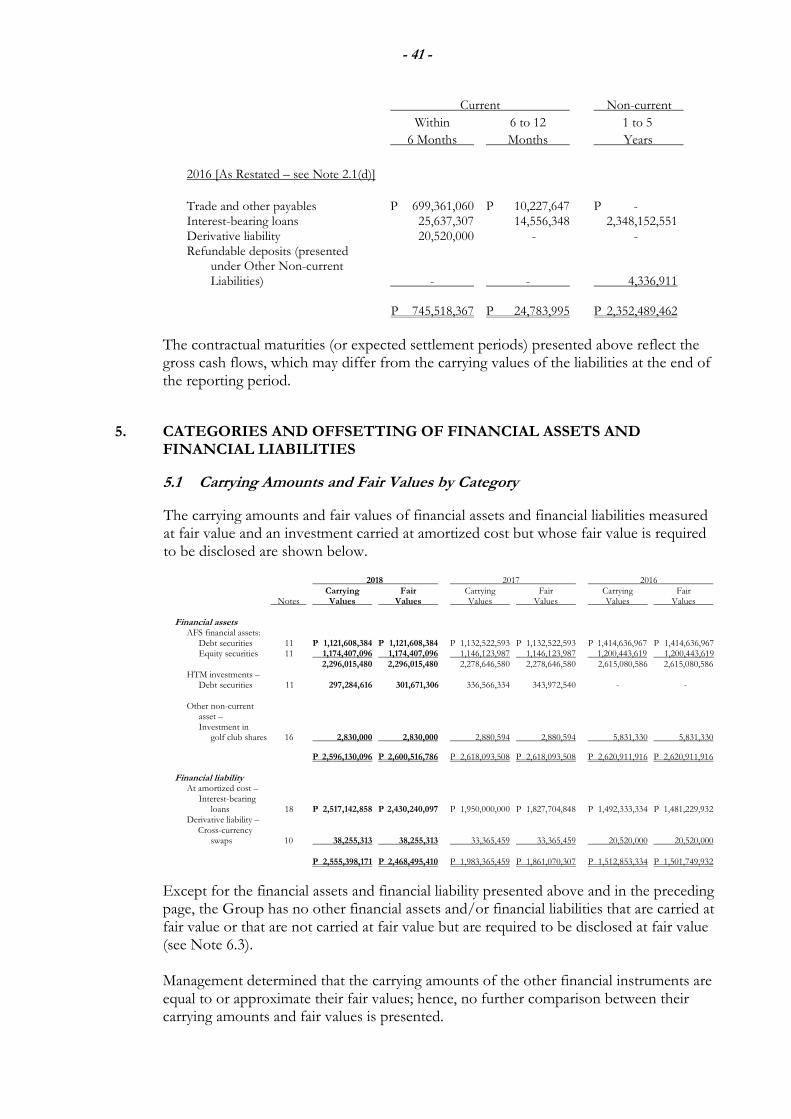
- 41 -
Current Non-current
Within 6 to 12 1 to 5
6 Months Months Years
2016 [As Restated – see Note 2.1(d)]
Trade and other payables P 699,361,060 P 10,227,647 P - Interest-bearing loans 25,637,307 14,556,348 2,348,152,551 Derivative liability 20,520,000 - - Refundable deposits (presented under Other Non-current Liabilities) - - 4,336,911 P 745,518,367 P 24,783,995 P 2,352,489,462
The contractual maturities (or expected settlement periods) presented above reflect the gross cash flows, which may differ from the carrying values of the liabilities at the end of the reporting period.
5. CATEGORIES AND OFFSETTING OF FINANCIAL ASSETS AND
FINANCIAL LIABILITIES
5.1 Carrying Amounts and Fair Values by Category
The carrying amounts and fair values of financial assets and financial liabilities measured at fair value and an investment carried at amortized cost but whose fair value is required to be disclosed are shown below.
2018 2017 2016 Carrying Fair Carrying Fair Carrying Fair Notes Values Values Values Values Values Values Financial assets AFS financial assets: Debt securities 11 P 1,121,608,384 P 1,121,608,384 P 1,132,522,593 P 1,132,522,593 P 1,414,636,967 P 1,414,636,967 Equity securities 11 1,174,407,096 1,174,407,096 1,146,123,987 1,146,123,987 1,200,443,619 1,200,443,619 2,296,015,480 2,296,015,480 2,278,646,580 2,278,646,580 2,615,080,586 2,615,080,586 HTM investments – Debt securities 11 297,284,616 301,671,306 336,566,334 343,972,540 - - Other non-current asset – Investment in golf club shares 16 2,830,000 2,830,000 2,880,594 2,880,594 5,831,330 5,831,330
P 2,596,130,096 P 2,600,516,786 P 2,618,093,508 P 2,618,093,508 P 2,620,911,916 P 2,620,911,916 Financial liability At amortized cost – Interest-bearing loans 18 P 2,517,142,858 P 2,430,240,097 P 1,950,000,000 P 1,827,704,848 P 1,492,333,334 P 1,481,229,932 Derivative liability – Cross-currency swaps 10 38,255,313 38,255,313 33,365,459 33,365,459 20,520,000 20,520,000 P 2,555,398,171 P 2,468,495,410 P 1,983,365,459 P 1,861,070,307 P 1,512,853,334 P 1,501,749,932
Except for the financial assets and financial liability presented above and in the preceding page, the Group has no other financial assets and/or financial liabilities that are carried at fair value or that are not carried at fair value but are required to be disclosed at fair value (see Note 6.3). Management determined that the carrying amounts of the other financial instruments are equal to or approximate their fair values; hence, no further comparison between their carrying amounts and fair values is presented.
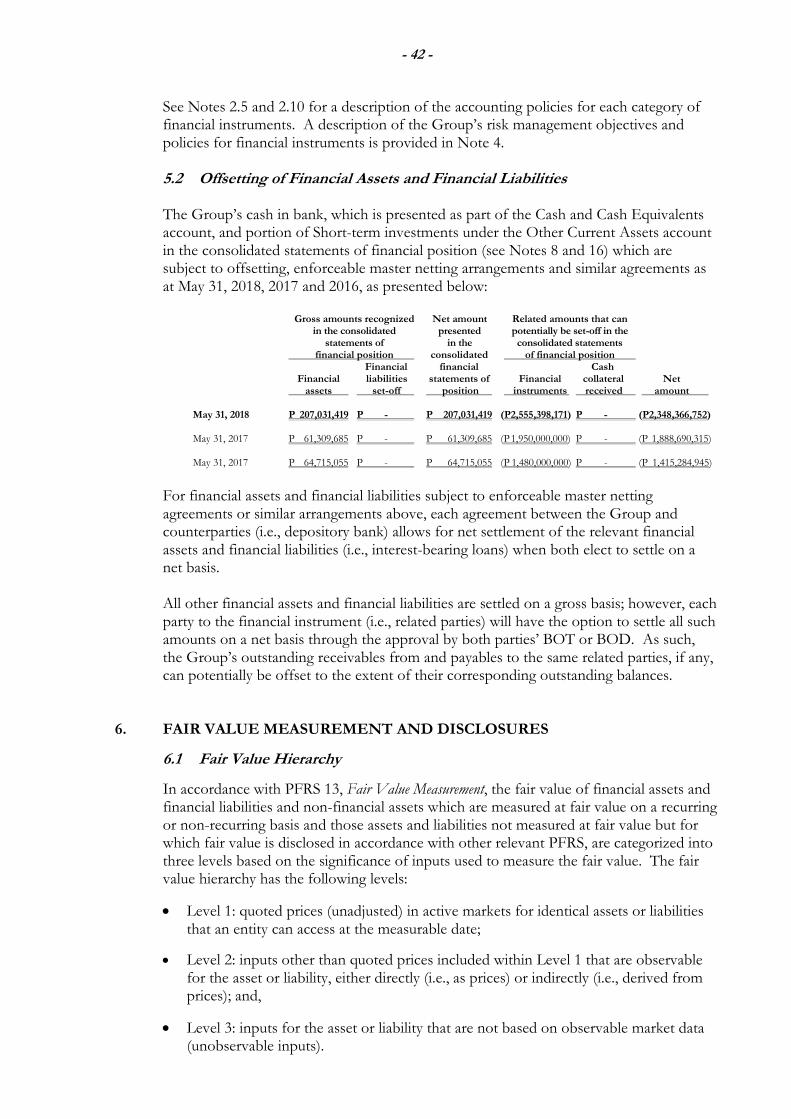
- 42 -
See Notes 2.5 and 2.10 for a description of the accounting policies for each category of financial instruments. A description of the Group’s risk management objectives and policies for financial instruments is provided in Note 4.
5.2 Offsetting of Financial Assets and Financial Liabilities The Group’s cash in bank, which is presented as part of the Cash and Cash Equivalents account, and portion of Short-term investments under the Other Current Assets account in the consolidated statements of financial position (see Notes 8 and 16) which are subject to offsetting, enforceable master netting arrangements and similar agreements as at May 31, 2018, 2017 and 2016, as presented below:
Gross amounts recognized Net amount Related amounts that can
in the consolidated presented potentially be set-off in the statements of in the consolidated statements
financial position consolidated of financial position Financial financial Cash Financial liabilities statements of Financial collateral Net assets set-off position instruments received amount May 31, 2018 P 207,031,419 P - P 207,031,419 (P2,555,398,171) P - (P2,348,366,752) May 31, 2017 P 61,309,685 P - P 61,309,685 (P 1,950,000,000) P - (P 1,888,690,315) May 31, 2017 P 64,715,055 P - P 64,715,055 (P 1,480,000,000) P - (P 1,415,284,945)
For financial assets and financial liabilities subject to enforceable master netting agreements or similar arrangements above, each agreement between the Group and counterparties (i.e., depository bank) allows for net settlement of the relevant financial assets and financial liabilities (i.e., interest-bearing loans) when both elect to settle on a net basis. All other financial assets and financial liabilities are settled on a gross basis; however, each party to the financial instrument (i.e., related parties) will have the option to settle all such amounts on a net basis through the approval by both parties’ BOT or BOD. As such, the Group’s outstanding receivables from and payables to the same related parties, if any, can potentially be offset to the extent of their corresponding outstanding balances.
6. FAIR VALUE MEASUREMENT AND DISCLOSURES
6.1 Fair Value Hierarchy
In accordance with PFRS 13, Fair Value Measurement, the fair value of financial assets and financial liabilities and non-financial assets which are measured at fair value on a recurring or non-recurring basis and those assets and liabilities not measured at fair value but for which fair value is disclosed in accordance with other relevant PFRS, are categorized into three levels based on the significance of inputs used to measure the fair value. The fair value hierarchy has the following levels:
• Level 1: quoted prices (unadjusted) in active markets for identical assets or liabilities that an entity can access at the measurable date;
• Level 2: inputs other than quoted prices included within Level 1 that are observable for the asset or liability, either directly (i.e., as prices) or indirectly (i.e., derived from prices); and,
• Level 3: inputs for the asset or liability that are not based on observable market data (unobservable inputs).
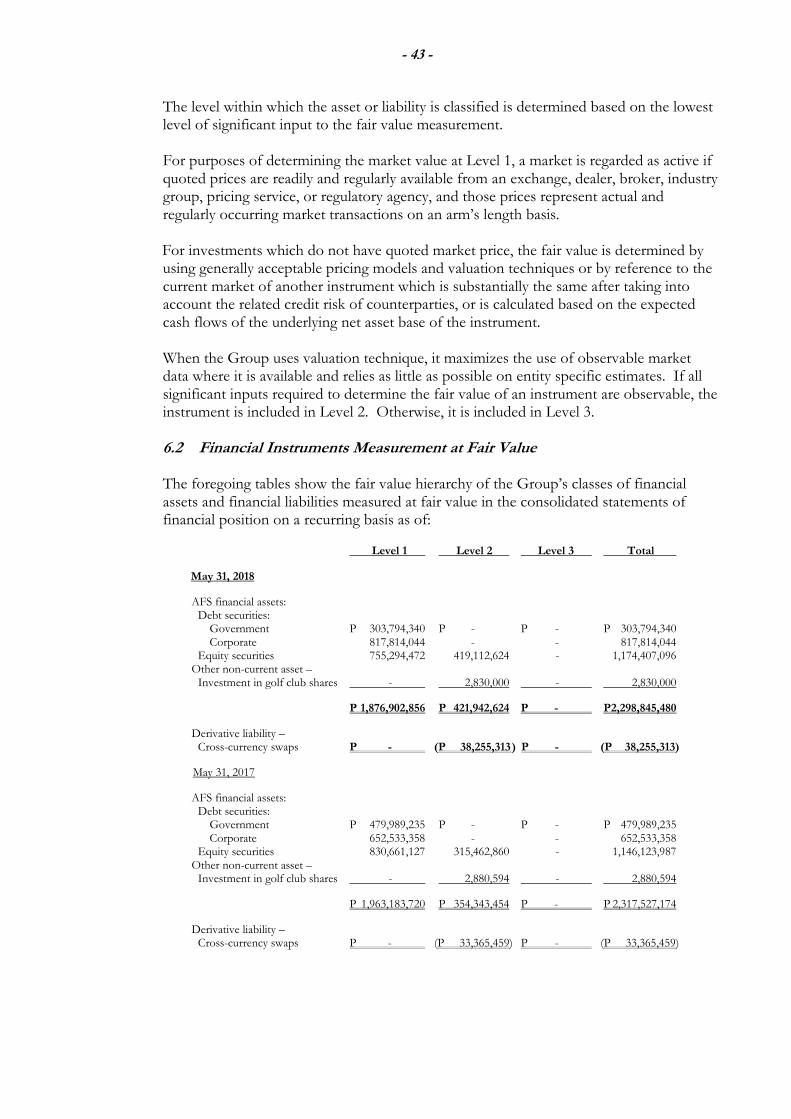
- 43 -
The level within which the asset or liability is classified is determined based on the lowest level of significant input to the fair value measurement. For purposes of determining the market value at Level 1, a market is regarded as active if quoted prices are readily and regularly available from an exchange, dealer, broker, industry group, pricing service, or regulatory agency, and those prices represent actual and regularly occurring market transactions on an arm’s length basis.
For investments which do not have quoted market price, the fair value is determined by using generally acceptable pricing models and valuation techniques or by reference to the current market of another instrument which is substantially the same after taking into account the related credit risk of counterparties, or is calculated based on the expected cash flows of the underlying net asset base of the instrument.
When the Group uses valuation technique, it maximizes the use of observable market data where it is available and relies as little as possible on entity specific estimates. If all significant inputs required to determine the fair value of an instrument are observable, the instrument is included in Level 2. Otherwise, it is included in Level 3.
6.2 Financial Instruments Measurement at Fair Value The foregoing tables show the fair value hierarchy of the Group’s classes of financial assets and financial liabilities measured at fair value in the consolidated statements of financial position on a recurring basis as of:
Level 1 Level 2 Level 3 Total
May 31, 2018
AFS financial assets: Debt securities: Government P 303,794,340 P - P - P 303,794,340 Corporate 817,814,044 - - 817,814,044 Equity securities 755,294,472 419,112,624 - 1,174,407,096 Other non-current asset – Investment in golf club shares - 2,830,000 - 2,830,000
P 1,876,902,856 P 421,942,624 P - P 2,298,845,480
Derivative liability – Cross-currency swaps P - (P 38,255,313 ) P - (P 38,255,313)
May 31, 2017
AFS financial assets: Debt securities: Government P 479,989,235 P - P - P 479,989,235 Corporate 652,533,358 - - 652,533,358 Equity securities 830,661,127 315,462,860 - 1,146,123,987 Other non-current asset – Investment in golf club shares - 2,880,594 - 2,880,594
P 1,963,183,720 P 354,343,454 P - P 2,317,527,174
Derivative liability – Cross-currency swaps P - (P 33,365,459) P - (P 33,365,459)
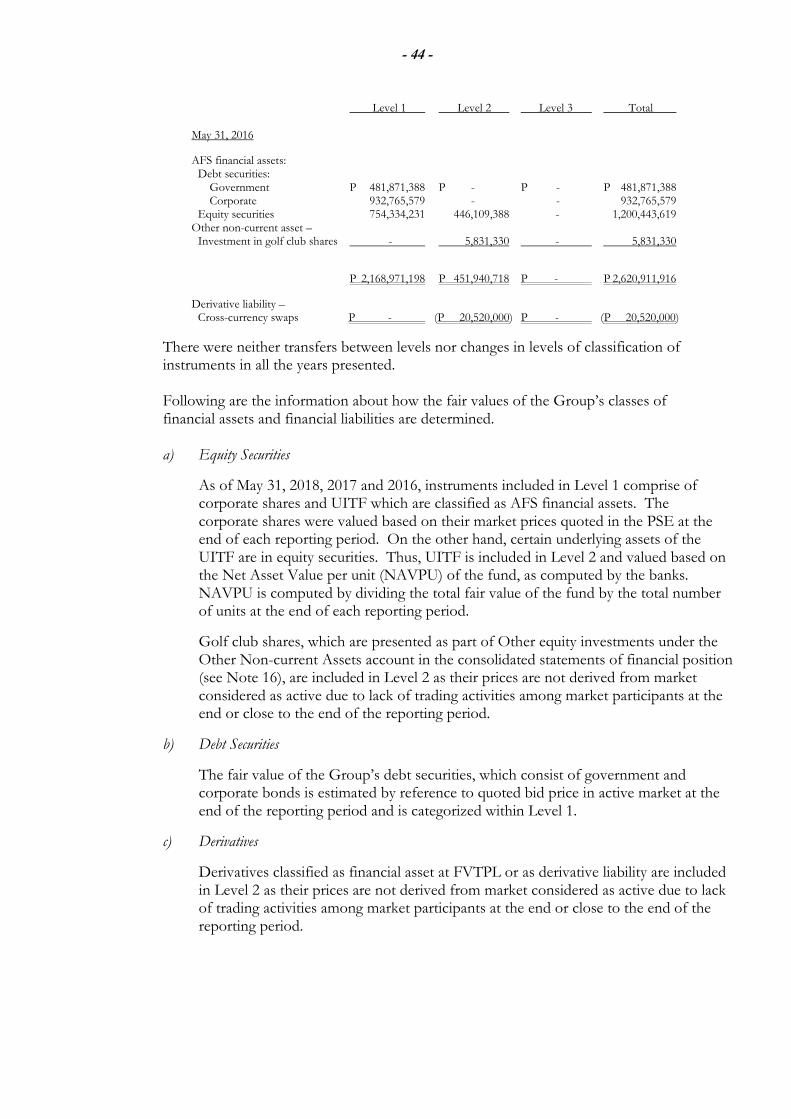
- 44 -
Level 1 Level 2 Level 3 Total May 31, 2016
AFS financial assets: Debt securities: Government P 481,871,388 P - P - P 481,871,388 Corporate 932,765,579 - - 932,765,579 Equity securities 754,334,231 446,109,388 - 1,200,443,619 Other non-current asset – Investment in golf club shares - 5,831,330 - 5,831,330
P 2,168,971,198 P 451,940,718 P - P 2,620,911,916
Derivative liability – Cross-currency swaps P - (P 20,520,000) P - (P 20,520,000)
There were neither transfers between levels nor changes in levels of classification of instruments in all the years presented.
Following are the information about how the fair values of the Group’s classes of financial assets and financial liabilities are determined.
a) Equity Securities
As of May 31, 2018, 2017 and 2016, instruments included in Level 1 comprise of corporate shares and UITF which are classified as AFS financial assets. The corporate shares were valued based on their market prices quoted in the PSE at the end of each reporting period. On the other hand, certain underlying assets of the UITF are in equity securities. Thus, UITF is included in Level 2 and valued based on the Net Asset Value per unit (NAVPU) of the fund, as computed by the banks. NAVPU is computed by dividing the total fair value of the fund by the total number of units at the end of each reporting period.
Golf club shares, which are presented as part of Other equity investments under the Other Non-current Assets account in the consolidated statements of financial position (see Note 16), are included in Level 2 as their prices are not derived from market considered as active due to lack of trading activities among market participants at the end or close to the end of the reporting period.
b) Debt Securities
The fair value of the Group’s debt securities, which consist of government and corporate bonds is estimated by reference to quoted bid price in active market at the end of the reporting period and is categorized within Level 1.
c) Derivatives
Derivatives classified as financial asset at FVTPL or as derivative liability are included in Level 2 as their prices are not derived from market considered as active due to lack of trading activities among market participants at the end or close to the end of the reporting period.
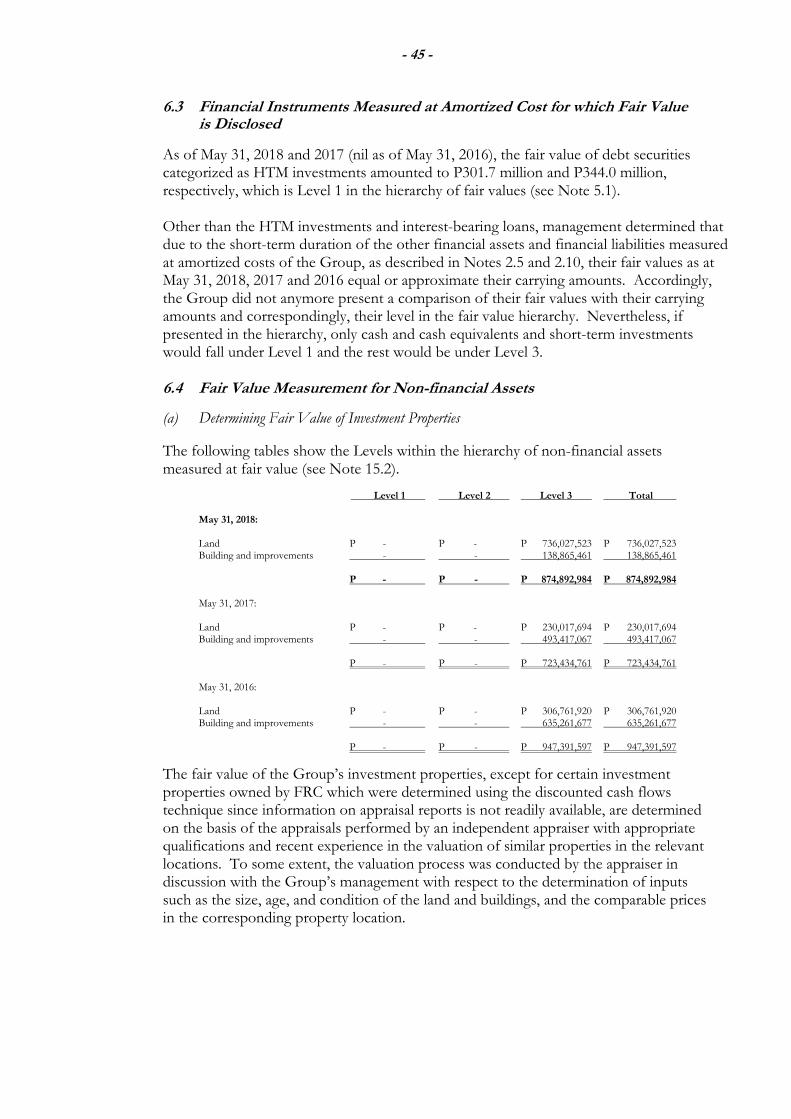
- 45 -
6.3 Financial Instruments Measured at Amortized Cost for which Fair Value is Disclosed
As of May 31, 2018 and 2017 (nil as of May 31, 2016), the fair value of debt securities categorized as HTM investments amounted to P301.7 million and P344.0 million, respectively, which is Level 1 in the hierarchy of fair values (see Note 5.1).
Other than the HTM investments and interest-bearing loans, management determined that due to the short-term duration of the other financial assets and financial liabilities measured at amortized costs of the Group, as described in Notes 2.5 and 2.10, their fair values as at May 31, 2018, 2017 and 2016 equal or approximate their carrying amounts. Accordingly, the Group did not anymore present a comparison of their fair values with their carrying amounts and correspondingly, their level in the fair value hierarchy. Nevertheless, if presented in the hierarchy, only cash and cash equivalents and short-term investments would fall under Level 1 and the rest would be under Level 3.
6.4 Fair Value Measurement for Non-financial Assets
(a) Determining Fair Value of Investment Properties
The following tables show the Levels within the hierarchy of non-financial assets measured at fair value (see Note 15.2).
Level 1 Level 2 Level 3 Total
May 31, 2018: Land P - P - P 736,027,523 P 736,027,523 Building and improvements - - 138,865,461 138,865,461
P - P - P 874,892,984 P 874,892,984 May 31, 2017: Land P - P - P 230,017,694 P 230,017,694 Building and improvements - - 493,417,067 493,417,067
P - P - P 723,434,761 P 723,434,761 May 31, 2016: Land P - P - P 306,761,920 P 306,761,920 Building and improvements - - 635,261,677 635,261,677
P - P - P 947,391,597 P 947,391,597
The fair value of the Group’s investment properties, except for certain investment properties owned by FRC which were determined using the discounted cash flows technique since information on appraisal reports is not readily available, are determined on the basis of the appraisals performed by an independent appraiser with appropriate qualifications and recent experience in the valuation of similar properties in the relevant locations. To some extent, the valuation process was conducted by the appraiser in discussion with the Group’s management with respect to the determination of inputs such as the size, age, and condition of the land and buildings, and the comparable prices in the corresponding property location.
- 46 -
In estimating the fair value of these properties, management takes into account the market participant’s ability to generate economic benefits by using the assets in their highest and best use. Based on management’s assessment, the best use of the Group’s non-financial assets indicated above is their current use.
The fair values of these non-financial assets were determined based on the following approaches:
(i) Fair Value Measurement for Land
The Level 3 fair value of land was derived using the market comparable approach that reflects the recent transaction prices for similar properties in nearby locations. Under this approach, the observable recent prices of the reference properties were adjusted for differences in key attributes such as property size, zoning, and accessibility. The most significant input into this valuation approach is the price per square foot, hence, the higher the price per square foot, the higher the fair value.
(ii) Fair Value Measurement for Building and Improvements
The Level 3 fair value of the buildings and improvements included under the Investment Properties account was determined using the cost approach that reflects the cost to a market participant to construct an asset of comparable usage, construction standards, design and layout, adjusted for obsolescence. The more significant inputs used in the valuation include direct and indirect costs of construction such as but not limited to, labor and contractor’s profit, materials and equipment, surveying and permit costs, electricity and utility costs, architectural and engineering fees, insurance and legal fees. These inputs were derived from various suppliers and contractor’s quotes, price catalogues, and construction price indices. Under this approach, higher estimated costs used in the valuation will result in higher fair value of the properties. There has been no change to the valuation techniques used by the Group during the year for its non-financial assets. Also, there were no transfers into or out of the different levels of the fair value hierarchy as of May 31, 2018, 2017 and 2016. The carrying amount of investment properties included in Level 3 is presented in Note 15.
(b) Other Fair Value Information
There were no transfers into or out of Level 3 fair value hierarchy during the periods ended May 31, 2018, 2017 and 2016.
- 47 -
7. SEGMENT INFORMATION
7.1 Business Segments The Group is organized into different business units based on its services or line of business for purposes of management assessment of each unit. In identifying its operating segments, management generally follow the Group’s three major lines of business, namely education, real estate and investment activities. These are the basis of the Group in reporting to its strategic steering committee for its strategic decision-making activities. Also, the Group reports geographical segments in which FEU campuses are located. 7.2 Segment Assets and Liabilities
Segment assets include all operating assets used by a segment and consist primarily of operating cash and cash equivalents, trade and other receivables, AFS financial assets, real estate held-for-sale, investment properties, and property and equipment. Segment assets do not include investments in an associate, deferred tax assets and other assets which are not allocated to any segment’s assets.
Segment liabilities include all operating liabilities as presented in the consolidated statements of financial position, except for deferred tax liabilities.
7.3 Intersegment Transactions
Segment revenues, expenses and performance include revenues and purchases between business segments and between geographical segments. Such services and purchases are eliminated in consolidation.
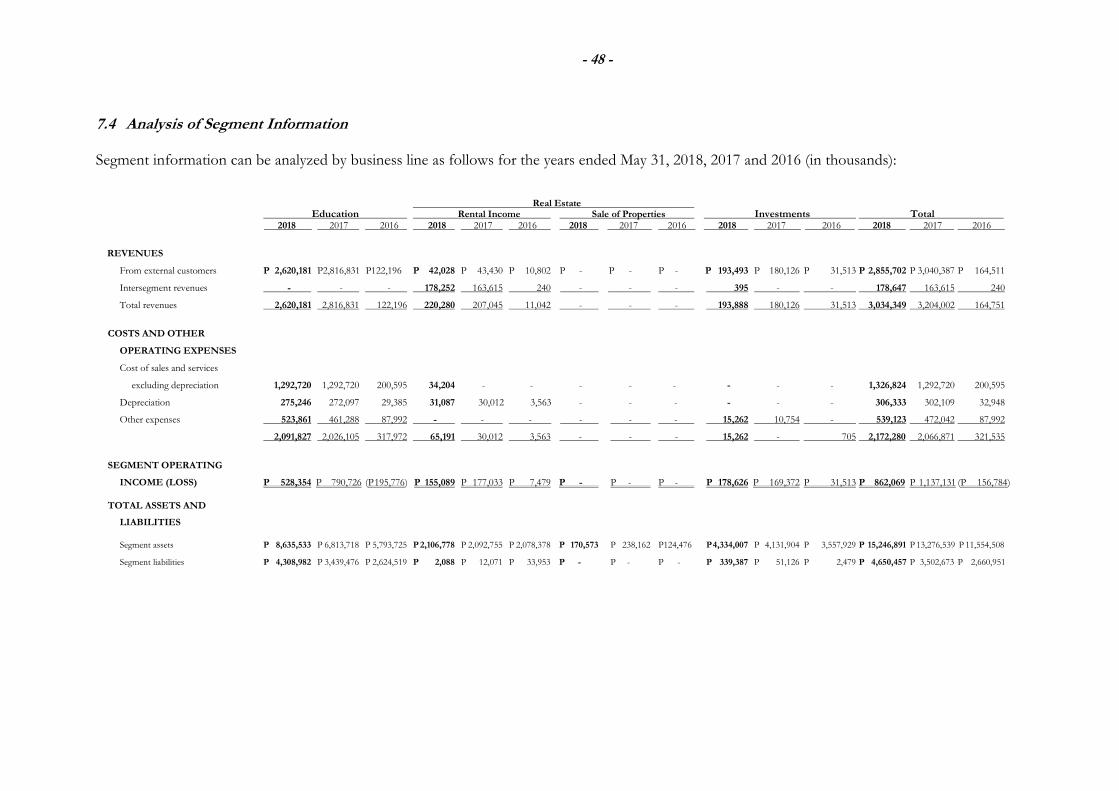
- 48 -
7.4 Analysis of Segment Information Segment information can be analyzed by business line as follows for the years ended May 31, 2018, 2017 and 2016 (in thousands):
Real Estate
Education Rental Income Sale of Properties Investments Total 2018 2017 2016 2018 2017 2016 2018 2017 2016 2018 2017 2016 2018 2017 2016
REVENUES
From external customers P 2,620,181 P2,816,831 P122,196 P 42,028 P 43,430 P 10,802 P - P - P - P 193,493 P 180,126 P 31,513 P 2,855,702 P 3,040,387 P 164,511
Intersegment revenues - - - 178,252 163,615 240 - - - 395 - - 178,647 163,615 240
Total revenues 2,620,181 2,816,831 122,196 220,280 207,045 11,042 - - - 193,888 180,126 31,513 3,034,349 3,204,002 164,751
COSTS AND OTHER
OPERATING EXPENSES
Cost of sales and services
excluding depreciation 1,292,720 1,292,720 200,595 34,204 - - - - - - - - 1,326,824 1,292,720 200,595
Depreciation 275,246 272,097 29,385 31,087 30,012 3,563 - - - - - - 306,333 302,109 32,948
Other expenses 523,861 461,288 87,992 - - - - - - 15,262 10,754 - 539,123 472,042 87,992
2,091,827 2,026,105 317,972 65,191 30,012 3,563 - - - 15,262 - 705 2,172,280 2,066,871 321,535
SEGMENT OPERATING
INCOME (LOSS) P 528,354 P 790,726 (P 195,776) P 155,089 P 177,033 P 7,479 P - P - P - P 178,626 P 169,372 P 31,513 P 862,069 P 1,137,131 (P 156,784) TOTAL ASSETS AND
LIABILITIES
Segment assets P 8,635,533 P 6,813,718 P 5,793,725 P 2,106,778 P 2,092,755 P 2,078,378 P 170,573 P 238,162 P124,476 P 4,334,007 P 4,131,904 P 3,557,929 P 15,246,891 P 13,276,539 P 11,554,508
Segment liabilities P 4,308,982 P 3,439,476 P 2,624,519 P 2,088 P 12,071 P 33,953 P - P - P - P 339,387 P 51,126 P 2,479 P 4,650,457 P 3,502,673 P 2,660,951
- 48 -
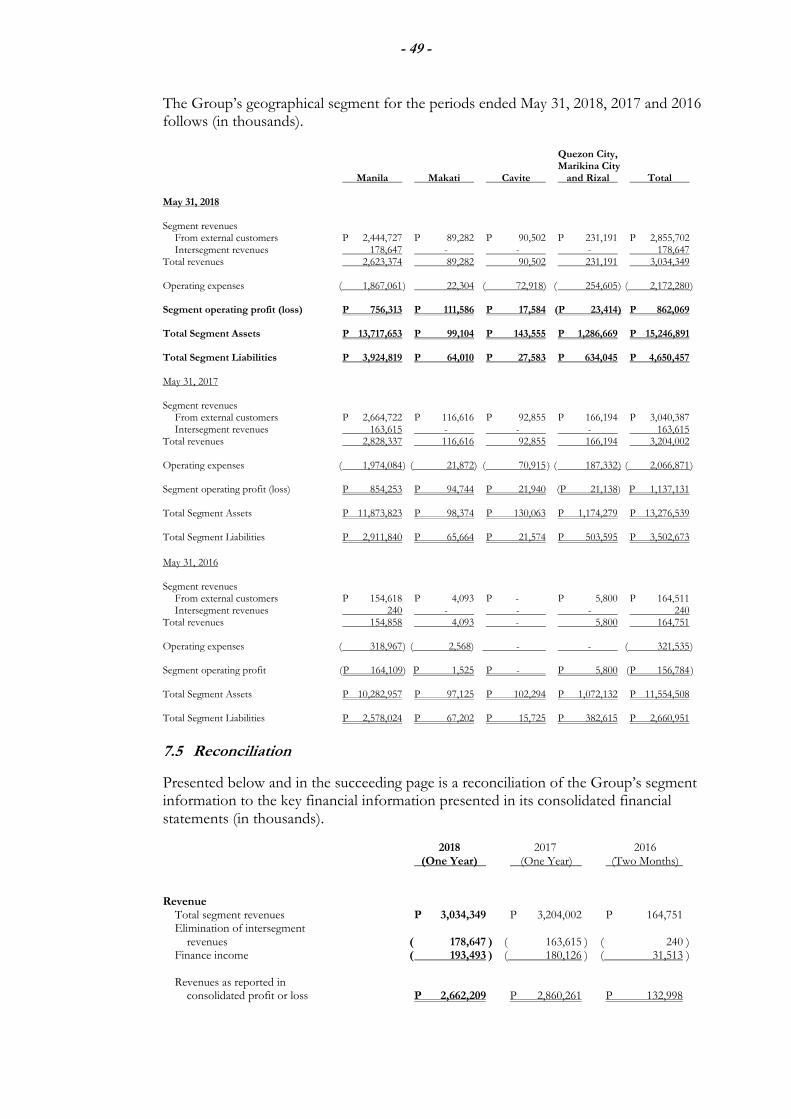
- 49 -
The Group’s geographical segment for the periods ended May 31, 2018, 2017 and 2016 follows (in thousands).
Quezon City, Marikina City Manila Makati Cavite and Rizal Total
May 31, 2018 Segment revenues From external customers P 2,444,727 P 89,282 P 90,502 P 231,191 P 2,855,702 Intersegment revenues 178,647 - - - 178,647 Total revenues 2,623,374 89,282 90,502 231,191 3,034,349 Operating expenses ( 1,867,061 ) 22,304 ( 72,918) ( 254,605 ) ( 2,172,280 ) Segment operating profit (loss) P 756,313 P 111,586 P 17,584 (P 23,414) P 862,069 Total Segment Assets P 13,717,653 P 99,104 P 143,555 P 1,286,669 P 15,246,891
Total Segment Liabilities P 3,924,819 P 64,010 P 27,583 P 634,045 P 4,650,457 May 31, 2017 Segment revenues From external customers P 2,664,722 P 116,616 P 92,855 P 166,194 P 3,040,387 Intersegment revenues 163,615 - - - 163,615 Total revenues 2,828,337 116,616 92,855 166,194 3,204,002 Operating expenses ( 1,974,084 ) ( 21,872) ( 70,915 ) ( 187,332 ) ( 2,066,871 ) Segment operating profit (loss) P 854,253 P 94,744 P 21,940 (P 21,138) P 1,137,131 Total Segment Assets P 11,873,823 P 98,374 P 130,063 P 1,174,279 P 13,276,539
Total Segment Liabilities P 2,911,840 P 65,664 P 21,574 P 503,595 P 3,502,673
May 31, 2016 Segment revenues From external customers P 154,618 P 4,093 P - P 5,800 P 164,511 Intersegment revenues 240 - - - 240 Total revenues 154,858 4,093 - 5,800 164,751 Operating expenses ( 318,967 ) ( 2,568) - - ( 321,535 ) Segment operating profit ( P 164,109) P 1,525 P - P 5,800 ( P 156,784 ) Total Segment Assets P 10,282,957 P 97,125 P 102,294 P 1,072,132 P 11,554,508
Total Segment Liabilities P 2,578,024 P 67,202 P 15,725 P 382,615 P 2,660,951
7.5 Reconciliation
Presented below and in the succeeding page is a reconciliation of the Group’s segment information to the key financial information presented in its consolidated financial statements (in thousands).
2018 2017 2016 (One Year) (One Year) (Two Months) Revenue Total segment revenues P 3,034,349 P 3,204,002 P 164,751 Elimination of intersegment revenues ( 178,647 ) ( 163,615 ) ( 240 ) Finance income ( 193,493 ) ( 180,126 ) ( 31,513 ) Revenues as reported in consolidated profit or loss P 2,662,209 P 2,860,261 P 132,998
- 49 -
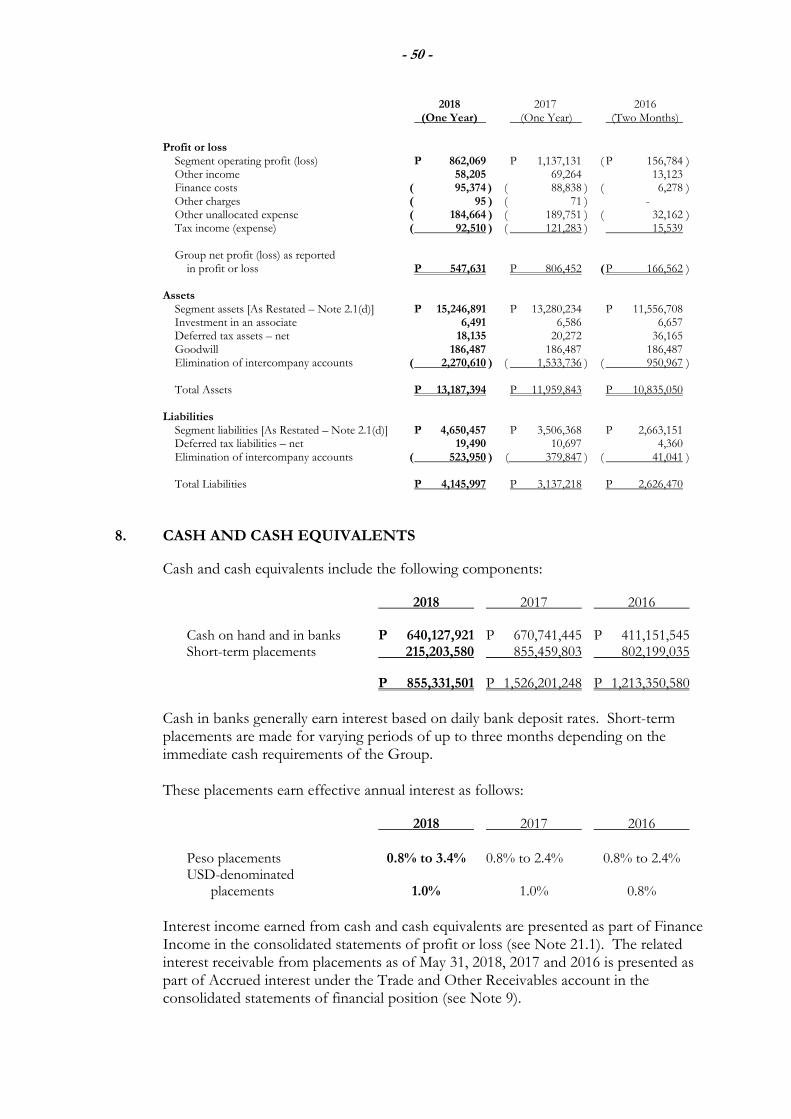
- 50 -
2018 2017 2016 (One Year) (One Year) (Two Months)
Profit or loss Segment operating profit (loss) P 862,069 P 1,137,131 ( P 156,784 ) Other income 58,205 69,264 13,123 Finance costs ( 95,374 ) ( 88,838 ) ( 6,278 ) Other charges ( 95 ) ( 71 ) - Other unallocated expense ( 184,664 ) ( 189,751 ) ( 32,162 ) Tax income (expense) ( 92,510 ) ( 121,283 ) 15,539 Group net profit (loss) as reported in profit or loss P 547,631 P 806,452 ( P 166,562 )
Assets Segment assets [As Restated – Note 2.1(d)] P 15,246,891 P 13,280,234 P 11,556,708 Investment in an associate 6,491 6,586 6,657 Deferred tax assets – net 18,135 20,272 36,165 Goodwill 186,487 186,487 186,487 Elimination of intercompany accounts ( 2,270,610 ) ( 1,533,736 ) ( 950,967 ) Total Assets P 13,187,394 P 11,959,843 P 10,835,050
Liabilities
Segment liabilities [As Restated – Note 2.1(d)] P 4,650,457 P 3,506,368 P 2,663,151 Deferred tax liabilities – net 19,490 10,697 4,360 Elimination of intercompany accounts ( 523,950 ) ( 379,847 ) ( 41,041 ) Total Liabilities P 4,145,997 P 3,137,218 P 2,626,470 8. CASH AND CASH EQUIVALENTS
Cash and cash equivalents include the following components:
2018 2017 2016 Cash on hand and in banks P 640,127,921 P 670,741,445 P 411,151,545 Short-term placements 215,203,580 855,459,803 802,199,035
P 855,331,501 P 1,526,201,248 P 1,213,350,580 Cash in banks generally earn interest based on daily bank deposit rates. Short-term placements are made for varying periods of up to three months depending on the immediate cash requirements of the Group. These placements earn effective annual interest as follows:
2018 2017 2016
Peso placements 0.8% to 3.4% 0.8% to 2.4% 0.8% to 2.4% USD-denominated placements 1.0% 1.0% 0.8%
Interest income earned from cash and cash equivalents are presented as part of Finance Income in the consolidated statements of profit or loss (see Note 21.1). The related interest receivable from placements as of May 31, 2018, 2017 and 2016 is presented as part of Accrued interest under the Trade and Other Receivables account in the consolidated statements of financial position (see Note 9).
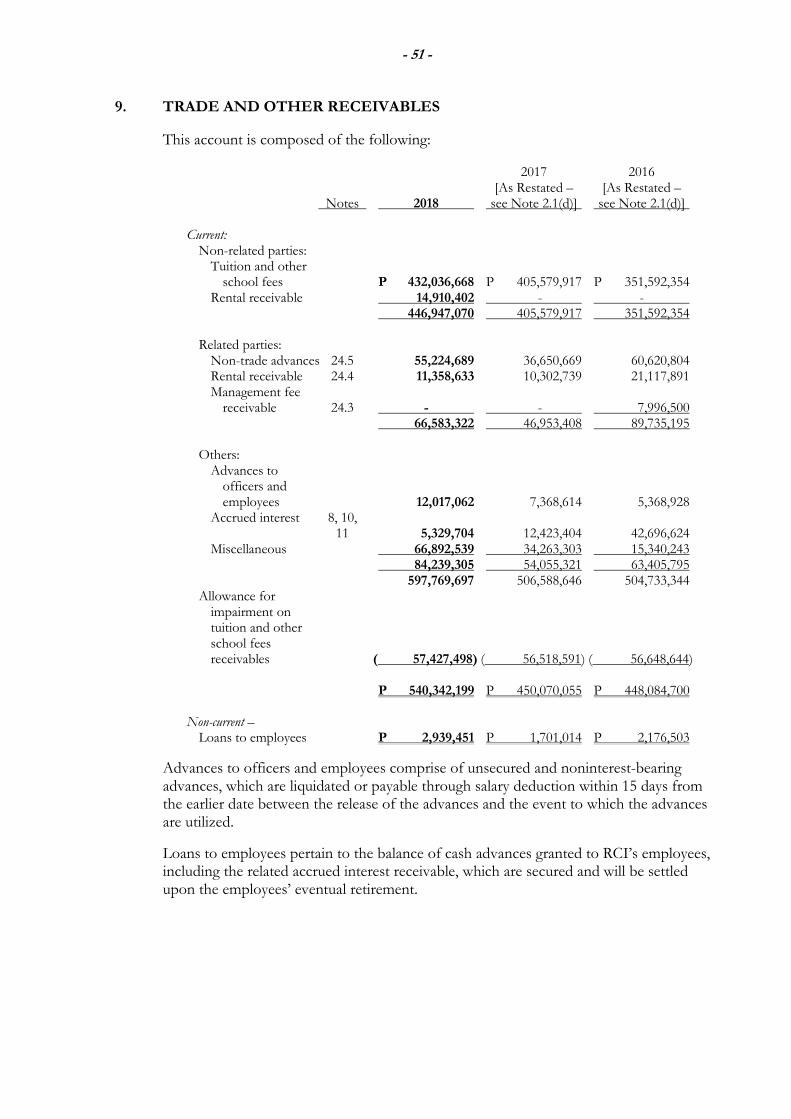
- 51 -
9. TRADE AND OTHER RECEIVABLES
This account is composed of the following: 2017 2016 [As Restated – [As Restated –
Notes 2018 see Note 2.1(d)] see Note 2.1(d)] Current: Non-related parties: Tuition and other school fees P 432,036,668 P 405,579,917 P 351,592,354 Rental receivable 14,910,402 - - 446,947,070 405,579,917 351,592,354 Related parties: Non-trade advances 24.5 55,224,689 36,650,669 60,620,804 Rental receivable 24.4 11,358,633 10,302,739 21,117,891 Management fee receivable 24.3 - - 7,996,500 66,583,322 46,953,408 89,735,195 Others:
Advances to officers and employees 12,017,062 7,368,614 5,368,928 Accrued interest 8, 10, 11 5,329,704 12,423,404 42,696,624 Miscellaneous 66,892,539 34,263,303 15,340,243 84,239,305 54,055,321 63,405,795 597,769,697 506,588,646 504,733,344 Allowance for impairment on tuition and other school fees receivables ( 57,427,498) ( 56,518,591) ( 56,648,644) P 540,342,199 P 450,070,055 P 448,084,700 Non-current – Loans to employees P 2,939,451 P 1,701,014 P 2,176,503
Advances to officers and employees comprise of unsecured and noninterest-bearing advances, which are liquidated or payable through salary deduction within 15 days from the earlier date between the release of the advances and the event to which the advances are utilized.
Loans to employees pertain to the balance of cash advances granted to RCI’s employees, including the related accrued interest receivable, which are secured and will be settled upon the employees’ eventual retirement.
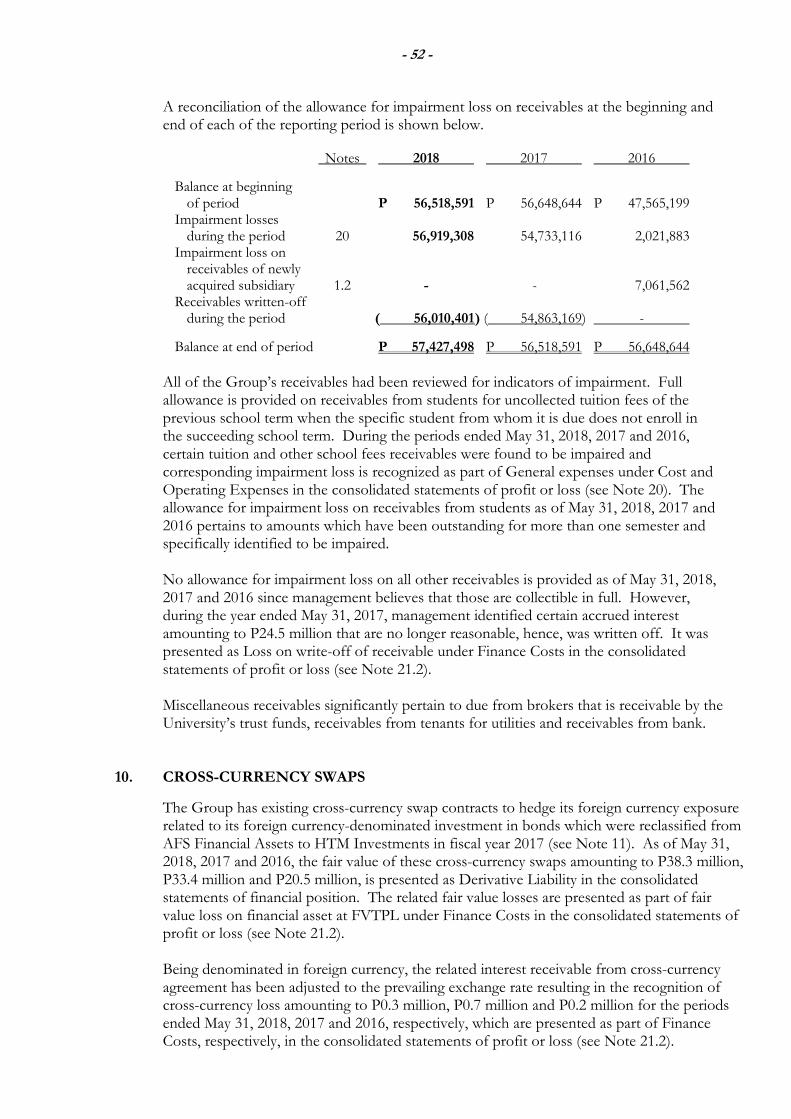
- 52 -
A reconciliation of the allowance for impairment loss on receivables at the beginning and end of each of the reporting period is shown below.
Notes 2018 2017 2016
Balance at beginning of period P 56,518,591 P 56,648,644 P 47,565,199 Impairment losses during the period 20 56,919,308 54,733,116 2,021,883 Impairment loss on receivables of newly acquired subsidiary 1.2 - - 7,061,562 Receivables written-off during the period ( 56,010,401 ) ( 54,863,169) -
Balance at end of period P 57,427,498 P 56,518,591 P 56,648,644 All of the Group’s receivables had been reviewed for indicators of impairment. Full allowance is provided on receivables from students for uncollected tuition fees of the previous school term when the specific student from whom it is due does not enroll in the succeeding school term. During the periods ended May 31, 2018, 2017 and 2016, certain tuition and other school fees receivables were found to be impaired and corresponding impairment loss is recognized as part of General expenses under Cost and Operating Expenses in the consolidated statements of profit or loss (see Note 20). The allowance for impairment loss on receivables from students as of May 31, 2018, 2017 and 2016 pertains to amounts which have been outstanding for more than one semester and specifically identified to be impaired.
No allowance for impairment loss on all other receivables is provided as of May 31, 2018, 2017 and 2016 since management believes that those are collectible in full. However, during the year ended May 31, 2017, management identified certain accrued interest amounting to P24.5 million that are no longer reasonable, hence, was written off. It was presented as Loss on write-off of receivable under Finance Costs in the consolidated statements of profit or loss (see Note 21.2). Miscellaneous receivables significantly pertain to due from brokers that is receivable by the University’s trust funds, receivables from tenants for utilities and receivables from bank.
10. CROSS-CURRENCY SWAPS
The Group has existing cross-currency swap contracts to hedge its foreign currency exposure related to its foreign currency-denominated investment in bonds which were reclassified from AFS Financial Assets to HTM Investments in fiscal year 2017 (see Note 11). As of May 31, 2018, 2017 and 2016, the fair value of these cross-currency swaps amounting to P38.3 million, P33.4 million and P20.5 million, is presented as Derivative Liability in the consolidated statements of financial position. The related fair value losses are presented as part of fair value loss on financial asset at FVTPL under Finance Costs in the consolidated statements of profit or loss (see Note 21.2). Being denominated in foreign currency, the related interest receivable from cross-currency agreement has been adjusted to the prevailing exchange rate resulting in the recognition of cross-currency loss amounting to P0.3 million, P0.7 million and P0.2 million for the periods ended May 31, 2018, 2017 and 2016, respectively, which are presented as part of Finance Costs, respectively, in the consolidated statements of profit or loss (see Note 21.2).
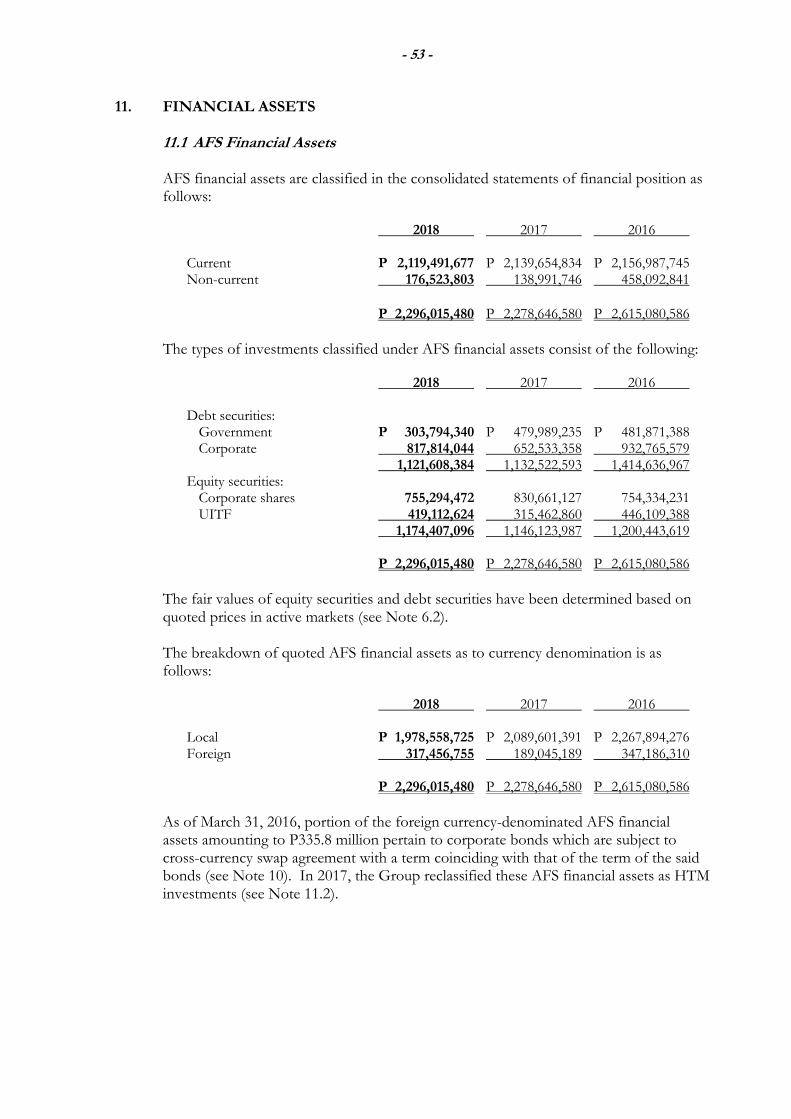
- 53 -
11. FINANCIAL ASSETS 11.1 AFS Financial Assets AFS financial assets are classified in the consolidated statements of financial position as follows:
2018 2017 2016 Current P 2,119,491,677 P 2,139,654,834 P 2,156,987,745 Non-current 176,523,803 138,991,746 458,092,841 P 2,296,015,480 P 2,278,646,580 P 2,615,080,586
The types of investments classified under AFS financial assets consist of the following: 2018 2017 2016 Debt securities: Government P 303,794,340 P 479,989,235 P 481,871,388 Corporate 817,814,044 652,533,358 932,765,579 1,121,608,384 1,132,522,593 1,414,636,967 Equity securities: Corporate shares 755,294,472 830,661,127 754,334,231 UITF 419,112,624 315,462,860 446,109,388 1,174,407,096 1,146,123,987 1,200,443,619 P 2,296,015,480 P 2,278,646,580 P 2,615,080,586 The fair values of equity securities and debt securities have been determined based on quoted prices in active markets (see Note 6.2). The breakdown of quoted AFS financial assets as to currency denomination is as follows:
2018 2017 2016 Local P 1,978,558,725 P 2,089,601,391 P 2,267,894,276 Foreign 317,456,755 189,045,189 347,186,310 P 2,296,015,480 P 2,278,646,580 P 2,615,080,586 As of March 31, 2016, portion of the foreign currency-denominated AFS financial assets amounting to P335.8 million pertain to corporate bonds which are subject to cross-currency swap agreement with a term coinciding with that of the term of the said bonds (see Note 10). In 2017, the Group reclassified these AFS financial assets as HTM investments (see Note 11.2).
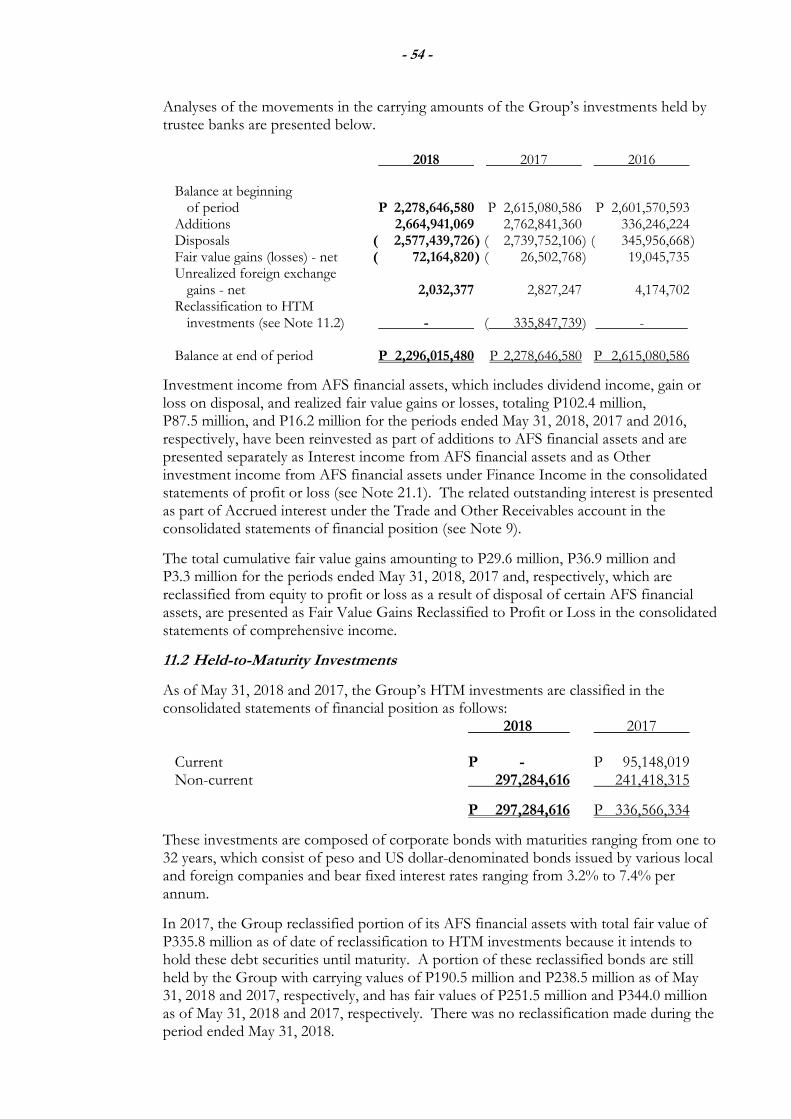
- 54 -
Analyses of the movements in the carrying amounts of the Group’s investments held by trustee banks are presented below.
2018 2017 2016
Balance at beginning of period P 2,278,646,580 P 2,615,080,586 P 2,601,570,593 Additions 2,664,941,069 2,762,841,360 336,246,224
Disposals ( 2,577,439,726 ) ( 2,739,752,106 ) ( 345,956,668 ) Fair value gains (losses) - net ( 72,164,820 ) ( 26,502,768 ) 19,045,735 Unrealized foreign exchange gains - net 2,032,377 2,827,247 4,174,702 Reclassification to HTM investments (see Note 11.2) - ( 335,847,739 ) -
Balance at end of period P 2,296,015,480 P 2,278,646,580 P 2,615,080,586
Investment income from AFS financial assets, which includes dividend income, gain or loss on disposal, and realized fair value gains or losses, totaling P102.4 million, P87.5 million, and P16.2 million for the periods ended May 31, 2018, 2017 and 2016, respectively, have been reinvested as part of additions to AFS financial assets and are presented separately as Interest income from AFS financial assets and as Other investment income from AFS financial assets under Finance Income in the consolidated statements of profit or loss (see Note 21.1). The related outstanding interest is presented as part of Accrued interest under the Trade and Other Receivables account in the consolidated statements of financial position (see Note 9).
The total cumulative fair value gains amounting to P29.6 million, P36.9 million and P3.3 million for the periods ended May 31, 2018, 2017 and, respectively, which are reclassified from equity to profit or loss as a result of disposal of certain AFS financial assets, are presented as Fair Value Gains Reclassified to Profit or Loss in the consolidated statements of comprehensive income.
11.2 Held-to-Maturity Investments
As of May 31, 2018 and 2017, the Group’s HTM investments are classified in the consolidated statements of financial position as follows:
2018 2017
Current P - P 95,148,019 Non-current 297,284,616 241,418,315
P 297,284,616 P 336,566,334
These investments are composed of corporate bonds with maturities ranging from one to 32 years, which consist of peso and US dollar-denominated bonds issued by various local and foreign companies and bear fixed interest rates ranging from 3.2% to 7.4% per annum.
In 2017, the Group reclassified portion of its AFS financial assets with total fair value of P335.8 million as of date of reclassification to HTM investments because it intends to hold these debt securities until maturity. A portion of these reclassified bonds are still held by the Group with carrying values of P190.5 million and P238.5 million as of May 31, 2018 and 2017, respectively, and has fair values of P251.5 million and P344.0 million as of May 31, 2018 and 2017, respectively. There was no reclassification made during the period ended May 31, 2018.
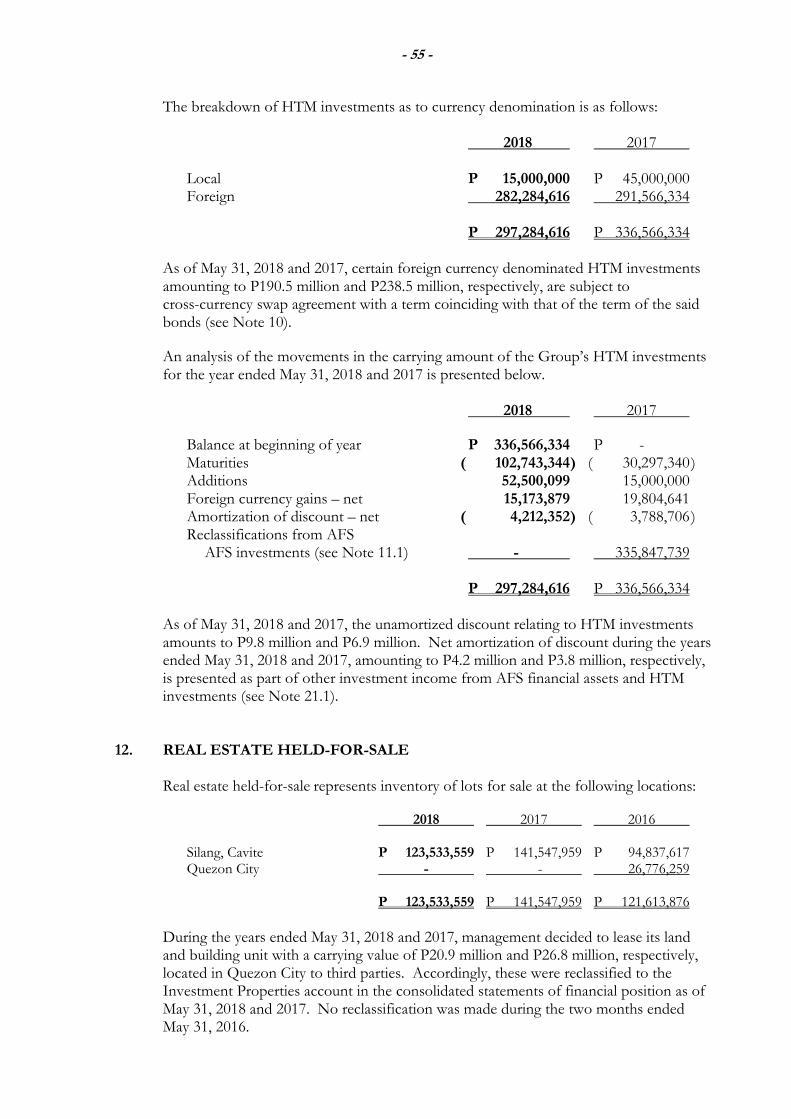
- 55 -
The breakdown of HTM investments as to currency denomination is as follows:
2018 2017
Local P 15,000,000 P 45,000,000 Foreign 282,284,616 291,566,334 P 297,284,616 P 336,566,334
As of May 31, 2018 and 2017, certain foreign currency denominated HTM investments amounting to P190.5 million and P238.5 million, respectively, are subject to cross-currency swap agreement with a term coinciding with that of the term of the said bonds (see Note 10). An analysis of the movements in the carrying amount of the Group’s HTM investments for the year ended May 31, 2018 and 2017 is presented below.
2018 2017 Balance at beginning of year P 336,566,334 P - Maturities ( 102,743,344 ) ( 30,297,340 ) Additions 52,500,099 15,000,000 Foreign currency gains – net 15,173,879 19,804,641 Amortization of discount – net ( 4,212,352 ) ( 3,788,706 ) Reclassifications from AFS AFS investments (see Note 11.1) - 335,847,739 P 297,284,616 P 336,566,334
As of May 31, 2018 and 2017, the unamortized discount relating to HTM investments amounts to P9.8 million and P6.9 million. Net amortization of discount during the years ended May 31, 2018 and 2017, amounting to P4.2 million and P3.8 million, respectively, is presented as part of other investment income from AFS financial assets and HTM investments (see Note 21.1).
12. REAL ESTATE HELD-FOR-SALE
Real estate held-for-sale represents inventory of lots for sale at the following locations:
2018 2017 2016
Silang, Cavite P 123,533,559 P 141,547,959 P 94,837,617 Quezon City - - 26,776,259 P 123,533,559 P 141,547,959 P 121,613,876
During the years ended May 31, 2018 and 2017, management decided to lease its land and building unit with a carrying value of P20.9 million and P26.8 million, respectively, located in Quezon City to third parties. Accordingly, these were reclassified to the Investment Properties account in the consolidated statements of financial position as of May 31, 2018 and 2017. No reclassification was made during the two months ended May 31, 2016.
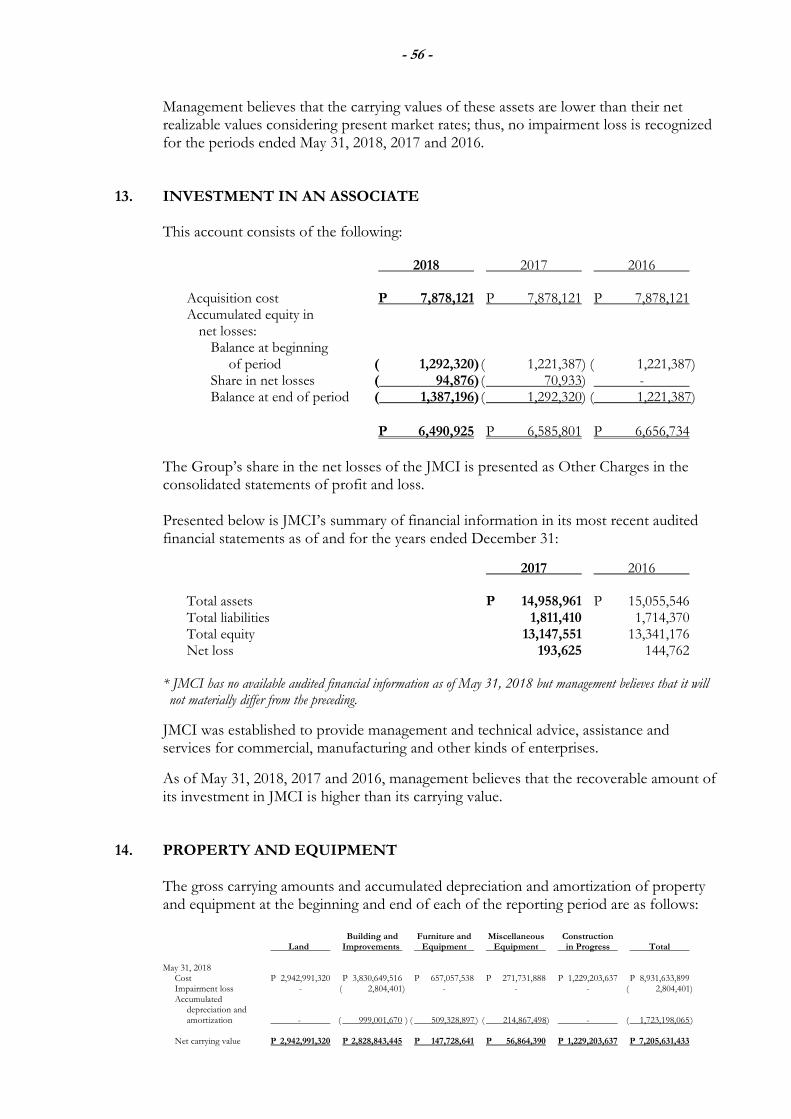
- 56 -
Management believes that the carrying values of these assets are lower than their net realizable values considering present market rates; thus, no impairment loss is recognized for the periods ended May 31, 2018, 2017 and 2016.
13. INVESTMENT IN AN ASSOCIATE This account consists of the following:
2018 2017 2016 Acquisition cost P 7,878,121 P 7,878,121 P 7,878,121 Accumulated equity in net losses: Balance at beginning of period ( 1,292,320) ( 1,221,387) ( 1,221,387) Share in net losses ( 94,876) ( 70,933) - Balance at end of period ( 1,387,196) ( 1,292,320) ( 1,221,387)
P 6,490,925 P 6,585,801 P 6,656,734
The Group’s share in the net losses of the JMCI is presented as Other Charges in the consolidated statements of profit and loss. Presented below is JMCI’s summary of financial information in its most recent audited financial statements as of and for the years ended December 31:
2017 2016 Total assets P 14,958,961 P 15,055,546 Total liabilities 1,811,410 1,714,370 Total equity 13,147,551 13,341,176 Net loss 193,625 144,762
* JMCI has no available audited financial information as of May 31, 2018 but management believes that it will not materially differ from the preceding.
JMCI was established to provide management and technical advice, assistance and services for commercial, manufacturing and other kinds of enterprises.
As of May 31, 2018, 2017 and 2016, management believes that the recoverable amount of its investment in JMCI is higher than its carrying value.
14. PROPERTY AND EQUIPMENT
The gross carrying amounts and accumulated depreciation and amortization of property and equipment at the beginning and end of each of the reporting period are as follows:
Building and Furniture and Miscellaneous Construction Land Improvements Equipment Equipment in Progress Total
May 31, 2018 Cost P 2,942,991,320 P 3,830,649,516 P 657,057,538 P 271,731,888 P 1,229,203,637 P 8,931,633,899 Impairment loss - ( 2,804,401) - - - ( 2,804,401) Accumulated depreciation and amortization - ( 999,001,670 ) ( 509,328,897 ) ( 214,867,498 ) - ( 1,723,198,065 ) Net carrying value P 2,942,991,320 P 2,828,843,445 P 147,728,641 P 56,864,390 P 1,229,203,637 P 7,205,631,433
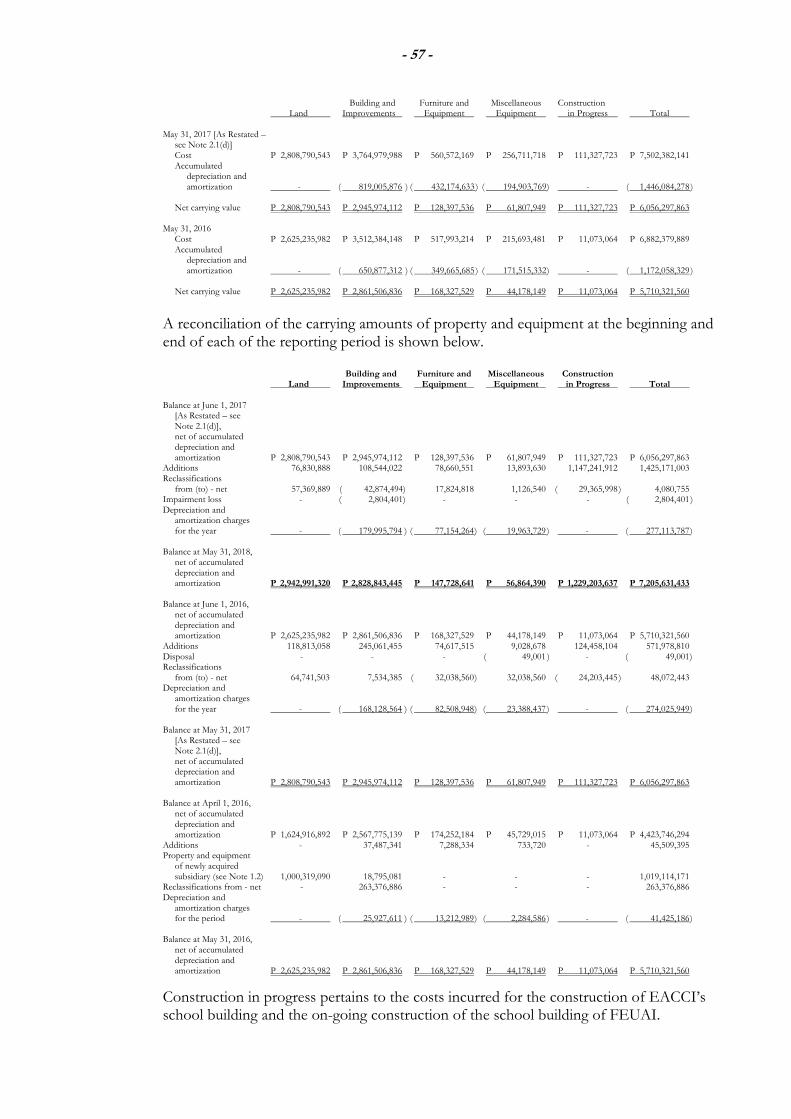
- 57 -
Building and Furniture and Miscellaneous Construction Land Improvements Equipment Equipment in Progress Total
May 31, 2017 [As Restated – see Note 2.1(d)]
Cost P 2,808,790,543 P 3,764,979,988 P 560,572,169 P 256,711,718 P 111,327,723 P 7,502,382,141 Accumulated depreciation and amortization - ( 819,005,876 ) ( 432,174,633 ) ( 194,903,769 ) - ( 1,446,084,278 ) Net carrying value P 2,808,790,543 P 2,945,974,112 P 128,397,536 P 61,807,949 P 111,327,723 P 6,056,297,863
May 31, 2016 Cost P 2,625,235,982 P 3,512,384,148 P 517,993,214 P 215,693,481 P 11,073,064 P 6,882,379,889 Accumulated depreciation and amortization - ( 650,877,312 ) ( 349,665,685 ) ( 171,515,332 ) - ( 1,172,058,329 ) Net carrying value P 2,625,235,982 P 2,861,506,836 P 168,327,529 P 44,178,149 P 11,073,064 P 5,710,321,560
A reconciliation of the carrying amounts of property and equipment at the beginning and end of each of the reporting period is shown below.
Building and Furniture and Miscellaneous Construction Land Improvements Equipment Equipment in Progress Total
Balance at June 1, 2017
[As Restated – see Note 2.1(d)],
net of accumulated depreciation and amortization P 2,808,790,543 P 2,945,974,112 P 128,397,536 P 61,807,949 P 111,327,723 P 6,056,297,863 Additions 76,830,888 108,544,022 78,660,551 13,893,630 1,147,241,912 1,425,171,003 Reclassifications from (to) - net 57,369,889 ( 42,874,494) 17,824,818 1,126,540 ( 29,365,998 ) 4,080,755 Impairment loss - ( 2,804,401) - - - ( 2,804,401 ) Depreciation and amortization charges for the year - ( 179,995,794 ) ( 77,154,264 ) ( 19,963,729 ) - ( 277,113,787 ) Balance at May 31, 2018, net of accumulated depreciation and amortization P 2,942,991,320 P 2,828,843,445 P 147,728,641 P 56,864,390 P 1,229,203,637 P 7,205,631,433 Balance at June 1, 2016, net of accumulated depreciation and amortization P 2,625,235,982 P 2,861,506,836 P 168,327,529 P 44,178,149 P 11,073,064 P 5,710,321,560 Additions 118,813,058 245,061,455 74,617,515 9,028,678 124,458,104 571,978,810 Disposal - - - ( 49,001 ) - ( 49,001 ) Reclassifications from (to) - net 64,741,503 7,534,385 ( 32,038,560 ) 32,038,560 ( 24,203,445 ) 48,072,443 Depreciation and amortization charges for the year - ( 168,128,564 ) ( 82,508,948 ) ( 23,388,437 ) - ( 274,025,949 )
Balance at May 31, 2017 [As Restated – see Note 2.1(d)],
net of accumulated depreciation and amortization P 2,808,790,543 P 2,945,974,112 P 128,397,536 P 61,807,949 P 111,327,723 P 6,056,297,863 Balance at April 1, 2016, net of accumulated depreciation and amortization P 1,624,916,892 P 2,567,775,139 P 174,252,184 P 45,729,015 P 11,073,064 P 4,423,746,294 Additions - 37,487,341 7,288,334 733,720 - 45,509,395 Property and equipment of newly acquired subsidiary (see Note 1.2) 1,000,319,090 18,795,081 - - - 1,019,114,171 Reclassifications from - net - 263,376,886 - - - 263,376,886 Depreciation and amortization charges for the period - ( 25,927,611 ) ( 13,212,989 ) ( 2,284,586 ) - ( 41,425,186 ) Balance at May 31, 2016, net of accumulated depreciation and amortization P 2,625,235,982 P 2,861,506,836 P 168,327,529 P 44,178,149 P 11,073,064 P 5,710,321,560
Construction in progress pertains to the costs incurred for the construction of EACCI’s school building and the on-going construction of the school building of FEUAI.
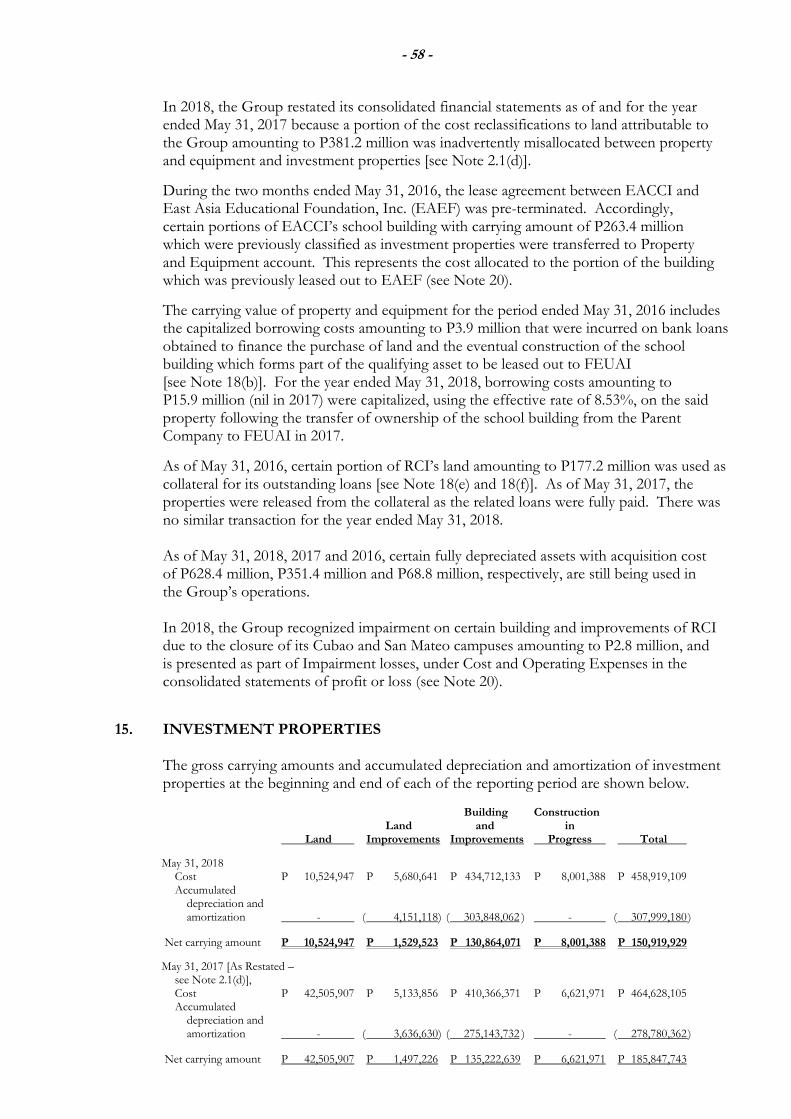
- 58 -
In 2018, the Group restated its consolidated financial statements as of and for the year ended May 31, 2017 because a portion of the cost reclassifications to land attributable to the Group amounting to P381.2 million was inadvertently misallocated between property and equipment and investment properties [see Note 2.1(d)].
During the two months ended May 31, 2016, the lease agreement between EACCI and East Asia Educational Foundation, Inc. (EAEF) was pre-terminated. Accordingly, certain portions of EACCI’s school building with carrying amount of P263.4 million which were previously classified as investment properties were transferred to Property and Equipment account. This represents the cost allocated to the portion of the building which was previously leased out to EAEF (see Note 20).
The carrying value of property and equipment for the period ended May 31, 2016 includes the capitalized borrowing costs amounting to P3.9 million that were incurred on bank loans obtained to finance the purchase of land and the eventual construction of the school building which forms part of the qualifying asset to be leased out to FEUAI [see Note 18(b)]. For the year ended May 31, 2018, borrowing costs amounting to P15.9 million (nil in 2017) were capitalized, using the effective rate of 8.53%, on the said property following the transfer of ownership of the school building from the Parent Company to FEUAI in 2017.
As of May 31, 2016, certain portion of RCI’s land amounting to P177.2 million was used as collateral for its outstanding loans [see Note 18(e) and 18(f)]. As of May 31, 2017, the properties were released from the collateral as the related loans were fully paid. There was no similar transaction for the year ended May 31, 2018. As of May 31, 2018, 2017 and 2016, certain fully depreciated assets with acquisition cost of P628.4 million, P351.4 million and P68.8 million, respectively, are still being used in the Group’s operations. In 2018, the Group recognized impairment on certain building and improvements of RCI due to the closure of its Cubao and San Mateo campuses amounting to P2.8 million, and is presented as part of Impairment losses, under Cost and Operating Expenses in the consolidated statements of profit or loss (see Note 20).
15. INVESTMENT PROPERTIES The gross carrying amounts and accumulated depreciation and amortization of investment properties at the beginning and end of each of the reporting period are shown below.
Building Construction
Land and in Land Improvements Improvements Progress Total
May 31, 2018 Cost P 10,524,947 P 5,680,641 P 434,712,133 P 8,001,388 P 458,919,109
Accumulated depreciation and amortization - ( 4,151,118) ( 303,848,062 ) - ( 307,999,180 )
Net carrying amount P 10,524,947 P 1,529,523 P 130,864,071 P 8,001,388 P 150,919,929
May 31, 2017 [As Restated – see Note 2.1(d)], Cost P 42,505,907 P 5,133,856 P 410,366,371 P 6,621,971 P 464,628,105
Accumulated depreciation and amortization - ( 3,636,630) ( 275,143,732 ) - ( 278,780,362 )
Net carrying amount P 42,505,907 P 1,497,226 P 135,222,639 P 6,621,971 P 185,847,743
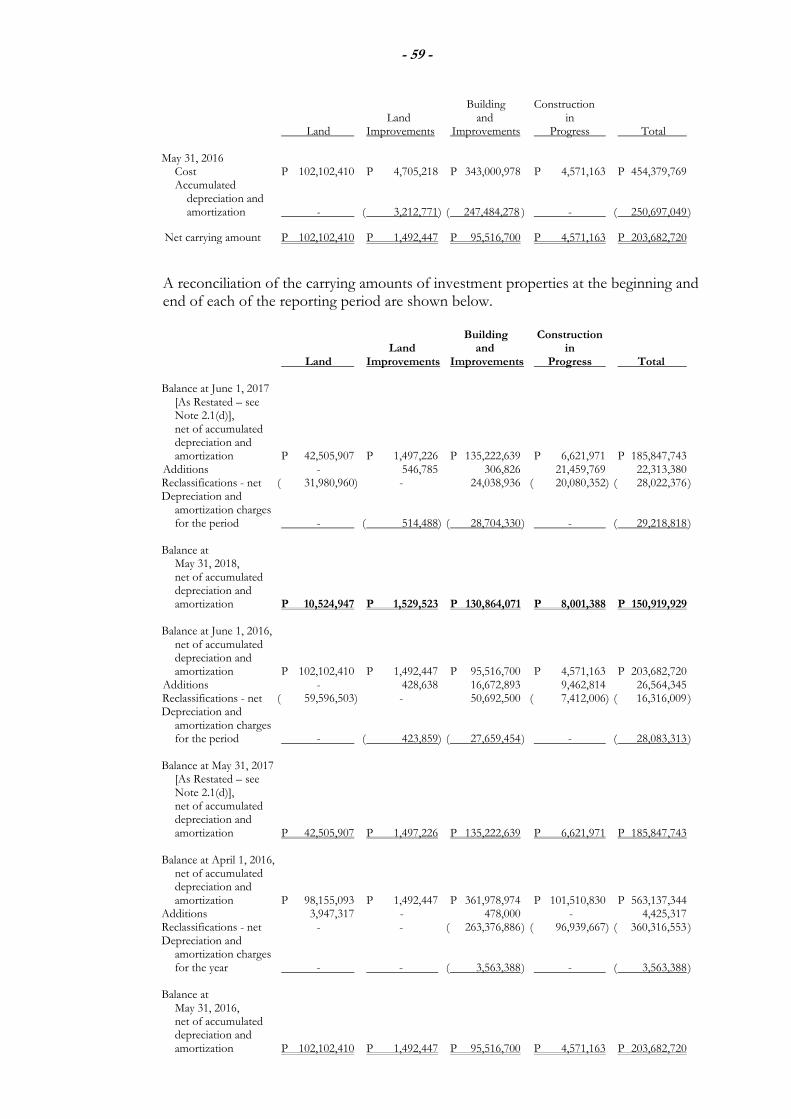
- 59 -
Building Construction Land and in Land Improvements Improvements Progress Total
May 31, 2016 Cost P 102,102,410 P 4,705,218 P 343,000,978 P 4,571,163 P 454,379,769
Accumulated depreciation and amortization - ( 3,212,771) ( 247,484,278 ) - ( 250,697,049 )
Net carrying amount P 102,102,410 P 1,492,447 P 95,516,700 P 4,571,163 P 203,682,720
A reconciliation of the carrying amounts of investment properties at the beginning and end of each of the reporting period are shown below. Building Construction
Land and in Land Improvements Improvements Progress Total Balance at June 1, 2017
[As Restated – see Note 2.1(d)],
net of accumulated depreciation and amortization P 42,505,907 P 1,497,226 P 135,222,639 P 6,621,971 P 185,847,743 Additions - 546,785 306,826 21,459,769 22,313,380 Reclassifications - net ( 31,980,960) - 24,038,936 ( 20,080,352) ( 28,022,376 ) Depreciation and amortization charges for the period - ( 514,488) ( 28,704,330 ) - ( 29,218,818 ) Balance at May 31, 2018, net of accumulated depreciation and amortization P 10,524,947 P 1,529,523 P 130,864,071 P 8,001,388 P 150,919,929 Balance at June 1, 2016, net of accumulated depreciation and amortization P 102,102,410 P 1,492,447 P 95,516,700 P 4,571,163 P 203,682,720 Additions - 428,638 16,672,893 9,462,814 26,564,345 Reclassifications - net ( 59,596,503) - 50,692,500 ( 7,412,006) ( 16,316,009 ) Depreciation and amortization charges for the period - ( 423,859) ( 27,659,454 ) - ( 28,083,313 ) Balance at May 31, 2017 [As Restated – see Note 2.1(d)], net of accumulated depreciation and amortization P 42,505,907 P 1,497,226 P 135,222,639 P 6,621,971 P 185,847,743
Balance at April 1, 2016, net of accumulated depreciation and amortization P 98,155,093 P 1,492,447 P 361,978,974 P 101,510,830 P 563,137,344 Additions 3,947,317 - 478,000 - 4,425,317 Reclassifications - net - - ( 263,376,886 ) ( 96,939,667) ( 360,316,553 ) Depreciation and amortization charges for the year - - ( 3,563,388 ) - ( 3,563,388 ) Balance at May 31, 2016, net of accumulated depreciation and amortization P 102,102,410 P 1,492,447 P 95,516,700 P 4,571,163 P 203,682,720
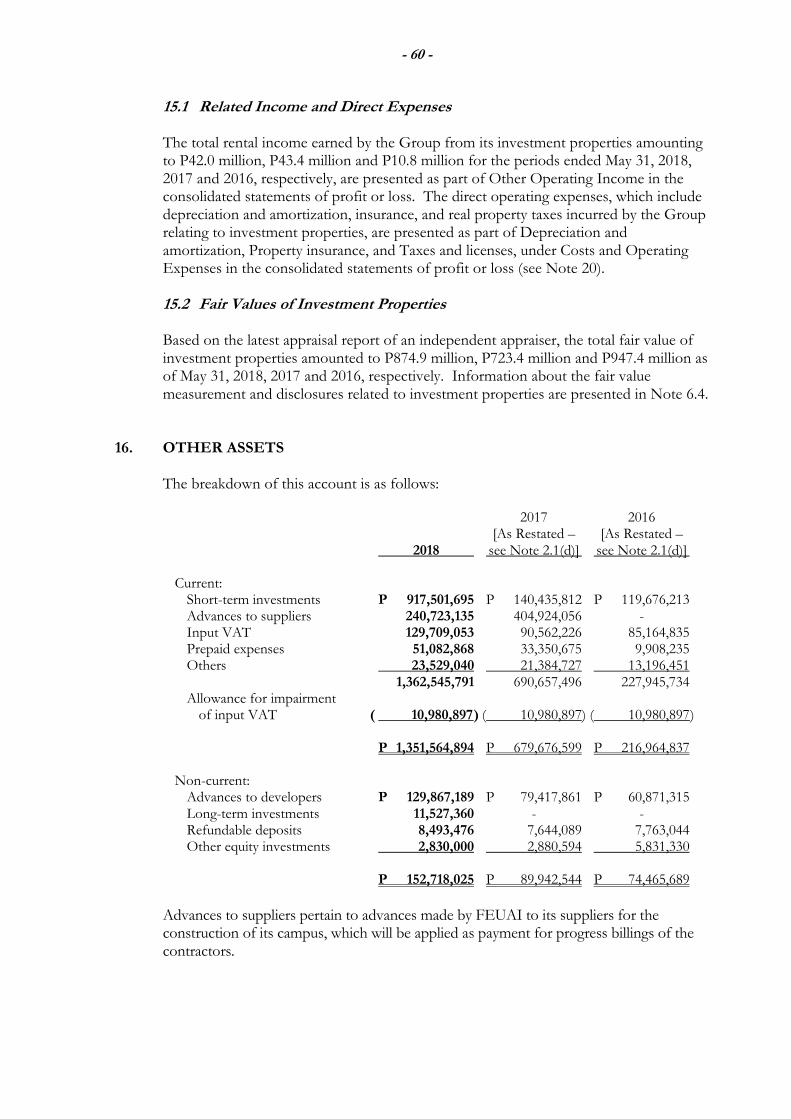
- 60 -
15.1 Related Income and Direct Expenses The total rental income earned by the Group from its investment properties amounting to P42.0 million, P43.4 million and P10.8 million for the periods ended May 31, 2018, 2017 and 2016, respectively, are presented as part of Other Operating Income in the consolidated statements of profit or loss. The direct operating expenses, which include depreciation and amortization, insurance, and real property taxes incurred by the Group relating to investment properties, are presented as part of Depreciation and amortization, Property insurance, and Taxes and licenses, under Costs and Operating Expenses in the consolidated statements of profit or loss (see Note 20).
15.2 Fair Values of Investment Properties Based on the latest appraisal report of an independent appraiser, the total fair value of investment properties amounted to P874.9 million, P723.4 million and P947.4 million as of May 31, 2018, 2017 and 2016, respectively. Information about the fair value measurement and disclosures related to investment properties are presented in Note 6.4.
16. OTHER ASSETS
The breakdown of this account is as follows:
2017 2016 [As Restated – [As Restated –
2018 see Note 2.1(d)] see Note 2.1(d)] Current: Short-term investments P 917,501,695 P 140,435,812 P 119,676,213 Advances to suppliers 240,723,135 404,924,056 - Input VAT 129,709,053 90,562,226 85,164,835 Prepaid expenses 51,082,868 33,350,675 9,908,235 Others 23,529,040 21,384,727 13,196,451 1,362,545,791 690,657,496 227,945,734 Allowance for impairment of input VAT ( 10,980,897 ) ( 10,980,897) ( 10,980,897 ) P 1,351,564,894 P 679,676,599 P 216,964,837
Non-current: Advances to developers P 129,867,189 P 79,417,861 P 60,871,315 Long-term investments 11,527,360 - - Refundable deposits 8,493,476 7,644,089 7,763,044 Other equity investments 2,830,000 2,880,594 5,831,330 P 152,718,025 P 89,942,544 P 74,465,689
Advances to suppliers pertain to advances made by FEUAI to its suppliers for the construction of its campus, which will be applied as payment for progress billings of the contractors.
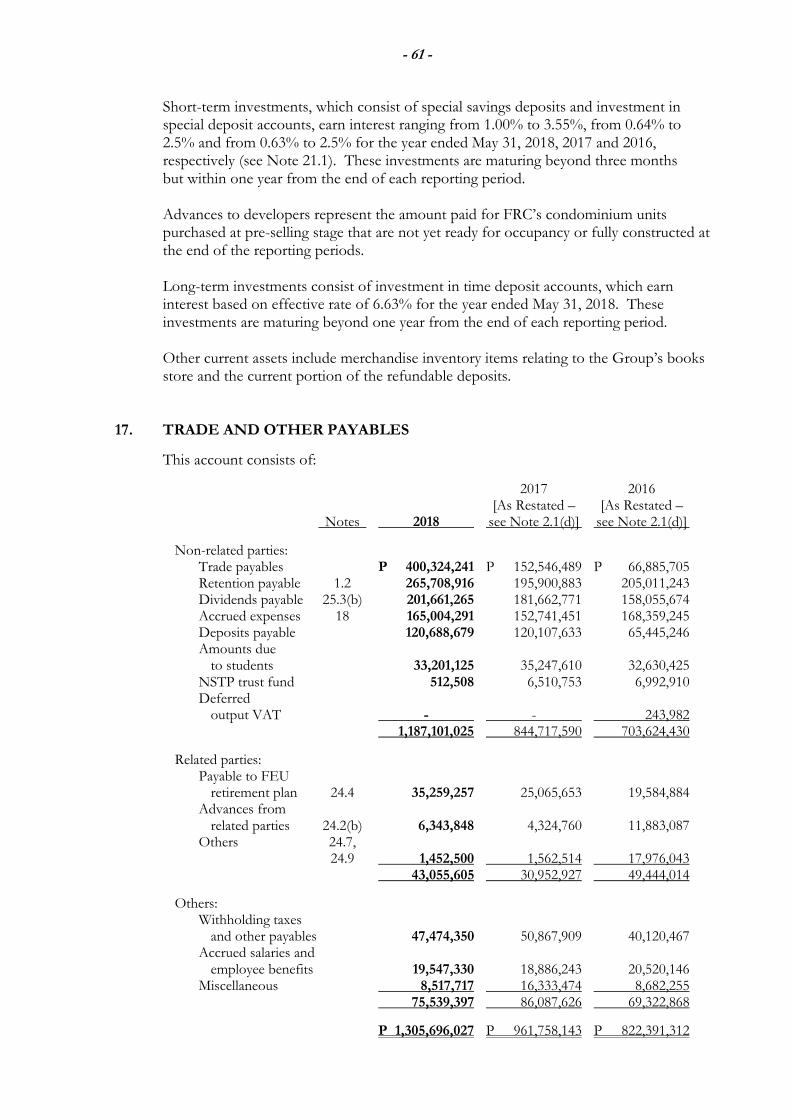
- 61 -
Short-term investments, which consist of special savings deposits and investment in special deposit accounts, earn interest ranging from 1.00% to 3.55%, from 0.64% to 2.5% and from 0.63% to 2.5% for the year ended May 31, 2018, 2017 and 2016, respectively (see Note 21.1). These investments are maturing beyond three months but within one year from the end of each reporting period. Advances to developers represent the amount paid for FRC’s condominium units purchased at pre-selling stage that are not yet ready for occupancy or fully constructed at the end of the reporting periods. Long-term investments consist of investment in time deposit accounts, which earn interest based on effective rate of 6.63% for the year ended May 31, 2018. These investments are maturing beyond one year from the end of each reporting period. Other current assets include merchandise inventory items relating to the Group’s books store and the current portion of the refundable deposits.
17. TRADE AND OTHER PAYABLES
This account consists of:
2017 2016 [As Restated – [As Restated – Notes 2018 see Note 2.1(d)] see Note 2.1(d)]
Non-related parties: Trade payables P 400,324,241 P 152,546,489 P 66,885,705 Retention payable 1.2 265,708,916 195,900,883 205,011,243 Dividends payable 25.3(b) 201,661,265 181,662,771 158,055,674 Accrued expenses 18 165,004,291 152,741,451 168,359,245 Deposits payable 120,688,679 120,107,633 65,445,246 Amounts due to students 33,201,125 35,247,610 32,630,425 NSTP trust fund 512,508 6,510,753 6,992,910 Deferred output VAT - - 243,982 1,187,101,025 844,717,590 703,624,430
Related parties: Payable to FEU retirement plan 24.4 35,259,257 25,065,653 19,584,884 Advances from related parties 24.2(b) 6,343,848 4,324,760 11,883,087 Others 24.7, 24.9 1,452,500 1,562,514 17,976,043 43,055,605 30,952,927 49,444,014
Others: Withholding taxes and other payables 47,474,350 50,867,909 40,120,467 Accrued salaries and employee benefits 19,547,330 18,886,243 20,520,146 Miscellaneous 8,517,717 16,333,474 8,682,255 75,539,397 86,087,626 69,322,868
P 1,305,696,027 P 961,758,143 P 822,391,312
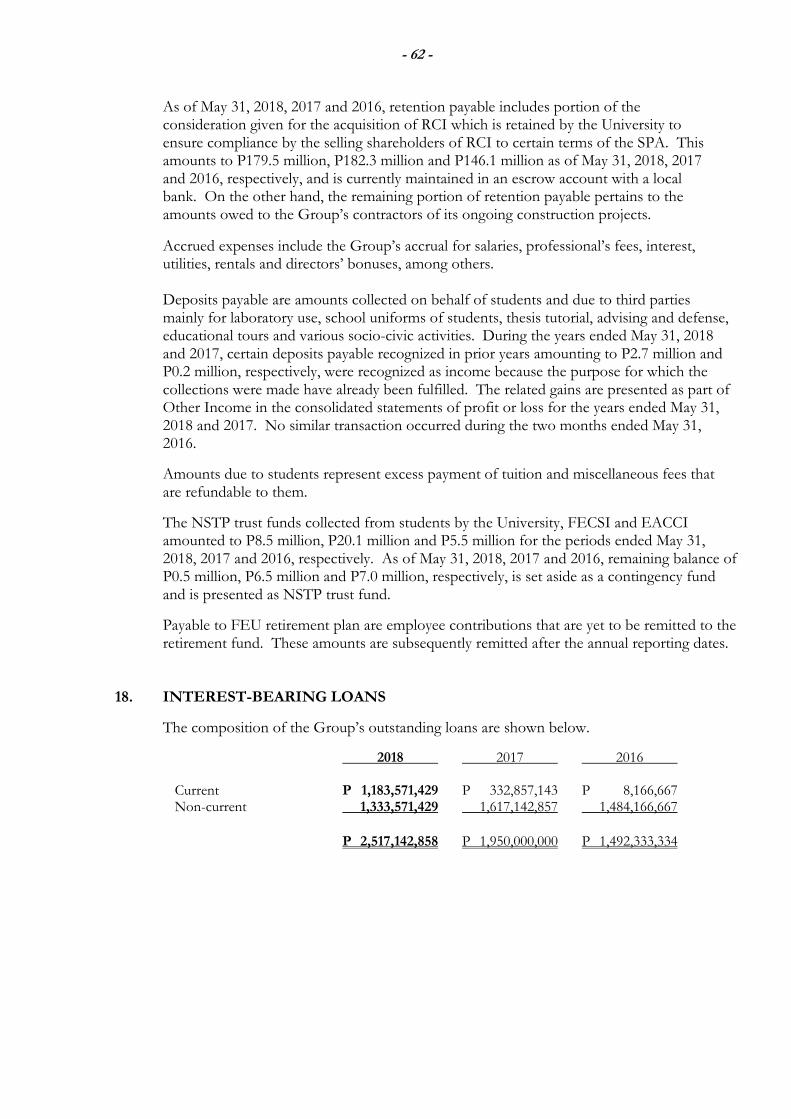
- 62 -
As of May 31, 2018, 2017 and 2016, retention payable includes portion of the consideration given for the acquisition of RCI which is retained by the University to ensure compliance by the selling shareholders of RCI to certain terms of the SPA. This amounts to P179.5 million, P182.3 million and P146.1 million as of May 31, 2018, 2017 and 2016, respectively, and is currently maintained in an escrow account with a local bank. On the other hand, the remaining portion of retention payable pertains to the amounts owed to the Group’s contractors of its ongoing construction projects.
Accrued expenses include the Group’s accrual for salaries, professional’s fees, interest, utilities, rentals and directors’ bonuses, among others.
Deposits payable are amounts collected on behalf of students and due to third parties mainly for laboratory use, school uniforms of students, thesis tutorial, advising and defense, educational tours and various socio-civic activities. During the years ended May 31, 2018 and 2017, certain deposits payable recognized in prior years amounting to P2.7 million and P0.2 million, respectively, were recognized as income because the purpose for which the collections were made have already been fulfilled. The related gains are presented as part of Other Income in the consolidated statements of profit or loss for the years ended May 31, 2018 and 2017. No similar transaction occurred during the two months ended May 31, 2016.
Amounts due to students represent excess payment of tuition and miscellaneous fees that are refundable to them.
The NSTP trust funds collected from students by the University, FECSI and EACCI amounted to P8.5 million, P20.1 million and P5.5 million for the periods ended May 31, 2018, 2017 and 2016, respectively. As of May 31, 2018, 2017 and 2016, remaining balance of P0.5 million, P6.5 million and P7.0 million, respectively, is set aside as a contingency fund and is presented as NSTP trust fund.
Payable to FEU retirement plan are employee contributions that are yet to be remitted to the retirement fund. These amounts are subsequently remitted after the annual reporting dates.
18. INTEREST-BEARING LOANS
The composition of the Group’s outstanding loans are shown below.
2018 2017 2016 Current P 1,183,571,429 P 332,857,143 P 8,166,667 Non-current 1,333,571,429 1,617,142,857 1,484,166,667
P 2,517,142,858 P 1,950,000,000 P 1,492,333,334
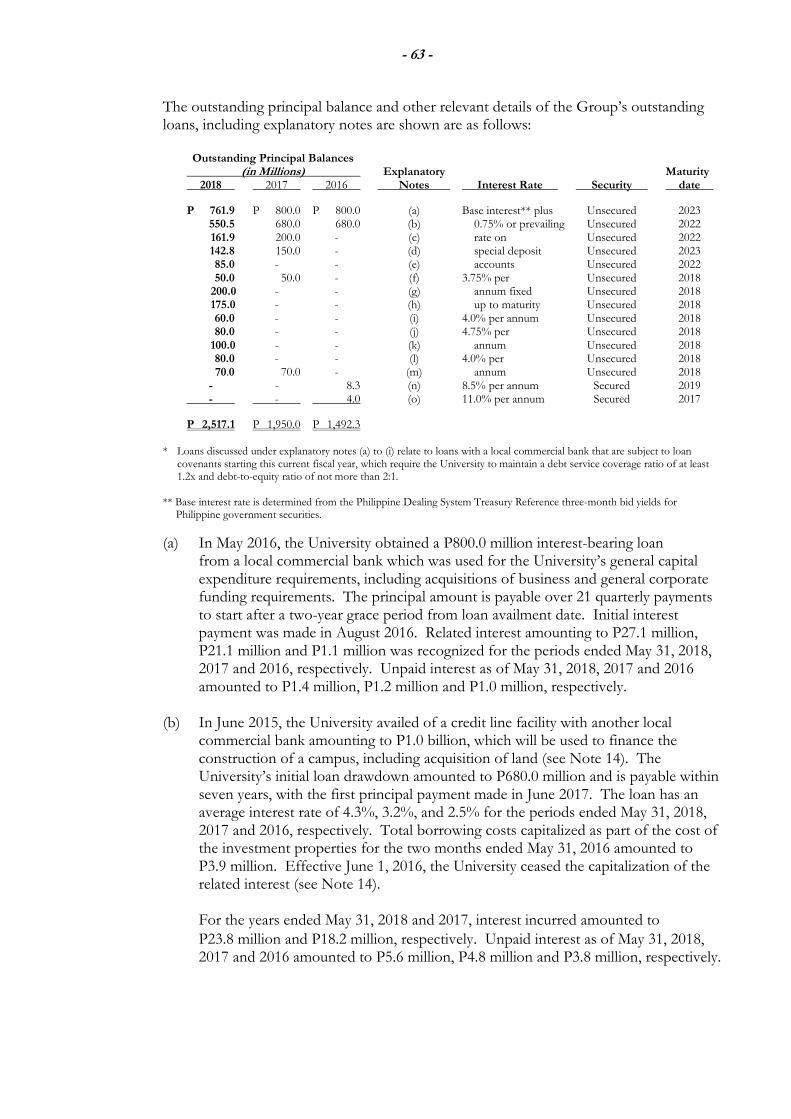
- 63 -
The outstanding principal balance and other relevant details of the Group’s outstanding loans, including explanatory notes are shown are as follows:
Outstanding Principal Balances
(in Millions) Explanatory Maturity 2018 2017 2016 Notes Interest Rate Security date
P 761.9 P 800.0 P 800.0 (a) Base interest** plus Unsecured 2023 550.5 680.0 680.0 (b) 0.75% or prevailing Unsecured 2022 161.9 200.0 - (c) rate on Unsecured 2022 142.8 150.0 - (d) special deposit Unsecured 2023 85.0 - - (e) accounts Unsecured 2022 50.0 50.0 - (f) 3.75% per Unsecured 2018 200.0 - - (g) annum fixed Unsecured 2018 175.0 - - (h) up to maturity Unsecured 2018 60.0 - - (i) 4.0% per annum Unsecured 2018 80.0 - - (j) 4.75% per Unsecured 2018 100.0 - - (k) annum Unsecured 2018
80.0 - - (l) 4.0% per Unsecured 2018 70.0 70.0 - (m) annum Unsecured 2018 - - 8.3 (n) 8.5% per annum Secured 2019 - - 4.0 (o) 11.0% per annum Secured 2017
P 2,517.1 P 1,950.0 P 1,492.3 * Loans discussed under explanatory notes (a) to (i) relate to loans with a local commercial bank that are subject to loan
covenants starting this current fiscal year, which require the University to maintain a debt service coverage ratio of at least 1.2x and debt-to-equity ratio of not more than 2:1.
** Base interest rate is determined from the Philippine Dealing System Treasury Reference three-month bid yields for Philippine government securities.
(a) In May 2016, the University obtained a P800.0 million interest-bearing loan from a local commercial bank which was used for the University’s general capital expenditure requirements, including acquisitions of business and general corporate funding requirements. The principal amount is payable over 21 quarterly payments to start after a two-year grace period from loan availment date. Initial interest payment was made in August 2016. Related interest amounting to P27.1 million, P21.1 million and P1.1 million was recognized for the periods ended May 31, 2018, 2017 and 2016, respectively. Unpaid interest as of May 31, 2018, 2017 and 2016 amounted to P1.4 million, P1.2 million and P1.0 million, respectively.
(b) In June 2015, the University availed of a credit line facility with another local
commercial bank amounting to P1.0 billion, which will be used to finance the construction of a campus, including acquisition of land (see Note 14). The University’s initial loan drawdown amounted to P680.0 million and is payable within seven years, with the first principal payment made in June 2017. The loan has an average interest rate of 4.3%, 3.2%, and 2.5% for the periods ended May 31, 2018, 2017 and 2016, respectively. Total borrowing costs capitalized as part of the cost of the investment properties for the two months ended May 31, 2016 amounted to P3.9 million. Effective June 1, 2016, the University ceased the capitalization of the related interest (see Note 14).
For the years ended May 31, 2018 and 2017, interest incurred amounted to
P23.8 million and P18.2 million, respectively. Unpaid interest as of May 31, 2018, 2017 and 2016 amounted to P5.6 million, P4.8 million and P3.8 million, respectively.
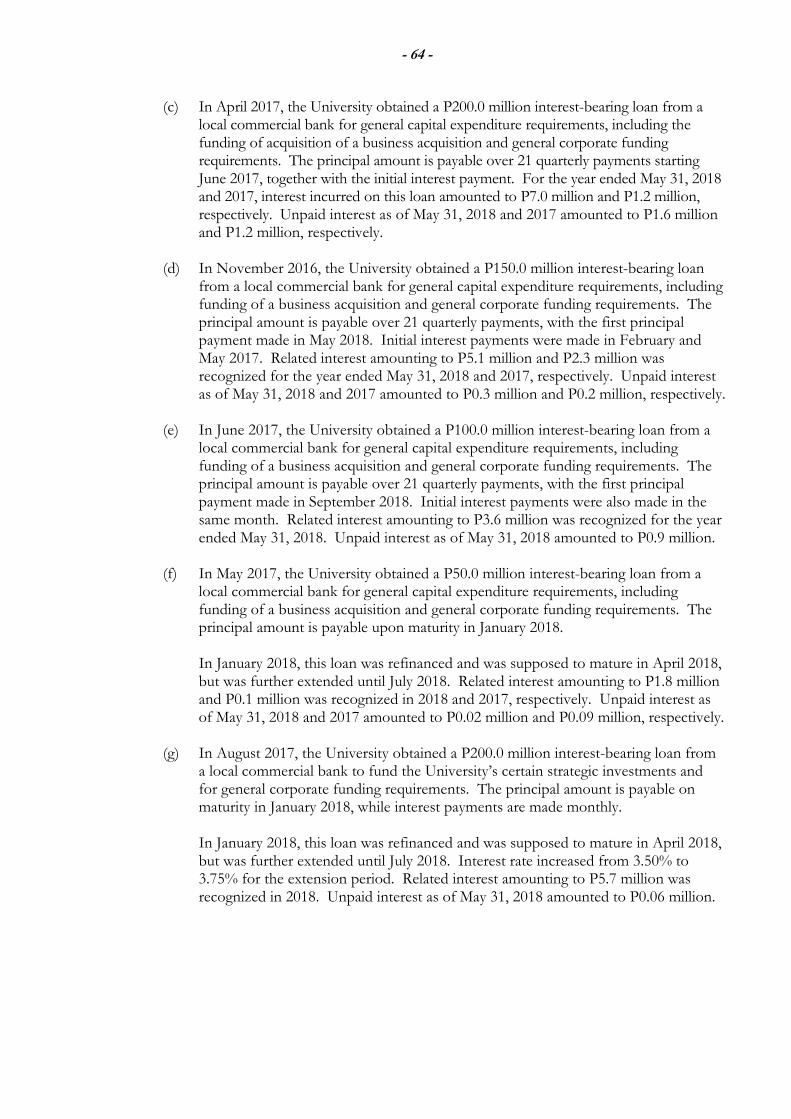
- 64 -
(c) In April 2017, the University obtained a P200.0 million interest-bearing loan from a local commercial bank for general capital expenditure requirements, including the funding of acquisition of a business acquisition and general corporate funding requirements. The principal amount is payable over 21 quarterly payments starting June 2017, together with the initial interest payment. For the year ended May 31, 2018 and 2017, interest incurred on this loan amounted to P7.0 million and P1.2 million, respectively. Unpaid interest as of May 31, 2018 and 2017 amounted to P1.6 million and P1.2 million, respectively.
(d) In November 2016, the University obtained a P150.0 million interest-bearing loan from a local commercial bank for general capital expenditure requirements, including funding of a business acquisition and general corporate funding requirements. The principal amount is payable over 21 quarterly payments, with the first principal payment made in May 2018. Initial interest payments were made in February and May 2017. Related interest amounting to P5.1 million and P2.3 million was recognized for the year ended May 31, 2018 and 2017, respectively. Unpaid interest as of May 31, 2018 and 2017 amounted to P0.3 million and P0.2 million, respectively.
(e) In June 2017, the University obtained a P100.0 million interest-bearing loan from a
local commercial bank for general capital expenditure requirements, including funding of a business acquisition and general corporate funding requirements. The principal amount is payable over 21 quarterly payments, with the first principal payment made in September 2018. Initial interest payments were also made in the same month. Related interest amounting to P3.6 million was recognized for the year ended May 31, 2018. Unpaid interest as of May 31, 2018 amounted to P0.9 million.
(f) In May 2017, the University obtained a P50.0 million interest-bearing loan from a local commercial bank for general capital expenditure requirements, including funding of a business acquisition and general corporate funding requirements. The principal amount is payable upon maturity in January 2018.
In January 2018, this loan was refinanced and was supposed to mature in April 2018, but was further extended until July 2018. Related interest amounting to P1.8 million and P0.1 million was recognized in 2018 and 2017, respectively. Unpaid interest as of May 31, 2018 and 2017 amounted to P0.02 million and P0.09 million, respectively.
(g) In August 2017, the University obtained a P200.0 million interest-bearing loan from
a local commercial bank to fund the University’s certain strategic investments and for general corporate funding requirements. The principal amount is payable on maturity in January 2018, while interest payments are made monthly. In January 2018, this loan was refinanced and was supposed to mature in April 2018, but was further extended until July 2018. Interest rate increased from 3.50% to 3.75% for the extension period. Related interest amounting to P5.7 million was recognized in 2018. Unpaid interest as of May 31, 2018 amounted to P0.06 million.
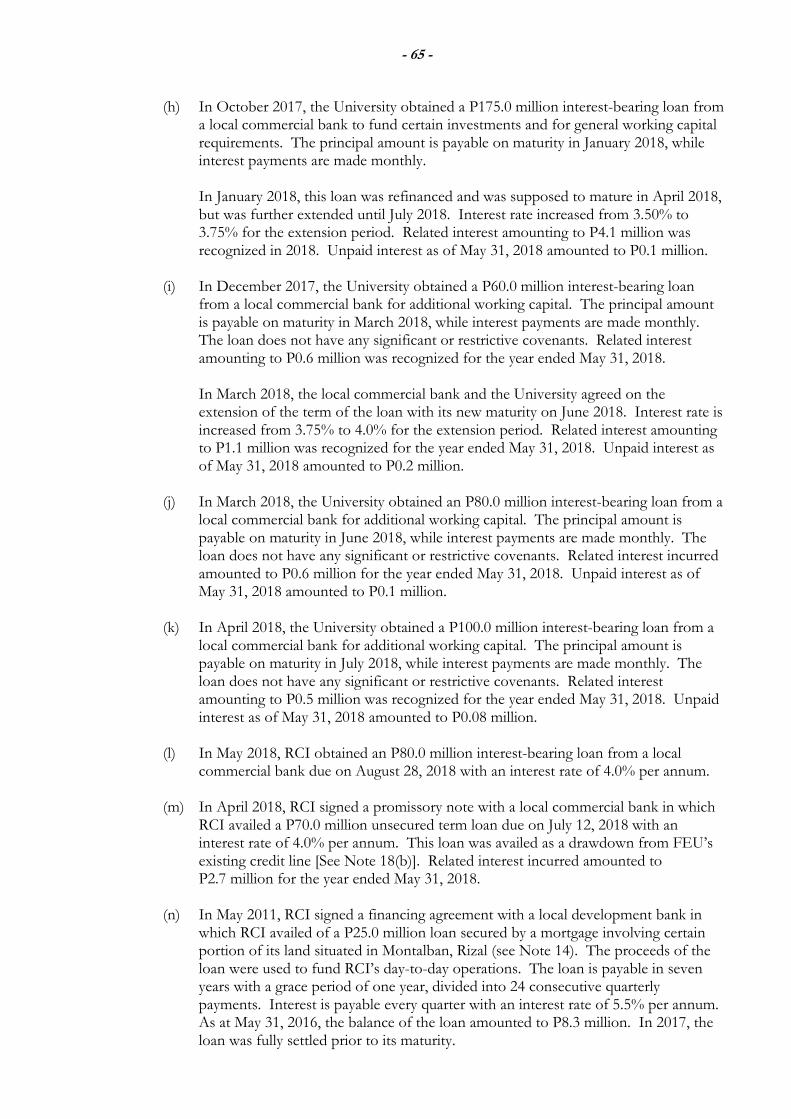
- 65 -
(h) In October 2017, the University obtained a P175.0 million interest-bearing loan from a local commercial bank to fund certain investments and for general working capital requirements. The principal amount is payable on maturity in January 2018, while interest payments are made monthly.
In January 2018, this loan was refinanced and was supposed to mature in April 2018, but was further extended until July 2018. Interest rate increased from 3.50% to 3.75% for the extension period. Related interest amounting to P4.1 million was recognized in 2018. Unpaid interest as of May 31, 2018 amounted to P0.1 million.
(i) In December 2017, the University obtained a P60.0 million interest-bearing loan
from a local commercial bank for additional working capital. The principal amount is payable on maturity in March 2018, while interest payments are made monthly. The loan does not have any significant or restrictive covenants. Related interest amounting to P0.6 million was recognized for the year ended May 31, 2018.
In March 2018, the local commercial bank and the University agreed on the extension of the term of the loan with its new maturity on June 2018. Interest rate is increased from 3.75% to 4.0% for the extension period. Related interest amounting to P1.1 million was recognized for the year ended May 31, 2018. Unpaid interest as of May 31, 2018 amounted to P0.2 million.
(j) In March 2018, the University obtained an P80.0 million interest-bearing loan from a local commercial bank for additional working capital. The principal amount is payable on maturity in June 2018, while interest payments are made monthly. The loan does not have any significant or restrictive covenants. Related interest incurred amounted to P0.6 million for the year ended May 31, 2018. Unpaid interest as of May 31, 2018 amounted to P0.1 million.
(k) In April 2018, the University obtained a P100.0 million interest-bearing loan from a local commercial bank for additional working capital. The principal amount is payable on maturity in July 2018, while interest payments are made monthly. The loan does not have any significant or restrictive covenants. Related interest amounting to P0.5 million was recognized for the year ended May 31, 2018. Unpaid interest as of May 31, 2018 amounted to P0.08 million.
(l) In May 2018, RCI obtained an P80.0 million interest-bearing loan from a local commercial bank due on August 28, 2018 with an interest rate of 4.0% per annum.
(m) In April 2018, RCI signed a promissory note with a local commercial bank in which
RCI availed a P70.0 million unsecured term loan due on July 12, 2018 with an interest rate of 4.0% per annum. This loan was availed as a drawdown from FEU’s existing credit line [See Note 18(b)]. Related interest incurred amounted to P2.7 million for the year ended May 31, 2018.
(n) In May 2011, RCI signed a financing agreement with a local development bank in
which RCI availed of a P25.0 million loan secured by a mortgage involving certain portion of its land situated in Montalban, Rizal (see Note 14). The proceeds of the loan were used to fund RCI’s day-to-day operations. The loan is payable in seven years with a grace period of one year, divided into 24 consecutive quarterly payments. Interest is payable every quarter with an interest rate of 5.5% per annum. As at May 31, 2016, the balance of the loan amounted to P8.3 million. In 2017, the loan was fully settled prior to its maturity.
- 66 -
(o) In December 2013, RCI signed a promissory note with a local commercial bank in which RCI availed of a P4.0 million secured loan by a mortgage involving certain portion of its land situated in Marikina (see Note 14). The proceeds of the loan were used by RCI for its working capital. The loan is renewable every six months and bears an interest of 11% per annum. The loan was paid in full in June 2016.
(p) On August 16, 2016, the University’s BOT approved the acceptance of a credit line
facility of up to P3.0 billion from another local bank. As of May 31, 2018 and 2017, the University has not made any drawdown from the facility yet. Any loans to be drawn from the facility will be unsecured.
The total interest incurred by the Group on all of these loans are presented as part of Interest expense under Finance Costs in the consolidated statements of profit or loss (see Note 21.2), while any outstanding interest payable is recognized as part of Accrued expenses under Trade and Other Payables in the consolidated statements of financial position (see Note 17). The portion of finance costs for 2018, 2017 and 2016 that were capitalized is included as part of additions to Construction in progress under Property and Equipment account in the consolidated statements of financial position (see Note 15).
As of May 31, 2016, certain portion of RCI’s land was used as collateral for its outstanding loans (see Note 14). In 2017, these properties were released from the collateral as the related loans were fully paid. As of May 31, 2018 and 2017, there are no assets used and/or required as collaterals for the Group’s interest bearing loans and borrowings. As of May 31, 2018, 2017 and 2016, the Group has complied with its loan covenants.
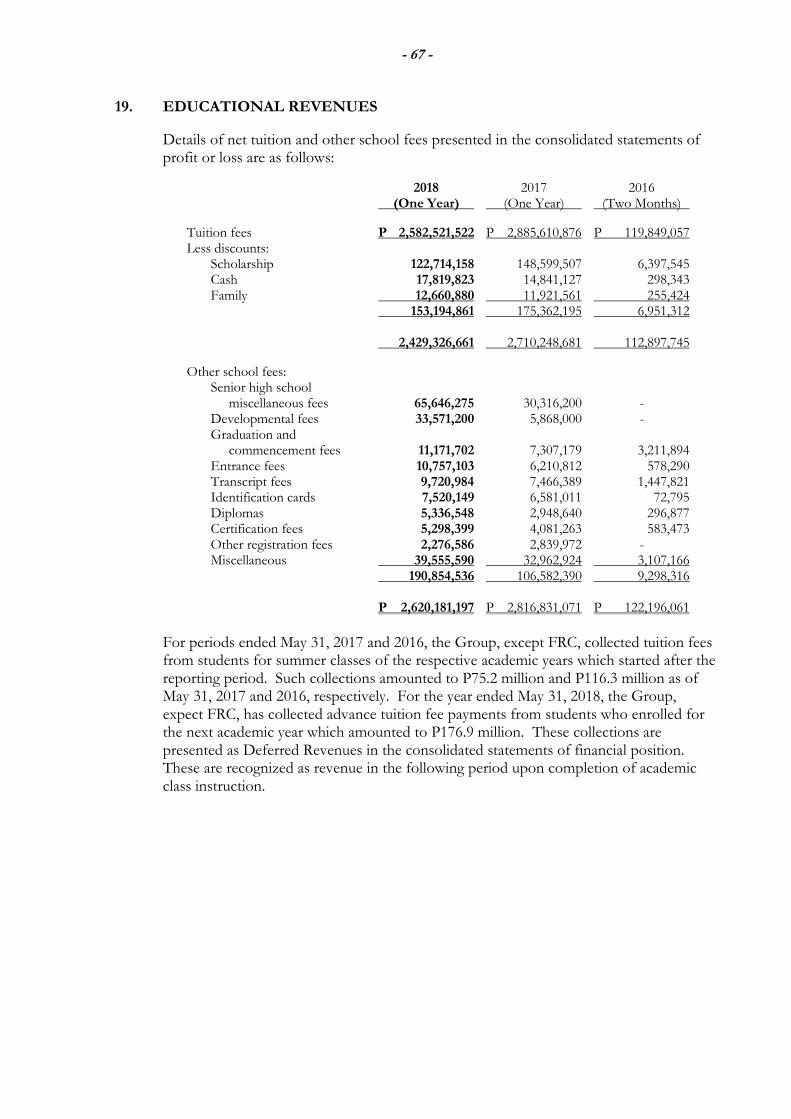
- 67 -
19. EDUCATIONAL REVENUES
Details of net tuition and other school fees presented in the consolidated statements of profit or loss are as follows:
2018 2017 2016 (One Year) (One Year) (Two Months)
Tuition fees P 2,582,521,522 P 2,885,610,876 P 119,849,057 Less discounts: Scholarship 122,714,158 148,599,507 6,397,545 Cash 17,819,823 14,841,127 298,343 Family 12,660,880 11,921,561 255,424 153,194,861 175,362,195 6,951,312 2,429,326,661 2,710,248,681 112,897,745
Other school fees: Senior high school miscellaneous fees 65,646,275 30,316,200 - Developmental fees 33,571,200 5,868,000 - Graduation and commencement fees 11,171,702 7,307,179 3,211,894 Entrance fees 10,757,103 6,210,812 578,290 Transcript fees 9,720,984 7,466,389 1,447,821 Identification cards 7,520,149 6,581,011 72,795 Diplomas 5,336,548 2,948,640 296,877 Certification fees 5,298,399 4,081,263 583,473 Other registration fees 2,276,586 2,839,972 - Miscellaneous 39,555,590 32,962,924 3,107,166 190,854,536 106,582,390 9,298,316 P 2,620,181,197 P 2,816,831,071 P 122,196,061
For periods ended May 31, 2017 and 2016, the Group, except FRC, collected tuition fees from students for summer classes of the respective academic years which started after the reporting period. Such collections amounted to P75.2 million and P116.3 million as of May 31, 2017 and 2016, respectively. For the year ended May 31, 2018, the Group, expect FRC, has collected advance tuition fee payments from students who enrolled for the next academic year which amounted to P176.9 million. These collections are presented as Deferred Revenues in the consolidated statements of financial position. These are recognized as revenue in the following period upon completion of academic class instruction.
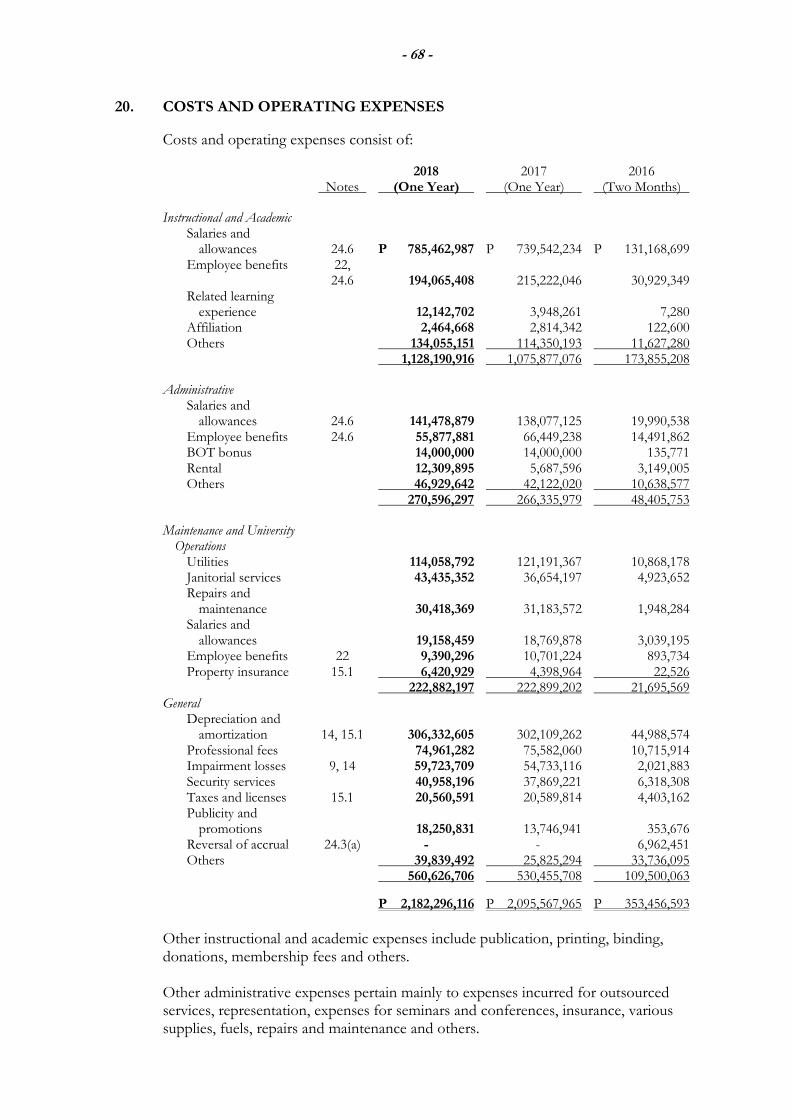
- 68 -
20. COSTS AND OPERATING EXPENSES
Costs and operating expenses consist of:
2018 2017 2016 Notes (One Year) (One Year) (Two Months)
Instructional and Academic Salaries and allowances 24.6 P 785,462,987 P 739,542,234 P 131,168,699 Employee benefits 22, 24.6 194,065,408 215,222,046 30,929,349 Related learning experience 12,142,702 3,948,261 7,280 Affiliation 2,464,668 2,814,342 122,600 Others 134,055,151 114,350,193 11,627,280 1,128,190,916 1,075,877,076 173,855,208
Administrative Salaries and allowances 24.6 141,478,879 138,077,125 19,990,538 Employee benefits 24.6 55,877,881 66,449,238 14,491,862 BOT bonus 14,000,000 14,000,000 135,771 Rental 12,309,895 5,687,596 3,149,005 Others 46,929,642 42,122,020 10,638,577 270,596,297 266,335,979 48,405,753 Maintenance and University
Operations Utilities 114,058,792 121,191,367 10,868,178 Janitorial services 43,435,352 36,654,197 4,923,652 Repairs and maintenance 30,418,369 31,183,572 1,948,284 Salaries and allowances 19,158,459 18,769,878 3,039,195 Employee benefits 22 9,390,296 10,701,224 893,734 Property insurance 15.1 6,420,929 4,398,964 22,526 222,882,197 222,899,202 21,695,569 General Depreciation and amortization 14, 15.1 306,332,605 302,109,262 44,988,574 Professional fees 74,961,282 75,582,060 10,715,914 Impairment losses 9, 14 59,723,709 54,733,116 2,021,883 Security services 40,958,196 37,869,221 6,318,308 Taxes and licenses 15.1 20,560,591 20,589,814 4,403,162 Publicity and promotions 18,250,831 13,746,941 353,676 Reversal of accrual 24.3(a) - - 6,962,451 Others 39,839,492 25,825,294 33,736,095 560,626,706 530,455,708 109,500,063
P 2,182,296,116 P 2,095,567,965 P 353,456,593
Other instructional and academic expenses include publication, printing, binding, donations, membership fees and others.
Other administrative expenses pertain mainly to expenses incurred for outsourced services, representation, expenses for seminars and conferences, insurance, various supplies, fuels, repairs and maintenance and others.
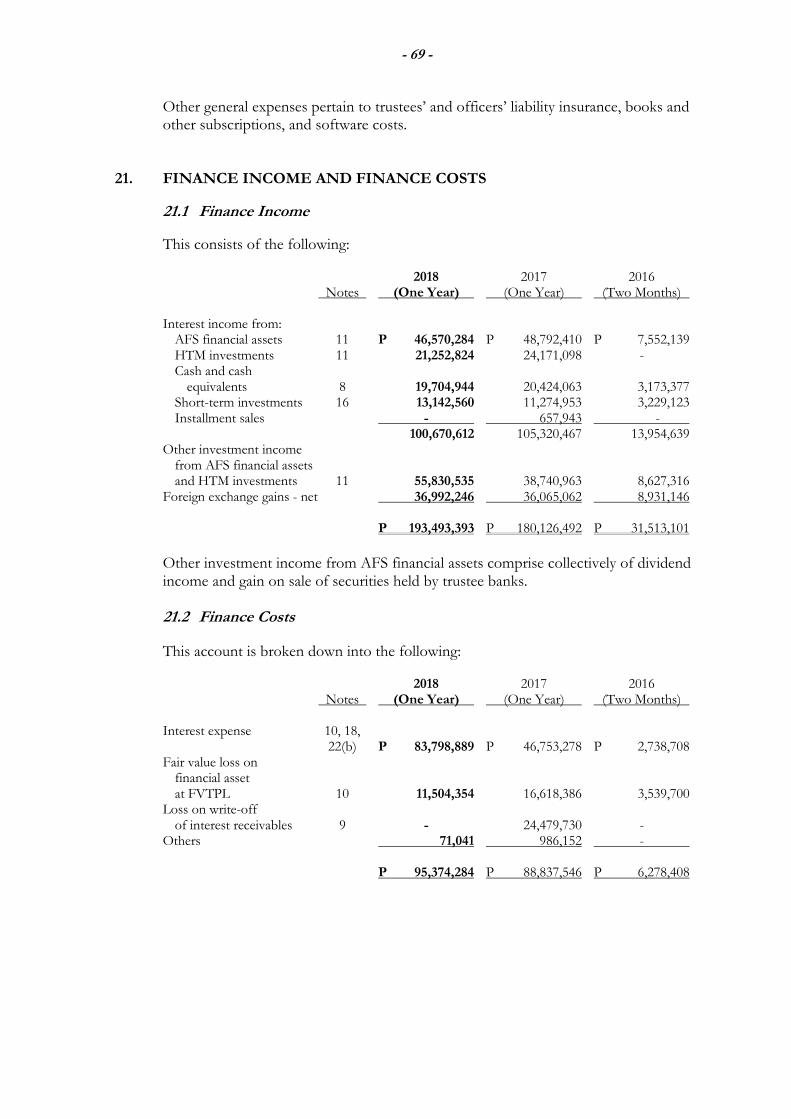
- 69 -
Other general expenses pertain to trustees’ and officers’ liability insurance, books and other subscriptions, and software costs.
21. FINANCE INCOME AND FINANCE COSTS
21.1 Finance Income
This consists of the following:
2018 2017 2016 Notes (One Year) (One Year) (Two Months) Interest income from: AFS financial assets 11 P 46,570,284 P 48,792,410 P 7,552,139 HTM investments 11 21,252,824 24,171,098 - Cash and cash equivalents 8 19,704,944 20,424,063 3,173,377 Short-term investments 16 13,142,560 11,274,953 3,229,123 Installment sales - 657,943 - 100,670,612 105,320,467 13,954,639 Other investment income from AFS financial assets and HTM investments 11 55,830,535 38,740,963 8,627,316 Foreign exchange gains - net 36,992,246 36,065,062 8,931,146
P 193,493,393 P 180,126,492 P 31,513,101
Other investment income from AFS financial assets comprise collectively of dividend income and gain on sale of securities held by trustee banks.
21.2 Finance Costs
This account is broken down into the following:
2018 2017 2016 Notes (One Year) (One Year) (Two Months)
Interest expense 10, 18, 22(b) P 83,798,889 P 46,753,278 P 2,738,708
Fair value loss on financial asset at FVTPL 10 11,504,354 16,618,386 3,539,700
Loss on write-off of interest receivables 9 - 24,479,730 - Others 71,041 986,152 -
P 95,374,284 P 88,837,546 P 6,278,408
- 70 -
22. EMPLOYEES’ HEALTH, WELFARE AND RETIREMENT FUND
(a) Characteristics of the Defined Contribution and Defined Benefit Plans (i) The University, FECSI and EACCI
The University, FECSI and EACCI maintain tax-qualified, funded and contributory retirement plans, which fall under a defined contribution type of retirement plan, covering regular teaching and non-teaching personnel members. The University, FECSI and EACCI’s retirement plans were maintained since 1967, 2013 and 2017, respectively.
The retirement funds are under the administration of organizations, the FEU Health, Welfare and Retirement Fund, the FEU Cavite Health, Welfare and Retirement and Private Education Retirement Annuity Association (the Funds), through their respective Board of Governors. Contributions to these funds are in accordance with the defined contribution established by the Retirement Board, which is the sum of the employees’ and the University, FECSI and EACCI’s contributions. Retirement expense presented as part of Employee benefits under Costs and Operating Expenses in the consolidated statements of profit or loss amounted to P82.0 million, P80.7 million and P17.0 million for the periods ended May 31, 2018, 2017 and 2016, respectively (see Note 20). As a policy, any contributions made by the University, FECSI and EACCI in the past years that were subsequently forfeited resulting from resignations of covered employees prior to vesting of their retirement pay can be applied to reduce employer contributions in the succeeding years. On April 18, 2017 and March 10, 2016, management approved the offering of Enhanced Retirement Gratuity Program (ERGP), to be implemented and paid in multiple batches, which covers eligible regular full-time faculty members and non-teaching rank-and-file and supervisory personnel. This program can be availed by all qualified and interested employees.
(ii) RCI RCI has not yet established a formal post-employment plan. However, it accrues the estimated cost of post-employment benefits, actuarially determined, required by the provisions of RA No. 7641, which is an unfunded and non-contributory post-employment defined benefit plan covering all regular full-time employees. Under RA No. 7641, RCI is required to provide minimum post-employment benefits to qualified employees. RA No. 7641, does not, however, require it to be funded.
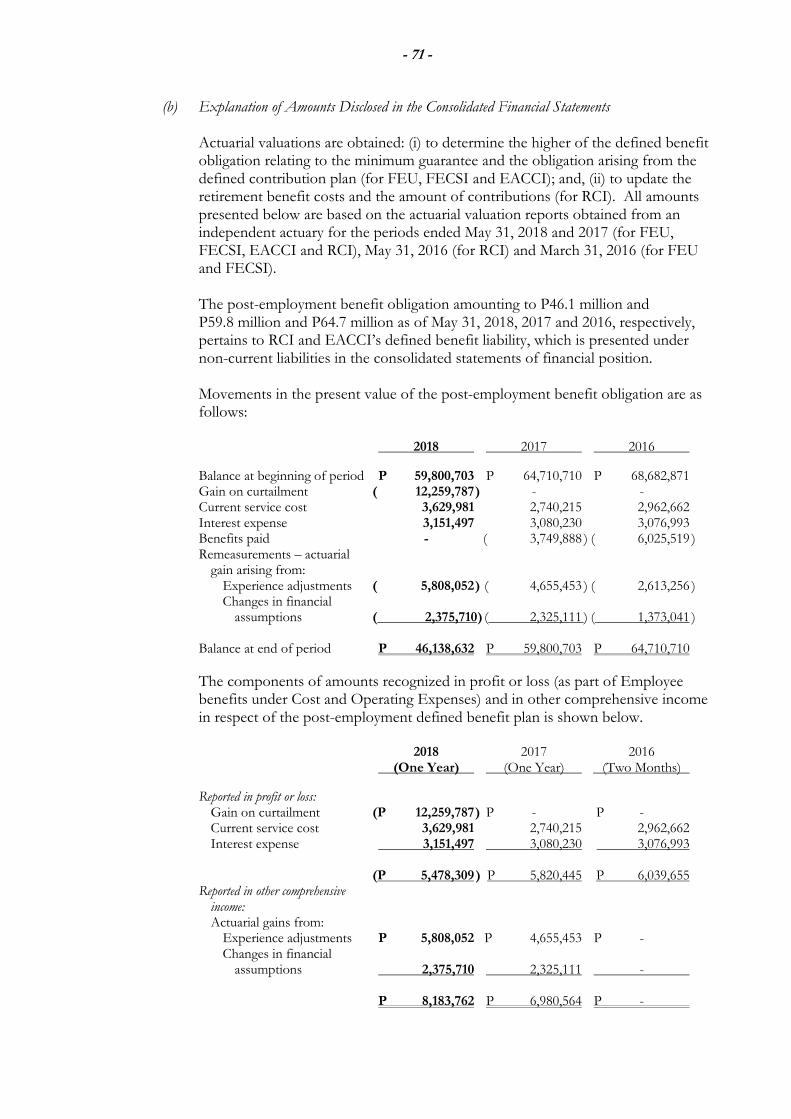
- 71 -
(b) Explanation of Amounts Disclosed in the Consolidated Financial Statements
Actuarial valuations are obtained: (i) to determine the higher of the defined benefit obligation relating to the minimum guarantee and the obligation arising from the defined contribution plan (for FEU, FECSI and EACCI); and, (ii) to update the retirement benefit costs and the amount of contributions (for RCI). All amounts presented below are based on the actuarial valuation reports obtained from an independent actuary for the periods ended May 31, 2018 and 2017 (for FEU, FECSI, EACCI and RCI), May 31, 2016 (for RCI) and March 31, 2016 (for FEU and FECSI). The post-employment benefit obligation amounting to P46.1 million and P59.8 million and P64.7 million as of May 31, 2018, 2017 and 2016, respectively, pertains to RCI and EACCI’s defined benefit liability, which is presented under non-current liabilities in the consolidated statements of financial position. Movements in the present value of the post-employment benefit obligation are as follows:
2018 2017 2016 Balance at beginning of period P 59,800,703 P 64,710,710 P 68,682,871 Gain on curtailment ( 12,259,787 ) - - Current service cost 3,629,981 2,740,215 2,962,662 Interest expense 3,151,497 3,080,230 3,076,993 Benefits paid - ( 3,749,888 ) ( 6,025,519 ) Remeasurements – actuarial gain arising from: Experience adjustments ( 5,808,052 ) ( 4,655,453 ) ( 2,613,256 ) Changes in financial assumptions ( 2,375,710 ) ( 2,325,111 ) ( 1,373,041 ) Balance at end of period P 46,138,632 P 59,800,703 P 64,710,710
The components of amounts recognized in profit or loss (as part of Employee benefits under Cost and Operating Expenses) and in other comprehensive income in respect of the post-employment defined benefit plan is shown below.
2018 2017 2016 (One Year) (One Year) (Two Months) Reported in profit or loss: Gain on curtailment (P 12,259,787 ) P - P - Current service cost 3,629,981 2,740,215 2,962,662 Interest expense 3,151,497 3,080,230 3,076,993 (P 5,478,309 ) P 5,820,445 P 6,039,655 Reported in other comprehensive income: Actuarial gains from: Experience adjustments P 5,808,052 P 4,655,453 P - Changes in financial assumptions 2,375,710 2,325,111 - P 8,183,762 P 6,980,564 P -
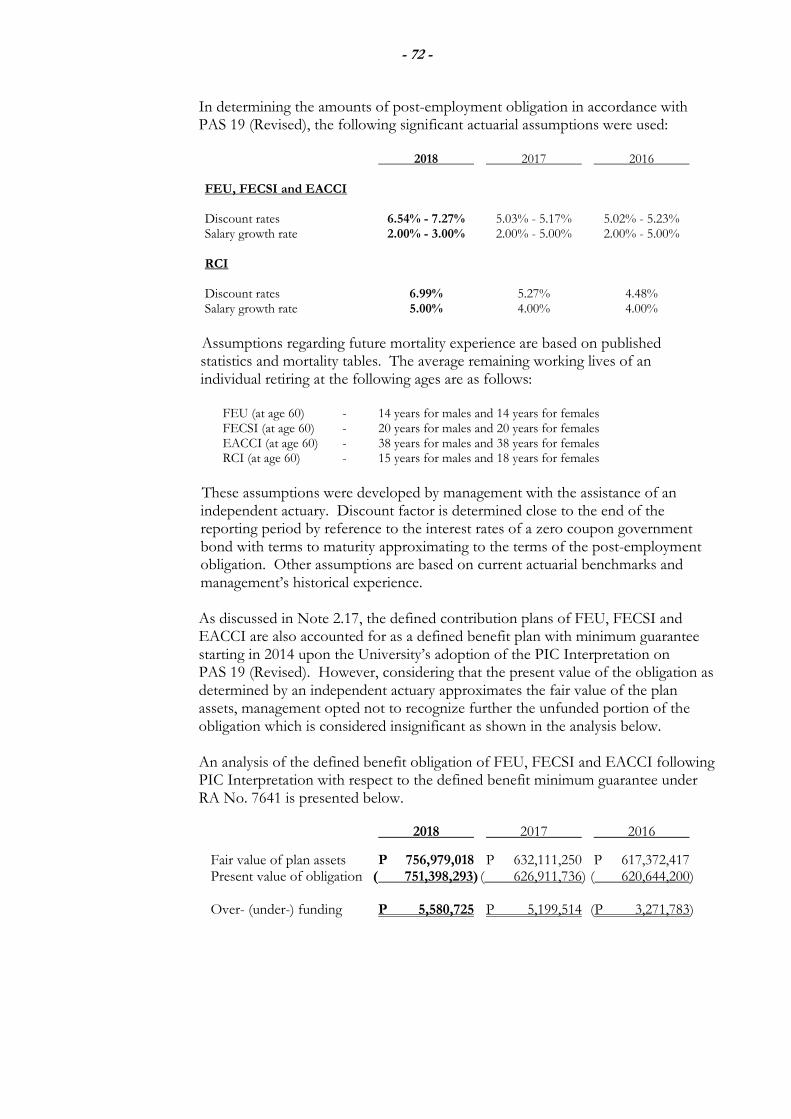
- 72 -
In determining the amounts of post-employment obligation in accordance with PAS 19 (Revised), the following significant actuarial assumptions were used:
2018 2017 2016 FEU, FECSI and EACCI
Discount rates 6.54% - 7.27% 5.03% - 5.17% 5.02% - 5.23% Salary growth rate 2.00% - 3.00% 2.00% - 5.00% 2.00% - 5.00%
RCI
Discount rates 6.99% 5.27% 4.48% Salary growth rate 5.00% 4.00% 4.00%
Assumptions regarding future mortality experience are based on published statistics and mortality tables. The average remaining working lives of an individual retiring at the following ages are as follows:
FEU (at age 60) - 14 years for males and 14 years for females FECSI (at age 60) - 20 years for males and 20 years for females EACCI (at age 60) - 38 years for males and 38 years for females RCI (at age 60) - 15 years for males and 18 years for females
These assumptions were developed by management with the assistance of an independent actuary. Discount factor is determined close to the end of the reporting period by reference to the interest rates of a zero coupon government bond with terms to maturity approximating to the terms of the post-employment obligation. Other assumptions are based on current actuarial benchmarks and management’s historical experience. As discussed in Note 2.17, the defined contribution plans of FEU, FECSI and EACCI are also accounted for as a defined benefit plan with minimum guarantee starting in 2014 upon the University’s adoption of the PIC Interpretation on PAS 19 (Revised). However, considering that the present value of the obligation as determined by an independent actuary approximates the fair value of the plan assets, management opted not to recognize further the unfunded portion of the obligation which is considered insignificant as shown in the analysis below. An analysis of the defined benefit obligation of FEU, FECSI and EACCI following PIC Interpretation with respect to the defined benefit minimum guarantee under RA No. 7641 is presented below.
2018 2017 2016
Fair value of plan assets P 756,979,018 P 632,111,250 P 617,372,417 Present value of obligation ( 751,398,293) ( 626,911,736) ( 620,644,200) Over- (under-) funding P 5,580,725 P 5,199,514 (P 3,271,783)
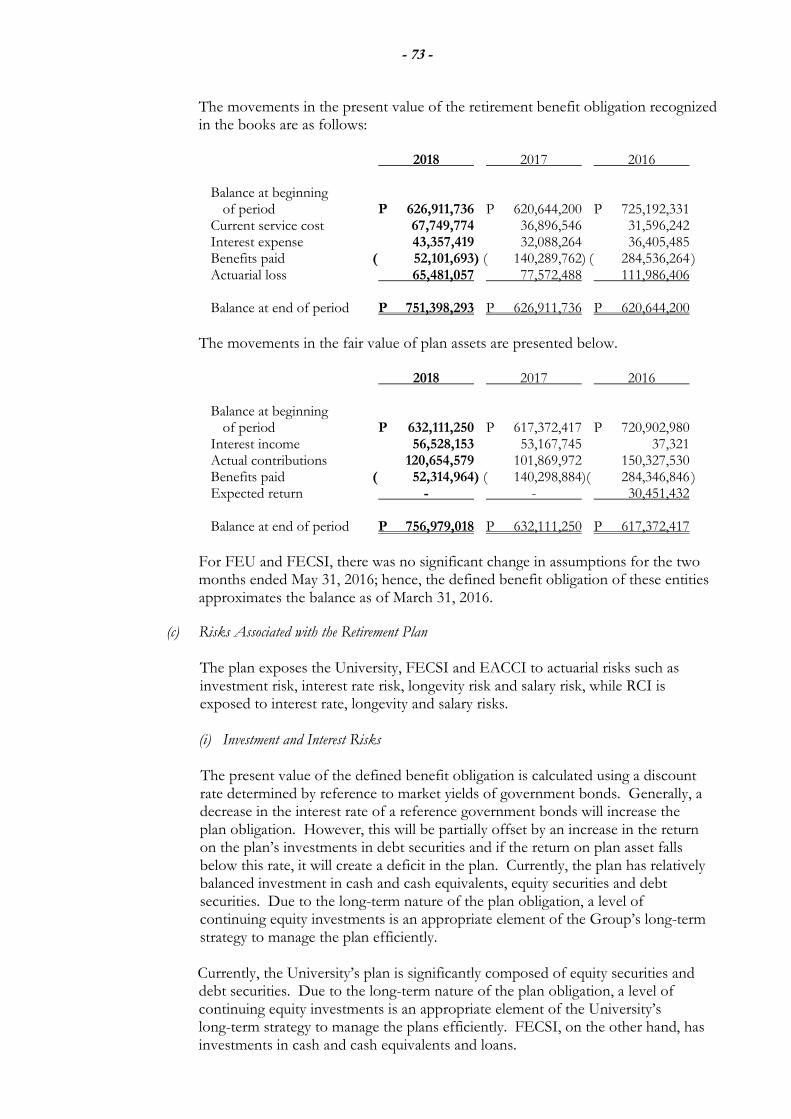
- 73 -
The movements in the present value of the retirement benefit obligation recognized in the books are as follows:
2018 2017 2016 Balance at beginning of period P 626,911,736 P 620,644,200 P 725,192,331 Current service cost 67,749,774 36,896,546 31,596,242 Interest expense 43,357,419 32,088,264 36,405,485 Benefits paid ( 52,101,693) ( 140,289,762) ( 284,536,264 ) Actuarial loss 65,481,057 77,572,488 111,986,406 Balance at end of period P 751,398,293 P 626,911,736 P 620,644,200
The movements in the fair value of plan assets are presented below. 2018 2017 2016 Balance at beginning of period P 632,111,250 P 617,372,417 P 720,902,980 Interest income 56,528,153 53,167,745 37,321 Actual contributions 120,654,579 101,869,972 150,327,530 Benefits paid ( 52,314,964) ( 140,298,884)( 284,346,846 ) Expected return - - 30,451,432 Balance at end of period P 756,979,018 P 632,111,250 P 617,372,417
For FEU and FECSI, there was no significant change in assumptions for the two months ended May 31, 2016; hence, the defined benefit obligation of these entities approximates the balance as of March 31, 2016.
(c) Risks Associated with the Retirement Plan
The plan exposes the University, FECSI and EACCI to actuarial risks such as investment risk, interest rate risk, longevity risk and salary risk, while RCI is exposed to interest rate, longevity and salary risks.
(i) Investment and Interest Risks The present value of the defined benefit obligation is calculated using a discount rate determined by reference to market yields of government bonds. Generally, a decrease in the interest rate of a reference government bonds will increase the plan obligation. However, this will be partially offset by an increase in the return on the plan’s investments in debt securities and if the return on plan asset falls below this rate, it will create a deficit in the plan. Currently, the plan has relatively balanced investment in cash and cash equivalents, equity securities and debt securities. Due to the long-term nature of the plan obligation, a level of continuing equity investments is an appropriate element of the Group’s long-term strategy to manage the plan efficiently. Currently, the University’s plan is significantly composed of equity securities and debt securities. Due to the long-term nature of the plan obligation, a level of continuing equity investments is an appropriate element of the University’s long-term strategy to manage the plans efficiently. FECSI, on the other hand, has investments in cash and cash equivalents and loans.
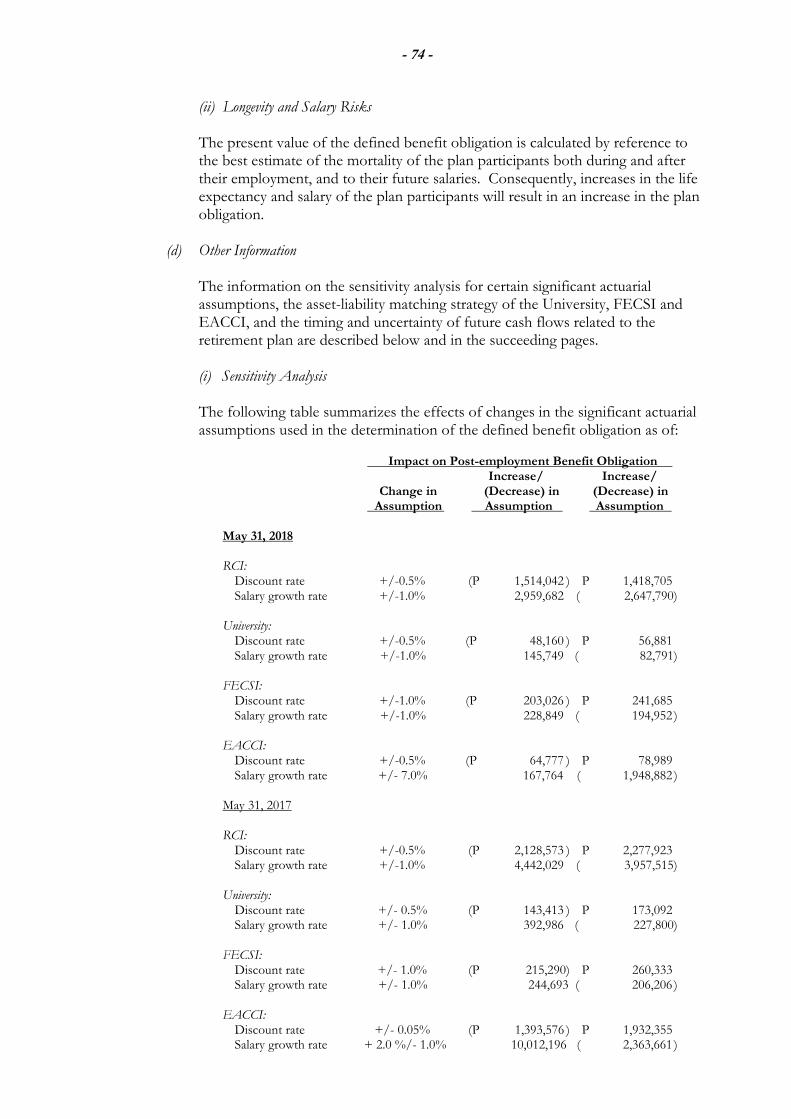
- 74 -
(ii) Longevity and Salary Risks The present value of the defined benefit obligation is calculated by reference to the best estimate of the mortality of the plan participants both during and after their employment, and to their future salaries. Consequently, increases in the life expectancy and salary of the plan participants will result in an increase in the plan obligation.
(d) Other Information
The information on the sensitivity analysis for certain significant actuarial assumptions, the asset-liability matching strategy of the University, FECSI and EACCI, and the timing and uncertainty of future cash flows related to the retirement plan are described below and in the succeeding pages.
(i) Sensitivity Analysis The following table summarizes the effects of changes in the significant actuarial assumptions used in the determination of the defined benefit obligation as of:
Impact on Post-employment Benefit Obligation Increase/ Increase/ Change in (Decrease) in (Decrease) in Assumption Assumption Assumption
May 31, 2018 RCI:
Discount rate +/-0.5% (P 1,514,042 ) P 1,418,705 Salary growth rate +/-1.0% 2,959,682 ( 2,647,790)
University: Discount rate +/-0.5% (P 48,160 ) P 56,881 Salary growth rate +/-1.0% 145,749 ( 82,791)
FECSI:
Discount rate +/-1.0% (P 203,026 ) P 241,685 Salary growth rate +/-1.0% 228,849 ( 194,952 )
EACCI:
Discount rate +/-0.5% (P 64,777 ) P 78,989 Salary growth rate +/- 7.0% 167,764 ( 1,948,882 )
May 31, 2017 RCI:
Discount rate +/-0.5% (P 2,128,573 ) P 2,277,923 Salary growth rate +/-1.0% 4,442,029 ( 3,957,515)
University: Discount rate +/- 0.5% (P 143,413 ) P 173,092 Salary growth rate +/- 1.0% 392,986 ( 227,800)
FECSI:
Discount rate +/- 1.0% (P 215,290) P 260,333 Salary growth rate +/- 1.0% 244,693 ( 206,206 )
EACCI:
Discount rate +/- 0.05% (P 1,393,576 ) P 1,932,355 Salary growth rate + 2.0 %/- 1.0% 10,012,196 ( 2,363,661 )
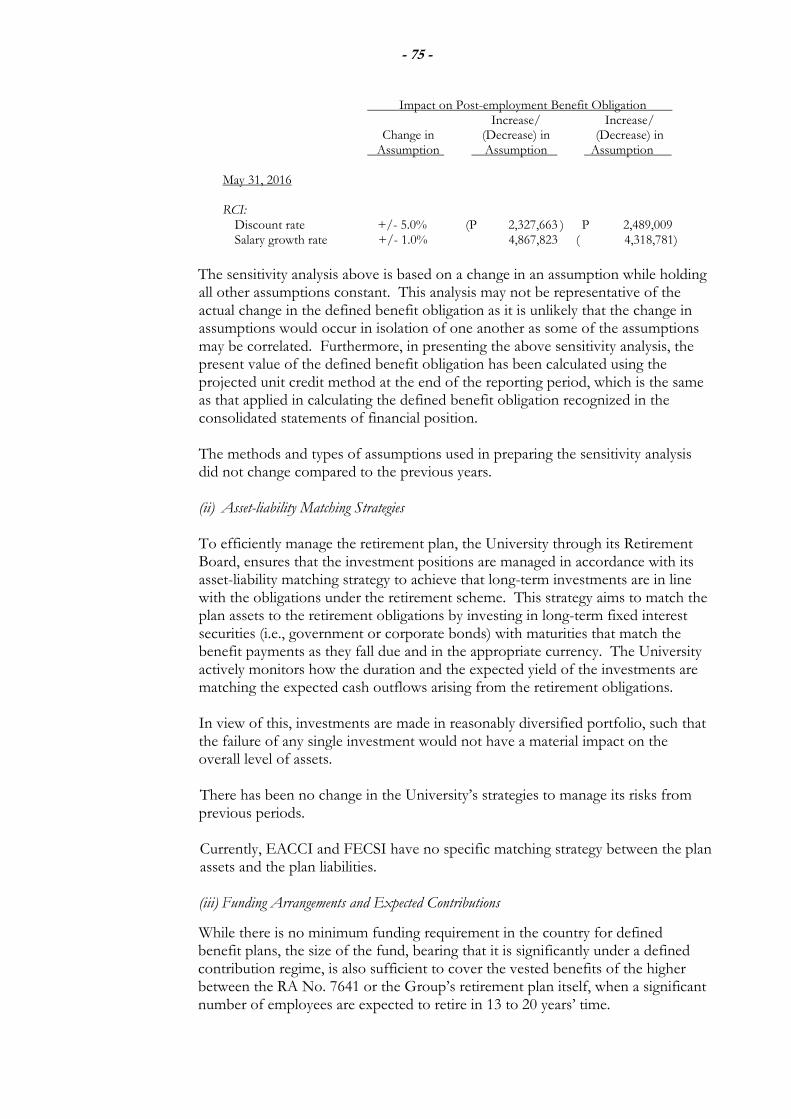
- 75 -
Impact on Post-employment Benefit Obligation Increase/ Increase/ Change in (Decrease) in (Decrease) in Assumption Assumption Assumption
May 31, 2016 RCI:
Discount rate +/- 5.0% (P 2,327,663 ) P 2,489,009 Salary growth rate +/- 1.0% 4,867,823 ( 4,318,781)
The sensitivity analysis above is based on a change in an assumption while holding all other assumptions constant. This analysis may not be representative of the actual change in the defined benefit obligation as it is unlikely that the change in assumptions would occur in isolation of one another as some of the assumptions may be correlated. Furthermore, in presenting the above sensitivity analysis, the present value of the defined benefit obligation has been calculated using the projected unit credit method at the end of the reporting period, which is the same as that applied in calculating the defined benefit obligation recognized in the consolidated statements of financial position. The methods and types of assumptions used in preparing the sensitivity analysis did not change compared to the previous years.
(ii) Asset-liability Matching Strategies
To efficiently manage the retirement plan, the University through its Retirement Board, ensures that the investment positions are managed in accordance with its asset-liability matching strategy to achieve that long-term investments are in line with the obligations under the retirement scheme. This strategy aims to match the plan assets to the retirement obligations by investing in long-term fixed interest securities (i.e., government or corporate bonds) with maturities that match the benefit payments as they fall due and in the appropriate currency. The University actively monitors how the duration and the expected yield of the investments are matching the expected cash outflows arising from the retirement obligations. In view of this, investments are made in reasonably diversified portfolio, such that the failure of any single investment would not have a material impact on the overall level of assets.
There has been no change in the University’s strategies to manage its risks from previous periods.
Currently, EACCI and FECSI have no specific matching strategy between the plan assets and the plan liabilities.
(iii) Funding Arrangements and Expected Contributions
While there is no minimum funding requirement in the country for defined benefit plans, the size of the fund, bearing that it is significantly under a defined contribution regime, is also sufficient to cover the vested benefits of the higher between the RA No. 7641 or the Group’s retirement plan itself, when a significant number of employees are expected to retire in 13 to 20 years’ time.

- 76 -
The University and EACCI expect to make contribution of P72.2 million and P2.5 million, respectively, to their plans during the next reporting period; FECSI does not expect to make contributions to its plan during the next reporting period; while, RCI’s management is yet to determine when it shall establish a formal plan to fund its post-employment benefit obligation.
The maturity profile of RCI’s undiscounted expected benefit payments from the plan as of May 31 is as follows:
2018 2017 2016
Within one year P 12,374,536 P 12,795,781 P 13,413,977 More than one year to five years 15,843,602 19,806,814 19,415,126 More than five years to 10 years 37,605,296 45,933,146 40,401,969 More than 10 years to 15 years 26,393,563 35,039,845 43,965,111 More than 15 years to 20 years 32,395,065 39,432,879 28,525,864 More than 20 years 164,604,710 132,776,132 96,613,621 P 289,216,772 P 285,784,597 P 242,335,668
The weighted average duration of RCI’s defined benefit obligation at the end of the reporting period is 15 years.
The latest available audited statements of financial position of the University’s Fund, which comprised of both employer and employee share contributions, show the following as of December 31:
2017 2016 Assets Cash and cash equivalents P 29,628,252 P 61,546,204 Receivables - net 47,623,046 49,445,707
Investment in debt securities: Corporate bonds and other debt instruments 290,708,947 306,961,487 Government securities 117,339,580 133,933,153 Investment in equity securities: Equity securities 367,638,346 234,275,091 UITF 81,764,716 73,402,231 Mutual funds 12,731,282 10,176,639 Investment in long term certificate of deposits - 4,442,956 Others 124,147 53,511 947,558,316 874,236,979 Liabilities ( 23,228,158 ) ( 9,802,728 ) Net Assets Available for Plan Benefits P 924,330,158 P 864,434,251
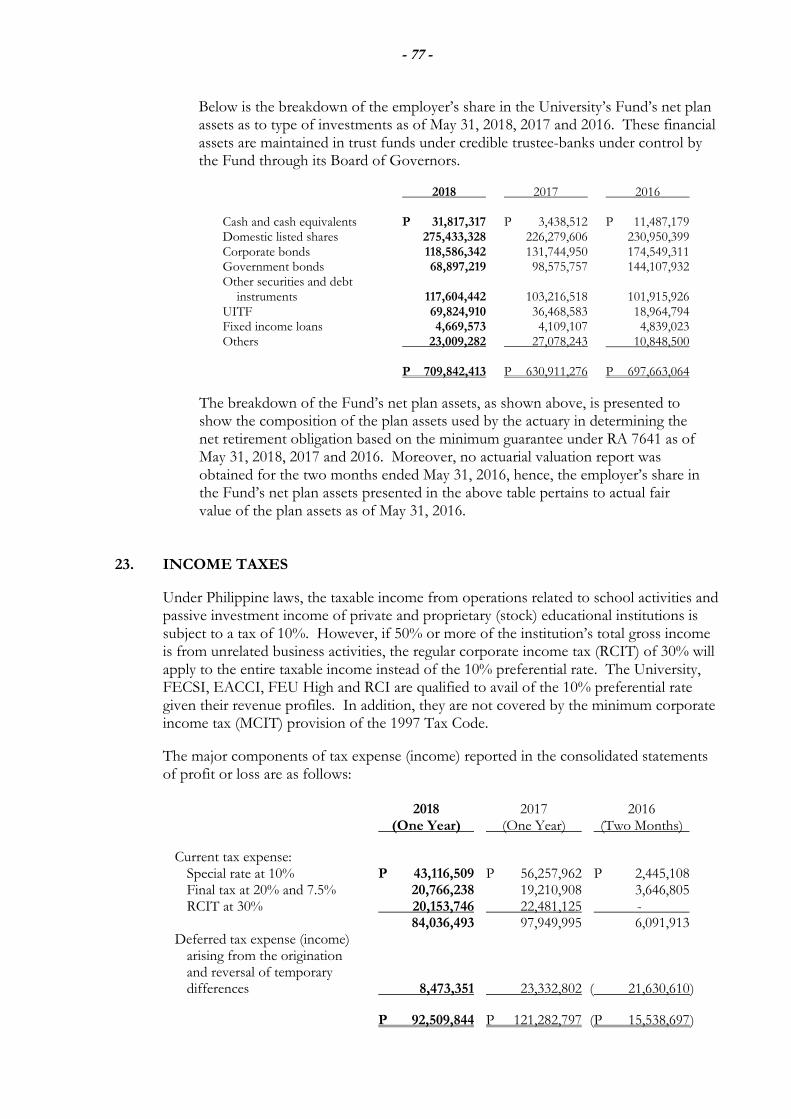
- 77 -
Below is the breakdown of the employer’s share in the University’s Fund’s net plan assets as to type of investments as of May 31, 2018, 2017 and 2016. These financial assets are maintained in trust funds under credible trustee-banks under control by the Fund through its Board of Governors.
2018 2017 2016 Cash and cash equivalents P 31,817,317 P 3,438,512 P 11,487,179 Domestic listed shares 275,433,328 226,279,606 230,950,399 Corporate bonds 118,586,342 131,744,950 174,549,311 Government bonds 68,897,219 98,575,757 144,107,932 Other securities and debt instruments 117,604,442 103,216,518 101,915,926 UITF 69,824,910 36,468,583 18,964,794 Fixed income loans 4,669,573 4,109,107 4,839,023 Others 23,009,282 27,078,243 10,848,500 P 709,842,413 P 630,911,276 P 697,663,064
The breakdown of the Fund’s net plan assets, as shown above, is presented to show the composition of the plan assets used by the actuary in determining the net retirement obligation based on the minimum guarantee under RA 7641 as of May 31, 2018, 2017 and 2016. Moreover, no actuarial valuation report was obtained for the two months ended May 31, 2016, hence, the employer’s share in the Fund’s net plan assets presented in the above table pertains to actual fair value of the plan assets as of May 31, 2016.
23. INCOME TAXES
Under Philippine laws, the taxable income from operations related to school activities and passive investment income of private and proprietary (stock) educational institutions is subject to a tax of 10%. However, if 50% or more of the institution’s total gross income is from unrelated business activities, the regular corporate income tax (RCIT) of 30% will apply to the entire taxable income instead of the 10% preferential rate. The University, FECSI, EACCI, FEU High and RCI are qualified to avail of the 10% preferential rate given their revenue profiles. In addition, they are not covered by the minimum corporate income tax (MCIT) provision of the 1997 Tax Code.
The major components of tax expense (income) reported in the consolidated statements of profit or loss are as follows:
2018 2017 2016 (One Year) (One Year) (Two Months)
Current tax expense: Special rate at 10% P 43,116,509 P 56,257,962 P 2,445,108 Final tax at 20% and 7.5% 20,766,238 19,210,908 3,646,805 RCIT at 30% 20,153,746 22,481,125 - 84,036,493 97,949,995 6,091,913 Deferred tax expense (income) arising from the origination and reversal of temporary differences 8,473,351 23,332,802 ( 21,630,610 )
P 92,509,844 P 121,282,797 (P 15,538,697 )
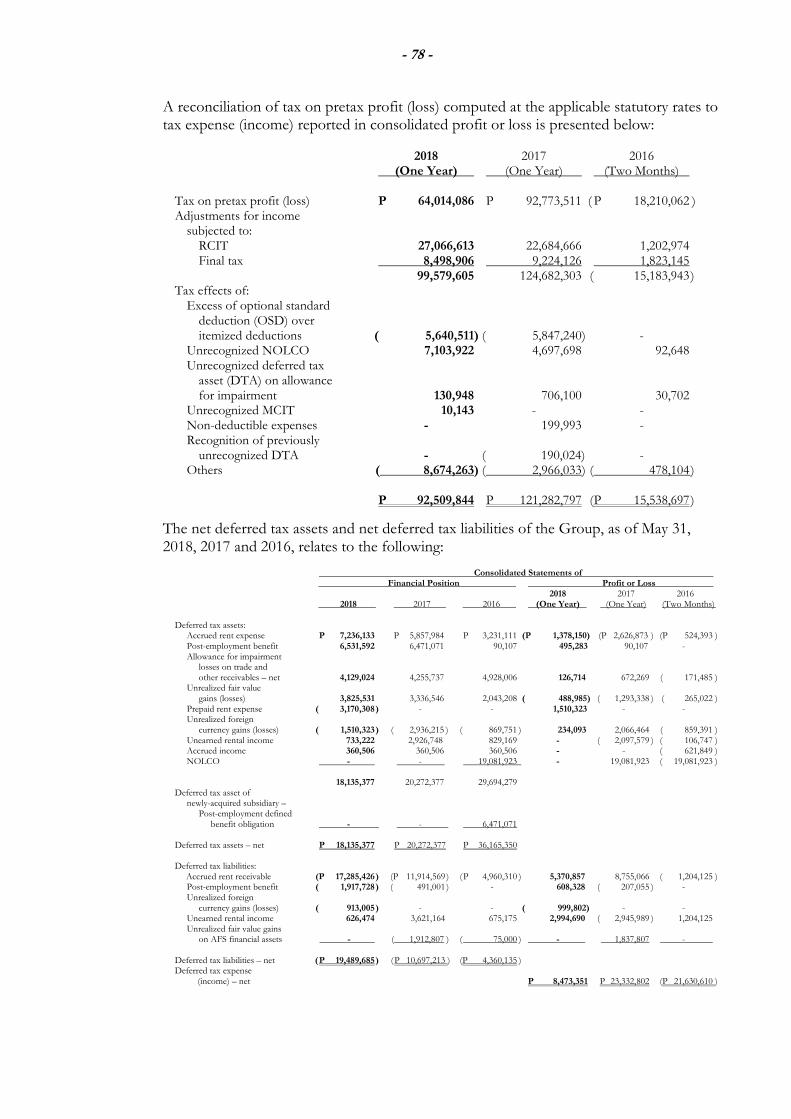
- 78 -
A reconciliation of tax on pretax profit (loss) computed at the applicable statutory rates to tax expense (income) reported in consolidated profit or loss is presented below:
2018 2017 2016 (One Year) (One Year) (Two Months) Tax on pretax profit (loss) P 64,014,086 P 92,773,511 ( P 18,210,062 ) Adjustments for income subjected to: RCIT 27,066,613 22,684,666 1,202,974 Final tax 8,498,906 9,224,126 1,823,145 99,579,605 124,682,303 ( 15,183,943 ) Tax effects of: Excess of optional standard deduction (OSD) over itemized deductions ( 5,640,511) ( 5,847,240) - Unrecognized NOLCO 7,103,922 4,697,698 92,648 Unrecognized deferred tax asset (DTA) on allowance for impairment 130,948 706,100 30,702 Unrecognized MCIT 10,143 - - Non-deductible expenses - 199,993 - Recognition of previously
unrecognized DTA - ( 190,024) - Others ( 8,674,263) ( 2,966,033) ( 478,104 ) P 92,509,844 P 121,282,797 ( P 15,538,697 )
The net deferred tax assets and net deferred tax liabilities of the Group, as of May 31, 2018, 2017 and 2016, relates to the following:
Consolidated Statements of Financial Position Profit or Loss 2018 2017 2016 2018 2017 2016 (One Year) (One Year) (Two Months) Deferred tax assets: Accrued rent expense P 7,236,133 P 5,857,984 P 3,231,111 (P 1,378,150) (P 2,626,873 ) (P 524,393 ) Post-employment benefit 6,531,592 6,471,071 90,107 495,283 90,107 - Allowance for impairment losses on trade and other receivables – net 4,129,024 4,255,737 4,928,006 126,714 672,269 ( 171,485 ) Unrealized fair value gains (losses) 3,825,531 3,336,546 2,043,208 ( 488,985) ( 1,293,338 ) ( 265,022 ) Prepaid rent expense ( 3,170,308 ) - - 1,510,323 - - Unrealized foreign currency gains (losses) ( 1,510,323 ) ( 2,936,215 ) ( 869,751 ) 234,093 2,066,464 ( 859,391 ) Unearned rental income 733,222 2,926,748 829,169 - ( 2,097,579 ) ( 106,747 ) Accrued income 360,506 360,506 360,506 - - ( 621,849 ) NOLCO - - 19,081,923 - 19,081,923 ( 19,081,923 ) 18,135,377 20,272,377 29,694,279 Deferred tax asset of newly-acquired subsidiary – Post-employment defined benefit obligation - - 6,471,071 Deferred tax assets – net P 18,135,377 P 20,272,377 P 36,165,350 Deferred tax liabilities: Accrued rent receivable (P 17,285,426 ) (P 11,914,569 ) ( P 4,960,310 ) 5,370,857 8,755,066 ( 1,204,125 ) Post-employment benefit ( 1,917,728 ) ( 491,001 ) - 608,328 ( 207,055 ) - Unrealized foreign currency gains (losses) ( 913,005 ) - - ( 999,802) - - Unearned rental income 626,474 3,621,164 675,175 2,994,690 ( 2,945,989 ) 1,204,125 Unrealized fair value gains on AFS financial assets - ( 1,912,807 ) ( 75,000 ) - 1,837,807 - Deferred tax liabilities – net ( P 19,489,685 ) ( P 10,697,213 ) (P 4,360,135 ) Deferred tax expense (income) – net P 8,473,351 P 23,332,802 (P 21,630,610 )
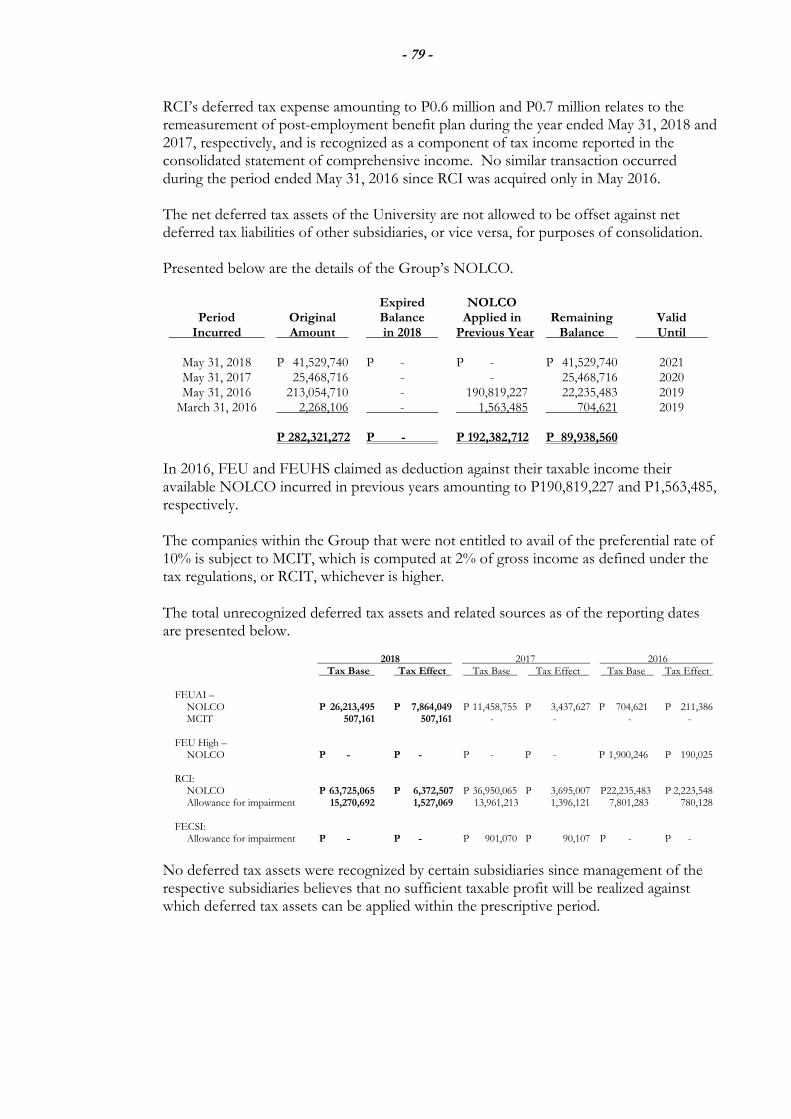
- 79 -
RCI’s deferred tax expense amounting to P0.6 million and P0.7 million relates to the remeasurement of post-employment benefit plan during the year ended May 31, 2018 and 2017, respectively, and is recognized as a component of tax income reported in the consolidated statement of comprehensive income. No similar transaction occurred during the period ended May 31, 2016 since RCI was acquired only in May 2016. The net deferred tax assets of the University are not allowed to be offset against net deferred tax liabilities of other subsidiaries, or vice versa, for purposes of consolidation.
Presented below are the details of the Group’s NOLCO.
Expired NOLCO Period Original Balance Applied in Remaining Valid Incurred Amount in 2018 Previous Year Balance Until May 31, 2018 P 41,529,740 P - P - P 41,529,740 2021 May 31, 2017 25,468,716 - - 25,468,716 2020 May 31, 2016 213,054,710 - 190,819,227 22,235,483 2019 March 31, 2016 2,268,106 - 1,563,485 704,621 2019 P 282,321,272 P - P 192,382,712 P 89,938,560
In 2016, FEU and FEUHS claimed as deduction against their taxable income their available NOLCO incurred in previous years amounting to P190,819,227 and P1,563,485, respectively. The companies within the Group that were not entitled to avail of the preferential rate of 10% is subject to MCIT, which is computed at 2% of gross income as defined under the tax regulations, or RCIT, whichever is higher.
The total unrecognized deferred tax assets and related sources as of the reporting dates are presented below. 2018 2017 2016
Tax Base Tax Effect Tax Base Tax Effect Tax Base Tax Effect FEUAI – NOLCO P 26,213,495 P 7,864,049 P 11,458,755 P 3,437,627 P 704,621 P 211,386 MCIT 507,161 507,161 - - - - FEU High – NOLCO P - P - P - P - P 1,900,246 P 190,025 RCI: NOLCO P 63,725,065 P 6,372,507 P 36,950,065 P 3,695,007 P22,235,483 P 2,223,548 Allowance for impairment 15,270,692 1,527,069 13,961,213 1,396,121 7,801,283 780,128 FECSI: Allowance for impairment P - P - P 901,070 P 90,107 P - P -
No deferred tax assets were recognized by certain subsidiaries since management of the respective subsidiaries believes that no sufficient taxable profit will be realized against which deferred tax assets can be applied within the prescriptive period.
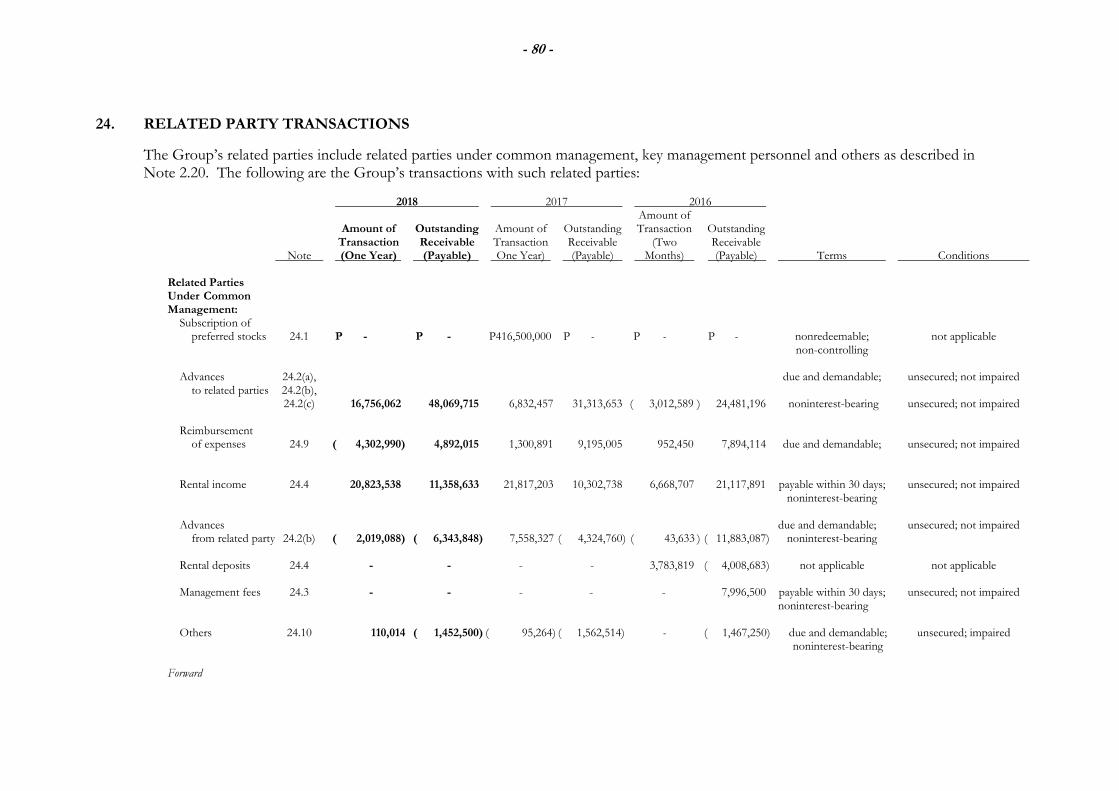
- 80 -
24. RELATED PARTY TRANSACTIONS
The Group’s related parties include related parties under common management, key management personnel and others as described in Note 2.20. The following are the Group’s transactions with such related parties:
2018 2017 2016 Amount of Amount of Outstanding Amount of Outstanding Transaction Outstanding Transaction Receivable Transaction Receivable (Two Receivable Note (One Year) (Payable) One Year) (Payable) Months) (Payable) Terms Conditions Related Parties Under Common Management: Subscription of preferred stocks 24.1 P - P - P416,500,000 P - P - P - nonredeemable; not applicable non-controlling Advances 24.2(a), due and demandable; unsecured; not impaired to related parties 24.2(b), 24.2(c) 16,756,062 48,069,715 6,832,457 31,313,653 ( 3,012,589 ) 24,481,196 noninterest-bearing unsecured; not impaired Reimbursement of expenses 24.9 ( 4,302,990) 4,892,015 1,300,891 9,195,005 952,450 7,894,114 due and demandable; unsecured; not impaired Rental income 24.4 20,823,538 11,358,633 21,817,203 10,302,738 6,668,707 21,117,891 payable within 30 days; unsecured; not impaired noninterest-bearing Advances due and demandable; unsecured; not impaired from related party 24.2(b) ( 2,019,088) ( 6,343,848) 7,558,327 ( 4,324,760) ( 43,633 ) ( 11,883,087) noninterest-bearing Rental deposits 24.4 - - - - 3,783,819 ( 4,008,683) not applicable not applicable Management fees 24.3 - - - - - 7,996,500 payable within 30 days; unsecured; not impaired noninterest-bearing Others 24.10 110,014 ( 1,452,500) ( 95,264) ( 1,562,514) - ( 1,467,250) due and demandable; unsecured; impaired noninterest-bearing Forward
- 80 -
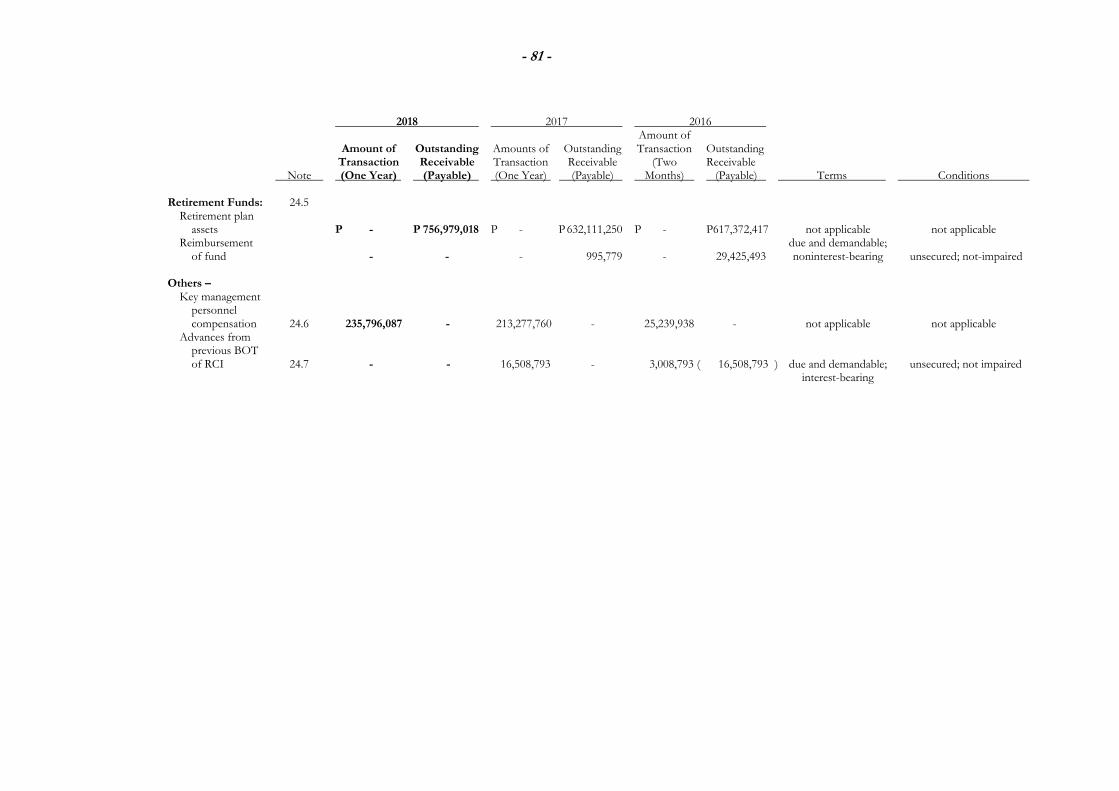
- 81 -
2018 2017 2016 Amount of Amount of Outstanding Amounts of Outstanding Transaction Outstanding Transaction Receivable Transaction Receivable (Two Receivable Note (One Year) (Payable) (One Year) (Payable) Months) (Payable) Terms Conditions Retirement Funds: 24.5 Retirement plan assets P - P 756,979,018 P - P 632,111,250 P - P617,372,417 not applicable not applicable Reimbursement due and demandable; of fund - - - 995,779 - 29,425,493 noninterest-bearing unsecured; not-impaired Others – Key management personnel compensation 24.6 235,796,087 - 213,277,760 - 25,239,938 - not applicable not applicable Advances from previous BOT of RCI 24.7 - - 16,508,793 - 3,008,793 ( 16,508,793 ) due and demandable; unsecured; not impaired interest-bearing
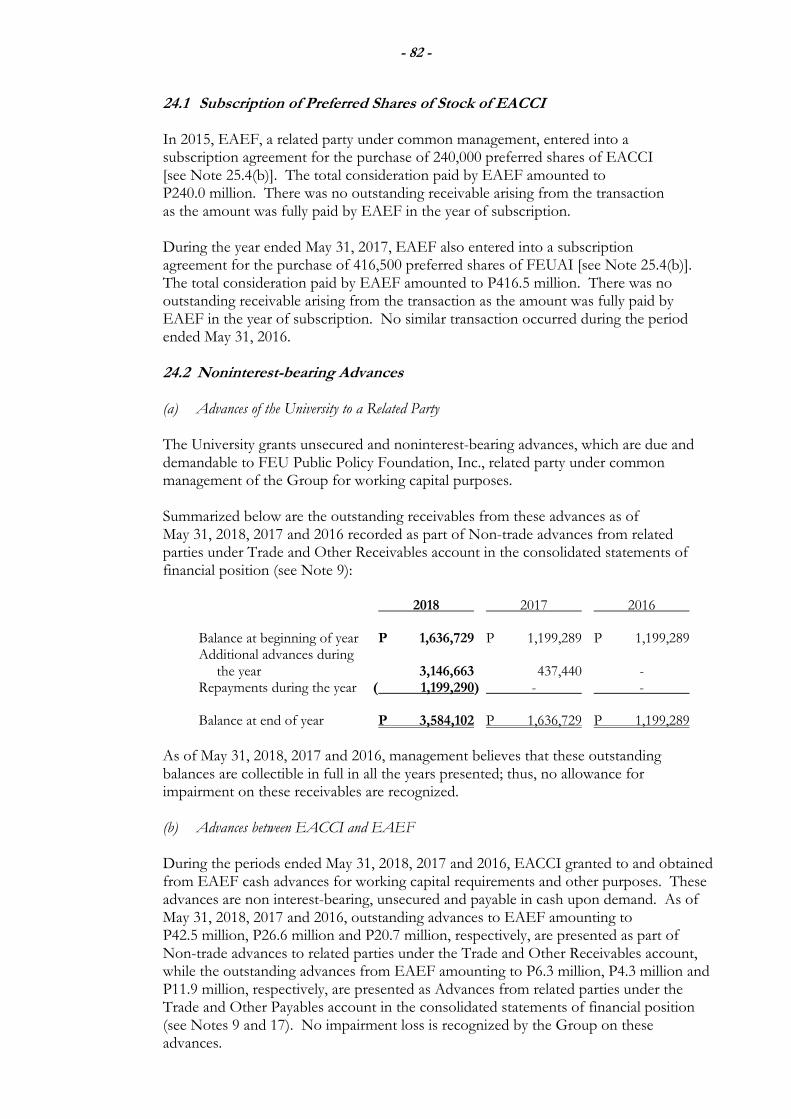
- 82 -
24.1 Subscription of Preferred Shares of Stock of EACCI
In 2015, EAEF, a related party under common management, entered into a subscription agreement for the purchase of 240,000 preferred shares of EACCI [see Note 25.4(b)]. The total consideration paid by EAEF amounted to P240.0 million. There was no outstanding receivable arising from the transaction as the amount was fully paid by EAEF in the year of subscription. During the year ended May 31, 2017, EAEF also entered into a subscription agreement for the purchase of 416,500 preferred shares of FEUAI [see Note 25.4(b)]. The total consideration paid by EAEF amounted to P416.5 million. There was no outstanding receivable arising from the transaction as the amount was fully paid by EAEF in the year of subscription. No similar transaction occurred during the period ended May 31, 2016.
24.2 Noninterest-bearing Advances (a) Advances of the University to a Related Party The University grants unsecured and noninterest-bearing advances, which are due and demandable to FEU Public Policy Foundation, Inc., related party under common management of the Group for working capital purposes. Summarized below are the outstanding receivables from these advances as of May 31, 2018, 2017 and 2016 recorded as part of Non-trade advances from related parties under Trade and Other Receivables account in the consolidated statements of financial position (see Note 9):
2018 2017 2016 Balance at beginning of year P 1,636,729 P 1,199,289 P 1,199,289 Additional advances during the year 3,146,663 437,440 - Repayments during the year ( 1,199,290) - - Balance at end of year P 3,584,102 P 1,636,729 P 1,199,289
As of May 31, 2018, 2017 and 2016, management believes that these outstanding balances are collectible in full in all the years presented; thus, no allowance for impairment on these receivables are recognized.
(b) Advances between EACCI and EAEF
During the periods ended May 31, 2018, 2017 and 2016, EACCI granted to and obtained from EAEF cash advances for working capital requirements and other purposes. These advances are non interest-bearing, unsecured and payable in cash upon demand. As of May 31, 2018, 2017 and 2016, outstanding advances to EAEF amounting to P42.5 million, P26.6 million and P20.7 million, respectively, are presented as part of Non-trade advances to related parties under the Trade and Other Receivables account, while the outstanding advances from EAEF amounting to P6.3 million, P4.3 million and P11.9 million, respectively, are presented as Advances from related parties under the Trade and Other Payables account in the consolidated statements of financial position (see Notes 9 and 17). No impairment loss is recognized by the Group on these advances.
- 82 -
- 83 -
(c) Advances of RCI to its Related Party RCI grants noninterest-bearing and unsecured advances to Roosevelt College Center for Teacher Education, a related party under common management, for working capital purposes. These advances are generally collectible in cash and are due upon demand or through offsetting arrangement. The outstanding balance from these transactions which amounts to P2.0 million, P3.0 million and P2.7 million as of May 31, 2018, 2017 and 2016, respectively, are presented as part of Non-trade advances to related parties under the Trade and Other Receivables account in the consolidated statements of financial position (see Note 9).
24.3 Management Services The University provided management services to EAEF and FERN College, which agreed to pay management fee computed at a certain percentage of the latter’s gross revenue subject to certain conditions. Management fees earned amounted to P20.4 million for the period ended March 31, 2016 and is presented as Management Fees under Revenues in the consolidated statements of profit or loss. No similar income was earned for the periods ended May 31, 2017 and 2016 as EACCI already took over the operations of EAEF during the said periods.
Outstanding receivables arising from this transaction amounted to P8.0 million and as of May 31, 2016 (nil as of May 31, 2017) and are presented as part of Management fee receivable under Trade and Other Receivables account in the consolidated statements of financial position (see Note 9). No impairment loss is recognized by the University on these receivables. 24.4 Leases
(a) Lease of Buildings to EAEF The University leased out certain buildings to EAEF for a period of one to five years until May 31, 2015. Upon expiration of the term of the contract, the University and EAEF had mutually agreed not to renew such lease agreement. Instead, as of May 31, 2018, 2017 and 2016, only certain floors of the buildings were leased out to EAEF. Total rental income earned by the University and EACCI from EAEF, presented as part of Rental under Revenues in the consolidated statements of profit or loss, amounted to P2.8 million and P6.7 million for the periods ended May 31, 2017 and 2016, respectively. Outstanding receivable arising from the transaction amounted to P2.9 million, P3.3 million and P17.0 million as of May 31, 2018, 2017 and 2016, respectively, and is presented as Rental receivable under Trade and Other Receivables account in the consolidated statement of financial position (see Note 9). There was no similar transaction in 2018 as EAEF has already transferred its students to EACCI through a memorandum of agreement in 2017.
- 84 -
Meanwhile, since the construction of the school building of EACCI was fully completed as of March 31, 2015, EAEF and EACCI entered into a contract to lease certain floors of EACCI’s newly-constructed school building (see Note 15). The lease commenced on July 1, 2014 for a period of five years with 5% annual escalation. However, in May 2016, the lease agreement was pre-terminated. Accordingly, EACCI reversed the related accrued rent receivable arising from straight line recognition of lease amounting to P7.0 million and is recorded as part of General expenses under costs and Operating Expenses in the 2016 consolidated statement of profit or loss (see Note 20).
(b) Lease of Buildings to FERN College
FRC leased out certain buildings to FERN College effective from June 1, 2007 to May 31, 2017 for an annual rental of P14.0 million or 10% of gross annual revenue, whichever is higher. In January 2013, an amended lease agreement was executed by both parties which stated that the lease term shall now be from January 31, 2013 to December 31, 2023 for an annual rental fee of P12.0 million or 10% of FERN College’s annual gross income, whichever is higher. Total rental income of FRC from FERN College amounted to P19.4 million and P18.0 million for the years ended May 31, 2018 and 2017, which is recorded as part of Rental under Revenues in the consolidated statements of profit or loss. No similar income was earned during the two months ended May 31, 2016. Outstanding receivables from this transaction amount to P8.4 million, P7.0 million and P4.1 million as of May 31, 2018, 2017 and 2016, respectively, are presented as part of Rental receivable under the Trade and Other Receivables account in the consolidated statements of financial position (see Note 9). No impairment loss is recognized by the Group on this receivable from FERN College. (c) Lease of Transportation Vehicle to FERN College
In 2012, FRC entered into a contract with FERN College for the lease of a bus to the latter for a fixed monthly rental of P0.1 million covering a term of five years. The rental income earned from this transaction amounted to P1.4 million and P1.5 million for the years ended May 31, 2018 and 2017 and is presented as part of Rental under Revenues in the consolidated statements of profit or loss. No similar income was earned during the two months ended May 31, 2016. The Group recognized unearned rental income in accordance with PAS 17 from FERN College amounting to P0.1 million and P0.9 million as of May 31, 2017 and 2016 (nil in 2018), respectively, and are presented as part of the Deferred Revenues account in the consolidated statements of financial position.
(d) Rental Deposits
Outstanding rental deposits arose from the lease of building by EACCI to EAEF, which amounted to P4.0 million as of May 31, 2016. These deposits are presented as part of Other Non-Current Liabilities account in the consolidated statements of financial position.
- 85 -
24.5 Retirement Funds
The University’s, FECSI’s and EACCI’s retirement funds are in the form of trustee-banks managed accounts. The fair value of the University’s retirement plan assets amounted to P757.0 million, P632.1 million and P617.4 million as of May 31, 2018, 2017 and 2016, respectively [(see Note 22(b)]. The University, FECSI and EACCI have no transactions with the retirement plans other than contributions and benefit payments in all periods presented.
During the periods ended May 31, 2017 and 2016, the University funded the retirement pay of certain employees who availed of the ERGP [see Note 22(a)(i)], which will be reimbursed by the Fund. The outstanding receivable from this transaction amounted to P1.0 million and P29.4 million as of May 31, 2017 and 2016, respectively, and is recorded as part of Non-trade advances from related parties under Trade and Other Receivables account in the consolidated statements of financial position (see Note 9). No similar transaction occurred for the year ended May 31, 2018. None of the retirement plan assets are invested in or provided to the University or FECSI, their related parties, and to their officers in the form of advances or loans.
The retirement funds neither provide any guarantee nor surety for any obligation of the University and FECSI. 24.6 Key Management Personnel Compensation
Total remunerations of the Group’s key management personnel for the periods ended May 31, 2018, 2017 and 2016, which are presented as part of Instructional and academic and Administrative expenses under Costs and Operating Expenses in the consolidated statement of profit or loss (see Note 20), are as follows:
2018 2017 2016 (One Year) (One Year) (Two Months)
Short-term benefits P 208,947,101 P 188,323,195 P 21,511,998 Post-employment benefits 26,848,986 24,954,565 3,727,940
P 235,796,087 P 213,277,760 P 25,239,938
24.7 Advances from RCI’s BOT RCI obtains unsecured, interest-bearing cash advances from the current members of its BOT, with an interest rate ranging from 8% to 12% per annum, for working capital purposes. These advances are generally collectible in cash and are due upon demand. The outstanding balance from this transaction amounted to P16.5 million as of May 31, 2016, and is presented as part of Other payables under the Trade and Other Payables account in the consolidated statement of financial position. The outstanding payable was settled in 2017.
- 86 -
24.8 Financial Guaranty for Subsidiaries’ Loans In March 2017, the BOT approved that for and in consideration of the loan or credit facilities obtained by any subsidiary of the University, in which the University owns at least 75% of the outstanding voting capital stock of such subsidiary, from a local commercial bank, the University gives its full consent and authority to act as surety for the subsidiary’s obligations arising from any loan or availments from any credit facilities granted by the said local bank in favor of the subsidiary, as well as any renewals, increases, extensions of existing obligations obtained by or which may hereafter be obtained by the subsidiary from the local bank, whether direct or indirect, principal or secondary. In April 2018, RCI availed an unsecured term loan as a drawdown from the University’s credit facility with the local bank (see Note 18).
24.9 Reimbursement of Expenses
During the periods ended May 31, 2017 and 2016 (nil in 2018), the University billed EAEF for related services such as security and janitorial services, light and water and other utilities at cost. Accordingly, the outstanding receivable amounting to P4.9 million, P9.2 million and P7.9 million as of May 31, 2018, 2017 and 2016, respectively, is presented as part of Non-trade advances to related parties under the Trade and Other Receivables account in the consolidated statements of financial position (see Note 9).
24.10 Others Others include amounts due to non-controlling interest for to the unclaimed payments arising from the fractional shares, treated as treasury stocks in 2007 and 2015 by FRC. Outstanding payable to non-controlling interest amounted to P1.5 million as of May 31, 2018, 2017 and 2016, and is presented as part of Other payables to related parties under the Trade and Other Payables account in the consolidated statements of financial position (see Note 17).
25. EQUITY
25.1 Capital Stock
As of May 31, 2018, 2017 and 2016, the University has 20,000,000 shares of authorized capital stock, of which 16,425,387, 16,431,159 and 16,444,038 during the periods ended May 31, 2018, 2017 and 2016, respectively, were issued and outstanding, with par value of P100 per share.
On July 11, 1986, the SEC approved the listing of the University’s common shares, its only listed securities, at an offer price of P100 per share. As of May 31, 2018, 2017 and 2016, there are 16,514,354 listed shares which include those held in treasury and shares held by the University’s related parties. The University has a total of 10,970,623, 10,834,034 and 10,816,929 listed shares, which is equivalent to 66.58%, 65.75% and 65.64%, held by related parties as at May 31, 2018, 2017 and 2016, respectively, while there are 5,506,400, 5,642,989 and 5,660,754 listed shares owned by the public which is equivalent to 33.42%, 34.25% and 34.36% of the total outstanding shares as at May 31, 2018, 2017 and 2016, respectively.
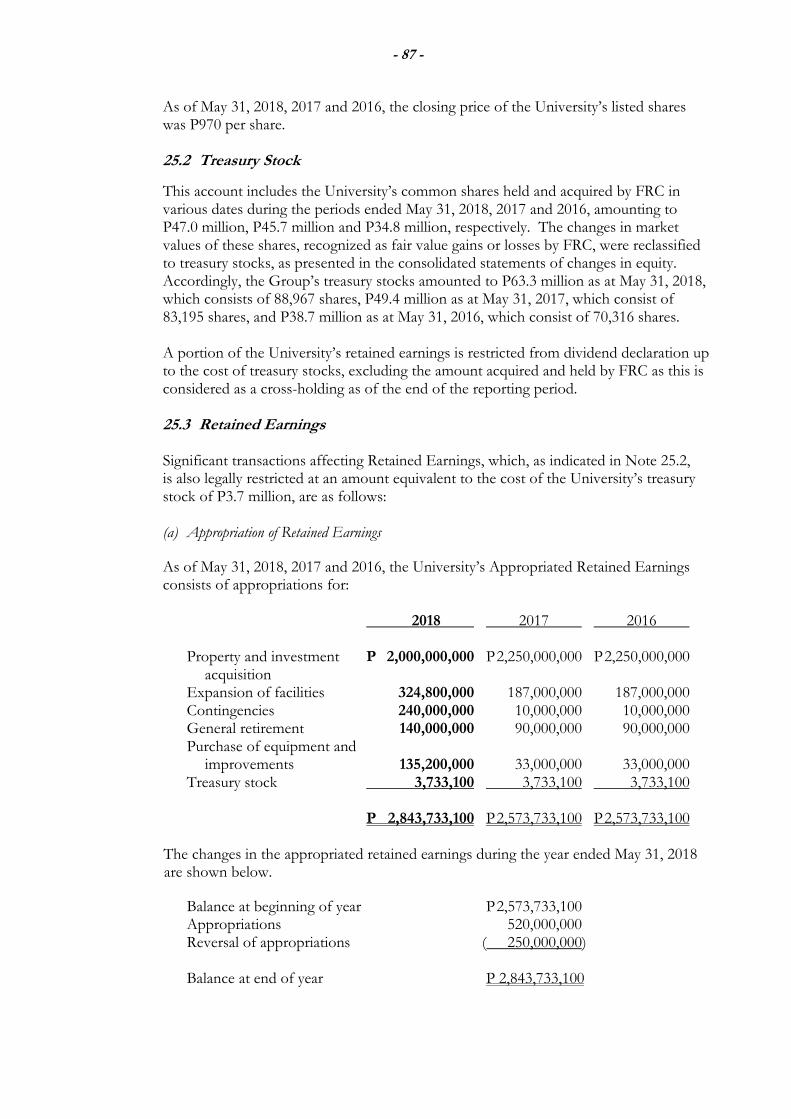
- 87 -
As of May 31, 2018, 2017 and 2016, the closing price of the University’s listed shares was P970 per share.
25.2 Treasury Stock
This account includes the University’s common shares held and acquired by FRC in various dates during the periods ended May 31, 2018, 2017 and 2016, amounting to P47.0 million, P45.7 million and P34.8 million, respectively. The changes in market values of these shares, recognized as fair value gains or losses by FRC, were reclassified to treasury stocks, as presented in the consolidated statements of changes in equity. Accordingly, the Group’s treasury stocks amounted to P63.3 million as at May 31, 2018, which consists of 88,967 shares, P49.4 million as at May 31, 2017, which consist of 83,195 shares, and P38.7 million as at May 31, 2016, which consist of 70,316 shares.
A portion of the University’s retained earnings is restricted from dividend declaration up to the cost of treasury stocks, excluding the amount acquired and held by FRC as this is considered as a cross-holding as of the end of the reporting period.
25.3 Retained Earnings
Significant transactions affecting Retained Earnings, which, as indicated in Note 25.2, is also legally restricted at an amount equivalent to the cost of the University’s treasury stock of P3.7 million, are as follows:
(a) Appropriation of Retained Earnings
As of May 31, 2018, 2017 and 2016, the University’s Appropriated Retained Earnings consists of appropriations for:
2018 2017 2016 Property and investment P 2,000,000,000 P 2,250,000,000 P 2,250,000,000 acquisition Expansion of facilities 324,800,000 187,000,000 187,000,000 Contingencies 240,000,000 10,000,000 10,000,000 General retirement 140,000,000 90,000,000 90,000,000 Purchase of equipment and improvements 135,200,000 33,000,000 33,000,000 Treasury stock 3,733,100 3,733,100 3,733,100 P 2,843,733,100 P 2,573,733,100 P 2,573,733,100 The changes in the appropriated retained earnings during the year ended May 31, 2018 are shown below.
Balance at beginning of year P 2,573,733,100 Appropriations 520,000,000 Reversal of appropriations ( 250,000,000) Balance at end of year P 2,843,733,100
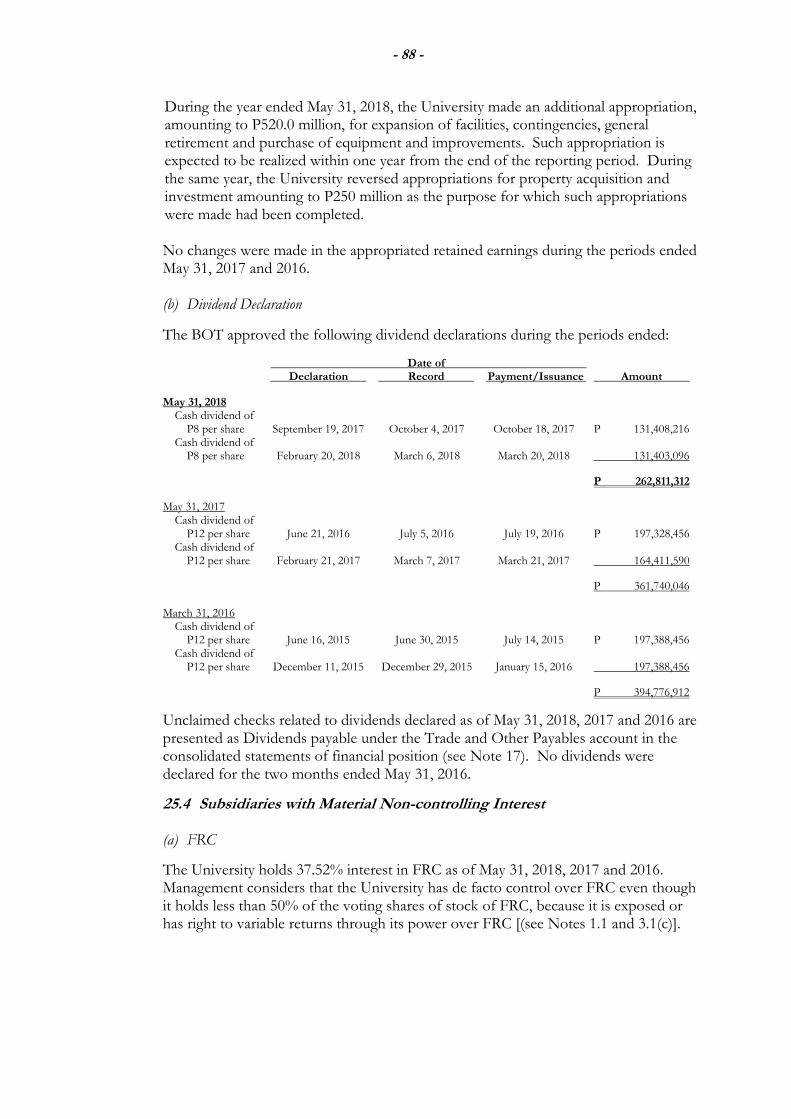
- 88 -
During the year ended May 31, 2018, the University made an additional appropriation, amounting to P520.0 million, for expansion of facilities, contingencies, general retirement and purchase of equipment and improvements. Such appropriation is expected to be realized within one year from the end of the reporting period. During the same year, the University reversed appropriations for property acquisition and investment amounting to P250 million as the purpose for which such appropriations were made had been completed.
No changes were made in the appropriated retained earnings during the periods ended May 31, 2017 and 2016.
(b) Dividend Declaration
The BOT approved the following dividend declarations during the periods ended: Date of Declaration Record Payment/Issuance Amount
May 31, 2018 Cash dividend of P8 per share September 19, 2017 October 4, 2017 October 18, 2017 P 131,408,216 Cash dividend of P8 per share February 20, 2018 March 6, 2018 March 20, 2018 131,403,096
P 262,811,312
May 31, 2017 Cash dividend of P12 per share June 21, 2016 July 5, 2016 July 19, 2016 P 197,328,456 Cash dividend of P12 per share February 21, 2017 March 7, 2017 March 21, 2017 164,411,590
P 361,740,046
March 31, 2016 Cash dividend of P12 per share June 16, 2015 June 30, 2015 July 14, 2015 P 197,388,456 Cash dividend of P12 per share December 11, 2015 December 29, 2015 January 15, 2016 197,388,456
P 394,776,912
Unclaimed checks related to dividends declared as of May 31, 2018, 2017 and 2016 are presented as Dividends payable under the Trade and Other Payables account in the consolidated statements of financial position (see Note 17). No dividends were declared for the two months ended May 31, 2016.
25.4 Subsidiaries with Material Non-controlling Interest
(a) FRC
The University holds 37.52% interest in FRC as of May 31, 2018, 2017 and 2016. Management considers that the University has de facto control over FRC even though it holds less than 50% of the voting shares of stock of FRC, because it is exposed or has right to variable returns through its power over FRC [(see Notes 1.1 and 3.1(c)].
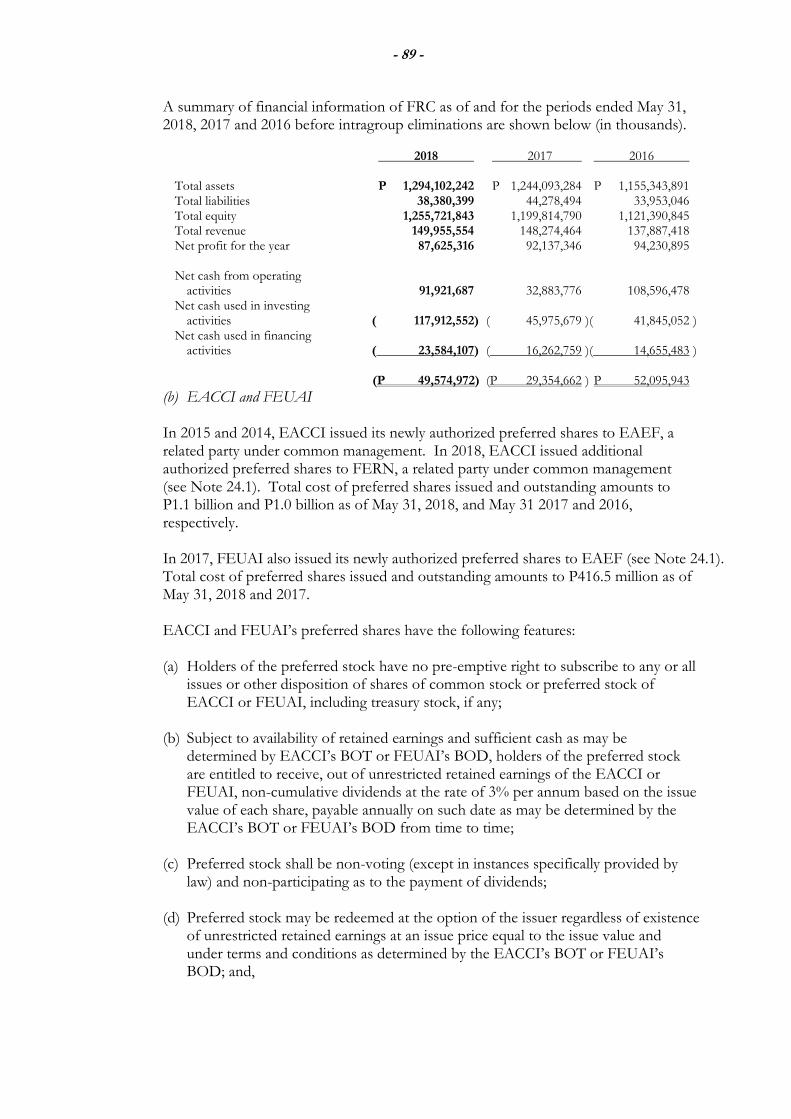
- 89 -
A summary of financial information of FRC as of and for the periods ended May 31, 2018, 2017 and 2016 before intragroup eliminations are shown below (in thousands).
2018 2017 2016 Total assets P 1,294,102,242 P 1,244,093,284 P 1,155,343,891 Total liabilities 38,380,399 44,278,494 33,953,046 Total equity 1,255,721,843 1,199,814,790 1,121,390,845 Total revenue 149,955,554 148,274,464 137,887,418 Net profit for the year 87,625,316 92,137,346 94,230,895 Net cash from operating activities 91,921,687 32,883,776 108,596,478 Net cash used in investing
activities ( 117,912,552) ( 45,975,679 )( 41,845,052 ) Net cash used in financing activities ( 23,584,107) ( 16,262,759 )( 14,655,483 )
(P 49,574,972) (P 29,354,662 ) P 52,095,943
(b) EACCI and FEUAI
In 2015 and 2014, EACCI issued its newly authorized preferred shares to EAEF, a related party under common management. In 2018, EACCI issued additional authorized preferred shares to FERN, a related party under common management (see Note 24.1). Total cost of preferred shares issued and outstanding amounts to P1.1 billion and P1.0 billion as of May 31, 2018, and May 31 2017 and 2016, respectively. In 2017, FEUAI also issued its newly authorized preferred shares to EAEF (see Note 24.1). Total cost of preferred shares issued and outstanding amounts to P416.5 million as of May 31, 2018 and 2017.
EACCI and FEUAI’s preferred shares have the following features:
(a) Holders of the preferred stock have no pre-emptive right to subscribe to any or all
issues or other disposition of shares of common stock or preferred stock of EACCI or FEUAI, including treasury stock, if any;
(b) Subject to availability of retained earnings and sufficient cash as may be determined by EACCI’s BOT or FEUAI’s BOD, holders of the preferred stock are entitled to receive, out of unrestricted retained earnings of the EACCI or FEUAI, non-cumulative dividends at the rate of 3% per annum based on the issue value of each share, payable annually on such date as may be determined by the EACCI’s BOT or FEUAI’s BOD from time to time;
(c) Preferred stock shall be non-voting (except in instances specifically provided by law) and non-participating as to the payment of dividends;
(d) Preferred stock may be redeemed at the option of the issuer regardless of existence
of unrestricted retained earnings at an issue price equal to the issue value and under terms and conditions as determined by the EACCI’s BOT or FEUAI’s BOD; and,
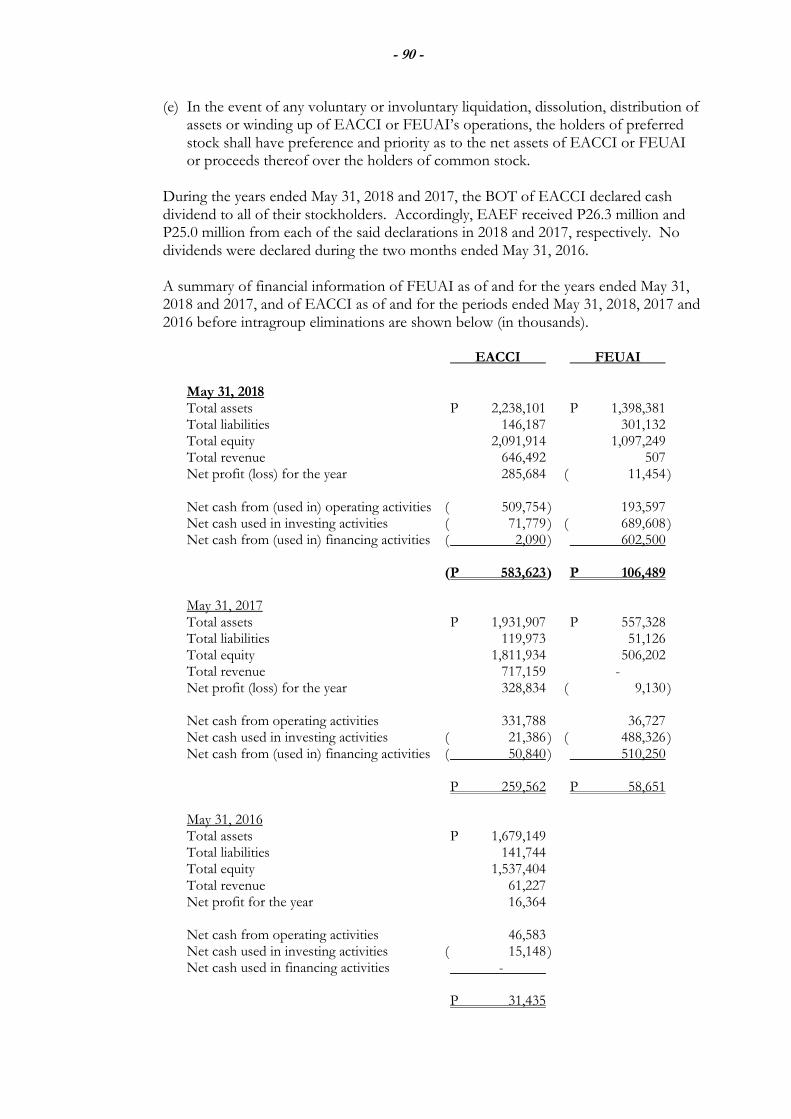
- 90 -
(e) In the event of any voluntary or involuntary liquidation, dissolution, distribution of assets or winding up of EACCI or FEUAI’s operations, the holders of preferred stock shall have preference and priority as to the net assets of EACCI or FEUAI or proceeds thereof over the holders of common stock.
During the years ended May 31, 2018 and 2017, the BOT of EACCI declared cash dividend to all of their stockholders. Accordingly, EAEF received P26.3 million and P25.0 million from each of the said declarations in 2018 and 2017, respectively. No dividends were declared during the two months ended May 31, 2016.
A summary of financial information of FEUAI as of and for the years ended May 31, 2018 and 2017, and of EACCI as of and for the periods ended May 31, 2018, 2017 and 2016 before intragroup eliminations are shown below (in thousands).
EACCI FEUAI
May 31, 2018
Total assets P 2,238,101 P 1,398,381 Total liabilities 146,187 301,132 Total equity 2,091,914 1,097,249 Total revenue 646,492 507 Net profit (loss) for the year 285,684 ( 11,454 ) Net cash from (used in) operating activities ( 509,754 ) 193,597 Net cash used in investing activities ( 71,779 ) ( 689,608 ) Net cash from (used in) financing activities ( 2,090 ) 602,500 ( P 583,623 ) P 106,489
May 31, 2017
Total assets P 1,931,907 P 557,328 Total liabilities 119,973 51,126 Total equity 1,811,934 506,202 Total revenue 717,159 - Net profit (loss) for the year 328,834 ( 9,130 ) Net cash from operating activities 331,788 36,727 Net cash used in investing activities ( 21,386 ) ( 488,326 ) Net cash from (used in) financing activities ( 50,840 ) 510,250 P 259,562 P 58,651 May 31, 2016 Total assets P 1,679,149 Total liabilities 141,744 Total equity 1,537,404 Total revenue 61,227 Net profit for the year 16,364 Net cash from operating activities 46,583 Net cash used in investing activities ( 15,148 ) Net cash used in financing activities - P 31,435
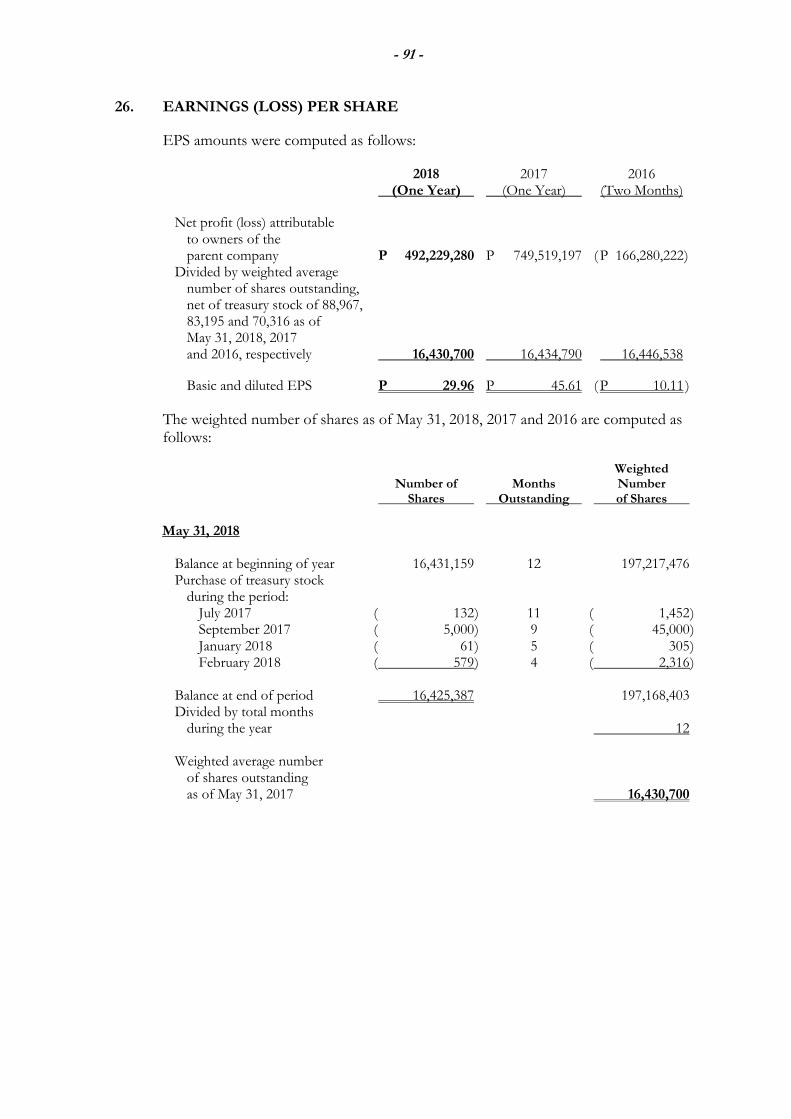
- 91 -
26. EARNINGS (LOSS) PER SHARE
EPS amounts were computed as follows:
2018 2017 2016 (One Year) (One Year) (Two Months) Net profit (loss) attributable to owners of the parent company P 492,229,280 P 749,519,197 ( P 166,280,222 ) Divided by weighted average number of shares outstanding, net of treasury stock of 88,967, 83,195 and 70,316 as of May 31, 2018, 2017 and 2016, respectively 16,430,700 16,434,790 16,446,538
Basic and diluted EPS P 29.96 P 45.61 ( P 10.11 )
The weighted number of shares as of May 31, 2018, 2017 and 2016 are computed as follows:
Weighted Number of Months Number Shares Outstanding of Shares
May 31, 2018 Balance at beginning of year 16,431,159 12 197,217,476 Purchase of treasury stock during the period: July 2017 ( 132 ) 11 ( 1,452 ) September 2017 ( 5,000 ) 9 ( 45,000 ) January 2018 ( 61 ) 5 ( 305 ) February 2018 ( 579 ) 4 ( 2,316 ) Balance at end of period 16,425,387 197,168,403 Divided by total months during the year 12 Weighted average number of shares outstanding as of May 31, 2017 16,430,700
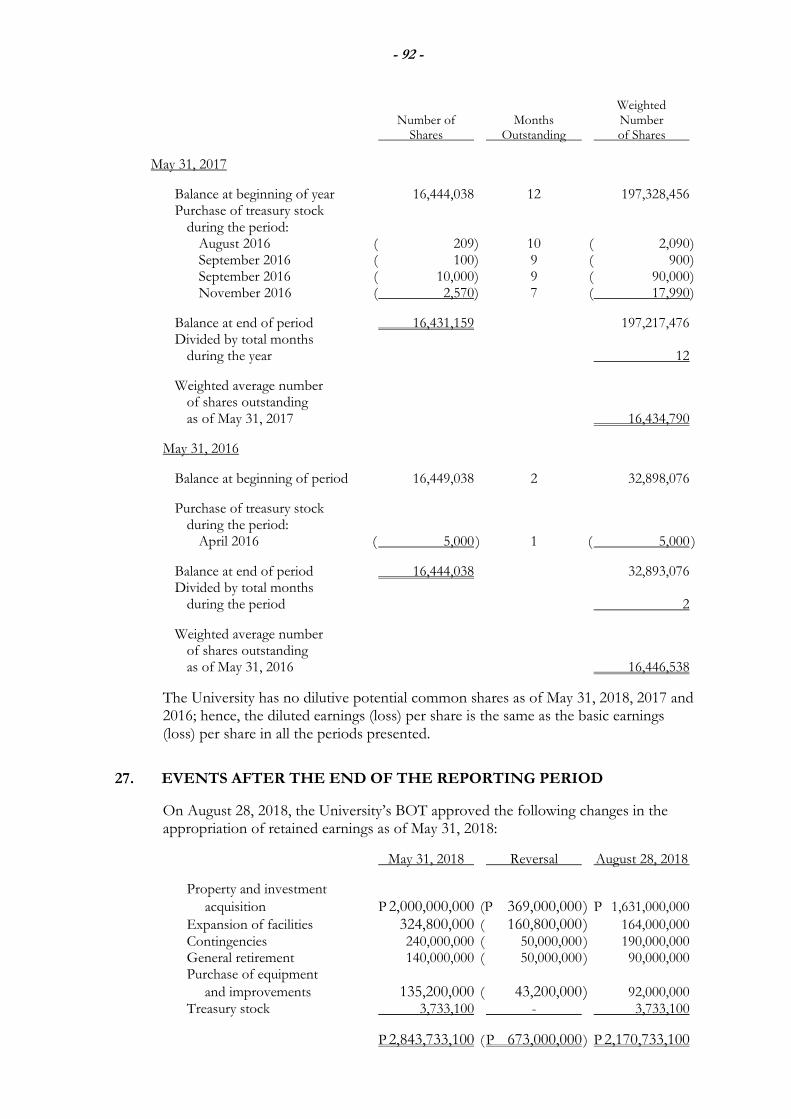
- 92 -
Weighted Number of Months Number Shares Outstanding of Shares
May 31, 2017
Balance at beginning of year 16,444,038 12 197,328,456 Purchase of treasury stock during the period: August 2016 ( 209 ) 10 ( 2,090 ) September 2016 ( 100 ) 9 ( 900 ) September 2016 ( 10,000 ) 9 ( 90,000 ) November 2016 ( 2,570 ) 7 ( 17,990 )
Balance at end of period 16,431,159 197,217,476 Divided by total months during the year 12
Weighted average number of shares outstanding as of May 31, 2017 16,434,790
May 31, 2016
Balance at beginning of period 16,449,038 2 32,898,076
Purchase of treasury stock during the period: April 2016 ( 5,000 ) 1 ( 5,000 )
Balance at end of period 16,444,038 32,893,076 Divided by total months during the period 2
Weighted average number of shares outstanding as of May 31, 2016 16,446,538
The University has no dilutive potential common shares as of May 31, 2018, 2017 and 2016; hence, the diluted earnings (loss) per share is the same as the basic earnings (loss) per share in all the periods presented.
27. EVENTS AFTER THE END OF THE REPORTING PERIOD
On August 28, 2018, the University’s BOT approved the following changes in the appropriation of retained earnings as of May 31, 2018:
May 31, 2018 Reversal August 28, 2018
Property and investment
acquisition P 2,000,000,000 (P 369,000,000 ) P 1,631,000,000 Expansion of facilities 324,800,000 ( 160,800,000 ) 164,000,000 Contingencies 240,000,000 ( 50,000,000 ) 190,000,000
General retirement 140,000,000 ( 50,000,000 ) 90,000,000 Purchase of equipment
and improvements 135,200,000 ( 43,200,000 ) 92,000,000 Treasury stock 3,733,100 - 3,733,100
P 2,843,733,100 ( P 673,000,000 ) P 2,170,733,100
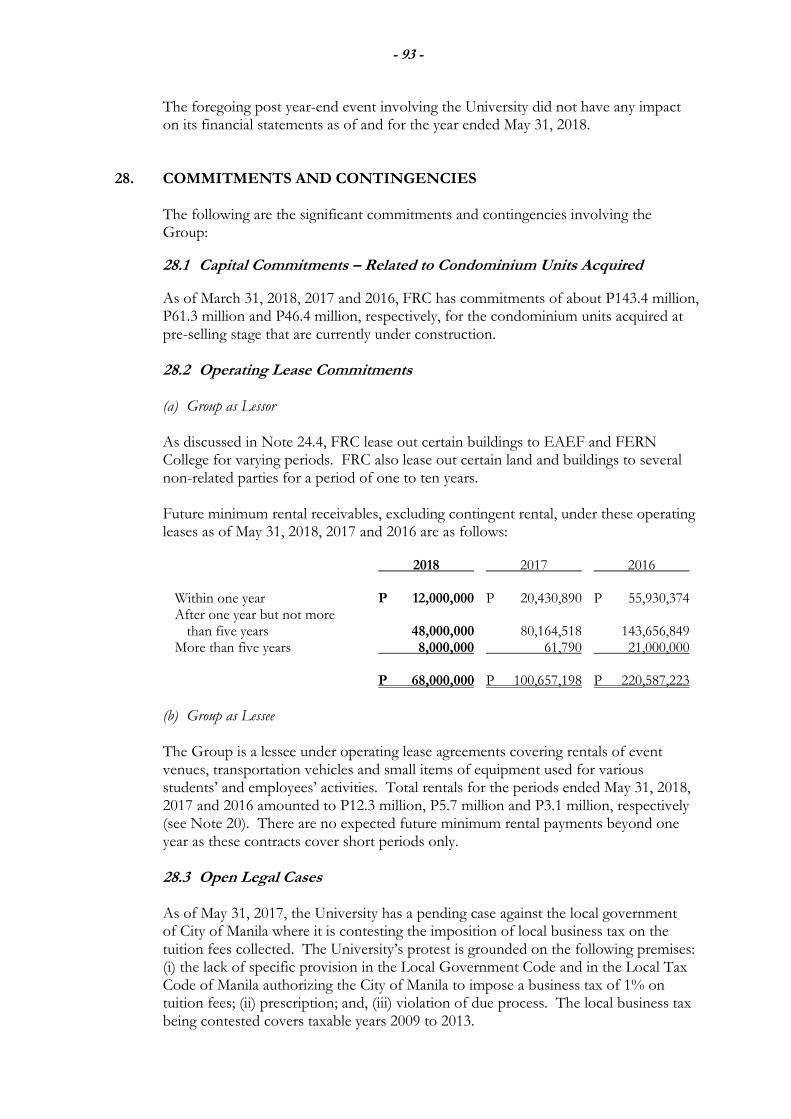
- 93 -
The foregoing post year-end event involving the University did not have any impact on its financial statements as of and for the year ended May 31, 2018.
28. COMMITMENTS AND CONTINGENCIES
The following are the significant commitments and contingencies involving the Group:
28.1 Capital Commitments – Related to Condominium Units Acquired
As of March 31, 2018, 2017 and 2016, FRC has commitments of about P143.4 million, P61.3 million and P46.4 million, respectively, for the condominium units acquired at pre-selling stage that are currently under construction.
28.2 Operating Lease Commitments
(a) Group as Lessor As discussed in Note 24.4, FRC lease out certain buildings to EAEF and FERN College for varying periods. FRC also lease out certain land and buildings to several non-related parties for a period of one to ten years.
Future minimum rental receivables, excluding contingent rental, under these operating leases as of May 31, 2018, 2017 and 2016 are as follows:
2018 2017 2016 Within one year P 12,000,000 P 20,430,890 P 55,930,374 After one year but not more than five years 48,000,000 80,164,518 143,656,849 More than five years 8,000,000 61,790 21,000,000 P 68,000,000 P 100,657,198 P 220,587,223
(b) Group as Lessee The Group is a lessee under operating lease agreements covering rentals of event venues, transportation vehicles and small items of equipment used for various students’ and employees’ activities. Total rentals for the periods ended May 31, 2018, 2017 and 2016 amounted to P12.3 million, P5.7 million and P3.1 million, respectively (see Note 20). There are no expected future minimum rental payments beyond one year as these contracts cover short periods only.
28.3 Open Legal Cases
As of May 31, 2017, the University has a pending case against the local government of City of Manila where it is contesting the imposition of local business tax on the tuition fees collected. The University’s protest is grounded on the following premises: (i) the lack of specific provision in the Local Government Code and in the Local Tax Code of Manila authorizing the City of Manila to impose a business tax of 1% on tuition fees; (ii) prescription; and, (iii) violation of due process. The local business tax being contested covers taxable years 2009 to 2013.
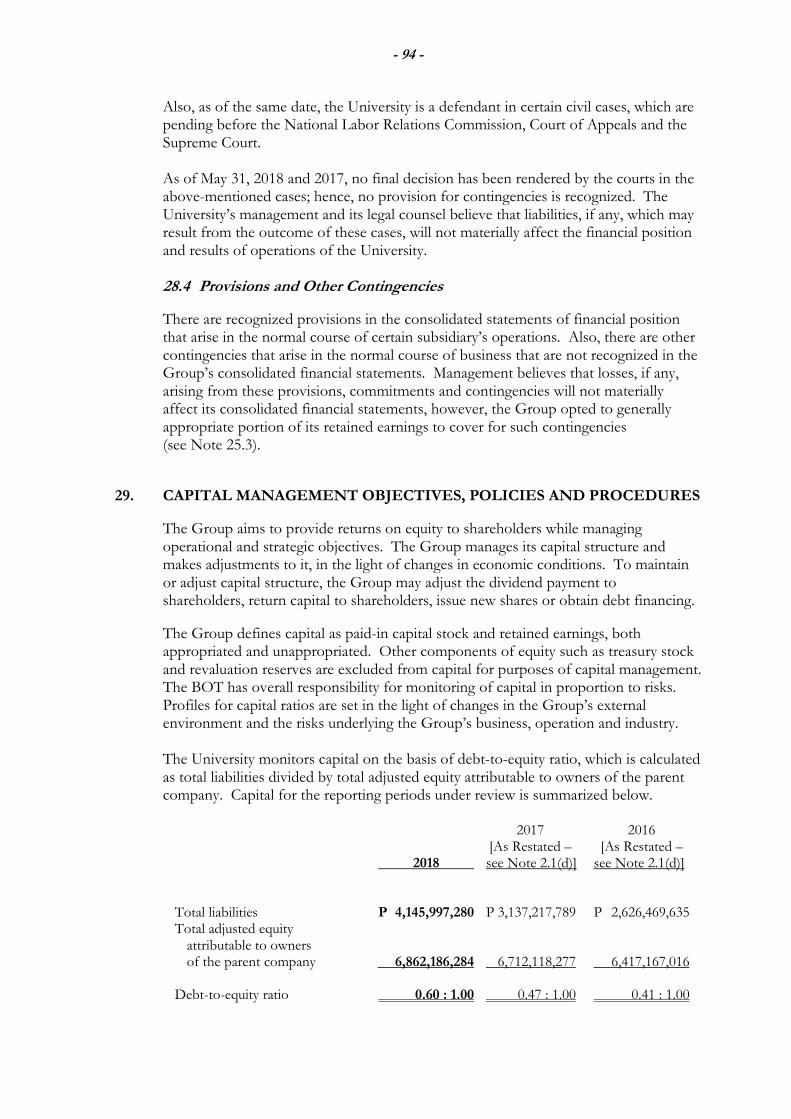
- 94 -
Also, as of the same date, the University is a defendant in certain civil cases, which are pending before the National Labor Relations Commission, Court of Appeals and the Supreme Court. As of May 31, 2018 and 2017, no final decision has been rendered by the courts in the above-mentioned cases; hence, no provision for contingencies is recognized. The University’s management and its legal counsel believe that liabilities, if any, which may result from the outcome of these cases, will not materially affect the financial position and results of operations of the University.
28.4 Provisions and Other Contingencies
There are recognized provisions in the consolidated statements of financial position that arise in the normal course of certain subsidiary’s operations. Also, there are other contingencies that arise in the normal course of business that are not recognized in the Group’s consolidated financial statements. Management believes that losses, if any, arising from these provisions, commitments and contingencies will not materially affect its consolidated financial statements, however, the Group opted to generally appropriate portion of its retained earnings to cover for such contingencies (see Note 25.3).
29. CAPITAL MANAGEMENT OBJECTIVES, POLICIES AND PROCEDURES
The Group aims to provide returns on equity to shareholders while managing operational and strategic objectives. The Group manages its capital structure and makes adjustments to it, in the light of changes in economic conditions. To maintain or adjust capital structure, the Group may adjust the dividend payment to shareholders, return capital to shareholders, issue new shares or obtain debt financing.
The Group defines capital as paid-in capital stock and retained earnings, both appropriated and unappropriated. Other components of equity such as treasury stock and revaluation reserves are excluded from capital for purposes of capital management. The BOT has overall responsibility for monitoring of capital in proportion to risks. Profiles for capital ratios are set in the light of changes in the Group’s external environment and the risks underlying the Group’s business, operation and industry.
The University monitors capital on the basis of debt-to-equity ratio, which is calculated as total liabilities divided by total adjusted equity attributable to owners of the parent company. Capital for the reporting periods under review is summarized below.
2017 2016 [As Restated – [As Restated – 2018 see Note 2.1(d)] see Note 2.1(d)]
Total liabilities P 4,145,997,280 P 3,137,217,789 P 2,626,469,635 Total adjusted equity attributable to owners of the parent company 6,862,186,284 6,712,118,277 6,417,167,016
Debt-to-equity ratio 0.60 : 1.00 0.47 : 1.00 0.41 : 1.00
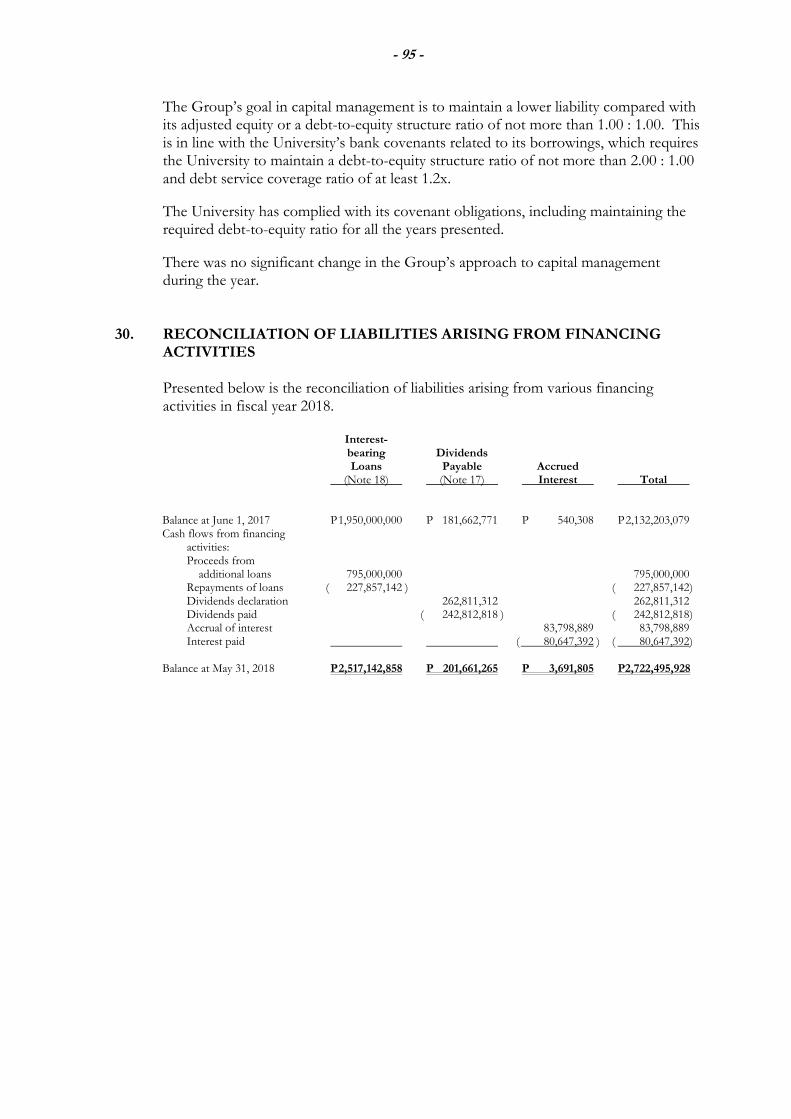
- 95 -
The Group’s goal in capital management is to maintain a lower liability compared with its adjusted equity or a debt-to-equity structure ratio of not more than 1.00 : 1.00. This is in line with the University’s bank covenants related to its borrowings, which requires the University to maintain a debt-to-equity structure ratio of not more than 2.00 : 1.00 and debt service coverage ratio of at least 1.2x.
The University has complied with its covenant obligations, including maintaining the required debt-to-equity ratio for all the years presented.
There was no significant change in the Group’s approach to capital management during the year.
30. RECONCILIATION OF LIABILITIES ARISING FROM FINANCING ACTIVITIES
Presented below is the reconciliation of liabilities arising from various financing activities in fiscal year 2018.
Interest- bearing Dividends Loans Payable Accrued (Note 18) (Note 17) Interest Total Balance at June 1, 2017 P 1,950,000,000 P 181,662,771 P 540,308 P 2,132,203,079 Cash flows from financing activities: Proceeds from additional loans 795,000,000 795,000,000 Repayments of loans ( 227,857,142 ) ( 227,857,142) Dividends declaration 262,811,312 262,811,312 Dividends paid ( 242,812,818 ) ( 242,812,818) Accrual of interest 83,798,889 83,798,889 Interest paid ( 80,647,392 ) ( 80,647,392) Balance at May 31, 2018 P 2,517,142,858 P 201,661,265 P 3,691,805 P2,722,495,928
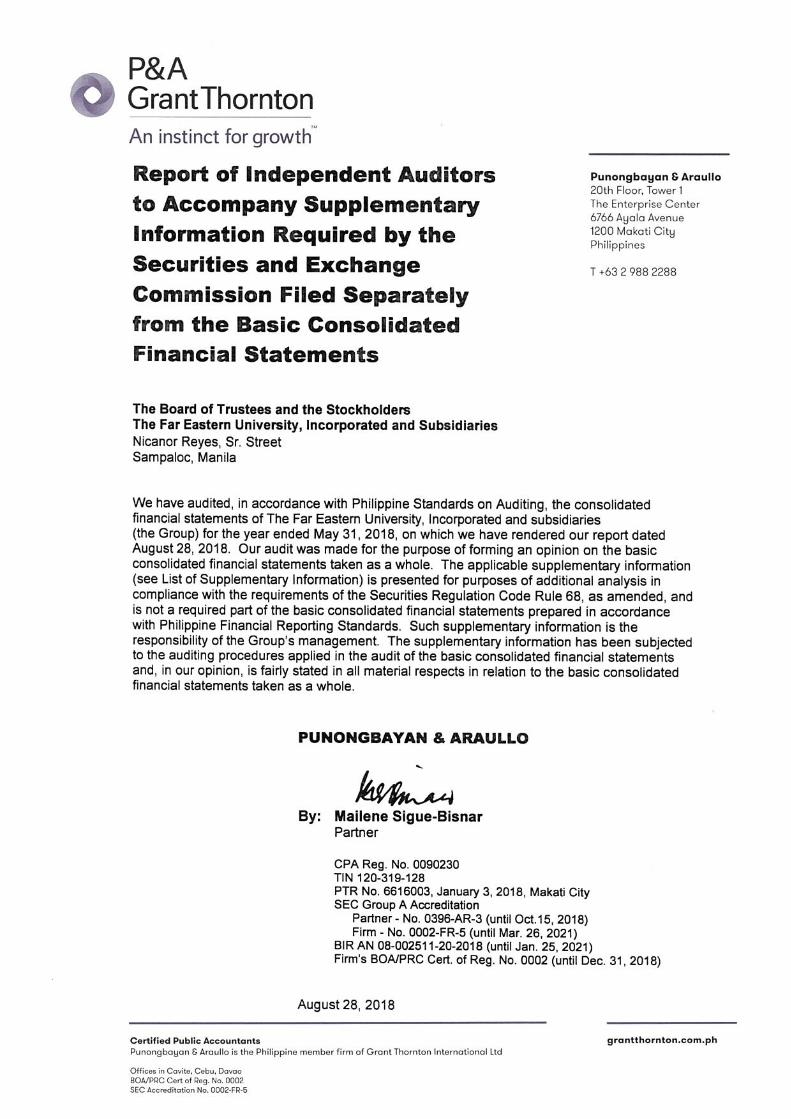
Statement of Management's Responsibility for the Consolidated Financial Statements
Independent Auditor's Report on the SEC Supplementary Schedules Filed Separately
from the Basic Financial Statements
Supplementary Schedules to Consolidated Financial Statements (Form 17-A, Item 7)
Page
Schedule A Marketable Securities (Current Marketable Securities and Other
Short-term Cash Investments 1
Schedule B Amounts Receivable from Directors, Officers, Employees, Related Parties
and Principal Stockholders (Other Than Related Parties) 2
Schedule C Amounts Receivable from Relatede Parties Which are Eliminated During
the Consolidation of Financial Statements 3
Schedule D Non-current Marketable Equity Securities, Other Lon-term Investments
in Stocks and Other Investments 4
Schedule E Indebtedness to Unconsolidated Subsidiaries and Related Parties N/A
Schedule F Other Assets 5
Schedule G Long-term Debt 6
Schedule H Indebtedness to Related Parties (Long-term Loans from Related Companies) N/A
Schedule I Guarantees of Securities of Other Issuers N/A
Schedule J Capital Stock 7
Other Required Information
Reconciliation of Retained Earnings Available for Dividend Declaration 8
Summary of Financial Reporting Standards and Interpretations Effective May 31, 2018 9
Map Showing the Relationships Between and Among the University and Its Related Parties 10
Financial Indicators 11
THE FAR EASTERN UNIVERSITY, INCORPORATED AND SUBSIDIARIES
INDEX TO SUPPLEMENTAL SCHEDULES
MAY 31, 2018
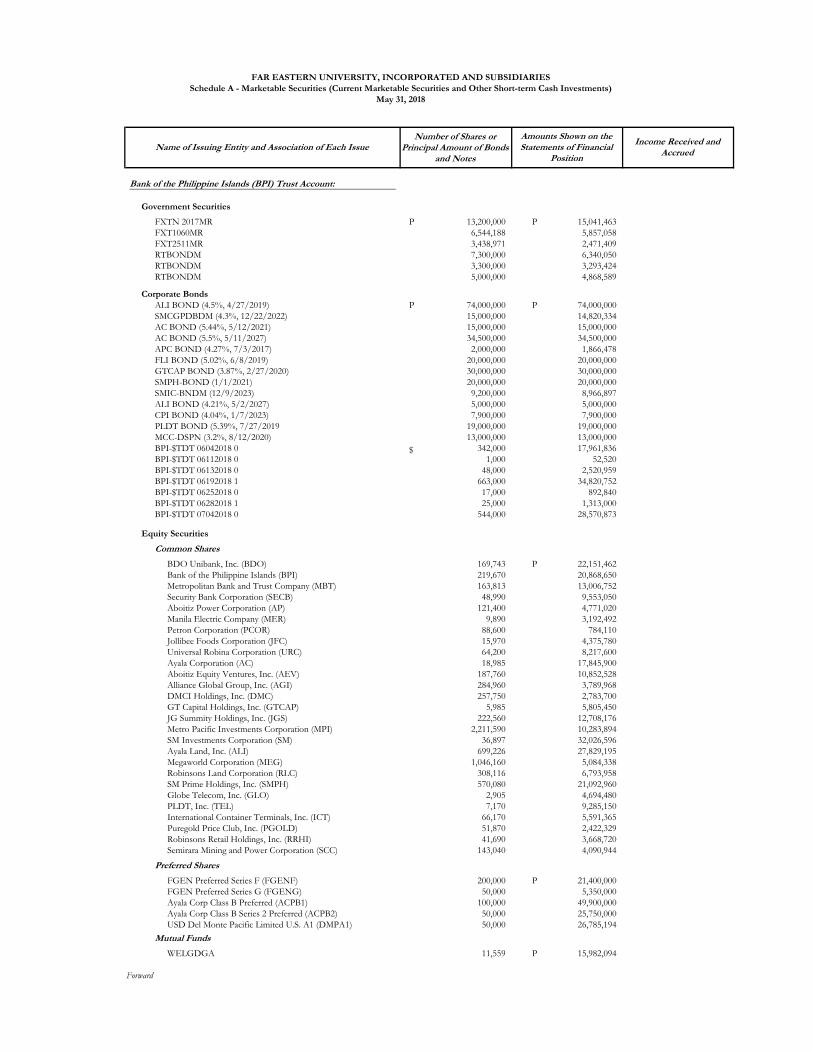
Number of Shares or Principal Amount of Bonds
and Notes
Government Securities
FXTN 2017MR 13,200,000 P 15,041,463 P FXT1060MR 6,544,188 5,857,058 FXT2511MR 3,438,971 2,471,409 RTBONDM 7,300,000 6,340,050 RTBONDM 3,300,000 3,293,424 RTBONDM 5,000,000 4,868,589
Corporate Bonds
ALI BOND (4.5%, 4/27/2019) 74,000,000 P 74,000,000 P SMCGPDBDM (4.3%, 12/22/2022) 15,000,000 14,820,334 AC BOND (5.44%, 5/12/2021) 15,000,000 15,000,000 AC BOND (5.5%, 5/11/2027) 34,500,000 34,500,000 APC BOND (4.27%, 7/3/2017) 2,000,000 1,866,478 FLI BOND (5.02%, 6/8/2019) 20,000,000 20,000,000 GTCAP BOND (3.87%, 2/27/2020) 30,000,000 30,000,000 SMPH-BOND (1/1/2021) 20,000,000 20,000,000 SMIC-BNDM (12/9/2023) 9,200,000 8,966,897 ALI BOND (4.21%, 5/2/2027) 5,000,000 5,000,000 CPI BOND (4.04%, 1/7/2023) 7,900,000 7,900,000 PLDT BOND (5.39%, 7/27/2019 19,000,000 19,000,000 MCC-DSPN (3.2%, 8/12/2020) 13,000,000 13,000,000 BPI-$TDT 06042018 0 342,000 17,961,836 BPI-$TDT 06112018 0 1,000 52,520 BPI-$TDT 06132018 0 48,000 2,520,959 BPI-$TDT 06192018 1 663,000 34,820,752 BPI-$TDT 06252018 0 17,000 892,840 BPI-$TDT 06282018 1 25,000 1,313,000 BPI-$TDT 07042018 0 544,000 28,570,873
Equity Securities
Common Shares
BDO Unibank, Inc. (BDO) 169,743 22,151,462 P Bank of the Philippine Islands (BPI) 219,670 20,868,650 Metropolitan Bank and Trust Company (MBT) 163,813 13,006,752 Security Bank Corporation (SECB) 48,990 9,553,050 Aboitiz Power Corporation (AP) 121,400 4,771,020 Manila Electric Company (MER) 9,890 3,192,492 Petron Corporation (PCOR) 88,600 784,110 Jollibee Foods Corporation (JFC) 15,970 4,375,780 Universal Robina Corporation (URC) 64,200 8,217,600 Ayala Corporation (AC) 18,985 17,845,900 Aboitiz Equity Ventures, Inc. (AEV) 187,760 10,852,528 Alliance Global Group, Inc. (AGI) 284,960 3,789,968 DMCI Holdings, Inc. (DMC) 257,750 2,783,700 GT Capital Holdings, Inc. (GTCAP) 5,985 5,805,450 JG Summity Holdings, Inc. (JGS) 222,560 12,708,176 Metro Pacific Investments Corporation (MPI) 2,211,590 10,283,894 SM Investments Corporation (SM) 36,897 32,026,596 Ayala Land, Inc. (ALI) 699,226 27,829,195 Megaworld Corporation (MEG) 1,046,160 5,084,338 Robinsons Land Corporation (RLC) 308,116 6,793,958 SM Prime Holdings, Inc. (SMPH) 570,080 21,092,960 Globe Telecom, Inc. (GLO) 2,905 4,694,480 PLDT, Inc. (TEL) 7,170 9,285,150 International Container Terminals, Inc. (ICT) 66,170 5,591,365 Puregold Price Club, Inc. (PGOLD) 51,870 2,422,329 Robinsons Retail Holdings, Inc. (RRHI) 41,690 3,668,720 Semirara Mining and Power Corporation (SCC) 143,040 4,090,944
Preferred Shares
FGEN Preferred Series F (FGENF) 200,000 21,400,000 P FGEN Preferred Series G (FGENG) 50,000 5,350,000 Ayala Corp Class B Preferred (ACPB1) 100,000 49,900,000 Ayala Corp Class B Series 2 Preferred (ACPB2) 50,000 25,750,000 USD Del Monte Pacific Limited U.S. A1 (DMPA1) 50,000 26,785,194
Mutual Funds
WELGDGA 11,559 15,982,094 P
Forward
FAR EASTERN UNIVERSITY, INCORPORATED AND SUBSIDIARIES
Schedule A - Marketable Securities (Current Marketable Securities and Other Short-term Cash Investments)
May 31, 2018
Income Received and Accrued
Amounts Shown on the Statements of Financial
PositionName of Issuing Entity and Association of Each Issue
Bank of the Philippine Islands (BPI) Trust Account:
$
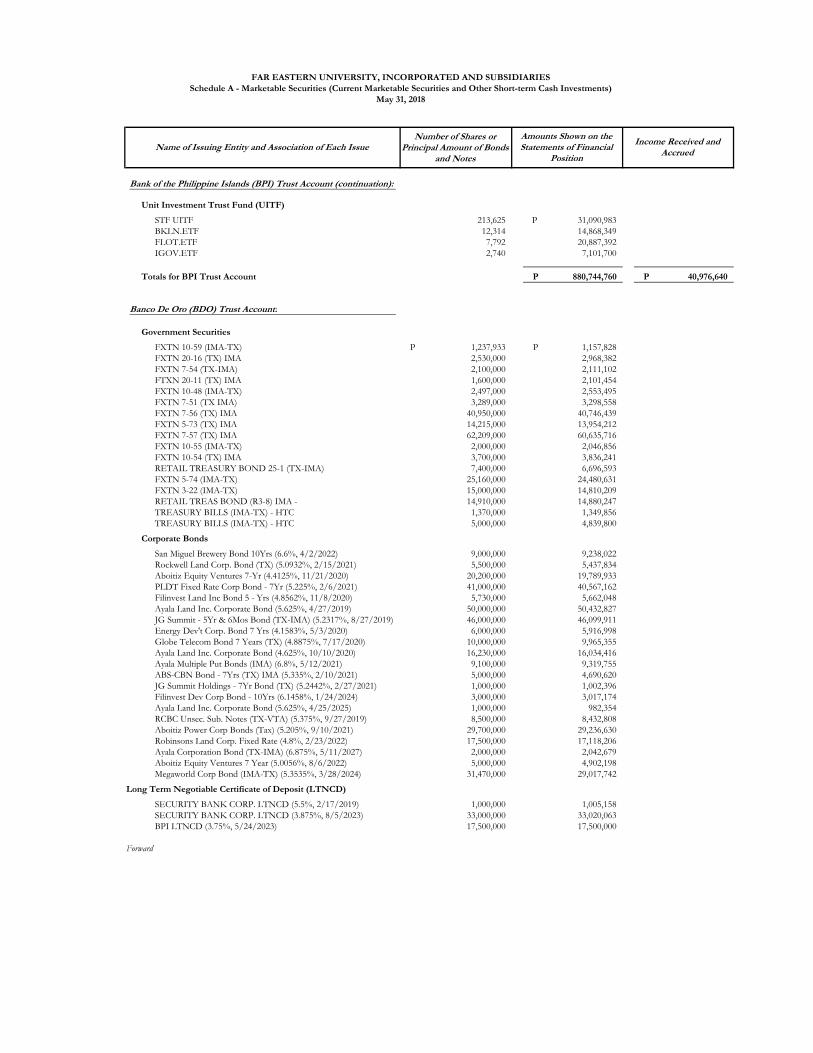
Number of Shares or Principal Amount of Bonds
and Notes
Unit Investment Trust Fund (UITF)
STF UITF 213,625 31,090,983 P BKLN.ETF 12,314 14,868,349 FLOT.ETF 7,792 20,887,392 IGOV.ETF 2,740 7,101,700
Totals for BPI Trust Account 880,744,760 P 40,976,640 P
Government Securities
FXTN 10-59 (IMA-TX) 1,237,933 P 1,157,828 P FXTN 20-16 (TX) IMA 2,530,000 2,968,382 FXTN 7-54 (TX-IMA) 2,100,000 2,111,102 FTXN 20-11 (TX) IMA 1,600,000 2,101,454 FXTN 10-48 (IMA-TX) 2,497,000 2,553,495 FXTN 7-51 (TX IMA) 3,289,000 3,298,558 FXTN 7-56 (TX) IMA 40,950,000 40,746,439 FXTN 5-73 (TX) IMA 14,215,000 13,954,212 FXTN 7-57 (TX) IMA 62,209,000 60,635,716 FXTN 10-55 (IMA-TX) 2,000,000 2,046,856 FXTN 10-54 (TX) IMA 3,700,000 3,836,241 RETAIL TREASURY BOND 25-1 (TX-IMA) 7,400,000 6,696,593 FXTN 5-74 (IMA-TX) 25,160,000 24,480,631 FXTN 3-22 (IMA-TX) 15,000,000 14,810,209 RETAIL TREAS BOND (R3-8) IMA - 14,910,000 14,880,247 TREASURY BILLS (IMA-TX) - HTC 1,370,000 1,349,856 TREASURY BILLS (IMA-TX) - HTC 5,000,000 4,839,800
Corporate Bonds
San Miguel Brewery Bond 10Yrs (6.6%, 4/2/2022) 9,000,000 9,238,022 Rockwell Land Corp. Bond (TX) (5.0932%, 2/15/2021) 5,500,000 5,437,834 Aboitiz Equity Ventures 7-Yr (4.4125%, 11/21/2020) 20,200,000 19,789,933 PLDT Fixed Rate Corp Bond - 7Yr (5.225%, 2/6/2021) 41,000,000 40,567,162 Filinvest Land Inc Bond 5 - Yrs (4.8562%, 11/8/2020) 5,730,000 5,662,048 Ayala Land Inc. Corporate Bond (5.625%, 4/27/2019) 50,000,000 50,432,827 JG Summit - 5Yr & 6Mos Bond (TX-IMA) (5.2317%, 8/27/2019) 46,000,000 46,099,911 Energy Dev't Corp. Bond 7 Yrs (4.1583%, 5/3/2020) 6,000,000 5,916,998 Globe Telecom Bond 7 Years (TX) (4.8875%, 7/17/2020) 10,000,000 9,965,355 Ayala Land Inc. Corporate Bond (4.625%, 10/10/2020) 16,230,000 16,034,416 Ayala Multiple Put Bonds (IMA) (6.8%, 5/12/2021) 9,100,000 9,319,755 ABS-CBN Bond - 7Yrs (TX) IMA (5.335%, 2/10/2021) 5,000,000 4,690,620 JG Summit Holdings - 7Yr Bond (TX) (5.2442%, 2/27/2021) 1,000,000 1,002,396 Filinvest Dev Corp Bond - 10Yrs (6.1458%, 1/24/2024) 3,000,000 3,017,174 Ayala Land Inc. Corporate Bond (5.625%, 4/25/2025) 1,000,000 982,354 RCBC Unsec. Sub. Notes (TX-VTA) (5.375%, 9/27/2019) 8,500,000 8,432,808 Aboitiz Power Corp Bonds (Tax) (5.205%, 9/10/2021) 29,700,000 29,236,630 Robinsons Land Corp. Fixed Rate (4.8%, 2/23/2022) 17,500,000 17,118,206 Ayala Corporation Bond (TX-IMA) (6.875%, 5/11/2027) 2,000,000 2,042,679 Aboitiz Equity Ventures 7 Year (5.0056%, 8/6/2022) 5,000,000 4,902,198 Megaworld Corp Bond (IMA-TX) (5.3535%, 3/28/2024) 31,470,000 29,017,742
Long Term Negotiable Certificate of Deposit (LTNCD)
SECURITY BANK CORP. LTNCD (5.5%, 2/17/2019) 1,000,000 1,005,158 SECURITY BANK CORP. LTNCD (3.875%, 8/5/2023) 33,000,000 33,020,063 BPI LTNCD (3.75%, 5/24/2023) 17,500,000 17,500,000
Forward
Banco De Oro (BDO) Trust Account:
FAR EASTERN UNIVERSITY, INCORPORATED AND SUBSIDIARIES
Schedule A - Marketable Securities (Current Marketable Securities and Other Short-term Cash Investments)
May 31, 2018
Name of Issuing Entity and Association of Each IssueAmounts Shown on the Statements of Financial
Position
Income Received and Accrued
Bank of the Philippine Islands (BPI) Trust Account (continuation):
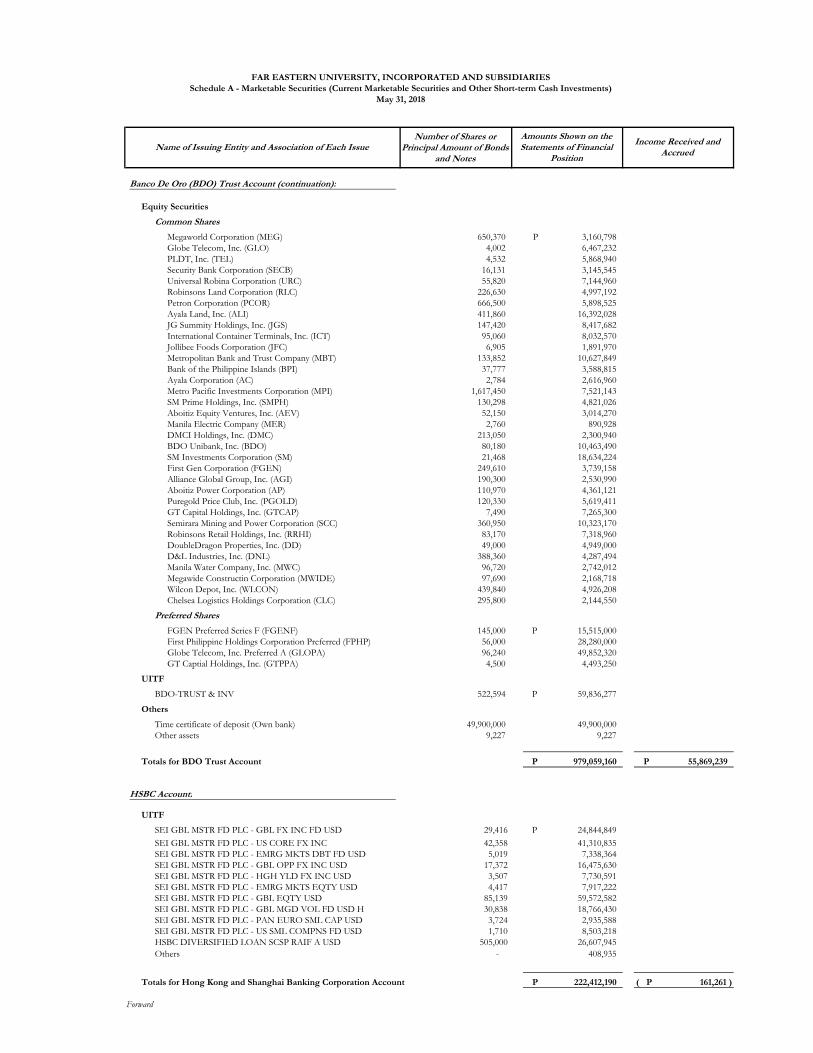
Number of Shares or Principal Amount of Bonds
and Notes
Equity Securities
Common Shares
Megaworld Corporation (MEG) 650,370 3,160,798 P Globe Telecom, Inc. (GLO) 4,002 6,467,232 PLDT, Inc. (TEL) 4,532 5,868,940 Security Bank Corporation (SECB) 16,131 3,145,545 Universal Robina Corporation (URC) 55,820 7,144,960 Robinsons Land Corporation (RLC) 226,630 4,997,192 Petron Corporation (PCOR) 666,500 5,898,525 Ayala Land, Inc. (ALI) 411,860 16,392,028 JG Summity Holdings, Inc. (JGS) 147,420 8,417,682 International Container Terminals, Inc. (ICT) 95,060 8,032,570 Jollibee Foods Corporation (JFC) 6,905 1,891,970 Metropolitan Bank and Trust Company (MBT) 133,852 10,627,849 Bank of the Philippine Islands (BPI) 37,777 3,588,815 Ayala Corporation (AC) 2,784 2,616,960 Metro Pacific Investments Corporation (MPI) 1,617,450 7,521,143 SM Prime Holdings, Inc. (SMPH) 130,298 4,821,026 Aboitiz Equity Ventures, Inc. (AEV) 52,150 3,014,270 Manila Electric Company (MER) 2,760 890,928 DMCI Holdings, Inc. (DMC) 213,050 2,300,940 BDO Unibank, Inc. (BDO) 80,180 10,463,490 SM Investments Corporation (SM) 21,468 18,634,224 First Gen Corporation (FGEN) 249,610 3,739,158 Alliance Global Group, Inc. (AGI) 190,300 2,530,990 Aboitiz Power Corporation (AP) 110,970 4,361,121 Puregold Price Club, Inc. (PGOLD) 120,330 5,619,411 GT Capital Holdings, Inc. (GTCAP) 7,490 7,265,300 Semirara Mining and Power Corporation (SCC) 360,950 10,323,170 Robinsons Retail Holdings, Inc. (RRHI) 83,170 7,318,960 DoubleDragon Properties, Inc. (DD) 49,000 4,949,000 D&L Industries, Inc. (DNL) 388,360 4,287,494 Manila Water Company, Inc. (MWC) 96,720 2,742,012 Megawide Constructin Corporation (MWIDE) 97,690 2,168,718 Wilcon Depot, Inc. (WLCON) 439,840 4,926,208 Chelsea Logistics Holdings Corporation (CLC) 295,800 2,144,550
Preferred Shares
FGEN Preferred Series F (FGENF) 145,000 15,515,000 P First Philippine Holdings Corporation Preferred (FPHP) 56,000 28,280,000 Globe Telecom, Inc. Preferred A (GLOPA) 96,240 49,852,320 GT Captial Holdings, Inc. (GTPPA) 4,500 4,493,250
UITF
BDO-TRUST & INV 522,594 59,836,277 P
Others
Time certificate of deposit (Own bank) 49,900,000 49,900,000 Other assets 9,227 9,227
Totals for BDO Trust Account 979,059,160 P 55,869,239 P
UITF
SEI GBL MSTR FD PLC - GBL FX INC FD USD 29,416 24,844,849 P
SEI GBL MSTR FD PLC - US CORE FX INC 42,358 41,310,835 SEI GBL MSTR FD PLC - EMRG MKTS DBT FD USD 5,019 7,338,364 SEI GBL MSTR FD PLC - GBL OPP FX INC USD 17,372 16,475,630 SEI GBL MSTR FD PLC - HGH YLD FX INC USD 3,507 7,730,591 SEI GBL MSTR FD PLC - EMRG MKTS EQTY USD 4,417 7,917,222 SEI GBL MSTR FD PLC - GBL EQTY USD 85,139 59,572,582 SEI GBL MSTR FD PLC - GBL MGD VOL FD USD H 30,838 18,766,430 SEI GBL MSTR FD PLC - PAN EURO SML CAP USD 3,724 2,935,588 SEI GBL MSTR FD PLC - US SML COMPNS FD USD 1,710 8,503,218 HSBC DIVERSIFIED LOAN SCSP RAIF A USD 505,000 26,607,945
Others - 408,935
Totals for Hong Kong and Shanghai Banking Corporation Account 222,412,190 P 161,261 )( P
Forward
HSBC Account:
Banco De Oro (BDO) Trust Account (continuation):
FAR EASTERN UNIVERSITY, INCORPORATED AND SUBSIDIARIES
Schedule A - Marketable Securities (Current Marketable Securities and Other Short-term Cash Investments)
May 31, 2018
Name of Issuing Entity and Association of Each IssueAmounts Shown on the Statements of Financial
Position
Income Received and Accrued
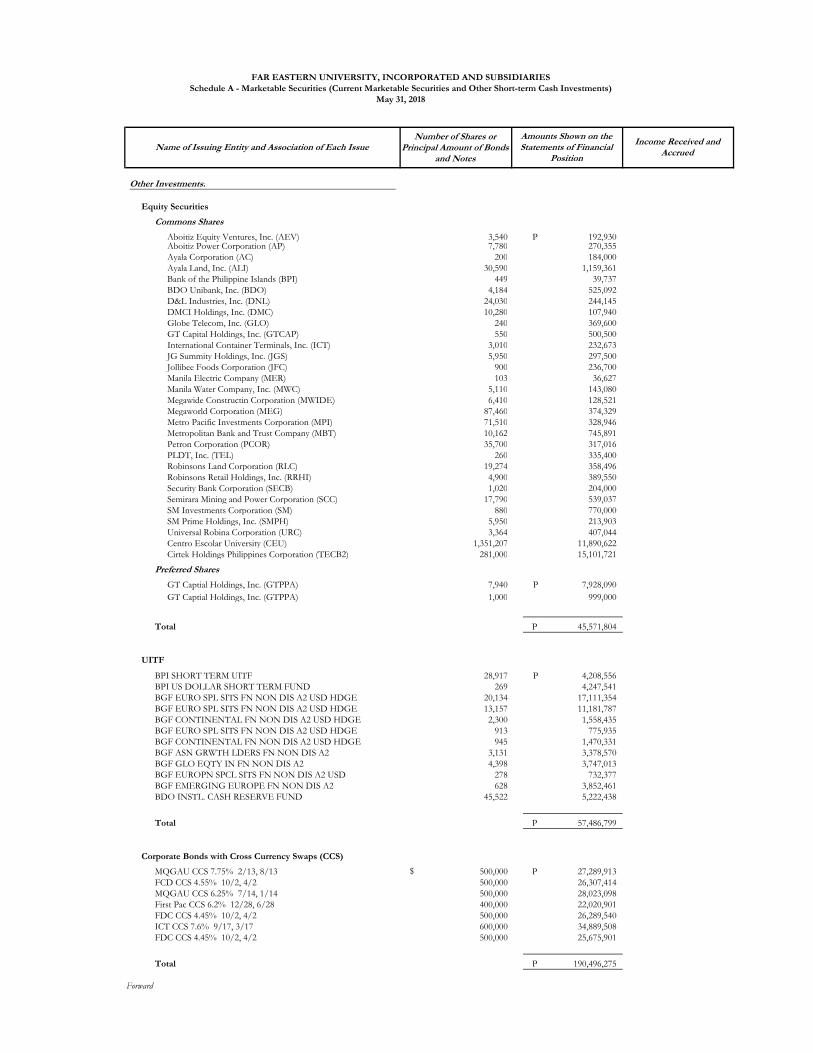
Number of Shares or Principal Amount of Bonds
and Notes
Equity Securities
Commons Shares
Aboitiz Equity Ventures, Inc. (AEV) 3,540 192,930 P Aboitiz Power Corporation (AP) 7,780 270,355 Ayala Corporation (AC) 200 184,000 Ayala Land, Inc. (ALI) 30,590 1,159,361 Bank of the Philippine Islands (BPI) 449 39,737 BDO Unibank, Inc. (BDO) 4,184 525,092 D&L Industries, Inc. (DNL) 24,030 244,145 DMCI Holdings, Inc. (DMC) 10,280 107,940 Globe Telecom, Inc. (GLO) 240 369,600 GT Capital Holdings, Inc. (GTCAP) 550 500,500 International Container Terminals, Inc. (ICT) 3,010 232,673 JG Summity Holdings, Inc. (JGS) 5,950 297,500 Jollibee Foods Corporation (JFC) 900 236,700 Manila Electric Company (MER) 103 36,627 Manila Water Company, Inc. (MWC) 5,110 143,080 Megawide Constructin Corporation (MWIDE) 6,410 128,521 Megaworld Corporation (MEG) 87,460 374,329 Metro Pacific Investments Corporation (MPI) 71,510 328,946 Metropolitan Bank and Trust Company (MBT) 10,162 745,891 Petron Corporation (PCOR) 35,700 317,016 PLDT, Inc. (TEL) 260 335,400 Robinsons Land Corporation (RLC) 19,274 358,496 Robinsons Retail Holdings, Inc. (RRHI) 4,900 389,550 Security Bank Corporation (SECB) 1,020 204,000 Semirara Mining and Power Corporation (SCC) 17,790 539,037 SM Investments Corporation (SM) 880 770,000 SM Prime Holdings, Inc. (SMPH) 5,950 213,903 Universal Robina Corporation (URC) 3,364 407,044 Centro Escolar University (CEU) 1,351,207 11,890,622 Cirtek Holdings Philippines Corporation (TECB2) 281,000 15,101,721
Preferred Shares
GT Captial Holdings, Inc. (GTPPA) 7,940 7,928,090 P
GT Captial Holdings, Inc. (GTPPA) 1,000 999,000
Total 45,571,804 P
UITF
BPI SHORT TERM UITF 28,917 4,208,556 P BPI US DOLLAR SHORT TERM FUND 269 4,247,541 BGF EURO SPL SITS FN NON DIS A2 USD HDGE 20,134 17,111,354 BGF EURO SPL SITS FN NON DIS A2 USD HDGE 13,157 11,181,787 BGF CONTINENTAL FN NON DIS A2 USD HDGE 2,300 1,558,435 BGF EURO SPL SITS FN NON DIS A2 USD HDGE 913 775,935 BGF CONTINENTAL FN NON DIS A2 USD HDGE 945 1,470,331 BGF ASN GRWTH LDERS FN NON DIS A2 3,131 3,378,570 BGF GLO EQTY IN FN NON DIS A2 4,398 3,747,013 BGF EUROPN SPCL SITS FN NON DIS A2 USD 278 732,377 BGF EMERGING EUROPE FN NON DIS A2 628 3,852,461 BDO INSTL. CASH RESERVE FUND 45,522 5,222,438
Total 57,486,799 P
Corporate Bonds with Cross Currency Swaps (CCS)
MQGAU CCS 7.75% 2/13, 8/13 500,000 27,289,913 P FCD CCS 4.55% 10/2, 4/2 500,000 26,307,414 MQGAU CCS 6.25% 7/14, 1/14 500,000 28,023,098 First Pac CCS 6.2% 12/28, 6/28 400,000 22,020,901 FDC CCS 4.45% 10/2, 4/2 500,000 26,289,540 ICT CCS 7.6% 9/17, 3/17 600,000 34,889,508 FDC CCS 4.45% 10/2, 4/2 500,000 25,675,901
Total 190,496,275 P
Forward
FAR EASTERN UNIVERSITY, INCORPORATED AND SUBSIDIARIES
Schedule A - Marketable Securities (Current Marketable Securities and Other Short-term Cash Investments)
May 31, 2018
Name of Issuing Entity and Association of Each IssueAmounts Shown on the Statements of Financial
Position
Income Received and Accrued
Other Investments:
$
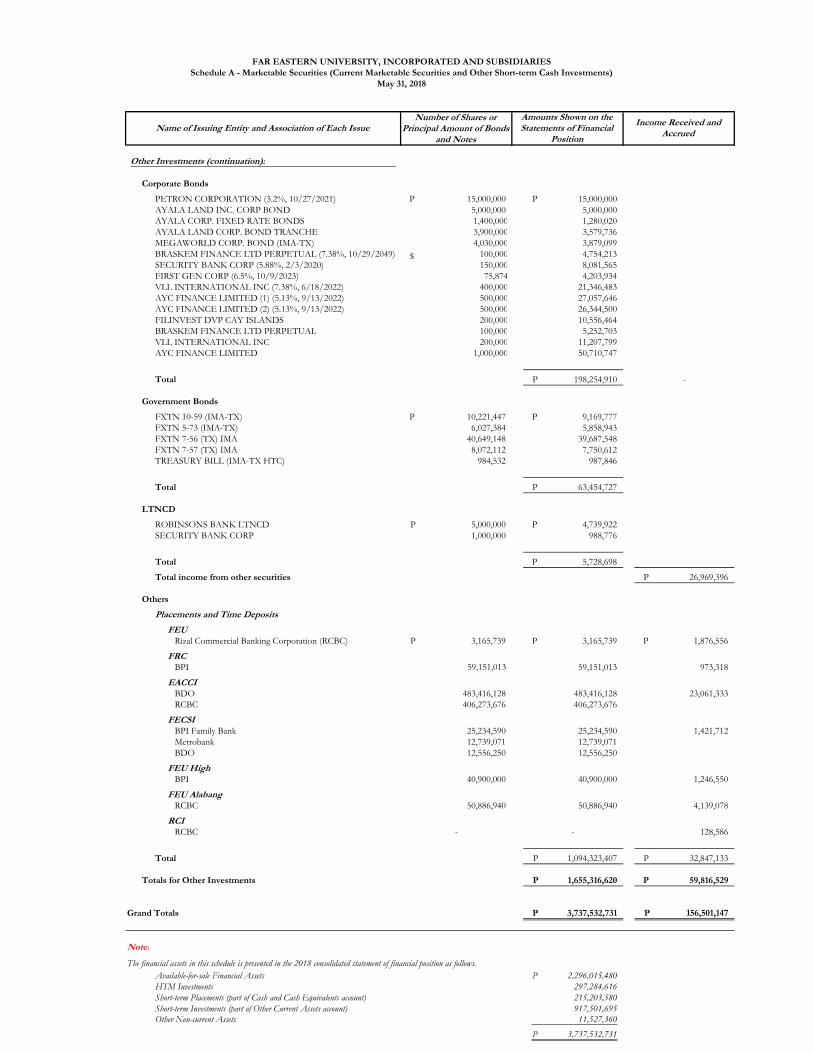
Number of Shares or Principal Amount of Bonds
and Notes
Corporate Bonds
PETRON CORPORATION (3.2%, 10/27/2021) 15,000,000 P 15,000,000 P AYALA LAND INC. CORP BOND 5,000,000 5,000,000 AYALA CORP. FIXED RATE BONDS 1,400,000 1,280,020 AYALA LAND CORP. BOND TRANCHE 3,900,000 3,579,736 MEGAWORLD CORP. BOND (IMA-TX) 4,030,000 3,879,099 BRASKEM FINANCE LTD PERPETUAL (7.38%, 10/29/2049) 100,000 4,754,213 SECURITY BANK CORP (5.88%, 2/3/2020) 150,000 8,081,565 FIRST GEN CORP (6.5%, 10/9/2023) 75,874 4,203,934 VLL INTERNATIONAL INC (7.38%, 6/18/2022) 400,000 21,346,483 AYC FINANCE LIMITED (1) (5.13%, 9/13/2022) 500,000 27,057,646 AYC FINANCE LIMITED (2) (5.13%, 9/13/2022) 500,000 26,344,500 FILINVEST DVP CAY ISLANDS 200,000 10,556,464 BRASKEM FINANCE LTD PERPETUAL 100,000 5,252,703 VLL INTERNATIONAL INC 200,000 11,207,799 AYC FINANCE LIMITED 1,000,000 50,710,747
Total 198,254,910 P -
Government Bonds
FXTN 10-59 (IMA-TX) 10,221,447 P 9,169,777 P FXTN 5-73 (IMA-TX) 6,027,384 5,858,943 FXTN 7-56 (TX) IMA 40,649,148 39,687,548 FXTN 7-57 (TX) IMA 8,072,112 7,750,612 TREASURY BILL (IMA-TX HTC) 984,532 987,846
Total 63,454,727 P
LTNCD
ROBINSONS BANK LTNCD 5,000,000 P 4,739,922 P SECURITY BANK CORP 1,000,000 988,776
Total 5,728,698 P
Total income from other securities 26,969,396 P
Others
Placements and Time Deposits
FEU Rizal Commercial Banking Corporation (RCBC) 3,165,739 P 3,165,739 P 1,876,556 P
FRC BPI 59,151,013 59,151,013 973,318
EACCI BDO 483,416,128 483,416,128 23,061,333 RCBC 406,273,676 406,273,676
FECSI BPI Family Bank 25,234,590 25,234,590 1,421,712 Metrobank 12,739,071 12,739,071 BDO 12,556,250 12,556,250
FEU High BPI 40,900,000 40,900,000 1,246,550
FEU Alabang RCBC 50,886,940 50,886,940 4,139,078
RCI RCBC - - 128,586
Total 1,094,323,407 P 32,847,133 P
Totals for Other Investments 1,655,316,620 P 59,816,529 P
Grand Totals 3,737,532,731 P 156,501,147 P
Note:
The financial assets in this schedule is presented in the 2018 consolidated statement of financial position as follows.
Available-for-sale Financial Assets 2,296,015,480 P
HTM Investments 297,284,616
Short-term Placements (part of Cash and Cash Equivalents account) 215,203,580
Short-term Investments (part of Other Current Assets account) 917,501,695
Other Non-current Assets 11,527,360
3,737,532,731 P
Other Investments (continuation):
FAR EASTERN UNIVERSITY, INCORPORATED AND SUBSIDIARIES
Schedule A - Marketable Securities (Current Marketable Securities and Other Short-term Cash Investments)
May 31, 2018
Name of Issuing Entity and Association of Each IssueAmounts Shown on the Statements of Financial
Position
Income Received and Accrued
$
$
$
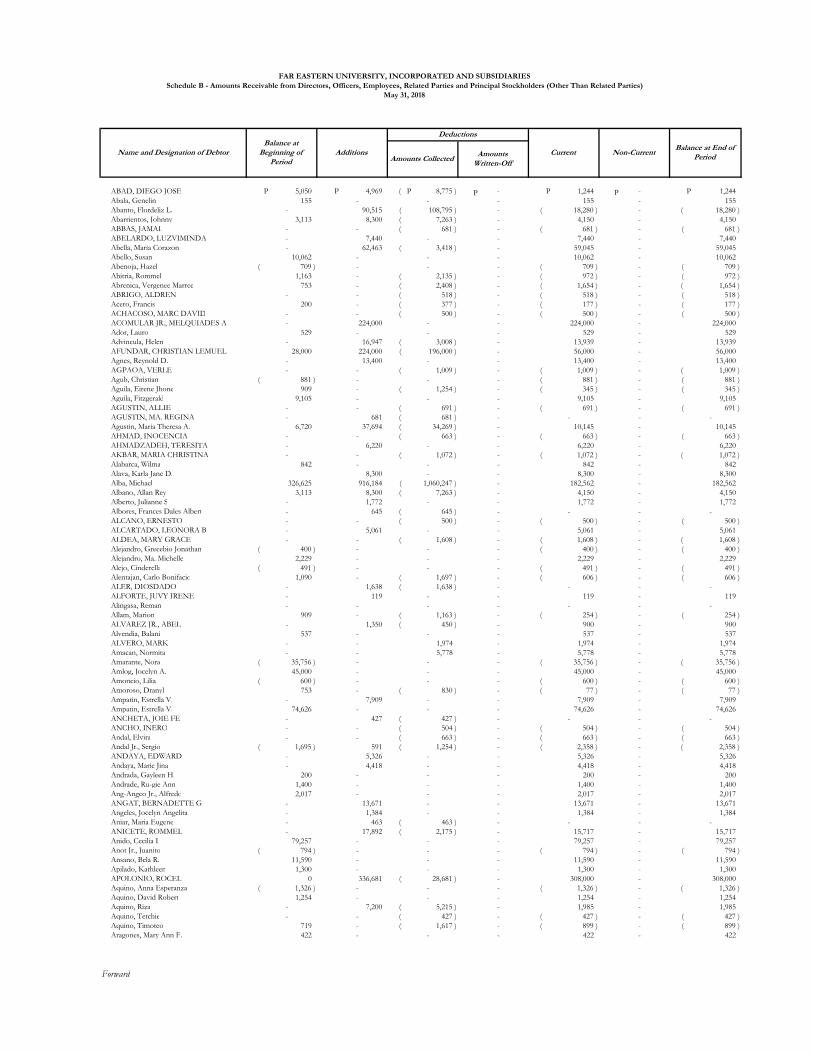
ABAD, DIEGO JOSE 5,050 P 4,969 P 8,775 )( P - 1,244 P - 1,244 P
Abala, Genelin 155 - - - 155 - 155 Abanto, Flordeliz L. - 90,515 108,795 )( - 18,280 )( - 18,280 )( Abarrientos, Johnny 3,113 8,300 7,263 )( - 4,150 - 4,150 ABBAS, JAMAL - - 681 )( - 681 )( - 681 )( ABELARDO, LUZVIMINDA - 7,440 - - 7,440 - 7,440 Abella, Maria Corazon - 62,463 3,418 )( - 59,045 - 59,045 Abello, Susan 10,062 - - - 10,062 - 10,062 Abenoja, Hazel 709 )( - - - 709 )( - 709 )( Abitria, Rommel 1,163 - 2,135 )( - 972 )( - 972 )( Abrenica, Vergenee Marree 753 - 2,408 )( - 1,654 )( - 1,654 )( ABRIGO, ALDREN - - 518 )( - 518 )( - 518 )( Acero, Francis 200 - 377 )( - 177 )( - 177 )( ACHACOSO, MARC DAVID - - 500 )( - 500 )( - 500 )( ACOMULAR JR., MELQUIADES A - 224,000 - - 224,000 - 224,000 Ador, Lauro 529 - - - 529 - 529 Advincula, Helen - 16,947 3,008 )( - 13,939 - 13,939 AFUNDAR, CHRISTIAN LEMUEL 28,000 224,000 196,000 )( - 56,000 - 56,000 Agnes, Reynold D. - 13,400 - - 13,400 - 13,400 AGPAOA, VERLE - - 1,009 )( - 1,009 )( - 1,009 )( Agub, Christian 881 )( - - - 881 )( - 881 )( Aguila, Eirene Jhone 909 - 1,254 )( - 345 )( - 345 )( Aguila, Fitzgerald 9,105 - - - 9,105 - 9,105 AGUSTIN, ALLIE - - 691 )( - 691 )( - 691 )( AGUSTIN, MA. REGINA - 681 681 )( - - - - Agustin, Maria Theresa A. 6,720 37,694 34,269 )( - 10,145 - 10,145 AHMAD, INOCENCIA - - 663 )( - 663 )( - 663 )( AHMADZADEH, TERESITA - 6,220 - - 6,220 - 6,220 AKBAR, MARIA CHRISTINA - - 1,072 )( - 1,072 )( - 1,072 )( Alabarca, Wilma 842 - - - 842 - 842 Alava, Karla Jane D. 8,300 - - 8,300 - 8,300 Alba, Michael 326,625 916,184 1,060,247 )( - 182,562 - 182,562 Albano, Allan Rey 3,113 8,300 7,263 )( - 4,150 - 4,150 Alberto, Julianne S - 1,772 - - 1,772 - 1,772 Albores, Frances Dales Albert - 645 645 )( - - - - ALCANO, ERNESTO - - 500 )( - 500 )( - 500 )( ALCARTADO, LEONORA B - 5,061 - - 5,061 - 5,061 ALDEA, MARY GRACE - - 1,608 )( - 1,608 )( - 1,608 )( Alejandro, Grecebio Jonathan 400 )( - - - 400 )( - 400 )( Alejandro, Ma. Michelle 2,229 - - - 2,229 - 2,229 Alejo, Cinderella 491 )( - - - 491 )( - 491 )( Alentajan, Carlo Bonifacio 1,090 - 1,697 )( - 606 )( - 606 )( ALER, DIOSDADO - 1,638 1,638 )( - - - - ALFORTE, JUVY IRENE - 119 - - 119 - 119 Alingasa, Reman - - - - - - - Allam, Marion 909 - 1,163 )( - 254 )( - 254 )( ALVAREZ JR., ABEL - 1,350 450 )( - 900 - 900 Alvendia, Balani 537 - - - 537 - 537 ALVERO, MARK - - 1,974 - 1,974 - 1,974 Amacan, Normita - - 5,778 - 5,778 - 5,778 Amarante, Nora 35,756 )( - - - 35,756 )( - 35,756 )( Amlog, Jocelyn A. 45,000 - - - 45,000 - 45,000 Amoncio, Lilia 600 )( - - - 600 )( - 600 )( Amoroso, Dranyl 753 - 830 )( - 77 )( - 77 )( Ampatin, Estrella V. - 7,909 - - 7,909 - 7,909 Ampatin, Estrella V. 74,626 - - - 74,626 - 74,626 ANCHETA, JOIE FE - 427 427 )( - - - - ANCHO, INERO - - 504 )( - 504 )( - 504 )( Andal, Elvira - - 663 )( - 663 )( - 663 )( Andal Jr., Sergio 1,695 )( 591 1,254 )( - 2,358 )( - 2,358 )( ANDAYA, EDWARD - 5,326 - - 5,326 - 5,326 Andaya, Marie Jina - 4,418 - - 4,418 - 4,418 Andrada, Gayleen H. 200 - - - 200 - 200 Andrade, Ru-gie Ann 1,400 - - - 1,400 - 1,400 Ang-Angco Jr., Alfredo 2,017 - - - 2,017 - 2,017 ANGAT, BERNADETTE G - 13,671 - - 13,671 - 13,671 Angeles, Jocelyn Angelita - 1,384 - - 1,384 - 1,384 Aniar, Maria Eugene - 463 463 )( - - - - ANICETE, ROMMEL - 17,892 2,175 )( - 15,717 - 15,717 Anido, Cecilia I. 79,257 - - - 79,257 - 79,257 Anot Jr., Juanito 794 )( - - - 794 )( - 794 )( Ansano, Bela R. 11,590 - - - 11,590 - 11,590 Apilado, Kathleen 1,300 - - - 1,300 - 1,300 APOLONIO, ROCEL 0 336,681 28,681 )( - 308,000 - 308,000 Aquino, Anna Esperanza 1,326 )( - - - 1,326 )( - 1,326 )( Aquino, David Robert 1,254 - - - 1,254 - 1,254 Aquino, Riza - 7,200 5,215 )( - 1,985 - 1,985 Aquino, Tetchie - - 427 )( - 427 )( - 427 )( Aquino, Timoteo 719 - 1,617 )( - 899 )( - 899 )( Aragones, Mary Ann F. 422 - - - 422 - 422
Forward
Name and Designation of DebtorBalance at
Beginning of Period
Additions Current
FAR EASTERN UNIVERSITY, INCORPORATED AND SUBSIDIARIES
Schedule B - Amounts Receivable from Directors, Officers, Employees, Related Parties and Principal Stockholders (Other Than Related Parties)
May 31, 2018
Non-CurrentBalance at End of
PeriodAmounts CollectedAmounts
Written-Off
Deductions
P P
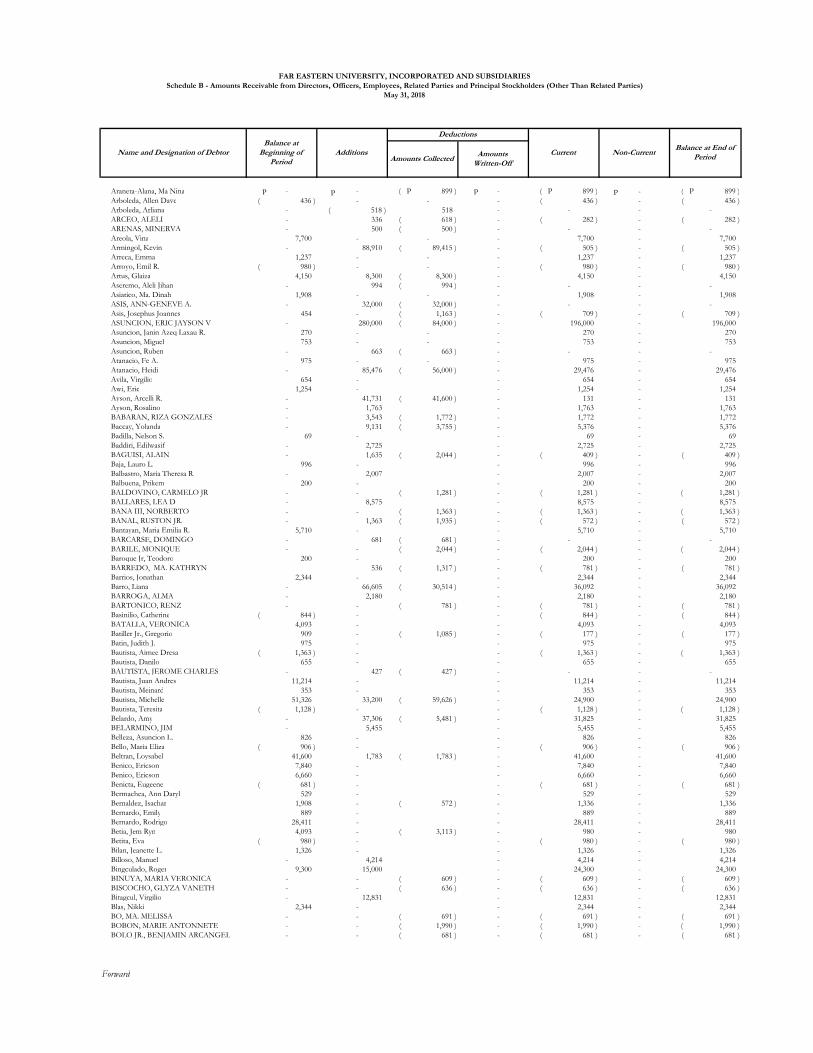
Araneta-Alana, Ma Nina - - 899 )( P - 899 )( P - 899 )( P
Arboleda, Allen Dave 436 )( - - - 436 )( - 436 )( Arboleda, Arliana - 518 )( 518 - - - - ARCEO, ALELI - 336 618 )( - 282 )( - 282 )( ARENAS, MINERVA - 500 500 )( - - - - Areola, Vina 7,700 - - - 7,700 - 7,700 Armingol, Kevin - 88,910 89,415 )( - 505 )( - 505 )( Arreca, Emma 1,237 - - - 1,237 - 1,237 Arroyo, Emil R. 980 )( - - - 980 )( - 980 )( Artus, Glaiza 4,150 8,300 8,300 )( - 4,150 - 4,150 Aseremo, Aleli Jihan - 994 994 )( - - - - Asiatico, Ma. Dinah 1,908 - - - 1,908 - 1,908 ASIS, ANN-GENEVE A. - 32,000 32,000 )( - - - - Asis, Josephus Joannes 454 - 1,163 )( - 709 )( - 709 )( ASUNCION, ERIC JAYSON V - 280,000 84,000 )( - 196,000 - 196,000 Asuncion, Janin Azeq Laxau R. 270 - - - 270 - 270 Asuncion, Miguel 753 - - - 753 - 753 Asuncion, Ruben - 663 663 )( - - - - Atanacio, Fe A. 975 - - - 975 - 975 Atanacio, Heidi - 85,476 56,000 )( - 29,476 - 29,476 Avila, Virgilio 654 - - 654 - 654 Awi, Eric 1,254 - - 1,254 - 1,254 Ayson, Arcelli R. - 41,731 41,600 )( - 131 - 131 Ayson, Rosalino - 1,763 - 1,763 - 1,763 BABARAN, RIZA GONZALES - 3,543 1,772 )( - 1,772 - 1,772 Baccay, Yolanda - 9,131 3,755 )( - 5,376 - 5,376 Badilla, Nelson S. 69 - - 69 - 69 Baddiri, Edilwasif - 2,725 - 2,725 - 2,725 BAGUISI, ALAIN - 1,635 2,044 )( - 409 )( - 409 )( Baja, Lauro L. 996 - - 996 - 996 Balbastro, Maria Theresa R. - 2,007 - 2,007 - 2,007 Balbuena, Prikem 200 - - 200 - 200 BALDOVINO, CARMELO JR - - 1,281 )( - 1,281 )( - 1,281 )( BALLARES, LEA D - 8,575 - 8,575 - 8,575 BANA III, NORBERTO - - 1,363 )( - 1,363 )( - 1,363 )( BANAL, RUSTON JR. - 1,363 1,935 )( - 572 )( - 572 )( Bantayan, Maria Emilia R. 5,710 - - 5,710 - 5,710 BARCARSE, DOMINGO - 681 681 )( - - - - BARILE, MONIQUE - - 2,044 )( - 2,044 )( - 2,044 )( Baroque Jr, Teodoro 200 - - 200 - 200 BARREDO, MA. KATHRYN 536 1,317 )( - 781 )( - 781 )( Barrios, Jonathan 2,344 - - 2,344 - 2,344 Barro, Liana - 66,605 30,514 )( - 36,092 - 36,092 BARROGA, ALMA - 2,180 - 2,180 - 2,180 BARTONICO, RENZ - - 781 )( - 781 )( - 781 )( Basinilio, Catherine 844 )( - - 844 )( - 844 )( BATALLA, VERONICA 4,093 - - 4,093 - 4,093 Batiller Jr., Gregorio 909 - 1,085 )( - 177 )( - 177 )( Batin, Judith J. 975 - - 975 - 975 Bautista, Aimee Dresa 1,363 )( - - 1,363 )( - 1,363 )( Bautista, Danilo 655 - - 655 - 655 BAUTISTA, JEROME CHARLES - 427 427 )( - - - - Bautista, Juan Andres 11,214 - - 11,214 - 11,214 Bautista, Meinard 353 - - 353 - 353 Bautista, Michelle 51,326 33,200 59,626 )( - 24,900 - 24,900 Bautista, Teresita 1,128 )( - - 1,128 )( - 1,128 )( Belardo, Amy - 37,306 5,481 )( - 31,825 - 31,825 BELARMINO, JIM - 5,455 - 5,455 - 5,455 Belleza, Asuncion L. 826 - - 826 - 826 Bello, Maria Eliza 906 )( - - 906 )( - 906 )( Beltran, Loysabel 41,600 1,783 1,783 )( - 41,600 - 41,600 Benico, Ericson 7,840 - - 7,840 - 7,840 Benico, Ericson 6,660 - - 6,660 - 6,660 Benicta, Eugeene 681 )( - - 681 )( - 681 )( Bermachea, Ann Daryl 529 - - 529 - 529 Bernaldez, Isachar 1,908 - 572 )( - 1,336 - 1,336 Bernardo, Emily 889 - - 889 - 889 Bernardo, Rodrigo 28,411 - - 28,411 - 28,411 Betia, Jem Ryn 4,093 - 3,113 )( - 980 - 980 Betita, Eva 980 )( - - 980 )( - 980 )( Bilan, Jeanette L. 1,326 - - 1,326 - 1,326 Billoso, Manuel - 4,214 - 4,214 - 4,214 Bingculado, Roger 9,300 15,000 - 24,300 - 24,300 BINUYA, MARIA VERONICA - - 609 )( - 609 )( - 609 )( BISCOCHO, GLYZA VANETH - - 636 )( - 636 )( - 636 )( Bitagcul, Virgilio - 12,831 - 12,831 - 12,831 Blas, Nikki 2,344 - - 2,344 - 2,344 BO, MA. MELISSA - - 691 )( - 691 )( - 691 )( BOBON, MARIE ANTONNETE - - 1,990 )( - 1,990 )( - 1,990 )( BOLO JR., BENJAMIN ARCANGEL - - 681 )( - 681 )( - 681 )(
Forward
FAR EASTERN UNIVERSITY, INCORPORATED AND SUBSIDIARIES
Schedule B - Amounts Receivable from Directors, Officers, Employees, Related Parties and Principal Stockholders (Other Than Related Parties)
May 31, 2018
Name and Designation of DebtorBalance at
Beginning of Period
Additions
Deductions
Current Non-CurrentBalance at End of
PeriodAmounts CollectedAmounts
Written-Off
P P PP
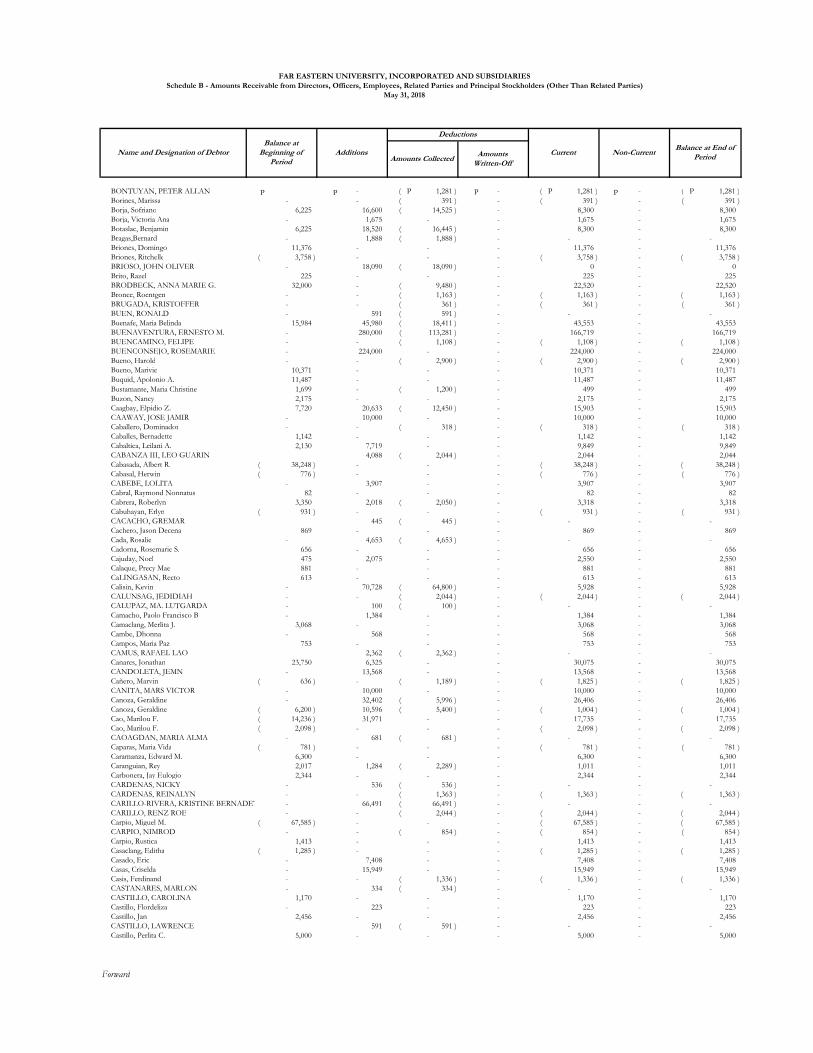
BONTUYAN, PETER ALLAN - 1,281 )( P - 1,281 )( P - 1,281 )( P
Borines, Marissa - - 391 )( - 391 )( - 391 )( Borja, Sofriano 6,225 16,600 14,525 )( - 8,300 - 8,300 Borja, Victoria Ana - 1,675 - - 1,675 - 1,675 Botaslac, Benjamin 6,225 18,520 16,445 )( - 8,300 - 8,300 Bragas,Bernard - 1,888 1,888 )( - - - - Briones, Domingo 11,376 - - - 11,376 - 11,376 Briones, Ritchelle 3,758 )( - - - 3,758 )( - 3,758 )( BRIOSO, JOHN OLIVER - 18,090 18,090 )( - 0 - 0 Brito, Razel 225 - - - 225 - 225 BRODBECK, ANNA MARIE G. 32,000 - 9,480 )( - 22,520 - 22,520 Bronce, Roentgen - - 1,163 )( - 1,163 )( - 1,163 )( BRUGADA, KRISTOFFER - - 361 )( - 361 )( - 361 )( BUEN, RONALD - 591 591 )( - - - - Buenafe, Maria Belinda 15,984 45,980 18,411 )( - 43,553 - 43,553 BUENAVENTURA, ERNESTO M. - 280,000 113,281 )( - 166,719 - 166,719 BUENCAMINO, FELIPE - - 1,108 )( - 1,108 )( - 1,108 )( BUENCONSEJO, ROSEMARIE - 224,000 - - 224,000 - 224,000 Bueno, Harold - - 2,900 )( - 2,900 )( - 2,900 )( Bueno, Marivie 10,371 - - - 10,371 - 10,371 Buquid, Apolonio A. 11,487 - - - 11,487 - 11,487
Bustamante, Maria Christine 1,699 - 1,200 )( - 499 - 499
Buzon, Nancy 2,175 - - - 2,175 - 2,175 Caagbay, Elpidio Z. 7,720 20,633 12,450 )( - 15,903 - 15,903 CAAWAY, JOSE JAMIR - 10,000 - - 10,000 - 10,000 Caballero, Dominador - - 318 )( - 318 )( - 318 )( Caballes, Bernadette 1,142 - - - 1,142 - 1,142 Cabaltica, Leilani A. 2,130 7,719 - - 9,849 - 9,849 CABANZA III, LEO GUARIN 4,088 2,044 )( - 2,044 - 2,044 Cabasada, Albert R. 38,248 )( - - - 38,248 )( - 38,248 )( Cabasal, Herwin 776 )( - - - 776 )( - 776 )( CABEBE, LOLITA - 3,907 - - 3,907 - 3,907 Cabral, Raymond Nonnatus 82 - - - 82 - 82 Cabrera, Roberlyn 3,350 2,018 2,050 )( - 3,318 - 3,318 Cabuhayan, Erlyn 931 )( - - - 931 )( - 931 )( CACACHO, GREMAR 445 445 )( - - - - Cachero, Jason Decena 869 - - - 869 - 869 Cada, Rosalie - 4,653 4,653 )( - - - - Cadorna, Rosemarie S. 656 - - - 656 - 656 Cajuday, Noel 475 2,075 - - 2,550 - 2,550 Calaque, Precy Mae 881 - - - 881 - 881 CaLINGASAN, Recto 613 - - - 613 - 613 Calisin, Kevin - 70,728 64,800 )( - 5,928 - 5,928 CALUNSAG, JEDIDIAH - - 2,044 )( - 2,044 )( - 2,044 )( CALUPAZ, MA. LUTGARDA - 100 100 )( - - - - Camacho, Paolo Francisco B - 1,384 - - 1,384 - 1,384 Camaclang, Merlita J. 3,068 - - - 3,068 - 3,068 Cambe, Dhonna - 568 - - 568 - 568 Campos, Maria Paz 753 - - - 753 - 753 CAMUS, RAFAEL LAO 2,362 2,362 )( - - - - Canares, Jonathan 23,750 6,325 - - 30,075 - 30,075 CANDOLETA, JEMN - 13,568 - - 13,568 - 13,568 Cañero, Marvin 636 )( - 1,189 )( - 1,825 )( - 1,825 )( CANITA, MARS VICTOR - 10,000 - - 10,000 - 10,000 Canoza, Geraldine - 32,402 5,996 )( - 26,406 - 26,406 Canoza, Geraldine 6,200 )( 10,596 5,400 )( - 1,004 )( - 1,004 )( Cao, Marilou F. 14,236 )( 31,971 - - 17,735 - 17,735 Cao, Marilou F. 2,098 )( - - - 2,098 )( - 2,098 )( CAOAGDAN, MARIA ALMA - 681 681 )( - - - - Caparas, Maria Vida 781 )( - - - 781 )( - 781 )( Caramanza, Edward M. 6,300 - - - 6,300 - 6,300 Caranguian, Rey 2,017 1,284 2,289 )( - 1,011 - 1,011 Carbonera, Jay Eulogio 2,344 - - - 2,344 - 2,344 CARDENAS, NICKY - 536 536 )( - - - - CARDENAS, REINALYN - - 1,363 )( - 1,363 )( - 1,363 )( CARILLO-RIVERA, KRISTINE BERNADETTE - 66,491 66,491 )( - - - - CARILLO, RENZ ROE - - 2,044 )( - 2,044 )( - 2,044 )( Carpio, Miguel M. 67,585 )( - - - 67,585 )( - 67,585 )( CARPIO, NIMROD - - 854 )( - 854 )( - 854 )( Carpio, Rustica 1,413 - - - 1,413 - 1,413 Casaclang, Editha 1,285 )( - - - 1,285 )( - 1,285 )( Casado, Eric - 7,408 - - 7,408 - 7,408 Casas, Criselda - 15,949 - - 15,949 - 15,949 Casis, Ferdinand - - 1,336 )( - 1,336 )( - 1,336 )( CASTANARES, MARLON - 334 334 )( - - - - CASTILLO, CAROLINA 1,170 - - - 1,170 - 1,170 Castillo, Flordeliza - 223 - - 223 - 223 Castillo, Jan 2,456 - - - 2,456 - 2,456 CASTILLO, LAWRENCE 591 591 )( - - - - Castillo, Perlita C. 5,000 - - - 5,000 - 5,000
Forward
FAR EASTERN UNIVERSITY, INCORPORATED AND SUBSIDIARIES
Schedule B - Amounts Receivable from Directors, Officers, Employees, Related Parties and Principal Stockholders (Other Than Related Parties)
May 31, 2018
Name and Designation of DebtorBalance at
Beginning of Period
Additions
Deductions
Current Non-CurrentBalance at End of
PeriodAmounts CollectedAmounts
Written-Off
P PP P
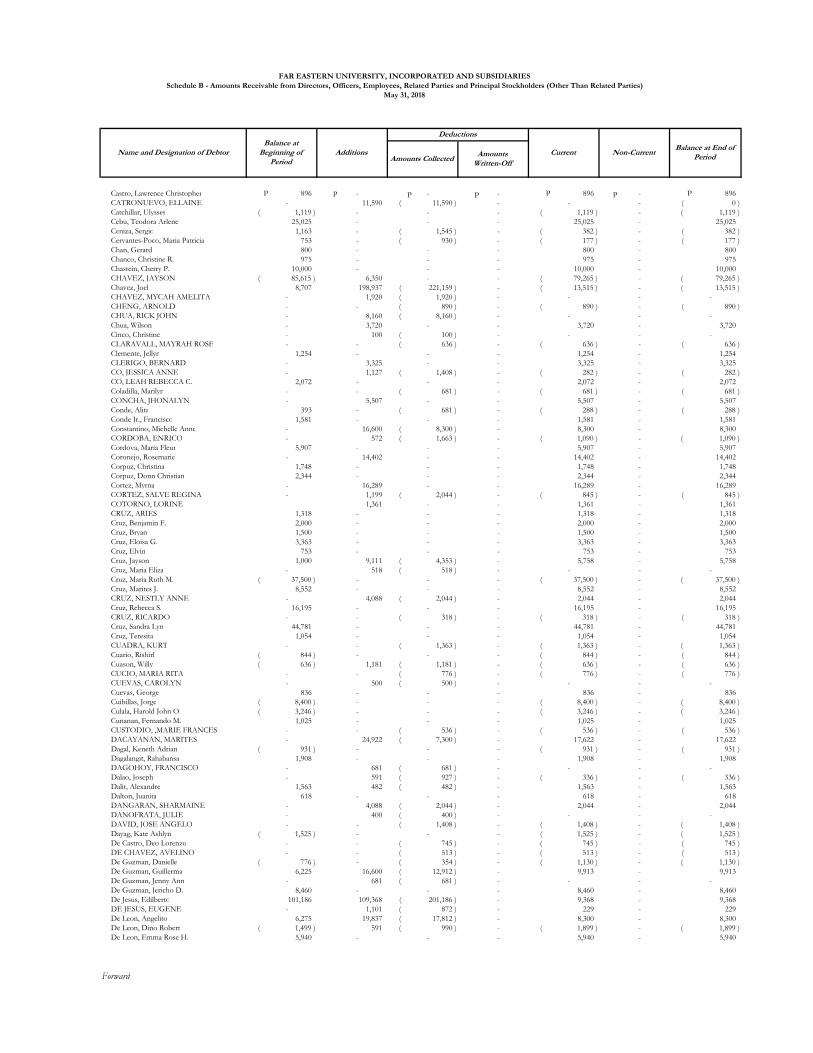
Castro, Lawrence Christopher 896 P - - - 896 P - 896 P
CATRONUEVO, ELLAINE - 11,590 11,590 )( - - - 0 )( Catchillar, Ulysses 1,119 )( - - - 1,119 )( - 1,119 )( Cebu, Teodora Arlene 25,025 - - - 25,025 - 25,025 Ceniza, Sergio 1,163 - 1,545 )( - 382 )( - 382 )( Cervantes-Poco, Maria Patricia 753 - 930 )( - 177 )( - 177 )( Chan, Gerard 800 - - - 800 - 800 Chanco, Christine R. 975 - - - 975 - 975 Chastein, Cherry P. 10,000 - - - 10,000 - 10,000 CHAVEZ, JAYSON 85,615 )( 6,350 - - 79,265 )( - 79,265 )( Chavez, Joel 8,707 198,937 221,159 )( - 13,515 )( - 13,515 )( CHAVEZ, MYCAH AMELITA - 1,920 1,920 )( - - - - CHENG, ARNOLD - - 890 )( - 890 )( - 890 )( CHUA, RICK JOHN - 8,160 8,160 )( - - - - Chua, Wilson - 3,720 - - 3,720 - 3,720 Cinco, Christine - 100 100 )( - - - - CLARAVALL, MAYRAH ROSE - - 636 )( - 636 )( - 636 )( Clemente, Jellyn 1,254 - - - 1,254 - 1,254 CLERIGO, BERNARD - 3,325 - - 3,325 - 3,325 CO, JESSICA ANNE - 1,127 1,408 )( - 282 )( - 282 )( CO, LEAH REBECCA C. 2,072 - - - 2,072 - 2,072 Coladilla, Marilyn - - 681 )( - 681 )( - 681 )( CONCHA, JHONALYN - 5,507 - - 5,507 - 5,507 Conde, Alita 393 - 681 )( - 288 )( - 288 )( Conde Jr., Francisco 1,581 - - - 1,581 - 1,581 Constantino, Michelle Anne - 16,600 8,300 )( - 8,300 - 8,300 CORDOBA, ENRICO - 572 1,663 )( - 1,090 )( - 1,090 )( Cordova, Maria Fleur 5,907 - - - 5,907 - 5,907 Coronejo, Rosemarie - 14,402 - - 14,402 - 14,402 Corpuz, Christina 1,748 - - - 1,748 - 1,748 Corpuz, Donn Christian 2,344 - - - 2,344 - 2,344 Cortez, Myrna - 16,289 - - 16,289 - 16,289 CORTEZ, SALVE REGINA - 1,199 2,044 )( - 845 )( - 845 )( COTORNO, LORINE 1,361 - - 1,361 - 1,361 CRUZ, ARIES 1,318 - - - 1,318 - 1,318 Cruz, Benjamin F. 2,000 - - - 2,000 - 2,000 Cruz, Bryan 1,500 - - - 1,500 - 1,500 Cruz, Eloisa G. 3,363 - - - 3,363 - 3,363 Cruz, Elvin 753 - - - 753 - 753 Cruz, Jayson 1,000 9,111 4,353 )( - 5,758 - 5,758 Cruz, Maria Eliza - 518 518 )( - - - - Cruz, Maria Ruth M. 37,500 )( - - - 37,500 )( - 37,500 )( Cruz, Marites J. 8,552 - - - 8,552 - 8,552 CRUZ, NESTLY ANNE - 4,088 2,044 )( - 2,044 - 2,044 Cruz, Rebecca S. 16,195 - - - 16,195 - 16,195 CRUZ, RICARDO - - 318 )( - 318 )( - 318 )( Cruz, Sandra Lyn 44,781 - - - 44,781 - 44,781 Cruz, Teresita 1,054 - - - 1,054 - 1,054 CUADRA, KURT - - 1,363 )( - 1,363 )( - 1,363 )( Cuario, Rishirl 844 )( - - - 844 )( - 844 )( Cuason, Willy 636 )( 1,181 1,181 )( - 636 )( - 636 )( CUCIO, MARIA RITA - - 776 )( - 776 )( - 776 )( CUEVAS, CAROLYN - 500 500 )( - - - - Cuevas, George 836 - - - 836 - 836 Cuibillas, Jorge 8,400 )( - - - 8,400 )( - 8,400 )( Culala, Harold John O. 3,246 )( - - - 3,246 )( - 3,246 )( Cunanan, Fernando M. 1,025 - - - 1,025 - 1,025 CUSTODIO, ,MARIE FRANCES - - 536 )( - 536 )( - 536 )( DACAYANAN, MARITES - 24,922 7,300 )( - 17,622 - 17,622 Dagal, Keneth Adrian 931 )( - - - 931 )( - 931 )( Dagalangit, Rahabansa 1,908 - - - 1,908 - 1,908 DAGOHOY, FRANCISCO - 681 681 )( - - - - Dalao, Joseph - 591 927 )( - 336 )( - 336 )( Dalit, Alexandre 1,563 482 482 )( - 1,563 - 1,563 Dalton, Juanita 618 - - - 618 - 618 DANGARAN, SHARMAINE - 4,088 2,044 )( - 2,044 - 2,044 DANOFRATA, JULIE - 400 400 )( - - - - DAVID, JOSE ANGELO - - 1,408 )( - 1,408 )( - 1,408 )( Dayag, Kate Ashlyn 1,525 )( - - - 1,525 )( - 1,525 )( De Castro, Deo Lorenzo - - 745 )( - 745 )( - 745 )( DE CHAVEZ, AVELINO - - 513 )( - 513 )( - 513 )( De Guzman, Danielle 776 )( - 354 )( - 1,130 )( - 1,130 )( De Guzman, Guillerma 6,225 16,600 12,912 )( - 9,913 - 9,913 De Guzman, Jenny Ann - 681 681 )( - - - - De Guzman, Jericho D. 8,460 - - - 8,460 - 8,460 De Jesus, Edilberto 101,186 109,368 201,186 )( - 9,368 - 9,368 DE JESUS, EUGENE - 1,101 872 )( - 229 - 229 De Leon, Angelito 6,275 19,837 17,812 )( - 8,300 - 8,300 De Leon, Dino Robert 1,499 )( 591 990 )( - 1,899 )( - 1,899 )( De Leon, Emma Rose H. 5,940 - - - 5,940 - 5,940
Forward
FAR EASTERN UNIVERSITY, INCORPORATED AND SUBSIDIARIES
Schedule B - Amounts Receivable from Directors, Officers, Employees, Related Parties and Principal Stockholders (Other Than Related Parties)
May 31, 2018
Name and Designation of DebtorBalance at
Beginning of Period
Additions
Deductions
Current Non-CurrentBalance at End of
PeriodAmounts CollectedAmounts
Written-Off
P P PP
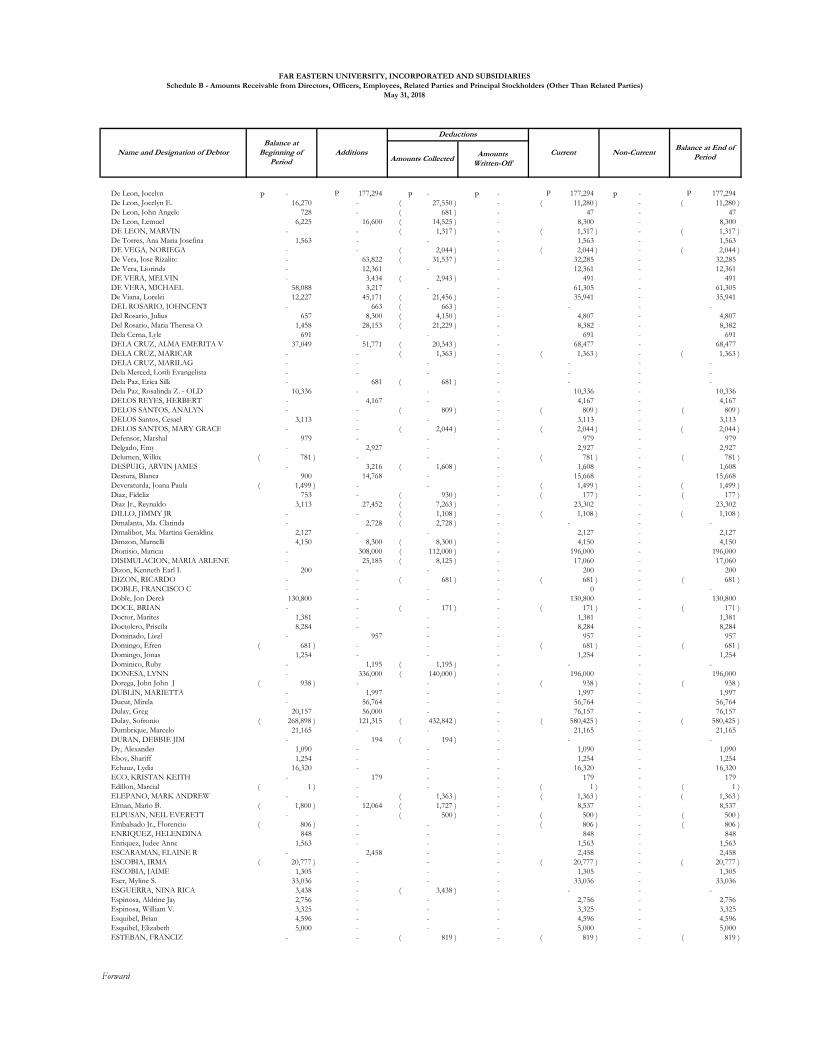
De Leon, Jocelyn - 177,294 P - - 177,294 P - 177,294 P
De Leon, Jocelyn E. 16,270 - 27,550 )( - 11,280 )( - 11,280 )( De Leon, John Angelo 728 - 681 )( - 47 - 47 De Leon, Lemuel 6,225 16,600 14,525 )( - 8,300 - 8,300 DE LEON, MARVIN - - 1,317 )( - 1,317 )( - 1,317 )( De Torres, Ana Maria Josefina 1,563 - - - 1,563 - 1,563 DE VEGA, NORIEGA - - 2,044 )( - 2,044 )( - 2,044 )( De Vera, Jose Rizalito - 63,822 31,537 )( - 32,285 - 32,285 De Vera, Liorinda - 12,361 - - 12,361 - 12,361 DE VERA, MELVIN - 3,434 2,943 )( - 491 - 491 DE VERA, MICHAEL 58,088 3,217 - - 61,305 - 61,305 De Viana, Lorelei 12,227 45,171 21,456 )( - 35,941 - 35,941 DEL ROSARIO, JOHNCENT - 663 663 )( - - - - Del Rosario, Julius 657 8,300 4,150 )( - 4,807 - 4,807 Del Rosario, Maria Theresa O. 1,458 28,153 21,229 )( - 8,382 - 8,382 Dela Cerna, Lyle 691 - - - 691 - 691 DELA CRUZ, ALMA EMERITA V 37,049 51,771 20,343 )( - 68,477 - 68,477 DELA CRUZ, MARICAR - - 1,363 )( - 1,363 )( - 1,363 )( DELA CRUZ, MARILAG - - - - - - - Dela Merced, Lorili Evangelista - - - - - - - Dela Paz, Erica Silk - 681 681 )( - - - - Dela Paz, Rosalinda Z. - OLD 10,336 - - - 10,336 - 10,336 DELOS REYES, HERBERT - 4,167 - - 4,167 - 4,167 DELOS SANTOS, ANALYN - - 809 )( - 809 )( - 809 )( DELOS Santos, Cesael 3,113 - - - 3,113 - 3,113 DELOS SANTOS, MARY GRACE - - 2,044 )( - 2,044 )( - 2,044 )( Defensor, Marshal 979 - - - 979 - 979 Delgado, Emy - 2,927 - - 2,927 - 2,927 Delumen, Wilkie 781 )( - - - 781 )( - 781 )( DESPUIG, ARVIN JAMES - 3,216 1,608 )( - 1,608 - 1,608 Destura, Blanca 900 14,768 - - 15,668 - 15,668 Deveraturda, Joana Paula 1,499 )( - - - 1,499 )( - 1,499 )( Diaz, Fideliz 753 - 930 )( - 177 )( - 177 )( Diaz Jr., Reynaldo 3,113 27,452 7,263 )( - 23,302 - 23,302 DILLO, JIMMY JR - - 1,108 )( - 1,108 )( - 1,108 )( Dimalanta, Ma. Clarinda - 2,728 2,728 )( - - - - Dimalibot, Ma. Martina Geraldine 2,127 - - - 2,127 - 2,127 Dimzon, Marnelli 4,150 8,300 8,300 )( - 4,150 - 4,150 Dionisio, Maricar - 308,000 112,000 )( - 196,000 - 196,000 DISIMULACION, MARIA ARLENE - 25,185 8,125 )( - 17,060 - 17,060 Dizon, Kenneth Earl I. 200 - - - 200 - 200 DIZON, RICARDO - - 681 )( - 681 )( - 681 )( DOBLE, FRANCISCO C - - - - 0 - - Doble, Jon Derek 130,800 - - - 130,800 - 130,800 DOCE, BRIAN - - 171 )( - 171 )( - 171 )( Doctor, Marites 1,381 - - - 1,381 - 1,381 Doctolero, Priscila 8,284 - - - 8,284 - 8,284 Dominado, Liezl - 957 - - 957 - 957 Domingo, Efren 681 )( - - - 681 )( - 681 )( Domingo, Jonas 1,254 - - - 1,254 - 1,254 Dominico, Ruby - 1,195 1,195 )( - - - - DONESA, LYNN - 336,000 140,000 )( - 196,000 - 196,000 Dorega, John John J 938 )( - - - 938 )( - 938 )( DUBLIN, MARIETTA - 1,997 - - 1,997 - 1,997 Ducut, Mirela - 56,764 - - 56,764 - 56,764 Dulay, Greg 20,157 56,000 - - 76,157 - 76,157 Dulay, Sofronio 268,898 )( 121,315 432,842 )( - 580,425 )( - 580,425 )( Dumbrique, Marcelo 21,165 - - - 21,165 - 21,165 DURAN, DEBBIE JIM - 194 194 )( - - - - Dy, Alexander 1,090 - - - 1,090 - 1,090 Eboy, Shariff 1,254 - - - 1,254 - 1,254 Echauz, Lydia 16,320 - - - 16,320 - 16,320 ECO, KRISTAN KEITH - 179 - - 179 - 179 Edillon, Marcial 1 )( - - - 1 )( - 1 )( ELEPANO, MARK ANDREW - - 1,363 )( - 1,363 )( - 1,363 )( Elman, Mario B. 1,800 )( 12,064 1,727 )( - 8,537 - 8,537 ELPUSAN, NEIL EVERETT - - 500 )( - 500 )( - 500 )( Embalsado Jr., Florencio 806 )( - - - 806 )( - 806 )( ENRIQUEZ, HELENDINA 848 - - - 848 - 848 Enriquez, Judee Anne 1,563 - - - 1,563 - 1,563 ESCARAMAN, ELAINE R - 2,458 - - 2,458 - 2,458 ESCOBIA, IRMA 20,777 )( - - - 20,777 )( - 20,777 )( ESCOBIA, JAIME 1,305 - - - 1,305 - 1,305 Eser, Myline S. 33,036 - - - 33,036 - 33,036 ESGUERRA, NINA RICA 3,438 - 3,438 )( - - - - Espinosa, Aldrine Jay 2,756 - - - 2,756 - 2,756 Espinosa, William V. 3,325 - - - 3,325 - 3,325 Esquibel, Brian 4,596 - - - 4,596 - 4,596 Esquibel, Elizabeth 5,000 - - - 5,000 - 5,000 ESTEBAN, FRANCIZ - - 819 )( - 819 )( - 819 )(
Forward
Schedule B - Amounts Receivable from Directors, Officers, Employees, Related Parties and Principal Stockholders (Other Than Related Parties)
May 31, 2018
Name and Designation of DebtorBalance at
Beginning of Period
Additions
Deductions
Current Non-CurrentBalance at End of
PeriodAmounts CollectedAmounts
Written-Off
FAR EASTERN UNIVERSITY, INCORPORATED AND SUBSIDIARIES
PP PP
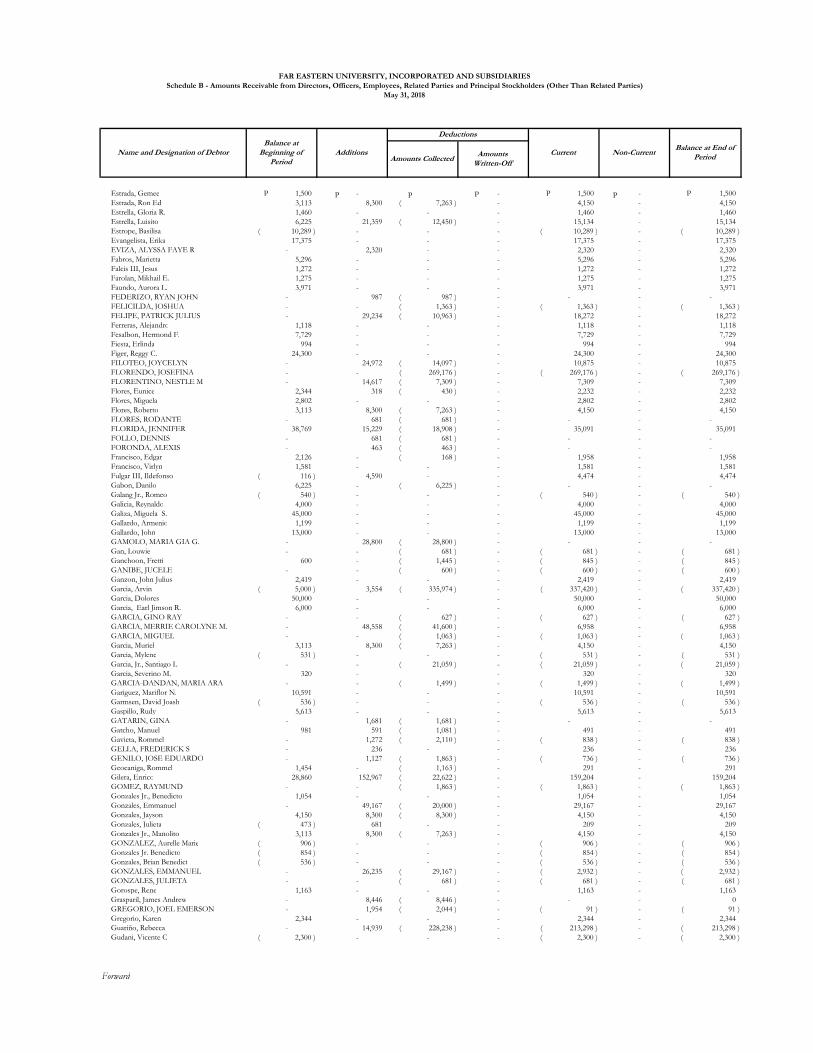
Estrada, Gemee 1,500 P - - 1,500 P - 1,500 P
Estrada, Ron Ed 3,113 8,300 7,263 )( - 4,150 - 4,150 Estrella, Gloria R. 1,460 - - - 1,460 - 1,460 Estrella, Luisito 6,225 21,359 12,450 )( - 15,134 - 15,134 Estrope, Basilisa 10,289 )( - - - 10,289 )( - 10,289 )( Evangelista, Erika 17,375 - - - 17,375 - 17,375 EVIZA, ALYSSA FAYE R - 2,320 - - 2,320 - 2,320 Fabros, Marietta 5,296 - - - 5,296 - 5,296 Falcis III, Jesus 1,272 - - - 1,272 - 1,272 Farolan, Mikhail E. 1,275 - - - 1,275 - 1,275 Faundo, Aurora L. 3,971 - - - 3,971 - 3,971 FEDERIZO, RYAN JOHN - 987 987 )( - - - - FELICILDA, JOSHUA - - 1,363 )( - 1,363 )( - 1,363 )( FELIPE, PATRICK JULIUS - 29,234 10,963 )( - 18,272 - 18,272 Ferreras, Alejandro 1,118 - - - 1,118 - 1,118 Fesalbon, Hermond F. 7,729 - - - 7,729 - 7,729 Fiesta, Erlinda 994 - - - 994 - 994 Figer, Reggy C. 24,300 - - - 24,300 - 24,300 FILOTEO, JOYCELYN - 24,972 14,097 )( - 10,875 - 10,875 FLORENDO, JOSEFINA - - 269,176 )( - 269,176 )( - 269,176 )( FLORENTINO, NESTLE M - 14,617 7,309 )( - 7,309 - 7,309 Flores, Eunice 2,344 318 430 )( - 2,232 - 2,232 Flores, Miguela 2,802 - - - 2,802 - 2,802 Flores, Roberto 3,113 8,300 7,263 )( - 4,150 - 4,150 FLORES, RODANTE - 681 681 )( - - - - FLORIDA, JENNIFER 38,769 15,229 18,908 )( - 35,091 - 35,091 FOLLO, DENNIS - 681 681 )( - - - - FORONDA, ALEXIS - 463 463 )( - - - - Francisco, Edgar 2,126 - 168 )( - 1,958 - 1,958 Francisco, Virlyn 1,581 - - - 1,581 - 1,581 Fulgar III, Ildefonso 116 )( 4,590 - - 4,474 - 4,474 Gabon, Danilo 6,225 - 6,225 )( - - - - Galang Jr., Romeo 540 )( - - - 540 )( - 540 )( Galicia, Reynaldo 4,000 - - - 4,000 - 4,000 Galiza, Miguela S. 45,000 - - - 45,000 - 45,000 Gallardo, Armenio 1,199 - - - 1,199 - 1,199 Gallardo, John 13,000 - - - 13,000 - 13,000 GAMOLO, MARIA GIA G. - 28,800 28,800 )( - - - - Gan, Louwie - - 681 )( - 681 )( - 681 )( Ganchoon, Fretti 600 - 1,445 )( - 845 )( - 845 )( GANIBE, JUCELE - - 600 )( - 600 )( - 600 )( Ganzon, John Julius 2,419 - - - 2,419 - 2,419 Garcia, Arvin 5,000 )( 3,554 335,974 )( - 337,420 )( - 337,420 )( Garcia, Dolores 50,000 - - - 50,000 - 50,000 Garcia, Earl Jimson R. 6,000 - - - 6,000 - 6,000 GARCIA, GINO RAY - - 627 )( - 627 )( - 627 )( GARCIA, MERRIE CAROLYNE M. - 48,558 41,600 )( - 6,958 - 6,958 GARCIA, MIGUEL - - 1,063 )( - 1,063 )( - 1,063 )( Garcia, Muriel 3,113 8,300 7,263 )( - 4,150 - 4,150 Garcia, Mylene 531 )( - - - 531 )( - 531 )( Garcia, Jr., Santiago L - - 21,059 )( - 21,059 )( - 21,059 )( Garcia, Severino M. 320 - - 320 - 320 GARCIA-DANDAN, MARIA ARA - - 1,499 )( - 1,499 )( - 1,499 )( Gariguez, Mariflor N. 10,591 - - - 10,591 - 10,591 Garmsen, David Joash 536 )( - - - 536 )( - 536 )( Gaspillo, Rudy 5,613 - - - 5,613 - 5,613 GATARIN, GINA - 1,681 1,681 )( - - - - Gatcho, Manuel 981 591 1,081 )( - 491 - 491 Gavieta, Rommel - 1,272 2,110 )( - 838 )( - 838 )( GELLA, FREDERICK S - 236 - - 236 - 236 GENILO, JOSE EDUARDO - 1,127 1,863 )( - 736 )( - 736 )( Geocaniga, Rommel 1,454 - 1,163 )( - 291 - 291 Gilera, Enrico 28,860 152,967 22,622 )( - 159,204 - 159,204 GOMEZ, RAYMUND - - 1,863 )( - 1,863 )( - 1,863 )( Gonzales Jr., Benedicto 1,054 - - - 1,054 - 1,054 Gonzales, Emmanuel - 49,167 20,000 )( - 29,167 - 29,167 Gonzales, Jayson 4,150 8,300 8,300 )( - 4,150 - 4,150 Gonzales, Julieta 473 )( 681 - - 209 - 209 Gonzales Jr., Manolito 3,113 8,300 7,263 )( - 4,150 - 4,150 GONZALEZ, Aurelle Marie 906 )( - - - 906 )( - 906 )( Gonzales Jr. Benedicto 854 )( - - - 854 )( - 854 )( Gonzales, Brian Benedict 536 )( - - - 536 )( - 536 )( GONZALES, EMMANUEL - 26,235 29,167 )( - 2,932 )( - 2,932 )( GONZALES, JULIETA - - 681 )( - 681 )( - 681 )( Gorospe, Rene 1,163 - - - 1,163 - 1,163 Grasparil, James Andrew - 8,446 8,446 )( - - - 0 GREGORIO, JOEL EMERSON - 1,954 2,044 )( - 91 )( - 91 )( Gregorio, Karen 2,344 - - - 2,344 - 2,344 Guariño, Rebecca - 14,939 228,238 )( - 213,298 )( - 213,298 )( Gudani, Vicente C 2,300 )( - - - 2,300 )( - 2,300 )(
Forward
FAR EASTERN UNIVERSITY, INCORPORATED AND SUBSIDIARIES
Schedule B - Amounts Receivable from Directors, Officers, Employees, Related Parties and Principal Stockholders (Other Than Related Parties)
May 31, 2018
Name and Designation of DebtorBalance at
Beginning of Period
Additions
Deductions
Current Non-CurrentBalance at End of
PeriodAmounts CollectedAmounts
Written-Off
P PP P
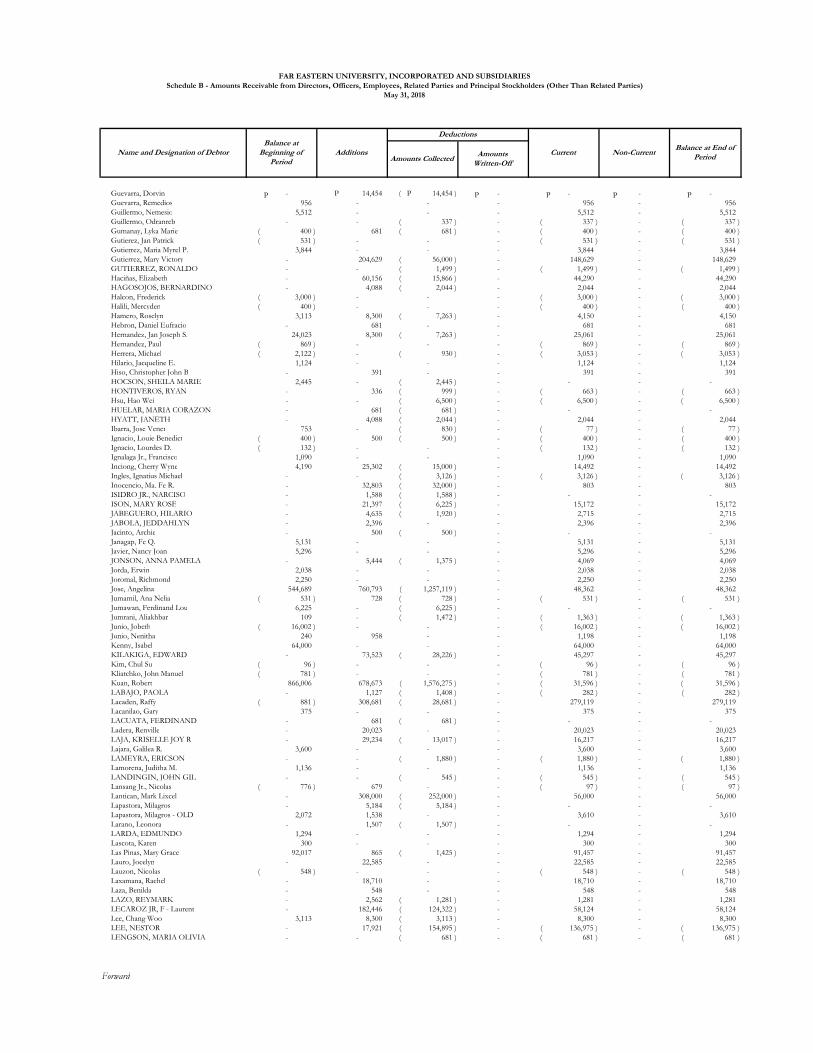
Guevarra, Dorvin - 14,454 P 14,454 )( P - - - -
Guevarra, Remedios 956 - - - 956 - 956 Guillermo, Nemesio 5,512 - - - 5,512 - 5,512 Guillermo, Odranreb - - 337 )( - 337 )( - 337 )( Gumanay, Lyka Marie 400 )( 681 681 )( - 400 )( - 400 )( Gutierez, Jan Patrick 531 )( - - - 531 )( - 531 )( Gutierrez, Maria Myrel P. 3,844 - - - 3,844 - 3,844 Gutierrez, Mary Victory - 204,629 56,000 )( - 148,629 - 148,629 GUTIERREZ, RONALDO - - 1,499 )( - 1,499 )( - 1,499 )( Haciñas, Elizabeth - 60,156 15,866 )( - 44,290 - 44,290 HAGOSOJOS, BERNARDINO - 4,088 2,044 )( - 2,044 - 2,044 Halcon, Frederick 3,000 )( - - - 3,000 )( - 3,000 )( Halili, Mercyden 400 )( - - - 400 )( - 400 )( Hamero, Roselyn 3,113 8,300 7,263 )( - 4,150 - 4,150 Hebron, Daniel Eufracio - 681 - - 681 - 681 Hernandez, Jan Joseph S. 24,023 8,300 7,263 )( - 25,061 - 25,061 Hernandez, Paul 869 )( - - - 869 )( - 869 )( Herrera, Michael 2,122 )( - 930 )( - 3,053 )( - 3,053 )( Hilario, Jacqueline E. 1,124 - - - 1,124 - 1,124 Hiso, Christopher John B - 391 - - 391 - 391 HOCSON, SHEILA MARIE 2,445 - 2,445 )( - - - - HONTIVEROS, RYAN - 336 999 )( - 663 )( - 663 )( Hsu, Hao Wei - - 6,500 )( - 6,500 )( - 6,500 )( HUELAR, MARIA CORAZON - 681 681 )( - - - - HYATT, JANETH - 4,088 2,044 )( - 2,044 - 2,044 Ibarra, Jose Vener 753 - 830 )( - 77 )( - 77 )( Ignacio, Louie Benedict 400 )( 500 500 )( - 400 )( - 400 )( Ignacio, Lourdes D. 132 )( - - - 132 )( - 132 )( Ignalaga Jr., Francisco 1,090 - - - 1,090 - 1,090 Inciong, Cherry Wyne 4,190 25,302 15,000 )( - 14,492 - 14,492 Ingles, Ignatius Michael - - 3,126 )( - 3,126 )( - 3,126 )( Inocencio, Ma. Fe R. - 32,803 32,000 )( - 803 - 803 ISIDRO JR., NARCISO - 1,588 1,588 )( - - - - ISON, MARY ROSE - 21,397 6,225 )( - 15,172 - 15,172 JABEGUERO, HILARIO - 4,635 1,920 )( - 2,715 - 2,715 JABOLA, JEDDAHLYN - 2,396 - - 2,396 - 2,396 Jacinto, Archie - 500 500 )( - - - - Janagap, Fe Q. 5,131 - - - 5,131 - 5,131 Javier, Nancy Joan 5,296 - - - 5,296 - 5,296 JONSON, ANNA PAMELA - 5,444 1,375 )( - 4,069 - 4,069 Jorda, Erwin 2,038 - - - 2,038 - 2,038 Joromal, Richmond 2,250 - - - 2,250 - 2,250 Jose, Angelina 544,689 760,793 1,257,119 )( - 48,362 - 48,362 Jumamil, Ana Nelia 531 )( 728 728 )( - 531 )( - 531 )( Jumawan, Ferdinand Lou 6,225 - 6,225 )( - - - - Jumrani, Aliakhbar 109 - 1,472 )( - 1,363 )( - 1,363 )( Junio, Jobeth 16,002 )( - - - 16,002 )( - 16,002 )( Junio, Nenitha 240 958 - - 1,198 - 1,198 Kenny, Isabel 64,000 - - - 64,000 - 64,000 KILAKIGA, EDWARD - 73,523 28,226 )( - 45,297 - 45,297 Kim, Chul Su 96 )( - - - 96 )( - 96 )( Kliatchko, John Manuel 781 )( - - - 781 )( - 781 )( Kuan, Robert 866,006 678,673 1,576,275 )( - 31,596 )( - 31,596 )( LABAJO, PAOLA - 1,127 1,408 )( - 282 )( - 282 )( Lacaden, Raffy 881 )( 308,681 28,681 )( - 279,119 - 279,119 Lacanilao, Gary 375 - - - 375 - 375 LACUATA, FERDINAND - 681 681 )( - - - - Ladera, Renville - 20,023 - - 20,023 - 20,023 LAJA, KRISELLE JOY R - 29,234 13,017 )( - 16,217 - 16,217 Lajara, Galilea R. 3,600 - - - 3,600 - 3,600 LAMEYRA, ERICSON - - 1,880 )( - 1,880 )( - 1,880 )( Lamorena, Juditha M. 1,136 - - - 1,136 - 1,136 LANDINGIN, JOHN GIL - - 545 )( - 545 )( - 545 )( Lansang Jr., Nicolas 776 )( 679 - - 97 )( - 97 )( Lantican, Mark Lixcel - 308,000 252,000 )( - 56,000 - 56,000 Lapastora, Milagros - 5,184 5,184 )( - - - - Lapastora, Milagros - OLD 2,072 1,538 - - 3,610 - 3,610 Larano, Leonora - 1,507 1,507 )( - - - - LARDA, EDMUNDO 1,294 - - - 1,294 - 1,294 Lascota, Karen 300 - - - 300 - 300 Las Pinas, Mary Grace 92,017 865 1,425 )( - 91,457 - 91,457 Lauro, Jocelyn - 22,585 - - 22,585 - 22,585 Lauzon, Nicolas 548 )( - - - 548 )( - 548 )( Laxamana, Rachel - 18,710 - - 18,710 - 18,710 Laza, Benilda - 548 - - 548 - 548 LAZO, REYMARK - 2,562 1,281 )( - 1,281 - 1,281 LECAROZ JR, F - Laurent - 182,446 124,322 )( - 58,124 - 58,124 Lee, Chang Woo 3,113 8,300 3,113 )( - 8,300 - 8,300 LEE, NESTOR - 17,921 154,895 )( - 136,975 )( - 136,975 )( LENGSON, MARIA OLIVIA - - 681 )( - 681 )( - 681 )(
Forward
FAR EASTERN UNIVERSITY, INCORPORATED AND SUBSIDIARIES
Schedule B - Amounts Receivable from Directors, Officers, Employees, Related Parties and Principal Stockholders (Other Than Related Parties)
May 31, 2018
Name and Designation of DebtorBalance at
Beginning of Period
Additions
Deductions
Current Non-CurrentBalance at End of
PeriodAmounts CollectedAmounts
Written-Off
PP PP P
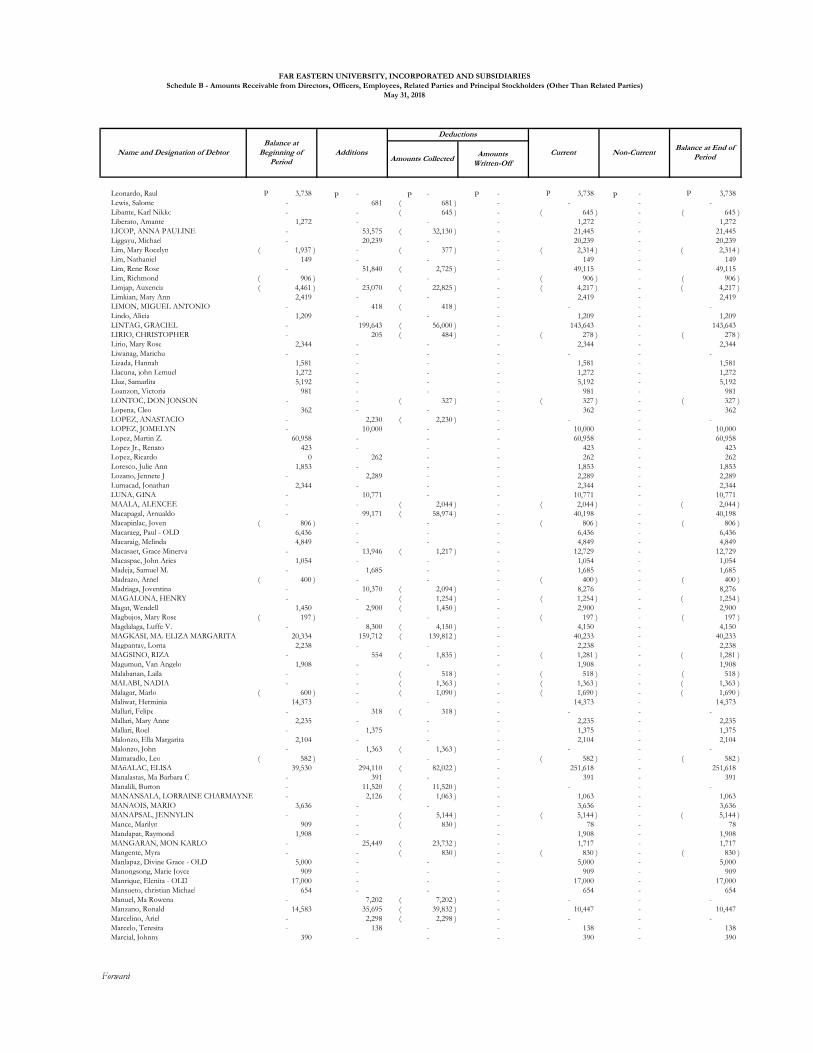
Leonardo, Raul 3,738 P - - - 3,738 P - 3,738 P
Lewis, Salome - 681 681 )( - - - - Libante, Karl Nikko - - 645 )( - 645 )( - 645 )( Liberato, Amante 1,272 - - - 1,272 - 1,272 LICOP, ANNA PAULINE - 53,575 32,130 )( - 21,445 - 21,445 Liggayu, Michael - 20,239 - - 20,239 - 20,239 Lim, Mary Rocelyn 1,937 )( - 377 )( - 2,314 )( - 2,314 )( Lim, Nathaniel 149 - - - 149 - 149 Lim, Rene Rose - 51,840 2,725 )( - 49,115 - 49,115 Lim, Richmond 906 )( - - - 906 )( - 906 )( Limjap, Auxencia 4,461 )( 23,070 22,825 )( - 4,217 )( - 4,217 )( Limkian, Mary Ann 2,419 - - - 2,419 - 2,419 LIMON, MIGUEL ANTONIO - 418 418 )( - - - - Lindo, Alicia 1,209 - - - 1,209 - 1,209 LINTAG, GRACIEL - 199,643 56,000 )( - 143,643 - 143,643 LIRIO, CHRISTOPHER - 205 484 )( - 278 )( - 278 )( Lirio, Mary Rose 2,344 - - - 2,344 - 2,344 Liwanag, Marichu - - - - - - - Lizada, Hannah 1,581 - - - 1,581 - 1,581 Llacuna, john Lemuel 1,272 - - - 1,272 - 1,272 Lluz, Samarlita 5,192 - - - 5,192 - 5,192 Loanzon, Victoria 981 - - - 981 - 981 LONTOC, DON JONSON - - 327 )( - 327 )( - 327 )( Lopena, Cleo 362 - - - 362 - 362 LOPEZ, ANASTACIO - 2,230 2,230 )( - - - - LOPEZ, JOMELYN - 10,000 - - 10,000 - 10,000 Lopez, Martin Z. 60,958 - - - 60,958 - 60,958 Lopez Jr., Renato 423 - - - 423 - 423 Lopez, Ricardo 0 262 - - 262 - 262 Loresco, Julie Ann 1,853 - - - 1,853 - 1,853 Lozano, Jennete J - 2,289 - - 2,289 - 2,289 Lumacad, Jonathan 2,344 - - - 2,344 - 2,344 LUNA, GINA - 10,771 - - 10,771 - 10,771 MAALA, ALEXCEE - - 2,044 )( - 2,044 )( - 2,044 )( Macapagal, Arnualdo - 99,171 58,974 )( - 40,198 - 40,198 Macapinlac, Joven 806 )( - - - 806 )( - 806 )( Macaraeg, Paul - OLD 6,436 - - - 6,436 - 6,436 Macaraig, Melinda 4,849 - - - 4,849 - 4,849 Macasaet, Grace Minerva - 13,946 1,217 )( - 12,729 - 12,729 Macaspac, John Aries 1,054 - - - 1,054 - 1,054 Madeja, Samuel M. - 1,685 - - 1,685 - 1,685 Madrazo, Arnel 400 )( - - - 400 )( - 400 )( Madriaga, Joventina - 10,370 2,094 )( - 8,276 - 8,276 MAGALONA, HENRY - - 1,254 )( - 1,254 )( - 1,254 )( Magat, Wendell 1,450 2,900 1,450 )( - 2,900 - 2,900 Magbujos, Mary Rose 197 )( - - - 197 )( - 197 )( Magdalaga, Luffe V. - 8,300 4,150 )( - 4,150 - 4,150 MAGKASI, MA. ELIZA MARGARITA 20,334 159,712 139,812 )( - 40,233 - 40,233 Magpantay, Lorna 2,238 - - - 2,238 - 2,238 MAGSINO, RIZA - 554 1,835 )( - 1,281 )( - 1,281 )( Magumun, Van Angelo 1,908 - - - 1,908 - 1,908 Malabanan, Laila - - 518 )( - 518 )( - 518 )( MALABI, NADIA - - 1,363 )( - 1,363 )( - 1,363 )( Malagar, Marlo 600 )( - 1,090 )( - 1,690 )( - 1,690 )( Maliwat, Herminia 14,373 - - - 14,373 - 14,373 Mallari, Felipe - 318 318 )( - - - - Mallari, Mary Anne 2,235 - - - 2,235 - 2,235 Mallari, Roel - 1,375 - - 1,375 - 1,375 Malonzo, Ella Margarita 2,104 - - - 2,104 - 2,104 Malonzo, John - 1,363 1,363 )( - - - - Mamaradlo, Leo 582 )( - - - 582 )( - 582 )( MAñALAC, ELISA 39,530 294,110 82,022 )( - 251,618 - 251,618 Manalastas, Ma Barbara C - 391 - - 391 - 391 Manalili, Burton - 11,520 11,520 )( - - - - MANANSALA, LORRAINE CHARMAYNE - 2,126 1,063 )( - 1,063 - 1,063 MANAOIS, MARIO 3,636 - - - 3,636 - 3,636 MANAPSAL, JENNYLIN - - 5,144 )( - 5,144 )( - 5,144 )( Mance, Marilyn 909 - 830 )( - 78 - 78 Mandapat, Raymond 1,908 - - 1,908 - 1,908 MANGARAN, MON KARLO - 25,449 23,732 )( - 1,717 - 1,717 Mangente, Myra - - 830 )( - 830 )( - 830 )( Manlapaz, Divine Grace - OLD 5,000 - - - 5,000 - 5,000 Manongsong, Marie Joyce 909 - - - 909 - 909 Manrique, Elenita - OLD 17,000 - - - 17,000 - 17,000 Mansueto, christian Michael 654 - - - 654 - 654 Manuel, Ma Rowena - 7,202 7,202 )( - - - - Manzano, Ronald 14,583 35,695 39,832 )( - 10,447 - 10,447 Marcelino, Ariel - 2,298 2,298 )( - - - - Marcelo, Teresita - 138 - - 138 - 138 Marcial, Johnny 390 - - - 390 - 390
Forward
FAR EASTERN UNIVERSITY, INCORPORATED AND SUBSIDIARIES
Schedule B - Amounts Receivable from Directors, Officers, Employees, Related Parties and Principal Stockholders (Other Than Related Parties)
May 31, 2018
Name and Designation of DebtorBalance at
Beginning of Period
Additions
Deductions
Current Non-CurrentBalance at End of
PeriodAmounts CollectedAmounts
Written-Off
P PP P
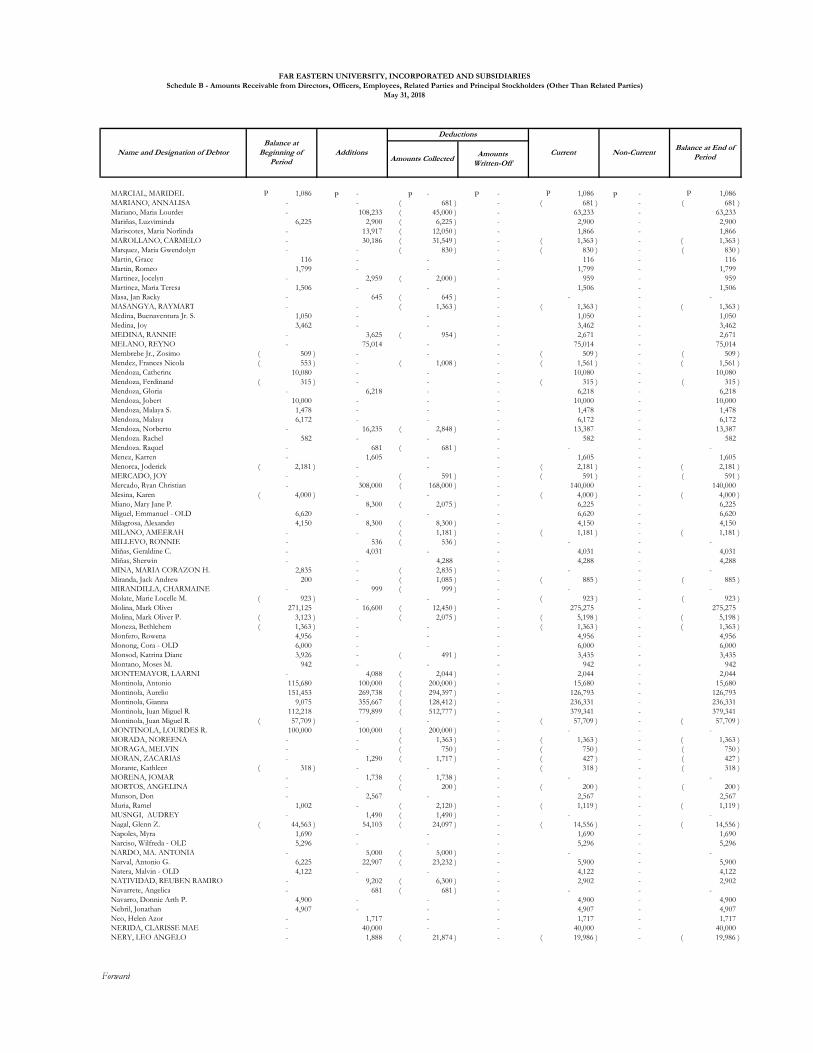
MARCIAL, MARIDEL 1,086 P - - - 1,086 P - 1,086 P
MARIANO, ANNALISA - - 681 )( - 681 )( - 681 )( Mariano, Maria Lourdes - 108,233 45,000 )( - 63,233 - 63,233 Mariñas, Luzviminda 6,225 2,900 6,225 )( - 2,900 - 2,900 Mariscotes, Maria Norlinda - 13,917 12,050 )( - 1,866 - 1,866 MAROLLANO, CARMELO - 30,186 31,549 )( - 1,363 )( - 1,363 )( Marquez, Maria Gwendolyn - - 830 )( - 830 )( - 830 )( Martin, Grace 116 - - - 116 - 116 Martin, Romeo 1,799 - - - 1,799 - 1,799 Martinez, Jocelyn - 2,959 2,000 )( - 959 - 959 Martinez, Maria Teresa 1,506 - - - 1,506 - 1,506 Masa, Jan Racky - 645 645 )( - - - - MASANGYA, RAYMART - - 1,363 )( - 1,363 )( - 1,363 )( Medina, Buenaventura Jr. S. 1,050 - - - 1,050 - 1,050 Medina, Joy 3,462 - - - 3,462 - 3,462 MEDINA, RANNIE - 3,625 954 )( - 2,671 - 2,671 MELANO, REYNO - 75,014 - - 75,014 - 75,014 Membrebe Jr., Zosimo 509 )( - - - 509 )( - 509 )( Mendez, Frances Nicola 553 )( - 1,008 )( - 1,561 )( - 1,561 )( Mendoza, Catherine 10,080 - - - 10,080 - 10,080 Mendoza, Ferdinand 315 )( - - - 315 )( - 315 )( Mendoza, Gloria - 6,218 - - 6,218 - 6,218 Mendoza, Jobert 10,000 - - - 10,000 - 10,000 Mendoza, Malaya S. 1,478 - - - 1,478 - 1,478 Mendoza, Malaya 6,172 - - - 6,172 - 6,172 Mendoza, Norberto - 16,235 2,848 )( - 13,387 - 13,387 Mendoza. Rachel 582 - - - 582 - 582 Mendoza. Raquel - 681 681 )( - - - - Menez, Karren - 1,605 - - 1,605 - 1,605 Menorca, Joderick 2,181 )( - - - 2,181 )( - 2,181 )( MERCADO, JOY - - 591 )( - 591 )( - 591 )( Mercado, Ryan Christian - 308,000 168,000 )( - 140,000 - 140,000 Mesina, Karen 4,000 )( - - - 4,000 )( - 4,000 )( Miano, Mary Jane P. 8,300 2,075 )( - 6,225 - 6,225 Miguel, Emmanuel - OLD 6,620 - - - 6,620 - 6,620 Milagrosa, Alexander 4,150 8,300 8,300 )( - 4,150 - 4,150 MILANO, AMEERAH - - 1,181 )( - 1,181 )( - 1,181 )( MILLEVO, RONNIE - 536 536 )( - - - - Miñas, Geraldine C. - 4,031 - - 4,031 - 4,031 Miñas, Sherwin - - 4,288 - 4,288 - 4,288 MINA, MARIA CORAZON H. 2,835 - 2,835 )( - - - - Miranda, Jack Andrew 200 - 1,085 )( - 885 )( - 885 )( MIRANDILLA, CHARMAINE - 999 999 )( - - - - Molate, Marie Locelle M. 923 )( - - - 923 )( - 923 )( Molina, Mark Oliver 271,125 16,600 12,450 )( - 275,275 - 275,275 Molina, Mark Oliver P. 3,123 )( - 2,075 )( - 5,198 )( - 5,198 )( Moneza, Bethlehem 1,363 )( - - - 1,363 )( - 1,363 )( Monfero, Rowena 4,956 - - - 4,956 - 4,956 Monong, Cora - OLD 6,000 - - - 6,000 - 6,000 Monsod, Katrina Diane 3,926 - 491 )( - 3,435 - 3,435 Montano, Moses M. 942 - - - 942 - 942 MONTEMAYOR, LAARNI - 4,088 2,044 )( - 2,044 - 2,044 Montinola, Antonio 115,680 100,000 200,000 )( - 15,680 - 15,680 Montinola, Aurelio 151,453 269,738 294,397 )( - 126,793 - 126,793 Montinola, Gianna 9,075 355,667 128,412 )( - 236,331 - 236,331 Montinola, Juan Miguel R. 112,218 779,899 512,777 )( - 379,341 - 379,341 Montinola, Juan Miguel R. 57,709 )( - - - 57,709 )( - 57,709 )( MONTINOLA, LOURDES R. 100,000 100,000 200,000 )( - - - - MORADA, NOREENA - - 1,363 )( - 1,363 )( - 1,363 )( MORAGA, MELVIN - - 750 )( - 750 )( - 750 )( MORAN, ZACARIAS - 1,290 1,717 )( - 427 )( - 427 )( Morante, Kathleen 318 )( - - - 318 )( - 318 )( MORENA, JOMAR - 1,738 1,738 )( - - - - MORTOS, ANGELINA - - 200 )( - 200 )( - 200 )( Munson, Don - 2,567 - - 2,567 - 2,567 Muria, Ramel 1,002 - 2,120 )( - 1,119 )( - 1,119 )( MUSNGI, AUDREY - 1,490 1,490 )( - - - - Nagal, Glenn Z. 44,563 )( 54,103 24,097 )( - 14,556 )( - 14,556 )( Napoles, Myra 1,690 - - - 1,690 - 1,690 Narciso, Wilfreda - OLD 5,296 - - - 5,296 - 5,296 NARDO, MA. ANTONIA - 5,000 5,000 )( - - - - Narval, Antonio G. 6,225 22,907 23,232 )( - 5,900 - 5,900 Natera, Malvin - OLD 4,122 - - - 4,122 - 4,122 NATIVIDAD, REUBEN RAMIRO - 9,202 6,300 )( - 2,902 - 2,902 Navarrete, Angelica - 681 681 )( - - - - Navarro, Donnie Arth P. 4,900 - - - 4,900 - 4,900 Nebril, Jonathan 4,907 - - - 4,907 - 4,907 Neo, Helen Azor - 1,717 - - 1,717 - 1,717 NERIDA, CLARISSE MAE - 40,000 - - 40,000 - 40,000 NERY, LEO ANGELO - 1,888 21,874 )( - 19,986 )( - 19,986 )(
Forward
FAR EASTERN UNIVERSITY, INCORPORATED AND SUBSIDIARIES
Schedule B - Amounts Receivable from Directors, Officers, Employees, Related Parties and Principal Stockholders (Other Than Related Parties)
May 31, 2018
Name and Designation of DebtorBalance at
Beginning of Period
Additions
Deductions
Current Non-CurrentBalance at End of
PeriodAmounts CollectedAmounts
Written-Off
P PP P
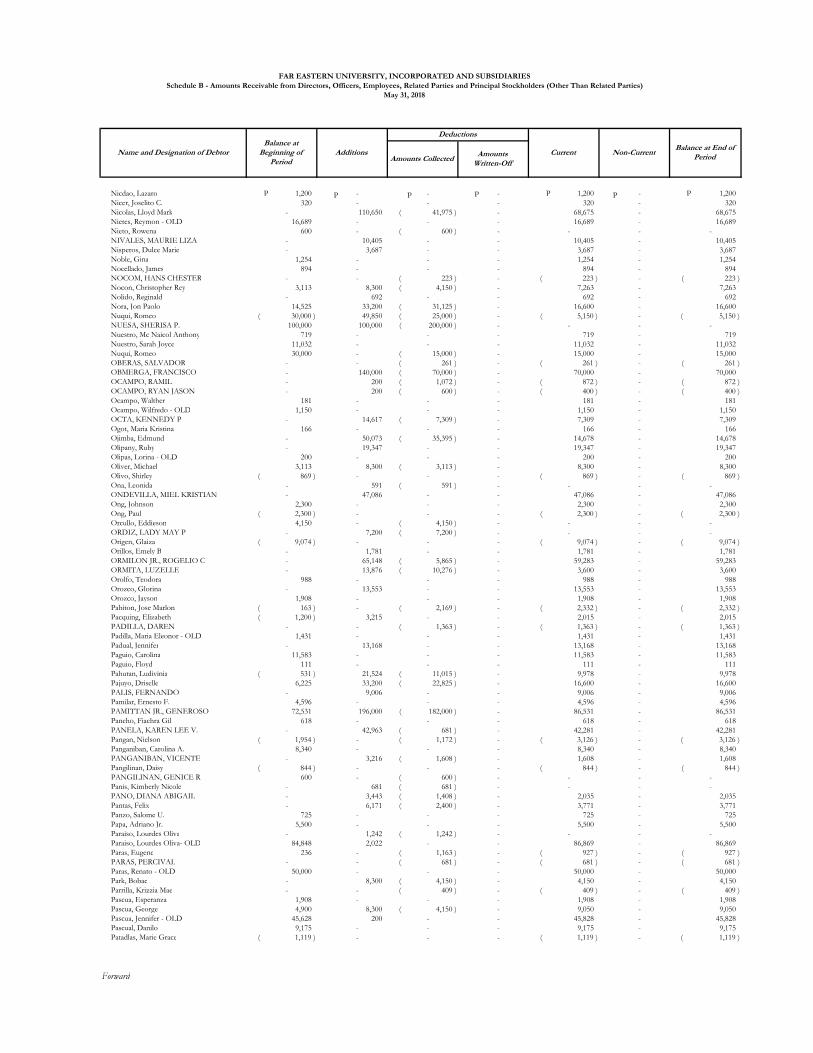
Nicdao, Lazaro 1,200 P - - - 1,200 P - 1,200 P
Nicer, Joselito C. 320 - - - 320 - 320 Nicolas, Lloyd Mark - 110,650 41,975 )( - 68,675 - 68,675 Nietes, Reymon - OLD 16,689 - - - 16,689 - 16,689 Nieto, Rowena 600 - 600 )( - - - - NIVALES, MAURIE LIZA - 10,405 - - 10,405 - 10,405 Nisperos, Dulce Marie - 3,687 - - 3,687 - 3,687 Noble, Gina 1,254 - - - 1,254 - 1,254 Nocellado, James 894 - - - 894 - 894 NOCOM, HANS CHESTER - - 223 )( - 223 )( - 223 )( Nocon, Christopher Rey 3,113 8,300 4,150 )( - 7,263 - 7,263 Nolido, Reginald - 692 - - 692 - 692 Nora, Jon Paolo 14,525 33,200 31,125 )( - 16,600 - 16,600 Nuqui, Romeo 30,000 )( 49,850 25,000 )( - 5,150 )( - 5,150 )( NUESA, SHERISA P. 100,000 100,000 200,000 )( - - - - Nuestro, Mc Naicol Anthony 719 - - - 719 - 719 Nuestro, Sarah Joyce 11,032 - - - 11,032 - 11,032 Nuqui, Romeo 30,000 - 15,000 )( - 15,000 - 15,000 OBERAS, SALVADOR - - 261 )( - 261 )( - 261 )( OBMERGA, FRANCISCO - 140,000 70,000 )( - 70,000 - 70,000 OCAMPO, RAMIL - 200 1,072 )( - 872 )( - 872 )( OCAMPO, RYAN JASON - 200 600 )( - 400 )( - 400 )( Ocampo, Walther 181 - - - 181 - 181 Ocampo, Wilfredo - OLD 1,150 - - - 1,150 - 1,150 OCTA, KENNEDY P - 14,617 7,309 )( - 7,309 - 7,309 Ogot, Maria Kristina 166 - - - 166 - 166 Ojimba, Edmund - 50,073 35,395 )( - 14,678 - 14,678 Olipany, Ruby - 19,347 - - 19,347 - 19,347 Olipas, Lorina - OLD 200 - - - 200 - 200 Oliver, Michael 3,113 8,300 3,113 )( - 8,300 - 8,300 Olivo, Shirley 869 )( - - - 869 )( - 869 )( Ona, Leonida - 591 591 )( - - - - ONDEVILLA, MIEL KRISTIAN - 47,086 - - 47,086 - 47,086 Ong, Johnson 2,300 - - - 2,300 - 2,300 Ong, Paul 2,300 )( - - - 2,300 )( - 2,300 )( Orcullo, Eddieson 4,150 - 4,150 )( - - - - ORDIZ, LADY MAY P - 7,200 7,200 )( - - - - Origen, Glaiza 9,074 )( - - - 9,074 )( - 9,074 )( Orillos, Emely B - 1,781 - - 1,781 - 1,781 ORMILON JR., ROGELIO C - 65,148 5,865 )( - 59,283 - 59,283 ORMITA, LUZELLE - 13,876 10,276 )( - 3,600 - 3,600 Orolfo, Teodora 988 - - - 988 - 988 Orozco, Glorina - 13,553 - - 13,553 - 13,553 Orozco, Jayson 1,908 - - - 1,908 - 1,908 Pabiton, Jose Marlon 163 )( - 2,169 )( - 2,332 )( - 2,332 )( Pacquing, Elizabeth 1,200 )( 3,215 - - 2,015 - 2,015 PADILLA, DAREN - - 1,363 )( - 1,363 )( - 1,363 )( Padilla, Maria Eleonor - OLD 1,431 - - - 1,431 - 1,431 Padual, Jennifer - 13,168 - - 13,168 - 13,168 Paguio, Carolina 11,583 - - - 11,583 - 11,583 Paguio, Floyd 111 - - - 111 - 111 Pahutan, Ludivinia 531 )( 21,524 11,015 )( - 9,978 - 9,978 Pajuyo, Driselle 6,225 33,200 22,825 )( - 16,600 - 16,600 PALIS, FERNANDO - 9,006 - - 9,006 - 9,006 Pamilar, Ernesto F. 4,596 - - - 4,596 - 4,596 PAMITTAN JR., GENEROSO 72,531 196,000 182,000 )( - 86,531 - 86,531 Pancho, Fiachra Gil 618 - - - 618 - 618 PANELA, KAREN LEE V. - 42,963 681 )( - 42,281 - 42,281 Pangan, Nielson 1,954 )( - 1,172 )( - 3,126 )( - 3,126 )( Panganiban, Carolina A. 8,340 - - - 8,340 - 8,340 PANGANIBAN, VICENTE - 3,216 1,608 )( - 1,608 - 1,608 Pangilinan, Daisy 844 )( - - - 844 )( - 844 )( PANGILINAN, GENICE R 600 - 600 )( - - - - Panis, Kimberly Nicole - 681 681 )( - - - - PANO, DIANA ABIGAIL - 3,443 1,408 )( - 2,035 - 2,035 Pantas, Felix - 6,171 2,400 )( - 3,771 - 3,771 Panzo, Salome U. 725 - - - 725 - 725 Papa, Adriano Jr. 5,500 - - - 5,500 - 5,500 Paraiso, Lourdes Oliva - 1,242 1,242 )( - - - - Paraiso, Lourdes Oliva- OLD 84,848 2,022 - - 86,869 - 86,869 Paras, Eugene 236 - 1,163 )( - 927 )( - 927 )( PARAS, PERCIVAL - - 681 )( - 681 )( - 681 )( Paras, Renato - OLD 50,000 - - - 50,000 - 50,000 Park, Bobae - 8,300 4,150 )( - 4,150 - 4,150 Parrilla, Krizzia Mae - - 409 )( - 409 )( - 409 )( Pascua, Esperanza 1,908 - - - 1,908 - 1,908 Pascua, George 4,900 8,300 4,150 )( - 9,050 - 9,050 Pascua, Jennifer - OLD 45,628 200 - - 45,828 - 45,828 Pascual, Danilo 9,175 - - - 9,175 - 9,175 Patadlas, Marie Grace 1,119 )( - - - 1,119 )( - 1,119 )(
Forward
FAR EASTERN UNIVERSITY, INCORPORATED AND SUBSIDIARIES
Schedule B - Amounts Receivable from Directors, Officers, Employees, Related Parties and Principal Stockholders (Other Than Related Parties)
May 31, 2018
Name and Designation of DebtorBalance at
Beginning of Period
Additions
Deductions
Current Non-CurrentBalance at End of
PeriodAmounts CollectedAmounts
Written-Off
PP P P
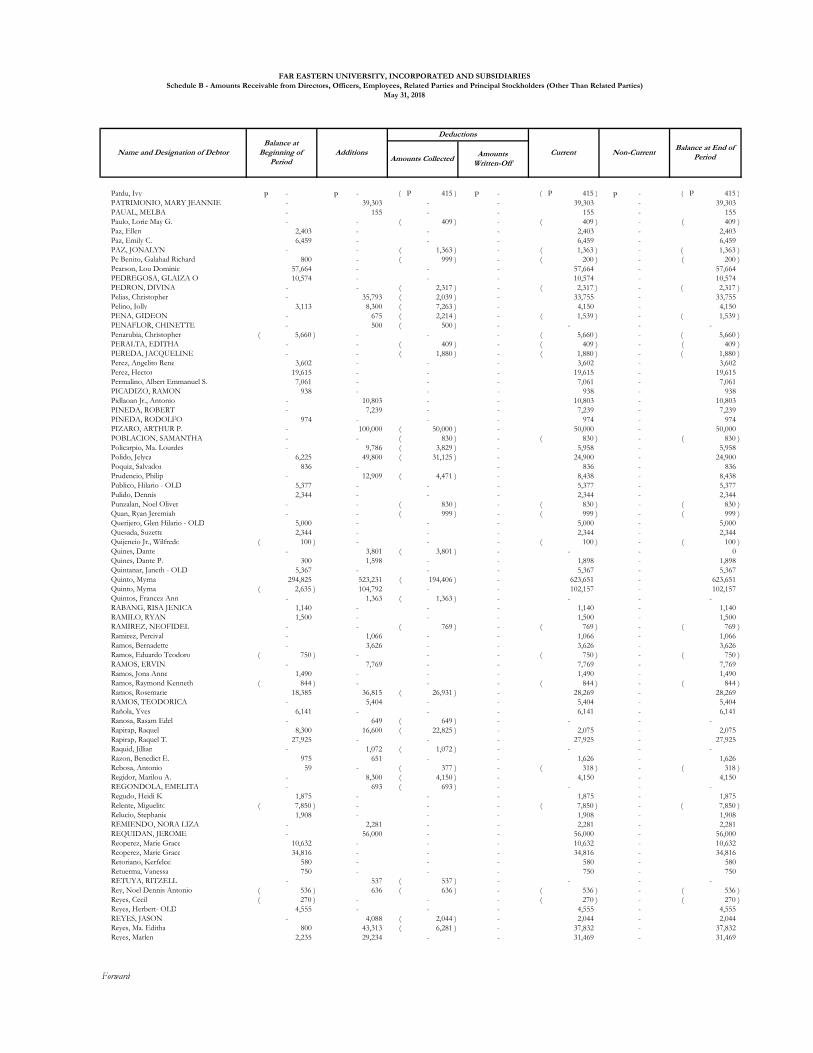
Patdu, Ivy - - 415 )( P - 415 )( P - 415 )( P
PATRIMONIO, MARY JEANNIE - 39,303 - - 39,303 - 39,303 PAUAL, MELBA - 155 - - 155 - 155 Paulo, Lorie May G. - - 409 )( - 409 )( - 409 )( Paz, Ellen 2,403 - - - 2,403 - 2,403 Paz, Emily C. 6,459 - - - 6,459 - 6,459 PAZ, JONALYN - - 1,363 )( - 1,363 )( - 1,363 )( Pe Benito, Galahad Richard 800 - 999 )( - 200 )( - 200 )( Pearson, Lou Dominic 57,664 - - - 57,664 - 57,664 PEDREGOSA, GLAIZA O 10,574 - - - 10,574 - 10,574 PEDRON, DIVINA - - 2,317 )( - 2,317 )( - 2,317 )( Pelias, Christopher - 35,793 2,039 )( - 33,755 - 33,755 Pelino, Jolly 3,113 8,300 7,263 )( - 4,150 - 4,150 PENA, GIDEON - 675 2,214 )( - 1,539 )( - 1,539 )( PENAFLOR, CHINETTE - 500 500 )( - - - - Penarubia, Christopher 5,660 )( - - - 5,660 )( - 5,660 )( PERALTA, EDITHA - - 409 )( - 409 )( - 409 )( PEREDA, JACQUELINE - - 1,880 )( - 1,880 )( - 1,880 )( Perez, Angelito Rene 3,602 - - - 3,602 - 3,602 Perez, Hector 19,615 - - - 19,615 - 19,615 Permalino, Albert Emmanuel S. 7,061 - - - 7,061 - 7,061 PICADIZO, RAMON 938 - - - 938 - 938 Pidlaoan Jr., Antonio - 10,803 - - 10,803 - 10,803 PINEDA, ROBERT - 7,239 - - 7,239 - 7,239 PINEDA, RODOLFO 974 - - - 974 - 974 PIZARO, ARTHUR P. - 100,000 50,000 )( - 50,000 - 50,000 POBLACION, SAMANTHA - - 830 )( - 830 )( - 830 )( Policarpio, Ma. Lourdes - 9,786 3,829 )( - 5,958 - 5,958 Polido, Jelyca 6,225 49,800 31,125 )( - 24,900 - 24,900 Poquiz, Salvador 836 - - 836 - 836 Prudencio, Philip - 12,909 4,471 )( - 8,438 - 8,438 Publico, Hilario - OLD 5,377 - - - 5,377 - 5,377 Pulido, Dennis 2,344 - - - 2,344 - 2,344 Punzalan, Noel Oliver - - 830 )( - 830 )( - 830 )( Quan, Ryan Jeremiah - - 999 )( - 999 )( - 999 )( Querijero, Glen Hilario - OLD 5,000 - - - 5,000 - 5,000 Quesada, Suzette 2,344 - - - 2,344 - 2,344 Quijencio Jr., Wilfredo 100 )( - - - 100 )( - 100 )( Quines, Dante - 3,801 3,801 )( - - - 0 Quines, Dante P. 300 1,598 - - 1,898 - 1,898 Quintanar, Janeth - OLD 5,367 - - - 5,367 - 5,367 Quinto, Myrna 294,825 523,231 194,406 )( - 623,651 - 623,651 Quinto, Myrna 2,635 )( 104,792 - - 102,157 - 102,157 Quintos, Francez Ann - 1,363 1,363 )( - - - - RABANG, RISA JENICA 1,140 - - - 1,140 - 1,140 RAMILO, RYAN 1,500 - - - 1,500 - 1,500 RAMIREZ, NEOFIDEL - - 769 )( - 769 )( - 769 )( Ramirez, Percival - 1,066 - - 1,066 - 1,066 Ramos, Bernadette - 3,626 - - 3,626 - 3,626 Ramos, Eduardo Teodoro 750 )( - - - 750 )( - 750 )( RAMOS, ERVIN - 7,769 - - 7,769 - 7,769 Ramos, Jona Anne 1,490 - - - 1,490 - 1,490 Ramos, Raymond Kenneth 844 )( - - - 844 )( - 844 )( Ramos, Rosemarie 18,385 36,815 26,931 )( - 28,269 - 28,269 RAMOS, TEODORICA - 5,404 - - 5,404 - 5,404 Rañola, Yves 6,141 - - - 6,141 - 6,141 Ranosa, Rasam Edel - 649 649 )( - - - - Rapirap, Raquel 8,300 16,600 22,825 )( - 2,075 - 2,075 Rapirap, Raquel T. 27,925 - - - 27,925 - 27,925 Raquid, Jillian - 1,072 1,072 )( - - - - Razon, Benedict E. 975 651 - - 1,626 - 1,626 Rebosa, Antonio 59 - 377 )( - 318 )( - 318 )( Regidor, Marilou A. - 8,300 4,150 )( - 4,150 - 4,150 REGONDOLA, EMELITA - 693 693 )( - - - - Regudo, Heidi K. 1,875 - - - 1,875 - 1,875 Relente, Miguelito 7,850 )( - - - 7,850 )( - 7,850 )( Relucio, Stephanie 1,908 - - - 1,908 - 1,908 REMIENDO, NORA LIZA - 2,281 - - 2,281 - 2,281 REQUIDAN, JEROME - 56,000 - - 56,000 - 56,000 Reoperez, Marie Grace 10,632 - - - 10,632 - 10,632 Reoperez, Marie Grace 34,816 - - - 34,816 - 34,816 Retoriano, Kerfelcel 580 - - - 580 - 580 Retuerma, Vanessa 750 - - - 750 - 750 RETUYA, RITZELL - 537 537 )( - - - - Rey, Noel Dennis Antonio 536 )( 636 636 )( - 536 )( - 536 )( Reyes, Cecil 270 )( - - - 270 )( - 270 )( Reyes, Herbert- OLD 4,555 - - - 4,555 - 4,555 REYES, JASON - 4,088 2,044 )( - 2,044 - 2,044 Reyes, Ma. Editha 800 43,313 6,281 )( - 37,832 - 37,832 Reyes, Marlen 2,235 29,234 - - 31,469 - 31,469
Forward
FAR EASTERN UNIVERSITY, INCORPORATED AND SUBSIDIARIES
Schedule B - Amounts Receivable from Directors, Officers, Employees, Related Parties and Principal Stockholders (Other Than Related Parties)
May 31, 2018
Name and Designation of DebtorBalance at
Beginning of Period
Additions
Deductions
Current Non-CurrentBalance at End of
PeriodAmounts CollectedAmounts
Written-Off
PP PP
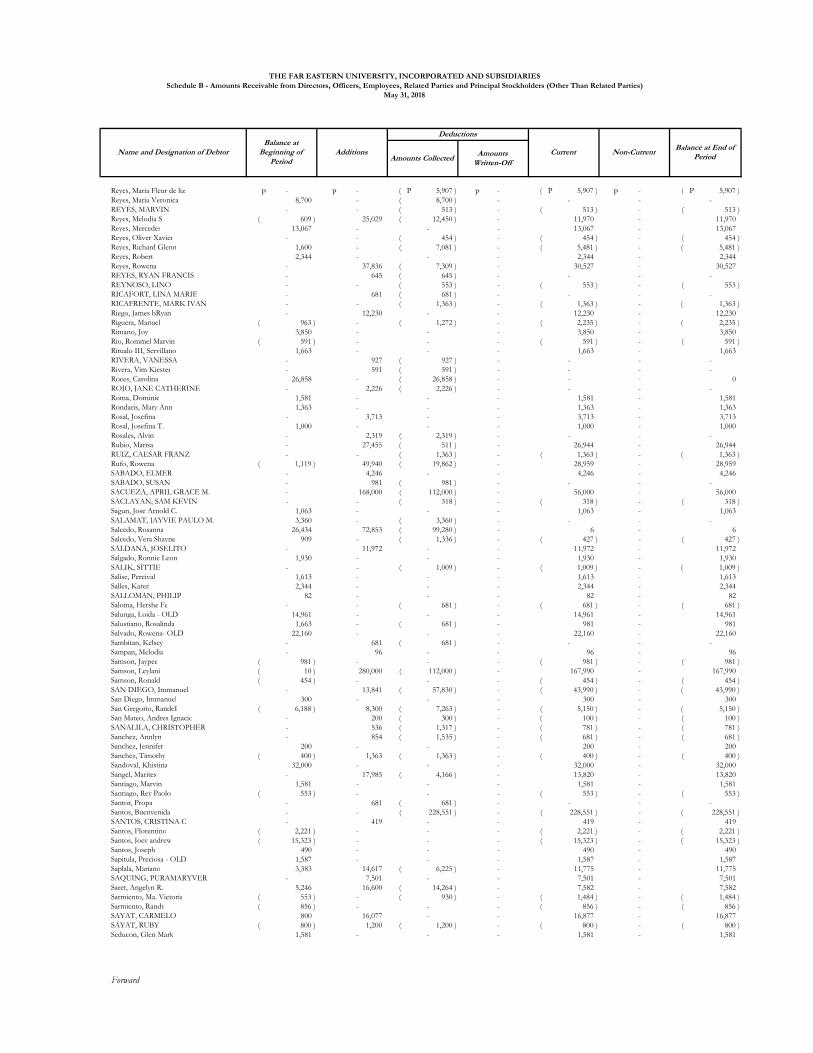
Reyes, Maria Fleur de liz - - 5,907 )( P - 5,907 )( P - 5,907 )( P
Reyes, Maria Veronica 8,700 - 8,700 )( - - - - REYES, MARVIN - - 513 )( - 513 )( - 513 )( Reyes, Melodia S. 609 )( 25,029 12,450 )( - 11,970 - 11,970 Reyes, Mercedes 13,067 - - - 13,067 - 13,067 Reyes, Oliver Xavier - - 454 )( - 454 )( - 454 )( Reyes, Richard Glenn 1,600 - 7,081 )( - 5,481 )( - 5,481 )( Reyes, Robert 2,344 - - - 2,344 - 2,344 Reyes, Rowena - 37,836 7,309 )( - 30,527 - 30,527 REYES, RYAN FRANCIS - 645 645 )( - - - - REYNOSO, LINO - - 553 )( - 553 )( - 553 )( RICAFORT, LINA MARIE - 681 681 )( - - - - RICAFRENTE, MARK IVAN - - 1,363 )( - 1,363 )( - 1,363 )( Riego, James bRyan - 12,230 - - 12,230 - 12,230 Riguera, Manuel 963 )( - 1,272 )( - 2,235 )( - 2,235 )( Rimano, Joy 3,850 - - - 3,850 - 3,850 Rio, Rommel Marvin 591 )( - - - 591 )( - 591 )( Ritualo III, Servillano 1,663 - - - 1,663 - 1,663 RIVERA, VANESSA - 927 927 )( - - - - Rivera, Vim Kiester - 591 591 )( - - - - Roces, Carolina 26,858 - 26,858 )( - - - 0 ROJO, JANE CATHERINE - 2,226 2,226 )( - - - - Roma, Dominic 1,581 - - - 1,581 - 1,581 Rondaris, Mary Ann 1,363 - - - 1,363 - 1,363 Rosal, Josefina - 3,713 - - 3,713 - 3,713 Rosal, Josefina T. 1,000 - - - 1,000 - 1,000 Rosales, Alvin - 2,319 2,319 )( - - - - Rubio, Marisa - 27,455 511 )( - 26,944 - 26,944 RUIZ, CAESAR FRANZ - - 1,363 )( - 1,363 )( - 1,363 )( Rufo, Rowena 1,119 )( 49,940 19,862 )( - 28,959 - 28,959 SABADO, ELMER - 4,246 - - 4,246 - 4,246 SABADO, SUSAN - 981 981 )( - - - - SACUEZA, APRIL GRACE M. - 168,000 112,000 )( - 56,000 - 56,000 SACLAYAN, SAM KEVIN - - 318 )( - 318 )( - 318 )( Sagun, Jose Arnold C. 1,063 - - - 1,063 - 1,063 SALAMAT, JAYVIE PAULO M. 3,360 - 3,360 )( - - - - Salcedo, Rosanna 26,434 72,853 99,280 )( - 6 - 6 Salcedo, Vera Shayne 909 - 1,336 )( - 427 )( - 427 )( SALDANA, JOSELITO - 11,972 - - 11,972 - 11,972 Salgado, Ronnie Leon 1,930 - - - 1,930 - 1,930 SALIK, SITTIE - - 1,009 )( - 1,009 )( - 1,009 )( Salise, Percival 1,613 - - - 1,613 - 1,613 Salles, Karen 2,344 - - - 2,344 - 2,344 SALLOMAN, PHILIP 82 - - - 82 - 82 Saloma, Hershe Fe - - 681 )( - 681 )( - 681 )( Salunga, Loida - OLD 14,961 - - - 14,961 - 14,961 Salustiano, Rosalinda 1,663 - 681 )( - 981 - 981 Salvado, Rowena- OLD 22,160 - - - 22,160 - 22,160 Sambitan, Kelsey - 681 681 )( - - - - Sampan, Melodia - 96 - - 96 - 96 Samson, Jaypee 981 )( - - - 981 )( - 981 )( Samson, Leylani 10 )( 280,000 112,000 )( - 167,990 - 167,990 Samson, Ronald 454 )( - - - 454 )( - 454 )( SAN DIEGO, Immanuel - 13,841 57,830 )( - 43,990 )( - 43,990 )( San Diego, Immanuel 300 - - - 300 - 300 San Gregorio, Randell 6,188 )( 8,300 7,263 )( - 5,150 )( - 5,150 )( San Mateo, Andres Ignacio - 200 300 )( - 100 )( - 100 )( SANALILA, CHRISTOPHER - 536 1,317 )( - 781 )( - 781 )( Sanchez, Annlyn - 854 1,535 )( - 681 )( - 681 )( Sanchez, Jennifer 200 - - - 200 - 200 Sanchez, Timothy 400 )( 1,363 1,363 )( - 400 )( - 400 )( Sandoval, Khistina 32,000 - - - 32,000 - 32,000 Sangel, Marites - 17,985 4,166 )( - 13,820 - 13,820 Santiago, Marvin 1,581 - - - 1,581 - 1,581 Santiago, Rey Paolo 553 )( - - - 553 )( - 553 )( Santor, Propa - 681 681 )( - - - - Santos, Buenvenida - - 228,551 )( - 228,551 )( - 228,551 )( SANTOS, CRISTINA C - 419 - - 419 - 419 Santos, Florentino 2,221 )( - - - 2,221 )( - 2,221 )( Santos, Joey andrew 15,323 )( - - - 15,323 )( - 15,323 )( Santos, Joseph 490 - - - 490 - 490 Sapitula, Preciosa - OLD 1,587 - - - 1,587 - 1,587 Saplala, Mariano 3,383 14,617 6,225 )( - 11,775 - 11,775 SAQUING, PURAMARYVER - 7,501 - - 7,501 - 7,501 Saret, Angelyn R. 5,246 16,600 14,264 )( - 7,582 - 7,582 Sarmiento, Ma. Victoria 553 )( - 930 )( - 1,484 )( - 1,484 )( Sarmiento, Randy 856 )( - - - 856 )( - 856 )( SAYAT, CARMELO 800 16,077 - - 16,877 - 16,877 SAYAT, RUBY 800 )( 1,200 1,200 )( - 800 )( - 800 )( Seducon, Glen Mark 1,581 - - - 1,581 - 1,581
Forward
THE FAR EASTERN UNIVERSITY, INCORPORATED AND SUBSIDIARIES
Schedule B - Amounts Receivable from Directors, Officers, Employees, Related Parties and Principal Stockholders (Other Than Related Parties)
May 31, 2018
Name and Designation of DebtorBalance at
Beginning of Period
Additions
Deductions
Current Non-CurrentBalance at End of
PeriodAmounts CollectedAmounts
Written-Off
PP PP
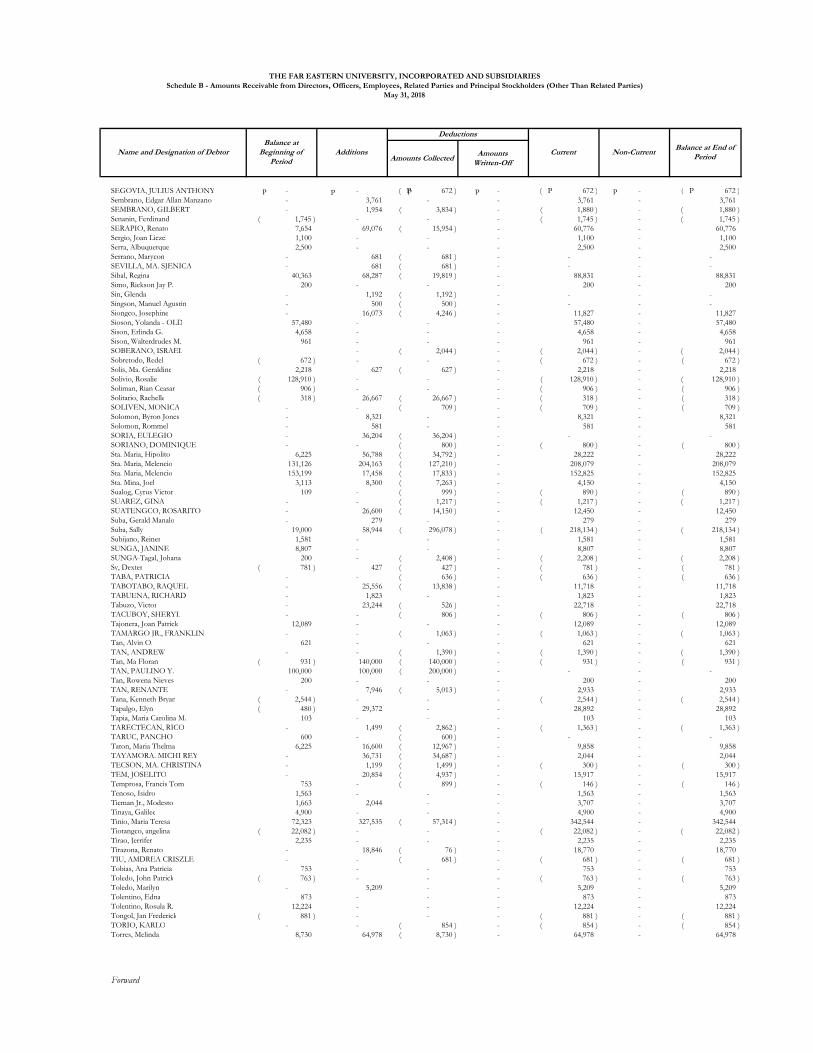
SEGOVIA, JULIUS ANTHONY - - 672 )( P - 672 )( P - 672 )( P
Sembrano, Edgar Allan Manzano - 3,761 - - 3,761 - 3,761 SEMBRANO, GILBERT - 1,954 3,834 )( - 1,880 )( - 1,880 )( Senanin, Ferdinand 1,745 )( - - - 1,745 )( - 1,745 )( SERAPIO, Renato 7,654 69,076 15,954 )( - 60,776 - 60,776 Sergio, Joan Liezel 1,100 - - - 1,100 - 1,100 Serra, Albuquerque 2,500 - - - 2,500 - 2,500 Serrano, Marycon - 681 681 )( - - - - SEVILLA, MA. SJENICA - 681 681 )( - - - - Sibal, Regina 40,363 68,287 19,819 )( - 88,831 - 88,831 Simo, Rickson Jay P. 200 - - - 200 - 200 Sin, Glenda - 1,192 1,192 )( - - - - Singson, Manuel Agustin - 500 500 )( - - - - Siongco, Josephine - 16,073 4,246 )( - 11,827 - 11,827 Sioson, Yolanda - OLD 57,480 - - - 57,480 - 57,480 Sison, Erlinda G. 4,658 - - - 4,658 - 4,658 Sison, Walterdrudes M. 961 - - - 961 - 961 SOBERANO, ISRAEL - 2,044 )( - 2,044 )( - 2,044 )( Sobretodo, Redel 672 )( - - - 672 )( - 672 )( Solis, Ma. Geraldine 2,218 627 627 )( - 2,218 - 2,218 Solivio, Rosalie 128,910 )( - - - 128,910 )( - 128,910 )( Soliman, Rian Ceasar 906 )( - - - 906 )( - 906 )( Solitario, Rachelle 318 )( 26,667 26,667 )( - 318 )( - 318 )( SOLIVEN, MONICA - - 709 )( - 709 )( - 709 )( Solomon, Byron Jones - 8,321 - - 8,321 - 8,321 Solomon, Rommel - 581 - - 581 - 581 SORIA, EULEGIO - 36,204 36,204 )( - - - - SORIANO, DOMINIQUE - - 800 )( - 800 )( - 800 )( Sta. Maria, Hipolito 6,225 56,788 34,792 )( - 28,222 - 28,222 Sta. Maria, Melencio 131,126 204,163 127,210 )( - 208,079 - 208,079 Sta. Maria, Melencio 153,199 17,458 17,833 )( - 152,825 - 152,825 Sta. Mina, Joel 3,113 8,300 7,263 )( - 4,150 - 4,150 Sualog, Cyrus Victor 109 - 999 )( - 890 )( - 890 )( SUAREZ, GINA - - 1,217 )( - 1,217 )( - 1,217 )( SUATENGCO, ROSARITO - 26,600 14,150 )( - 12,450 - 12,450 Suba, Gerald Manalo - 279 - - 279 - 279 Suba, Sally 19,000 58,944 296,078 )( - 218,134 )( - 218,134 )( Subijano, Reiner 1,581 - - - 1,581 - 1,581 SUNGA, JANINE 8,807 - - - 8,807 - 8,807 SUNGA-Tagal, Johana 200 - 2,408 )( - 2,208 )( - 2,208 )( Sy, Dexter 781 )( 427 427 )( - 781 )( - 781 )( TABA, PATRICIA - - 636 )( - 636 )( - 636 )( TABOTABO, RAQUEL - 25,556 13,838 )( - 11,718 - 11,718 TABUENA, RICHARD - 1,823 - - 1,823 - 1,823 Tabuzo, Victor - 23,244 526 )( - 22,718 - 22,718 TACUBOY, SHERYL - - 806 )( - 806 )( - 806 )( Tajonera, Joan Patrick 12,089 - - - 12,089 - 12,089 TAMARGO JR., FRANKLIN - - 1,063 )( - 1,063 )( - 1,063 )( Tan, Alvin O. 621 - - - 621 - 621 TAN, ANDREW - - 1,390 )( - 1,390 )( - 1,390 )( Tan, Ma Floran 931 )( 140,000 140,000 )( - 931 )( - 931 )( TAN, PAULINO Y. 100,000 100,000 200,000 )( - - - - Tan, Rowena Nieves 200 - - - 200 - 200 TAN, RENANTE - 7,946 5,013 )( - 2,933 - 2,933 Tana, Kenneth Bryan 2,544 )( - - - 2,544 )( - 2,544 )( Tapalgo, Elyn 480 )( 29,372 - - 28,892 - 28,892 Tapia, Maria Carolina M. 103 - - - 103 - 103 TARECTECAN, RICO - 1,499 2,862 )( - 1,363 )( - 1,363 )( TARUC, PANCHO 600 - 600 )( - - - - Taton, Maria Thelma 6,225 16,600 12,967 )( - 9,858 - 9,858 TAYAMORA. MICHI REY - 36,731 34,687 )( - 2,044 - 2,044 TECSON, MA. CHRISTINA - 1,199 1,499 )( - 300 )( - 300 )( TEM, JOSELITO - 20,854 4,937 )( - 15,917 - 15,917 Temprosa, Francis Tom 753 - 899 )( - 146 )( - 146 )( Tenoso, Isidro 1,563 - - - 1,563 - 1,563 Ticman Jr., Modesto 1,663 2,044 - - 3,707 - 3,707 Tinaya, Galilee 4,900 - - - 4,900 - 4,900 Tinio, Maria Teresa 72,323 327,535 57,314 )( - 342,544 - 342,544 Tiotangco, angelina 22,082 )( - - - 22,082 )( - 22,082 )( Tirao, Jerrifer 2,235 - - - 2,235 - 2,235 Tirazona, Renato - 18,846 76 )( - 18,770 - 18,770 TIU, AMDREA CRISZLE - - 681 )( - 681 )( - 681 )( Tobias, Ana Patricia 753 - - - 753 - 753 Toledo, John Patrick 763 )( - - - 763 )( - 763 )( Toledo, Marilyn - 5,209 - - 5,209 - 5,209 Tolentino, Edna 873 - - - 873 - 873 Tolentino, Rosula R. 12,224 - - - 12,224 - 12,224 Tongol, Jan Frederick 881 )( - - - 881 )( - 881 )( TORIO, KARLO - - 854 )( - 854 )( - 854 )( Torres, Melinda 8,730 64,978 8,730 )( - 64,978 - 64,978
Forward
THE FAR EASTERN UNIVERSITY, INCORPORATED AND SUBSIDIARIES
Schedule B - Amounts Receivable from Directors, Officers, Employees, Related Parties and Principal Stockholders (Other Than Related Parties)
May 31, 2018
Name and Designation of DebtorBalance at
Beginning of Period
Additions
Deductions
Current Non-CurrentBalance at End of
PeriodAmounts CollectedAmounts
Written-Off
PP PPP
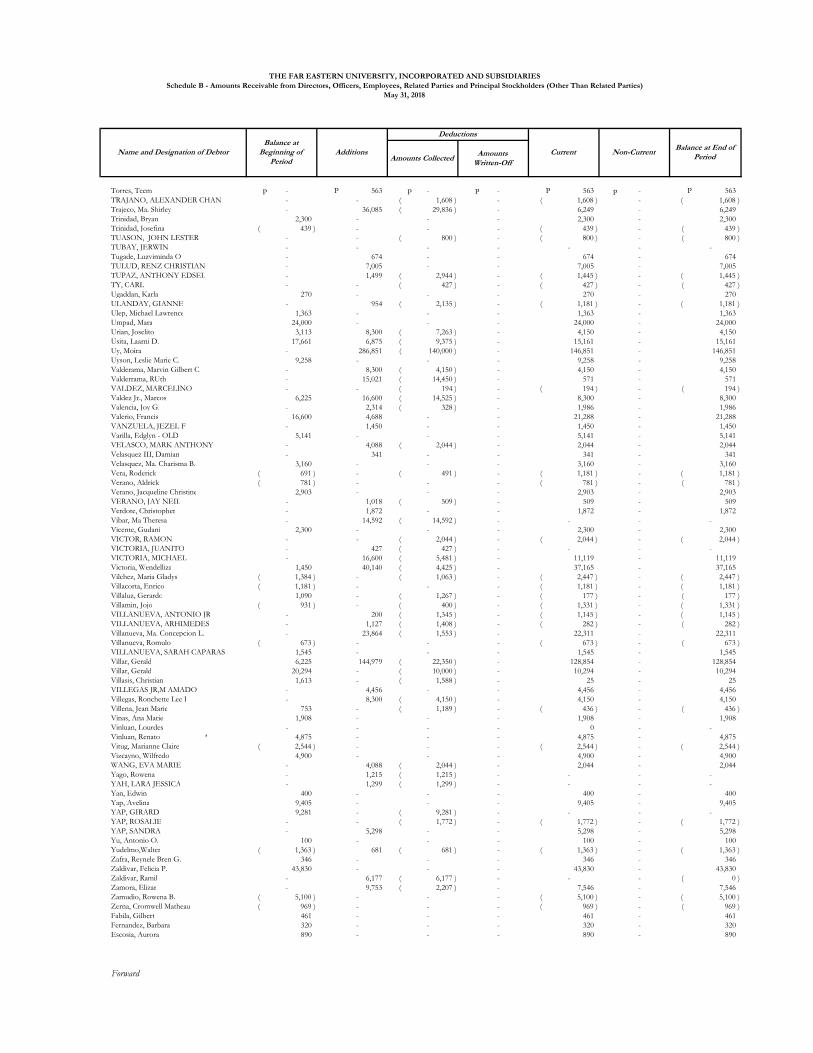
Torres, Teem - 563 P - - 563 P - 563 P
TRAJANO, ALEXANDER CHAN - - 1,608 )( - 1,608 )( - 1,608 )( Trajeco, Ma. Shirley - 36,085 29,836 )( - 6,249 - 6,249 Trinidad, Bryan 2,300 - - - 2,300 - 2,300 Trinidad, Josefina 439 )( - - - 439 )( - 439 )( TUASON, JOHN LESTER - - 800 )( - 800 )( - 800 )( TUBAY, JERWIN - - - - - - - Tugade, Luzviminda O - 674 - - 674 - 674 TULUD, RENZ CHRISTIAN - 7,005 - - 7,005 - 7,005 TUPAZ, ANTHONY EDSEL - 1,499 2,944 )( - 1,445 )( - 1,445 )( TY, CARL - - 427 )( - 427 )( - 427 )( Ugaddan, Karla 270 - - - 270 - 270 ULANDAY, GIANNE - 954 2,135 )( - 1,181 )( - 1,181 )( Ulep, Michael Lawrence 1,363 - - - 1,363 - 1,363 Umpad, Mara 24,000 - - - 24,000 - 24,000 Urian, Joselito 3,113 8,300 7,263 )( - 4,150 - 4,150 Usita, Laarni D. 17,661 6,875 9,375 )( - 15,161 - 15,161 Uy, Moira - 286,851 140,000 )( - 146,851 - 146,851 Uyson, Leslie Marie C. 9,258 - - - 9,258 - 9,258 Valderama, Marvin Gilbert C. - 8,300 4,150 )( - 4,150 - 4,150 Valderrama, RUth - 15,021 14,450 )( - 571 - 571 VALDEZ, MARCELINO - - 194 )( - 194 )( - 194 )( Valdez Jr., Marcos 6,225 16,600 14,525 )( - 8,300 - 8,300 Valencia, Joy G. - 2,314 328 )( - 1,986 - 1,986 Valerio, Francis 16,600 4,688 - - 21,288 - 21,288 VANZUELA, JEZEL F - 1,450 - - 1,450 - 1,450 Varilla, Edglyn - OLD 5,141 - - - 5,141 - 5,141 VELASCO, MARK ANTHONY - 4,088 2,044 )( - 2,044 - 2,044 Velasquez III, Damian - 341 - - 341 - 341 Velasquez, Ma. Charisma B. 3,160 - - - 3,160 - 3,160 Vera, Roderick 691 )( - 491 )( - 1,181 )( - 1,181 )( Verano, Aldrick 781 )( - - - 781 )( - 781 )( Verano, Jacqueline Christine 2,903 - - - 2,903 - 2,903 VERANO, JAY NEIL - 1,018 509 )( - 509 - 509 Verdote, Christopher - 1,872 - - 1,872 - 1,872 Vibar, Ma Theresa - 14,592 14,592 )( - - - - Vicente, Gudani 2,300 - - - 2,300 - 2,300 VICTOR, RAMON - - 2,044 )( - 2,044 )( - 2,044 )( VICTORIA, JUANITO - 427 427 )( - - - - VICTORIA, MICHAEL - 16,600 5,481 )( - 11,119 - 11,119 Victoria, Wendelliza 1,450 40,140 4,425 )( - 37,165 - 37,165 Vilchez, Maria Gladys 1,384 )( - 1,063 )( - 2,447 )( - 2,447 )( Villacorta, Enrico 1,181 )( - - - 1,181 )( - 1,181 )( Villaluz, Gerardo 1,090 - 1,267 )( - 177 )( - 177 )( Villamin, Jojo 931 )( - 400 )( - 1,331 )( - 1,331 )( VILLANUEVA, ANTONIO JR - 200 1,345 )( - 1,145 )( - 1,145 )( VILLANUEVA, ARHIMEDES - 1,127 1,408 )( - 282 )( - 282 )( Villanueva, Ma. Concepcion L. - 23,864 1,553 )( - 22,311 - 22,311 Villanueva, Romulo 673 )( - - - 673 )( - 673 )( VILLANUEVA, SARAH CAPARAS 1,545 - - - 1,545 - 1,545 Villar, Gerald 6,225 144,979 22,350 )( - 128,854 - 128,854 Villar, Gerald 20,294 - 10,000 )( - 10,294 - 10,294 Villasis, Christian 1,613 - 1,588 )( - 25 - 25 VILLEGAS JR,M AMADO - 4,456 - - 4,456 - 4,456 Villegas, Ronchette Lee I - 8,300 4,150 )( - 4,150 - 4,150 Villena, Jean Marie 753 - 1,189 )( - 436 )( - 436 )( Vinas, Ana Marie 1,908 - - - 1,908 - 1,908 Vinluan, Lourdes - - - - 0 - - Vinluan, Renato * 4,875 - - - 4,875 - 4,875 Vitug, Marianne Claire 2,544 )( - - - 2,544 )( - 2,544 )( Vizcayno, Wilfredo 4,900 - - - 4,900 - 4,900 WANG, EVA MARIE - 4,088 2,044 )( - 2,044 - 2,044 Yago, Rowena - 1,215 1,215 )( - - - - YAH, LARA JESSICA - 1,299 1,299 )( - - - - Yan, Edwin 400 - - - 400 - 400 Yap, Avelina 9,405 - - - 9,405 - 9,405 YAP, GIRARD 9,281 - 9,281 )( - - - - YAP, ROSALIE - - 1,772 )( - 1,772 )( - 1,772 )( YAP, SANDRA - 5,298 - - 5,298 - 5,298 Yu, Antonio O. 100 - - - 100 - 100 Yudelmo,Walter 1,363 )( 681 681 )( - 1,363 )( - 1,363 )( Zafra, Reynele Bren G. 346 - - - 346 - 346 Zaldivar, Felicia P. 43,830 - - - 43,830 - 43,830 Zaldivar, Ramil - 6,177 6,177 )( - - - 0 )( Zamora, Elizar - 9,753 2,207 )( - 7,546 - 7,546 Zamudio, Rowena B. 5,100 )( - - - 5,100 )( - 5,100 )( Zerna, Cromwell Matheau 969 )( - - - 969 )( - 969 )( Fabila, Gilbert 461 - - - 461 - 461 Fernandez, Barbara 320 - - - 320 - 320 Escosia, Aurora 890 - - - 890 - 890
Forward
THE FAR EASTERN UNIVERSITY, INCORPORATED AND SUBSIDIARIES
Schedule B - Amounts Receivable from Directors, Officers, Employees, Related Parties and Principal Stockholders (Other Than Related Parties)
May 31, 2018
Name and Designation of DebtorBalance at
Beginning of Period
Additions
Deductions
Current Non-CurrentBalance at End of
PeriodAmounts CollectedAmounts
Written-Off
PP PP
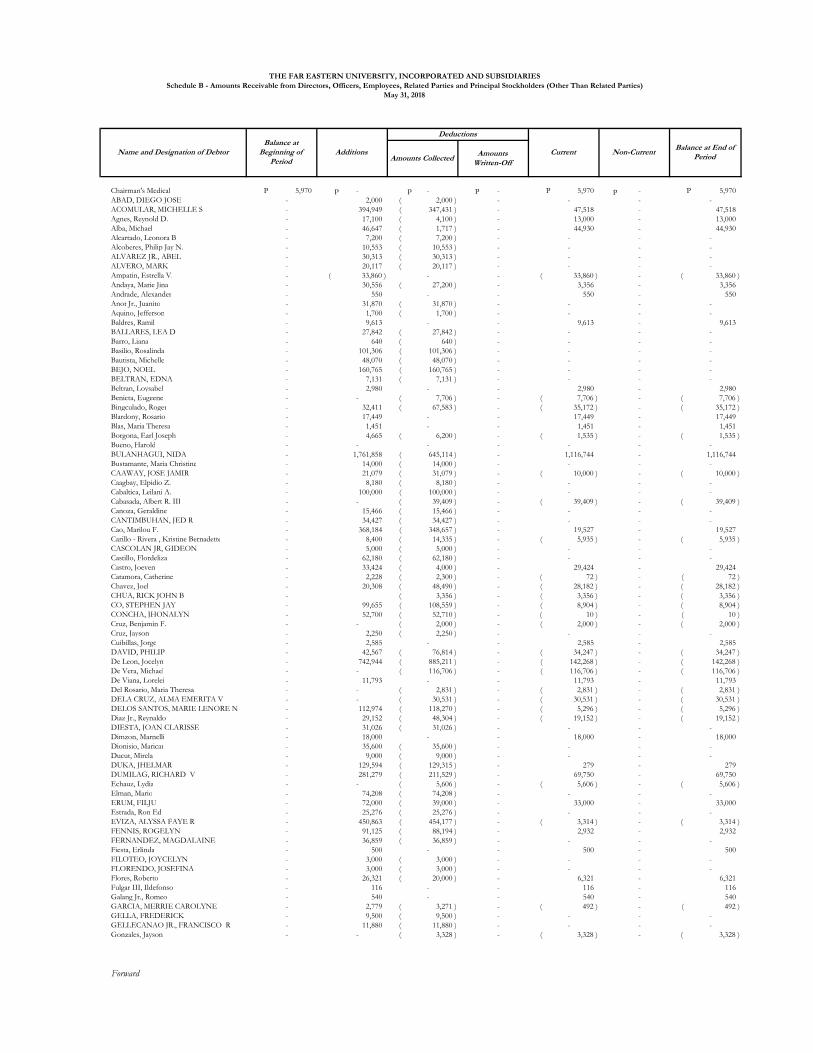
Chairman's Medical 5,970 P - - - 5,970 P - 5,970 P
ABAD, DIEGO JOSE - 2,000 2,000 )( - - - - ACOMULAR, MICHELLE S - 394,949 347,431 )( - 47,518 - 47,518 Agnes, Reynold D. - 17,100 4,100 )( - 13,000 - 13,000 Alba, Michael - 46,647 1,717 )( - 44,930 - 44,930 Alcartado, Leonora B - 7,200 7,200 )( - - - - Alcoberes, Philip Jay N. - 10,553 10,553 )( - - - - ALVAREZ JR., ABEL - 30,313 30,313 )( - - - - ALVERO, MARK - 20,117 20,117 )( - - - - Ampatin, Estrella V. - 33,860 )( - - 33,860 )( - 33,860 )( Andaya, Marie Jina - 30,556 27,200 )( - 3,356 - 3,356 Andrade, Alexander - 550 - - 550 - 550 Anot Jr., Juanito - 31,870 31,870 )( - - - - Aquino, Jefferson - 1,700 1,700 )( - - - - Baldres, Ramil - 9,613 - - 9,613 - 9,613 BALLARES, LEA D - 27,842 27,842 )( - - - - Barro, Liana - 640 640 )( - - - - Basilio, Rosalinda - 101,306 101,306 )( - - - - Bautista, Michelle - 48,070 48,070 )( - - - - BEJO, NOEL - 160,765 160,765 )( - - - - BELTRAN, EDNA - 7,131 7,131 )( - - - - Beltran, Loysabel - 2,980 - - 2,980 - 2,980 Benicta, Eugeene - - 7,706 )( - 7,706 )( - 7,706 )( Bingculado, Roger - 32,411 67,583 )( - 35,172 )( - 35,172 )( Blardony, Rosario - 17,449 - - 17,449 - 17,449 Blas, Maria Theresa - 1,451 - - 1,451 - 1,451 Borgona, Earl Joseph - 4,665 6,200 )( - 1,535 )( - 1,535 )( Bueno, Harold - - - - - - - BULANHAGUI, NIDA - 1,761,858 645,114 )( - 1,116,744 - 1,116,744 Bustamante, Maria Christine - 14,000 14,000 )( - - - - CAAWAY, JOSE JAMIR - 21,079 31,079 )( - 10,000 )( - 10,000 )( Caagbay, Elpidio Z. - 8,180 8,180 )( - - - - Cabaltica, Leilani A. - 100,000 100,000 )( - - - - Cabasada, Albert R. III - - 39,409 )( - 39,409 )( - 39,409 )( Canoza, Geraldine - 15,466 15,466 )( - - - - CANTIMBUHAN, JED R - 34,427 34,427 )( - - - - Cao, Marilou F. - 368,184 348,657 )( - 19,527 - 19,527 Carillo - Rivera , Kristine Bernadette - 8,400 14,335 )( - 5,935 )( - 5,935 )( CASCOLAN JR, GIDEON - 5,000 5,000 )( - - - - Castillo, Flordeliza - 62,180 62,180 )( - - - - Castro, Joeven - 33,424 4,000 )( - 29,424 - 29,424 Catamora, Catherine - 2,228 2,300 )( - 72 )( - 72 )( Chavez, Joel - 20,308 48,490 )( - 28,182 )( - 28,182 )( CHUA, RICK JOHN B - 3,356 )( - 3,356 )( - 3,356 )( CO, STEPHEN JAY - 99,655 108,559 )( - 8,904 )( - 8,904 )( CONCHA, JHONALYN - 52,700 52,710 )( - 10 )( - 10 )( Cruz, Benjamin F. - - 2,000 )( - 2,000 )( - 2,000 )( Cruz, Jayson - 2,250 2,250 )( - - - - Cuibillas, Jorge - 2,585 - - 2,585 - 2,585 DAVID, PHILIP - 42,567 76,814 )( - 34,247 )( - 34,247 )( De Leon, Jocelyn - 742,944 885,211 )( - 142,268 )( - 142,268 )( De Vera, Michael - - 116,706 )( - 116,706 )( - 116,706 )( De Viana, Lorelei - 11,793 - - 11,793 - 11,793 Del Rosario, Maria Theresa - - 2,831 )( - 2,831 )( - 2,831 )( DELA CRUZ, ALMA EMERITA V - - 30,531 )( - 30,531 )( - 30,531 )( DELOS SANTOS, MARIE LENORE N - 112,974 118,270 )( - 5,296 )( - 5,296 )( Diaz Jr., Reynaldo - 29,152 48,304 )( - 19,152 )( - 19,152 )( DIESTA, JOAN CLARISSE - 31,026 31,026 )( - - - - Dimzon, Marnelli - 18,000 - - 18,000 - 18,000 Dionisio, Maricar - 35,600 35,600 )( - - - - Ducut, Mirela - 9,000 9,000 )( - - - - DUKA, JHELMAR - 129,594 129,315 )( - 279 - 279 DUMILAG, RICHARD V - 281,279 211,529 )( - 69,750 - 69,750 Echauz, Lydia - - 5,606 )( - 5,606 )( - 5,606 )( Elman, Mario - 74,208 74,208 )( - - - - ERUM, FILJU - 72,000 39,000 )( - 33,000 - 33,000 Estrada, Ron Ed - 25,276 25,276 )( - - - - EVIZA, ALYSSA FAYE R - 450,863 454,177 )( - 3,314 )( - 3,314 )( FENNIS, ROGELYN - 91,125 88,194 )( - 2,932 - 2,932 FERNANDEZ, MAGDALAINE - 36,859 36,859 )( - - - - Fiesta, Erlinda - 500 - - 500 - 500 FILOTEO, JOYCELYN - 3,000 3,000 )( - - - - FLORENDO, JOSEFINA - 3,000 3,000 )( - - - - Flores, Roberto - 26,321 20,000 )( - 6,321 - 6,321 Fulgar III, Ildefonso - 116 - - 116 - 116 Galang Jr., Romeo - 540 - - 540 - 540 GARCIA, MERRIE CAROLYNE - 2,779 3,271 )( - 492 )( - 492 )( GELLA, FREDERICK - 9,500 9,500 )( - - - - GELLECANAO JR., FRANCISCO R - 11,880 11,880 )( - - - - Gonzales, Jayson - - 3,328 )( - 3,328 )( - 3,328 )(
Forward
THE FAR EASTERN UNIVERSITY, INCORPORATED AND SUBSIDIARIES
Schedule B - Amounts Receivable from Directors, Officers, Employees, Related Parties and Principal Stockholders (Other Than Related Parties)
May 31, 2018
Name and Designation of DebtorBalance at
Beginning of Period
Additions
Deductions
Current Non-CurrentBalance at End of
PeriodAmounts CollectedAmounts
Written-Off
P PPP
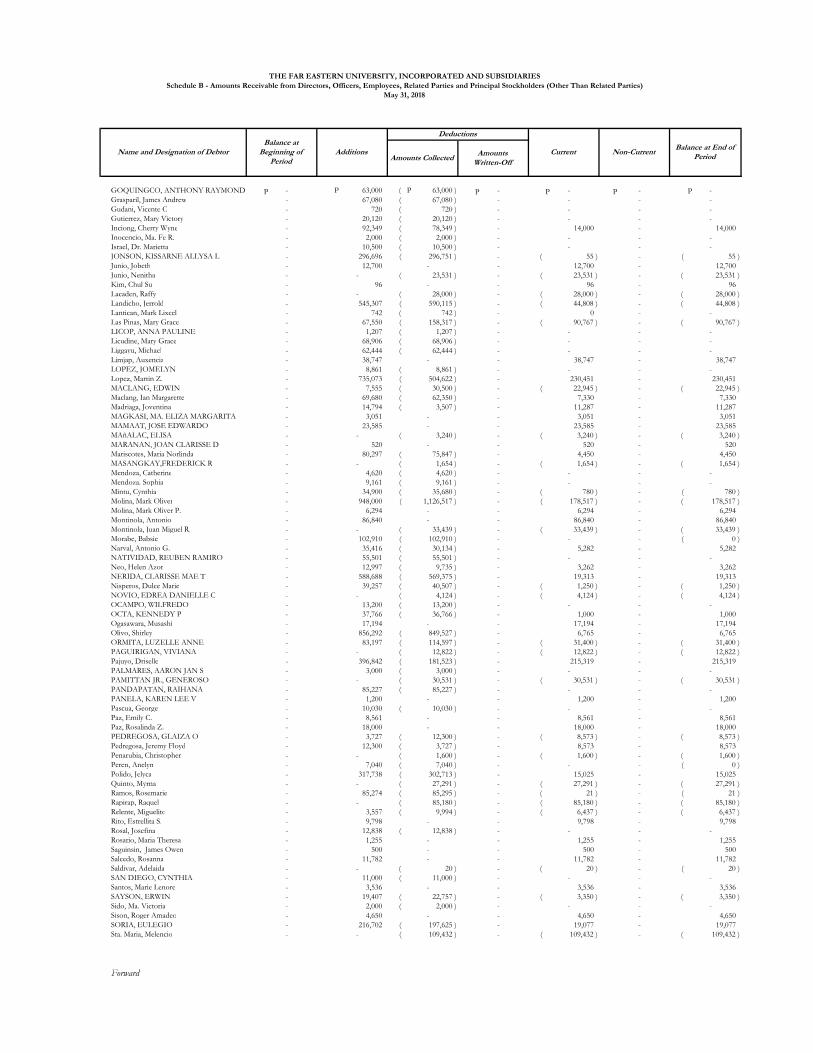
GOQUINGCO, ANTHONY RAYMOND - 63,000 P 63,000 )( P - - - -
Grasparil, James Andrew - 67,080 67,080 )( - - - - Gudani, Vicente C - 720 720 )( - - - - Gutierrez, Mary Victory - 20,120 20,120 )( - - - - Inciong, Cherry Wyne - 92,349 78,349 )( - 14,000 - 14,000 Inocencio, Ma. Fe R. - 2,000 2,000 )( - - - - Israel, Dr. Marietta - 10,500 10,500 )( - - - - JONSON, KISSARNE ALLYSA L - 296,696 296,751 )( - 55 )( - 55 )( Junio, Jobeth - 12,700 - - 12,700 - 12,700 Junio, Nenitha - - 23,531 )( - 23,531 )( - 23,531 )( Kim, Chul Su - 96 - - 96 - 96 Lacaden, Raffy - - 28,000 )( - 28,000 )( - 28,000 )( Landicho, Jerrold - 545,307 590,115 )( - 44,808 )( - 44,808 )( Lantican, Mark Lixcel - 742 742 )( - 0 - - Las Pinas, Mary Grace - 67,550 158,317 )( - 90,767 )( - 90,767 )( LICOP, ANNA PAULINE - 1,207 1,207 )( - - - - Licudine, Mary Grace - 68,906 68,906 )( - - - - Liggayu, Michael - 62,444 62,444 )( - - - - Limjap, Auxencia - 38,747 - - 38,747 - 38,747 LOPEZ, JOMELYN - 8,861 8,861 )( - - - - Lopez, Martin Z. - 735,073 504,622 )( - 230,451 - 230,451 MACLANG, EDWIN - 7,555 30,500 )( - 22,945 )( - 22,945 )( Maclang, Ian Margarette - 69,680 62,350 )( - 7,330 - 7,330 Madriaga, Joventina - 14,794 3,507 )( - 11,287 - 11,287 MAGKASI, MA. ELIZA MARGARITA - 3,051 - - 3,051 - 3,051 MAMAAT, JOSE EDWARDO - 23,585 - - 23,585 - 23,585 MAñALAC, ELISA - - 3,240 )( - 3,240 )( - 3,240 )( MARANAN, JOAN CLARISSE D - 520 - - 520 - 520 Mariscotes, Maria Norlinda - 80,297 75,847 )( - 4,450 - 4,450 MASANGKAY,FREDERICK R - - 1,654 )( - 1,654 )( - 1,654 )( Mendoza, Catherine - 4,620 4,620 )( - - - - Mendoza. Sophia - 9,161 9,161 )( - - - - Mintu, Cynthia - 34,900 35,680 )( - 780 )( - 780 )( Molina, Mark Oliver - 948,000 1,126,517 )( - 178,517 )( - 178,517 )( Molina, Mark Oliver P. - 6,294 - - 6,294 - 6,294 Montinola, Antonio - 86,840 - - 86,840 - 86,840 Montinola, Juan Miguel R. - - 33,439 )( - 33,439 )( - 33,439 )( Morabe, Babsie - 102,910 102,910 )( - - - 0 )( Narval, Antonio G. - 35,416 30,134 )( - 5,282 - 5,282 NATIVIDAD, REUBEN RAMIRO - 55,501 55,501 )( - - - - Neo, Helen Azor - 12,997 9,735 )( - 3,262 - 3,262 NERIDA, CLARISSE MAE T - 588,688 569,375 )( - 19,313 - 19,313 Nisperos, Dulce Marie - 39,257 40,507 )( - 1,250 )( - 1,250 )( NOVIO, EDREA DANIELLE C - - 4,124 )( - 4,124 )( - 4,124 )( OCAMPO, WILFREDO - 13,200 13,200 )( - - - - OCTA, KENNEDY P - 37,766 36,766 )( - 1,000 - 1,000 Ogasawara, Musashi - 17,194 - - 17,194 - 17,194 Olivo, Shirley - 856,292 849,527 )( - 6,765 - 6,765 ORMITA, LUZELLE ANNE - 83,197 114,597 )( - 31,400 )( - 31,400 )( PAGUIRIGAN, VIVIANA - - 12,822 )( - 12,822 )( - 12,822 )( Pajuyo, Driselle - 396,842 181,523 )( - 215,319 - 215,319 PALMARES, AARON JAN S - 3,000 3,000 )( - - - - PAMITTAN JR., GENEROSO - - 30,531 )( - 30,531 )( - 30,531 )( PANDAPATAN, RAIHANA - 85,227 85,227 )( - - - - PANELA, KAREN LEE V - 1,200 - - 1,200 - 1,200 Pascua, George - 10,030 10,030 )( - - - - Paz, Emily C. - 8,561 - - 8,561 - 8,561 Paz, Rosalinda Z. - 18,000 - - 18,000 - 18,000 PEDREGOSA, GLAIZA O - 3,727 12,300 )( - 8,573 )( - 8,573 )( Pedregosa, Jeremy Floyd - 12,300 3,727 )( - 8,573 - 8,573 Penarubia, Christopher - - 1,600 )( - 1,600 )( - 1,600 )( Peren, Anelyn - 7,040 7,040 )( - - - 0 )( Polido, Jelyca - 317,738 302,713 )( - 15,025 - 15,025 Quinto, Myrna - - 27,291 )( - 27,291 )( - 27,291 )( Ramos, Rosemarie - 85,274 85,295 )( - 21 )( - 21 )( Rapirap, Raquel - - 85,180 )( - 85,180 )( - 85,180 )( Relente, Miguelito - 3,557 9,994 )( - 6,437 )( - 6,437 )( Rito, Estrellita S. - 9,798 - - 9,798 - 9,798 Rosal, Josefina - 12,838 12,838 )( - - - - Rosario, Maria Theresa - 1,255 - - 1,255 - 1,255 Saguinsin, James Owen - 500 - - 500 - 500 Salcedo, Rosanna - 11,782 - - 11,782 - 11,782 Saldivar, Adelaida - - 20 )( - 20 )( - 20 )( SAN DIEGO, CYNTHIA - 11,000 11,000 )( - - - - Santos, Marie Lenore - 3,536 - - 3,536 - 3,536 SAYSON, ERWIN - 19,407 22,757 )( - 3,350 )( - 3,350 )( Sido, Ma. Victoria - 2,000 2,000 )( - - - - Sison, Roger Amadeo - 4,650 - - 4,650 - 4,650 SORIA, EULEGIO - 216,702 197,625 )( - 19,077 - 19,077 Sta. Maria, Melencio - - 109,432 )( - 109,432 )( - 109,432 )(
Forward
THE FAR EASTERN UNIVERSITY, INCORPORATED AND SUBSIDIARIES
Schedule B - Amounts Receivable from Directors, Officers, Employees, Related Parties and Principal Stockholders (Other Than Related Parties)
May 31, 2018
Name and Designation of DebtorBalance at
Beginning of Period
Additions
Deductions
Current Non-CurrentBalance at End of
PeriodAmounts CollectedAmounts
Written-Off
PP PP P
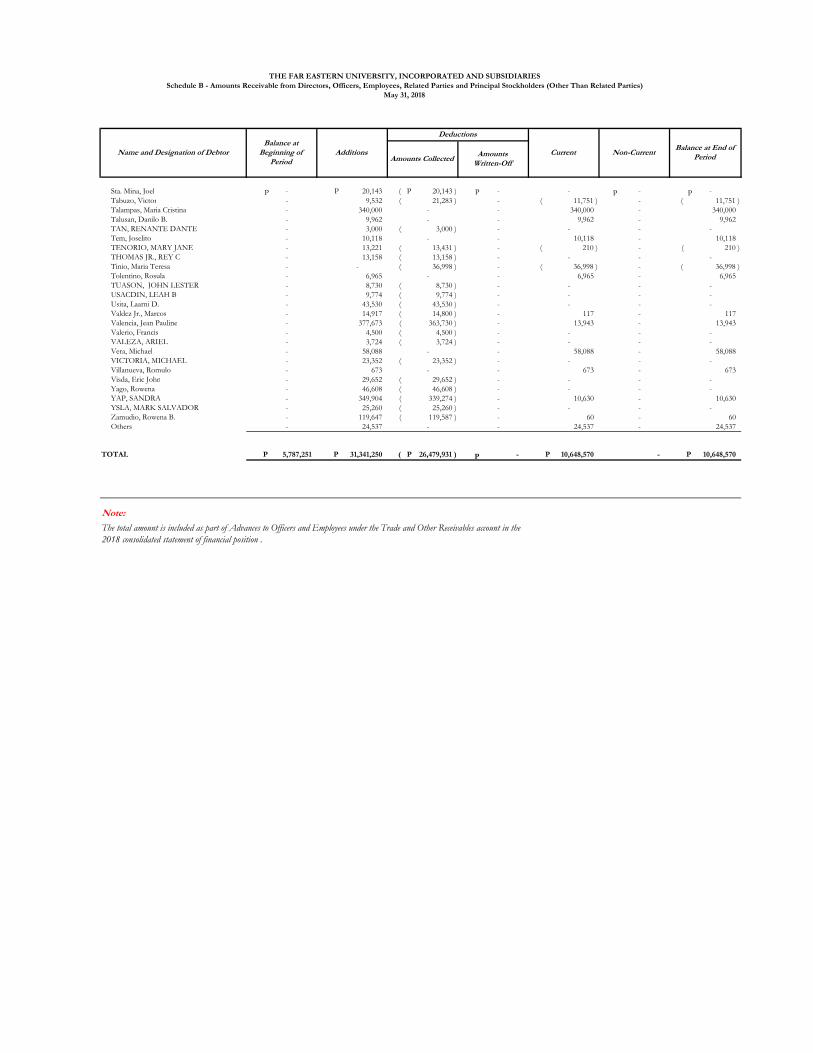
Sta. Mina, Joel - 20,143 P 20,143 )( P - - - -
Tabuzo, Victor - 9,532 21,283 )( - 11,751 )( - 11,751 )( Talampas, Maria Cristina - 340,000 - - 340,000 - 340,000 Talusan, Danilo B. - 9,962 - - 9,962 - 9,962 TAN, RENANTE DANTE - 3,000 3,000 )( - - - - Tem, Joselito - 10,118 - - 10,118 - 10,118 TENORIO, MARY JANE - 13,221 13,431 )( - 210 )( - 210 )( THOMAS JR., REY C - 13,158 13,158 )( - - - - Tinio, Maria Teresa - - 36,998 )( - 36,998 )( - 36,998 )( Tolentino, Rosula - 6,965 - - 6,965 - 6,965 TUASON, JOHN LESTER - 8,730 8,730 )( - - - - USACDIN, LEAH B - 9,774 9,774 )( - - - - Usita, Laarni D. - 43,530 43,530 )( - - - - Valdez Jr., Marcos - 14,917 14,800 )( - 117 - 117 Valencia, Jean Pauline - 377,673 363,730 )( - 13,943 - 13,943 Valerio, Francis - 4,500 4,500 )( - - - - VALEZA, ARIEL - 3,724 3,724 )( - - - - Vera, Michael - 58,088 - - 58,088 - 58,088 VICTORIA, MICHAEL - 23,352 23,352 )( - - - - Villanueva, Romulo - 673 - - 673 - 673 Visda, Eric John - 29,652 29,652 )( - - - - Yago, Rowena - 46,608 46,608 )( - - - - YAP, SANDRA - 349,904 339,274 )( - 10,630 - 10,630 YSLA, MARK SALVADOR - 25,260 25,260 )( - - - - Zamudio, Rowena B. - 119,647 119,587 )( - 60 - 60 Others - 24,537 - - 24,537 - 24,537
TOTAL 5,787,251 P 31,341,250 P 26,479,931 )( P - 10,648,570 P - 10,648,570 P
Note:
The total amount is included as part of Advances to Officers and Employees under the Trade and Other Receivables account in the
2018 consolidated statement of financial position .
THE FAR EASTERN UNIVERSITY, INCORPORATED AND SUBSIDIARIES
Schedule B - Amounts Receivable from Directors, Officers, Employees, Related Parties and Principal Stockholders (Other Than Related Parties)
May 31, 2018
Name and Designation of DebtorBalance at
Beginning of Period
Additions
Deductions
Current Non-CurrentBalance at End of
PeriodAmounts CollectedAmounts
Written-Off
P
P
P P P
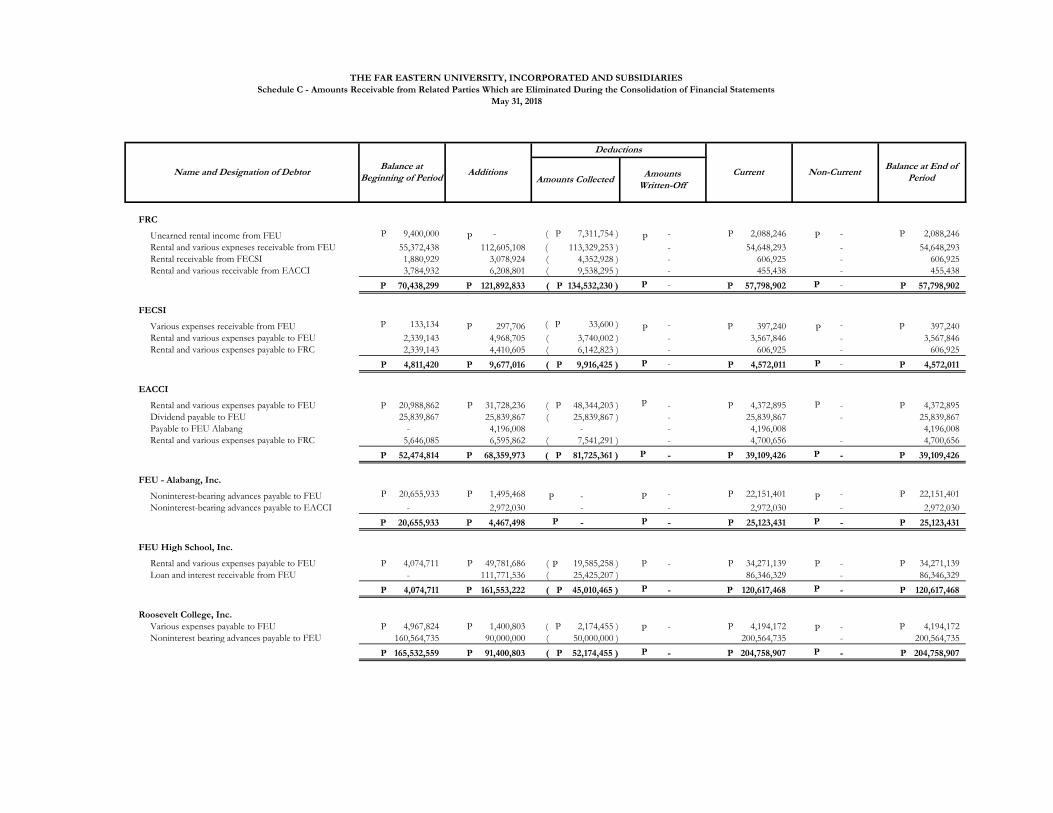
FRC
Unearned rental income from FEU 9,400,000 P - 7,311,754 )( P - 2,088,246 P - 2,088,246 P
Rental and various expneses receivable from FEU 55,372,438 112,605,108 113,329,253 )( - 54,648,293 - 54,648,293
Rental receivable from FECSI 1,880,929 3,078,924 4,352,928 )( - 606,925 - 606,925
Rental and various receivable from EACCI 3,784,932 6,208,801 9,538,295 )( - 455,438 - 455,438
70,438,299 P 121,892,833 P 134,532,230 )( P - 57,798,902 P - 57,798,902 P
FECSI
Various expenses receivable from FEU 133,134 P 297,706 P 33,600 )( P - 397,240 P - 397,240 P
Rental and various expenses payable to FEU 2,339,143 4,968,705 3,740,002 )( - 3,567,846 - 3,567,846
Rental and various expenses payable to FRC 2,339,143 4,410,605 6,142,823 )( - 606,925 - 606,925
4,811,420 P 9,677,016 P 9,916,425 )( P - 4,572,011 P - 4,572,011 P
EACCI
Rental and various expenses payable to FEU 20,988,862 31,728,236 P 48,344,203 )( P - 4,372,895 P - 4,372,895 P
Dividend payable to FEU 25,839,867 25,839,867 25,839,867 )( - 25,839,867 - 25,839,867
Payable to FEU Alabang - 4,196,008 - - 4,196,008 4,196,008
Rental and various expenses payable to FRC 5,646,085 6,595,862 7,541,291 )( - 4,700,656 - 4,700,656
52,474,814 P 68,359,973 P 81,725,361 )( P - 39,109,426 P - 39,109,426 P
FEU - Alabang, Inc.
Noninterest-bearing advances payable to FEU 20,655,933 P 1,495,468 P - - 22,151,401 P - 22,151,401 P
Noninterest-bearing advances payable to EACCI - 2,972,030 - - 2,972,030 - 2,972,030
20,655,933 P 4,467,498 P - - 25,123,431 P - 25,123,431 P
FEU High School, Inc.
Rental and various expenses payable to FEU 4,074,711 P 49,781,686 P 19,585,258 )( - 34,271,139 P - 34,271,139 P
Loan and interest receivable from FEU - 111,771,536 25,425,207 )( 86,346,329 - 86,346,329
4,074,711 P 161,553,222 P 45,010,465 )( P - 120,617,468 P - 120,617,468 P
Roosevelt College, Inc.
Various expenses payable to FEU 4,967,824 P 1,400,803 P 2,174,455 )( P - 4,194,172 P - 4,194,172 P
Noninterest bearing advances payable to FEU 160,564,735 90,000,000 50,000,000 )( 200,564,735 - 200,564,735
165,532,559 P 91,400,803 P 52,174,455 )( P - 204,758,907 P - 204,758,907 P
Balance at End of Period
Non-Current
THE FAR EASTERN UNIVERSITY, INCORPORATED AND SUBSIDIARIES
Schedule C - Amounts Receivable from Related Parties Which are Eliminated During the Consolidation of Financial Statements
May 31, 2018
Amounts CollectedAmounts
Written-Off
Deductions
Name and Designation of DebtorBalance at
Beginning of PeriodAdditions Current
P P P
P P P
P P
P P
P P P
P P
P P
P
P PP
P P
P P
P P
P P
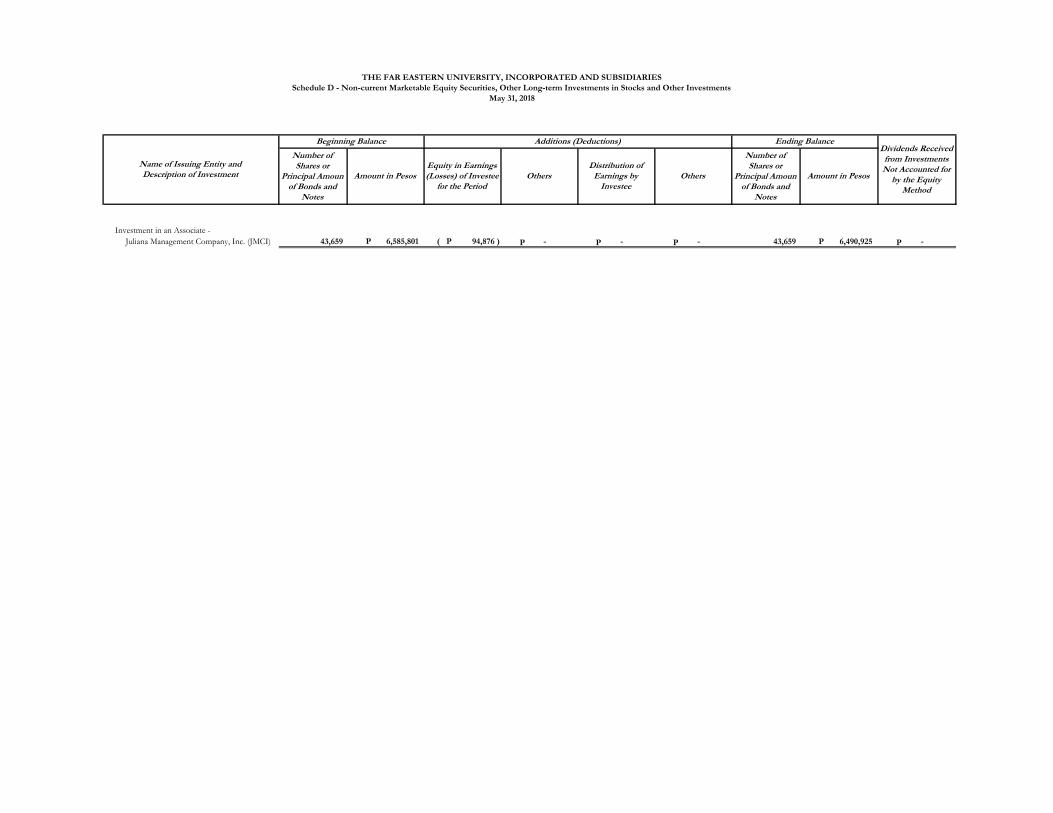
Number of Shares or
Principal Amoun of Bonds and
Notes
Number of Shares or
Principal Amoun of Bonds and
Notes
Investment in an Associate -
Juliana Management Company, Inc. (JMCI) 43,659 6,585,801 P 94,876 )( P - - - 43,659 6,490,925 P -
Dividends Received from Investments Not Accounted for
by the Equity Method
THE FAR EASTERN UNIVERSITY, INCORPORATED AND SUBSIDIARIES
Schedule D - Non-current Marketable Equity Securities, Other Long-term Investments in Stocks and Other Investments
May 31, 2018
Amount in PesosEquity in Earnings (Losses) of Investee
for the PeriodOthers
Distribution of Earnings by
InvesteeOthers
Name of Issuing Entity and Description of Investment Amount in Pesos
Beginning Balance Additions (Deductions) Ending Balance
P P PP
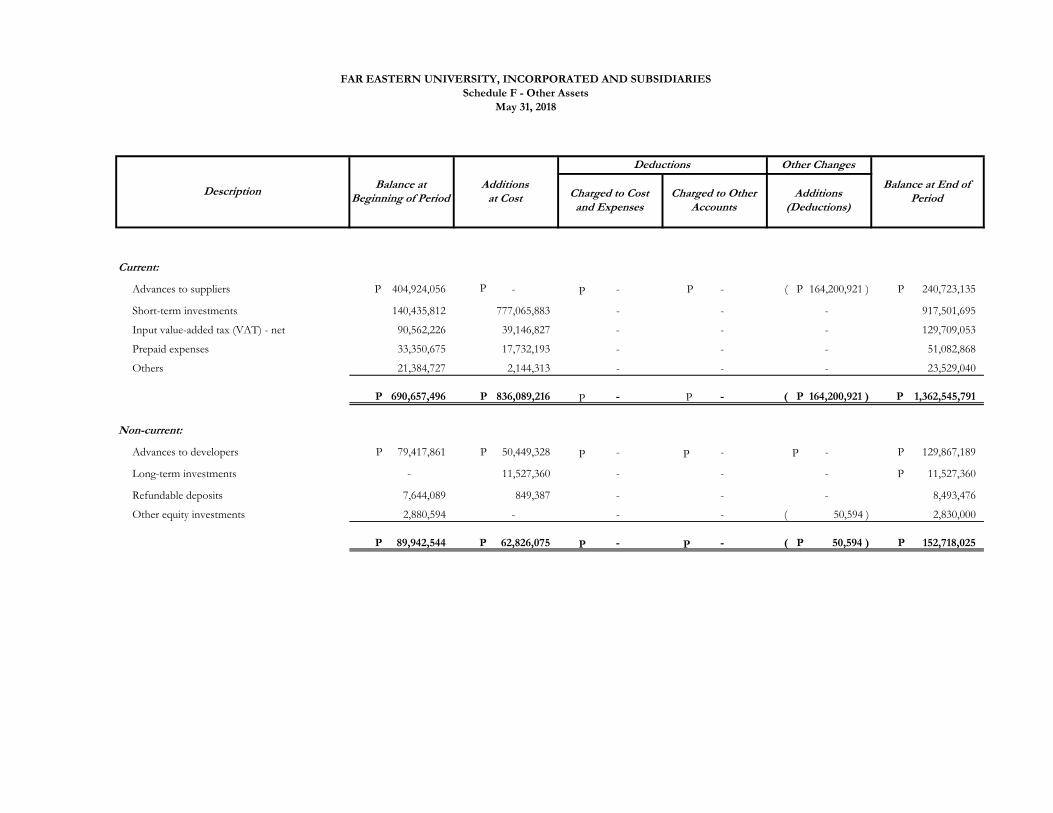
Current:
Advances to suppliers 404,924,056 P - - - 164,200,921 )( P 240,723,135 P
Short-term investments 140,435,812 777,065,883 - - - 917,501,695
Input value-added tax (VAT) - net 90,562,226 39,146,827 - - - 129,709,053
Prepaid expenses 33,350,675 17,732,193 - - - 51,082,868
Others 21,384,727 2,144,313 - - - 23,529,040
690,657,496 P 836,089,216 P - - 164,200,921 )( P 1,362,545,791 P
Non-current:
Advances to developers 79,417,861 P 50,449,328 P - - - 129,867,189 P
Long-term investments - 11,527,360 - - - 11,527,360 P
Refundable deposits 7,644,089 849,387 - - - 8,493,476
Other equity investments 2,880,594 - - - 50,594 )( 2,830,000
89,942,544 P 62,826,075 P - - 50,594 )( P 152,718,025 P
Charged to Cost and Expenses
Charged to Other Accounts
Other Changes
Additions (Deductions)
FAR EASTERN UNIVERSITY, INCORPORATED AND SUBSIDIARIES
Schedule F - Other Assets
May 31, 2018
DescriptionBalance at
Beginning of PeriodAdditions at Cost
Deductions
Balance at End of Period
PP
P P P
P P
P
P
P
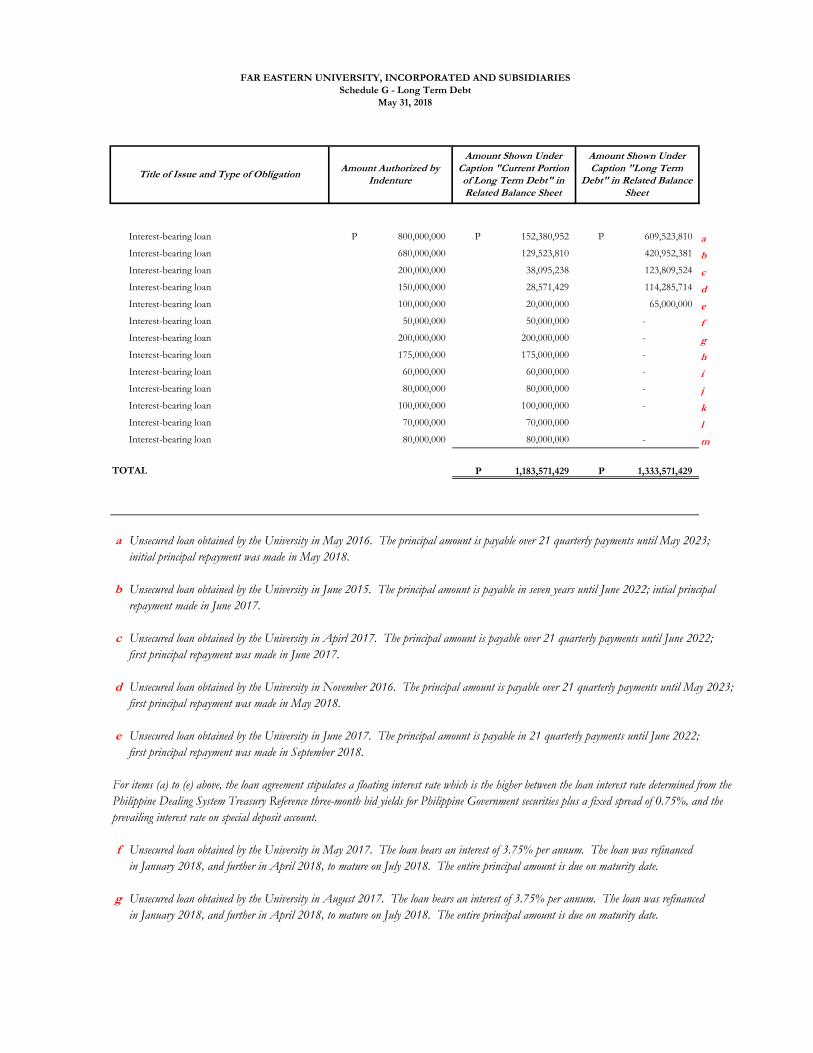
Interest-bearing loan 800,000,000 P 152,380,952 P 609,523,810 P a
Interest-bearing loan 680,000,000 129,523,810 420,952,381 b
Interest-bearing loan 200,000,000 38,095,238 123,809,524 c
Interest-bearing loan 150,000,000 28,571,429 114,285,714 d
Interest-bearing loan 100,000,000 20,000,000 65,000,000 e
Interest-bearing loan 50,000,000 50,000,000 - f
Interest-bearing loan 200,000,000 200,000,000 - g
Interest-bearing loan 175,000,000 175,000,000 - h
Interest-bearing loan 60,000,000 60,000,000 - i
Interest-bearing loan 80,000,000 80,000,000 - j
Interest-bearing loan 100,000,000 100,000,000 - k
Interest-bearing loan 70,000,000 70,000,000 l
Interest-bearing loan 80,000,000 80,000,000 - m
TOTAL 1,183,571,429 P 1,333,571,429 P
a Unsecured loan obtained by the University in May 2016. The principal amount is payable over 21 quarterly payments until May 2023;
initial principal repayment was made in May 2018.
b Unsecured loan obtained by the University in June 2015. The principal amount is payable in seven years until June 2022; intial principal
repayment made in June 2017.
c Unsecured loan obtained by the University in Apirl 2017. The principal amount is payable over 21 quarterly payments until June 2022;
first principal repayment was made in June 2017.
d Unsecured loan obtained by the University in November 2016. The principal amount is payable over 21 quarterly payments until May 2023;
first principal repayment was made in May 2018.
e Unsecured loan obtained by the University in June 2017. The principal amount is payable in 21 quarterly payments until June 2022;
first principal repayment was made in September 2018.
For items (a) to (e) above, the loan agreement stipulates a floating interest rate which is the higher between the loan interest rate determined from the
Philippine Dealing System Treasury Reference three-month bid yields for Philippine Government securities plus a fixed spread of 0.75%, and the
prevailing interest rate on special deposit account.
f Unsecured loan obtained by the University in May 2017. The loan bears an interest of 3.75% per annum. The loan was refinanced
in January 2018, and further in April 2018, to mature on July 2018. The entire principal amount is due on maturity date.
g Unsecured loan obtained by the University in August 2017. The loan bears an interest of 3.75% per annum. The loan was refinanced
in January 2018, and further in April 2018, to mature on July 2018. The entire principal amount is due on maturity date.
Title of Issue and Type of ObligationAmount Authorized by
Indenture
Amount Shown Under Caption "Current Portion of Long Term Debt" in Related Balance Sheet
Amount Shown Under Caption "Long Term
Debt" in Related Balance Sheet
FAR EASTERN UNIVERSITY, INCORPORATED AND SUBSIDIARIES
Schedule G - Long Term Debt
May 31, 2018
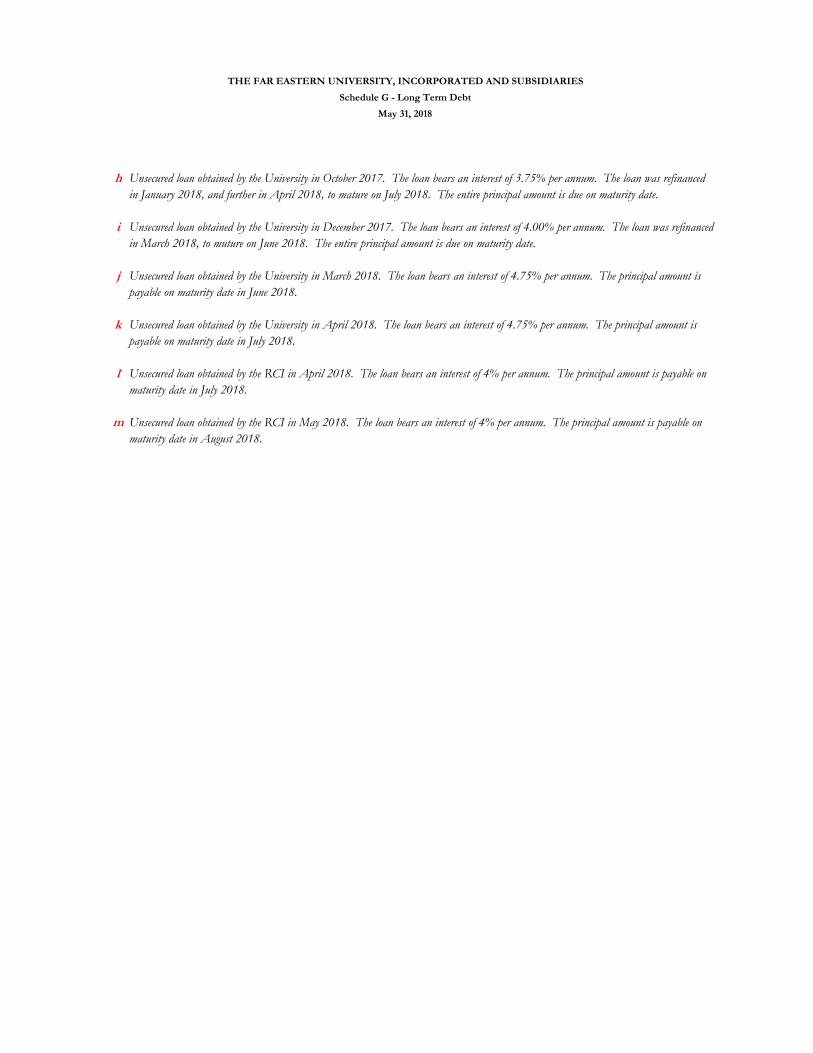
h Unsecured loan obtained by the University in October 2017. The loan bears an interest of 3.75% per annum. The loan was refinanced
in January 2018, and further in April 2018, to mature on July 2018. The entire principal amount is due on maturity date.
i Unsecured loan obtained by the University in December 2017. The loan bears an interest of 4.00% per annum. The loan was refinanced
in March 2018, to muture on June 2018. The entire principal amount is due on maturity date.
j Unsecured loan obtained by the University in March 2018. The loan bears an interest of 4.75% per annum. The principal amount is
payable on maturity date in June 2018.
k Unsecured loan obtained by the University in April 2018. The loan bears an interest of 4.75% per annum. The principal amount is
payable on maturity date in July 2018.
l Unsecured loan obtained by the RCI in April 2018. The loan bears an interest of 4% per annum. The principal amount is payable on
maturity date in July 2018.
m Unsecured loan obtained by the RCI in May 2018. The loan bears an interest of 4% per annum. The principal amount is payable on
maturity date in August 2018.
May 31, 2018
THE FAR EASTERN UNIVERSITY, INCORPORATED AND SUBSIDIARIES
Schedule G - Long Term Debt
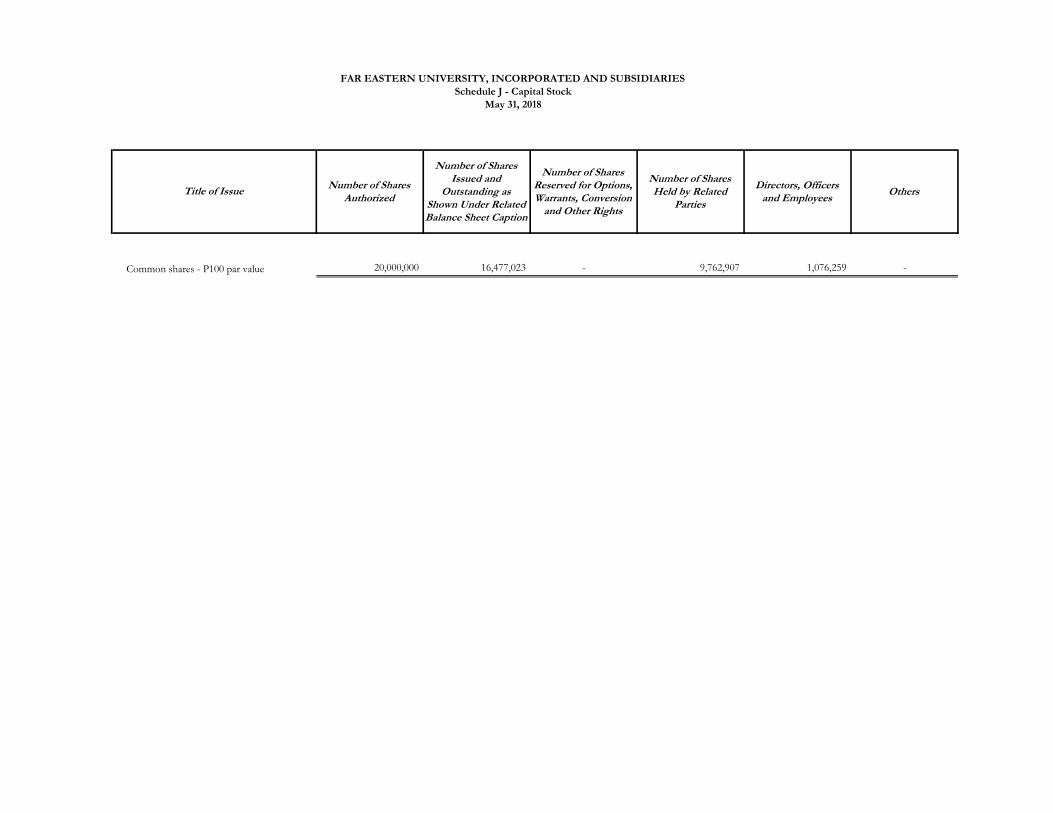
Number of Shares Authorized
Number of Shares Issued and
Outstanding as Shown Under Related Balance Sheet Caption
Number of Shares Reserved for Options, Warrants, Conversion
and Other Rights
Number of Shares Held by Related
Parties
Directors, Officers and Employees
Others
Common shares - P100 par value 20,000,000 16,477,023 - 9,762,907 1,076,259 -
FAR EASTERN UNIVERSITY, INCORPORATED AND SUBSIDIARIES
Schedule J - Capital Stock
May 31, 2018
Title of Issue
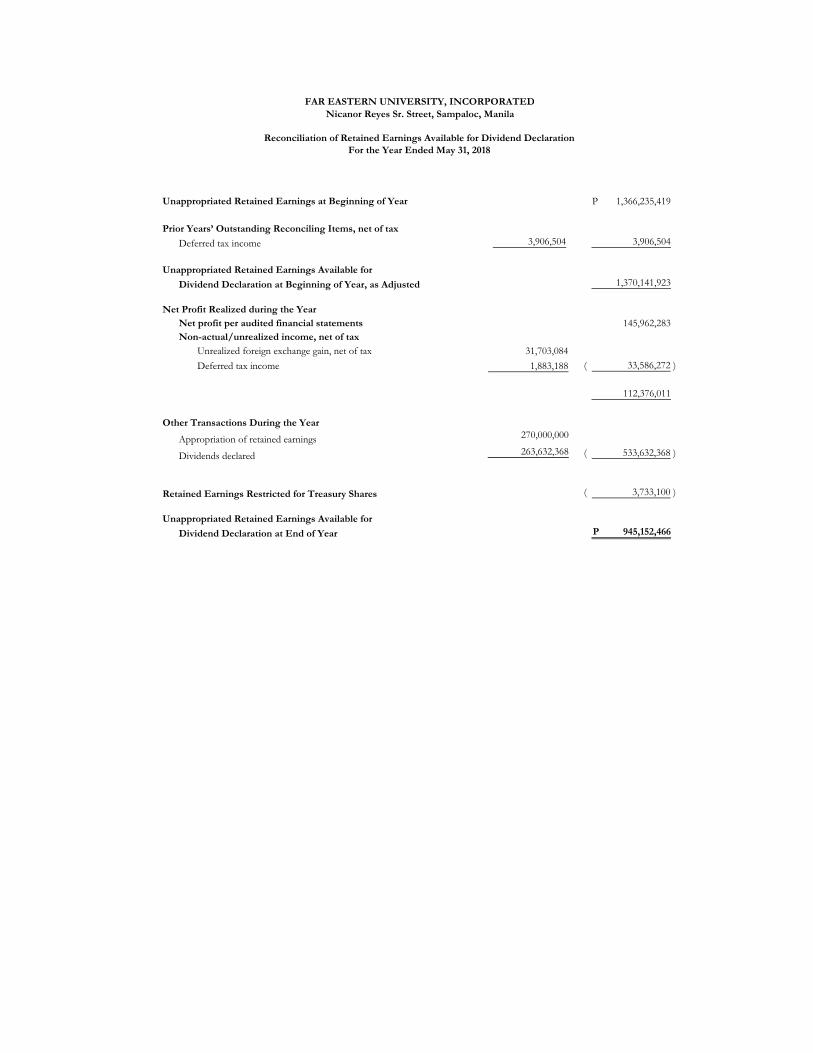
Unappropriated Retained Earnings at Beginning of Year 1,366,235,419 P
Prior Years’ Outstanding Reconciling Items, net of tax
Deferred tax income 3,906,504 3,906,504
Unappropriated Retained Earnings Available for
Dividend Declaration at Beginning of Year, as Adjusted 1,370,141,923
Net Profit Realized during the Year
Net profit per audited financial statements 145,962,283
Non-actual/unrealized income, net of tax
Unrealized foreign exchange gain, net of tax 31,703,084
Deferred tax income 1,883,188 33,586,272 )(
112,376,011
Other Transactions During the Year
Appropriation of retained earnings 270,000,000
Dividends declared 263,632,368 533,632,368 )(
Retained Earnings Restricted for Treasury Shares 3,733,100 )(
Unappropriated Retained Earnings Available for
Dividend Declaration at End of Year 945,152,466 P
FAR EASTERN UNIVERSITY, INCORPORATED
Nicanor Reyes Sr. Street, Sampaloc, Manila
Reconciliation of Retained Earnings Available for Dividend Declaration
For the Year Ended May 31, 2018
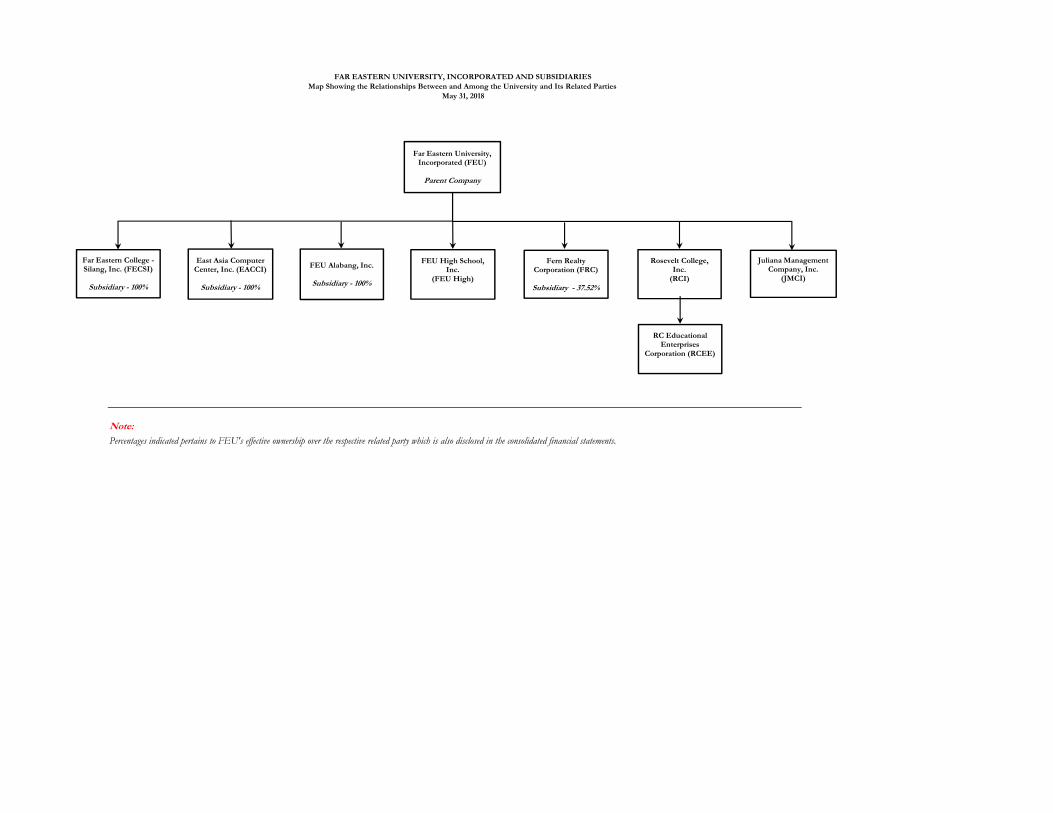
Note:
Percentages indicated pertains to FEU's effective ownership over the respective related party which is also disclosed in the consolidated financial statements.
FAR EASTERN UNIVERSITY, INCORPORATED AND SUBSIDIARIES
Map Showing the Relationships Between and Among the University and Its Related Parties
May 31, 2018
Far Eastern University, Incorporated (FEU)
Parent Company
Far Eastern College -Silang, Inc. (FECSI)
Subsidiary - 100%
East Asia Computer Center, Inc. (EACCI)
Subsidiary - 100%
FEU Alabang, Inc.
Subsidiary - 100%
FEU High School, Inc.
(FEU High)
Fern Realty Corporation (FRC)
Subsidiary - 37.52%
Juliana Management Company, Inc.
(JMCI)
Rosevelt College, Inc.(RCI)
RC Educational Enterprises
Corporation (RCEE)
Adopted Not AdoptedNot
Applicable
a
a
a
First-time Adoption of Philippine Financial Reporting Standards a
a
Amendments to PFRS 1: Limited Exemption from Comparative PFRS 7 Disclosures for
First-time Adopters a
Amendments to PFRS 1: Severe Hyperinflation and Removal of Fixed Date for
First-time Adopters a
Amendments to PFRS 1: Government Loans a
Amendments to PFRS 1: Deletion of Short-term Exemptions a
Share-based Payment a
Amendments to PFRS 2: Vesting Conditions and Cancellations a
Amendments to PFRS 2: Group Cash-settled Share-based Payment Transactions a
Amendments to PFRS 2: Classification and Measurement of Share-based Payment Transactions*
(effective January 1, 2018) a
Business Combinations aAmendment to PFRS 3: Remeasurement of Previously Held Interests in a Joint Operation*
(effective January 1, 2019) a
Insurance Contracts aAmendments to PAS 39 and PFRS 4: Financial Guarantee Contracts aAmendments to PFRS 4: Applying PFRS 9, Financial Instruments , with PFRS 4, Insurance Contracts*
(effective January 1, 2018) a
PFRS 5 Non-current Assets Held for Sale and Discontinued Operations aPFRS 6 Exploration for and Evaluation of Mineral Resources a
Financial Instruments: Disclosures aAmendments to PFRS 7: Transition aAmendments to PAS 39 and PFRS 7: Reclassification of Financial Assets aAmendments to PAS 39 and PFRS 7: Reclassification of Financial Assets - Effective Date and
Transition a
Amendments to PFRS 7: Improving Disclosures about Financial Instruments aAmendments to PFRS 7: Disclosures – Transfers of Financial Assets aAmendments to PFRS 7: Disclosures – Offsetting Financial Assets and Financial Liabilities aAmendments to PFRS 7: Mandatory Effective Date of PFRS 9 and Transition Disclosures*
(effective when PFRS 9 is first applied) a
PFRS 8 Operating Segments aFinancial Instruments (2014)* (effective January 1, 2018) aAmendments to PFRS 9: Prepayment Features with Negative Compensation*
(effective January 1, 2019) a
Consolidated Financial Statements aAmendments to PFRS 10: Transition Guidance aAmendments to PFRS 10: Investment Entities aAmendments to PFRS 10: Sale or Contribution of Assets between an Investor and its Associate or
Joint Venture* (effective date deferred indefinitely) a
Amendments to PFRS 10: Investment Entities – Applying the Consolidation Exception aJoint Arrangements a
Amendments to PFRS 11: Transition Guidance a
Amendments to PFRS 11: Accounting for Acquisitions of Interests in Joint Operations aAmendment to PFRS 11: Remeasurement of Previously Held Interests in a Joint Operation*
(effective January 1, 2019) a
Disclosure of Interests in Other Entities aAmendments to PFRS 12: Transition Guidance aAmendments to PFRS 12: Investment Entities aAmendments to PFRS 10: Investment Entities – Applying the Consolidation Exception a
Framework for the Preparation and Presentation of Financial Statements
THE FAR EASTER UNIVERSITY, INCORPORATED AND SUBSIDIARIES
Schedule of Philippine Financial Reporting Standards and Interpretations
Adopted by the Securities and Exchange Commission and the
Financial Reporting Standards Council as of May 31, 2018
PHILIPPINE FINANCIAL REPORTING STANDARDS AND INTERPRETATIONS
PFRS 11
Conceptual Framework Phase A: Objectives and Qualitative Characteristics
Practice Statement Management Commentary
Philippine Financial Reporting Standards (PFRS)
PFRS 1
(Revised)
Amendments to PFRS 1: Additional Exemptions for First-time Adopters
PFRS 2
PFRS 3
(Revised)
PFRS 4
PFRS 7
PFRS 9
PFRS 10
PFRS 12
3
Adopted Not AdoptedNot
ApplicablePHILIPPINE FINANCIAL REPORTING STANDARDS AND INTERPRETATIONS
PFRS 13 Fair Value Measurement a
PFRS 14 Regulatory Deferral Accounts a
PFRS 15 Revenue from Contracts with Customers* (effective January 1, 2018 ) a
PFRS 16 Leases* (effective January 1, 2019) a
PFRS 17 Insurance Contracts* (effective January 1, 2021) a
Presentation of Financial Statements a
Amendments to PAS 32 and PAS 1: Puttable Financial Instruments and Obligations Arising on
Liquidation a
Amendments to PAS 1: Presentation of Items of Other Comprehensive Income a
Amendments to PAS 1: Disclosure Initiative a
PAS 2 Inventories a
Statement of Cash Flows a
Amendments to PAS 7: Disclosure Initiative a
PAS 8 Accounting Policies, Changes in Accounting Estimates and Errors a
PAS 10 Events After the Reporting Period a
PAS 11 Construction Contracts a
Income Taxes a
Amendments to PAS 12 - Deferred Tax: Recovery of Underlying Assets a
Amendments to PAS 12 - Recognition of Deferred Tax Assets for Unrealized Losses a
Amendment to PAS 12 - Tax Consequences of Dividends* (effective January 1, 2019) a
Property, Plant and Equipment a
Amendments to PAS 16: Bearer Plants** aAmendments to PAS 16: Clarification of Acceptable Methods of Depreciation and Amortization a
PAS 17 Leases aPAS 18 Revenue a
Employee Benefits aAmendments to PAS 19: Defined Benefit Plans - Employee Contributions a
PAS 20 Accounting for Government Grants and Disclosure of Government Assistance aThe Effects of Changes in Foreign Exchange Rates aAmendments: Net Investment in a Foreign Operation aBorrowing Costs aAmendment to PAS 23: Eligibility for Capitalization a
PAS 24
(Revised) Related Party Disclosures a
PAS 26 Accounting and Reporting by Retirement Benefit Plans a
Separate Financial Statements a
Amendments to PAS 27: Investment Entities aAmendments to PAS 27: Equity Method in Separate Financial Statements a
Investments in Associates and Joint Ventures a
Amendments to PFRS 10: Sale or Contribution of Assets between an Investor and its Associate or
Joint Venture* (effective date deferred indefinitely) a
Amendments to PAS 28: Investment Entities - Applying the Consolidation Exception aAmendment to PAS 28: Measurement of Investment in Associates at Fair Value through Profit or
Loss* (effective January 1, 2018) a
Amendment to PAS 28: Long-term Interest in Associates and Joint Venture*
(effective January 1, 2019 ) a
PAS 29 Financial Reporting in Hyperinflationary Economies aFinancial Instruments: Presentation aAmendments to PAS 32 and PAS 1: Puttable Financial Instruments and Obligations Arising on
Liquidation a
Amendments to PAS 32: Classification of Rights Issues aAmendments to PAS 32: Offsetting Financial Assets and Financial Liabilities a
PAS 33 Earnings Per Share aPAS 34 Interim Financial Reporting a
Impairment of Assets aAmendment to PAS 36: Recoverable Amount Disclosures for Non-financial Assets a
PAS 37 Provisions, Contingent Liabilities and Contingent Assets a
Intangible Assets aAmendments to PAS 38: Clarification of Acceptable Methods of Depreciation and Amortization a
PAS 32
Philippine Accounting Standards (PAS)
PAS 1
(Revised)
PAS 7
PAS 12
PAS 16
PAS 19
(Revised)
PAS 21
PAS 23
(Revised)
PAS 27
(Revised)
PAS 28
(Revised)
PAS 36
PAS 38
4
Adopted Not AdoptedNot
ApplicablePHILIPPINE FINANCIAL REPORTING STANDARDS AND INTERPRETATIONS
Financial Instruments: Recognition and Measurement a
Amendments to PAS 39: Transition and Initial Recognition of Financial Assets and Financial
Liabilities a
Amendments to PAS 39: Cash Flow Hedge Accounting of Forecast Intragroup Transactions** a
Amendments to PAS 39: The Fair Value Option** a
Amendments to PAS 39 and PFRS 4: Financial Guarantee Contracts** aAmendments to PAS 39 and PFRS 7: Reclassification of Financial Assets a
Amendments to PAS 39 and PFRS 7: Reclassification of Financial Assets – Effective Date and
Transition a
Amendments to Philippine Interpretation IFRIC 9 and PAS 39: Embedded Derivatives** a
Amendments to PAS 39: Eligible Hedged Items** a
Amendments to PAS 39: Novation of Derivatives and Continuation of Hedge Accounting** a
Investment Property a
Amendment to PAS 40: Reclassification to and from Investment Property*
(effective January 1, 2018 ) a
Agriculture a
Amendments to PAS 41: Bearer Plants a
IFRIC 1 Changes in Existing Decommissioning, Restoration and Similar Liabilities a
IFRIC 2 Members’ Share in Co-operative Entities and Similar Instruments a
IFRIC 4 Determining Whether an Arrangement Contains a Lease a
IFRIC 5 Rights to Interests Arising from Decommissioning, Restoration and Environmental Rehabilitation
Funds a
IFRIC 6 Liabilities Arising from Participating in a Specific Market - Waste Electrical and Electronic
Equipment a
IFRIC 7 Applying the Restatement Approach under PAS 29, Financial Reporting in Hyperinflationary
Economies a
Reassessment of Embedded Derivatives a
Amendments to Philippine Interpretation IFRIC–9 and PAS 39: Embedded Derivatives a
IFRIC 10 Interim Financial Reporting and Impairment aIFRIC 12 Service Concession Arrangements aIFRIC 13 Customer Loyalty Programmes a
PAS 19 - The Limit on a Defined Benefit Asset, Minimum Funding Requirements and their
Interaction a
Amendments to Philippine Interpretations IFRIC - 14, Prepayments of a Minimum Funding
Requirement and their Interaction a
IFRIC 16 Hedges of a Net Investment in a Foreign Operation aIFRIC 17 Distributions of Non-cash Assets to Owners aIFRIC 18 Transfers of Assets from Customers aIFRIC 19 Extinguishing Financial Liabilities with Equity Instruments aIFRIC 20 Stripping Costs in the Production Phase of a Surface Mine aIFRIC 21 Levies aIFRIC 22 Foreign Currency Transactions and Advance Consideration* (effective January 1, 2018 ) aIFRIC 23 Uncertainty Over Income Tax Treatments* (effective January 1, 2019) a
SIC-7 Introduction of the Euro aSIC-10 Government Assistance - No Specific Relation to Operating Activities aSIC-13 Jointly Controlled Entities - Non-Monetary Contributions by Venturers aSIC-15 Operating Leases - Incentives aSIC-25 Income Taxes - Changes in the Tax Status of an Entity or its Shareholders aSIC-27 Evaluating the Substance of Transactions Involving the Legal Form of a Lease aSIC-29 Service Concession Arrangements: Disclosures a
SIC-31 Revenue - Barter Transactions Involving Advertising Services** a
SIC-32 Intangible Assets - Web Site Costs a
* These standards will be effective for periods subsequent to fiscal year 2018 and are not early adopted by the Group.
** These standards have been adopted in the preparation of financial statements but the Group has no significant transactions
covered in both years presented.
IFRIC 9
IFRIC 14
Philippine Interpretations - Standing Interpretations Committee (SIC)
PAS 39
PAS 40
PAS 41
Philippine Interpretations - International Financial Reporting Interpretations Committee (IFRIC)
5
Related Documents