Accident Analysis and Prevention 33 (2001) 423 – 432 Secular trends of motor vehicle mortality in the United States, 1910 – 1994 Guohua Li a,b, *, Cyrus Shahpar a , Jurek George Grabowski a , Susan P. Baker a,b a Department of Emergency Medicine, Johns Hopkins Uni6ersity School of Medicine, 1830 East Monument Street, Suite 6 -100, Baltimore, MD 21205, USA b Center for Injury Research and Policy, Johns Hopkins Uni6ersity School of Hygiene and Public Health, Baltimore, MD 21205, USA Received 5 April 2000; received in revised form 29 June 2000; accepted 1 July 2000 Abstract To examine the secular trends of mortality from motor vehicle crashes, the authors compiled annual population and mortality data for the United States from 1910 to 1994 and performed an age – period – cohort analysis through graphical presentation, median polish, and Poisson regression modeling. During the 85-year study period, death rates from motor vehicle crashes showed two peaks, first in 1935–39 and then in 1965–69. Age and period effects accounted for 94% of the variation in motor vehicle mortality in men and 84% of the variation in women. Age patterns of motor vehicle mortality varied greatly with birth cohorts: for those who were born before 1910, death rates increased with age; for those born after 1910, death rates peaked at age 20–24 years for men and at age 15–19 years for women. A crossover characterized by a downward trend in death rates among the elderly and an upward trend among adolescents and young adults was observed in both sexes. The complex age, period, and cohort patterns of motor vehicle mortality are likely to have been shaped by changes in traffic patterns and driver behavior, and by improvements in safety design and emergency medical service systems. © 2001 Elsevier Science Ltd. All rights reserved. Keywords: Age effect; Cohort effect; Epidemiologic method; Motor vehicle crashes www.elsevier.com/locate/aap 1. Introduction Injury has been one of the leading causes of morbid- ity and mortality in the United States since the 1930s. About one-third of all injury deaths and 12% of all nonfatal injuries treated in emergency departments re- sult from motor vehicle crashes (Baker et al., 1992; Burt, 1995). In 1997 in the United States, motor vehicle crashes claimed 41 967 lives, caused 3.4 million injuries, and resulted in economic costs of over US$100 billion (NHTSA, 1994, 1998). The gender and age characteristics and the historical trends of motor vehicle mortality have been well docu- mented (Baker et al., 1992). Overall, the death rate from motor vehicle crashes for men is about three times the rate for women, and the age patterns of motor vehicle mortality are similar for both sexes, with the highest peak around ages 15–24 and an elevation among the elderly. In the past six decades, motor vehicle mortality has fluctuated over time with a 29% decrease between 1930 and 1990 (Baker et al., 1992). Despite the large body of literature on injury epidemiol- ogy, the secular trends of motor vehicle mortality are not well understood because most studies are cross-sec- tional in essence or limited to data for a relatively short period. The purpose of the present study is to delineate the secular trends of motor vehicle mortality in the United States, using the age – period – cohort (APC) analysis technique. First introduced in 1930 by Andvord (1930), APC analysis has gained renewed interest in recent years with advancements in biostatistical research and com- puting technology. It has been used in studies of a variety of diseases and injuries (Stevens and Mool- gavkar, 1984; Tango and Kurashina, 1987; Rewers et al., 1989; Nystrom et al., 1990; Lin and Lee, 1993; Sverre, 1993; Lee and Lin, 1995; Seow et al., 1996; Tsauo et al., 1996; Zheng et al., 1996; Gilliland et al., * Corresponding author. Tel.: 1-410-6145229; fax: +1-410- 9550141. E-mail address: [email protected] (G. Li). 0001-4575/01/$ - see front matter © 2001 Elsevier Science Ltd. All rights reserved. PII:S0001-4575(00)00056-7

Welcome message from author
This document is posted to help you gain knowledge. Please leave a comment to let me know what you think about it! Share it to your friends and learn new things together.
Transcript
Accident Analysis and Prevention 33 (2001) 423–432
Secular trends of motor vehicle mortality in the United States,1910–1994
Guohua Li a,b,*, Cyrus Shahpar a, Jurek George Grabowski a, Susan P. Baker a,b
a Department of Emergency Medicine, Johns Hopkins Uni6ersity School of Medicine, 1830 East Monument Street, Suite 6-100, Baltimore,MD 21205, USA
b Center for Injury Research and Policy, Johns Hopkins Uni6ersity School of Hygiene and Public Health, Baltimore, MD 21205, USA
Received 5 April 2000; received in revised form 29 June 2000; accepted 1 July 2000
Abstract
To examine the secular trends of mortality from motor vehicle crashes, the authors compiled annual population and mortalitydata for the United States from 1910 to 1994 and performed an age–period–cohort analysis through graphical presentation,median polish, and Poisson regression modeling. During the 85-year study period, death rates from motor vehicle crashes showedtwo peaks, first in 1935–39 and then in 1965–69. Age and period effects accounted for 94% of the variation in motor vehiclemortality in men and 84% of the variation in women. Age patterns of motor vehicle mortality varied greatly with birth cohorts:for those who were born before 1910, death rates increased with age; for those born after 1910, death rates peaked at age 20–24years for men and at age 15–19 years for women. A crossover characterized by a downward trend in death rates among theelderly and an upward trend among adolescents and young adults was observed in both sexes. The complex age, period, andcohort patterns of motor vehicle mortality are likely to have been shaped by changes in traffic patterns and driver behavior, andby improvements in safety design and emergency medical service systems. © 2001 Elsevier Science Ltd. All rights reserved.
Keywords: Age effect; Cohort effect; Epidemiologic method; Motor vehicle crashes
www.elsevier.com/locate/aap
1. Introduction
Injury has been one of the leading causes of morbid-ity and mortality in the United States since the 1930s.About one-third of all injury deaths and 12% of allnonfatal injuries treated in emergency departments re-sult from motor vehicle crashes (Baker et al., 1992;Burt, 1995). In 1997 in the United States, motor vehiclecrashes claimed 41 967 lives, caused 3.4 million injuries,and resulted in economic costs of over US$100 billion(NHTSA, 1994, 1998).
The gender and age characteristics and the historicaltrends of motor vehicle mortality have been well docu-mented (Baker et al., 1992). Overall, the death ratefrom motor vehicle crashes for men is about three timesthe rate for women, and the age patterns of motorvehicle mortality are similar for both sexes, with the
highest peak around ages 15–24 and an elevationamong the elderly. In the past six decades, motorvehicle mortality has fluctuated over time with a 29%decrease between 1930 and 1990 (Baker et al., 1992).Despite the large body of literature on injury epidemiol-ogy, the secular trends of motor vehicle mortality arenot well understood because most studies are cross-sec-tional in essence or limited to data for a relatively shortperiod. The purpose of the present study is to delineatethe secular trends of motor vehicle mortality in theUnited States, using the age–period–cohort (APC)analysis technique.
First introduced in 1930 by Andvord (1930), APCanalysis has gained renewed interest in recent yearswith advancements in biostatistical research and com-puting technology. It has been used in studies of avariety of diseases and injuries (Stevens and Mool-gavkar, 1984; Tango and Kurashina, 1987; Rewers etal., 1989; Nystrom et al., 1990; Lin and Lee, 1993;Sverre, 1993; Lee and Lin, 1995; Seow et al., 1996;Tsauo et al., 1996; Zheng et al., 1996; Gilliland et al.,
* Corresponding author. Tel.: 1-410-6145229; fax: +1-410-9550141.
E-mail address: [email protected] (G. Li).
0001-4575/01/$ - see front matter © 2001 Elsevier Science Ltd. All rights reserved.PII: S 0 0 0 1 -4575 (00 )00056 -7

G. Li et al. / Accident Analysis and Pre6ention 33 (2001) 423–432424
1997; Tarone et al., 1997; Shahpar and Li, 1999). APCanalysis involves three time variables, age, period, andcohort. Usually the cohort effect is of most interest inan APC analysis, because it implies that the affectedgeneration may have been exposed in a unique way torisk factors in the environment and society (Last, 1995).Period effects are also attributed to changes in theenvironment, but are defined by a given time period.Thus, the population at risk for a period effect includespeople of all age groups who were alive during thattime period (Susser, 1982). Unlike cohort and periodeffects, age effects are intrinsic in nature, dependent onthe psychological, physiological, and behavioral matu-ration of the study population.
2. Methods
In this study, motor vehicle mortality refers to allunintentional injury deaths coded as E810 throughE825 according to the International classification ofDiseases, Ninth Revision (ICD-9), including drivers,passengers, pedestrians, and cyclists. Annual age- andsex-specific mortality data from motor vehicle crashesfor years 1910–1994 were abstracted from Vital Statis-tics of the United States, formerly Mortality Statistics,published by the National Center for Health Statistics(Bureau of the Census, 1910–1938; NCHS, 1939–1992,1998). During the study period, the ICD has beenrevised eight times (WHO, 1992). Despite manychanges in individual ICD codes over the past eightdecades, the definition and classification of uninten-tional deaths from motor vehicle crashes have remainedvirtually the same (Dunn and Shackley, 1944; Faustand Dolman, 1963, 1965; Klebba and Dolman, 1975;NCHS, 1980).
Death rates per 100 000 population from motor vehi-cle crashes were computed based on mid-year popula-tion data from the US Bureau of the Census, andtabulated into 15 5-year age groups (0–4 to 70–74years), 17 5-year periods (1910–14 to 1990–94), and 31overlapping 10-year birth cohorts (1835–1844 to 1985–1994), identified by central year of birth from 1840 to1990. Excluded from this study were persons age 75years or older because age-specific data for these elderlywere not uniformly available for years 1910–1939 andthe numbers of deaths from motor vehicle crashesamong these elderly were too small to allow meaningfulanalysis. Age-adjusted death rates were calculated usingthe direct method and the population from the 1940–44period as the standard. Data for men and women wereanalyzed separately because of the considerable genderdiscrepancies in death rates from motor vehicle crashes.
A three-step approach was taken in this APCanalysis.
First, age-specific death rates were plotted by year ofdeath (period) and central year of birth (cohort) tovisually inspect age, period, and cohort patterns. Toclarify long term patterns, certain age-specific (0–4,10–14, and alternative age groups beginning with 35–39 years) and year of birth-specific (every other cohortfrom 1840–1990, except 1910) rates were not includedin the plots.
Second, a median polish analysis was performed todetect cohort effects by examining the residuals ofdeath rates after removing the additive influences of ageand period. A non-parametric method, median polishenables removal of the additive effects of age (row) andperiod (column) on the death rates by iteratively sub-tracting the median value of each row and column. Theresidual values resulting from the median polish analy-sis are equivalent to the interaction effect of age andperiod on the death rates, i.e. the departure from theadditive model. Because cohort effect is statistically apartial interaction of age and period (Greenburg et al.,1950; Kupper et al., 1985), the magnitude and distribu-tion of the residual values are instructive for gaugingthe cohort effect.
Finally, Poisson regression modeling was used toquantify the age, period, and cohort effects. Assumingthat the number of deaths from motor vehicle crashesfollows a Poisson distribution, the logarithm of thedeath rates is expressed as the following linear functionof age, period, and cohort:
log(dij/pij)=m+ai+bj+gk+eij (1)
where dij denotes the number of deaths in the ith agegroup and jth period; pij, the population at risk in theith age group and jth period; m, the overall mean; ai,the effect of the ith age group; bj, the effect of the jthperiod; gk, the effect of the kth cohort with k=I− i+ jwhen i=1, 2, 3,…, I ; and eij, the random error withE(eij)=0. Because of the linear dependence among age,period, and cohort, parameters in Eq. (1) are notuniquely estimable unless constraints are imposed.
In this study, Poisson regression modeling was per-formed in a step-wise fashion, starting with the inter-cept-only model, progressing to the one-factor (age,period, cohort) models, to the two-factor (age–period,age–cohort, and period–cohort) models, and to thethree factor (age–period–cohort) models. Since graphi-cal inspection revealed two distinctive age patterns inmotor vehicle mortality among those who were bornbefore 1905 and among those born after 1905, Poissonregression modeling was conducted separately for co-horts with central year of birth 1840–1905, and cohortswith central year of birth 1910–1990. Three-factormodels were fitted with the assumption that the regres-sion coefficients for the two extreme cohorts (i.e. theoldest and the youngest) are nil (Tarone and Chu, 1996;Gilliland et al., 1997). Regression coefficients from the

G. Li et al. / Accident Analysis and Pre6ention 33 (2001) 423–432 425
two-factor models can be interpreted as the logarithmof the rate ratio adjusted for the other factor. Althoughthe first-order estimates from the three-factor model arenot interpretable because of the constraints applied(g1=gK=0), the second-order estimates are invariantto the model constraints and can be used to statisticallyassess the changes in the slopes of age, period, and
cohort effects (Clayton and Schifflers, 1987; Tarone andChu, 1996). In this study, second-order estimates fromthe three-factor model were evaluated through linearcontrasts between neighboring effects (Clayton andSchifflers, 1987; Tarone and Chu, 1996; Tarone et al.,1997; Gilliland et al., 1997). The modeling was carriedout using the GENMOD procedure of the StatisticalAnalysis Software (SAS) version 6.12 (SAS Institute,1997).
3. Results
A total of 2 745 808 deaths under age 75 years frommotor vehicle crashes were recorded in the UnitedStates during 1910 through 1994. Age-adjusted ratesincreased from 3.4 per 100 000 (5.3 for men and 1.5 forwomen) in the 1910–14 period to 26.7 per 100 000(41.1 for men and 12.8 for women) in the 1935–39period, then declined (Fig. 1). After experiencing asecond peak in 1965–69, the rates declined to 16.1 per100 000 (22.6 for men and 9.8 for women) in 1990–94.The overall age-adjusted death rate from motor vehiclecrashes for men was 30.2 per 100 000 per year, threetimes the rate for women (10.1 per 100 000 per year).
3.1. Graphical presentation
Death rates from motor vehicles for men exhibited asteep rise during 1910–1939 and then a gradual declineafter 1940 in most age groups (Fig. 2). Adolescents ages15–19 and young adults ages 20–29 experienced aprolonged increase in the death rates, until peaking inthe late 1960s. Before 1950 the elderly were at greaterrisk of motor vehicle mortality, with persons ages 70–74 years having the highest death rate. A crossoveroccurred during 1950–54 when the death rates for the20–24 age group surpassed the rates for the elderly andbecame the highest among all age groups (Fig. 2).Death rates for the 15–19 and 25–29 age groupsexhibited similar temporal trends as for ages 20–24 andhave been respectively the second and third highestsince 1965.
The death rates for women declined sharply duringWorld War II among all age groups above 14 years(Fig. 3). The rates for women ages 15–24 increasedcontinuously between 1945 and 1970, while the rates forother age groups remained fairly stable. After 1975,female adolescents ages 15–19 replaced the elderly asthe highest risk group (Fig. 3).
When age-specific rates for each birth cohort wereexamined, it was apparent that age patterns of motorvehicle mortality had changed considerably across birthcohorts in men (Fig. 4) and women (Fig. 5). Generally,there existed three cohort patterns in motor vehiclemortality: for those who were born during 1845 and
Fig. 1. Age-adjusted death rates from motor vehicle crashes by sexand year of death, United States, 1910–1994.
Fig. 2. Death rates from motor vehicle crashes among men 0–74years by year of death and age, United States, 1910–1994.
Fig. 3. Death rates from motor vehicle crashes among women 0–74years by year of death and age, United States, 1910–1994.

G. Li et al. / Accident Analysis and Pre6ention 33 (2001) 423–432426
Fig. 4. Death rates from motor vehicle crashes among men 0–74years by age and year of birth, United States, 1910–1994.
ages 20–24 years in men (Fig. 4) and at ages 15–19years in women (Fig. 5).
3.2. Median polish
Cohort effects were further assessed through the me-dian polish analysis. After removing the additive effectsof age and period, modest positive residuals (indicatingheightened mortality rates) were observed in the 1850–1870 and 1950–1975 cohorts of both sexes, and modestnegative residuals (indicating decreased mortality rates)were observed in the 1895–1905 and 1985–1990 co-horts of both sexes (Fig. 6).
3.3. Poisson regression
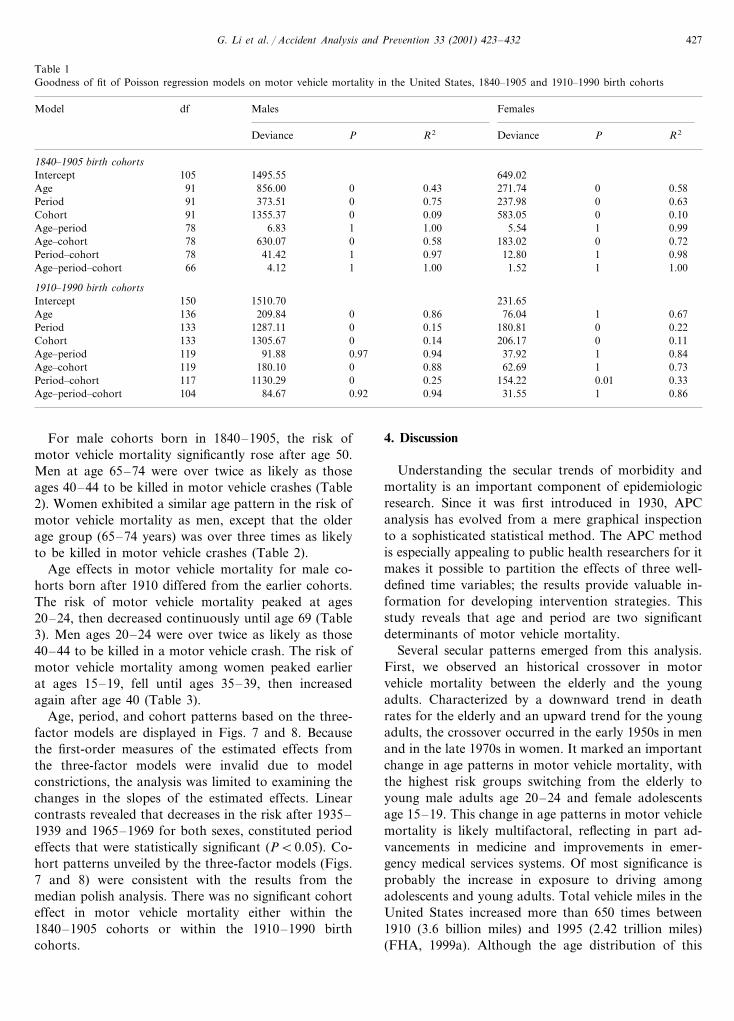
Poisson regression modeling revealed that in the1840–1905 cohorts, period was the most importantdeterminant of motor vehicle mortality, accounting for75% of the variation in the male death rates and 63% ofthe variation in the female death rates. For the 1910–1990 cohorts, age was the most important determinantof motor vehicle mortality, accounting for 86 and 67%of the variation in death rates among men and women,respectively. While age and period showed a significanteffect in both sexes, the explanatory power of cohortwas insignificant for men and women in both birthcohort groups, when adjusting for age and period(Table 1). Quantitative estimates of motor vehicle mor-tality risk by age and year of death were obtained fromtwo-factor age–period models (Tables 2 and 3). Be-cause these models fit the data nearly as well as fullthree factor age–period–cohort models, the estimatesthey provide are unlikely to be confounded by birthcohort.
Fig. 5. Death rates from motor vehicle crashes among women 0–74years by age and year of birth, United States, 1910–1994.
1865, death rates increased monotonically with age; forthe 1875–1905 cohorts, the higher rates in older agegroups gradually flattened and shifted to younger ages;and for those born after 1910, death rates peaked at
Fig. 6. Mean residuals from the median polish analysis by year of birth and sex, motor vehicle mortality data, United States, 1910–1994.
G. Li et al. / Accident Analysis and Pre6ention 33 (2001) 423–432 427
Table 1Goodness of fit of Poisson regression models on motor vehicle mortality in the United States, 1840–1905 and 1910–1990 birth cohorts
Malesdf FemalesModel
Deviance P R2 Deviance P R2
1840–1905 birth cohorts1495.55 649.02Intercept 105856.00 0 0.4391 271.74Age 0 0.58373.51 0 0.75 237.98 0Period 0.6391
1355.37 0 0.0991 583.05Cohort 0 0.106.83 1 1.00Age–period 5.5478 1 0.99
630.07 0 0.5878 183.02Age–cohort 0 0.72Period–cohort 41.4278 1 0.97 12.80 1 0.98
4.12 1 1.00 1.5266 1Age–period–cohort 1.00
1910–1990 birth cohorts1510.70150 231.65Intercept209.84 0 0.86 76.04 1Age 0.67136
1287.11 0 0.15133 180.81Period 0 0.221305.67 0 0.14Cohort 206.17133 0 0.11
91.88 0.97 0.94119 37.92Age–period 1 0.84180.10 0 0.88Age–cohort 62.69119 1 0.73
1130.29 0 0.25117 154.22Period–cohort 0.01 0.3384.67 0.92 0.94Age–period–cohort 31.55104 1 0.86
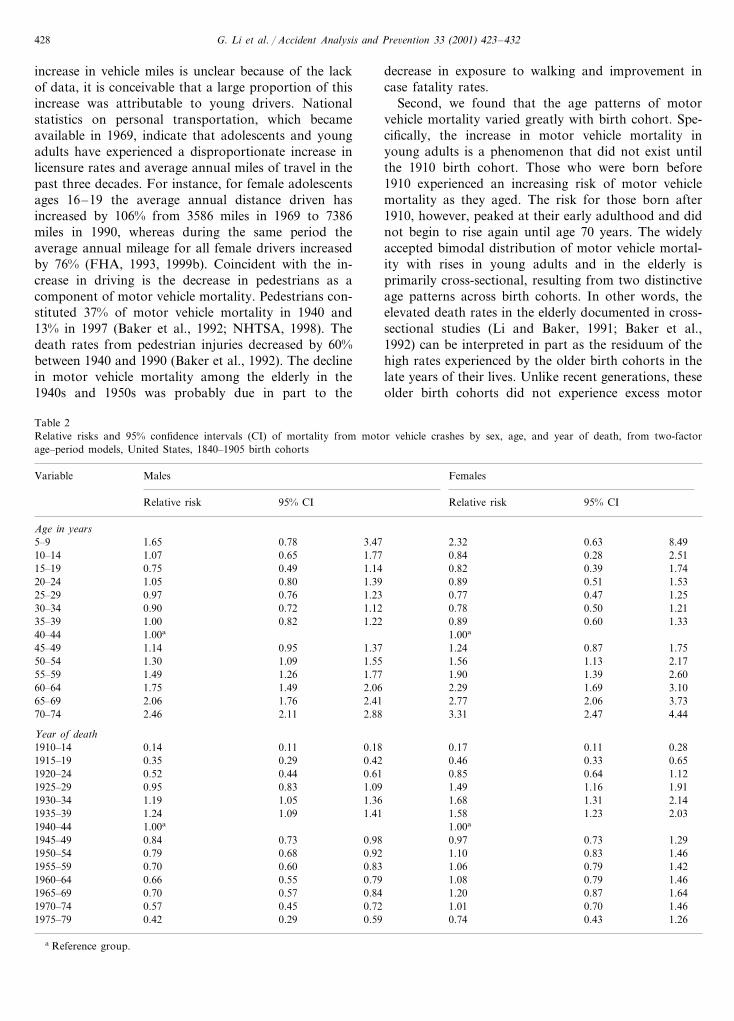
For male cohorts born in 1840–1905, the risk ofmotor vehicle mortality significantly rose after age 50.Men at age 65–74 were over twice as likely as thoseages 40–44 to be killed in motor vehicle crashes (Table2). Women exhibited a similar age pattern in the risk ofmotor vehicle mortality as men, except that the olderage group (65–74 years) was over three times as likelyto be killed in motor vehicle crashes (Table 2).
Age effects in motor vehicle mortality for male co-horts born after 1910 differed from the earlier cohorts.The risk of motor vehicle mortality peaked at ages20–24, then decreased continuously until age 69 (Table3). Men ages 20–24 were over twice as likely as those40–44 to be killed in a motor vehicle crash. The risk ofmotor vehicle mortality among women peaked earlierat ages 15–19, fell until ages 35–39, then increasedagain after age 40 (Table 3).
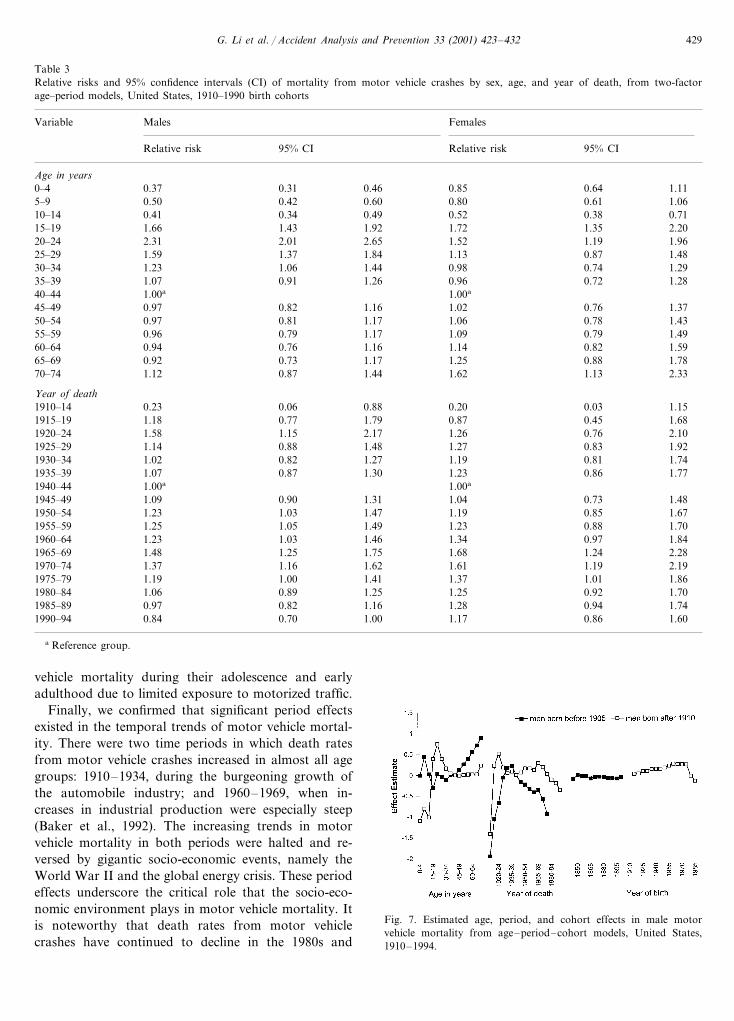
Age, period, and cohort patterns based on the three-factor models are displayed in Figs. 7 and 8. Becausethe first-order measures of the estimated effects fromthe three-factor models were invalid due to modelconstrictions, the analysis was limited to examining thechanges in the slopes of the estimated effects. Linearcontrasts revealed that decreases in the risk after 1935–1939 and 1965–1969 for both sexes, constituted periodeffects that were statistically significant (PB0.05). Co-hort patterns unveiled by the three-factor models (Figs.7 and 8) were consistent with the results from themedian polish analysis. There was no significant cohorteffect in motor vehicle mortality either within the1840–1905 cohorts or within the 1910–1990 birthcohorts.
4. Discussion
Understanding the secular trends of morbidity andmortality is an important component of epidemiologicresearch. Since it was first introduced in 1930, APCanalysis has evolved from a mere graphical inspectionto a sophisticated statistical method. The APC methodis especially appealing to public health researchers for itmakes it possible to partition the effects of three well-defined time variables; the results provide valuable in-formation for developing intervention strategies. Thisstudy reveals that age and period are two significantdeterminants of motor vehicle mortality.
Several secular patterns emerged from this analysis.First, we observed an historical crossover in motorvehicle mortality between the elderly and the youngadults. Characterized by a downward trend in deathrates for the elderly and an upward trend for the youngadults, the crossover occurred in the early 1950s in menand in the late 1970s in women. It marked an importantchange in age patterns in motor vehicle mortality, withthe highest risk groups switching from the elderly toyoung male adults age 20–24 and female adolescentsage 15–19. This change in age patterns in motor vehiclemortality is likely multifactoral, reflecting in part ad-vancements in medicine and improvements in emer-gency medical services systems. Of most significance isprobably the increase in exposure to driving amongadolescents and young adults. Total vehicle miles in theUnited States increased more than 650 times between1910 (3.6 billion miles) and 1995 (2.42 trillion miles)(FHA, 1999a). Although the age distribution of this
G. Li et al. / Accident Analysis and Pre6ention 33 (2001) 423–432428
increase in vehicle miles is unclear because of the lackof data, it is conceivable that a large proportion of thisincrease was attributable to young drivers. Nationalstatistics on personal transportation, which becameavailable in 1969, indicate that adolescents and youngadults have experienced a disproportionate increase inlicensure rates and average annual miles of travel in thepast three decades. For instance, for female adolescentsages 16–19 the average annual distance driven hasincreased by 106% from 3586 miles in 1969 to 7386miles in 1990, whereas during the same period theaverage annual mileage for all female drivers increasedby 76% (FHA, 1993, 1999b). Coincident with the in-crease in driving is the decrease in pedestrians as acomponent of motor vehicle mortality. Pedestrians con-stituted 37% of motor vehicle mortality in 1940 and13% in 1997 (Baker et al., 1992; NHTSA, 1998). Thedeath rates from pedestrian injuries decreased by 60%between 1940 and 1990 (Baker et al., 1992). The declinein motor vehicle mortality among the elderly in the1940s and 1950s was probably due in part to the
decrease in exposure to walking and improvement incase fatality rates.
Second, we found that the age patterns of motorvehicle mortality varied greatly with birth cohort. Spe-cifically, the increase in motor vehicle mortality inyoung adults is a phenomenon that did not exist untilthe 1910 birth cohort. Those who were born before1910 experienced an increasing risk of motor vehiclemortality as they aged. The risk for those born after1910, however, peaked at their early adulthood and didnot begin to rise again until age 70 years. The widelyaccepted bimodal distribution of motor vehicle mortal-ity with rises in young adults and in the elderly isprimarily cross-sectional, resulting from two distinctiveage patterns across birth cohorts. In other words, theelevated death rates in the elderly documented in cross-sectional studies (Li and Baker, 1991; Baker et al.,1992) can be interpreted in part as the residuum of thehigh rates experienced by the older birth cohorts in thelate years of their lives. Unlike recent generations, theseolder birth cohorts did not experience excess motor
Table 2Relative risks and 95% confidence intervals (CI) of mortality from motor vehicle crashes by sex, age, and year of death, from two-factorage–period models, United States, 1840–1905 birth cohorts
Variable FemalesMales
95% CIRelative risk 95% CI Relative risk
Age in years3.470.781.655–9 0.632.32 8.49
0.28 2.5110–14 1.07 0.65 1.77 0.840.39 1.7415–19 0.75 0.49 1.14 0.82
1.530.510.891.3920–24 0.801.050.47 1.2525–29 0.97 0.76 1.23 0.77
0.90 0.72 1.1230–34 0.78 0.50 1.211.330.600.891.2235–39 0.821.00
1.00a40–44 1.00a
45–49 0.871.14 1.750.95 1.37 1.241.30 1.09 1.5550–54 1.56 1.13 2.171.49 1.26 1.7755–59 1.90 1.39 2.601.75 1.49 2.0660–64 2.29 3.101.692.06 3.7365–69 2.062.772.411.762.46 2.11 2.8870–74 3.31 2.47 4.44
Year of death0.280.111910–14 0.170.14 0.180.11
0.42 0.46 0.33 0.650.351915–19 0.290.85 0.64 1.121920–24 0.610.52 0.44
1.911.161.491925–29 1.090.95 0.831.68 1.311930–34 1.19 1.05 1.36 2.141.58 1.231935–39 1.24 1.09 1.41 2.031.00a1940–44 1.00a
1.290.98 0.730.970.730.841945–490.79 0.68 0.921950–54 1.10 0.83 1.46
1.061955–59 0.830.60 1.420.790.700.550.661960–64 0.79 1.08 0.79 1.46
1965–69 0.70 0.57 0.84 1.20 0.87 1.640.700.57 1.460.45 0.72 1.011970–740.43 1.261975–79 0.42 0.29 0.59 0.74
a Reference group.
G. Li et al. / Accident Analysis and Pre6ention 33 (2001) 423–432 429
Table 3Relative risks and 95% confidence intervals (CI) of mortality from motor vehicle crashes by sex, age, and year of death, from two-factorage–period models, United States, 1910–1990 birth cohorts
Variable FemalesMales
95% CI Relative riskRelative risk 95% CI
Age in years0.31 0.46 0.850–4 0.640.37 1.110.42 0.60 0.800.50 0.615–9 1.06
0.4110–14 0.34 0.49 0.52 0.38 0.711.6615–19 1.43 1.92 1.72 1.35 2.20
2.01 2.65 1.522.31 1.1920–24 1.961.37 1.84 1.13 0.87 1.4825–29 1.591.06 1.44 0.981.23 0.7430–34 1.29
1.0735–39 0.91 1.26 0.96 0.72 1.281.00a40–44 1.00a
0.82 1.16 1.020.97 0.7645–49 1.370.81 1.17 1.06 0.7850–54 1.430.970.79 1.17 1.090.96 0.7955–59 1.49
0.9460–64 0.76 1.16 1.14 0.82 1.5965–69 0.730.92 1.17 1.25 0.88 1.78
0.87 1.44 1.62 1.131.12 2.3370–74
Year of death0.06 0.88 0.20 0.03 1.151910–14 0.230.77 1.79 0.871.18 0.451915–19 1.68
1.581920–24 1.15 2.17 1.26 0.76 2.100.88 1.48 1.271925–29 0.831.14 1.920.82 1.27 1.191.02 0.811930–34 1.74
1.071935–39 0.87 1.30 1.23 0.86 1.771.00a1940–44 1.00a
0.90 1.31 1.041.09 0.731945–49 1.481.231950–54 1.03 1.47 1.19 0.85 1.671.251955–59 1.05 1.49 1.23 0.88 1.70
1.03 1.46 1.341.23 0.971960–64 1.841965–69 1.48 1.25 1.75 1.68 1.24 2.28
1.16 1.62 1.611.37 1.191970–74 2.191.191975–79 1.00 1.41 1.37 1.01 1.861.061980–84 0.89 1.25 1.25 0.92 1.70
0.82 1.16 1.280.97 0.941985–89 1.740.70 1.001990–94 1.170.84 0.86 1.60
a Reference group.
vehicle mortality during their adolescence and earlyadulthood due to limited exposure to motorized traffic.
Finally, we confirmed that significant period effectsexisted in the temporal trends of motor vehicle mortal-ity. There were two time periods in which death ratesfrom motor vehicle crashes increased in almost all agegroups: 1910–1934, during the burgeoning growth ofthe automobile industry; and 1960–1969, when in-creases in industrial production were especially steep(Baker et al., 1992). The increasing trends in motorvehicle mortality in both periods were halted and re-versed by gigantic socio-economic events, namely theWorld War II and the global energy crisis. These periodeffects underscore the critical role that the socio-eco-nomic environment plays in motor vehicle mortality. Itis noteworthy that death rates from motor vehiclecrashes have continued to decline in the 1980s and
Fig. 7. Estimated age, period, and cohort effects in male motorvehicle mortality from age–period–cohort models, United States,1910–1994.

G. Li et al. / Accident Analysis and Pre6ention 33 (2001) 423–432430
Fig. 8. Estimated age, period, and cohort effects in female motorvehicle mortality from age–period–cohort models, United States,1910–1994.
could attenuate the validity of the results, particularlythe estimated cohort effects.
It is worth noting that our analyses were limited topopulation-based death rates and that the mortalitydata included all victims of motor vehicle crashes.Thus, the complex secular trends reported in this studydo not necessarily reflect the age, period, and cohortpatterns of crash risk. In fact, mileage-based fatal crashrates have decreased continuously from 1910 (44 per100 million vehicle-miles of travel) to 1995 (1.7 per 100million vehicle-miles of travel) (FHA, 1999a).Combining different types of victims for an extensiveperiod in the analysis might also have compoundedcohort patterns. Based on an analysis of motor vehiclemortality for the years 1975–1990, Evans (1993) foundthat death rates for younger generations of male driversat a given age were consistently lower than for oldergenerations.
Age, period, and cohort are not risk factors bythemselves. Rather, they are the surrogates of a varietyof intrinsic and extrinsic factors. The complex age,period, and cohort patterns reported in this study arethe results of the intricate interactions of socioeco-nomic, behavioral and environmental factors. Despitethe limitations inherent in the APC method, results ofthis study provide valuable information for better un-derstanding the historical trends and the dynamics ofmotor vehicle mortality. Of special note is the excessmortality experienced by women at ages 15–19 yearsand by men at ages 20–24 years among cohorts bornafter 1910. Unless more effective interventions aimed atthese high-risk groups are developed and implemented,this disturbing age pattern is likely to continue.
Acknowledgements
This research was supported in part by GrantsR01AA09963 and R01AG13642 from the National In-stitutes of Health and by Grant R49/CCR302486 fromthe Centers for Disease Control and Prevention.
References
Andvord, K.F., 1930. What can we learn by studying tuberculosis bygenerations? Norsk Magazin for Laegevidenskaben 91, 642–660.
Baker, S.P., O’Neill, B., Ginsburg, J.M., Li, G., 1992. The InjuryFact Book, 2nd edn. Oxford University Press, New York.
Bureau of the Census, 1910–1938. Mortality Statistics. Bureau of theCensus, Washington, DC.
Burt, C.W., 1995. Injury-related Visits to Hospital Emergency De-partments: United States, 1992. Advance Data from Vital andHealth Statistics, No. 261. National Center for Health Statistics,Hyattsville, MD.
Centers for Disease Control (CDC) and Prevention, 1994. Deathsresulting from firearm- and motor-vehicle-related injuries —United States, 1968–1991. Journal of American Medical Associa-tion 271, 495–496.
1990s. Although the decreases in motor vehicle mortal-ity during World War II, when fuel was diverted fromprivate cars to military aircraft, and the global energycrisis in the 1970s, were mainly due to substantialdecreases in fuel availability and exposure to driving(Martinez-Schnell and Zaidi, 1989; Partyka, 1991;Seltzer, 1995) and the adoption of 55 mph speed limit(Mela, 1977), the continuing downward trend in recentyears is primarily a result of public health efforts, suchas improved design of cars (Robertson, 1998), increasedsafety belt usage (Chorba et al., 1988; CDC, 1994;Seltzer, 1995; Robertson, 1998), and intensified legisla-tion and enforcement of safety laws (Lund and Wolfe,1991; Partyka, 1991; Stinson and DeBakey, 1992; Hing-son, 1993; CDC, 1994).
There are two limitations inherent in the APCmethod: the non-identifiability problem and the mis-classification problem. Although age, period, and co-hort effects each have their distinctive epidemiologicdefinitions (Susser, 1982), statistically they are notuniquely identifiable because of the linear dependenceamong them. This identification issue causes difficultiesin both statistical modeling and epidemiologic interpre-tation. In this study, we tried to avoid the risk of solelyrelying on statistical modeling by incorporating theclassic graphical presentation and median polish in thedata analysis. Results indicate that the age, period, andcohort patterns unveiled through different methods areconsistent.
The misclassification problem arises from the factthat the birth cohorts are defined as intervals accordingto five-year age and five-year period categories andtherefore may overlap to some extent (Holford, 1983).For instance, people aged 45–49 who died during theperiod 1945–49 were born sometime between 1895 and1905, which overlaps with the 1890–1899 cohort (thoseaged 50–54 who died during 1945–49) and the 1900–1909 cohort (those aged 40–44 who died during 1945–49). The overlapping between neighboring cohorts
G. Li et al. / Accident Analysis and Pre6ention 33 (2001) 423–432 431
Chorba, T.L., Reinfurt, D., Hulka, B.S., 1988. Efficacy of mandatoryseat-belt use legislation. The North Carolina experience from 1983through 1987. Journal of American Medical Association 260,3593–3597.
Clayton, D., Schifflers, E., 1987. Models for temporal variation incancer rates. II: age–period–cohort models. Statistics in Medicine6, 469–481.
Dunn, H.L., Shackley, W., 1944. Comparison of cause-of deathassignments by the 1929 and 1938 revisions of the InternationalList: Deaths in the United States, 1940. Vital Statistics-SpecialReports, vol. 19, no. 14. US Government Printing Office, Wash-ington, DC.
Evans, L., 1993. How safe were today’s older drivers when they wereyounger? American Journal of Epidemiology 137, 769–775.
Faust, M.M., Dolman, A.B., 1963. Comparability ratios based onmortality statistics for the fifth and sixth revisions: United States,1950. Vital Statistics-Special Reports, vol. 51, no. 3. US Govern-ment Printing Office, Washington, DC.
Faust, M.M., Dolman, A.B., 1965. Comparability of mortality statis-tics for the sixth and seventh revisions: United States, 1958. VitalStatistics-Special Reports, vol. 51, no. 4. US Government PrintingOffice, Washington, DC.
Federal Highway Administration (FHA), 1993. 1990 NationwidePersonal Transportation Survey data book, vol I. DOT Publica-tion no. FHWA-PL-94-010A. Federal Highway Administration,Washington, DC.
Federal Highway Administration (FHA), 1999a. Motor VehicleTraffic Fatalities, 1900–1995. Available at: http://www.fhwa.dot.gov/ohim/summary95/fi200.pdf. Accessed Febru-ary 28, 1999.
Federal Highway Administration (FHA), 1999b. 1969 NationwidePersonal Transportation Study. Available at: http://www.fhwa.dot.gov/ohim/1969/s.pdf. Accessed February 24, 1999.
Gilliland, F.D., Owen, C., Gilliland, S.S., Carter, J.S., 1997. Tempo-ral trends in diabetes mortality among American Indians andHispanics in New Mexico: birth cohort and period effects. Amer-ican Journal of Epidemiology 145, 422–431.
Greenburg, B.G., Wright, J.J., Sheps, C.G., 1950. A technique foranalyzing some factors affecting the incidence of syphilis. Journalof American Statistical Association 9, 373–399.
Hingson, R., 1993. Prevention of alcohol-impaired driving. AlcoholHealth Research World 17, 28–34.
Holford, T.R., 1983. The estimation of age, period and cohort effectsfor vital rates. Biometrics 39, 311–324.
Klebba, A.J., Dolman, A.B., 1975. Comparability of mortality statis-tics for the seventh and eighth revisions of the internationalclassification of diseases, United States. Vital and Health Statis-tics, Ser. 2, no. 66. US Government Printing Office, Washington,DC.
Kupper, L.L., Janis, J.M., Karmous, A., Greenburg, B.G., 1985.Statistical age–period–cohort analysis: a review and critique.Journal of Chronic Disease 38, 811–830.
Last, J.M., 1995. A Dictionary of Epidemiology, 3rd edn. OxfordUniversity Press, New York.
Lee, W.C., Lin, R.S., 1995. Analysis of cancer rates using excess riskage–period–cohort models. International Journal of Epidemiol-ogy 24, 671–677.
Li, G., Baker, S.P., 1991. A comparison of injury death rates inChina and the United States, 1986. American Journal of PublicHealth 81, 605–609.
Lin, R.S., Lee, W.C., 1993. Trends in mortality from diabetes mellitusin Taiwan, 1960–1988. Diabetologia 35, 973–979.
Lund, A.K., Wolfe, A.C., 1991. Changes in the incidence of alcohol-impaired driving in the United States, 1973–1986. Journal ofStudies of Alcohol 52, 293–301.
Martinez-Schnell, B., Zaidi, A., 1989. Time series analysis of injuries.Statistics in Medicine 8, 1497–1508.
Mela, D.F., 1977. Review of information on the safety effects of the55 mph speed limit in the US Technical Report DOT HS-802-383.National Highway Traffic Safety Administration, Washington,DC.
National Center for Health Statistics (NCHS), 1939–1992. Vitalstatistics of the United States. DHHS publication PHS 96-1100.National Center for Health Statistics, Rockville, MD.
National Center for Health Statistics (NCHS), 1980. Annual sum-mary for the United States, 1979. Monthly vital statistics report,vol. 28, no. 13. Public Health Service, Hyattsville, MD.
National Center for Health Statistics (NCHS), 1998. Deaths for 72selected causes by 5-year age groups, 1993–1994. Available at:http://www.cdc.gov/nchswww/data. Accessed August 3, 1998.
National Highway Traffic Safety Administration (NHTSA), 1994.Traffic Safety Facts, 1993. DOT Publication no. DOT-HS-808-169. National Highway Traffic Safety Administration, Washing-ton, DC.
National Highway Traffic Safety Administration (NHTSA), 1998.Traffic Safety Facts, 1997. DOT Publication no. DOT-HS-808-770. National Highway Traffic Safety Administration, Washing-ton, DC.
Nystrom, L., Dahlquist, G., Rewers, M., Wall, S., 1990. The Swedishchildhood diabetes study. An analysis of the temporal variation indiabetes incidence 1978–1987. International Journal of Epidemi-ology 19, 141–146.
Partyka, S.C., 1991. Simple models of fatality trends revisited sevenyears later. Accident Analysis and Prevention 23, 423–430.
Rewers, M., Stone, R.A., LaPorte, R.E., et al., 1989. Poisson regres-sion modeling of temporal variation in incidence of childhoodinsulin-dependent diabetes mellitus in Allegheny County, Pennsly-vania, and Wielkopolska, Poland, 1970–1985. American Journalof Epidemiology 129, 569–581.
Robertson, L.S., 1998. Injury Epidemiology, 2nd edn. Oxford Uni-versity Press, New York.
SAS Institute, 1997. SAS Software [computer program], version 6.12.SAS Institute Inc., Cary, NC.
Seltzer, F., 1995. Trend in mortality from violent deaths: uninten-tional injuries, United States, 1960–1991. Statistical Bulletin ofthe Metropolitan Insurance Company 76, 19–28.
Seow, A., Duffy, S.W., McGee, M.A., Lee, J., Lee, H.P., 1996. Breastcancer in Singapore: trends in incidence 1968–1992. InternationalJournal of Epidemiology 25, 40–45.
Shahpar, C., Li, G., 1999. Homicide mortality in the United States,1935–1994: age, period, and cohort effects. American Journal ofEpidemiology 150, 1213–1222.
Stevens, R.G., Moolgavkar, S.H., 1984. A cohort analysis of lungcancer and smoking in British males. American Journal of Epi-demiology 119, 624–641.
Stinson, F.S., DeBakey, S.F., 1992. Alcohol-related mortality in theUnited States, 1979–1988. British Journal of Addiction 87, 777–783.
Susser, M., 1982. Period effects, generation effects and age effects inpeptic ulcer mortality. Journal of Chronic Disease 35, 29–40.
Sverre, J.M., 1993. Secular trends in coronary heart disease mortalityin Norway, 1966–1986. American Journal of Epidemiology 137,301–310.
Tango, T., Kurashina, S., 1987. Age, period and cohort analysis oftrends in mortality from major diseases in Japan, 1955–1979:peculiarity of the cohort born in the early Showa Era. Statistics inMedicine 6, 709–726.
Tarone, R.E., Chu, K.C., 1996. Evaluation of birth cohort patterns inpopulation disease rates. American Journal of Epidemiology 143,85–91.
Tarone, R.E., Chu, K.C., Gaudette, L.A., 1997. Birth cohort andcalendar period trends in breast cancer mortality in the UnitedStates and Canada. Journal of National Cancer Institute 89,251–256.

G. Li et al. / Accident Analysis and Pre6ention 33 (2001) 423–432432
Tsauo, J.Y., Lee, W.C., Wang, J.D., 1996. Age–period–cohort anal-ysis of motor vehicle mortality in Taiwan, 1974–1992. AccidentAnalysis and Prevention 28, 619–626.
World Health Organization (WHO), 1992. International StatisticalClassification of Diseases and Related Health Problems, vol. 2,
10th revision. World Health Organization, Geneva.Zheng, T., Holford, T.R., Chen, Y., et al., 1996. Time trend and
age–period–cohort effect on incidence of bladder cancer in Con-necticut, 1935–1992. International Journal of Cancer 68, 172–176.
.
Related Documents