AUGUST 2015 This publication was produced for review by the United States Agency for International Development. It was prepared by Elizabeth Freudenberger, Management Systems International for the E3 Analytics and Evaluation Project. Sectoral Synthesis of 2013–2014 Evaluation Findings BUREAU FOR ECONOMIC GROWTH, EDUCATION, & ENVIRONMENT

Welcome message from author
This document is posted to help you gain knowledge. Please leave a comment to let me know what you think about it! Share it to your friends and learn new things together.
Transcript

1 USAID TARABOT ANNUAL REPORT
AUGUST 2015This publication was produced for review by the United States Agency for International Development. It was prepared by Elizabeth Freudenberger, Management Systems International for the E3 Analytics and Evaluation Project.
Sectoral Synthesis of 2013–2014 Evaluation FindingsBUREAU FOR ECONOMIC GROWTH, EDUCATION, & ENVIRONMENT

SECTORAL SYNTHESIS OF 2013 – 2014 EVALUATION FINDINGS BUREAU FOR ECONOMIC GROWTH, EDUCATION & ENVIRONMENT
Management Systems International Corporate Offices 200 12th Street, South Arlington, VA 22202 USA
Tel: + 1 703 979 7100
Contracted under AID-OAA-M-13-00017 E3 Analytics and Evaluation Project
DISCLAIMER The author’s views expressed in this publication do not necessarily reflect the views of the United States Agency for International Development or the United States Government.

SECTORAL SYNTHESIS OF 2013 -2014 EVALUATION FINDINGS: E3 BUREAU i
ACKNOWLEDGEMENTS
This study has been a large collaborative effort to which many individuals have contributed their time. We would like to thank Bhavani Pathak for her leadership as the Contracting Officer’s Representative of the E3 Analytics and Evaluation Project, as well as our key counterpart for this study. We would also like to thank the following E3 staff for their time and detailed review of the E3 evaluations:
C. Stuart Callison, Christine Beggs, Aaron Miles, Lita Echiverri, Patrick Collins, Jessica Torres, Rebecca Nicodemus, Autumn Gorman, Kate Faulhaber, Stephen Brooks, Beverly McIntyre, Jesse Shapiro, Geeta Uhl, Scott Lampman, Liz Jordan, Megan Hill, Mary Rowen, Pam Baldinger, Seema Johnson, Jeff Goldberg, Katherine Sill, Dorian Mead, Katherine Swanson, Heidi Schuttenberg, Kathy Rostkowski, Scott Haller, Kristen Madler, Diane Russell, Fred Guymont, Oliver Subasinghe, Andrew Tobiason, Patricia Mantey, Barbara Best, Rebecca Butterfield, Hannah Fairbank, Richard Volk, Mercedes Stickler, Anthony Kolb, Monica Bansal, Simone Lawaetz, Natalie Bailey, Yuliya Neyman, Nathan Gregory, Olaf Zerbock
The E3 Analytics and Evaluation Project would also like to thank all of the Project team members from MSI and dTS who contributed to this study. The coding and analysis team included Adam Peterson, Betsy Bury, Greg Norfleet, Gregor Young, Gwynne Zodrow, Ingrid Orvedal, Irene Velez, Isaac Morrison, Lala Kasimova, Masha Keller, Meredith Waters, Sam Hargadine, and Thomaz Alvares. The study was overseen by Elizabeth Freudenberger and Molly Hageboeck of MSI. In addition, the study was supported by the MSI project management team of Jeremy Gans, Sam Hargadine, and Meredith Waters.

SECTORAL SYNTHESIS OF 2013 -2014 EVALUATION FINDINGS: E3 BUREAU ii
SECTORAL SYNTHESIS OF 2013 -2014 EVALUATION FINDINGS: E3 BUREAU iii
CONTENTS
Acknowledgements ......................................................................................................................... i
Contents ......................................................................................................................................... iii
Table of Figures ............................................................................................................................ iv
Acronyms and Abbreviations ...................................................................................................... vi
Executive Summary ..................................................................................................................... vii
Introduction .................................................................................................................................... 1
Overview of 2013 – 2014 E3 Evaluations ..................................................................................... 3
Key Themes Across the E3 Bureau .............................................................................................. 5
Improvement in the Quality of E3 Evaluations ......................................................................... 16
Conclusion .................................................................................................................................... 20
Economic Policy Evaluations ...................................................................................................... 21
Trade and Regulatory Reform Evaluations .............................................................................. 31
Private Capital Management Evaluations ................................................................................. 39
Development Credit Evaluations ................................................................................................ 47
Education Evaluations ................................................................................................................. 51
Forestry and Biodiversity Evaluations ....................................................................................... 65
Water Evaluations ....................................................................................................................... 77
Energy and Infrastructure Evaluations ..................................................................................... 87
Global Climate Change Evaluations .......................................................................................... 95
Land Tenure and Resource Management Evaluations .......................................................... 103
Annex A: Statement of Work .................................................................................................... 110
Annex B: Evaluation Reference List ........................................................................................ 114
Annex C: Sectoral Synthesis Methodology .............................................................................. 142
Annex D: Content Analysis Questionnaire .............................................................................. 145
Annex E: Evaluation Report Quality Review Checklists and Rater’s Guides ..................... 158
SECTORAL SYNTHESIS OF 2013 -2014 EVALUATION FINDINGS: E3 BUREAU iv
Annex F: Gender Integration Analysis Questionnaire ........................................................... 179
TABLE OF FIGURES
Figure 1: Density of Evaluations by Location ................................................................................. 1 Figure 2: Distribution of 2013-2014 E3 Sectoral Synthesis Evaluations by Sector ........................ 3 Figure 3: Evaluation Timing ............................................................................................................ 3 Figure 4: Distribution of E3 Sectoral Synthesis Evaluations by Region ......................................... 4 Figure 5: Distribution of E3 Sectoral Synthesis Evaluations by Group and Region ....................... 4 Figure 6: Overall Achievement of Performance Targets (n = 76) ................................................... 5 Figure 7: Percent of E3 Evaluations that Addressed Project Outcomes and Attribution
(n = 117) ............................................................................................................ 6 Figure 8: Percent of Evaluations that Addressed Innovative Practices (n = 117) ............................ 7 Figure 9: Trend in Percent of E3 Evaluations that Disaggregated Findings by Sex at All
Levels, 2009 - 2014 ..................................................................................................... 9 Figure 10: Trend in Percent of E3 Evaluations that Addressed Differential Access or
Benefits by Gender, 2009 - 2014 ................................................................................ 10 Figure 11: Percent of E3 Evaluations that Addressed Private Sector Engagement (n =
117) .......................................................................................................... 11 Figure 12: Percent of E3 Evaluations that Addressed Governance Issues (n = 117) ..................... 12 Figure 13: Percent of Evaluations that Addressed Areas for Improvement and Learning
(n = 117) .......................................................................................................... 13 Figure 14: Percent of E3 Evaluations that Addressed Lessons Learned ........................................ 14 Figure 15: Trends in Quality of E3 Evaluation Report Scores, 2009 - 2014 ................................. 16 Figure 16: Distribution of Quality of E3 Evaluation Report Scores, 2013-2014 ........................... 17 Figure 17: Trend in Evaluation Report Quality Factor Performance Levels, 2009 - 2014 ............ 17 Figure 18: Evaluation Report Quality Factors for E3 Evaluations Clustered by
Performance Category Change Between 2012 and 2014 ........................................... 18 Figure 19: Number of Economic Policy Evaluations by Region ................................................... 21 Figure 20: Quality of Evaluation Report Score, Economic Policy ................................................ 21 Figure 21: Percent of Economic Policy Evaluations that Addressed Each Topic Area ................. 22 Figure 22: Overall Achievement of Performance Targets (n = 14 evaluations) ............................ 23 Figure 23: Number of Trade and Regulatory Reform Evaluations by Region .............................. 31 Figure 24: Quality of Evaluation Report Score, Trade and Regulatory Reform ............................ 31 Figure 25: Percent of Trade and Regulatory Reform Evaluations that Addressed Each
Topic Area .......................................................................................................... 32 Figure 26: Overall Achievement of Performance Targets (n = 9 evaluations) .............................. 33 Figure 27: Number of Private Capital Management Evaluations by Region ................................. 39 Figure 28: Quality of Evaluation Report Score, Private Capital Management .............................. 39 Figure 29: Percent of Private Capital Management Evaluations that Addressed Each
Topic Area .......................................................................................................... 40 Figure 30: Overall Achievement of Performance Targets (n = 3 evaluations) .............................. 41 Figure 31: Quality of Evaluation Report Score, Development Credit ........................................... 47 Figure 32: Number of Education Evaluations by Region .............................................................. 51 Figure 33: Quality of Evaluation Report Score, Education ........................................................... 51 Figure 34: Percent of Education Evaluations that Addressed Each Topic Area ............................ 52 Figure 35: Overall Achievement of Performance Targets (n = 42 evaluations) ............................ 53 Figure 36: Number of Forestry and Biodiversity Evaluations by Region ..................................... 65 Figure 37: Quality of Evaluation Report Score, Forestry and Biodiversity ................................... 65

SECTORAL SYNTHESIS OF 2013 -2014 EVALUATION FINDINGS: E3 BUREAU v
Figure 38: Percent of Forestry and Biodiversity Evaluations that Addressed Each Topic Area .......................................................................................................... 66
Figure 39: Overall Achievement of Performance Targets (n = 17 evaluations) ............................ 67 Figure 40: Number of Water Evaluations by Region .................................................................... 77 Figure 41: Quality of Evaluation Report Score, Water .................................................................. 77 Figure 42: Percent of Water Evaluations that Addressed Each Topic Area .................................. 78 Figure 43: Overall Achievement of Performance Targets (n = 13 evaluations) ............................ 79 Figure 44: Number of Energy and Infrastructure Evaluations by Region ..................................... 87 Figure 45: Quality of Evaluation Report Score, Energy and Infrastructure .................................. 87 Figure 46: Percent of Energy and Infrastructure Evaluations that Addressed Each Topic
Area .......................................................................................................... 88 Figure 47: Overall Achievement of Performance Targets (n = 8 evaluations) .............................. 89 Figure 48: Number of Global Climate Change Evaluations by Region ......................................... 95 Figure 49: Quality of Evaluation Report Score, Global Climate Change ...................................... 95 Figure 50: Percent of Global Climate Change Evaluations that Addressed Each Topic
Area .......................................................................................................... 96 Figure 51: Overall Achievement of Performance Targets (n = 6 evaluations) .............................. 97 Figure 52: Number of Land Tenure and Resource Management Evaluations by Region ........... 103 Figure 53: Quality of Evaluation Report Score, Land Tenure and Resource Management ......... 103 Figure 54: Percent of Land Tenure and Resource Management Evaluations that
Addressed Each Topic Area ..................................................................................... 104 Figure 55: Overall Achievement of Performance Targets (n = 6 evaluations) ............................ 105

SECTORAL SYNTHESIS OF 2013 -2014 EVALUATION FINDINGS: E3 BUREAU vi
ACRONYMS AND ABBREVIATIONS
ADS Automated Directives System
AfPak Afghanistan and Pakistan
DEC Development Experience Clearinghouse
dTS Development & Training Services
E3 Bureau for Economic Growth, Education and Environment (USAID)
E&E Europe and Eurasia
ICT Information and communications technology
LAC Latin America and the Caribbean
ME Middle East
M&E Monitoring and evaluation
MSI Management Systems International
PPP Public-private partnerships
PPR Performance Plan and Reports
SOW Statement of Work
USAID United States Agency for International Development
WASH Water, Sanitation, and Hygiene

SECTORAL SYNTHESIS OF 2013 -2014 EVALUATION FINDINGS: E3 BUREAU vii
EXECUTIVE SUMMARY
The E3 Sectoral Synthesis of 2013-2014 Evaluation Findings is an in-depth review of 117 evaluations published between January 2013 and September 2014 of projects related to E3 technical sectors. This study builds upon the success of the E3 Sectoral Synthesis of 2012 Evaluation Findings by reviewing evaluations against more detailed criteria related to technical and sectoral lessons learned, as well as adding a structured review of the quality of the evaluation reports. In addition to providing E3 staff and Missions with an overview of what has been learned overall and for specific sectors in which USAID works, the results of this study are intended to inform USAID strategy and project development.
This study examined project results, key lessons learned, areas for improvement, and innovative practices as presented in the evaluation reports. Evaluations were also reviewed for cross-cutting topics such as gender equality and women’s empowerment, private sector engagement, and governance. This report presents the overarching, as well as sector-specific, findings from each of these areas. Key findings include:
Of the 65 percent of reports that included enough information to assess achievement of performance targets, more than half met their performance targets overall, with roughly a third of evaluations conveying that the project had exceeded its targets. However, 34 percent of the evaluations did not provide enough information to assess overall achievement towards performance targets.
Eighty-four of the 117 evaluation reports noted that the project achieved some sort of outcome, with 53 of those outcomes described by the evaluation report as being at least partially attributable to the project. Major project outcomes related to capacity development, improved collaboration, project sustainability, and policy reform.
Forty-four percent of evaluations identified some sort of innovative practice, with the primary types of innovation identified including inter-organizational relationship innovations, process innovations, and product or service innovations.
Evaluations are doing a better job of addressing gender differentials and providing sex-disaggregated data. The number of evaluations addressing gender differentials in project access, participation, or benefits rose from a low of 15 percent in 2011 to 67 percent in 2014. Similarly, the number of evaluations providing sex-disaggregated data on evaluation findings at all levels increased from 7 percent in 2010 to 53 percent in 2014.
Sixty-four percent of evaluations showed evidence that the projects had, to at least some degree, addressed the integration of gender equality and/or women’s empowerment in either project design or implementation. Sixty-five percent of evaluations included some level of analysis of the gender equality and/or female empowerment aspects of project outputs and outcomes.
Sixty-three percent of evaluations addressed private sector engagement, such as public-private partnerships, generating employment, local market development, and improving supply chains.
Sixty-six percent of evaluations addressed governance issues. Themes included collaborating with host country institutions, policy reform, public-private collaboration, and strengthening civil society.

SECTORAL SYNTHESIS OF 2013 -2014 EVALUATION FINDINGS: E3 BUREAU viii
Areas for learning and improvement included setting realistic expectations related to local capacity and performance targets, achieving stakeholder buy-in, planning for sustainability, and project timing.
Additional lessons learned across sectors focused on defining an appropriate project scope, the benefits cross-sector integrated design, ensuring flexibility in programming, planning for and understanding current capacity, fostering community engagement and ownership, and the need for useful performance management.
This study found that the quality of evaluation reports related to E3 sectors has been continuously improving since the release of the USAID Evaluation Policy in 2011. The study employed the checklist and 10-point scoring system used in USAID’s 2009-2012 Agency-wide Meta Evaluation1 to allow for comparisons to be drawn between this study’s set of E3 evaluations and the ratings that E3 sector evaluations earned in the earlier Meta-Evaluation. The quality score of E3 evaluation reports rose from 4.69 in 2010 to 8.02 in 2014, demonstrating a serious effort across E3 sectors to strengthen the performance of the evaluations that they undertake.
In summary, the E3 Sectoral Synthesis of 2013 – 2014 Evaluation Findings has demonstrated that Bureau attention to evaluation quality on an ongoing basis pays off. As the study shows, the quality of E3 evaluation reports visibly improved both overall and on multiple specific evaluation report dimensions, and the study’s aggregate qualitative findings provide important lessons for future programming. These findings should encourage a continuing focus on evaluation quality and periodic monitoring using the types of analytic tools on which this study relied, not only in E3 but across all Bureaus and in overseas Missions as well.
1 “Meta-Evaluation of Quality and Coverage of USAID Evaluations 2009 – 2012.” http://pdf.usaid.gov/pdf_docs/PDACX771.pdf

SECTORAL SYNTHESIS OF 2013 -2014 EVALUATION FINDINGS: E3 BUREAU 1
INTRODUCTION
Background and Scope
In 2013, USAID’s Bureau for Economic Growth, Education and Environment (E3) broke new ground with the development of a Sectoral Synthesis Report on 2012 Evaluation Findings. This report examined technical findings from 60 evaluation reports published in 2012 that focused on projects related to E3 sectors. The report also presented what the Bureau learned during the review about the quality of its evaluations and how they might be improved. The report was shared with USAID Missions around the world and was received with appreciation by Bureau management.
In November 2014, E3 requested support from the E3 Analytics and Evaluation Project to update and expand upon the E3 Sectoral Synthesis methodology to produce the second Sectoral Synthesis of Evaluation Findings. This report presents the overall findings of this study, covering evaluations published between January 1, 2013 and September 30, 2014. This study includes 117 evaluations from all USAID operational regions. Demonstrating a commitment to learning from evaluations and improving processes, the expanded scope of this study reviewed evaluations against more detailed criteria related to technical and sectoral lessons learned, as well as reviewed for the quality of the evaluation report. USAID’s Statement of Work (SOW) for this study is included in Annex A.
Figure 1: Density of Evaluations by Location
SECTORAL SYNTHESIS OF 2013 -2014 EVALUATION FINDINGS: E3 BUREAU 2
Purpose and Audience
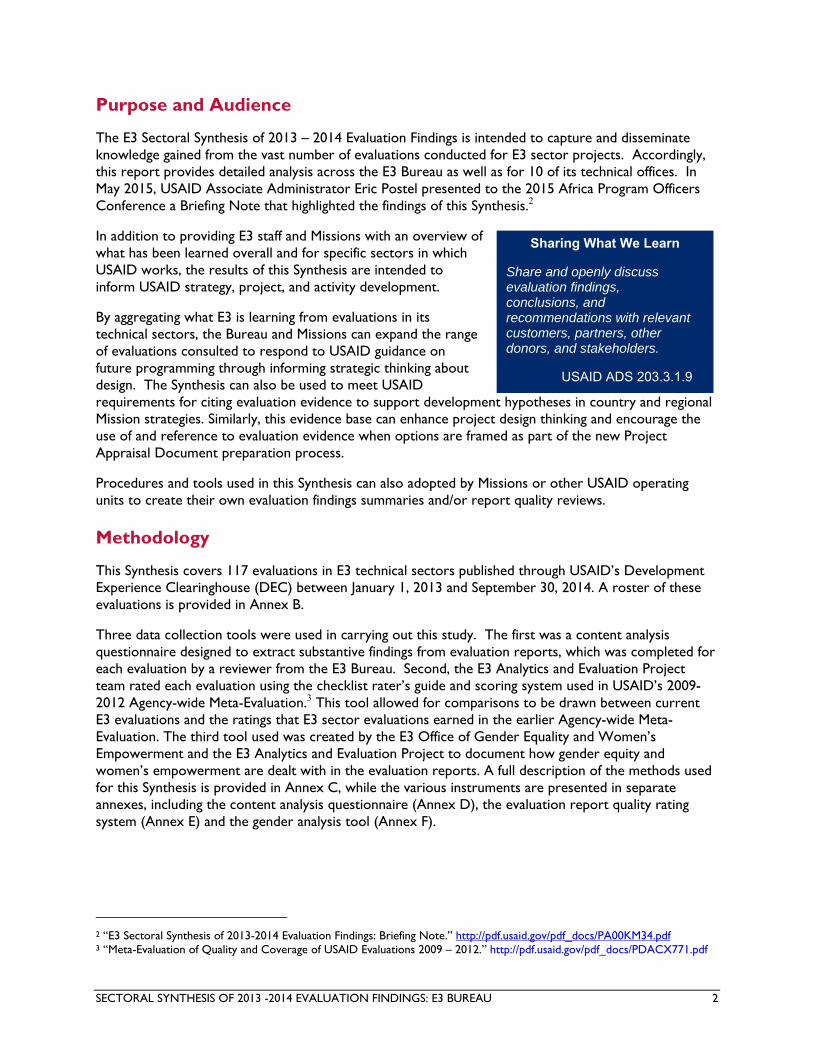
The E3 Sectoral Synthesis of 2013 – 2014 Evaluation Findings is intended to capture and disseminate knowledge gained from the vast number of evaluations conducted for E3 sector projects. Accordingly, this report provides detailed analysis across the E3 Bureau as well as for 10 of its technical offices. In May 2015, USAID Associate Administrator Eric Postel presented to the 2015 Africa Program Officers Conference a Briefing Note that highlighted the findings of this Synthesis.2
In addition to providing E3 staff and Missions with an overview of what has been learned overall and for specific sectors in which USAID works, the results of this Synthesis are intended to inform USAID strategy, project, and activity development.
By aggregating what E3 is learning from evaluations in its technical sectors, the Bureau and Missions can expand the range of evaluations consulted to respond to USAID guidance on future programming through informing strategic thinking about design. The Synthesis can also be used to meet USAID requirements for citing evaluation evidence to support development hypotheses in country and regional Mission strategies. Similarly, this evidence base can enhance project design thinking and encourage the use of and reference to evaluation evidence when options are framed as part of the new Project Appraisal Document preparation process.
Procedures and tools used in this Synthesis can also adopted by Missions or other USAID operating units to create their own evaluation findings summaries and/or report quality reviews.
Methodology
This Synthesis covers 117 evaluations in E3 technical sectors published through USAID’s Development Experience Clearinghouse (DEC) between January 1, 2013 and September 30, 2014. A roster of these evaluations is provided in Annex B.
Three data collection tools were used in carrying out this study. The first was a content analysis questionnaire designed to extract substantive findings from evaluation reports, which was completed for each evaluation by a reviewer from the E3 Bureau. Second, the E3 Analytics and Evaluation Project team rated each evaluation using the checklist rater’s guide and scoring system used in USAID’s 2009-2012 Agency-wide Meta-Evaluation.3 This tool allowed for comparisons to be drawn between current E3 evaluations and the ratings that E3 sector evaluations earned in the earlier Agency-wide Meta-Evaluation. The third tool used was created by the E3 Office of Gender Equality and Women’s Empowerment and the E3 Analytics and Evaluation Project to document how gender equity and women’s empowerment are dealt with in the evaluation reports. A full description of the methods used for this Synthesis is provided in Annex C, while the various instruments are presented in separate annexes, including the content analysis questionnaire (Annex D), the evaluation report quality rating system (Annex E) and the gender analysis tool (Annex F).
2 “E3 Sectoral Synthesis of 2013-2014 Evaluation Findings: Briefing Note.” http://pdf.usaid.gov/pdf_docs/PA00KM34.pdf 3 “Meta-Evaluation of Quality and Coverage of USAID Evaluations 2009 – 2012.” http://pdf.usaid.gov/pdf_docs/PDACX771.pdf
Sharing What We Learn
Share and openly discuss evaluation findings, conclusions, and recommendations with relevant customers, partners, other donors, and stakeholders.
USAID ADS 203.3.1.9
SECTORAL SYNTHESIS OF 2013 -2014 EVALUATION FINDINGS: E3 BUREAU 3
OVERVIEW OF 2013 – 2014 E3 EVALUATIONS
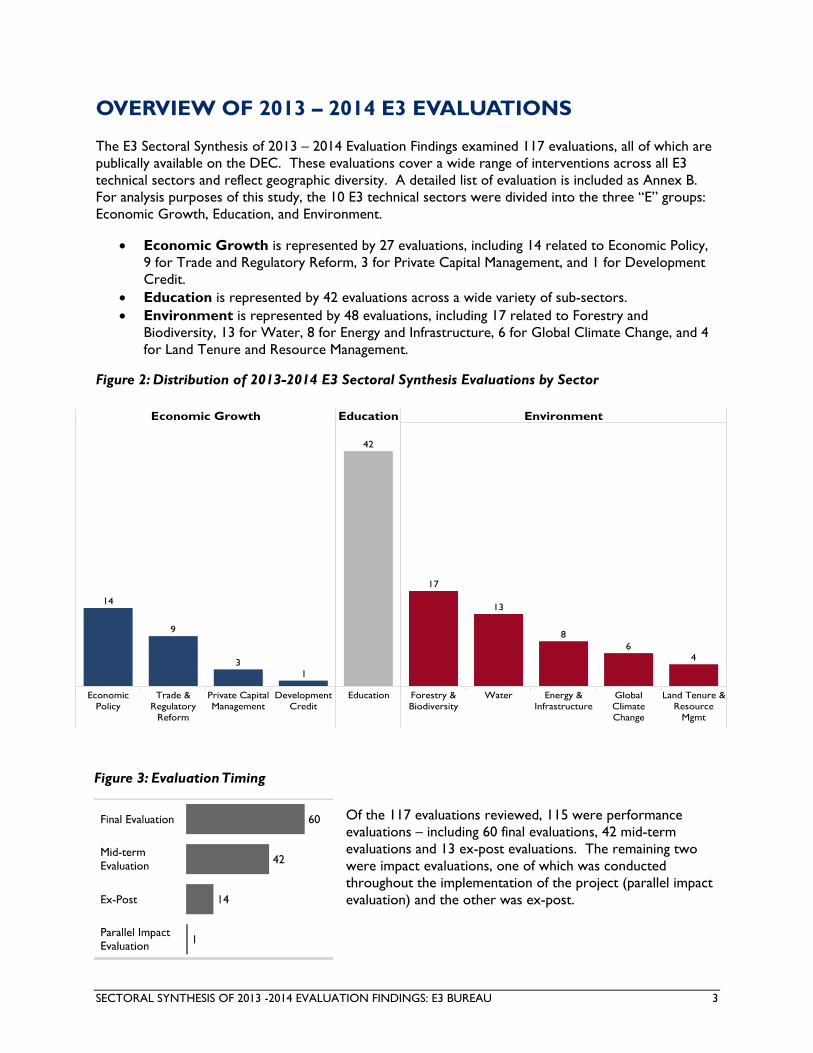
The E3 Sectoral Synthesis of 2013 – 2014 Evaluation Findings examined 117 evaluations, all of which are publically available on the DEC. These evaluations cover a wide range of interventions across all E3 technical sectors and reflect geographic diversity. A detailed list of evaluation is included as Annex B. For analysis purposes of this study, the 10 E3 technical sectors were divided into the three “E” groups: Economic Growth, Education, and Environment.
Economic Growth is represented by 27 evaluations, including 14 related to Economic Policy, 9 for Trade and Regulatory Reform, 3 for Private Capital Management, and 1 for Development Credit.
Education is represented by 42 evaluations across a wide variety of sub-sectors. Environment is represented by 48 evaluations, including 17 related to Forestry and
Biodiversity, 13 for Water, 8 for Energy and Infrastructure, 6 for Global Climate Change, and 4 for Land Tenure and Resource Management.
Figure 2: Distribution of 2013-2014 E3 Sectoral Synthesis Evaluations by Sector
Of the 117 evaluations reviewed, 115 were performance evaluations – including 60 final evaluations, 42 mid-term evaluations and 13 ex-post evaluations. The remaining two were impact evaluations, one of which was conducted throughout the implementation of the project (parallel impact evaluation) and the other was ex-post.
Figure 3: Evaluation Timing

SECTORAL SYNTHESIS OF 2013 -2014 EVALUATION FINDINGS: E3 BUREAU 4
Evaluations were categorized into the six USAID operational regions. Across E3, evaluations were most frequently conducted in Africa (40), followed by Asia (27), Latin America and the Caribbean (17), Europe and Eurasia (16), Afghanistan and Pakistan (10), and the Middle East (6). There was one global evaluation.
Figure 4: Distribution of E3 Sectoral Synthesis Evaluations by Region
Looking individually at the E3 groups, the Education evaluations followed the same distribution pattern as E3 as a whole. Evaluations related to Economic Growth sectors had a higher concentration of evaluations in the Europe and Eurasia Region. Evaluations in the Environment sectors had a higher concentration than average in Afghanistan and Pakistan.
Figure 5: Distribution of E3 Sectoral Synthesis Evaluations by Group and Region
All E3 Sectors

SECTORAL SYNTHESIS OF 2013 -2014 EVALUATION FINDINGS: E3 BUREAU 5
KEY THEMES ACROSS THE E3 BUREAU
E3 sector specialists who reviewed the 117 evaluation reports extracted a wide range of project-specific as well as cross-cutting findings and lessons learned. A number of Bureau-wide themes emerged during the analysis. This section provides an overview of findings with broad applicability across the Bureau, including examples from individual sectors. Detailed analysis by sector is presented in the following sections.
Project Results
Evaluations were reviewed as to whether the project exceeded, met, or fell short of its performance targets overall. Of the 86 evaluations that discussed performance targets, 76 included enough information to determine the overall achievement of the project. For the majority of these evaluations (52 to 54 percent between Economic Growth, Education and Environment), the E3 reviewers were able to determine that the project had generally met its targets, while roughly a third (21 to 36 percent) conveyed that the project exceeded its targets. A minority (12 to 25 percent) expressed that overall the project fell short of its targets.
Figure 6: Overall Achievement of Performance Targets (n = 76)
Evaluation reports were also reviewed as to what type of information they provided on project outcomes, if any. Guided by the definition in USAID’s Automated Directives System (ADS) Glossary, an outcome is a “higher level or end result at the assistance objective level. Development Objectives should be outcomes. An outcome is expected to have a positive impact on and lead to change in the development situation of the host country.”
13% 12%25%
52% 52%
54%
35% 36%21%
0%
10%
20%
30%
40%
50%
60%
70%
80%
90%
100%
Economic Growth Education Environment
Exceeded Targets Met Targets Fell Short of Targets

SECTORAL SYNTHESIS OF 2013 -2014 EVALUATION FINDINGS: E3 BUREAU 6
Eighty-four of the 117 evaluation reports noted that the project achieved some sort of outcome, with 53 of those outcomes described as being at least partially attributable to the project. Evaluations relating to Economic Growth were the most likely to claim attribution, at 74 percent, and just over a third of Education and Environment evaluations claimed attribution. While the types of outcomes varied widely across sectors, the analysis identified cross-cutting themes for the E3 Bureau that are highlighted below.
Figure 7: Percent of E3 Evaluations that Addressed Project Outcomes and Attribution (n = 117)
Capacity development was one outcome reported in evaluations from all sectors. For example, increased capacity was a reported as an outcome for 16 of the 28 Education evaluations that credited the project with producing outcomes. This included increased capacity for teachers, education administrators, and students.
Outcomes related to improved collaboration were also particularly common in the case of Forestry and Biodiversity projects, where they were described in 7 of the 13 evaluation reports that mentioned project outcomes. Examples include improved coordination between government institutions, coalition building within civil society, and enhanced collaboration between parks and local communities.
Project sustainability was one of the most commonly cited outcomes achieved for all 3 of the evaluations that reported on Land Tenure and Resource Management outcomes, as well as 6 of the 13 evaluations reporting on outcomes from Forestry and Biodiversity, and 2 of the 3 for Private Capital Management. For example, in the case of Private Capital Management, sustainability was achieved through the strengthening of local partner institutions.
Policy reform outcomes were also linked to four projects in Forestry and Biodiversity, as well as three projects in Economic Policy and two in Trade and Regulatory Reform.
For those 53 evaluations stating that outcomes could be attributed to the intervention to at least some degree, the causal linkages connecting project outputs to outcomes varied widely. Anecdotal data from stakeholders, interviewees, and focus group participants were used to verify linkages to outcomes in 21 of the evaluation reports reviewed, but 22 of the evaluations treated the project’s linkage to the stated
4%
33% 33%
74%
36% 38%
22%31% 29%
0%
20%
40%
60%
80%
100%
Economic Growth Education Environment
Outcomes identified but notattributed to project
Outcomes identified andattributed to project
No outcomes identified
Key themes related to project outcomes included:
‐ Capacity development ‐ Improved collaboration ‐ Project sustainability ‐ Policy reform

SECTORAL SYNTHESIS OF 2013 -2014 EVALUATION FINDINGS: E3 BUREAU 7
outcomes as self-evident, providing little or no verification. In none of these instances did evidence cited as a basis for attribution meet the Agency’s established standards for impact evaluations, per its Evaluation Policy, of having a counterfactual. The remaining 10 evaluations provided data that did not support the premise that the project had produced the stated outcome.
Two of the 117 evaluation reports under review met the USAID impact evaluation criteria of providing evidence of change by looking at a control/comparison group over time. Additionally, evaluations for six of the Education projects, two Economic Policy projects as well as one each from Trade and Regulatory Reform and Forestry and Biodiversity presented pre- and post-measures to demonstrate improvements in outcome measures, but did not include a counterfactual to support attribution claims by eliminating other possible causes of the changes that were demonstrated.
Innovative Practices
The E3 Sectoral Synthesis also examined the use of innovative practices. In reviewing the evaluation reports, E3 sector specialists were given the following definition of innovation used by USAID’s Development Innovation Ventures:
“novel business or organizational models, operational or production processes, or products or services that lead to substantial improvements (not incremental “next steps”) in addressing development challenges. Innovation may incorporate science and technology but is often broader, to include new processes or business models.”
Innovative practices in project design, project implementation, or technical approach were addressed in 44 percent of the evaluation reports (52 of 117), with little variation in frequency between sectors. Of these, innovations were most often described as proven models that are being implemented in a new context.
Figure 8: Percent of Evaluations that Addressed Innovative Practices (n = 117)
33%45% 50%
0%
20%
40%
60%
80%
100%
Economic Growth Education Environment
Addressed Not Addressed
The primary types of innovation described in the E3 sector evaluations included:
‐ Inter-Organizational Relationship Innovations
‐ Process Innovations ‐ Product or Service
Innovations
SECTORAL SYNTHESIS OF 2013 -2014 EVALUATION FINDINGS: E3 BUREAU 8
One broad category identified in the evaluation reports is inter-organizational innovation, referring to new relationships between actors and new ways that stakeholders engage with one another. Inter-organizational innovations tended to be more from the perspective of the implementing partner and how it engaged with different actors. Within this broad category, there were a few recurring themes:
• New relationships and entities: Innovation was noted when projects connected entities that had not previously worked together. In some instances, the project created entities whose purpose was to coordinate between groups. This was an important theme in private sector development efforts.
• Relationships were based on co-managing of initiatives: For instance, one Forestry and Biodiversity project was successful in getting different governmental departments to work together on biodiversity conservation issues. Other times, projects supported community-based management that connected disparate groups; this was especially evident in evaluations of natural resource management projects.
• Engaging new funding sources: This often, but not always, took the form of public-private partnerships.
Innovation also related to new processes that beneficiaries have taken on themselves. In Forestry and Biodiversity, 5 out of 17 evaluations reported new approaches being adopted or modifications to existing approaches, such as by adding income generation to a sustainable natural resources management project. Five evaluations in the Education sector cited innovative approaches in both teaching methods (e.g. use of visual aids in classrooms) and education administration (e.g. a new way of selecting scholarship recipients). Relative to other sectors, Education had a higher share of new processes or approaches.
Evaluation reports also described 18 product or service innovations. Half of these were related to information and communications technology (ICT) innovations such as providing laptops for classrooms, software development, and information portals. Non-ICT innovations included products and services such as fuel-efficient woodstoves; improved agricultural practices; Water, Sanitation, and Hygiene (WASH) technologies; and teaching tools.
Gender Equality and Women’s Empowerment
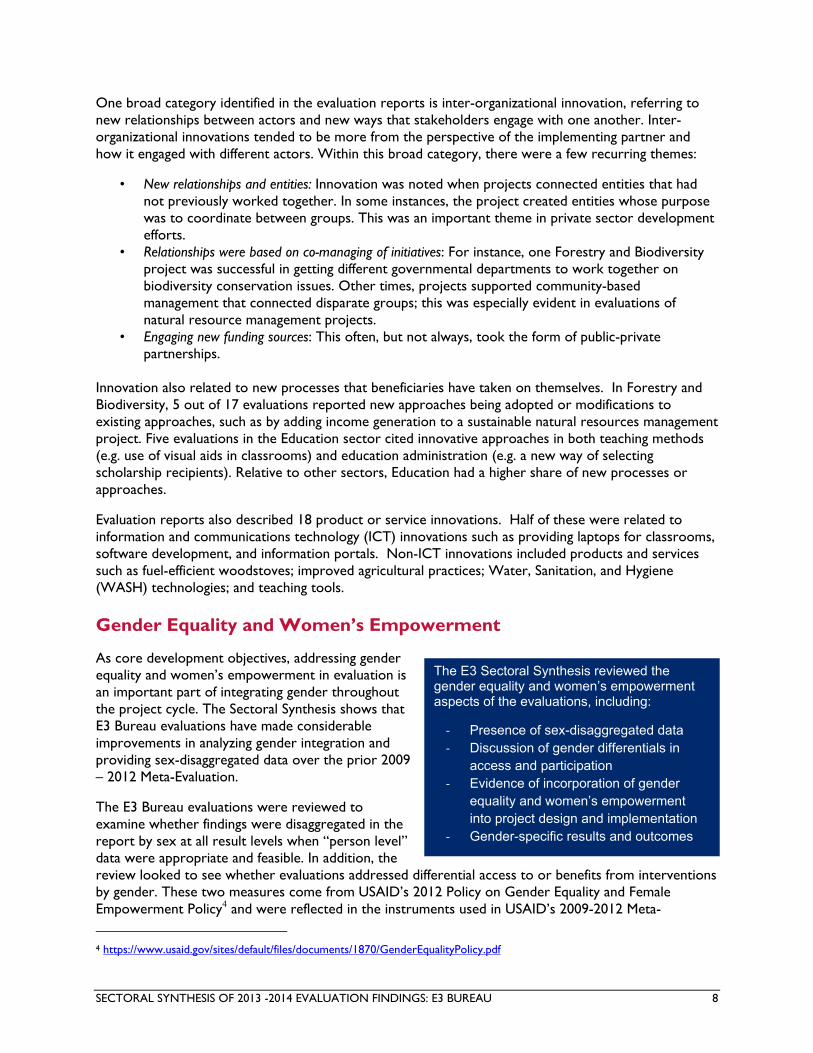
As core development objectives, addressing gender equality and women’s empowerment in evaluation is an important part of integrating gender throughout the project cycle. The Sectoral Synthesis shows that E3 Bureau evaluations have made considerable improvements in analyzing gender integration and providing sex-disaggregated data over the prior 2009 – 2012 Meta-Evaluation.
The E3 Bureau evaluations were reviewed to examine whether findings were disaggregated in the report by sex at all result levels when “person level” data were appropriate and feasible. In addition, the review looked to see whether evaluations addressed differential access to or benefits from interventions by gender. These two measures come from USAID’s 2012 Policy on Gender Equality and Female Empowerment Policy4 and were reflected in the instruments used in USAID’s 2009-2012 Meta-
4 https://www.usaid.gov/sites/default/files/documents/1870/GenderEqualityPolicy.pdf
The E3 Sectoral Synthesis reviewed the gender equality and women’s empowerment aspects of the evaluations, including:
‐ Presence of sex-disaggregated data ‐ Discussion of gender differentials in
access and participation ‐ Evidence of incorporation of gender
equality and women’s empowerment into project design and implementation
‐ Gender-specific results and outcomes

SECTORAL SYNTHESIS OF 2013 -2014 EVALUATION FINDINGS: E3 BUREAU 9
Evaluation as well as in the checklist used in this Synthesis. As such, the findings from this set of 117 evaluations can be compared to evaluations from E3 sectors in the 2009 – 2012 Meta-Evaluation sample, providing a trend over time.
The percent of E3 evaluations that disaggregated findings by sex at all results levels rose from a low of 7 percent in 2010 to 53 percent in 2014. While recognizing that evaluations should strive to provide sex-disaggregated data at all levels, evaluations were also reviewed to see if at least some disaggregated findings were presented. For the 2013 – 2014 period, this study found that 78 percent of evaluations did provide sex-disaggregated data on at least some findings by sex.
Figure 9: Trend in Percent of E3 Evaluations that Disaggregated Findings by Sex at All Levels, 2009 - 2014
E3 sector evaluations have also shown marked improvement over time in identifying, discussing, or explaining differences in how men and women participated in or benefited from the project. The percent of evaluations that addressed differential access or benefits by gender increased from a low of 15 percent in 2011 to 67 percent in 2014.
33%
7%
23%28%
39%
53%
0%
20%
40%
60%
80%
100%
2009 2010 2011 2012 2013 2014
Sources: 2009-2012: Meta-Evaluation of Quality and Coverage of USAID Evaluations2013-2014: E3 Sectoral Synthesis of 2013 - 2014 Evaluation Findings

SECTORAL SYNTHESIS OF 2013 -2014 EVALUATION FINDINGS: E3 BUREAU 10
Figure 10: Trend in Percent of E3 Evaluations that Addressed Differential Access or Benefits by Gender, 2009 - 2014
Of the 62 evaluations (out of 117) included in this study that discussed differential access or benefits by gender, there were a wide range of findings, including topics such as men’s and women’s participation in village forums and the degree of empowerment shown by women after project interventions. Evaluations also looked at gender differences in areas such as access to jobs associated with the project interventions. Examples of these findings are included in the following office-level analysis sections.
Evaluations were also reviewed to see if the evaluation report documented whether the applicable project’s design, implementation, and/or management integrated gender equality and/or women’s empowerment considerations. Most evaluations (64 percent) showed evidence that the projects had addressed gender equality and/or women’s empowerment considerations to at least some degree. For instance, the evaluation of one education project noted that the project was designed to increase girls’ enrollment and retention in school by building latrines for girls, starting girls’ clubs, and undertaking other interventions specifically targeted at girls. In the same vein, an evaluation of a Global Climate Change project indicated that a gender advisor was included to conduct gender analysis of differences in the drivers of deforestation as a way of integrating gender perspectives into policy dialogues. These findings are provided in detail for each office in the following report sections.
Finally, evaluations were reviewed to see whether they addressed the project’s gender equality and women’s empowerment results. The E3 Sectoral Synthesis found that 76 of the 117 evaluations included some level of analysis of the gender equality and/or female empowerment aspects of project outputs and outcomes. Of those, 49 analyzed both outputs and outcomes. Common gender equality and women’s empowerment outcomes included increases in jobs and income, improved educational performance, and decreases in household responsibilities (such as time spent carrying water with an increase in access to a clean water supply).
While evaluations in E3 sectors have shown marked improvement in addressing gender equality and women’s empowerment since the 2009 – 2012 Meta-Evaluation, these issues have not yet been integrated across the board. In 41 cases where the evaluation report did not analyze the gender equality
33%
19%15%
48%
61%67%
0%
20%
40%
60%
80%
100%
2009 2010 2011 2012 2013 2014
Sources: 2009-2012: Meta-Evaluation of Quality and Coverage of USAID Evaluations2013-2014: E3 Sectoral Synthesis of 2013 - 2014 Evaluation Findings

SECTORAL SYNTHESIS OF 2013 -2014 EVALUATION FINDINGS: E3 BUREAU 11
and/or female empowerment aspects of outputs and outcomes, the reports tended not to provide an explanation regarding why. For 7 out of 41 evaluations that did discuss why these aspects were not analyzed, explanations included the project still being in an incipient stage, limited availability of gender data for the project’s specialized subject population, the fact that the project addressed a gender-neutral topic, and the lack of gender-specific analysis completed by the project from which to draw information.
Private Sector Engagement
Seventy-three out of the 117 evaluations included information about private sector engagement, which is characterized by any form of partnership between USAID and private sector entities. Evaluations in the Economic Growth sector were most likely to address private sector engagement, with over 92 percent of evaluation reports describing some kind of private sector engagement. This was followed by Environment at 65 percent and Education at 40 percent.
Figure 11: Percent of E3 Evaluations that Addressed Private Sector Engagement (n = 117)
Public-private partnership was the most common type of private sector engagement across sectors. Trade and Regulatory Reform evaluations included references to public-private partnerships more frequently than did other types of projects, especially with evaluations of trade hub and export-focused projects. Development Credit evaluations provided another example of private sector engagement in the field of financing and investment. Economic Policy showed the most variation, with evaluations describing private sector engagement not only in private-public partnerships but also in the banking sector, employment and jobs, and in local market development and supply chains. Evaluation reports from the Education sector provided insight into the ways in which employment opportunities and vocational training for youth were incorporated by building relationships with the private sector.
Where the private sector was not successfully engaged, seven evaluation reports outlined a number of “opportunities missed” and made recommendations for increased engagement with and inclusion of the private sector in future programming. For example, in Forestry and Biodiversity, several evaluations of sustainable tourism projects recommended greater collaboration with the local tourism and hospitality industries. In Energy and Infrastructure, evaluations stated that engagement with the private sector was particularly challenging in promoting investment while alleviating risk for the private sector.
93%
40%
65%
0%
20%
40%
60%
80%
100%
Economic Growth Education Environment
Addressed Not Addressed
SECTORAL SYNTHESIS OF 2013 -2014 EVALUATION FINDINGS: E3 BUREAU 12
Governance
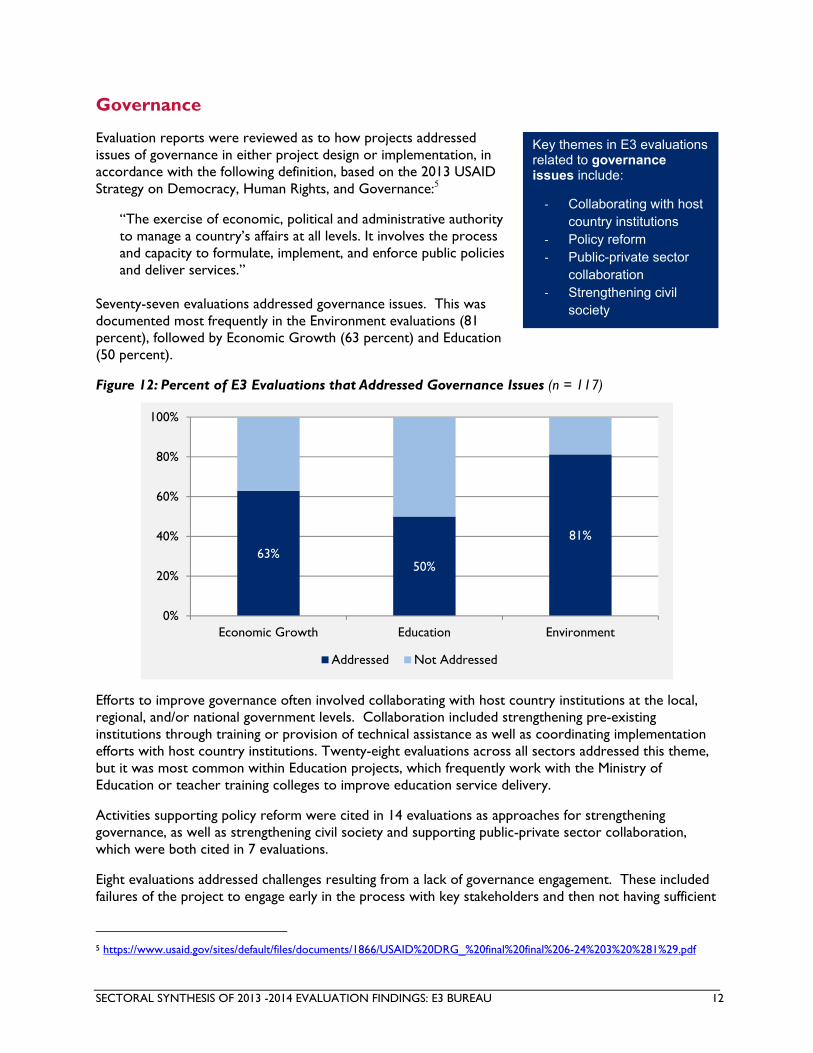
Evaluation reports were reviewed as to how projects addressed issues of governance in either project design or implementation, in accordance with the following definition, based on the 2013 USAID Strategy on Democracy, Human Rights, and Governance:5
“The exercise of economic, political and administrative authority to manage a country’s affairs at all levels. It involves the process and capacity to formulate, implement, and enforce public policies and deliver services.”
Seventy-seven evaluations addressed governance issues. This was documented most frequently in the Environment evaluations (81 percent), followed by Economic Growth (63 percent) and Education (50 percent).
Figure 12: Percent of E3 Evaluations that Addressed Governance Issues (n = 117)
Efforts to improve governance often involved collaborating with host country institutions at the local, regional, and/or national government levels. Collaboration included strengthening pre-existing institutions through training or provision of technical assistance as well as coordinating implementation efforts with host country institutions. Twenty-eight evaluations across all sectors addressed this theme, but it was most common within Education projects, which frequently work with the Ministry of Education or teacher training colleges to improve education service delivery.
Activities supporting policy reform were cited in 14 evaluations as approaches for strengthening governance, as well as strengthening civil society and supporting public-private sector collaboration, which were both cited in 7 evaluations.
Eight evaluations addressed challenges resulting from a lack of governance engagement. These included failures of the project to engage early in the process with key stakeholders and then not having sufficient
5 https://www.usaid.gov/sites/default/files/documents/1866/USAID%20DRG_%20final%20final%206-24%203%20%281%29.pdf
63%50%
81%
0%
20%
40%
60%
80%
100%
Economic Growth Education Environment
Addressed Not Addressed
Key themes in E3 evaluations related to governance issues include:
‐ Collaborating with host country institutions
‐ Policy reform ‐ Public-private sector
collaboration ‐ Strengthening civil
society
SECTORAL SYNTHESIS OF 2013 -2014 EVALUATION FINDINGS: E3 BUREAU 13
buy-in to implement activities, as well as delays in project implementation when a local institution did not deliver their component of the project on time.
Areas for Learning and Improvement
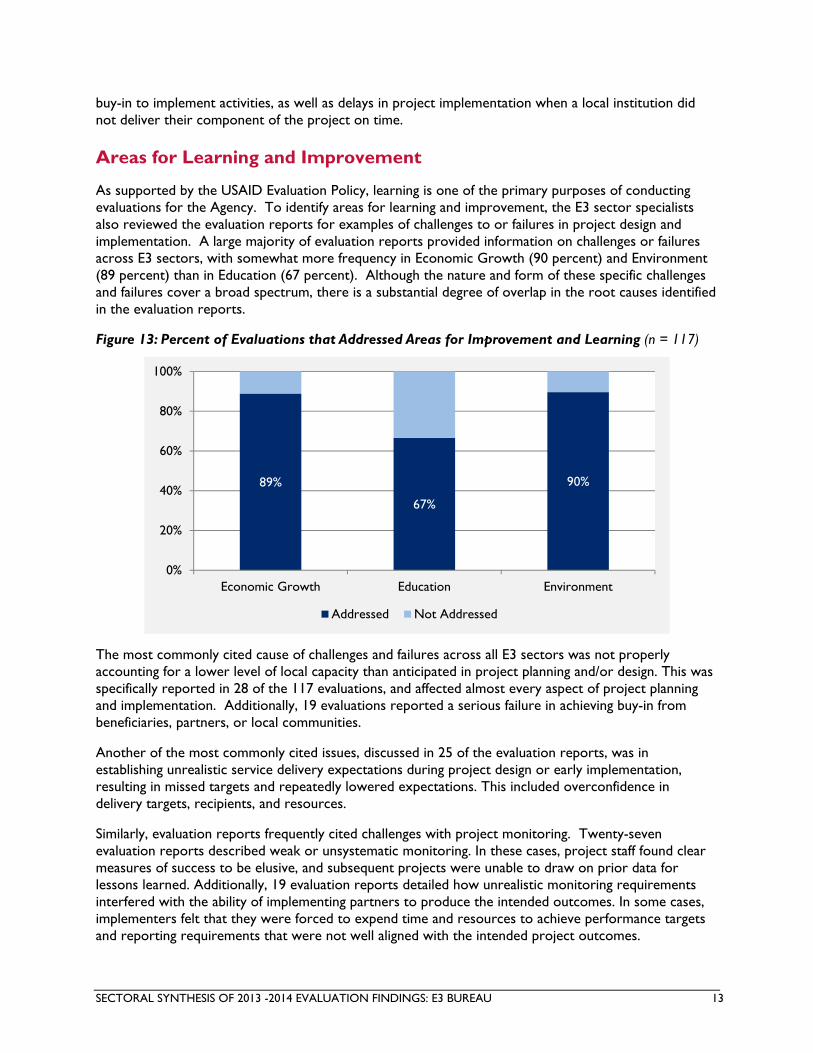
As supported by the USAID Evaluation Policy, learning is one of the primary purposes of conducting evaluations for the Agency. To identify areas for learning and improvement, the E3 sector specialists also reviewed the evaluation reports for examples of challenges to or failures in project design and implementation. A large majority of evaluation reports provided information on challenges or failures across E3 sectors, with somewhat more frequency in Economic Growth (90 percent) and Environment (89 percent) than in Education (67 percent). Although the nature and form of these specific challenges and failures cover a broad spectrum, there is a substantial degree of overlap in the root causes identified in the evaluation reports.
Figure 13: Percent of Evaluations that Addressed Areas for Improvement and Learning (n = 117)
The most commonly cited cause of challenges and failures across all E3 sectors was not properly accounting for a lower level of local capacity than anticipated in project planning and/or design. This was specifically reported in 28 of the 117 evaluations, and affected almost every aspect of project planning and implementation. Additionally, 19 evaluations reported a serious failure in achieving buy-in from beneficiaries, partners, or local communities.
Another of the most commonly cited issues, discussed in 25 of the evaluation reports, was in establishing unrealistic service delivery expectations during project design or early implementation, resulting in missed targets and repeatedly lowered expectations. This included overconfidence in delivery targets, recipients, and resources.
Similarly, evaluation reports frequently cited challenges with project monitoring. Twenty-seven evaluation reports described weak or unsystematic monitoring. In these cases, project staff found clear measures of success to be elusive, and subsequent projects were unable to draw on prior data for lessons learned. Additionally, 19 evaluation reports detailed how unrealistic monitoring requirements interfered with the ability of implementing partners to produce the intended outcomes. In some cases, implementers felt that they were forced to expend time and resources to achieve performance targets and reporting requirements that were not well aligned with the intended project outcomes.
89%
67%
90%
0%
20%
40%
60%
80%
100%
Economic Growth Education Environment
Addressed Not Addressed
SECTORAL SYNTHESIS OF 2013 -2014 EVALUATION FINDINGS: E3 BUREAU 14
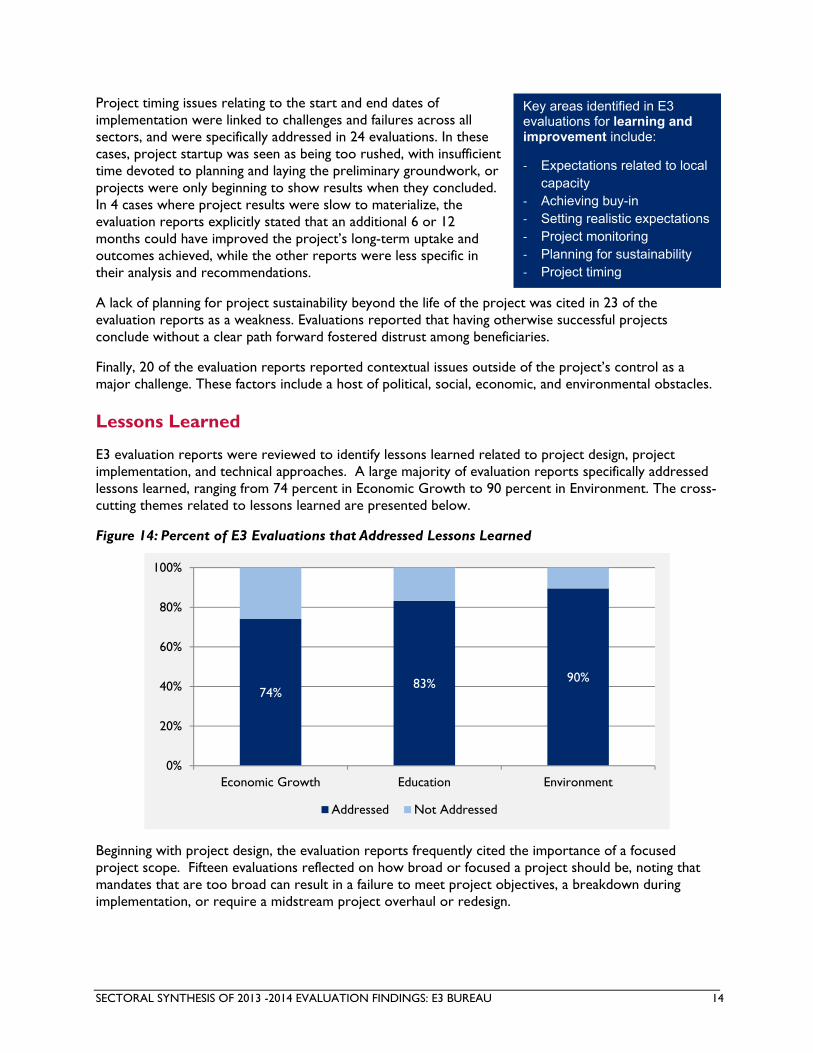
Project timing issues relating to the start and end dates of implementation were linked to challenges and failures across all sectors, and were specifically addressed in 24 evaluations. In these cases, project startup was seen as being too rushed, with insufficient time devoted to planning and laying the preliminary groundwork, or projects were only beginning to show results when they concluded. In 4 cases where project results were slow to materialize, the evaluation reports explicitly stated that an additional 6 or 12 months could have improved the project’s long-term uptake and outcomes achieved, while the other reports were less specific in their analysis and recommendations.
A lack of planning for project sustainability beyond the life of the project was cited in 23 of the evaluation reports as a weakness. Evaluations reported that having otherwise successful projects conclude without a clear path forward fostered distrust among beneficiaries.
Finally, 20 of the evaluation reports reported contextual issues outside of the project’s control as a major challenge. These factors include a host of political, social, economic, and environmental obstacles.
Lessons Learned
E3 evaluation reports were reviewed to identify lessons learned related to project design, project implementation, and technical approaches. A large majority of evaluation reports specifically addressed lessons learned, ranging from 74 percent in Economic Growth to 90 percent in Environment. The cross-cutting themes related to lessons learned are presented below.
Figure 14: Percent of E3 Evaluations that Addressed Lessons Learned
Beginning with project design, the evaluation reports frequently cited the importance of a focused project scope. Fifteen evaluations reflected on how broad or focused a project should be, noting that mandates that are too broad can result in a failure to meet project objectives, a breakdown during implementation, or require a midstream project overhaul or redesign.
74%83% 90%
0%
20%
40%
60%
80%
100%
Economic Growth Education Environment
Addressed Not Addressed
Key areas identified in E3 evaluations for learning and improvement include:
‐ Expectations related to local capacity
‐ Achieving buy-in ‐ Setting realistic expectations ‐ Project monitoring ‐ Planning for sustainability ‐ Project timing

SECTORAL SYNTHESIS OF 2013 -2014 EVALUATION FINDINGS: E3 BUREAU 15
However, evaluation reports also noted the value of cross-sector integrated design. Fourteen evaluations found that in order to fully address the complex development issues being tackled, projects should be built upon holistic designs. Examples of fields that were found to be more successful when integrated include: tourism, environment, and economic growth; crop production and plant disease; water, sanitation, and sustainability; and raising awareness and behavioral intervention.
Evaluations also noted the need for flexibility in programming. Lessons learned in seven evaluations suggested ensuring flexibility within a project’s scope of work, to provide implementers and other key partners the ability to respond to inevitable changing circumstances.
The issue of planning around the capacity of stakeholders, local systems, and implementing partners generated many lessons learned. Eighteen evaluations commented on the need to address the capacity of project stakeholders including local institutions, communities, and the host country government during the design phase. Eight of these reports specifically discussed the need for capacity assessments of stakeholders to be undertaken during the design phase. Twelve evaluations noted that capacity development activities should be implemented over longer timeframes or should be accompanied by routine follow-up, to ensure that capacity improvements are sustained. The importance of community engagement was another common lesson learned, with 27 evaluations noting that constructive engagement with local stakeholders is critical to successful implementation. Eighteen evaluations described the need to ensure community buy-in and ownership throughout project implementation. Strategies cited to foster community buy-in include active involvement of stakeholders in project activities and decision-making, which not only builds capacity but also strengthens investment in project processes and outcomes. Twenty evaluations also described a direct link between community ownership and project sustainability, noting that in order for activities to continue in the long-term, communities must be committed to sustaining them.
Fifteen evaluations mentioned the value of knowledge exchange through facilitating or creating technical networks and relationships, in order to supplement formal technical assistance efforts, empower stakeholders, and allow for cross-pollination of ideas. These networks can have a lasting impact by creating networks that continue beyond project implementation. Finally, challenges with performance management systems and approaches resulted in many lessons learned. Issues ranged from an overreliance on standard indicators that do not inform programming, to the failure to analyze or utilize monitoring data collected. Lessons learned included developing useful custom indicators at the implementation level and developing performance management plans that use monitoring data to affect programming during the life of the project.
Key themes identified in E3 evaluations as lessons learned include:
‐ Appropriate project scope ‐ Cross-sector integrated
design ‐ Flexibility in programming ‐ Planning for current capacity ‐ Community engagement and
ownership ‐ Facilitating knowledge
exchange ‐ Performance management

SECTORAL SYNTHESIS OF 2013 -2014 EVALUATION FINDINGS: E3 BUREAU 16
IMPROVEMENT IN THE QUALITY OF E3 EVALUATIONS
In the Meta-Evaluation of Quality and Coverage of USAID Evaluations 2009 – 2012, the Office of Learning, Evaluation and Research in the Bureau for Policy, Planning and Learning (PPL/LER) introduced a composite evaluation report “score” that was based on a larger checklist for reviewing the quality of evaluation reports. This score is a composite of 11 evaluation quality factors out of the larger 37 factor checklist, which is attached in this document as Annex D. Possible scores range from zero to 10, as two factors are combined to make one point.
The E3 Sectoral Synthesis built on this earlier PPL/LER study to examine evaluation report quality improvements over time for evaluations in E3 sectors. Evaluations in the set of 2013 – 2014 evaluations for the E3 Sectoral Synthesis were rated and scored using the same methodology and were then compared to evaluations related to E3 sectors that were scored for the 2009 – 2012 Meta-Evaluation.
The 2013-2014 E3 Sectoral Synthesis found that the quality score of E3 evaluation reports has shown marked improvement. On a ten-point scale, the average score for evaluations in E3 sectors rose from 4.69 in 2010 (just before the launch of USAID’s Evaluation Policy) to 8.02 in 2014. The Agency-wide average score for 2009 – 2012 was 5.93, and was mirrored by a similar year-to-year trend as evaluations in E3 sectors.
Figure 15: Trends in Quality of E3 Evaluation Report Scores, 2009 - 2014
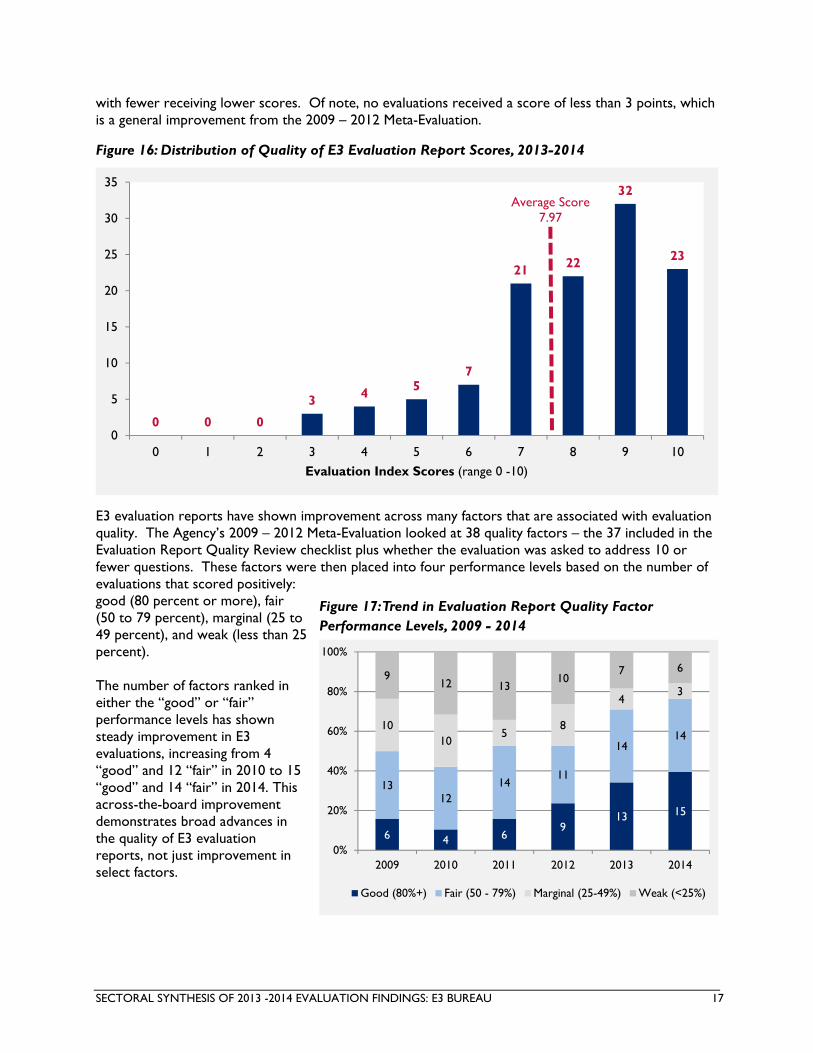
The average score for the 117 evaluations included in the 2013 – 2014 Sectoral Synthesis is 7.97. Figure 16 shows the distribution of these scores. Many evaluations are clustered around the average score,
5.64
4.69
6.396.52
7.95 8.02
4
5
6
7
8
9
10
2009 Average 2010 Average 2011 Average 2012 Average 2013 Average 2014 Average
Average
Sources: 2009 - 2012: Meta-Evaluation of Quaity and Coverage of USAID Evaluations2013 - 2014: E3 Sectoral Synthesis of 2013 - 2014 Evaluation FindingsScore Range: 0 - 10
The quality score of E3 Evaluations increased from 4.69 in 2010 to 8.02 in 2014.
This increase of nearly three and a half points shows remarkable improvement in the quality of evaluation reports and represents a serious effort across E3 sectors to strengthen the performance of the evaluations they undertake.
SECTORAL SYNTHESIS OF 2013 -2014 EVALUATION FINDINGS: E3 BUREAU 17
with fewer receiving lower scores. Of note, no evaluations received a score of less than 3 points, which is a general improvement from the 2009 – 2012 Meta-Evaluation.
Figure 16: Distribution of Quality of E3 Evaluation Report Scores, 2013-2014
E3 evaluation reports have shown improvement across many factors that are associated with evaluation quality. The Agency’s 2009 – 2012 Meta-Evaluation looked at 38 quality factors – the 37 included in the Evaluation Report Quality Review checklist plus whether the evaluation was asked to address 10 or fewer questions. These factors were then placed into four performance levels based on the number of evaluations that scored positively: good (80 percent or more), fair (50 to 79 percent), marginal (25 to 49 percent), and weak (less than 25 percent). The number of factors ranked in either the “good” or “fair” performance levels has shown steady improvement in E3 evaluations, increasing from 4 “good” and 12 “fair” in 2010 to 15 “good” and 14 “fair” in 2014. This across-the-board improvement demonstrates broad advances in the quality of E3 evaluation reports, not just improvement in select factors.
0 0 0
3 4 57
21 22
32
23
0
5
10
15
20
25
30
35
0 1 2 3 4 5 6 7 8 9 10
Evaluation Index Scores (range 0 -10)
Average Score 7.97
6 4 69
13 15
1312
1411
1414
1010
58
43
912 13
107 6
0%
20%
40%
60%
80%
100%
2009 2010 2011 2012 2013 2014
Good (80%+) Fair (50 - 79%) Marginal (25-49%) Weak (<25%)
Figure 17: Trend in Evaluation Report Quality Factor Performance Levels, 2009 - 2014

SECTORAL SYNTHESIS OF 2013 -2014 EVALUATION FINDINGS: E3 BUREAU 18
Figure 18 shows the change in the percent of evaluations that scored positively on each of the quality factors by performance category. Each factor notes the Evaluation Report Quality Review checklist item number and is described in detail in the Rater’s Handbook (Annex D).
The gray circles represent the average score of E3 sector evaluations in 2012. The solid dots are the average evaluation scores by factor in 2014. Overall, E3 sector evaluations have shown improvement over the past two years. For 28 out of 38 factors, scores improved, shown in blue. Several factors showed considerable improvement, such as addressing all of the evaluation questions in the body of the report (factor 18) and linking data collection methods to questions (factor 9). Scores did decrease for 10 factors, as illustrated by the red dots. Most of these are minor decreases, but some are particularly concerning. For example, the percent of evaluations that adequately described the characteristics of the project being evaluated (factor 2) and the percent that included the project’s theory of change (factor 3) decreased, two factors which are considered important enough to be included in the Quality of Evaluation Report Score.
Figure 18: Evaluation Report Quality Factors for E3 Evaluations Clustered by Performance Category Change Between 2012 and 2014
Good: 80 Percent or More Scored Positively in 2014

SECTORAL SYNTHESIS OF 2013 -2014 EVALUATION FINDINGS: E3 BUREAU 19
Fair: Between 50 Percent and 79 Percent Scored Positively in 2014
Marginal: Between 25 and 49 Percent Scored Positively in 2014
Weak: Less Than 25 Percent Scored Positively in 2014

SECTORAL SYNTHESIS OF 2013 -2014 EVALUATION FINDINGS: E3 BUREAU 20
CONCLUSION
In summary, the E3 Sectoral Synthesis of 2013 – 2014 Evaluation Findings has demonstrated that Bureau attention to evaluation quality on an ongoing basis pays off. As the study shows, the quality of E3 evaluation reports visibly improved overall as well as on multiple specific evaluation report dimensions, and the study’s aggregate qualitative findings provide important lessons for future programming. These findings should encourage a continuing focus on evaluation quality and periodic monitoring using the types of analytic tools on which this study relied, not only in E3 but across all Bureaus and in overseas Missions as well.
SECTORAL SYNTHESIS OF 2013 -2014 EVALUATION FINDINGS: E3 BUREAU 21
ECONOMIC POLICY EVALUATIONS
Summary of Evaluations
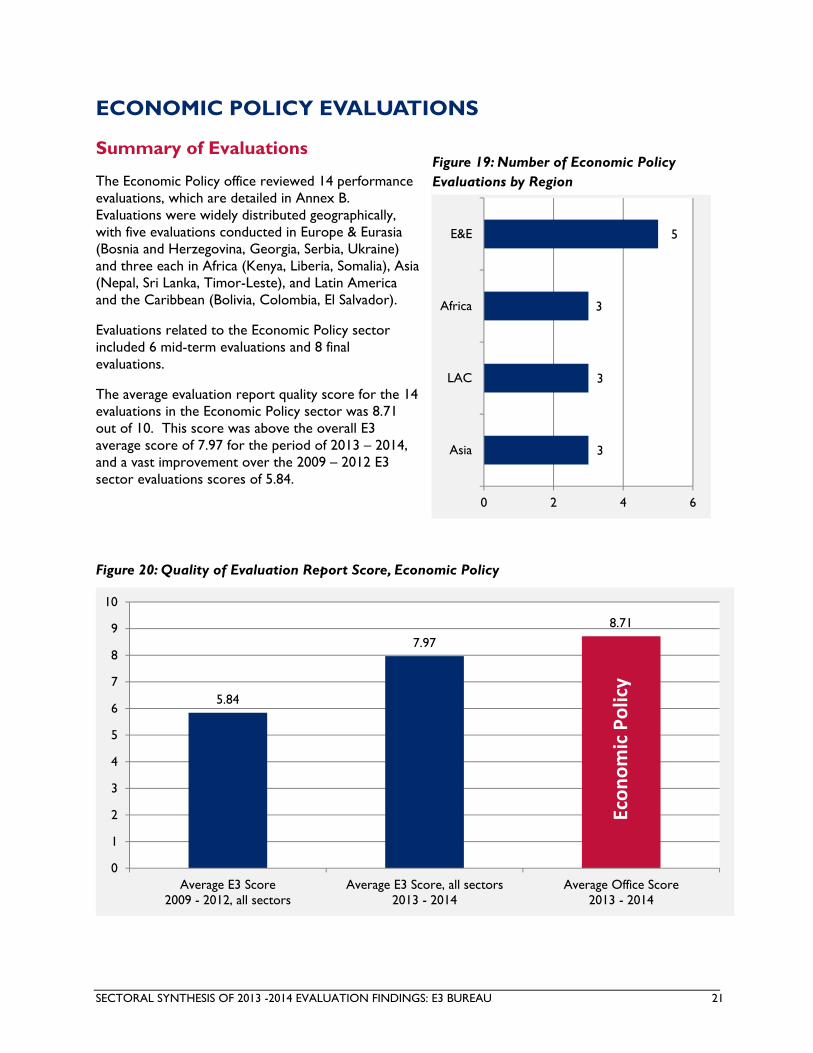
The Economic Policy office reviewed 14 performance evaluations, which are detailed in Annex B. Evaluations were widely distributed geographically, with five evaluations conducted in Europe & Eurasia (Bosnia and Herzegovina, Georgia, Serbia, Ukraine) and three each in Africa (Kenya, Liberia, Somalia), Asia (Nepal, Sri Lanka, Timor-Leste), and Latin America and the Caribbean (Bolivia, Colombia, El Salvador).
Evaluations related to the Economic Policy sector included 6 mid-term evaluations and 8 final evaluations.
The average evaluation report quality score for the 14 evaluations in the Economic Policy sector was 8.71 out of 10. This score was above the overall E3 average score of 7.97 for the period of 2013 – 2014, and a vast improvement over the 2009 – 2012 E3 sector evaluations scores of 5.84.
Figure 20: Quality of Evaluation Report Score, Economic Policy
5.84
7.97
8.71
0
1
2
3
4
5
6
7
8
9
10
Average E3 Score2009 - 2012, all sectors
Average E3 Score, all sectors2013 - 2014
Average Office Score2013 - 2014
Economic Policy
3
3
3
5
0 2 4 6
Asia
LAC
Africa
E&E
Figure 19: Number of Economic Policy Evaluations by Region

SECTORAL SYNTHESIS OF 2013 -2014 EVALUATION FINDINGS: E3 BUREAU 22
The chart below shows the percentage of evaluations that addressed the study areas of interest. As compared to E3 as a whole, evaluations in the Economic Policy sector were considerably more likely to address project outcomes, project performance targets, private sector engagement, and governance issues. Project outcomes is a particularly well covered theme, with all 14 evaluations discussing project outcomes and whether or not these could be attributed to the project.
Figure 21: Percent of Economic Policy Evaluations that Addressed Each Topic Area
84%
81%
66%
62%
44%
78%
74%
86%
93%
79%
93%
43%
93%
100%
0% 20% 40% 60% 80% 100%
Lessons Learned
Learning and Improvement
Governance
Private Sector Engagement
Innovative Practices
Performance Targets
Project Outcomes
Economic Policy (n = 14) E3 Average (n = 117)

SECTORAL SYNTHESIS OF 2013 -2014 EVALUATION FINDINGS: E3 BUREAU 23
Project Results
Thirteen of the 14 evaluations in the Economic Policy sector addressed performance targets. Evaluations were reviewed to see if, on the whole, the project met, exceeded, or fell short of its targets. In nine cases, the project met its performance targets and exceeded its targets in two cases while only in two cases did the project fell short of its targets.
Liberia SHOPS: “The combination of technical assistance and small enterprise development characterizing SHOPS strategy has generated benefits accruing directly to rural Liberian producers and consumers. SHOPS has engaged in capacity building in lucrative technical skills including metal fabrication, nursery operations, and business administration procedures for applying for and managing credit.” (Evaluation # 7)
All 14 evaluations in the Economic Policy sector provided information on project outcomes. Eight of the 14 projects achieved outcomes related to increased economic growth or security, and 7 of the 14 achieved outcomes related to increased capacity among beneficiaries and partner institutions.
Thirteen evaluations stated that the outcomes could in some way be attributed to the projects. Data supporting these outcomes and successfully linking them to the program activities were limited. Only two evaluations cited pre- and post- measures of change to demonstrate a linkage between project outputs to their outcomes, while six relied on accounts from stakeholders, interviewees and focus group participants. Four of the evaluations made unsupported statements linking the program to its outcomes, and two stated that it was simply too soon to know if some of the outcomes had been achieved.
Somalia PEG: “Evaluators also found that improvements in the knowledge and capacity among private and public sector entities contributed to improvements in on-farm and small enterprise outcomes, such as the adoption of improved practices and increased production, sales, income, and employment.” (Evaluation # 10)
Innovative Practices
Six of the 14 evaluations in the Economic Policy sector addressed innovative practices, and touched on all three stages of innovation. Innovations in Economic Policy tended not to be new ideas, but rather applying an approach in a new context or sector.
Proof of concept: The USAID municipal competitiveness project in El Salvador was one of the first to offer a comprehensive package of services for promoting public-private dialogue for local economic development.
Testing and positioning for scale: The Ukraine financial sector rehabilitation project (FINREP) was working with the Ministry of Education to approve a newly introduced and piloted course as optional or
Figure 22: Overall Achievement of Performance Targets (n = 14 evaluations)

SECTORAL SYNTHESIS OF 2013 -2014 EVALUATION FINDINGS: E3 BUREAU 24
mandatory nationwide. For the Somalia PEG program, the evaluation report states that: “Not only did this intervention achieve its immediate objectives, but it has also laid the groundwork for a significant expansion of wind-generated energy in Somaliland.”
Transitioning to scale: In several instances, projects applied known approaches or models in new contexts. The USAID/Timor-Leste consolidating cooperative and agribusiness recovery (COCAR) project introduced a US or top-down organizational model to the East Timor Coffee Cooperative. The Somalia Partnership for Economic Growth (PEG) program was aimed at piloting the private sector development approach in a new (and difficult) context.
In terms of the types of innovations, new relationships and linkages was a recurring theme, including a particularly interesting example from the municipal competitiveness project in El Salvador that offered an innovative approach to decentralized governance and working with municipalities for market development. Innovations in stakeholder engagement tended to be stated from the perspective of the program. In other words, implementers found innovative ways to engage and connect different stakeholders.
New financing modalities were another recurring innovative approach with public-private partnerships being cited often. Financing modalities and relationships are also often interrelated.
Bolivia BPC: “It should be noted that a special model of methodology for promoting the incubation and growth of MSMEs through a form of Public-Private-Alliances (PPA) was designed and agreed between the stakeholders. This model was chosen as a solution for Bolivia since the public GOB sector did not participate therefore USAID’s funds were the only public sector investment available.” (Evaluation # 1)
Somalia PEG: “PEG fundamentally challenged the prevailing development practice in Somalia, which relied heavily on, among other things, direct or subsidized service/good provision (…). The idea is new. It’s difficult for the farmers to accept the project as it is, because they were expecting some monetary incentives. On many occasions, PEG met with obstacles created by these traditional development practices, but was able to break through these barriers in most cases.” (Evaluation # 10)
Gender Equality and Women’s Empowerment
Across all 14 evaluations reviewed in the Economic Policy sector, most were fairly strong on gender measures. Almost three-quarters (71 percent) of the evaluations analyzed outputs/outcomes in terms of gender equality and/or female empowerment. Of those, 60 percent conducted the analysis only at the output level. Sixty-nine percent of the evaluations in the Economic Policy sector disaggregated data by gender at all levels when data were person-focused and 100 percent of the evaluations presented at least some sex disaggregated data. Sixty nine percent of evaluations explained whether access or outcomes were different for men or women where data were person focused. Analysis also showed that 64 percent of the evaluations included evidence that the projects incorporated gender into their design or implementation.
When evaluations in the Economic Policy sector analyzed gender integration, the types of things that were analyzed included: the gender of policymakers, women’s participation in targeted value chains, employment of women as a result of project interventions, the division of agricultural work between the genders, whether economic sectors targeted for assistance tend to employ men or women more heavily, and of course, the gender of project participants. Some examples of these analyses include:

SECTORAL SYNTHESIS OF 2013 -2014 EVALUATION FINDINGS: E3 BUREAU 25
Timor-Leste COCAR: “The division of agricultural work for the crops under discussion (coffee, cocoa, and cassava) tends to be gender-neutral, meaning that men perform tasks requiring more physical strength while women performed those that are more exacting and less physically strenuous. For example, women most often weed while men prune trees and prepare the land. In this regard, it is important to note that increasing gender-neutral agriculture workloads can negatively affect women because it will require them to spend more time on fieldwork and, unless there is a change in traditional household gender roles, they will still have the same amount of housework to complete.” (Evaluation # 12)
El Salvador MCP: “As part of the effort to encourage greater women’s participation in the economic and political arenas, the Project contracted with the El Salvador chapter of Vital Voices (VVES), whose focus is on identifying, investing in, and bringing visibility to women leaders in business, government, and civil society globally. As an example, an association of women in the small community of Caserío Las Crucitas visited by the evaluation team received Project and municipal support for an egg production project. These women indicated that if equipped with knowledge, technical assistance, and economic support and follow-up, women could accomplish huge achievements and both self-esteem and their economic situation would improve. Their new perception about themselves as capable beings have had a major impact in their lives, both economically and psychologically; they indicated that they now feel represented and that the approach to gender has positively impacted their lives in regards to self-esteem and economic empowerment.” (Evaluation # 4)
EVALUATION HIGHLIGHT: Evaluations related to the Economic Policy sector provided examples of representing sex-disaggregated data visually. The evaluation of the COCAR project in Timor-Leste (Evaluation # 12) provided information on differences in preferences between men and women and the evaluation of the NEAT project in Nepal (Evaluation # 8) showed difference in access to microfinance by gender.
The majority (64 percent) of Economic Policy evaluations showed evidence that gender was taken into consideration during project design and/or implementation. Relevant highlights from evaluation reports include:
Timor-Leste COCAR: “[The project's] gender neutral approach to training is appropriate to supporting the expansion of commercial agricultural cash producing enterprises and it has the

SECTORAL SYNTHESIS OF 2013 -2014 EVALUATION FINDINGS: E3 BUREAU 26
positive result of bringing women more directly into the commercial activities of the farm household and supports increased farm family income generation.” (Evaluation # 12)
Ukraine FINREP: “In general terms, policies that improve the pension system and financial literacy while expanding business opportunities and access to finance would (ceteris paribus) serve the interests of those who do not already benefit from wealth and connections, including most women. In this respect, the aims of the project are consistent with the enhancement of gender equity, either addressing areas of particular importance to gender status (e.g., pensions) or laying the necessary groundwork for more gender-specific interventions by helping build a stable financial sector.” (Evaluation # 13)
El Salvador MCP: “Project consultant staff completed a gender assessment analysis in January 2011 … A first version of the gender action plan was completed in June 2012, and a final version was approved by USAID in April 2013. Although originally included as an element of component 2: (MCI) in the 2010 work plan, according to Project staff, gender has since been a crosscutting MCP commitment, and the gender plan is implemented across the three MCP components and monitored by the MCP technical team... As the Project has developed over the years, women’s participation in MCCs has risen from an initial 33% to above 40%. Because MCCs are the main platform for public-private dialogue, participation has opened an opportunity to women to be represented in decision-making in their communities.” (Evaluation #4)
Private Sector Engagement
Thirteen out of the 14 evaluations in the Economic Policy sector addressed private sector engagement. At 93 percent, private sector engagement was addressed more frequently in Economic Policy, as compared to the average of 62 percent across all of E3.
These 13 evaluations fell under one or more of four categories of private sector engagement (PPPs, investment/financing, market development and employment). The majority of cases of private sector engagement fell under the PPP category as the most common approach to either project design or implementation. Where evaluations noted private sector development in any capacity, more than one type of engagement was usually present. For example, market development paired with employment generation, or PPPs paired with outreach to banks to promote lending and investment, as well as local supply chain/market development in key industries to foster economic growth. One exception to this was an evaluation under review of a project that was able to highlight a successful model of introducing PPPs in El Salvador, where that was the primary focus of the intervention.
El Salvador MCP: “…the Project had made a major contribution to developing a model for public-private sector dialogue and implementing a coherent program in support of a municipal
Evaluation Photo 1: Program beneficiary participating in a public-private alliance, Bolivia BPC Evaluation # 1

SECTORAL SYNTHESIS OF 2013 -2014 EVALUATION FINDINGS: E3 BUREAU 27
competitiveness agenda. The Project’s greatest contribution was facilitating the development of alliances between local governments and members of the private sector. These alliances, as reflected in the work of MCCs, are based on a relation of trust achieved through the construction of a shared vision, municipal competitiveness plans, and a commitment to work together for positive change. The establishment of this platform based on a process of competitiveness planning has helped municipalities become more proactive institutions that jointly define strategic course of action with private sector participation based on a shared vision. This platform has furthered private sector participation in the municipality garnering other private sector contributions towards improving the municipality. This process helped to change the mindsets of both the municipal governments and the business sector about the potential benefits of collaborating in municipal development.” (Evaluation # 4)
Somalia PEG: “PEG works closely with private sector businesses, government ministries, non-governmental organizations (NGOs), and civil society organizations (CSOs) to promote economic growth and stabilization in Somaliland and Puntland…One way PEG sought to strengthen the relevant market systems was by forging commercial connections between market actors at different levels in the horticulture, livestock, and fodder value chains: In the livestock value chain, PEG connected CAHWs in Somaliland and Puntland to pharmacies and the pharmacies to established, reputable drug wholesalers.” (Evaluation # 10)
Serbia SLDP: “Grants and subcontracts allocated by SLDP are relevant to the development needs of the stakeholders and are consistent with the expected project results particularly attraction of investment and generation of employment… Most of the grant funding was utilized for direct or indirect support of investment generation (this is approximately 37% through initiatives like BFC or promotion of IMC initiatives in Banat) and employment (approximately 28% through grants for support to youth internships).” (Evaluation # 9)
Governance
Eleven of the 14 evaluations in the Economic Policy sector addressed governance issues. Many of the challenges and areas for opportunity revolve around governance issues, at the local, regional, or national level. In addition to the Private-Public Partnerships addressed above, policy reform was a major outcome of engagement with governance issues.
Nepal NEAT: “To achieve [its] goals, the NEAT program provided technical and managerial expertise to a number of stakeholders, including key government ministries, departments, and agencies; private-sector institutions, enterprises, and support organizations; and smallholder farmers. … Forty policies and procedural reforms had been assessed, drafted, or re-drafted by NEAT staff, nine of which have since been passed and moved toward implementation by the completion of the NEAT program.” (Evaluation # 8)
Serbia SLDP: “SLDP was successful in supporting reform of the legal framework for IMCs and this was accomplished through support to reform of some of the key laws including the Law on Local Self Government, the Law on Public Enterprises, and the Labor Law.” (Evaluation # 10)
Ukraine FINREP: “FINREP helped shape the legal and regulatory environment for a stable, transparent and resilient financial sector in Ukraine. Our findings suggest that it did so by working effectively with key counterparts in government (primarily NBU, also MOF and SSMNC), the Verkhovna Rada and the banking sector, offering prompt and responsive input to these counterparts, taking the lead on a few critically important reform matters, and by providing appropriate expertise. The extent to which the project shaped the legal-regulatory environment was moderate. Our findings show that interviewees both in and outside official counterpart agencies consider FINREP’s input to legal-regulatory reforms in the financial sector as well-targeted and in conformity with best practice.” (Evaluation # 13)

SECTORAL SYNTHESIS OF 2013 -2014 EVALUATION FINDINGS: E3 BUREAU 28
Engagement with the host country government and institutions was also cited as a successful approach in evaluations related to the Economic Policy sector.
Somalia PEG: “Working with and through public sector authorities was a clear hallmark of PEG’s intervention strategy, whether this included working with the Ministry of Agriculture to draft the Seed Testing and Certification Policy in the agriculture sub-activity, working with the Somaliland Ministry of Livestock’s Veterinary Board to develop a standardized CAHW curriculum in the livestock sub-activity, or working with the Ministry of Livestock and Animal Husbandry (MoLAH) in Puntland to strengthen vertical market connections in the livestock sub-activity.” (Evaluation # 10)
Areas for Learning and Improvement
Thirteen out of the 14 evaluations in the Economic Policy sector addressed project challenges and failures. Although evaluations reported issues with sustainability, budget, and local resistance to some aspects of the projects, there was little consistency in the identified project failures. In fact, “failures” described in several projects under review were not actual failures at all, but rather enumerations of various challenges faced as different stages of the planning and implementing process and are reflected above in the lesson learned.
Three evaluations pointed to unrealistic or poorly-fitting performance metrics. Project length was a notable factor in the criticisms found in these evaluations, which interfered with both implementation and uptake.
Nepal NEAT: “The 2.5-year duration was too short. Many of the participants wanted a longer program more in line with the original 5-year program that was approved. Many farmers claimed they were just grasping how to implement learned skills when the program ended.” (Evaluation # 8)
Georgia EPI: “The broadly stated project objectives may have been too numerous, ambitious and vague, and the project performance indicators may have significantly influenced selection of project activities.” (Evaluation # 5)
Contextual factors, many of them unanticipated, were cited as interfering with successful project implementation for six of the projects. In particular, financial crises were blamed in three cases, and political conditions in host countries for two other cases.
Key Lessons Learned
Twelve out of the 14 Economic Policy sector evaluations provided information on lessons learned.
Major lessons learned for projects related to the Economic Policy sector in project design include the importance of a focused yet flexible project design, as well as ensuring that the duration of the project is sufficient to accomplish its goals.
BiH PARE: “The process of getting to the phase of rapid progress was relatively slow. The reasons for this included the Activity’s very broad contractual mandate - too broad, in our view - which initially diverted attention and resources from banking supervision to other objectives not covered in this evaluation.” (Evaluation # 2)
Nepal NEAT: “Throughout the evaluation process, beneficiaries and key stakeholders expressed the concern that the intervention was too short at 2.5 years. Many of the participants wanted a longer program more in line with the 5-year program that was originally planned.

SECTORAL SYNTHESIS OF 2013 -2014 EVALUATION FINDINGS: E3 BUREAU 29
Farmers stated that they were just beginning to understand the changes needed to improve their agricultural production when the program ended. More training classes and time were needed to ensure the successful adoption of these new methods and technologies.” (Evaluation # 8)
Ukraine FINREP: “It is important in this kind of project to ensure as far as possible that counterpart incentives are aligned with project goals, but this is not always possible and is furthermore subject to change over the life of the project. This argues for the flexibility to shift project priorities and counterparts. Aiding reform in a context of crisis and political volatility such as Ukraine requires not only flexibility, but also a streamlined project structure supporting quick response.” (Evaluation # 13)
In regards to project implementation, the 12 evaluations provided lessons learned around performance monitoring, drawing on examples of both good and poor practices. Where there were lessons learned about successful performance monitoring, these practices included linking indicators to meaningful outcomes, developing performance indicators to be monitored but not targeted, and the idea to include success stories in key results areas during routine reporting. Lessons learned also stemmed from the underuse or misuse of performance monitoring data such as monitoring gaps, lack of impact measurement, and an overemphasis on reaching targets to the detriment of effective programming.
Colombia MIDAS/ADAM: “There were unintended consequences from the use of a set of comprehensive indicators and the responsibility for meeting high targets. MIDAS and ADAM staff decision-making was distorted around reaching these targets on output-level indicators. Attention to higher-order results appears to have suffered as a result. Beneficiary individuals and associations, SMEs, operators and implementing partner staff felt the effects. The indicators with the highest profile (MIDAS jobs created, families benefited, and new hectares supported, for example) did not capture everything that mattered about the project, but they were so powerfully presented, and the targets so high, that they overshadowed other more nuanced data about the project’s accomplishments. Moreover, they provided a perverse incentive to the implementer to distort the achievement of impact-level goals in favor of easier, quicker wins but at a lower-order level of results.” (Evaluation # 3)
Serbia SLDP: “While one can argue that youth participation has been increased by the mere participation of youth in capacity development and networking activities, no tangible results attest to the effectiveness or the likely impact of these activities.” (Evaluation # 9)
In the Economic Policy sector, technical assistance and capacity building efforts that occur over a longer period of time were recommended by the evaluations as more effective. Longer engagement with beneficiaries through longer courses/trainings or via post-assistance follow-up to reinforce training and ensure built capacity was one approach to ensuring that sustainability.
Somalia PEG: “Both private and public sector entities need to have strong capacity to enable them to play their roles within the relevant market systems. Thus programs should allocate sufficient time and resources to develop local private and public sector capacities, including post assistance follow-up to increase the likelihood that any capacity and performance gains achieved are sustained.” (Evaluation # 10)
“The Evaluation Team identified some best practices from the BPC project, because of its potential scalability and transferability to other contexts or programs…The hirer and trainee work together to improve workforce production and real job opportunities according to market demands; leading to a sense of commitment among all parties involved.”
– Bolivia BPC, Evaluation # 1

SECTORAL SYNTHESIS OF 2013 -2014 EVALUATION FINDINGS: E3 BUREAU 30
Serbia SLDP: “The numerous studies and capacity building activities undertaken by the project are relevant; however, follow-up activities have been insufficient for ensuring sustainability and converting inputs/outputs into outcomes/impact.” (Evaluation # 9)
Successful training efforts highlighted in the evaluations include an on-the-job training model, interactive training sessions, intensive training workshops, and an approach that combines industry-specific with general transferable skills. Less successful were efforts that provided only education materials or that used non-interactive lectures.
Bolivia BPC: “This on-the-job training model aimed to create qualified employees for jobs that are available due to MSMEs expansion. The effect of increased productivity has forced additional demand for trained workers. It is a theoretical-practical training model on the workplace for a period of three months. The hirer and trainee work together to improve workforce production and real job opportunities according to market demands; leading to a sense of commitment among all parties involved.” (Evaluation # 1)
Nepal NEAT: “Findings from this evaluation show that it is not sufficient to provide local agricultural development officers with educational materials that were developed for use by at least some of the stakeholders. In addition, these local agricultural professionals should receive intensive training, possibly being included in farmers’ training workshops with the implementing partners, because these local agricultural professionals need to be able to continue the agricultural training of farmers in the future.” (Evaluation # 8)

SECTORAL SYNTHESIS OF 2013 -2014 EVALUATION FINDINGS: E3 BUREAU 31
TRADE AND REGULATORY REFORM EVALUATIONS
Summary of Evaluations
The Trade and Regulatory Reform office reviewed 9 performance evaluations, which are detailed in Annex B. Evaluations were widely distributed geographically, with three in Africa (Mozambique, regional), two in Asia (Bangladesh, regional), two in Europe and Eurasia (Azerbaijan, Serbia), and one each in the Middle East (Iraq) and Pakistan.
Evaluations related to the Trade and Regulatory Reform sector included four mid-term evaluations and five final evaluations.
The average evaluation report quality score for the 14 evaluations in the Trade and Regulatory Reform sector was 8.44 out of 10, almost a half point higher than the overall E3 Bureau average score of 7.97 for the same period of 2013 – 2014. This score is also a great improvement over the overall E3 sector evaluation average score of 5.84 from the previous period of 2009 – 2012.
Figure 24: Quality of Evaluation Report Score, Trade and Regulatory Reform
5.84
7.978.44
0
1
2
3
4
5
6
7
8
9
Average E3 Score2009 - 2012, all sectors
Average E3 Score, all sectors2013 - 2014
Average Office Score2013 - 2014
1
1
2
2
3
0 1 2 3 4
ME
AfPak
Asia
E&E
Africa
Figure 23: Number of Trade and Regulatory Reform Evaluations by Region
Trad
e and
Regulatory Reform

SECTORAL SYNTHESIS OF 2013 -2014 EVALUATION FINDINGS: E3 BUREAU 32
As compared to E3 evaluations as a whole, evaluations in the Trade and Regulatory Reform sector were more likely to address private sector engagement and project outcomes. They were less likely to include information on lessons learned or innovate practices.
Figure 25: Percent of Trade and Regulatory Reform Evaluations that Addressed Each Topic Area
84%
81%
66%
62%
44%
78%
74%
44%
78%
44%
100%
11%
78%
89%
0% 20% 40% 60% 80% 100%
Lessons Learned
Learning and Improvement
Governance
Private Sector Engagement
Innovative Practices
Performance Targets
Project Outcomes
Trade & Regulatory Reform (n = 9) E3 Average (n = 117)

SECTORAL SYNTHESIS OF 2013 -2014 EVALUATION FINDINGS: E3 BUREAU 33
Project Results
Seven of the nine evaluations in the Trade and Regulatory Reform sector addressed project performance results. In three cases, the projects met their performance targets overall. In four cases, the projects fell short of their targets, however one evaluation attributed a lack of process to the fact that indicators and targets had not been set until later in the project.
Eight of the nine evaluations related to the Trade and Regulatory Reform sector addressed outcomes related to the project. The outcomes described in the Trade and Regulatory Reform sector evaluations included increased economic security for three of the projects, and increased capacity for two others. Although not all of these could be directly attributed to the project, the E3 reviewers cited anecdotal reports and specific activities and outputs that suggested a causal relationship between their activities and the intended results.
Serbia BEP: “Interviewees acknowledged the project’s success in putting key issues on the agenda and in catalyzing behavioral or attitude change and subsequent action regarding key regulatory issues.” (Evaluation # 19)
Mozambique SPEED: “At the end of quarter three in 2013, a total 59 distinct policies have been amended, developed, or blocked due to SPEEDS involvement according to the PMP.” (Evaluation # 20)
APEC US TATF: “Representatives of APEC economies applied their newly acquired knowledge and skills in developing medium-term strategic plans and quality projects to inform national-level decisions for enabling complex reform measures and accrual of economic and social benefits.” (Evaluation # 18)
Innovative Practices
One evaluation provided a recommendation to focus on innovative high payout policies and practices to enhance regional economic integration in a responsible manner. No other innovative practices were addressed in the Trade and Regulatory Reform sector evaluations.
Gender Equality and Women’s Empowerment
The nine evaluations related to the Trade and Regulatory Reform sector generally showed strong performance in terms of gender measures. As with other sectors, the one notable area of weakness was that a relatively small percentage of evaluations disaggregated data at all levels (20 percent), though a strong majority did disaggregate at least some data (80 percent). A full 89 percent of evaluations included analysis of gender equality and/or female empowerment of outputs/outcomes, with the vast majority of these (88 percent) analyzing both outcomes and outputs. Sixty percent of evaluation explained project access or outcomes different for men and women where data were person focused and a full 100 percent of evaluation addressed whether projects were designed or implemented in ways that integrate gender equality and/or women’s empowerment.
Figure 26: Overall Achievement of Performance Targets (n = 9 evaluations)

SECTORAL SYNTHESIS OF 2013 -2014 EVALUATION FINDINGS: E3 BUREAU 34
Examples of the types of analysis of gender integration conducted in evaluations included:
Iraq Tijara: “MFIs Successfully Applied Equal Opportunity Practices for Issuing Loans to Both Genders. Tijara reported an increased number of female borrowers for the period 2008-2012. In 2008, female borrows made up 15% of the total number of active borrowers; by September 2012, this indicator had reached 23%.” (Evaluation # 19)
Bangladesh PRICE: “Consistent with the project indicators and answers about jobs creation in PRICE’s effectiveness survey questions, all stakeholders commented that the leather sector created jobs for women and that other sectors were not able to accomplish similar results.” (Evaluation # 16)
Pakistan PTP: “There is evidence that PTP has made small, but significant progress in supporting internships and employment for women under the Management and Mentorship Program. In other ways, however, PTP’s activities have had limited engagement with women and limited influence on the participation of women in trade activities. One reason for this is that the Women in Trade (WIT) Portal is not operational. Secondly, there is, as yet, no evidence (except for two case studies by PTP) that training women exporters in export processes, rules, and regulations has influenced their engagement in trade activities. However, this training is reported to be a useful tool for knowledge sharing.” (Evaluation # 21)
Evaluation Highlight: The Iraq Tijara evaluation explored the reasons for their success in increasing the number of female borrowers. “Forty loan officers stated that they encourage women to apply for loans, with some reporting that they preferred working with female borrowers. Having considered the social context, some MFIs have hired female loan officers to overcome cultural obstacles in working with women borrowers. In addition, they encourage female borrowers to spread the word about micro loan opportunities to other women. Another strategy is talking with husbands and other male household members and asking them to encourage their wives to apply for loans.” (Evaluation # 19)
The evaluations related to the Trade and Regulatory Reform sector also addressed whether gender was included in design and implementation of the projects being evaluated. In addition to successes, evaluations pointed out areas where further work was needed to successfully integrate gender equality and women’s empowerment in the future.
Serbia BEP: “Throughout its work, BEP attempted to ensure that the views of both men and women were heard, and that special attention was provided to women in business. The project cooperates with women associations (Serbian Chamber of Commerce’s Women-in-Business Group, Employer’s Association’s Women-in-Business Group, UN Women, Network of Women in Parliament, Etno Mreza, etc.).” (Evaluation # 19)
Mozambique SPEED: “The project, on a whole, only achieved 14% of female participation in trainings and capacity building programs, of a targeted 40%. However, more work can be done to tailor training and activities to men and women, which is currently not a focus of the project.

SECTORAL SYNTHESIS OF 2013 -2014 EVALUATION FINDINGS: E3 BUREAU 35
This will increase the likelihood and the level of meaningful positive gender impacts.” (Evaluation # 20)
Private Sector Engagement
All nine evaluations related to the Trade and Regulatory Reform sector addressed private sector engagement. Evaluations related trade hubs within the Trade and Regulatory Reform sector were heavily engaged with the private sector through establishing regional value chains and trade linkages.
Southern Africa Trade Hub: “The delivery of targeted technical assistance was expected to help the SADC region, including public sector, the private sector, and civil society organizations, to realize the advantages of greater regional and global trade linkages and export- oriented business development.” (Evaluation # 23)
Africa Trade Hub: “USAID’s Southern Africa Trade Competitiveness Project (TCP) … worked with the private sector to promote exports from key sectors of the Southern African economy to global markets. The project emphasized private-sector, market-led approaches to achieving export competitiveness and regional trade in agriculture, including food security.” (Evaluation # 17)
Serbia BEP: “The project’s approach to achieving reforms is to help GoS work closely with the private sector and outside experts to make reforms that improve business competitiveness...direct public and private sector beneficiaries praised the project on the effectiveness and efficiency of its methods, in part due to initial success with reduction of para-fiscal charges, and in part due to expectation of further successes in the numerous activities already in progress. In particular, BEP was praised for its achievement in bringing together key stakeholders and involving them in the reform process.” (Evaluation # 19)
Evaluation Photo 2: Site visit during the Africa Trade Hub evaluation (# 17)

SECTORAL SYNTHESIS OF 2013 -2014 EVALUATION FINDINGS: E3 BUREAU 36
Governance
Supporting improvements in governance was at the center of projects evaluated in the Trade and Regulatory Reform sector. For the five evaluations that addressed governance issues, methods of engagement varied but tended to focus on working with and through host country institutions to build capacity as well as pursuing policy reform.
APEC US TATF: “The TATF applies a two-pronged approach to supporting APEC, under category 2: incorporate a wide range of program areas, including but not limited to customs, standards and conformance, electronic commerce, business mobility, competition policy, regulatory reform, public sector management, corporate governance, economic and legal infrastructure, environment, and gender.” (Evaluation # 18)
Serbia BEP: “The Evaluation Team found that BEP is contributing to increasing GoS’ capacity in public finance management through its work in introducing methodology, coupled with provision of short-term expertise and training… More importantly, informed stakeholders have remarked upon
good progress and the Fiscal Council provides good quality oversight. Therefore, the Evaluation Team concluded that BEP’s success in increasing GoS’ capacity and transparency in public financial management has been moderate, with good prospects of higher achievement in the remaining period of project duration” (Evaluation # 19)
Mozambique SPEED: “The evaluation team finds that SPEED has adequately engaged with appropriate Mozambican government entities in relation to what have become their target sectors areas of focus. The key focus sectors for SPEED since 2010 have been: Trade and Investment; Agriculture; Tourism, Biodiversity and Natural Resources; Human Rights and Governance; Minerals.” (Evaluation # 20)
Areas for Learning and Improvement
All nine of the evaluations related to the Trade and Regulatory Reform sector identified areas for improvement and learning related to some degree of failure or problems with either the project design or up to implementation. Six of the nine evaluations identified problems with insufficient monitoring of outcomes or indicators. Challenges with external communications were pointed to in three of the nine cases, and lack of buy-in was also observed in three cases. Problems or failures related to sustainability concerns and budget issues were raised in two separate cases each.
Iraq Tijara: “Poor monitoring and reporting hindered the evaluation team from analyzing the effectiveness of the microfinance portal.” (Evaluation # 19)
Key challenges identified in Trade and Regulatory Reform evaluations included:
- Project monitoring - External communications - Stakeholder buy-in - Sustainability - Project timing
Evaluation Photo 3: A mango farmer in his orchard from Chapai Nawabgang, Bangladesh PRICE Evaluation # 16

SECTORAL SYNTHESIS OF 2013 -2014 EVALUATION FINDINGS: E3 BUREAU 37
Azerbaijan ACT: “Reporting formats and structures employed to track performance appeared to have no common thread linking one with the other in terms of recording actual results against plan over time.” (Evaluation # 15)
Challenges with external communications were pointed to in three of the nine cases, and lack of buy-in was also observed in three cases.
Iraq Tijara: “Poor monitoring and reporting hindered the evaluation team from analyzing the effectiveness of the microfinance portal.” (Evaluation # 19)
Pakistan PTP: “[There was a] lack of communications/coordination between the private sector, government officials at appropriate levels and government agencies.” (Evaluation # 21)
One particularly pointed comment pointed to a problematic intersection of timing and sustainability concerns.
Bangladesh PRICE: “The project was attempting to use a best practice approach to sustainability, and was shut down by an impatient Mission. It was forced to use a traditional approach that we know won’t work in the long-run.” (Evaluation # 16)
Key Lessons Learned
Six of the nine evaluations reviewed for the Trade and Regulatory Reform sector included lessons learned pertaining to stakeholder engagement. Five of these addressed local buy-in, and two dealt with modalities for engaging stakeholders.
Iraq Tijara: “Political support and local ownership should be secured at an early stage of a project to create a more stable microfinance ecosystem. This lesson is crucial and needs to be considered by both USAID and the project implementing partner.” (Evaluation # 19)
Mozambique SPEED: “Out of the non-beneficiaries, the majority had heard of SPEED but had not been contacted directly by SPEED. Several did feel they could benefit from support from SPEED, but did not know how to submit a request or didn’t know if they were even allowed to do so.” (Evaluation # 20)
The Trade and Regulatory Reform sector evaluations also provided lessons learned related to project size and scope. Four evaluations noted the link between a focused scope and the project’s effectiveness. Additionally, two evaluations addressed the value of cross-sectoral integration.
Serbia BEP: “…select activities with higher prospects of success would need to be completed with greater support during the implementation phase, and this would mean dropping or carefully limiting those activities that are less promising in order to increase the project’s effectiveness.” (Evaluation # 19)
Azerbaijan ACT: “One of the issues arising from this evaluation was the fact that there is no guarantee that by simply advising the GOAJ on the preparation of legislation and regulations, this support will necessarily lead to their implementation. In this respect, it may be more beneficial for USAID to employ a broader interpretation of business enabling environment rather than limit itself to working towards improving the legislative and/or regulatory framework of a host country.” (Evaluation # 15)
The value of and methods for information sharing was another key lesson learned. Two evaluations pointed out the need for coordination in order to avoid duplication of efforts between donors and the host country government. Two recommended making information sharing a more systematic effort.

SECTORAL SYNTHESIS OF 2013 -2014 EVALUATION FINDINGS: E3 BUREAU 38
Azerbaijan ACT: “Perhaps USAID might consider a more robust stance in SOWs regarding donor co-ordination to avoid duplication and to ensure that direct beneficiaries understand and appreciate the differences in assistance between USAID projects and others.” (Evaluation # 15)
APEC US TATF: “While TATF does actively push information to various stakeholders on their activities and on lessons learned in the course of carrying out studies and assessments many being project partners with whom TATF has had long-standing and repeat involvements there have been a number of missed opportunities to systematically put timely and more-targeted APEC-related information that might mobilize action into the hands of other potential beneficiaries.” (Evaluation # 18)
Iraq Tijara: “Increased focus on maintaining consistency of content between bilingual web sites is required to ensure greater transparency for all stakeholders.” (Evaluation # 19)
Understanding local capacity and the local context was a key lesson learned in the Trade and Regulatory Reform sector evaluations. Evaluations highlighted the need to identify reasonable targets and expectations that can be accomplished within the project timeframe.

SECTORAL SYNTHESIS OF 2013 -2014 EVALUATION FINDINGS: E3 BUREAU 39
PRIVATE CAPITAL MANAGEMENT EVALUATIONS
Summary of Evaluations
The Private Capital Management office reviewed three performance evaluations, which are detailed in Annex B. Two evaluations were conducted in Asia (India, Philippines) and one in the Middle East (Lebanon).
Evaluations related to the Private Capital Management sector included two ex-post and one midterm evaluation.
The average evaluation report quality score for the three evaluations in the Private Capital Management sector was 7 out of 10. This is slightly below the overall E3 average of 7.97 for the same period, but an increase from the E3 average score of 5.84 for the prior period of 2009 – 2012.
Figure 28: Quality of Evaluation Report Score, Private Capital Management
5.84
7.97
7.00
0
1
2
3
4
5
6
7
8
9
10
Average E3 Score2009 - 2012, all sectors
Average E3 Score, all sectors2013 - 2014
Average Office Score2013 - 2014
1
2
0 1 2 3
ME
Asia
Figure 27: Number of Private Capital Management Evaluations by Region
Private Cap
ital
Man
agement
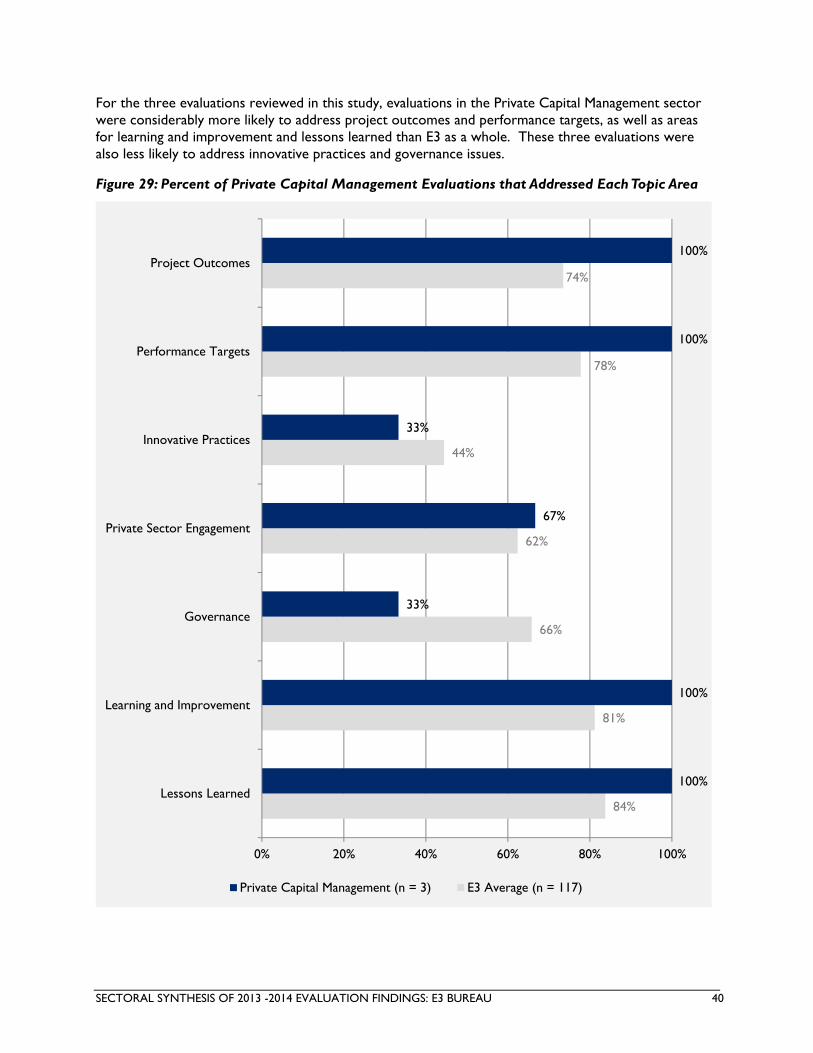
SECTORAL SYNTHESIS OF 2013 -2014 EVALUATION FINDINGS: E3 BUREAU 40
For the three evaluations reviewed in this study, evaluations in the Private Capital Management sector were considerably more likely to address project outcomes and performance targets, as well as areas for learning and improvement and lessons learned than E3 as a whole. These three evaluations were also less likely to address innovative practices and governance issues.
Figure 29: Percent of Private Capital Management Evaluations that Addressed Each Topic Area
84%
81%
66%
62%
44%
78%
74%
100%
100%
33%
67%
33%
100%
100%
0% 20% 40% 60% 80% 100%
Lessons Learned
Learning and Improvement
Governance
Private Sector Engagement
Innovative Practices
Performance Targets
Project Outcomes
Private Capital Management (n = 3) E3 Average (n = 117)

SECTORAL SYNTHESIS OF 2013 -2014 EVALUATION FINDINGS: E3 BUREAU 41
Project Results
All three Private Capital Management evaluations addressed project performance targets. Overall, one project exceeded its performance targets, with the other two falling short.
All three Private Capital Management evaluations addressed project outcomes. Two of those three cited increased capacity and sustainability of local partners and institutions as achieved outcomes. The third case noted potential for achieving outcomes, but as it was a mid-term evaluation additional time was needed to see if outcomes would be achieved.
The three evaluations also stated that the outcomes could be attributed to the project. However, supporting data directly attributing outcomes to the projects under review were limited. One case cited anecdotal data from beneficiaries but did not provide evidence. In the other two of the cases, the stated claims of attribution were unsupported, with no pre and post measures of change presented.
Innovative Practices
Two out of the three evaluations in Private Capital Management addressed innovation. In the area of innovative practices, one evaluation noted innovations related to market development and financing modalities.
Philippines MABS-4: “Banks were never given money or subsidies in the granting of loans which is different from governments providing loans at very low interest rates to on-lend to microfinance clients,” and, “Emphasis on cash flow rather than collateral based lending.” (Evaluation # 26)
In the case of the housing microfinance project in India, the evaluation did not specifically describe any innovations, however the E3 reviewer did point out that in terms of implementation there was a willingness to try something different, experiment, and adapt.
Gender Equality and Women’s Empowerment
The three evaluations reviewed under the Private Capital Management sector showed mixed performance in terms of their performance on gender measures. While all three included analysis of gender equality and/or female empowerment of outputs/outcomes, two of these focused only on outputs. Only one of the evaluations disaggregated data at all levels, though another did include some disaggregated data. Two of the evaluations reported on program access or outcomes differently for men and women. Only one of the evaluations showed evidence the project was designed or implemented in ways that integrate gender equality and/or women’s empowerment.
Figure 30: Overall Achievement of Performance Targets (n = 3 evaluations)

SECTORAL SYNTHESIS OF 2013 -2014 EVALUATION FINDINGS: E3 BUREAU 42
Types of analysis of gender integration in evaluation reports focused on the gender of the borrowers and the impact of their lives of participating in microfinance. Highlights include:
Lebanon LIM: “Women beneficiaries interviewed invariably reported that their income has increased as a result of their business loans… The women also discussed the non-financial impact that taking loans and running business activities had on their lives. Positive aspects include improved social lives as their business activities took them outside their home into the community on a regular basis. Several also described an enhanced sense of status in their families and communities as proud business owners as well as the ability to spend a small amount of their incomes on themselves. However, while most of the focus group participants’ experiences were positive, some also described negative aspects, including being overwhelmed in some cases with increased business-related workload on top of their already long days of household responsibilities and children, particularly where they were not receiving additional help from husbands or older children. One participant went as far as saying that she would stop her business activities if her family didn’t so badly need her income.” (Evaluation # 25)
Philippines MABS-4: “Most of the Bank AOs are predominantly male while loan clients are predominantly female. During the course of the FGDs among AOs, it was observed that they were predominantly male. This may be primarily due to the requirement of the job where the AOs need to be constantly out on fieldwork engaging clients and spending long hours under the heat of the sun. AOs are also required to collect loan amortizations, thus there are many times they carry large sums of money exposing them to possible robbery and harm. About 80 percent of those who avail of microenterprise loans are women but with their respective spouses acting as co-borrowers. ... This may be due to the fact that the men are normally out of the house and working. It is the women who are left in the house to look after the children thus it were the women that the loan officers would normally interact with whenever they do field visits. During the various FGDs with clients … the women said that they are the ones that decide how the loans will be spent. However, even if the men are not the principal borrowers, they act as co borrowers of their wives and they have the same responsibility when it comes to loan payments.” (Evaluation # 26)
One of the evaluations commented on the extent to which gender had been integrated into the program’s design, noting a lack of strategy:
Lebanon LIM: “Women were included among the poor, targeted beneficiaries (with youth and micro-scale start-ups) and remain underserved by LIM’s partners. LIM’s MFIs in some cases attempted to address their gender gap in outreach to women. While there is support for increased women’s participation among the MFIs, there are few established policies or activities beyond marketing and initial outreach to potential women beneficiaries in the communities. MFIs need to go beyond an equal participation opportunity approach and find innovative ways to specifically address the challenges of women’s participation, including identifying and addressing secondary impacts of their business activities as well as negative effects of additional work burdens.” (Evaluation # 25)
Private Sector Engagement
Two of the three projects evaluated under the Private Capital Management sector engaged the private sector. In the case of Philippines MABS-4 (Evaluation # 26), the project was designed the work with rural banks and the private sector. In the case of India HMF (Evaluation # 24), the development hypothesis of the project was that new business models are needed to drive scale and to connect financial and non-financial services in a manner that loans can be translated into meaningful housing solutions for the poor.

SECTORAL SYNTHESIS OF 2013 -2014 EVALUATION FINDINGS: E3 BUREAU 43
Governance
The Philippines MABS-4 (Evaluation # 26) provided an example of engaging with governance issues. In this case, the project supported dialogue between the Insurance Commission, insurance companies, and rural banks in order to support the development of insurance licensing procedures.
Areas for Learning and Improvement
Performance management was identified as an area of improvement. For example, one evaluation identified a reliance on indicators that do not facilitate identification or replication of success and another identified a lack of incentive to reach poor and high risk beneficiaries because of the structure of the sub-grant agreements.
India HMF: “Neither MFI partner reported on the cost recovery of the HMF product. Without consistent tracking, it is impossible for the project to know what kind of scale/pricing is required to make an HMF loan product profitable for an MFI"” (Evaluation # 24)
Lebanon LIM: “LIM's limited success in reaching poor and higher risk beneficiaries. Two primary challenges that LIM now faces are its potentially divergent focus and its reliance on indicators that do not sufficiently facilitate helping MFI's to reach the higher risk and poorer categories of beneficiaries who remain under-represented in the MFI portfolios… While some of the MFIs are making efforts to reach further down to the underserved, the terms of LIM's sub-grant agreements do not provide sufficiently strong incentives for the MFIs to find ways to reach deeper beyond their currently comfortable client demographics.” (Evaluation # 25)
One evaluation identified specific problems with the contracting mechanism that prevented achievement of targets.
India HMF: “It was clear from early reports that the project was falling behind target, and both MFI partners were having legitimate challenges in meeting their obligations. The structure of the agreements in retrospect had two important shortcomings: 1) it did not oblige the sub-awardees to ensure sufficient funding to roll-out the product within a specific period and 2) it did not permit either sub-awardee to be dropped or suspended from the project due to underperformance. ” (Evaluation # 24)
Key Lessons Learned
All three evaluations highlighted the need for market studies to generate products properly tailored to the clients and surrounding regulatory and economic contexts.
India HMF: “An environmental analysis (STEP analysis) should ideally be a part of the initial market study before setting up operations. Understanding the context (legal climate, regulation, previous history, culture, etc.) is primary before entering a new market.” (Evaluation # 24)
Philippines MABS-4: “The practices of piloting products and conducting market research should be institutionalized in order to have an idea of how products will be received / will perform.” (Evaluation # 26)
Lebanon LIM: “Lack of savings deprives poor clients of an essential tool for accumulating assets and building wealth. Role for LIM to promote value of savings and develop models that consider current Central Bank restrictions and advocate the adoption of best practices that foster an effective enabling environment for microfinance.” (Evaluation #25)

SECTORAL SYNTHESIS OF 2013 -2014 EVALUATION FINDINGS: E3 BUREAU 44
Pertaining to the theme of local capacity, two evaluations noted that the success of a microfinance project is highly dependent on the institutional capacity of the partner microfinance institution (MFI) itself.
India HMF: “The success of a pilot in a country with such high demand requires leadership and transformation throughout the MFI to get the product right and grow.” (Evaluation # 24)
Philippines MABS-4: Pressure to perform can lead to: deviation from credit procedures and policies, performance targets beyond staff's capabilities, weak monitoring from over-extended supervisors, poor evaluation procedures for repeat loans, high staff turnover.” (Evaluation # 26)
The three projects being evaluated in the Private Capital Management projects had a strong focus on technical assistance. All three providing training courses for banks that were conducted by third parties. One evaluation remarked that it would be beneficial for banks to develop their own internal trainings, tailored to their needs and internal processes.
Lebanon LIM: “It would be beneficial for the MFIs to develop their own training curricula and training capacity tailored for their policies and operations. LIM's Loan Officer Training has had a one-size-fits-all approach.” (Evaluation # 25)
In addition to support for lenders, technical assistance for borrowers with little knowledge of micro-finance was found to be of need as well. Technical visits to borrowers to help them estimate the correct loan amount proved a beneficial strategy in reducing diverted loans.
Lebanon LIM: “Lebanon's economic environment is too complex for new or inexperienced micro-entrepreneurs to easily establish successful businesses without technical assistance or training. This is a significant constraint to MFIs offering loans for start-up businesses or to youth or unemployed women who represent the greatest risk categories for lending.” (Evaluation # 25)
India HMF: “HMFTAC initiated the on-site construction technical visit to assess the construction technical considerations for the home improvement needs of the client. Research revealed that 90 percent of clients were unable to determine the correct loan amount on their own because they did not have the technical knowledge to estimate the costs. Technical visits
Evaluation Photo 4: Loan officers participate in a focus group during the Philippines MAPBs-4 evaluation (# 26)

SECTORAL SYNTHESIS OF 2013 -2014 EVALUATION FINDINGS: E3 BUREAU 45
were an important factor for helping clients with loan utilization. In cases where there was a time lag between the orientation and the disbursement, there was an increase in the number of diverted loans.” (Evaluation # 24)
Additionally, one evaluation highlighted emphasized the need to build upon past programs, use longer timeframes, and build good cooperation with stakeholders.
Philippines MABS-4: “This program appeared to successfully build upon past programs. Longer timeframes are often necessary to: address enabling environment issues; build effective dialogues between regulators, financial institutions and clients; and design and implement strong policy to achieve development objectives.” (Evaluation # 26)

SECTORAL SYNTHESIS OF 2013 -2014 EVALUATION FINDINGS: E3 BUREAU 46

SECTORAL SYNTHESIS OF 2013 -2014 EVALUATION FINDINGS: E3 BUREAU 47
DEVELOPMENT CREDIT EVALUATIONS
Summary of Evaluations
The Development Credit office reviewed one performance evaluation, which is detailed in Annex B. This mid-term evaluation was conducted in Africa (Mozambique).
The evaluation report quality score for this evaluation was 10 out of 10, which is above the E3 Bureau average for this period of 7.97.
Figure 31: Quality of Evaluation Report Score, Development Credit
Project Results
While it did not address project performance targets, the evaluation under review stated that outcomes could be attributed to the project. Outcomes included increased economic security/growth, improved coordination/cooperation, and increased capacity.
Mozambique DCA: “BOM has increased the level of engagement with development programs active it is area of reach (e.g. CLUSA {Promac/Agrifuturo}, INOVAGRO, TNS etc.) thus aiming to leverage its relationship with the farmers through the technical assistance provided by the programs.” (Evaluation # 27)
Innovative Practices
While the evaluation itself did not note any innovative practices, the E3 reviewer noted that the use of 50/50 risk sharing agreements used in this project is rare in the industry, as are co-guarantees offered by multiple development agencies. As such, these guarantees show innovation in Private Public Partnership access to financing programming.
5.84
7.97
10.00
0
1
2
3
4
5
6
7
8
9
10
Average E3 Score2009 - 2012, all sectors
Average E3 Score, all sectors2013 - 2014
Average Office Score2013 - 2014
Development Credit

SECTORAL SYNTHESIS OF 2013 -2014 EVALUATION FINDINGS: E3 BUREAU 48
Gender Equality and Women’s Empowerment
The one evaluation reviewed by Development Credit was strong on all gender measures. It analyzed both outputs and outcomes in terms of gender equality and/or female empowerment; it disaggregated data at all levels and it explained program access and outcomes for men and women differently. The evaluation also showed evidence that the project was designed and/or implemented in ways that integrate gender equality and/or women’s empowerment.
The evaluation analyzed the gender of borrowers and what women did with the funds they borrowed. One of the main evaluation questions/objectives was to see how bank lending affected men and women and could be improved to reach more women.
While the evaluation did a strong job of incorporating gender in its analysis, the findings related to the performance of women in the project were not positive, as described below.
Mozambique DCA: “The bank stated that although it seeks to have more women clients, the sociocultural practices of central and northern regions limits the number of women in the solidarity groups as they are not as active as desired.” (Evaluation # 27)
Mozambique DCA: “In Chókwé cases were discovered of women who had applied for the BT loans yet their husbands were the managers of the resource and the women actually reported not knowing the details of the use of the money. In Gurué BOM solidarity loan groups were mainly composed of men and when asked about women members they stated that women don’t feel ready to be part of a group and commit to the loan in Manica women were involved in poultry production and through women-only groups sought finance for the activities.” (Evaluation # 27)
Private Sector Engagement
The project covered under the one evaluation in the Development Credit sector worked with two banks to establish an enabling environment for small and micro enterprise development in the agricultural sector. While the banks have increased their agricultural products, the outcomes for the borrowers were mixed.
Mozambique DCA: “BOM reports having created 48 groups through which 644 farmers were financed through this agreement as they were primarily selected by African Century. The size of
Evaluation Photo 5: Focus Group Participants from the Mozambique DCA Evaluation (# 27)

SECTORAL SYNTHESIS OF 2013 -2014 EVALUATION FINDINGS: E3 BUREAU 49
the portfolio was 3.900.000Mt and the failure of this process resulted in only 64 percent repayment rate.” (Evaluation # 27)
Mozambique DCA: “BT also attempted to finance smallholders through an agreement it had with a rice producing company in Ch’kw’. Mia, the rice company, assumed 40 percent of the risk and through the DCA BT financed the smallholders. The poor management of the contract and the floorings…led to 93 of the 95 smallholders defaulting on their loans. These farmers…did not interact with the bank, the conditions of their loans were not clearly explained to them, in many cases they do not know for certain how much is owed to the bank and why because most delivered all their rice to Mia and never received any money for it.” (Evaluation # 27)
Governance
For Development Credit, the evaluation highlighted governance issues for civil society organizations. This evaluation noted that the associations and federations associated with this projected received training in good governance, including accounting and general loan management.
Areas for Learning and Improvement
This mid-term evaluation pointed to a need for better communication between USAID and the micro-lending institutions in order to ensure a full understanding of their responsibilities and relationship with the borrowers. Additionally, several issues related to reporting and data monitoring were cited, including a need to help them better understand the need for performance evaluation and demographic disaggregation. Other opportunities for diversification and expansion of micro-lending were also suggested as opportunities to build lender buy-in and engagement.
Key Lessons Learned
The evaluation indicates that the implementers, banks, and third parties involved were learning as they went, experimenting with new techniques, adjusting to failures and obstacles. The participating banks learned a great deal and emerged with good practices and expanded market shares.
However, during this learning phase, recurring mistakes and mismanagement on the part of the lenders resulted in serious economic consequences for borrowers such as damaged credit, default, and bankruptcy. The evaluation did not indicate if this could have been prevented or ameliorated through better design and management.
Mozambique DCA: “Both Banks benefited economically and financially from rendering their services to the agriculture segment under the DCA. BT has expanded its market share among commercial farmers and established itself as a bank which understands agriculture and offers suitable products for the sector.” (Evaluation # 27)
Mozambique DCA: “The poor management of the contract and the floorings which occurred in 2010 and 2013 led to 93 of the 95 smallholders defaulting on their loans. These farmers were surveyed under this evaluation and evidence shows that they did not interact with the bank, the conditions of their loans were not clearly explained to them, in many cases they do not know for certain how much is owed to the bank and why.” (Evaluation # 27)

SECTORAL SYNTHESIS OF 2013 -2014 EVALUATION FINDINGS: E3 BUREAU 50

SECTORAL SYNTHESIS OF 2013 -2014 EVALUATION FINDINGS: E3 BUREAU 51
EDUCATION EVALUATIONS
Summary of Evaluations
The Education office reviewed 42 evaluations, which are detailed in Annex B. This represents just over a third of all evaluations reviewed in this study, making it by far the most active sector within E3. Evaluations were widely distributed geographically, with 15 in Africa, 9 in Asia, 6 in Latin America and the Caribbean, 6 in Europe and Eurasia, 4 in Afghanistan/Pakistan, and 2 in the Middle East.
Evaluations related to the Education sector included 38 performance evaluations: 15 midterm, 19 final, and 1 ex-post. One impact evaluation was conducted. Additionally, two final evaluations and one ex-post evaluation included both performance and impact evaluation methodologies.
The average evaluation report quality score for the 42 evaluations in the Education sector was 8.17 out of 10, as compared to 7.97 for the E3 Bureau overall for the same period of 2013 – 2014. This shows strong improvement over the average E3 sector evaluation report score of 5.84 from the previous period of 2009 – 2012.
Figure 33: Quality of Evaluation Report Score, Education
5.84
7.97 8.17
0
1
2
3
4
5
6
7
8
9
10
Average E3 Score2009 - 2012, all sectors
Average E3 Score, all sectors2013 - 2014
Average Office Score2013 - 2014
2
4
6
6
9
15
0 2 4 6 8 10 12 14 16
ME
AfPak
E&E
LAC
Asia
Africa
Figure 32: Number of Education Evaluations by Region
Education
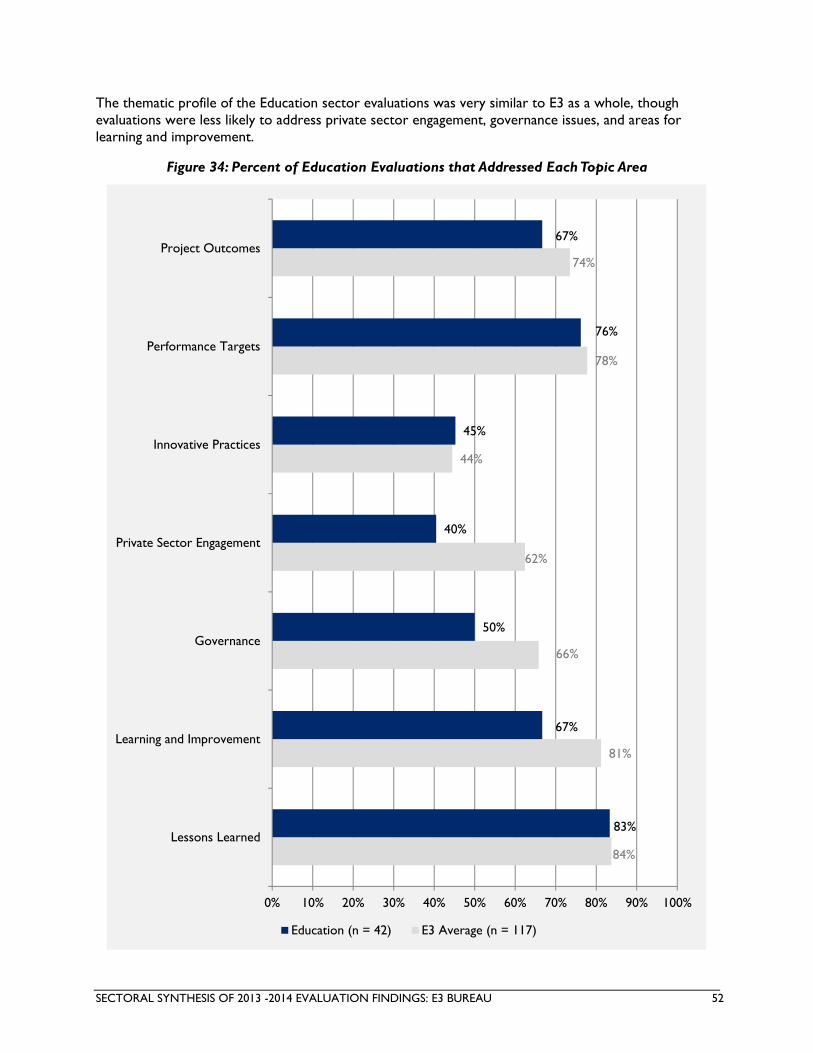
SECTORAL SYNTHESIS OF 2013 -2014 EVALUATION FINDINGS: E3 BUREAU 52
The thematic profile of the Education sector evaluations was very similar to E3 as a whole, though evaluations were less likely to address private sector engagement, governance issues, and areas for learning and improvement.
Figure 34: Percent of Education Evaluations that Addressed Each Topic Area
84%
81%
66%
62%
44%
78%
74%
83%
67%
50%
40%
45%
76%
67%
0% 10% 20% 30% 40% 50% 60% 70% 80% 90% 100%
Lessons Learned
Learning and Improvement
Governance
Private Sector Engagement
Innovative Practices
Performance Targets
Project Outcomes
Education (n = 42) E3 Average (n = 117)

SECTORAL SYNTHESIS OF 2013 -2014 EVALUATION FINDINGS: E3 BUREAU 53
Project Results
Thirty-two of the 42 evaluations related to the Education sector addressed project performance targets. In 13 cases, the project met its performance targets overall. In cases where the project had met its targets overall but not for every indicator, explanations included factors that were outside of the project’s manageable interest. In three cases, the projects exceeded their performance targets overall, though in one case the evaluation noted that the targets had been set at a moderate level and included primarily output indicators such as number of people trained that were easier to achieve.
In the nine cases where project were deemed to have fallen short of their performance targets overall, explanations included that the funding levels were insufficient to reach the targets and factors outside of the manageable interest of the project such as delays related to receiving approvals from the host country government and deteriorating security environments. In one case, the evaluation found that while targets may have been met, the project’s monitoring system was insufficient to document progress.
In six cases, project performance targets were addressed, but not enough information was contained in the evaluation to determine whether the project met, fell short, or exceeded its targets.
Increased capacity was the most common outcome from the programs reviewed in the Education evaluations, as observed in 15 of the 42 evaluations. Additionally, improved collaboration between communities, schools, and government institutions was reported in five of the evaluations. Four evaluations also cited improved educational outcomes as well, but no other clear trends emerged from the evaluations.
Somalia SYLI: “SYLI has made significant advances in infrastructure, training and capacity building, school management, community ownership, and support for women and girls.” (Evaluation # 65)
Vietnam HEEAP: “The success of HEEAP in advancing cutting-edge instruction, providing a relevant and up-to-date curriculum, improving undergraduate learning outcomes, and garnering institutional support for such reforms.” (Evaluation # 68)
Ukraine USETI: “The respondents saw, as a key outcome of this process, the benefits brought by the USETI project in terms of strengthening government commitment through providing the Ministry access to this debate, on a more neutral and open basis than had traditionally been the case in relations in the higher-education sphere.” (Evaluation # 68)
The most common approach to outcomes attribution that was observed in the evaluations was a conflation of outputs and outcomes – in nine cases successful achievement of targets was presented as evidence of outcome attainment.
Figure 35: Overall Achievement of Performance Targets (n = 42 evaluations)

SECTORAL SYNTHESIS OF 2013 -2014 EVALUATION FINDINGS: E3 BUREAU 54
Indonesia University Partnership 3-4: “Outcomes thus far largely involve TPC participant counts rather than participant impacts.” (Evaluation # 41)
Six of the evaluations cited pre and post measures of change to demonstrate a linkage between project outputs to their outcomes, and six of them relied on accounts from stakeholders, interviewees and focus group participants. In five of the cases, the attribution for outcomes attainment was stated as a given, but no justification was provided.
Ghana TAP: “The Evaluation involved six sampled districts; the results suggest that TAP schools demonstrated high rates of enrollment across all the districts, whereas non-TAP schools showed similar enrollment trends across only three districts.” (Evaluation # 38)
Kenya YYC: “YYC was reported to have played a positive role in developing governance skills and leadership, and increasing political engagement of bunge youth. Among stakeholders, the program was reported to have succeeded in voter registration and mobilization, national identity card registration and provision of civic education.” (Evaluation # 47)
Thirty two of the 42 evaluations related to the Education sector addressed project performance targets. In 13 cases, the project met its performance targets overall. In cases where the project had met its targets overall but not for every indicator, explanations included factors that were outside of the project’s manageable interest. In three cases, the projects exceeded their performance targets overall, though in one case the evaluation noted that the targets had been set at a moderate level and included primarily output indicators such as number of people trained that were easier to achieve.
In the nine cases where project were deemed to have fallen short of their performance targets overall, explanations included that the funding levels were insufficient to reach the targets and factors outside of the manageable interest of the project such as delays related to receiving approvals from the host country government and deteriorating security environments. In one case, the evaluation found that while targets may have been met, the project’s monitoring system was insufficient to document progress.
In six cases, project performance targets were addressed, but not enough information was contained in the evaluation to determine whether the project met, fell short, or exceeded its targets.
Evaluation Photo 6: Evaluators meet with program beneficiaries during the Indonesia University Partnership evaluation (# 41)
SECTORAL SYNTHESIS OF 2013 -2014 EVALUATION FINDINGS: E3 BUREAU 55
Innovative Practices
Innovation in the Education sector was addressed in 19 evaluations. These innovative practices took many different forms, including both new ideas and applying approaches or technologies in a new setting. One frequently addressed theme was innovation pertaining to education service delivery in terms of educational activities and teaching methods. Evaluations also provided examples of innovative approached to education administration.
Nicaragua Alliances 2: “Innovative approaches include the establishment of classrooms with many visual aids and reading materials, and daily reading sessions of 20-30 minutes. (…) The teachers interviewed mentioned the techniques of Significant Expressions, Sing and Tell, and reading aloud to stimulate (…)The use of the XOs facilitates learning in an entertaining way, stimulating autonomy and the cooperation between teachers and children. The programs have promoted creativity.” (Evaluation # 58)
Cambodia IBEC: “By establishing fully equipped classrooms dedicated to a particular subject (e.g., Geography, Science, Math, etc.) that require students to move from classroom to classroom, the project has made it much easier for teachers to easily access teaching and learning aids for their instruction. This institutional change in how schools work is spreading to other provinces and projects and deserves mention in the project’s evaluation record.” (Evaluation # 33)
One evaluation highlighted an innovative practice of using stakeholder engagement to select intervention schools.
Cambodia IBEC: “IBEC departed from the usual practice in development projects of basing school selection solely on criteria of need. The project also considered motivational factors and habits of risk-taking as additional key criteria in school selection. The project reasoned that schools that are averse to risk-taking behavior or who have no interest in participating in a development project focusing on innovation would mute the effectiveness of development aid.” (Evaluation # 33)
Another evaluation noted the incorporation of income generating activities into the education program.
Ethiopia SCOPSO: “At the school level, SCOPSO included school incentive awards to initiate school-based income generating activities to finance programs for orphaned and vulnerable children.” (Evaluation # 33)
Several evaluations noted the creation of new organizations and institutions to support the education sector as innovations in the project’s specific context.
Ukraine USETI: “USETI activities aimed to energize and strengthen civil society advocacy, oversight of admission testing in Ukraine, and to facilitate the creation of new channels of articulation for expressing individual and group views through innovative approaches that combined the following components: 1) establishing a first-ever Education, Law, Policy Expert Group (ELPEG) as an effective deliberation forum for all the strategic stakeholders involved in education reform; 2) creating a first-ever non-governmental organization (NGO) coalition
Innovations cited in Education sector evaluations included themes such as:
- Educational activities - Teaching methods - Education administration - Income generation - Creating new institutions - Gender considerations

SECTORAL SYNTHESIS OF 2013 -2014 EVALUATION FINDINGS: E3 BUREAU 56
empowered to carry out independent outside monitoring of test administration and university admissions process.” (Evaluation # 68)
There were at least three instances where the innovative practice addressed gender equality and women’s empowerment, including targeting of disadvantaged adolescent girls in Kenya (Evaluation # 48), overcoming gender inequalities in Nicaragua (Evaluation # 57), and multi-grade teaching in Benin (Evaluation #31).
Gender Equality and Women’s Empowerment
The 42 evaluations in the Education sector rated moderate to strong on gender measures. Gender equality and/or female empowerment of outputs/outcomes was analyzed on 64 percent of evaluations, and in 81 percent of these cases the analysis included both outputs and outcomes. In 58 percent of cases where data were person focused, it was disaggregated at all levels, and in 85 percent of cases, at least some data was disaggregated. Evaluation reports explain program access or outcomes differently for men and women where data were person focused in 58 percent of the evaluations. Evaluations showed evidence that education projects were designed or implemented in was that integrated gender equality and/or women’s empowerment 64 percent of the time.
Evaluations of education projects frequently analyzed the differential performance of projects in reaching boys and girls or men and women. Examples include:
Ghana TAP: “The evaluation study found that the TAP project has made significant progress toward increasing access and retention at the JHS level by narrowing the gender gap. TAP made particular impact on girls’ attitudes toward schooling and their ability to sustain participation at the JHS level, along with addressing the socio-economic barriers to their education.” (Evaluation # 38)
Afghanistan AWDP: “AWDP trained many more women than planned; in fact, according to January 2014 figures, women made up 35% of all participants, surpassing AWDP’s target of 25%. As job seekers, women were more successful than men (28% placement compared to 24% for men), while as employees women were less likely to secure raises (75% promotion compared to 86% for men).” (Evaluation # 28)
Vietnam HEEAP: “This achievement [of increasing participation of women to over 50% in some tracks] is noteworthy in that female engineers - whether graduates or undergraduates - make up fewer than 30% in any engineering specialty in Vietnam. The addition of electronics as a third eligible field, where more women are found, helped increase the number of women participants.” (Evaluation # 68)
Evaluations were able to identify a variety of ways the gender equality and women’s empowerment were integrated into the design and implementation of education projects. Examples include:
Somalia SYLI: “Infrastructure development has included work on latrines for female teachers and girls, either in terms of construction for schools that did not have latrines, a more preferred location (away from the main road or gate), within girl friendly spaces, supplying screens to block visibility of latrine entrances, or fencing around the school to restrict access from animals and intruders. The construction and rehabilitation of classrooms (173 in 30 schools) has contributed to decongesting classrooms and increasing enrollments, which also influenced the enrollment of girls.” (Evaluation # 65)
Djibouti AIDE: “Each component had a gender element built in. Specifically, that involved the development of a community mobilization strategy around addressing increasing access and retention of girls in primary and secondary school, and the provision of scholarships to alleviate
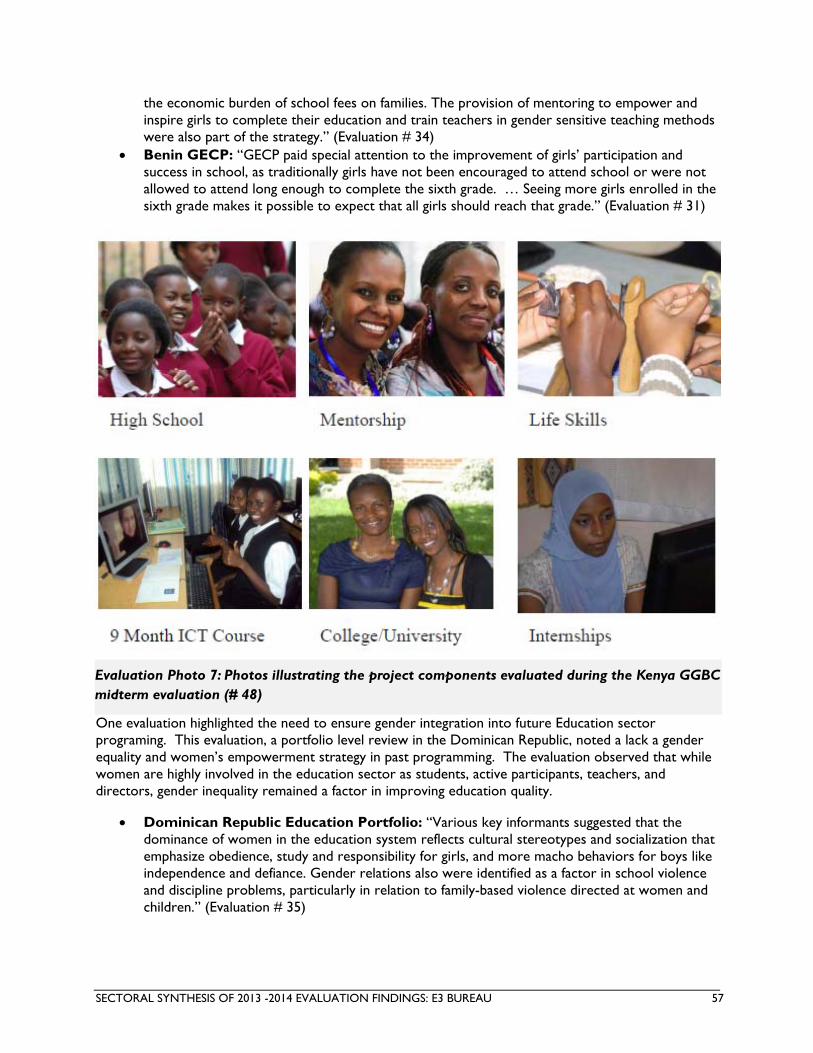
SECTORAL SYNTHESIS OF 2013 -2014 EVALUATION FINDINGS: E3 BUREAU 57
the economic burden of school fees on families. The provision of mentoring to empower and inspire girls to complete their education and train teachers in gender sensitive teaching methods were also part of the strategy.” (Evaluation # 34)
Benin GECP: “GECP paid special attention to the improvement of girls’ participation and success in school, as traditionally girls have not been encouraged to attend school or were not allowed to attend long enough to complete the sixth grade. … Seeing more girls enrolled in the sixth grade makes it possible to expect that all girls should reach that grade.” (Evaluation # 31)
One evaluation highlighted the need to ensure gender integration into future Education sector programing. This evaluation, a portfolio level review in the Dominican Republic, noted a lack a gender equality and women’s empowerment strategy in past programming. The evaluation observed that while women are highly involved in the education sector as students, active participants, teachers, and directors, gender inequality remained a factor in improving education quality.
Dominican Republic Education Portfolio: “Various key informants suggested that the dominance of women in the education system reflects cultural stereotypes and socialization that emphasize obedience, study and responsibility for girls, and more macho behaviors for boys like independence and defiance. Gender relations also were identified as a factor in school violence and discipline problems, particularly in relation to family-based violence directed at women and children.” (Evaluation # 35)
Evaluation Photo 7: Photos illustrating the project components evaluated during the Kenya GGBC midterm evaluation (# 48)

SECTORAL SYNTHESIS OF 2013 -2014 EVALUATION FINDINGS: E3 BUREAU 58
Private Sector Engagement
Private sector engagement in the evaluations related to the Education sector can be categorized primarily in three areas. The majority of evaluations addressed public-private partnerships (PPPs) and employment, and to a lesser extent included lending and also investment. There were no evaluations that indicated private sector engagement in the form of market development or local supply chains.
PPPs indicated private sector support of broad-based educational achievements such as in-kind donations and contributions to basic educational objectives. Employment opportunities were largely characterized as partnerships for vocational training, internships and professional development.
In addition, the ability to leverage private investments with program objectives was highlighted in several cases.
Nicaragua Alliances 2: “Under Alliances 2, RTI awarded sub-grants to six local NGOs … that committed to establishing partnerships with private-sector entities with the hope of raising counterpart funds equal to twice the amount provided by USAID…Through the efforts of EDUQUEMOS, seven partnerships have been established with NGOs, PVOs and CSOs to engage civil society with public and private sectors in promoting quality education.” (Evaluation # 58)
Vietnam HEEAP: “The GDA enabled the implementing partner to approach other companies to provide much-needed equipment to the target institutions, which otherwise would have required major additional funds. … The estimated value of all the partner contributions, as of 2013, reached $40 million, dwarfing USAID’s funding of several million dollars for HEEAP and VULII.” (Evaluation # 68)
Kenya GGBC: “KCDF fully matched the USAID grant by leveraging the private sector and utilizing subsidized public universities and government funded tertiary education loans to minimize costs. The program has leveraged approximately $4.5 million in assistance from private sector firms and individual sponsors through multi-year commitments to each girl and boy in the program.” (Evaluation # 48)
Two evaluations addressed both PPP and employment. The USETI project in Ukraine incorporated high levels of private sector engagement during the initial stages of project design and implementation and incorporated improving employment opportunities and leveraging PPPs to further the project’s objectives. In the case of the AWDP project in Afghanistan, the project provided grants to private sector training partners in technical and vocational education as well as business and employment skills training.
Ukraine USETI: “[A] strong core of committed employer organizations has made major contributions to the second goal (b) through their involvement in the development of draft laws on higher education. The evaluation concluded that these activities have ensured that dialogue between employer, education sector, and policy communities has been maintained and strengthened over the project’s implementation period and ensured that employer perspectives and concerns are factored in to the overall discussion of the development of the testing system and HE admissions.” (Evaluation # 67)
Afghanistan AWDP: “The goal of this capacity-building activity was to facilitate employment for job-seeking participants, or, for employed participants, to encourage their promotion through demand-driven training… as the grantees demonstrated a good understanding of the employment market, they were usually able to ensure that courses maintained a labor market focus.” (Evaluation # 28)

SECTORAL SYNTHESIS OF 2013 -2014 EVALUATION FINDINGS: E3 BUREAU 59
Governance
Half of the evaluations related to the Education sector address governance issues. Most examples of governance addressed working with or through host country institutions such as Ministries of Education. Project support included the development of teacher training colleges and resource centers, the development of education sector guidelines and management systems, partnering with the Ministries to provide monitoring services, and the development of Education Management Information Systems (EMIS).
Ghana PAGE: “As a result of PAGE activities, educational stakeholders have increased awareness of their roles and responsibilities, have a shared vision for improved school performance, and are collaborating in the monitoring and supervision of schools. The District Education Office Committee (DEOC) is now functional and visiting schools more regularly, the Circuit Supervisors (CS) have been resourced to do their work effectively, and School Management Committees/Parent Teacher Associations (SMC/PTA) are closely monitoring schools and assisting schools to solve challenges. Teacher attendance has improved as a result of increased monitoring, supervision, and accountability.” (Evaluation # 39)
Macedonia IIEP: “Given IIEP’s ambitious aim to work in all primary and secondary schools across Macedonia, a critical foundation to IIEP’s success was securing the buy-in of Macedonia’s four main education institutions. ... Each education institution involved has a clearly defined role in the process: MoES is involved in the selection of Master Trainers; SEI prepares qualitative indicators for schools; and BDE reviews the schools’ annual curricula. Each institution also
Evaluation Photo 8: Students complete a math and science test as part of the Tanzania BridgeIT project evaluation (# 66)

SECTORAL SYNTHESIS OF 2013 -2014 EVALUATION FINDINGS: E3 BUREAU 60
provides advisors to serve as Master Trainers to help train and mentor teachers involved in Component 2 on how to implement IIE activities.” (Evaluation # 39)
Evaluations in the Education sector also provided examples of how projects engaged with communities to provide oversight and strengthen governance systems.
Benin GECP: “GECP sought to improve community participation in the running of the school by teaching the principles of transparent and effective governance. Organizational capacity was quantitatively assessed twice a year using well-tested instruments that identified areas in need of improvement. Training involved topics such as running board elections, the content of the board’s roles, keeping records, developing a budget, etc.” (Evaluation # 31)
Nigeria NEI: “The evaluation team were informed, in interviews with key informants, that NEI project activities had produced positive impact on public sector human capacity that was being applied by government officials, actually resulting in improved budgeting priorities based on local needs.” (Evaluation # 31)
Senegal EdB: “In this respect, the efforts deployed by EdB project coordinators to guarantee, in all targeted middle schools, the emergence of CGE able to ensure students’, parents’, and community’s participation in a transparent management of establishments, is consistent with the stakes attached to the achievement of PDEF objectives.” (Evaluation # 64)
Areas for Learning and Improvement
Review of the education evaluations in question saw significantly more areas for leaning and improvement in relation to problems or failures that manifested during the implementation phase rather than at the design phase. Within the 42 evaluations, 15 were identified as having problems or failures related to the design, while implementation challenges were seen in 30 of the 42 cases.
In keeping with broader trends across E3, a lack of capacity was the most common issue related to failures and problems, with 13 of the 42 cases facing issues in this area. Examples include overextended teachers, inadequate facilities, deficient funding, and insufficient training for both teaching and management staff.
Vietnam KRBS: “School Management reported that they did not receive management training to support the transition process between EMW and GVN, nor had they been prepared for the completion of the KRBS Project and its final handover.” (Evaluation # 69)
Nicaragua Alliances 2: “[problems with assessment] were due in part due to the lack of an on-going health project specialist, problems with Juan XXIII management, and incipient capacity of health clinic personnel to prepare and submit reports.” (Evaluation # 58)
In eight cases, Education sector evaluations raised concerns over the targeting of the beneficiary populations. In particular, three of the eight were not successfully targeting students with special needs, and in two of the cases, communities from the lower socioeconomic strata were not being effectively targeted and served.
Kosovo BEP: “…some of these activities, especially Technicians Clubs, appear to effectively favor children from higher socio-economic families, that are already relatively privileged, that already have computers and other technology in their homes, and that have parents who teach and/or encourage them to use technology.” (Evaluation # 50)
“Teacher attendance has improved as a result of increased monitoring, supervision, and accountability.”
- Ghana PAGE, Evaluation # 39

SECTORAL SYNTHESIS OF 2013 -2014 EVALUATION FINDINGS: E3 BUREAU 61
Vietnam KRBS: “The [Evaluation] Team was unable to establish where the demand for the facilities and special activities targeting children with disabilities was established.” (Evaluation # 69)
Insufficient monitoring was also cited as a problem in eight cases, where weak documentation and unsystematic data collection interfered with or limited effective project management and oversight.
Cambodia IBEC: “The Project Indicators were activities and outputs and gave no actual indications of goal achievements. In addition several of the indicators were almost identical. The Result framework should follow a consistent and transparent design.” (Evaluation # 33)
Kyrgyzstan NAT: “After the project ended, the piecemeal, targeted funding did not entail rigorous oversight and feedback.” (Evaluation # 33)
Challenges related to with buy-in and engagement were not as common as in other E3 offices, but they were observed in seven of the 42 cases. In those instances, four evaluation cited problems with teacher buy-in and engagement, two identified shortcomings with local government buy-in, and one pointed to lack of administrative buy-in as causing difficulties.
Kosovo BEP: “…teachers must successfully undergo 100 hours of training over a five-year period to maintain their teaching license, setting aside the issue of qualifying for a promotion. Needless to say, this situation appears to be causing angst, disappointment and loss of morale among teachers.” (Evaluation # 50)
Liberia LTTP II: “…the current policy and management leadership at [Ministry of Environment] does not seem to support the pursuit of these priorities.” (Evaluation # 52)
Key Lessons Learned
Of the 42 Education sector evaluations, 35 provided sections or observations on lessons learned. Topics were wide ranging, including the size of the scope of work, project timing, individual and institutional stakeholder engagement, addressing systems, monitoring and evaluation, and teaching and training approaches.
Evaluations in the Education sector provided lessons learned surrounding the projects’ scopes of work. In some instances, the scope was too broad, given the allocated budget. In other instances, the evaluators recommended that the scope be broadened to make sure that impact occurred and was sustainable. Additionally, evaluations noted that in the case of large projects, care must be taken to ensure that project components are integrated with each other.
Djibouti AIDE: “Djibouti is a small country and the budget was relatively small at roughly $2M a year but the results indicate that the project was too broad and diffuse in nature and results and sustainability suffered some accordingly.” (Evaluation # 34)
Ukraine USETI: “USETI has benefitted in the past by placing its testing initiatives in a broad context, where influences from diverse sources can be identified and assessed for their impact on project objectives. Some key informants think that USETI’s future effectiveness will depend on adopting an even bigger picture: in effect, expanding its scope.” (Evaluation # 67)
Senegal EdB: “In conclusion, the EdB-USAID project is actually a hyper project, because each component can by itself constitute a project. The efficiency could have been increased if the synergy that has begun to emerge was built from the outset; in this respect, the unity between the different components should have been kept instead of separating them.” (Evaluation # 64)
Evaluations in the Education sector also offered lessons learned in regards to project timing. These evaluations provided examples of how delayed implementation has an impact on subsequent activities

SECTORAL SYNTHESIS OF 2013 -2014 EVALUATION FINDINGS: E3 BUREAU 62
and project success as well as how allowing participants to have time to adopt new practices has a positive impact on ultimate behavior change.
Jordan LETS: “The late introduction of the Results-Based Benchmark (RBB) and the project’s short timeframe (due to re-scoping) did not allow sufficient time to fully integrate the RBB assessment systems into schools.” (Evaluation # 46)
Jordan JSP: “It is important to recognize the time-factor as an integral component of the JSP. Key stakeholders and end beneficiaries need time to adopt, and adapt to all the new standards, practices and expectations that come with this project. Change occurs over time and the JSP has already provided the suitable climate for positive change to take place.” (Evaluation # 45)
Several evaluations note the correlation between individual stakeholder engagement, ownership, and buy-in with the project’s success.
Ghana TAP: “In schools/communities where the concept was well understood, it has helped clarify school development objectives and increased the participation of parents and children.” (Evaluation # 38)
Benin GECP: “The success of many development activities depends heavily on the enthusiastic and effective cooperation of government officials.” (Evaluation # 31)
Jordan JSP: “The sustainability of the JSP is directly correlated with the degree to which stakeholders and end users have a sense of ownership and belonging towards the New Schools and the Reconstructed Schools. This sense of ownership may be further enhanced by involving key stakeholders more actively, and by supporting end users to accommodate to the new environment.” (Evaluation # 45)
Evaluation Photo 9: School visit during the Tanzania BridgeIT project evaluation (# 66)
SECTORAL SYNTHESIS OF 2013 -2014 EVALUATION FINDINGS: E3 BUREAU 63
Evaluations in the education sector also addressed the importance of engagement at the organizational and institutional level. Key lessons learned include that engaging multiple organizations in a system increases the likelihood of the project’s sustainability and making sure that organizational engagement has well defined roles and responsibilities. One method of organizational engagement is through capacity building.
Nigeria NEI: “NEI should develop an institutional sustainability plan identifying a government team and community group structure that can operate sustainably to reform and improve the education sector after the NEI project has closed out.” (Evaluation # 59)
Jordan LETS: “USAID must systematically engage and adequately build the capacity of all relevant stakeholders required to institutionalize and sustain LE efforts. Capacity building of stakeholders, specifically the MoE and FD, should be designed according to their designated roles and responsibilities in LEI.” (Evaluation # 46)
Cambodia IBEC: “Another important observation that should be added to IBEC’s evaluation record relates to the high level of “buy-in” by [Ministry of Education] stakeholders at the highest levels, especially by the Director General of the Directorate of General Education who chaired IBEC’s oversight committee (known as the Consultative Group)...his support and advocacy for the project have been key to both its success and ability to leverage impacts.” (Evaluation # 33)
Two evaluations provided insight into individual motivation being the factor leading to success.
Kenya TEPD: “Some Teachers Training Colleges (TTCs) demonstrate more professional progress than others in adopting changes proposed by [the project]. This may be due in part to differences in levels of zeal with which key individuals have taken up the project and in the way that zeal has translated into policies and practices.” (Evaluation # 49)
Ethiopia SCOPSO: “Volunteerism is the other lesson the project taught. Where the life situation is generally pressing for teachers, it is difficult to thinks that projects of this kind would get someone who can voluntarily commit his/her time and energy for the project. This particular project has taught the possibility.” (Evaluation # 36)
Systems management refers to how different how organizations work together towards a common objective. This often related to the level of success that the project evaluated was able to integrate their programs within the objectives host country institutions.
Nepal EIG: “While FNCCI is well connected, EIG program learnt that they have not always been able to use their network of CCIs as expected.” (Evaluation # 56)
Ethiopia SCOPSO: “The geographic converge of the project is immense. However, it was possible to run it as a project due to the highly structured organization in place. Particularly the use of SCG (school core group) and focal coordinators for each service is an essential decision the project made. Therefore, similar big projects can learn from this.” (Evaluation # 36)
Evaluations in the Education sector provided lessons learned around results based monitoring and evaluation. In particular, performance monitoring and verification was pointed out as important in order to increase accountability. Additionally, the availability of quality data is important for designing programs and policies.
Nepal EIG: “EIGs field link and verification process was absolutely instrumental in ensuring compliance.” (Evaluation # 56)
Ghana PAGE: “To increase the quality and outcomes of [Circuit Supervisor (CS)] monitoring visits, best practices include CS monitoring work plans, CS monitoring checklists, CS review meetings, and provision of fuel allowances contingent on submission of CS monitoring reports.
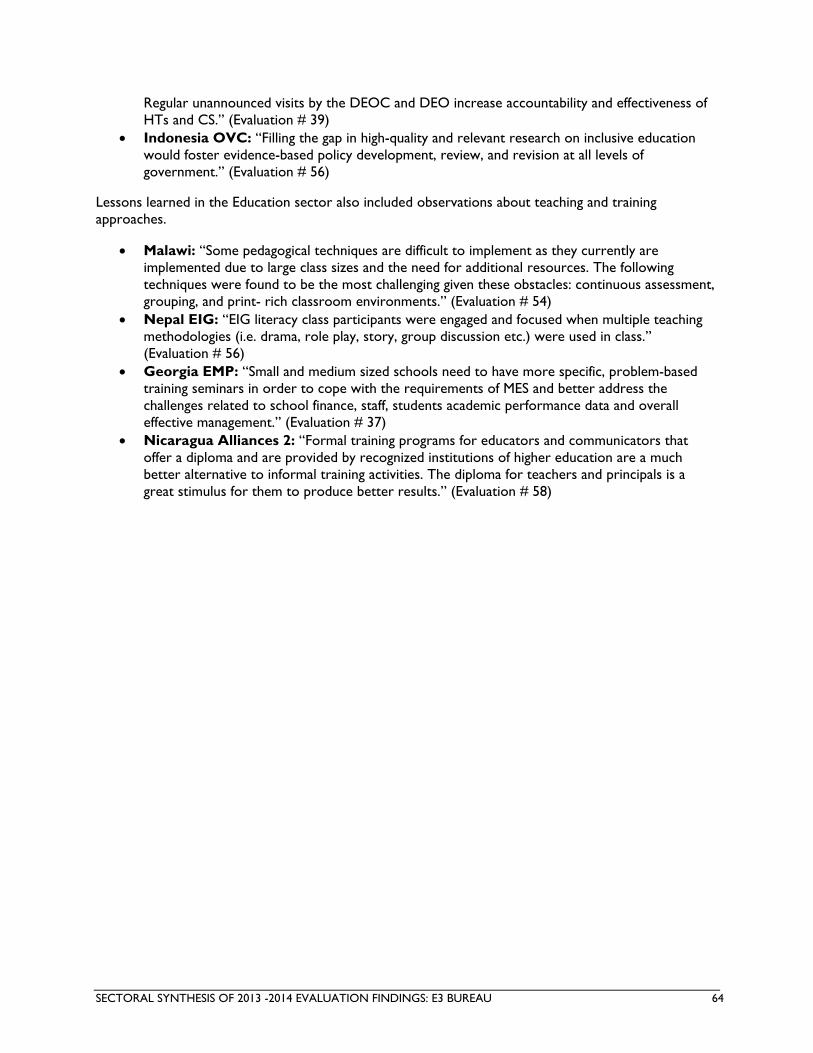
SECTORAL SYNTHESIS OF 2013 -2014 EVALUATION FINDINGS: E3 BUREAU 64
Regular unannounced visits by the DEOC and DEO increase accountability and effectiveness of HTs and CS.” (Evaluation # 39)
Indonesia OVC: “Filling the gap in high-quality and relevant research on inclusive education would foster evidence-based policy development, review, and revision at all levels of government.” (Evaluation # 56)
Lessons learned in the Education sector also included observations about teaching and training approaches.
Malawi: “Some pedagogical techniques are difficult to implement as they currently are implemented due to large class sizes and the need for additional resources. The following techniques were found to be the most challenging given these obstacles: continuous assessment, grouping, and print- rich classroom environments.” (Evaluation # 54)
Nepal EIG: “EIG literacy class participants were engaged and focused when multiple teaching methodologies (i.e. drama, role play, story, group discussion etc.) were used in class.” (Evaluation # 56)
Georgia EMP: “Small and medium sized schools need to have more specific, problem-based training seminars in order to cope with the requirements of MES and better address the challenges related to school finance, staff, students academic performance data and overall effective management.” (Evaluation # 37)
Nicaragua Alliances 2: “Formal training programs for educators and communicators that offer a diploma and are provided by recognized institutions of higher education are a much better alternative to informal training activities. The diploma for teachers and principals is a great stimulus for them to produce better results.” (Evaluation # 58)

SECTORAL SYNTHESIS OF 2013 -2014 EVALUATION FINDINGS: E3 BUREAU 65
FORESTRY AND BIODIVERSITY EVALUATIONS
Summary of Evaluations
The Forestry and Biodiversity office reviewed 17 performance evaluations, which are detailed in Annex B. Evaluations were widely distributed geographically, with six in Africa (Kenya, Malawi, Mozambique, Rwanda, Tanzania, regional), five in Latin America and the Caribbean (Bolivia, Ecuador, Nicaragua, Peru, Brazil), five in Asia (Bangladesh, Indonesia, regional), and one global evaluation6.
Evaluations related to the Forestry and Biodiversity sector included 6 mid-term, and 10 final, and 1 ex-post evaluation.
The average evaluation report quality score for the 17 evaluations in the Forestry and Biodiversity sector was 7.29 out of 10. While slightly below the E3 Bureau average for the same period, this score shows improvement over the E3 Bureau average for the prior period of 2009 – 2012.
Figure 37: Quality of Evaluation Report Score, Forestry and Biodiversity
6 Promoting Transformations by Linking Nature, Wealth and Power (TransLinks)
5.84
7.97
7.29
0
1
2
3
4
5
6
7
8
9
10
Average E3 Score2009 - 2012, all sectors
Average E3 Score, all sectors2013 - 2014
Average Office Score2013 - 2014
1
5
5
6
0 1 2 3 4 5 6 7
Global
Asia
LAC
Africa
Figure 36: Number of Forestry and Biodiversity Evaluations by Region
Forestry and
Biodiversity

SECTORAL SYNTHESIS OF 2013 -2014 EVALUATION FINDINGS: E3 BUREAU 66
As compared to E3 as a whole, evaluations in the Forestry and Biodiversity sector were more likely to address governance issues as well as areas for learning and improvement and lessons learned. They were also more likely to report on innovative practices.
Figure 38: Percent of Forestry and Biodiversity Evaluations that Addressed Each Topic Area
84%
81%
66%
62%
44%
78%
74%
94%
94%
88%
65%
59%
88%
76%
0% 10% 20% 30% 40% 50% 60% 70% 80% 90% 100%
Lessons Learned
Learning and Improvement
Governance
Private Sector Engagement
Innovative Practices
Performance Targets
Project Outcomes
Forestry & Biodiversity (n = 17) E3 Average (n = 117)

SECTORAL SYNTHESIS OF 2013 -2014 EVALUATION FINDINGS: E3 BUREAU 67
Project Results
Fifteen of the 17 evaluations related to Forestry and Biodiversity addressed project performance targets. In six cases, the project met its performance targets on the whole. Two projects exceed and two projects fell short of their targets. One evaluation for which the project did not meet its overall targets noted that the performance targets were linked to milestones which had not been given deadlines. As this was a midterm evaluation, no conclusions could be drawn from the project not yet meeting its targets. Five evaluations discussed performance targets but did not include sufficient information for the E3 reviewer to conclude whether or not the targets had been met. In two of these cases, the evaluations pointed to a lack of sufficient monitoring and evaluation to be able to evaluate performance.
Thirteen out of the 17 evaluations related to Forestry and Biodiversity addressed project outcomes, with 8 of those attributing the outcomes to the project. Of the 13 cases where outcomes were achieved, 5 cited increased or improved collaboration among stakeholders, 4 mentioned improved economic growth/security, 4 referenced cases of policy change, and 4 made reference to environmental improvement in general.
Bangladesh IPAC: “IPAC can be particularly credited with what one observer called an ‘unprecedented level of coordination’ with the three departments, helping them break out of their management silos and work together on biodiversity conservation issues.” (Evaluation # 70)
Bolivia Amazon: “Support for ecotourism activities has significantly improved income levels of the operating companies and communities.” (Evaluation # 71)
Peru USFS/PFSI: “USFS/PFSI’s counterparts have made significant progress completing Peru’s complex reforms of the forestry sector, as highlighted by the Ministry of Agriculture’s approval and publishing of the first National Forestry and Wildlife Policy; the approval and publishing of the first public draft of the National Forest and Wildlife Law regulations; the design and implementation of a web-based public participation input system; and the creation of SERFOR.” (Evaluation # 80)
Although some evaluations may have conflated outputs with outcomes, in the case of environmental improvement, the two may be more difficult to separate than in other sectors. For example, successful establishment of a protected area can be viewed as an output, but it can also be regarded as an outcome of environmental improvement as well.
Innovative Practices
Evaluations related to the Forestry and Biodiversity sector often characterized the level and type of coordination between actors as innovative or unprecedented in the country of region’s specific context. This is sometimes related to shared governance or management of a project, and other times referred to the establishment of a new body that would coordinate between disparate actors. Engagement of
Figure 39: Overall Achievement of Performance Targets (n = 17 evaluations)

SECTORAL SYNTHESIS OF 2013 -2014 EVALUATION FINDINGS: E3 BUREAU 68
local stakeholders using new approaches was also reported as an innovative practice. Innovation in funding mechanisms was also noted.
Bangladesh IPAC: “I IPAC can be credited with an unprecedented level of coordination– with the three departments, helping them to break out of their management silos and work together on biodiversity conservation issues.” (Evaluation # 70)
Ecuador SFC: “Another key innovation supported by the project is the participatory monitoring of crabs, which increased the state’s capacity to gather information and allowed an inclusive approach in terms of analysis and dissemination of monitoring results.” (Evaluation # 72)
Rwanda Nyungwe: “An innovative program using a comedy show and national comedian that incorporates environmental messages.” (Evaluation # 82)
The innovative practices addressed in the Forestry and Biodiversity sector evaluations tended to relate more closely to the second and third stages of innovation: testing/positioning for scale and transitioning to scale.
TransLink: “While many would consider the thematic explorations of Translinks to be innovative (e.g. carbon credits, PES), the focus has not been on innovation so much as it has been on showing how PES can be implemented in practice.” (Evaluation # 85)
Evaluations also identify innovation in natural resource management practices, several of which deal with financing modalities.
Ecuador SFC: “Another example is the project Sembrar agua (To plant water) in the Galera-San Francisco site which seeks to provide a stable supply of irrigation water through a combination of conservation measures in micro-watersheds. Other examples include the creation of water collection pools.” (Evaluation # 72)
Kenya LWF: “The Gathiuru and Shamanek CFAs have developed innovative ways of generating benefits from the Plantation Establishment and Livelihood Improvement Scheme (PELIS) and from investments on their farms in woodlots and agroforestry…Linking bee keeping to forest conservation, especially in the riparian areas, and minimizing the use of pesticides/herbicides and preventing deforestation and forest fires.” (Evaluation # 75)
There were a few instances of product innovations, primarily in ICT. These included the application of new technology in the traceability of forestry products, use of the MIST software program, Happy Fish mobile platform for data collection. Outside of ICT, the use of fuel efficient woodstoves was mentioned as innovative in applying the technology to new contexts.
Gender Equality and Women’s Empowerment
The 17 evaluations reviewed in the Forestry and Biodiversity sector were mixed in terms of their performance on gender measures. Just over half (53 percent) analyzed the gender aspects of outputs and/or outcomes, and two-thirds of these focused only on outputs. Only 23 percent disaggregated data at all levels, though 69 percent provided at least some disaggregated data. One area where the evaluations did well was in reporting on program access and outcomes differently for men and women where data were person focused with 69 percent doing so. Just over half (53 percent) of the evaluations showed evidence that the underlying project was designed or implemented in ways that integrated gender equality and/or women’s empowerment.
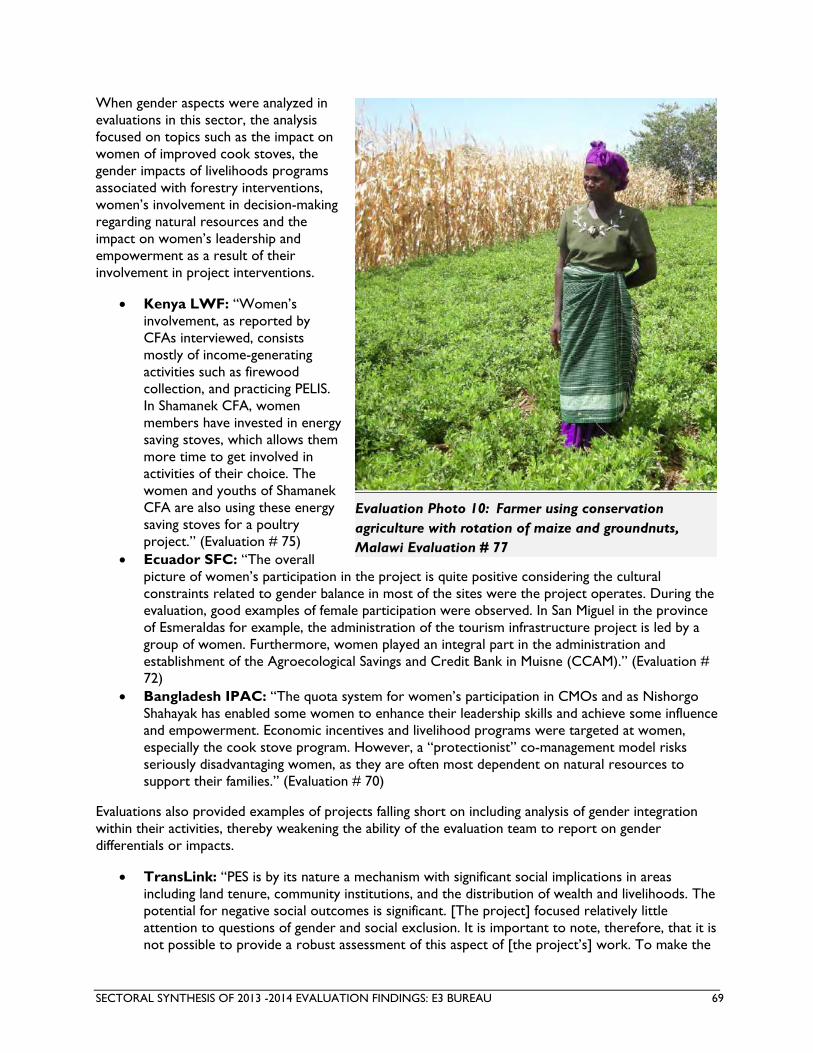
SECTORAL SYNTHESIS OF 2013 -2014 EVALUATION FINDINGS: E3 BUREAU 69
When gender aspects were analyzed in evaluations in this sector, the analysis focused on topics such as the impact on women of improved cook stoves, the gender impacts of livelihoods programs associated with forestry interventions, women’s involvement in decision-making regarding natural resources and the impact on women’s leadership and empowerment as a result of their involvement in project interventions.
Kenya LWF: “Women’s involvement, as reported by CFAs interviewed, consists mostly of income-generating activities such as firewood collection, and practicing PELIS. In Shamanek CFA, women members have invested in energy saving stoves, which allows them more time to get involved in activities of their choice. The women and youths of Shamanek CFA are also using these energy saving stoves for a poultry project.” (Evaluation # 75)
Ecuador SFC: “The overall picture of women’s participation in the project is quite positive considering the cultural constraints related to gender balance in most of the sites were the project operates. During the evaluation, good examples of female participation were observed. In San Miguel in the province of Esmeraldas for example, the administration of the tourism infrastructure project is led by a group of women. Furthermore, women played an integral part in the administration and establishment of the Agroecological Savings and Credit Bank in Muisne (CCAM).” (Evaluation # 72)
Bangladesh IPAC: “The quota system for women’s participation in CMOs and as Nishorgo Shahayak has enabled some women to enhance their leadership skills and achieve some influence and empowerment. Economic incentives and livelihood programs were targeted at women, especially the cook stove program. However, a “protectionist” co-management model risks seriously disadvantaging women, as they are often most dependent on natural resources to support their families.” (Evaluation # 70)
Evaluations also provided examples of projects falling short on including analysis of gender integration within their activities, thereby weakening the ability of the evaluation team to report on gender differentials or impacts.
TransLink: “PES is by its nature a mechanism with significant social implications in areas including land tenure, community institutions, and the distribution of wealth and livelihoods. The potential for negative social outcomes is significant. [The project] focused relatively little attention to questions of gender and social exclusion. It is important to note, therefore, that it is not possible to provide a robust assessment of this aspect of [the project’s] work. To make the
Evaluation Photo 10: Farmer using conservation agriculture with rotation of maize and groundnuts, Malawi Evaluation # 77
SECTORAL SYNTHESIS OF 2013 -2014 EVALUATION FINDINGS: E3 BUREAU 70
point, neither of two forest carbon case studies in Madagascar and Nepal make any mention of gender and neither analyzes how forest use rights are distributed among the communities involved.” (Evaluation # 85)
Tanzania WMA: “Women have certainly been included in all activities, particularly in local community development projects such as the fruit processing (all women) and honey production groups promoted in Ipole by [implementer]. However there have been no gender …impact analyses conducted, or at least none were made available to the evaluation team. There have been business plans and economic feasibility studies conducted in some WMAs, as in Wami-Mbiki, but these have not dealt with gender or youth issues, assuming that poverty reduction for all will be an inevitable outcome flowing down to local populations from outside investments. Gender audits or analyses of the roles of disadvantaged groups are needed so that differential impacts and other considerations can be taken into account when implementing activities.” (Evaluation # 83)
Ecuador SFC: “The only activity the project team implemented to encourage female participation was the planning of workshops or training activities at a time where women could have the possibility to participate without compromising their daily obligations. Of the 3,657 people trained by the project in natural resource management, 802 were women. However, no information was available on how effective this training of women has been. The project has only generated two isolated case studies concerning the successful inclusion of women in the project. These case studies do not provide reliable information on the project´s overall performance regarding gender issues.” (Evaluation # 72)
A number of evaluations in the Forestry and Biodiversity sector provided examples of how gender equality and women’s empowerment were integrated into project design and implementation.
Nicaragua CSTP: “There is a preponderance of women participants in the program. This is due to two factors: the first is that the tourism sector involves economic activities that have a great deal of participation by women; the second is that the program also promoted the participation of women in its different activities.” (Evaluation # 79)
Indonesia FOREST: “YAGASU is linking mangrove restoration with the livelihood activities of crabbers that theoretically will strengthen the need of a healthy ecosystem. Women’s groups are planting mangrove trees and crabbing. The research facility for ecosystem monitoring is still under construction… YAGASU led project in Percut (Medan) showed how alternative livelihoods (mangrove crab) can be combined with gender mainstreaming (cooperative for women) and bring about environmental sustainability.” (Evaluation # 73)
Evaluations also pointed out missed opportunities for better integration of gender equality and women’s empowerment in project design and implementation.
Tanzania WMA: “Given the fact that wildlife conservation tends to be a male dominated sector the level of female representation in AA membership, although well short of equal, is a sign that gender has been a real concern in the development of the WMAs. However improved representation is just a first step in gender mainstreaming and the lack of gender audits or analyses and gender disaggregation in the 2004 “Indicators and Monitoring Plans for Wildlife Management Areas in Tanzania” indicate there is a greater need to focus on gender and disadvantaged groups as the next phase of WMA support unfolds.” (Evaluation # 83)
Bolivia Amazon: “Women have an essential role in the management of biodiversity resources in collecting forest products such as food, medicinal plants, wild fruits, and firewood. Community forestry and non-timber products are part of the knowledge of women, which a comprehensive forests and biodiversity management programs cannot ignore. However, there is no information showing that women were consulted regarding their priorities. It is prudent to

SECTORAL SYNTHESIS OF 2013 -2014 EVALUATION FINDINGS: E3 BUREAU 71
do so to know their priorities in their areas, since women depend on healthy forests more than any other stakeholder group.” (Evaluation # 71)
Ecuador SFC: “In light of cultural constraints where the role of women is most defined by managing the household and raising children and not by contributing to household income, the project did not design or implement specific measures to include women in project activities such as female project facilitators. The development of business models aimed at women or educational strategies to strengthen the position of women in community organizations was also absent. Although there was no contractual agreement to do so, it would have been beneficial to consider and implement such measures.” (Evaluation # 72)
Private Sector Engagement
From the evaluation survey responses, the most frequent type of engagement with the private sector was through the tourism and resort industries. Because of the nature of the Forestry & Biodiversity programming evaluated, the private sector plays a significant role in both sustaining and depleting natural resources, such as protected wildlife species and forests, National Parks and coral reefs, all of which are significant sources of tourism appeal. Two such responses cited the role of the private sector in protecting endangered species and cutting demand for illegal logging, for example. To a lesser extent, supporting natural resource management for the purpose of livelihood protection (such as fisheries) was important for promoting local supply chains and market linkages. The need for banking and investment was again tied to the tourism industry, as one response noted the need for basic tourism infrastructure in order to attract investors.
Mozambique: “the project’s first initiative to attract investors was to design a Master Plan. Zones of Tourism Interest (ZTIs)… Most ZTIs are not attractive to investors, due in part to the need to compensate and resettle the occupants of the land. Most landholders have limited financial capacity to invest in tourism infrastructure. In addition, ZTIs are often unattractive because they lack basic infrastructure (roads, water, electricity, sewage management infrastructure); also, the airports in northern Mozambique are generally too small to receive international flights.” (Evaluation # 78)
Kenya LWF: “The report mentions the role of private companies (large-scale farms) in the WRUAs, but they are treated more as internal factors than as integrated into the design. The private ranches that are a key part of the landscape and design are more properly considered to be a land-use designation rather than part of the private sector.” (Evaluation # 75)
Tanzania WMA: “Overall, AAs have to date not worked with the private sector sufficiently closely as a strategic partner, in a manner that would result in major improvements in the economic viability and performance of WMAs. More often than not, the private sector has had to contend with government and AA bureaucracy, and sometimes justified suspicion and malpractices in their business dealings with WMAs. While effective partnerships exist, and some WMAs are now benefiting substantially from revenues generated by the private sector, much can be done to improve how WMAs can optimally benefit from and partner with the right private sector partners.” (Evaluation # 83)
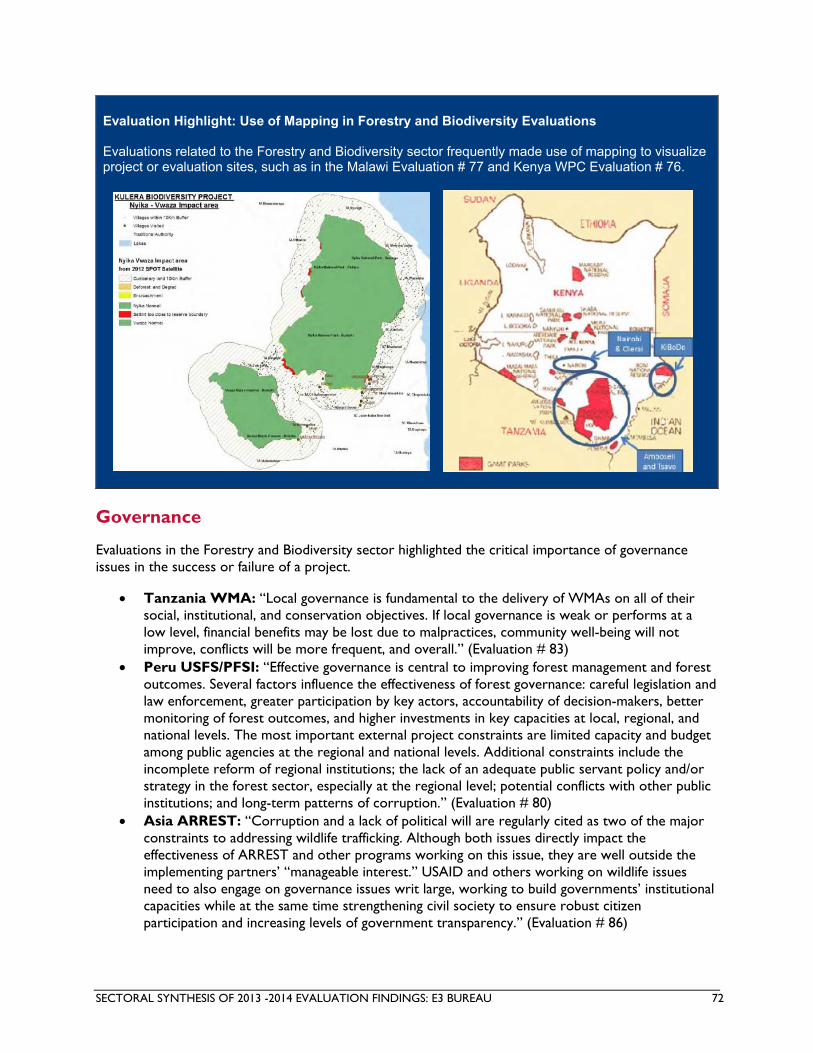
SECTORAL SYNTHESIS OF 2013 -2014 EVALUATION FINDINGS: E3 BUREAU 72
Evaluation Highlight: Use of Mapping in Forestry and Biodiversity Evaluations Evaluations related to the Forestry and Biodiversity sector frequently made use of mapping to visualize project or evaluation sites, such as in the Malawi Evaluation # 77 and Kenya WPC Evaluation # 76.
Governance
Evaluations in the Forestry and Biodiversity sector highlighted the critical importance of governance issues in the success or failure of a project.
Tanzania WMA: “Local governance is fundamental to the delivery of WMAs on all of their social, institutional, and conservation objectives. If local governance is weak or performs at a low level, financial benefits may be lost due to malpractices, community well-being will not improve, conflicts will be more frequent, and overall.” (Evaluation # 83)
Peru USFS/PFSI: “Effective governance is central to improving forest management and forest outcomes. Several factors influence the effectiveness of forest governance: careful legislation and law enforcement, greater participation by key actors, accountability of decision-makers, better monitoring of forest outcomes, and higher investments in key capacities at local, regional, and national levels. The most important external project constraints are limited capacity and budget among public agencies at the regional and national levels. Additional constraints include the incomplete reform of regional institutions; the lack of an adequate public servant policy and/or strategy in the forest sector, especially at the regional level; potential conflicts with other public institutions; and long-term patterns of corruption.” (Evaluation # 80)
Asia ARREST: “Corruption and a lack of political will are regularly cited as two of the major constraints to addressing wildlife trafficking. Although both issues directly impact the effectiveness of ARREST and other programs working on this issue, they are well outside the implementing partners’ “manageable interest.” USAID and others working on wildlife issues need to also engage on governance issues writ large, working to build governments’ institutional capacities while at the same time strengthening civil society to ensure robust citizen participation and increasing levels of government transparency.” (Evaluation # 86)
SECTORAL SYNTHESIS OF 2013 -2014 EVALUATION FINDINGS: E3 BUREAU 73
Key outcomes of several Forestry and Biodiversity projects included successful policy reform and strengthening local institutions.
Ecuador SFC: “A number of institutional elements of the enabling environment were identified as having been achieved by the project (e.g. forestry law proposal, ordinances for municipal environmental management units.). The project was initially open to, but not explicitly aimed at providing support to national policy making.” (Evaluation # 72)
US Coral Triangle: “US CTI initiated forming and supporting regional and national platforms including the Interim Regional Secretariat (IRS), the NCCs and the TWGs and promoted awareness of the need for conservation of resources. Activities for the development and advancement of policies and frameworks as well as strengthening of institutional capacity and collaboration were mentioned by the national and government respondents, including the CTSP implementers, as an achievement worth highlighting in the US CTI program.” (Evaluation # 74)
Areas for Learning and Improvement
Sixteen out of the 17 Forestry and Biodiversity evaluations addressed challenges and failures, most frequently focusing on challenges and opportunities for alternative approaches.
Technical aspects of the program design and USAID compliance were also extensively addressed, including Participating Agency Program Agreement compliance, the construction of the Performance Management Plan, and integration into pre-established regional Plans of Action and Conservation Projects. For this reason, many of the issues that were noted as challenging or problematic were unavoidable, and simply had to be accommodated.
Sustainability was a problem for four of the evaluated programs, particularly due to the absence of capacity-building activities that could enable local populations to maintain program-related activities after the programs’ conclusions.
Nicaragua CSTP: “There was no closing event for the program in each area, for the program, partners and allies to discuss and analyze the next steps, following the conclusion of the program. Many allies stated that they expected something along these lines to help them think about future courses of action.” (Evaluation # 79)
Additionally, challenges arising from a lack of engagement with local stakeholders was cited in five of the Forestry and Biodiversity evaluations.
Bolivia Amazon: “No evidence of "effective participation" in development, let alone training for implementation could be perceived during visits and interviews to communities.” (Evaluation # 71)
Problems with the tracking of indicators and outcomes were a recurring theme identified in seven of the evaluations. These problems were primarily related to poorly defined indicators or a failure to link outputs to outcomes, and in one case the evaluator traced the indicator/outcome problem back to the absence of a Theory of Change.
Bangladesh IPAC: “In the pursuit of quantity of outputs, the quality of some outcomes has been compromised, and an effective and sustainable approach to CM has yet to be developed.” (Evaluation # 70)
Bolivia Amazon: “Significant problems were found in the definition of project indicators, the means of verification and the form of interpretation of indicators.” (Evaluation # 71)

SECTORAL SYNTHESIS OF 2013 -2014 EVALUATION FINDINGS: E3 BUREAU 74
Unrealistic service delivery expectations were also noted in five of the cases, either due to inadequate funds, overly ambitious delivery targets, or a need for higher USAID engagement than previously planned.
Key Lessons Learned
Evaluations in the Forestry and Biodiversity sector highlight the value of community ownership. The achievement of neighboring community buy-in was cited as critical to the success of these projects. Some projects provide technical assistance and training to neighboring communities to get them involved in park work. Other projects are of the opinion that in order for true community buy-in to be achieved, that implementers need to either provide or better educate the neighboring communities on the direct or indirect benefits to wildlife conservation.
Kenya LWF: “Ownership of or access to natural resources and knowledge of responsible use and good governance within communities are pre-conditions to success and sustainability. Building capacity to develop strong governance structures in community-based organizations (CBOs) is, therefore, important to the long-term development of natural resources in Laikipia County.” (Evaluation # 75)
Peru PNCAZ: “One way that CIMA has found to involve the neighboring communities is through progressive training in useful knowledge that targets residents of the buffer zone: the use of a compass and GPS devices, climate monitoring, data collection, etc. Through this training, neighboring communities learn to value the Park and its benefits while forming a favorable opinion about the work done in the Park.” (Evaluation # 81)
There are a wide variety of stakeholders involved in forestry and biodiversity work. Evaluations extolled the benefits of developing knowledge exchange networks between stakeholders of all levels, at the local-level, among industries, at the provincial- or territorial-level, and even between countries.
US Coral Triangle: “…findings also suggest that coastal and marine issues such as those addressed by the US CTI (which are mostly national and local) are largely common to most CT6 countries and that there could be benefits to a program of on-the-ground action supported by information and technical exchange between and among countries.” (Evaluation # 74)
Nicaragua CSTP: “The use of ICT, including the Internet and social networks, cannot be absent from programs that support rural tourism development. These tools not only facilitate the operation of the enterprises, but also facilitate electronic development, promotion and sales. Moreover, they improve communication and coordination among cluster participants for the development of tourism products, shared promotion and marketing and development of training activities and exchange of experiences.” (Evaluation # 79)
Bolivia Amazon: “To promote the adoption of a holistic approach in the areas where the project works, the project should work with all actors present in the area, focusing on the actors that exert greater pressure on the forest and biodiversity. The project should support or create local comprehensive management platforms to promote exchanges between different interest groups that exist in the territories prioritized by the project.” (Evaluation # 71)
The Forestry and Biodiversity evaluations also provided lessons learned surrounding the scope and advance planning for projects. Challenges encountered by these projects included setting unrealistic objectives and creating scopes that were overly ambitious or that did not fully take in to account logistical realities on the ground. Improper scoping created serious obstacles to implementation, some of which proved to be insurmountable.

SECTORAL SYNTHESIS OF 2013 -2014 EVALUATION FINDINGS: E3 BUREAU 75
Bolivia Amazon: “Project efforts should focus on developing a functional operational approach and then extending this approach to other areas. The structural design of the project presents problems in understanding the logic of intervention. This is principally due to the disconnection between the results to be achieved and the strategic objectives of the project. Consequently, the project can fully meet the performance indicators, but may not necessarily have contributed to the achievement of project objectives.” (Evaluation # 71)
Ecuador SFC: “The project intended to promote sustainable forest management systems in the project sites. This particular activity proved not to be viable because the farms are far too small to implement a successful forest management system. The problem was compounded by the distance to potential markets and the situation of timber value chains that include a high number of middlemen. The SFC project analyzed the market conditions and limitations. This led to the decision to not move ahead with the intended activity.” (Evaluation # 72)
Indonesia FOREST: “A major lesson learned in this evaluation report from Indonesia is that of setting realistic objectives in project design. The FOREST program's original objectives were overly ambitious, and very difficult to implement from the outset.” (Evaluation # 73)
Evaluations in the Forestry and Biodiversity sector provided many lessons learned related to performance management. Many of the challenges faced by the projects were traced back to the failure to properly define a theory of change and/or develop a thorough logic framework during the project design phase.
Malawi Biodiversity: “USAID should have a clear Development Hypothesis, based on an explicit theory of change, and be evidence-based. A visual diagram of the Results Framework based on the Development Hypothesis should be part of the solicitation of proposals so that the logic of the project is clearly understood by both USAID and the future implementing organizations.” (Evaluation # 77)
Peru USFS/PFSI: “USFS/PFSI has a wide range of milestones that lack a defined and direct causal relationship with their underlying activities and have no scheduled completion date… Given the nature of the project, the inclusion of milestones that depend largely on counterpart progress is appropriate, but these should relate back to project activities. This will strengthen the strategic underpinning of the project as well as enable an analysis of the projects results and its hypothesis upon completion.” (Evaluation # 80)
The Forestry and Biodiversity evaluations also provided key lessons learned around monitoring and evaluation throughout project implementation. These evaluations highlight that the use a systematic approach to collecting data that ties inputs to outputs/outcomes and relevant contextual factors is essential for a project to track progress, identify problems, and implement improvements and solutions.
US Coral Triangle: “This may have also influenced the finding that US CTI was unable to develop an M&E system that could be, or was, used for performance management, although the Team cannot definitively attribute this to the lack of clarity on roles. Should USAID consider using multiple mechanisms in the future, in such cases it might consider assuming the internal coordination function itself.” (Evaluation # 74)
Peru USFS/PFSI: “The design and implementation of the USFS/PFSI, based upon quality processes, would benefit from closer linkages to counterpart strategic planning and requires an improved monitoring system that includes information allowing for the measurement of direct project results. Complementing strategic linkages with sector programming, the project should pursue the expanded use and formalization of coordination mechanisms that have led to its greatest successes to date.” (Evaluation # 80)
Mozambique Ecotourism and Biodiversity: “Future activities should have more comprehensive M&E plans, including collecting robust baseline data and quantitative indicators
SECTORAL SYNTHESIS OF 2013 -2014 EVALUATION FINDINGS: E3 BUREAU 76
to measure activity outputs/outcomes. Participatory Impact Pathways Analysis (the PIPA approach), widely employed by USAID in the Americas, is one possibility for identifying and resolving communication and networking problems and analyzing their relationship to impact.” (Evaluation # 78)

SECTORAL SYNTHESIS OF 2013 -2014 EVALUATION FINDINGS: E3 BUREAU 77
WATER EVALUATIONS
Summary of Evaluations
The Water office reviewed 13 evaluations, which are detailed in Annex B. Evaluations were concentrated in Africa, with seven in Africa (Ethiopia, Ghana, Tanzania, Zambia, Zimbabwe, regional) three in Afghanistan, and one each in Latin America and the Caribbean (Dominican Republic), the Middle East (Jordan), and Asia (Indonesia).
Evaluations related to the Water sector included five mid-term, six final, and one ex-post performance evaluation, as well as one ex-post impact evaluation.
The average evaluation report quality score for the 13 evaluations in the Water sector was 7.69 out of 10, which is similar to the overall E3 Bureau average score of 7.97 for the same period of 2013 – 2014. The score shows considerable improvement over the 2009 – 2012 average score for the quality of evaluation reports for the E3 sectors of 5.84.
Figure 41: Quality of Evaluation Report Score, Water
5.84
7.977.69
0
1
2
3
4
5
6
7
8
9
10
Average E3 Score2009 - 2012, all sectors
Average E3 Score, all sectors2013 - 2014
Average Office Score2013 - 2014
1
1
1
3
7
0 1 2 3 4 5 6 7 8
Asia
ME
LAC
AfPak
Africa
Figure 40: Number of Water Evaluations by Region
Water

SECTORAL SYNTHESIS OF 2013 -2014 EVALUATION FINDINGS: E3 BUREAU 78
As compared to E3 as a whole, evaluations in the Water sector were more likely to address private sector engagement and governance issues as well as lessons learned. Fewer of these evaluations addressed project outcomes, though a similar percentage addressed performance targets.
Figure 42: Percent of Water Evaluations that Addressed Each Topic Area
84%
81%
66%
62%
44%
78%
74%
92%
77%
85%
77%
46%
77%
46%
0% 10% 20% 30% 40% 50% 60% 70% 80% 90% 100%
Lessons Learned
Learning and Improvement
Governance
Private Sector Engagement
Innovative Practices
Performance Targets
Project Outcomes
Water (n = 13) E3 Average (n = 117)

SECTORAL SYNTHESIS OF 2013 -2014 EVALUATION FINDINGS: E3 BUREAU 79
Project Results
Ten of the 13 evaluations addressed project performance targets. In four of these cases, the projects exceeded their targets overall. However, in one case the evaluation noted that output level targets had been set too low relative to what the project ended up delivering. In another case, the evaluation noted that while the project exceeded its targets, the quality of the outputs was unsatisfactory. In five cases, the projects met their performance targets overall and in one case the project fell short.
Of the 13 evaluations reviewed for the Water sector, 6 addressed project outcomes, though the intended outcomes were not always clear or explicit. One of the projects looked at linkages between project outcomes between sectors, and one provided informant responses that supported attribution of outcomes.
Tanzania iWASH: “In natural resource management, innovative and scientifically important work has been done supporting improved Water Basin knowledge and management of the water resource studies and activities well-informed interviewees say would not have taken place absent iWASH funding.” (Evaluation # 97)
Zambia WASH: “Linkages between WASH Facilities and Pupil Attendance and Teacher Retention: Under this section, the findings are presented in two sub sections. (1) Linkage between provision of WASH facilities and pupil attendance and (ii) Linkage between provision of WASH facilities and teacher retention.” (Evaluation # 98)
Innovative Practices
Two evaluations reviewed for the Water sector make reference to systems innovations or innovations in stakeholder engagement.
Southern Africa SAREP: “(…) wide-scale coalition-building around climate change adaptation that treats the basin and its people as a whole, and imparts responsibility and rewards for actions that mitigate uncertainty. This is particularly important in complex systems and it is important that the socio-ecological system is constantly referenced in current and future work in order to ensure that people and the environment are not treated as separate.” (Evaluation # 96)
Southern Africa SAREP: “I particularly liked the "systems approach" inherent in the project design, with integration of water resource management, WASH, biodiversity, HIV, climate change, and livelihoods. This is critical to success, and all too rare in USAID programming.” (Evaluation # 96)
Mozambique SUWASA: “SUWASA/Mozambique is relatively innovative in its attempt to recognize and regulate the role played by FPAs in under-served peri-urban areas.” (Evaluation # 92)
Three of the 13 evaluations noted a non-ICT product innovation.
Figure 43: Overall Achievement of Performance Targets (n = 13 evaluations)
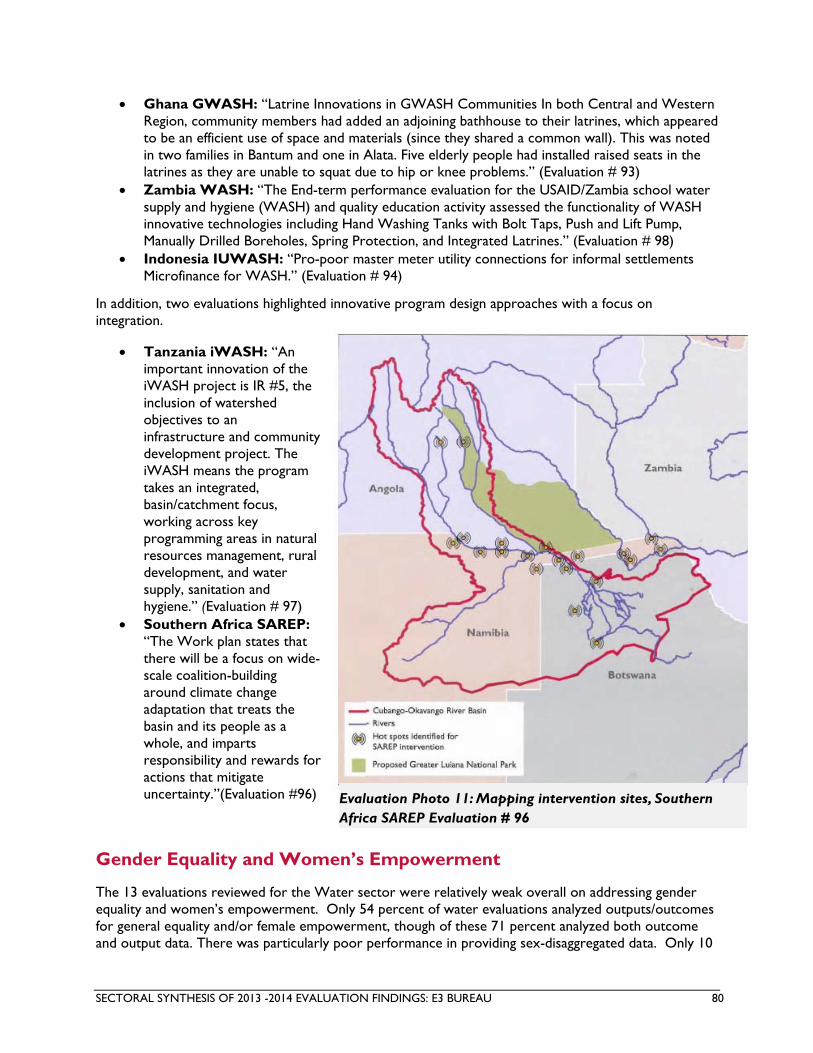
SECTORAL SYNTHESIS OF 2013 -2014 EVALUATION FINDINGS: E3 BUREAU 80
Ghana GWASH: “Latrine Innovations in GWASH Communities In both Central and Western Region, community members had added an adjoining bathhouse to their latrines, which appeared to be an efficient use of space and materials (since they shared a common wall). This was noted in two families in Bantum and one in Alata. Five elderly people had installed raised seats in the latrines as they are unable to squat due to hip or knee problems.” (Evaluation # 93)
Zambia WASH: “The End-term performance evaluation for the USAID/Zambia school water supply and hygiene (WASH) and quality education activity assessed the functionality of WASH innovative technologies including Hand Washing Tanks with Bolt Taps, Push and Lift Pump, Manually Drilled Boreholes, Spring Protection, and Integrated Latrines.” (Evaluation # 98)
Indonesia IUWASH: “Pro-poor master meter utility connections for informal settlements Microfinance for WASH.” (Evaluation # 94)
In addition, two evaluations highlighted innovative program design approaches with a focus on integration.
Tanzania iWASH: “An important innovation of the iWASH project is IR #5, the inclusion of watershed objectives to an infrastructure and community development project. The iWASH means the program takes an integrated, basin/catchment focus, working across key programming areas in natural resources management, rural development, and water supply, sanitation and hygiene.” (Evaluation # 97)
Southern Africa SAREP: “The Work plan states that there will be a focus on wide-scale coalition-building around climate change adaptation that treats the basin and its people as a whole, and imparts responsibility and rewards for actions that mitigate uncertainty.”(Evaluation #96)
Gender Equality and Women’s Empowerment
The 13 evaluations reviewed for the Water sector were relatively weak overall on addressing gender equality and women’s empowerment. Only 54 percent of water evaluations analyzed outputs/outcomes for general equality and/or female empowerment, though of these 71 percent analyzed both outcome and output data. There was particularly poor performance in providing sex-disaggregated data. Only 10
Evaluation Photo 11: Mapping intervention sites, Southern Africa SAREP Evaluation # 96

SECTORAL SYNTHESIS OF 2013 -2014 EVALUATION FINDINGS: E3 BUREAU 81
percent of the evaluations where data were person provided sex disaggregated data at all levels, though 50 percent disaggregated at least some data. Fifty percent also explained program access or outcomes differently for men and women where data were person focused. The gender measure where water evaluations showed the best performance (62 percent) was in addressing how projects had been designed or implemented in ways that integrated gender equality and/or women’s empowerment.
When the evaluations did analyze the gender aspects of Water programs, the evaluations frequently cited the fact that fetching water in developing countries is typically a woman’s job, so water projects can be expected to benefit women disproportionately. Analysis also found other ways in which men and women benefitted differently from water projects.
Zimbabwe WASH: “Women (and children) were the primary beneficiaries of the planned interventions. They stood to benefit the most from improved water sources and hygiene practices given their inherent vulnerability to water-borne and hygiene- or sanitation-related illnesses, their responsibilities for providing water for households, and their caring for the sick.” (Evaluation # 99)
Ethiopia WaTER: “The project addressed gender issues well in the establishment of WMCs. Approximately one-third of the members of the WMCs are women, who are usually involved in tasks related to cashier and addressing concerns and grievances of villagers. Women are also well represented as beneficiaries of the project. It has been mainly their burden that has been lifted since women are generally responsible for fetching water, thereby losing valuable productive time (details on time saved are included in the above sections). Through the new schemes their lives have been much improved. “(Evaluation # 91)
Ghana GWASH: “Nine of those committees were ranked 4 out of 5 or higher in terms of functionality of WASH committees. Those in Suibo and Asuoko, with more women on the committee, seemed to be functioning better than those with fewer women. As women make up half of the population and are the primary gatherers and users of water, the global experience is that when women manage the committees and are trained to maintain/repair pumps, there is less down time.” (Evaluation # 93)
Some Water sector evaluations did discuss efforts to integrate gender in design and implementation through gender sensitive hiring practices, inclusive programming, focusing on gender for monitoring and evaluation, and conducting gender analyses to inform project activities.
Tanzania iWash: “The project mitigated constraints to gender by keeping gender considerations in the forefront of project planning, by hiring gender-sensitive staff, by monitoring and reporting data segregated by gender, and by working with women in a substantial number of project activities: in water, sanitation, agriculture, VSL, pump maintenance (one example), and even Rope Pump manufacture (one example). Integrating gender considerations into activities is evidenced by ensuring female participation in village decision-making (site selection of DPs, for instance), and in women’s participation in community leadership structures, COWSOs and others. Another way the project integrated gender findings into its activities was through a gender study conducted in August 2012.” (Evaluation # 97)
Jordan ISSP: “The ISSP Program does not have a specific gender strategy or focus. The ISSP team and management, however, do have an awareness of the key role of gender in the water sector and have identified activities with gender implications. Examples include: Where possible, ISSP strives to achieve a gender mix in all of its training activities and in the formation of working groups etc., and; Gender disaggregated data is collected, where possible and relevant. An example is the Socio-Economic Impact Assessment of Groundwater in Jordan, which will explicitly survey and assess the impact of groundwater use by gender as a key component of the analysis. As an IRR program that is dealing with Jordanian legal and institutional structures and
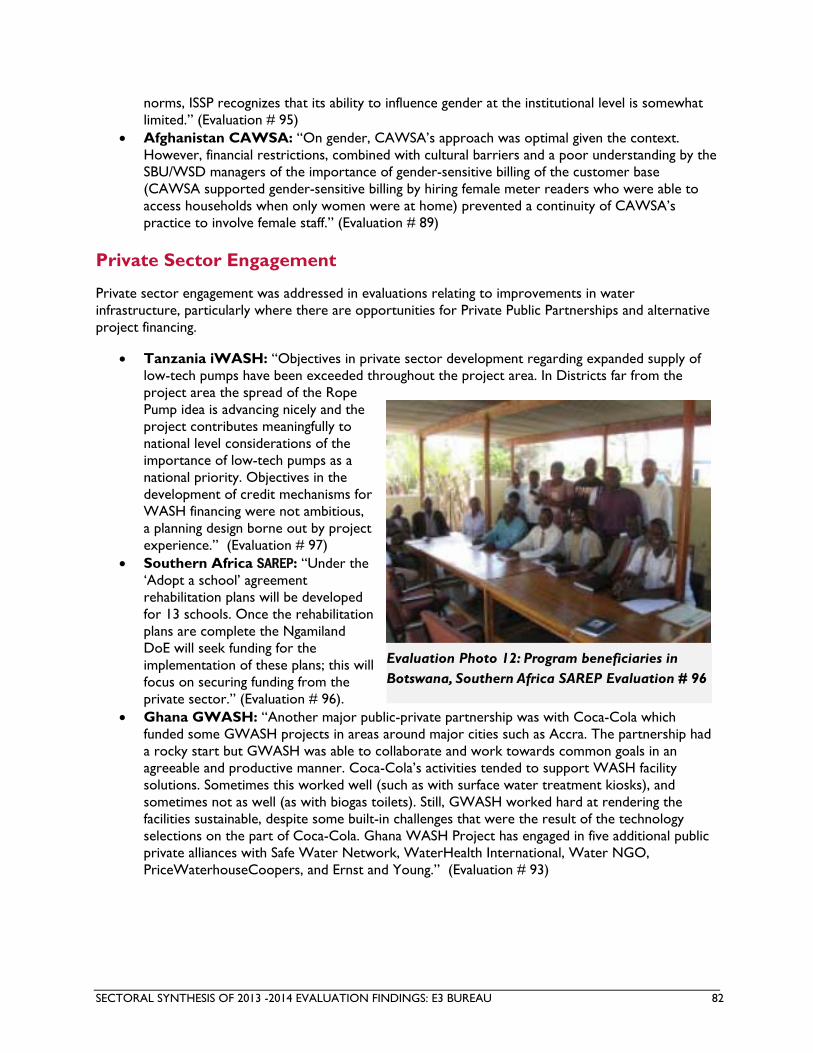
SECTORAL SYNTHESIS OF 2013 -2014 EVALUATION FINDINGS: E3 BUREAU 82
norms, ISSP recognizes that its ability to influence gender at the institutional level is somewhat limited.” (Evaluation # 95)
Afghanistan CAWSA: “On gender, CAWSA’s approach was optimal given the context. However, financial restrictions, combined with cultural barriers and a poor understanding by the SBU/WSD managers of the importance of gender-sensitive billing of the customer base (CAWSA supported gender-sensitive billing by hiring female meter readers who were able to access households when only women were at home) prevented a continuity of CAWSA’s practice to involve female staff.” (Evaluation # 89)
Private Sector Engagement
Private sector engagement was addressed in evaluations relating to improvements in water infrastructure, particularly where there are opportunities for Private Public Partnerships and alternative project financing.
Tanzania iWASH: “Objectives in private sector development regarding expanded supply of low-tech pumps have been exceeded throughout the project area. In Districts far from the project area the spread of the Rope Pump idea is advancing nicely and the project contributes meaningfully to national level considerations of the importance of low-tech pumps as a national priority. Objectives in the development of credit mechanisms for WASH financing were not ambitious, a planning design borne out by project experience.” (Evaluation # 97)
Southern Africa SAREP: “Under the ‘Adopt a school’ agreement rehabilitation plans will be developed for 13 schools. Once the rehabilitation plans are complete the Ngamiland DoE will seek funding for the implementation of these plans; this will focus on securing funding from the private sector.” (Evaluation # 96).
Ghana GWASH: “Another major public-private partnership was with Coca-Cola which funded some GWASH projects in areas around major cities such as Accra. The partnership had a rocky start but GWASH was able to collaborate and work towards common goals in an agreeable and productive manner. Coca-Cola’s activities tended to support WASH facility solutions. Sometimes this worked well (such as with surface water treatment kiosks), and sometimes not as well (as with biogas toilets). Still, GWASH worked hard at rendering the facilities sustainable, despite some built-in challenges that were the result of the technology selections on the part of Coca-Cola. Ghana WASH Project has engaged in five additional public private alliances with Safe Water Network, WaterHealth International, Water NGO, PriceWaterhouseCoopers, and Ernst and Young.” (Evaluation # 93)
Evaluation Photo 12: Program beneficiaries in Botswana, Southern Africa SAREP Evaluation # 96

SECTORAL SYNTHESIS OF 2013 -2014 EVALUATION FINDINGS: E3 BUREAU 83
Governance
Within the Water sector evaluations, the most frequent theme was the need to engage to work with, and sometimes through, the host country institutions. Especially in the case of large water projects, developing these relationships was a key to project success or failure.
Tanzania iWASH: “Good GoT staff capacity development has taken place through workshops, technical studies and field research. iWASH conceptualizes these interventions as directed to three goals: institutional capacity development, increased sustainable management of the watershed, and increased staff capacity to manage water resources.” (Evaluation # 97)
Indonesia IUWASH: “In the sanitation sector, IUWASH has provided useful services in supporting the development of decentralised communal wastewater systems by leveraging existing donor and GOI-funded activities, in particular a GOI and donor-acknowledged contribution to the National Sanitation Acceleration Plan (PPSP). However, with the issue of Contract Modification No 8, the project now faces the much more formidable challenge of assisting national and local governments to embed the sanitation sector as an efficient urban infrastructure service delivery through the necessary regulatory, institutional strengthening and budget processes.” (Evaluation # 94)
Jordan ISSP: “ISSP commenced with a detailed Institutional Assessment of the sector. This was carried out in a highly participatory manner and built on a large body of previous work. The Institutional Assessment Report provided a vision and implementation plan to achieve sector reform, and was well received by the sector stakeholders..” (Evaluation # 95)
Ethiopia WaTER: “Whereas the WMCs at the time of the evaluation were for the most part present and operational, their long term effectiveness is not guaranteed. The linkages with local authorities, specifically the Woredas is crucial in this context.” (Evaluation # 91)
Areas for Learning and Improvement
Common themes seen among evaluations were overly ambitious delivery objectives and/or insufficient time for full project completion, which were mentioned in six of the evaluations.
Africa SUWASA: “A two-year project timeframe was, from the start, overly optimistic and ambitious and the need for a longer timeframe should have been anticipated at the due diligence stage.” (Evaluation # 92)
Environmental factors related to water scarcity were only cited as limiting project success in one case, but technology/equipment factors contributed to failures in four cases, with problems that ranged from availability of parts and inadequacy of electrical current for pumps, to poor engineering design.
Concerns over sustainability were tied to local capacity in the case of three of the projects.
Indonesia IUWASH: ““Community organization, hygiene education, and behavior change should have preceded the installation of wells and latrines by three to six months to ensure community ownership and thus, sustainability.” (Evaluation # 94)
Management concerns were identified for four of the projects, including communication disconnects between implementing partner country and home offices, a failure to link the SOW with the project objectives, and a missed opportunity to build stakeholder processes for applying adaptive management.
Financial monitoring and reporting practices were particularly problematic for one project that encountered severe budgetary issues after funds that were perceived as unspent were allocated to other resources before discovering that they were not available.

SECTORAL SYNTHESIS OF 2013 -2014 EVALUATION FINDINGS: E3 BUREAU 84
Key Lessons Learned
The evaluations related to the Water sector provided several key lessons learned about project design, implementation, and technical approaches. One key lesson was a recommendation from various evaluations for USAID to consider the option of repairing existing infrastructure before building or replacing with the logic that is often more efficient and cost effective to invest in building the capacities of communities to repair existing water infrastructure and maintain them.
Ghana GWASH: “GWASH’s strategy of focusing on rehabilitation of wells and pumps is an excellent one. The communities have many, many broken pumps from other donors as well as GWASH.” (Evaluation # 93)
Zimbabwe WASH: “If the goal is a sustainable and effective intervention that increases supply of water to most Zimbabweans, then USAID/OFDA funds must be channeled to supporting the rehabilitation of existing municipal water supply systems, water treatment and sewage plants for urban and periurban households and institutions and/or capacity building for the managers thereof.” (Evaluation # 99)
Zimbabwe WASH: “In many cases, the most cost-effective intervention would be for USAID/OFDA to fund its implementing partners to facilitate the repair of broken down pumps and training to maintain these.” (Evaluation # 99)
In order to properly target efforts, evaluations pointed out that USAID should conduct more pre-implementation scoping, like water quality surveys, water coverage assessments, and partner capacity assessments during the project design phase.
Afghanistan CAWSA: “More attention should be paid to the selection of utilities and an assessment of their infrastructure conditions, as well as staffing needs and capacities prior to activity implementation, in order to determine more realistic expectations and appropriate capital investment to facilitate project objectives. This may result in more focused assistance in a smaller number of utilities.” (Project # 89)
Zimbabwe WASH: “Even systems that were functioning well were not able to provide water year-round, in part due to the need to share the water with surrounding households. USAID/OFDA could address these issues by funding water supply programs that ensure full coverage in a defined geographic area (e.g., a suburb or rural village).” (Evaluation # 99)
Sustainability was also addressed in the Water sector evaluations. The sustainability of efforts is of major concern given the ongoing maintenance needs for many water projects after the installation is complete. Sustainability requires community ownership and capacity building as well as a supply of spare parts.
Ghana GWASH: “A more systematic approach to building the financial, operational, technical, and service delivery capacity of LNGOs would promote greater sustainability of program activities. A strategy for greater involvement of local partners and government agencies is also essential, as well as clearer definition of the roles of each partner.” (Evaluation # 93)
Zambia WASH: “Any next project should place more emphasis on establishing spare parts outlets. Three alternatives are proposed; supporting commercial sales outlets to include hand pump spare parts, supporting APMs to purchase some spare parts and sell alongside their repair works as mobile sales outlets and supporting the District Councils to establish spare part outlets through the SOMAP initiative.” (Evaluation # 98)
Zimbabwe WASH: “Sustainability Strategic: USAID/OFDA and its implementing partners should focus on capacity building of beneficiary communities and service providers in combination with building or supporting stronger supply chains.” (Evaluation # 99)
SECTORAL SYNTHESIS OF 2013 -2014 EVALUATION FINDINGS: E3 BUREAU 85
Another component of sustainability in the Water sector is continued funding. Evaluations included suggestions for funding sustainable water infrastructure maintenance include fundraising by water management committees, incentivizing private sector involvement, and the establishment of a revolving loan fund.
Zimbabwe WASH: “Community: Work with existing groups (such as health clubs or water management committees) or form new groups. Any such group can be targeted to conduct fundraising for money to maintain the system as needed.” (Evaluation # 99)
Zimbabwe WASH: “A revolving fund/access to micro-credit/savings mechanisms could be put in place to provide necessary monies to buy spare parts when the time arises.” (Evaluation # 99)
Additionally, one evaluation highlighted the value of allowing for flexibility in programing.
Jordan ISSP: “However the implementation of the core reform agenda has been stalled by political factors and resulting changes in leadership positions within the Ministry of Water and Irrigation (MWI). Despite this, ISSP has been able to make progress on many other fronts, due to the flexibility inherent in the program, and the competent execution by ISSP management. As a result, ISSP has been able to continually re-assess the situation on the ground and adjust its implementation tasks accordingly.” (Evaluation # 95)

SECTORAL SYNTHESIS OF 2013 -2014 EVALUATION FINDINGS: E3 BUREAU 86
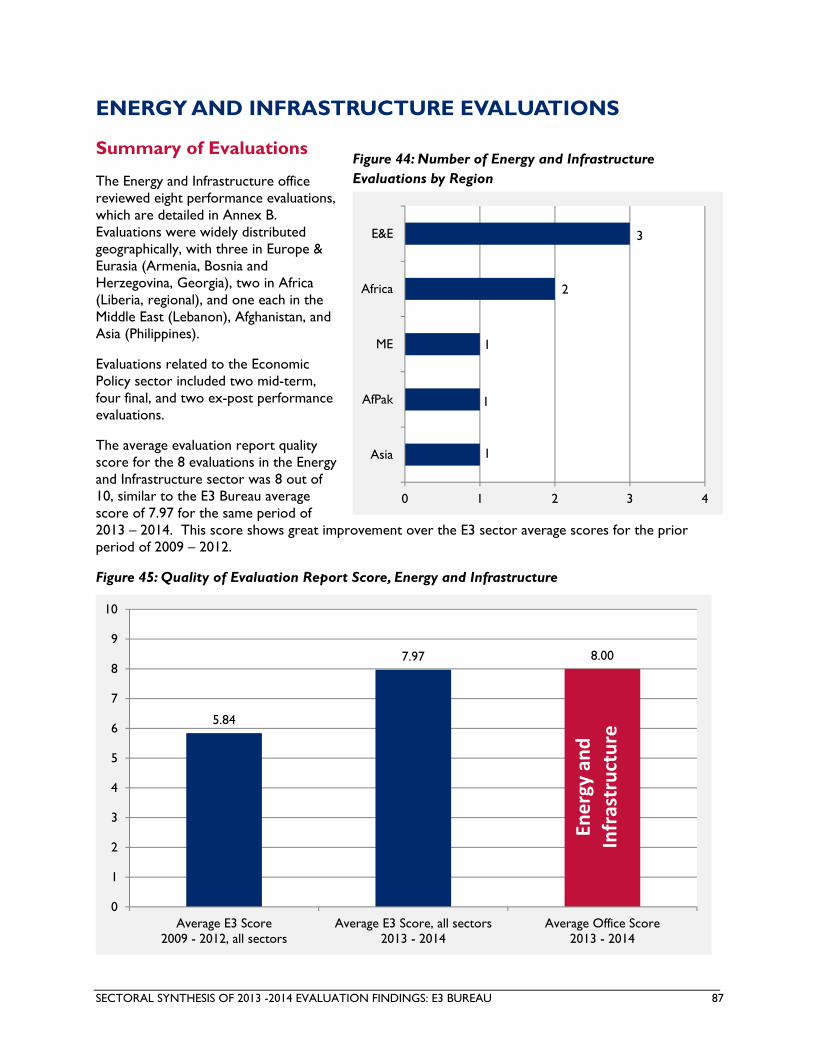
SECTORAL SYNTHESIS OF 2013 -2014 EVALUATION FINDINGS: E3 BUREAU 87
ENERGY AND INFRASTRUCTURE EVALUATIONS
Summary of Evaluations
The Energy and Infrastructure office reviewed eight performance evaluations, which are detailed in Annex B. Evaluations were widely distributed geographically, with three in Europe & Eurasia (Armenia, Bosnia and Herzegovina, Georgia), two in Africa (Liberia, regional), and one each in the Middle East (Lebanon), Afghanistan, and Asia (Philippines).
Evaluations related to the Economic Policy sector included two mid-term, four final, and two ex-post performance evaluations.
The average evaluation report quality score for the 8 evaluations in the Energy and Infrastructure sector was 8 out of 10, similar to the E3 Bureau average score of 7.97 for the same period of 2013 – 2014. This score shows great improvement over the E3 sector average scores for the prior period of 2009 – 2012.
Figure 45: Quality of Evaluation Report Score, Energy and Infrastructure
5.84
7.97 8.00
0
1
2
3
4
5
6
7
8
9
10
Average E3 Score2009 - 2012, all sectors
Average E3 Score, all sectors2013 - 2014
Average Office Score2013 - 2014
1
1
1
2
3
0 1 2 3 4
Asia
AfPak
ME
Africa
E&E
Figure 44: Number of Energy and Infrastructure Evaluations by Region
Energy an
d
Infrastructure

SECTORAL SYNTHESIS OF 2013 -2014 EVALUATION FINDINGS: E3 BUREAU 88
As compared to E3 evaluations as a whole, evaluations in the Energy and Infrastructure sector were slightly more likely to address areas for learning and improvement and lessons learned. The Energy and Infrastructure sector evaluations were less likely to address innovative practices, private sector engagement, governance, and performance targets.
Figure 46: Percent of Energy and Infrastructure Evaluations that Addressed Each Topic Area
84%
81%
66%
62%
44%
78%
74%
88%
88%
50%
50%
13%
50%
63%
0% 10% 20% 30% 40% 50% 60% 70% 80% 90% 100%
Lessons Learned
Learning and Improvement
Governance
Private Sector Engagement
Innovative Practices
Performance Targets
Project Outcomes
Energy & Infrastructure (n = 8) E3 Average (n = 117)

SECTORAL SYNTHESIS OF 2013 -2014 EVALUATION FINDINGS: E3 BUREAU 89
Project Results
Four of the eight evaluations in the Energy and Infrastructure sector addressed performance targets. In one case, the project met its qualitative targets but as the quantitative targets had been revised overall performance was difficult to determine. In two cases, the projects did not meet their targets overall, though in one of these it should be noted that USAID took over a project that had challenges from another donor. While performance targets were addressed in the fourth evaluation, not enough information was provided to determine overall success in achieving targets.
Five of the eight evaluations addressed outcomes. Three evaluations highlighted outcomes related to increased capacity and two evaluations discussed outcomes related to strengthened economic growth or security. The evidence provided to link the attribution of the outcomes to the project was primarily anecdotal.
Georgia PGIP: “The project has led to positive impacts for all end-users who have connected to gas: HHs, businesses, social/pubic institutions and industry, recognize the economic advantage of switching to gas.” (Evaluation # 104)
Afghanistan Airport: “Intervention by USAID was instrumental in getting the airport projects completed. There is a fair possibility that without this intervention the rehabilitation work would have been abandoned.” (Evaluation # 110).
Innovative Practices
Only one of the eight evaluations noted an innovation, pointing to an innovation in partnership approach.
Georgia PGIP: “The project is unique because it is funded from one-time supplemental post-conflict resources, is the largest USAID-funded infrastructure project in Georgia, and utilizes an innovative mix of both private sector and host country-controlled organizations as implementers.” (Evaluation # 104)
Gender Equality and Women’s Empowerment
The eight evaluations related to the Energy and Infrastructure sector showed poor to fair results on gender measures. Only 38 percent analyzed gender aspects of outputs/outcomes. Only half of the evaluations disaggregated data by sex at all levels where data were person focused though a full two-thirds (67 percent) disaggregated at least some data. Half explained how project access or outcomes were different for men and women. In addition, the project scored poorly with only 25 percent showing evidence that the project was designed or implemented in ways that integrate gender equality and/or women’s empowerment.
Figure 47: Overall Achievement of Performance Targets (n = 8 evaluations)
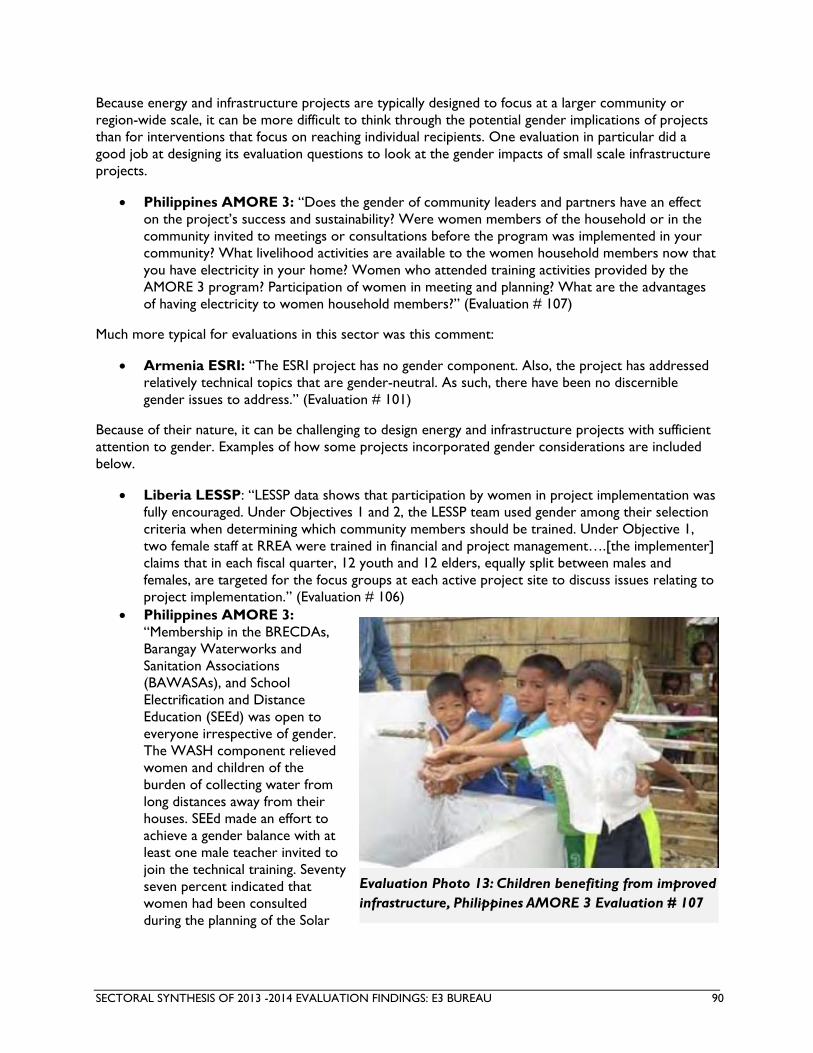
SECTORAL SYNTHESIS OF 2013 -2014 EVALUATION FINDINGS: E3 BUREAU 90
Because energy and infrastructure projects are typically designed to focus at a larger community or region-wide scale, it can be more difficult to think through the potential gender implications of projects than for interventions that focus on reaching individual recipients. One evaluation in particular did a good job at designing its evaluation questions to look at the gender impacts of small scale infrastructure projects.
Philippines AMORE 3: “Does the gender of community leaders and partners have an effect on the project’s success and sustainability? Were women members of the household or in the community invited to meetings or consultations before the program was implemented in your community? What livelihood activities are available to the women household members now that you have electricity in your home? Women who attended training activities provided by the AMORE 3 program? Participation of women in meeting and planning? What are the advantages of having electricity to women household members?” (Evaluation # 107)
Much more typical for evaluations in this sector was this comment:
Armenia ESRI: “The ESRI project has no gender component. Also, the project has addressed relatively technical topics that are gender-neutral. As such, there have been no discernible gender issues to address.” (Evaluation # 101)
Because of their nature, it can be challenging to design energy and infrastructure projects with sufficient attention to gender. Examples of how some projects incorporated gender considerations are included below.
Liberia LESSP: “LESSP data shows that participation by women in project implementation was fully encouraged. Under Objectives 1 and 2, the LESSP team used gender among their selection criteria when determining which community members should be trained. Under Objective 1, two female staff at RREA were trained in financial and project management….[the implementer] claims that in each fiscal quarter, 12 youth and 12 elders, equally split between males and females, are targeted for the focus groups at each active project site to discuss issues relating to project implementation.” (Evaluation # 106)
Philippines AMORE 3: “Membership in the BRECDAs, Barangay Waterworks and Sanitation Associations (BAWASAs), and School Electrification and Distance Education (SEEd) was open to everyone irrespective of gender. The WASH component relieved women and children of the burden of collecting water from long distances away from their houses. SEEd made an effort to achieve a gender balance with at least one male teacher invited to join the technical training. Seventy seven percent indicated that women had been consulted during the planning of the Solar
Evaluation Photo 13: Children benefiting from improved infrastructure, Philippines AMORE 3 Evaluation # 107

SECTORAL SYNTHESIS OF 2013 -2014 EVALUATION FINDINGS: E3 BUREAU 91
Lighting project and only 49% indicated that women had been consulted during the planning phase for the WASH.” (Evaluation # 107)
Private Sector Engagement
Of the four evaluations in the Energy and Infrastructure sector that addressed private sector engagement, two pointed to private sector investment in the energy sector (particularly investment risk as a challenge in the energy sector), one mentioned workforce training, and one response highlighted Public-Private Partnerships as a major element of the project.
Georgia PGIP: “The project is unique because it is funded from one-time supplemental post-conflict resources, is the largest USAID-funded infrastructure project in Georgia, and utilizes an innovative mix of both private sector and host country-controlled organizations as implementers.”(Evaluation # 104)
Bosnia and Herzegovina REAP: “Project was designed to enhance investment in electricity generation, however lack of clarity is risky for investors. It will be difficult for private companies to obtain capital for investment until consistent procedures and parameters for investment are more clearly established.” (Evaluation # 102)
Liberia LESSP: “Private sector investment was not secured due to: ‘Perceived risks for private sector involvement are very high, especially in light of the absence of an energy law.’…LESSP has not successfully attracted private sector investment. The investment climate in Liberia’s energy sector is characterized by high levels of risk due to uncertain policy and regulatory regimes, systemic corruption, the post-conflict landscape, and a variety of other factors. As a result, there is scant private sector investment anywhere in the country.” (Evaluation # 106)
Governance
Evaluations of Energy and Infrastructure projects noted engagement with governance issues through policy reform. In some cases, the reforms were successful, but other evaluations noted that policy form was insufficient to effect change.
Armenia ESRI: “Technical assistance and advisory support for harmonization of legal and normative documents governing interregional cooperation basically addresses support provided to MOENR in reaching an agreement with the Ministry of Energy of Georgia and signing a Memorandum of Understanding (MOU) between the two ministries. In 2010, Armenia and Georgia did sign such an MOU, which laid the groundwork for subsequent joint activities aimed at integration of the power systems.” (Evaluation # 101)
Liberia LESSP: “The legal, institutional and regulatory frameworks have not been improved as a result of LESSP activities. The energy law first drafted in 2009 remains mired in the legislature, despite its critical importance to private investors with interest in the energy sector. LESSP met is contractual obligations of submitting an Energy Regulatory Board Action Plan and a revised draft energy law, but no perceivable change has been occurred as a result of these actions.” (Evaluation # 104).
Additionally, one evaluation noted a lack of engagement with civil society and local governance.
Lebanon SVWTS: “The limited awareness and restricted engagement of the “large base” of the SVWTS project’s beneficiaries meant that there was limited citizen reaction to incidents that affected project’s implementation such as breaking the sewer network and diverting sewage flow to irrigate farms in Mashghara; dumping solid waste in the Litani River bed at the effluent outlet

SECTORAL SYNTHESIS OF 2013 -2014 EVALUATION FINDINGS: E3 BUREAU 92
of the WWTP in Fourzol; contamination of raw sewage with residues from olive presses thus hampering plants’ biological treatment processes; etc. In our opinion, these constraints should have been addressed with awareness raising activities, enhanced coordination with and direct engagement of the local population to run in parallel to project infrastructure development.” (Evaluation # 105).
Areas for Learning and Improvement
Sustainability was cited as problematic in three of the eight projects under review, particularly due to limited capacity building on the part of implementers and local counterparts. Questions of technical capacity were also raised in relation to two other projects’ shortcomings, one of which faced problems due to an inexperienced project manager, and the other due to a contractor’s limited local engineering experience.
Afghanistan Airport: “MoTCA did not achieve any long-term benefits from the training and capacity building given to the technical team of the PIU, as the unit was disbanded when the project ended.” (Evaluation # 110).
The technical aspects of the programs proved to be overly ambitious or optimistic, for half of the programs, setting unrealistic expectations regarding uptake, maintenance needs and affordability.
Lack of local interest was also a notable obstacle to uptake for three of the projects.
Bosnia and Herzegovina REAP: “Political paralysis and general lack of interest in changing their way of doing business are major obstacles to progress.” (Evaluation # 102).
Four of the projects encountered problems due to unrealistic monitoring and reporting requirements that were described as unrealistic, inefficient, not clearly stated, or inappropriate.
Key Lessons Learned
Due to the high investment costs associate with energy and infrastructure projects, project design requires rigorous scoping in the form of feasibility studies, cost-benefit analyses, and risk assessments. The evaluations in this sector called for better attention to producing accurate cost estimates, the identification of potential environment and technical implementation challenges, and the weighting of unknown variables.
Afghanistan Airport: “Prior to participating in an already ongoing project, USAID should conduct a review of the project and host a handover meeting with the previous project stakeholders to identify issues, risks and lessons learned for reference going forward.” (Evaluation # 110).
Liberia LESSP: “Need for rigorous feasibility studies for renewable energy systems to accurately identify costs and potential challenges to implementation such as environmental and technical issues.” (Evaluation # 104).
Georgia PGIP: “Cost-benefit analysis of a project should be performed before the project is approved and started. Care should be taken when developing cost-benefit analysis to adequately verify the input data, assumptions, and accuracy of calculations in order to avoid making unrealistic projects and inflating expectations. When cost-benefit analysis depends on the presence of large unknowns (direction of local economic development, decisions by large industrial consumers to build or not build), its value is considerably lowered. It cannot be assumed that an infrastructure project such as PGIP will have immediate widespread benefits for

SECTORAL SYNTHESIS OF 2013 -2014 EVALUATION FINDINGS: E3 BUREAU 93
end-users (HHs, businesses, industry) without ensuring that measures are in place to promote the use of said infrastructure.” (Evaluation # 104)
Local capacity was a frequent theme in lessons learned for evaluations related to the Energy and Infrastructure sector. A major aspect of the feasibility studies will be the capacity assessments of major partners including IPs, national ministries, and local partners. Institutional and technical capacities should be ascertained during the design phase.
Afghanistan Airport: “Prior to administering a grant, USAID should perform a financial, procurement, and technical capability assessment or gap analysis of the implementing organization to identify training and capacity building requirements. The analysis should follow USAID’s Public Financial Management Risk Assessment Framework (PFMRAF), Stage 2, which is part of USAID FORWARD’s IPR. 5) The results of the gap analyses should be used to schedule financial and technical training and capacity building among the first activities to be implemented so that the skills and knowledge gained will benefit the project.” (Evaluation # 110).
East Africa PPP: “The capacity and availability of implementing partners should be confirmed at the project design stage. EAPP and EAC were expected to play bigger roles but this later presented challenges during PPP implementation.” (Evaluation # 103)
Georgia PGIP: “Accurate assessment of the local technical and managerial capabilities is essential in determining the best working methodology for future infrastructure project designs. Specifically, such assessment needs to indicate whether the host country has skilled, experienced engineers and contractors required for the planned infrastructure project (covering all disciplines: civil, mechanical, electrical, electronic, etc.).” (Evaluation # 104)
Lebanon SVWTS: “To assess the financial and administrative soundness of the partners before committing USAID resources. The situation of municipal, water establishment and ministerial finances and their ability to provide adequate staffing for a project or initiative.” (Evaluation # 105)
The need to build institutional and technical capacity was paramount among energy infrastructure projects and necessary for both their implementation and sustainability. Evaluations in the Energy and Infrastructure sector noted a pervasive lack of institutional capacity and called for capacity assessments and increased investment in institutional development efforts.
East Africa PPP: “Taking into account inadequacy of resources and capacity noted during PPP implementation, USAID and other donors should consider providing additional institutional development support for implementation of the IDS and the EAPP Corporate Plan for 2012-2014.” (Evaluation # 103)
Georgia PGIP: “In addition, more steps need to be included in the bid evaluation process to ensure that the bidders have in-house capability.” (Evaluation # 104)
Liberia LESSP: “Must assess and build capacity for non-technical aspects of running a renewable energy system, including the business, accounting, governance, managerial and administrative elements, to ensure its sustainable operation.” (Evaluation # 106)
Emphasis was placed not only on the need for capacity building, but also on its retention. Evaluations noted that capacity building efforts should be intensive and conducted over a longer time span. They should build-in mechanisms to institutionalize the knowledge and capacity gained through training of trainers and other such efforts in order to safeguard against capacity loss from staff turn-over. The offering of competitive salaries could also help prevent the poaching of skilled and capacitated members of the workforce.

SECTORAL SYNTHESIS OF 2013 -2014 EVALUATION FINDINGS: E3 BUREAU 94
Liberia LESSP: “Capacity building is a long-term, intensive effort and can't be effectively built with implementation of one-off courses, particularly when they are not timed to coincide with when the knowledge gained will be put into practice.” (Evaluation # 106)
East Africa PPP: “Donors should consider providing strategic support for training of trainers in the region covering such fields as financial modeling, power pool planning and operations, and power transmission standards. This would help make PPP outcomes ultimately sustainable in the power pool.” (Evaluation # 103)
Georgia PGIP: “Building a local technical and managerial capacity for undertaking design-build projects is an important step of each country towards future self-sustainability. This would require not only training but also providing them with a high enough salary that will retain the skilled and qualified persons in the utility and in Georgia.” (Evaluation # 104)
The investment costs for projects in the Energy and Infrastructure sector are often too high to be covered by USAID alone. Evaluations included ideas for cost-sharing include partnering with other donors, partnering with the private sector, and/or passing some of the cost on to end-users.
Georgia PGIP: “The investment costs borne by USAID or GoG are insufficient to achieve the economic benefits envisioned by the project; additional investment is needed by distribution companies and end-users.” (Evaluation # 104)
East Africa PPP: “In future capacity building, there will be need for USAID and other donors to consider cost-sharing and including more in-country trainings of high priority, conducted by a combination of international consultants and regional professionals with relevant hands-on experience in the region.” (Evaluation # 104)
Liberia LESSP: “Project designs should carefully assess potential for private sector investment before building assumptions about such interest into the project's scope of work.” (Evaluation # 106)

SECTORAL SYNTHESIS OF 2013 -2014 EVALUATION FINDINGS: E3 BUREAU 95
GLOBAL CLIMATE CHANGE EVALUATIONS
Summary of Evaluations
The Global Climate Change office reviewed six evaluations, which are detailed in Annex B. Evaluations were conducted primarily in Asia, with four evaluations in Asia (Cambodia, Indonesia, Mongolia, regional) and one each in Africa (regional) and Latin America and the Caribbean (Mexico).
Evaluations related to the Global Climate Change sector included one mid-term and five final performance evaluations.
The average evaluation report quality score for the 6 evaluations in the Global Climate Change sector was 7.17 out of 10. This score is slightly lower than the overall E3 Bureau average score for the same period of 7.97. This score is an improvement from the 2009 – 2012 average score for E3 sector evaluations of 5.84.
Figure 49: Quality of Evaluation Report Score, Global Climate Change
5.84
7.97
7.17
0
1
2
3
4
5
6
7
8
9
10
Average E3 Score2009 - 2012, all sectors
Average E3 Score, all sectors2013 - 2014
Average Office Score2013 - 2014
1
1
4
0 1 2 3 4 5
LAC
Africa
Asia
Figure 48: Number of Global Climate Change Evaluations by Region
Global Clim
ate
Chan
ge
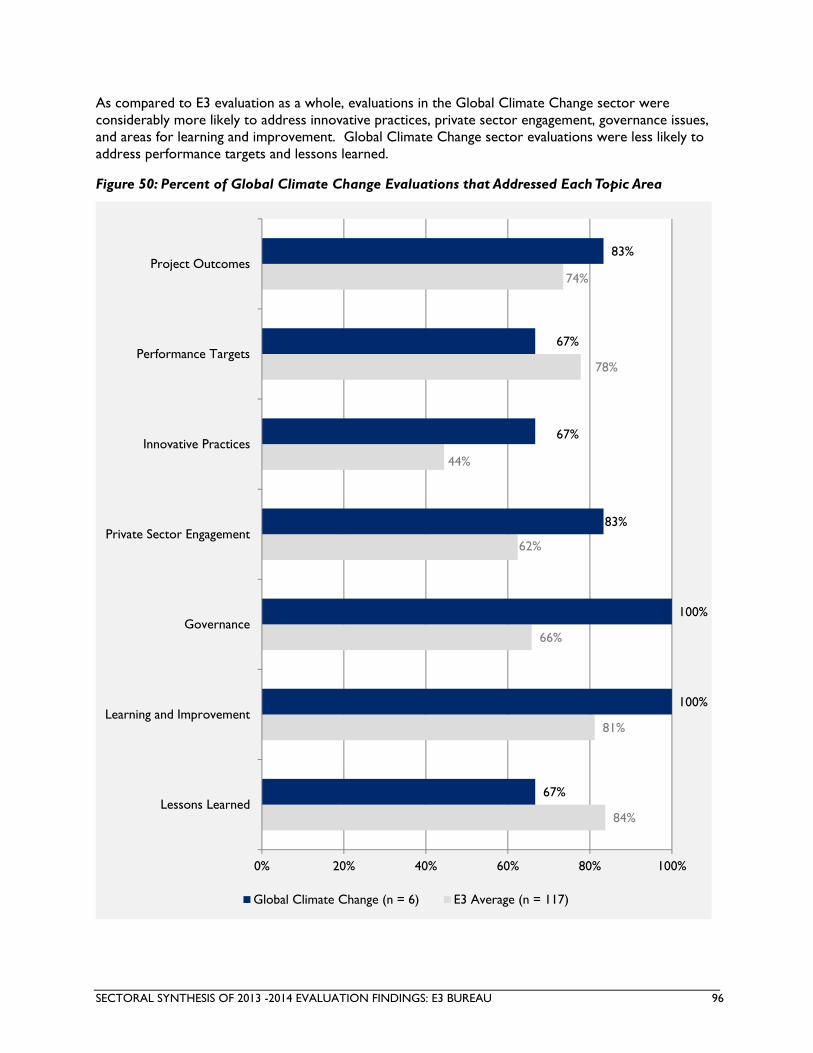
SECTORAL SYNTHESIS OF 2013 -2014 EVALUATION FINDINGS: E3 BUREAU 96
As compared to E3 evaluation as a whole, evaluations in the Global Climate Change sector were considerably more likely to address innovative practices, private sector engagement, governance issues, and areas for learning and improvement. Global Climate Change sector evaluations were less likely to address performance targets and lessons learned.
Figure 50: Percent of Global Climate Change Evaluations that Addressed Each Topic Area
84%
81%
66%
62%
44%
78%
74%
67%
100%
100%
83%
67%
67%
83%
0% 20% 40% 60% 80% 100%
Lessons Learned
Learning and Improvement
Governance
Private Sector Engagement
Innovative Practices
Performance Targets
Project Outcomes
Global Climate Change (n = 6) E3 Average (n = 117)

SECTORAL SYNTHESIS OF 2013 -2014 EVALUATION FINDINGS: E3 BUREAU 97
Project Results
Four of the six evaluations addressed project performance targets. In one case, the project met its targets. A second, which was a mid-term evaluation, noted that the project was unlikely to ever meet its primary targets. In two cases, the evaluation did not provide enough information on performance to determine the project’s success or failure in meeting targets.
Of the six evaluations reviewed for Global Climate Change, five addressed project outcomes, with only one of those attributing the outcome to the project. In this case, the evaluation highlighted improved economic outcomes.
Cambodia HARVEST: “HARVEST's agriculture value chain support activities are leading to increased economic benefits. Incomes are also increased in rice and fish production, but to a lesser extent and with less reliability.” (Evaluation # 109)
Innovative Practices
Four out of the six evaluations related to the Global Climate Change sector described the project design or implementation as innovate. Where these were identified as innovations, they tended to either be product innovations or new engagements.
Swaziland, et al. GDP: “The project has also been innovative in taking advantage of the opportunity provided through the provision of the giant clams (Tridacna maxima) obtained from a nearby pearl farm and carefully placed in the reef restoration sites as part of the seascape reef restoration.” (Evaluation # 113)
Swaziland, et al. GDP: “The Information Portal is a particularly innovative achievement that provides a real resource for the public and the presentations using power point, the Enviro-Picture building, the exhibits and the open day events all appear to have worked well.” (Evaluation # 113)
Gender Equality and Women’s Empowerment
The six evaluations reviewed in the Global Climate sector had mostly strong performance on gender measures. Two-thirds of evaluations analyzed output and/or outcome data in terms of gender equality and/or female empowerment, though of these 75 percent conducted the analysis only at the output level. All evaluations explained program access or outcomes differently for men or women where data were person focused and 83% showed evidence that projects were designed or implemented in ways that integrated gender equality and/or women’s empowerment. The one exception to the strong performance on gender measures was sex disaggregation of data; only one third of evaluations disaggregated person level data by sex at all levels, though two-thirds disaggregated at least some data.
When gender was analyzed as part of the evaluations, the topics included, inter alia: women’s participation in community meetings, the differential involvement of men and women in various project
Figure 51: Overall Achievement of Performance Targets (n = 6 evaluations)

SECTORAL SYNTHESIS OF 2013 -2014 EVALUATION FINDINGS: E3 BUREAU 98
activities, and the degree to which climate change training modules include appropriate gender considerations.
Swaziland, et al. GDP: “The gender of participants and beneficiaries was tracked by the projects and it is noteworthy that gender issues were not a major challenge for the projects. Women were particularly well represented in all structures and played a leading role in most of the projects. They were also major beneficiaries of the project processes.” (Evaluation # 113)
Indonesia Adapting: “The program struggled in “gender equity (50%) attained in all activities (50/50 women‐men participation)”, which can only reach 38.2 % women.” (Evaluation # 110)
Indonesia Adapting: “The evaluation team identified numerous areas in which participation is gender biased: In general, limited female spoke up in the focus group discussion if compared to male: Unless specifically invited (and encouraged) to speak, women did not actively contribute to community meetings in an open forum, like occurred in Lombok and Sumba Timur. … Community institutions that were established during the program were predominantly led by men, such as KMPB, Farmers Group, and Watershed Management. For UBSP (village microcredit), female leadership (and member) are more common. Young female are not common to join the program, usually married women. Though women are not active in meetings, that dominated by men, but in the real program implementation, like planting, farming, rearing, post-harvesting process, made energy-efficient stoves, and many hard working tasks, all are usually dominated by women.” (Evaluation # 110)
Evaluations related to the Global Climate Change sector also included examples of integrating gender equality and women’s empowerment into project design and implementation. Approaches included having a Gender Advisor on staff, focusing on gender equity in training and project activities, and developing gender integration toolkits.
Mongolia Retrofitting: “Both GIZ and the contractors noted that explicit efforts were made to hire female construction workers for the more detailed work (e.g., installation of insulation on facades, painting, laying of ceramic tile, installation of window sills) because in general, compared to men, their work was higher quality, they followed directions more carefully, and they were more reliable employees. The percentage of the permanent construction workers who were women varied among contractors. These percentages were zero percent, 11 percent, 30 percent, and 50 percent. The percentage of temporary construction workers who were women ranged from 30 to 60 percent. Also, of the four Mongolian construction companies engaged in this project, two are owned and directed by women, and the site manager for one of the construction companies was a woman.” (Evaluation # 112)
Cambodia HARVEST: “HARVEST includes a unit specifically dedicated to social inclusion and that unit’s impact is reflected in the program activities. HARVEST beneficiary selection procedures do not preclude women and HARVEST is achieving high levels of gender balance in its major activities. Overall female participation in the client base across all components is approximately 50% which surpasses its ambitious 45% target at this point in implementation. In the horticulture development activities, women represent 70% of the clientele. In the rice production activities, the female client target is 40% and, while the current 30% is not adequate, it indicates significant progress. The NTFP female client participation is 80% to date. HARVEST has been effective in increasing community tenure rights to prevent forests form being converted to ELC or smallholder agriculture which would destroy NTFP. The rattan processor groups supported by the program are almost exclusively women. Bamboo groups are mixed.” (Evaluation # 109)
Asia LEAF: “LEAF has increasingly focused on how gender inequalities influence key issues and activities. It strengthened that work by adding a Gender Advisor with international experience, increasing its total CA funding by $800,000 for gender activities, and ensuring that gender

SECTORAL SYNTHESIS OF 2013 -2014 EVALUATION FINDINGS: E3 BUREAU 99
coordinators were engaged at its major national coordination offices in Lao PDR and Vietnam. … Gender differences are considered in the critical analysis LEAF has carried out on the drivers of deforestation and forest degradation. However, the program’s analysis has not comprehensively included gender as an important factor related to institutional, policy and other elements of the enabling environment and markets. … LEAF developed an excellent Gender Mainstreaming Toolkit and Guidelines to integrate gender perspectives into program activities and REDD policy dialogues. Related to LEAF’s Climate Change Curriculum initiatives, it is not clear that all modules have sufficiently assessed how they address gender, youth and ethnic inclusion and deficiencies.” (Evaluation # 108)
Private Sector Engagement
Two of the six evaluations related to the Global Climate Change sector called for greater engagement of the private sector through Public Private Partnerships, either as an addition to the current approach to programing or noting a lack of successful private sector engagement even though this had been included in the original project design. Where the private sector was not as successfully engaged, additional work in the field of market development/supply chains was recommended.
Mexico MLED: “The project resulted in an increase in knowledge and skills in retrofitting technologies, particularly among the construction companies. This resulted from on-the-job training that GIZ provided to contractors during construction, as well as effective supervision. … Several contractors commented that they had not had prior experience with such high quality materials or with the specific installation techniques used for this project.” (Evaluation # 111)
Cambodia HARVEST: “As yet however, there is little evidence of any development of networks of organizations. Some vertical integration has been achieved, but this has been limited in most cases to the introduction of farmers to potential input suppliers, of MFIs to potential clients, of rice mills to producers and of horticultural producer groups to buyers…In particular, there has been no obvious attempt at arbitration or negotiation to ensure equitable business dealings, with the exception of HARVEST's interventions to reduce the costs of finance to farmers.” (Evaluation # 109)
One evaluation provided an example of increased capacity in the private sector to work with energy efficient retrofitting techniques through on-the-job training.
Mongolia Retrofitting: “The project achieved the goal of retrofitting the schools, but failed to incorporate additional elements that would have facilitated the use of these schools as a model
Evaluation Photo 14: Focus group participants for the Asia LEAF Evaluation # 108

SECTORAL SYNTHESIS OF 2013 -2014 EVALUATION FINDINGS: E3 BUREAU 100
in other communities, and thus the project appears to fail to address sustainability issues, and has minimal impact.” (Evaluation # 112)
Governance
Evaluations in the Global Climate Change sector noted that projects address governance issues in a variety of ways. While some projects work directly with or through the host country government, others promote technologies or approaches that governments may later adopt to achieve their emission reduction goals. Global Climate Change evaluations also pointed out the benefit of addressing governance issues in building local capacity.
Asia LEAF: “LEAF has worked with government agencies effectively where it (a) had a strong local partner or a partner that has already developed influence and credibility in engaging with government, or (b) was able to provide meaningful support for one or more of the government’s priority activities. Over the longer term, strengthening engagement among civil society, the government and private sector stakeholders appears to be key in building capacity.” (Evaluation # 108)
One evaluation provided an example of how to include local and international institutions in the project planning process.
Cambodia HARVEST: “Through a process that they reported as inclusive of all policy reform actors and institutions, primarily focused on the multitude of offices and divisions of MAFF and MoE, along with limited work with the Ministry of Water Resources and Meteorology, and USAID, they selected 15 areas of assistance in terms of policies, laws, and regulations. They also reportedly took into account programs and activities of other major donor partners in regards to policy reform, including EC, FAO, ADB, WB, IFC, AUSAID, JICA, AFD, and GIZ.” (Evaluation # 109)
Areas for Learning and Improvement
A variety of local capacity issues were mentioned as challenges to programming in five of the six, four of which related to lack of host government capacity as an obstacle to project success. However, the sixth evaluation identified successful capacity building as the projects most significant outcome.
Half of the projects were identified as having missed opportunities for sustainability or replicability.
Mongolia Retrofitting: “The project achieved the goal of retrofitting the schools, but failed to incorporate additional elements that would have facilitated the use of these schools as a model in other communities, and thus the project appears to fail to address sustainability issues, and has minimal impact.” (Evaluation # 112)
In three of the cases, despite the intention to target most needy and vulnerable populations, the evaluations concluded that projects failed to select the sites and beneficiaries that fit that description.
Indonesia Adapting: “In term of targeting the most needy villages or the most risky villages, the data shows that the program did not target the most needy (risky) villages, particularly in TTU and Lombok. WN confirmed that the village selection was not based on the Risk Level, but based on existing/previous intervention and/or partner's proposal.” (Evaluation # 110)

SECTORAL SYNTHESIS OF 2013 -2014 EVALUATION FINDINGS: E3 BUREAU 101
Key Lessons Learned
The desire to tailor services of Global Climate Change projects to various types of stakeholder groups were mentioned, including women, youth, and the elderly. However the need to provide support to the poor was the most often cited.
Swaziland, et. Al GDP: “Considerable effort needs to be invested in addressing the urgent needs for energy, water and other services of the poor in Southern Africa.” (Evaluation # 113)
Cambodia HARVEST: “It is difficult to provide support to the poorest in rural Cambodia, especially the youth and the elderly through production-based interventions. Such populations require an approach that is well tailored to their circumstances, especially to their lack of productive resources, and to their dependence upon employment as a source of income.” (Evaluation # 109)
Further, in communities in which climate change issues are less well known, gaining stakeholder buy-in may require expensing resources on public education in the early stages.
Indonesia Adapting: “An initial risk was that, when the project started, climate change was a new issue for all targeted districts. The risk management strategy was to start socializing climate adaptation through regular meetings, individually or through forum.” (Evaluation # 110)
Evaluations reported on the usefulness of/need for quantitative monitoring and evaluation data. There is an emphasis on technical data gathering, particularly for gathering and sharing data in order to build technical tools, knowledge, and expertise:
Mongolia Retrofitting: “To improve USAID's abilities to provide effective educational tools, the evaluation team recommends that future programming that involves the development of tools similar to the learning module prepared by this project include monitoring and evaluation of outcomes associated with the tool, including whether and how the tool was used, what aspects of the tool were more beneficial and why, and what aspects of the tool were less beneficial and why.” (Evaluation # 112)
Evaluation Photo 15: Project beneficiaries visited during the Asia LEAF Evaluation # 106

SECTORAL SYNTHESIS OF 2013 -2014 EVALUATION FINDINGS: E3 BUREAU 102
Asia LEAF: “LEAF should document and track how the program is supporting the emergence of a critical mass of experts in each targeted country. LEAF should increase exchanges of learning from the Vietnam REDD+ and PFES.” (Evaluation # 108)
Mongolia Retrofitting: “To increase the accuracy of estimated energy and GHG benefits of projects of this kind, the evaluation team recommends that future similar programming include: ï‚· Collection of annual coal consumption data for the buildings prior to the retrofits and after the retrofits, and collection of information on coal characteristics (calorific values, moisture contents), sources (mines and mine characteristics), transport conditions (distance, mode), and prices (variability by quality and time of purchase).” (Evaluation # 112)
In relation to project design, evaluations highlighted lessons about to programs being improperly scoped. Problems ranged from designs lacking proper contextual understanding, to being overly prescriptive. Suggested solutions include increased time and effort dedicated to preliminary scoping and the development of more flexible designs.
Asia LEAF: “The LEAF Program should consolidate its regional platform work to maximize impact.” (Evaluation # 108)
Swaziland, et al. DGP: “Project designs should allow for flexibility in response to changing circumstances. Overly prescriptive and detailed project designs can deter positive project adjustments.” (Evaluation # 113)
Cambodia HARVEST: “The limited understanding of the restrictions upon sustainable natural resource management expressed in the AAD and HARVEST contract suggest that a short (one year) preliminary learning program might have been appropriate to scope out a longer term program such as HARVEST.” (Evaluation # 109)
Other lessons learned included the need to fully assess the capacity of project partners, in particular of the IP, during the project design phase. Failure to do so can lead to overstretched implementers, strained relationships with beneficiaries, and inability to deliver services promised.
Mexico MLED: “The program has 167 activities, many of which depend on external partnerships (w.g., with Govt ministries) for completion. However, the implementer has a small staff, and it may not be feasible to develop that many relationships. A finding of the evaluation, which could be a good lessons learned, is that the mission should work with the IP to prioritize and reduce the number of activities.” (Evaluation # 111)
Swaziland, et al. GDP: “The capacity of project partners to deliver what is expected of them needs to be carefully assessed in project design if the project is not to be undermined by lack of delivery on the part of key stakeholders in government and community institutions.” (Evaluation # 113)
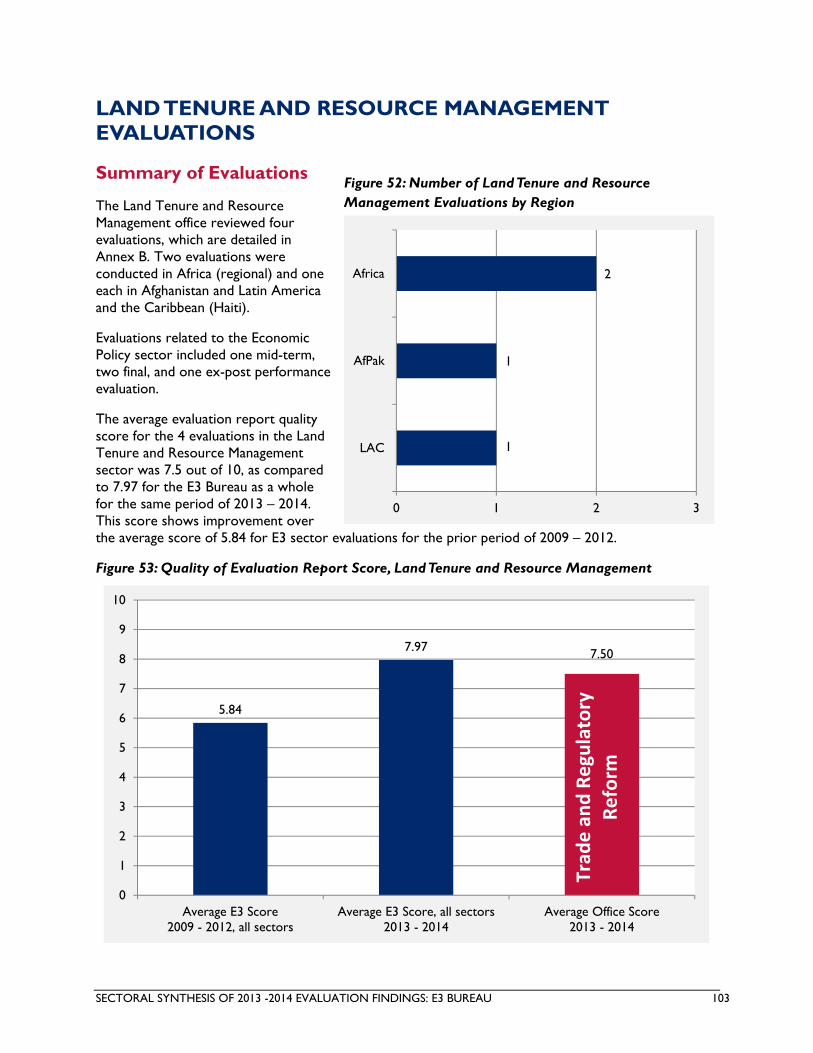
SECTORAL SYNTHESIS OF 2013 -2014 EVALUATION FINDINGS: E3 BUREAU 103
LAND TENURE AND RESOURCE MANAGEMENT EVALUATIONS
Summary of Evaluations
The Land Tenure and Resource Management office reviewed four evaluations, which are detailed in Annex B. Two evaluations were conducted in Africa (regional) and one each in Afghanistan and Latin America and the Caribbean (Haiti).
Evaluations related to the Economic Policy sector included one mid-term, two final, and one ex-post performance evaluation.
The average evaluation report quality score for the 4 evaluations in the Land Tenure and Resource Management sector was 7.5 out of 10, as compared to 7.97 for the E3 Bureau as a whole for the same period of 2013 – 2014. This score shows improvement over the average score of 5.84 for E3 sector evaluations for the prior period of 2009 – 2012.
Figure 53: Quality of Evaluation Report Score, Land Tenure and Resource Management
5.84
7.97 7.50
0
1
2
3
4
5
6
7
8
9
10
Average E3 Score2009 - 2012, all sectors
Average E3 Score, all sectors2013 - 2014
Average Office Score2013 - 2014
1
1
2
0 1 2 3
LAC
AfPak
Africa
Figure 52: Number of Land Tenure and Resource Management Evaluations by Region
Trad
e and Regulatory
Reform

SECTORAL SYNTHESIS OF 2013 -2014 EVALUATION FINDINGS: E3 BUREAU 104
As compared to E3 evaluation as a whole, evaluations in the Land Tenure and Resource Management sector were considerably more likely to address innovation, as well as areas for learning and improvement and lessons learned. Land Tenure and Resource Management sector evaluations were less likely to address private sector engagement.
Figure 54: Percent of Land Tenure and Resource Management Evaluations that Addressed Each Topic Area
84%
81%
66%
62%
44%
78%
74%
100%
100%
75%
25%
75%
75%
75%
0% 20% 40% 60% 80% 100%
Lessons Learned
Learning and Improvement
Governance
Private Sector Engagement
Innovative Practices
Performance Targets
Project Outcomes
Land Tenure & Resource Management (n = 4) E3 Average (n = 117)
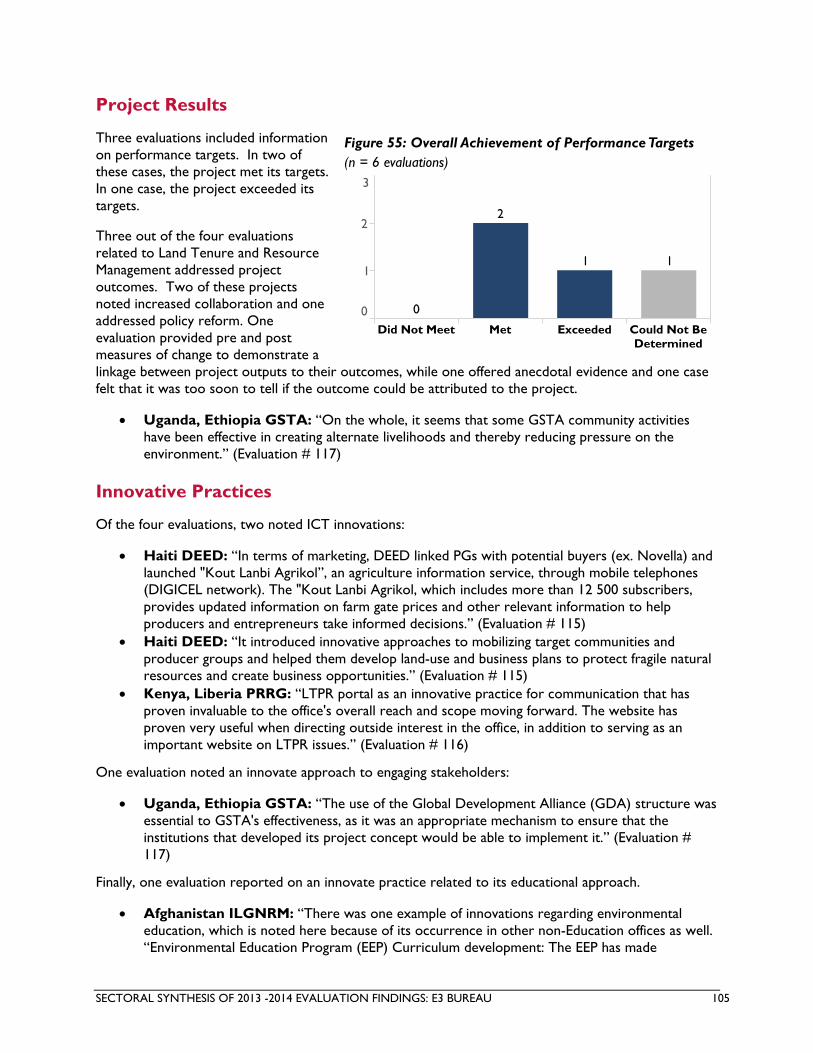
SECTORAL SYNTHESIS OF 2013 -2014 EVALUATION FINDINGS: E3 BUREAU 105
Project Results
Three evaluations included information on performance targets. In two of these cases, the project met its targets. In one case, the project exceeded its targets.
Three out of the four evaluations related to Land Tenure and Resource Management addressed project outcomes. Two of these projects noted increased collaboration and one addressed policy reform. One evaluation provided pre and post measures of change to demonstrate a linkage between project outputs to their outcomes, while one offered anecdotal evidence and one case felt that it was too soon to tell if the outcome could be attributed to the project.
Uganda, Ethiopia GSTA: “On the whole, it seems that some GSTA community activities have been effective in creating alternate livelihoods and thereby reducing pressure on the environment.” (Evaluation # 117)
Innovative Practices
Of the four evaluations, two noted ICT innovations:
Haiti DEED: “In terms of marketing, DEED linked PGs with potential buyers (ex. Novella) and launched "Kout Lanbi Agrikol”, an agriculture information service, through mobile telephones (DIGICEL network). The "Kout Lanbi Agrikol, which includes more than 12 500 subscribers, provides updated information on farm gate prices and other relevant information to help producers and entrepreneurs take informed decisions.” (Evaluation # 115)
Haiti DEED: “It introduced innovative approaches to mobilizing target communities and producer groups and helped them develop land-use and business plans to protect fragile natural resources and create business opportunities.” (Evaluation # 115)
Kenya, Liberia PRRG: “LTPR portal as an innovative practice for communication that has proven invaluable to the office's overall reach and scope moving forward. The website has proven very useful when directing outside interest in the office, in addition to serving as an important website on LTPR issues.” (Evaluation # 116)
One evaluation noted an innovate approach to engaging stakeholders:
Uganda, Ethiopia GSTA: “The use of the Global Development Alliance (GDA) structure was essential to GSTA's effectiveness, as it was an appropriate mechanism to ensure that the institutions that developed its project concept would be able to implement it.” (Evaluation # 117)
Finally, one evaluation reported on an innovate practice related to its educational approach.
Afghanistan ILGNRM: “There was one example of innovations regarding environmental education, which is noted here because of its occurrence in other non-Education offices as well. “Environmental Education Program (EEP) Curriculum development: The EEP has made
Figure 55: Overall Achievement of Performance Targets (n = 6 evaluations)

SECTORAL SYNTHESIS OF 2013 -2014 EVALUATION FINDINGS: E3 BUREAU 106
substantial contributions to environmental curriculum and continues to innovate on this front. These efforts address a critical gap given the low level of awareness of environmental threats and sound practices at the community level.” (Evaluation # 114)
Gender Equality and Women’s Empowerment
The four evaluations reviewed under the Land Tenure and Resource Management sector provided insight into the gender equality and women’s empowerment aspects of project outputs and outcomes, but tended not to provide sex-disaggregated data. All four analyzed both outputs and outcomes in terms of gender equality and/or female empowerment and all four explained program access and/or outcomes differently for men and women when data were person focused. Similarly, all four showed evidence that the projects were designed or implemented in ways that integrate gender equality and/or women’s empowerment. However, none of the evaluations disaggregated data at all levels when data were person focused and only 50% of those had any disaggregated data at all.
Haiti DEED: “(1) As a result of DEED assistance, about 1/3 of individuals (30%) with increased economic benefits derived from sustainable natural resource management and conservation were women. Thus, DEED has improved the economic status of women in the Montrouis and Limbé watershed. (2) This achievement resulted from DEED technical assistance to 12 women’s organizations/associations directly involved in the execution of project activities and a series of trainings (e.g. crop production, harvest/post-harvest, marketing, and natural resources management and/or biodiversity conservation). These interventions helped built women’s capacity and empower them for taking a leadership role in NRM and watershed management.” (Evaluation # 115)
Uganda, Ethiopia GSTA: “In one area there did seem to be a significant difference between the benefits accruing to men and women. In Uganda, men working as tour guides in Katwe were paid for each day they worked, whereas women performing for tourists were not paid for each performance. The community members discussing this responded that the women received their share of the overall income of the community enterprise; however, the men receive that share as well in addition to being paid for each day worked. In the Batwa area, both performers and tour guides are paid, but the guides are paid more than the performers. The impression conveyed in discussing this issue was that men are expected to bring in money, whereas women are expected to undertake unpaid household labor, so it appeared to be more important that men be paid for their work than women. When questions were raised about this in Katwe, community members eventually seemed to perceive that there could be a discrepancy and said they would have to rethink the issue. However, they may have been humoring the (female) foreign consultant rather than taking it seriously.” (Evaluation # 117)
The evaluations noted that each of the projects included gender in project design and implementation, though for one it was only after a gender analysis part way through the project spurred greater attention to the issue.
Kenya, Liberia PRRG: “In Rwanda, technical assistance from the Land Policy and Law project was instrumental in helping ensure that the government’s Land Tenure Reform Programme recognized women’s property rights and did not result in dispossession of widows." "Both the community legal aid activity in Rwanda’s Land Policy and Law project and the Kenyan Justice project in the Mau Forest worked with customary institutions and authorities to increase access for women. The projects helped women assert their property rights effectively by providing training for customary decision-makers on legal standards relating to women’s rights of control over marital property, property division and transfer, and inheritance rights.” (Evaluation # 116)

SECTORAL SYNTHESIS OF 2013 -2014 EVALUATION FINDINGS: E3 BUREAU 107
Uganda, Ethiopia GSTA: “Gender was not an explicit a focus of any GSTA activities. That said, all community activities showed a clear differentiation of roles according to gender, which suggests that this may have been assimilated into project design as a matter of course. Gender differences did not lead to unintended consequences in projects; it was clear to all involved that the roles and impacts of men and women would differ in a way that integrated gender in their design.” (Evaluation # 117)
Afghanistan ILGNRM: “In June 2012 Checchi and Company Consulting, Inc. completed a Gender Analysis of the project under the USAID/Afghanistan SUPPORT II contract. The evaluator concluded that the project had demonstrated minimal focus on women’s participation outside of the cook stove and environmental education activities. It also concluded that the project had not engaged women in decision-making, developed their decision-making capacity, or increased their potential for income generation at a meaningful level. In the year since this report, the project’s Gender and Livelihoods team has substantially ramped up staff resources with the fielding of an international Gender and Livelihoods Advisor in early 2013, recruitment of two local women to assist with livelihoods outreach in Band-e-Amir and the Wakhan, recruitment of a national Gender Specialist in Kabul, and participation of another Kabul-based Education Assistant in livelihoods activities (all five women).” (Evaluation # 114)
Private Sector Engagement
One evaluation from the Land Tenure and Resource Management sector addressed private sector engagement in terms of leveraging private sector investments with watershed development and building relationships with local producers through public-private alliances.
Haiti DEED: “DEED applied a market-based approach of high-value crops coupled with sound natural resource management (NRM) and expanded business and job opportunities as a means to sustain economic development…Promoting alliances with the private sector to leverage DEED resources DEED established alliances with the private sector to leverage DEED resources.” (Evaluation # 115)
Governance
Evaluations in the Land Tenure and Resource Management sector addressed the need for collaboration with local institutions as well as government capacity building.
Haiti DEED: “DEED valued participatory planning and partnership with the local governments, community-based organizations (CBOs), producer groups (PGs) and business owners to deliver technical services, training and business support to
Evaluation Photo 16: Mapping of intervention sites from the
Haiti DEED Evaluation # 115
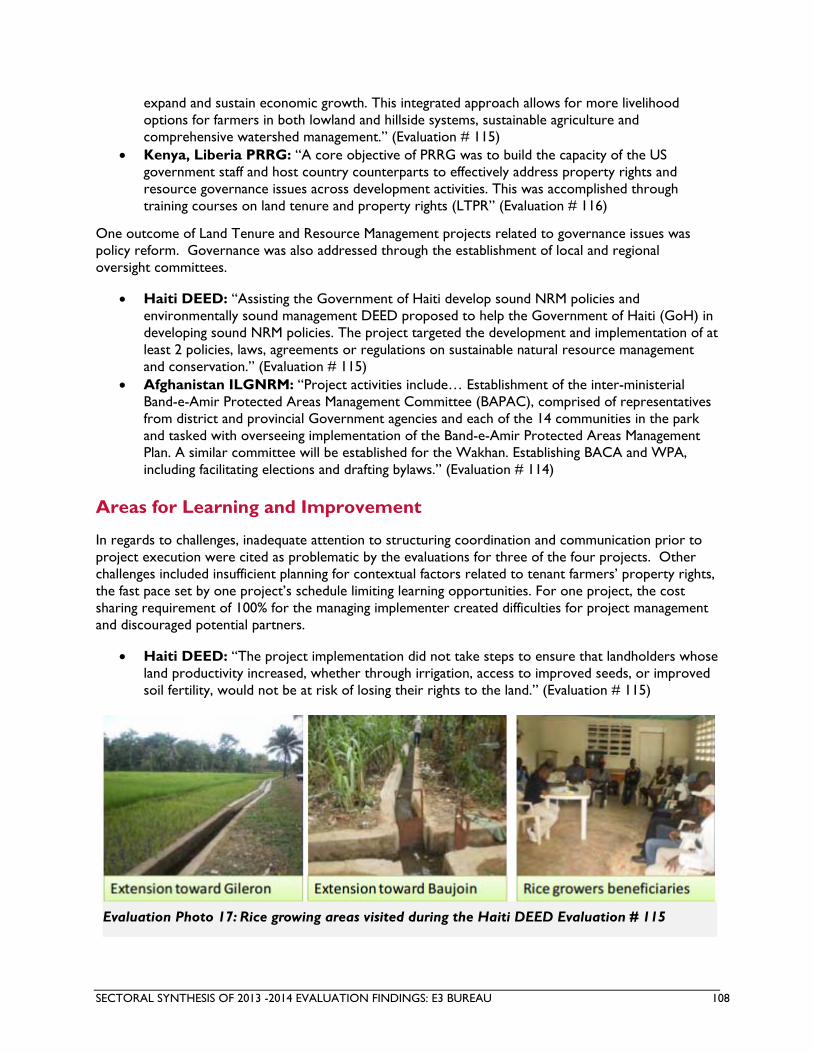
SECTORAL SYNTHESIS OF 2013 -2014 EVALUATION FINDINGS: E3 BUREAU 108
expand and sustain economic growth. This integrated approach allows for more livelihood options for farmers in both lowland and hillside systems, sustainable agriculture and comprehensive watershed management.” (Evaluation # 115)
Kenya, Liberia PRRG: “A core objective of PRRG was to build the capacity of the US government staff and host country counterparts to effectively address property rights and resource governance issues across development activities. This was accomplished through training courses on land tenure and property rights (LTPR” (Evaluation # 116)
One outcome of Land Tenure and Resource Management projects related to governance issues was policy reform. Governance was also addressed through the establishment of local and regional oversight committees.
Haiti DEED: “Assisting the Government of Haiti develop sound NRM policies and environmentally sound management DEED proposed to help the Government of Haiti (GoH) in developing sound NRM policies. The project targeted the development and implementation of at least 2 policies, laws, agreements or regulations on sustainable natural resource management and conservation.” (Evaluation # 115)
Afghanistan ILGNRM: “Project activities include… Establishment of the inter-ministerial Band-e-Amir Protected Areas Management Committee (BAPAC), comprised of representatives from district and provincial Government agencies and each of the 14 communities in the park and tasked with overseeing implementation of the Band-e-Amir Protected Areas Management Plan. A similar committee will be established for the Wakhan. Establishing BACA and WPA, including facilitating elections and drafting bylaws.” (Evaluation # 114)
Areas for Learning and Improvement
In regards to challenges, inadequate attention to structuring coordination and communication prior to project execution were cited as problematic by the evaluations for three of the four projects. Other challenges included insufficient planning for contextual factors related to tenant farmers’ property rights, the fast pace set by one project’s schedule limiting learning opportunities. For one project, the cost sharing requirement of 100% for the managing implementer created difficulties for project management and discouraged potential partners.
Haiti DEED: “The project implementation did not take steps to ensure that landholders whose land productivity increased, whether through irrigation, access to improved seeds, or improved soil fertility, would not be at risk of losing their rights to the land.” (Evaluation # 115)
Evaluation Photo 17: Rice growing areas visited during the Haiti DEED Evaluation # 115

SECTORAL SYNTHESIS OF 2013 -2014 EVALUATION FINDINGS: E3 BUREAU 109
Key Lessons Learned
The most commonly reported lesson learned had to do with the importance of early and continual stakeholder engagement. This helps to promote community ownership and buy-in in order to assure the sustainability of the interventions, which is especially important with land tenure programs. Different techniques included creating a steering committee with multi-stakeholder representation and the use of a local national for the position of DCOP to serve as the “community relations face”.
Kenya, Liberia PRRG: “Develop and promote the use of country nationals. It was noted that some buy-in projects had difficulties with community relations. This occurred for varying reasons, but one aspect seems to involve cultural perceptions of the project. In at least one case it was reported that communities were slow to warm up to a foreign project leader and to understand that the project was for their benefit.” (Evaluation # 116)
Haiti DEED: “The creation of a steering committee with multi-stakeholder representatives including the implementing agency and relevant ministries (e.g. MARNDR, MDE), local authorities (Mayor, CASECs, ASECs) and community leaders could facilitate planning of project activities, and ensure continuity of the interventions as the project ends. Local GOH institutions of the steering committee would also strengthen, gain ownership during project implementation, and take over as the project ends.” (Evaluation # 115)
One Land Tenure Resource Management project used results based management techniques throughout the implementation process in order inform programming make changes when necessary in-real time. It was reported that the project benefited from the changes. Another project conducted assessments using social networking tools during implementation but did not use them to make changes, though they recommended that future projects do so.
Kenya, Liberia PRRG: “Conduct various kinds of evaluations and assessments throughout the project, study the results in a timely fashion, and make any course corrections indicated without delay. The PRADD projects have demonstrated the value of conducting different kinds of assessments throughout a project, evaluating the results critically and in a timely fashion, and using the results to benefit the project during the lifespan of the project.” (Evaluation # 116)
Uganda, Ethiopia GSTA: “Social network analysis tools were used to analyze some GSTA activities, but the results were not used in project design or implementation due to research timing. This may be an interesting tool to strengthen future projects.” (Evaluation # 117)

SECTORAL SYNTHESIS OF 2013 -2014 EVALUATION FINDINGS: E3 BUREAU 110
ANNEX A: STATEMENT OF WORK
Statement of Work E3 Sectoral Synthesis for 2013-14
1. Introduction and Background
In 2013, USAID’s Bureau for Economic Growth, Education and Environment (E3) broke new ground with the development of a Sectoral Synthesis Report on 2012 Evaluation Findings. This report summarized both technical findings from 2012 evaluation reports that examined projects in E3 sectors as well as what the Bureau learned during the review about the quality of its evaluations and how they might be improved. The report was shared with USAID Missions around the world and was received with appreciation by Bureau management, which has requested that the Bureau reprise this effort to examine evaluations completed between January 1, 2013 and September 30, 2014.
In order to prepare the new Sectoral Synthesis Report on 2013-14 Evaluation Findings, USAID has requested support from the E3 Analytics and Evaluation Project.7 The Project’s support is expected to include the development of meta-analysis and meta-evaluation instruments, providing staff to conduct a meta-evaluation of the 2013-14 evaluation reports, training E3 M&E staff on the use of the meta-analysis, data analysis and synthesis of findings from the meta-analysis and meta-evaluation efforts, drafting the Sectoral Synthesis Report, presenting on the findings from the Sectoral Synthesis and managing the overall effort to prepare the new Sectoral Synthesis Report. As with the previous report, this is expected to be a highly participatory learning exercise for the E3 Bureau. An interactive and highly collaborative process is envisioned, with M&E staff from each E3 office carrying out the meta-analysis of evaluation findings and E3 Analytics and Evaluation Project staff reviewing the quality of evaluation reports. The findings from both aspects of the review will be integrated into an informative and even more comprehensive report than the 2012 Sectoral Synthesis.
2. Existing Information Sources
The Sectoral Synthesis Report on 2012 Evaluation Findings and corresponding data files will be shared with the E3 Analytics and Evaluation Project team as the starting point for designing the data collection instruments and process envisioned for developing the 2013-14 report. USAID will provide the Project team with data from FY13 and FY14 Performance Plan and Reports (PPRs) in order to define the universe of evaluations to be included in this new report. The Project team will also base the meta-evaluation instruments to be used for this review on the meta-evaluation checklists developed under the Meta-Evaluation of Quality and Coverage of USAID Evaluations, 2009-2012.8
3. Purpose, Audience, and Intended Use
Purpose and Intended Use
The purpose of the assistance rendered under this activity is to disseminate knowledge gained across all E3 evaluations in order to inform and improve future programming and project design, as well lessons learned to improve the quality of future USAID evaluations. The process involved in preparing the report is also intended to have a learning component for E3 M&E staff who will be involved in the meta-
7 Management Systems International (MSI) is the lead implementer of the E3 Analytics and Evaluation Project, along with team partners Development & Training Services, Inc. (dTS) and NORC at the University of Chicago. 8 See: http://pdf.usaid.gov/pdf_docs/PDACX771.pdf

SECTORAL SYNTHESIS OF 2013 -2014 EVALUATION FINDINGS: E3 BUREAU 111
analysis, to develop greater understanding as to the technical lessons from recent USAID evaluation reports and the overall quality of evaluations conducted on projects in E3 sectors.
Audience
The primary audience for the deliverables generated under this activity is E3 Bureau senior management. The Project will also work with the Communications and Knowledge Management (CKM) unit of E3's Planning, Learning and Coordination (PLC) Office in order to develop a dissemination and utilization plan for USAID/Washington and USAID Missions.
4. Support Tasks
The tasks outlined in this section are based on the current anticipated USAID needs to prepare the Sectoral Synthesis Report on 2013-14 Evaluation Findings, and will be refined in collaboration between USAID and the E3 Analytics and Evaluation Project team.
1. Preparing and Updating Data Collection Tools o Meta-analysis – The Project team will support USAID in revising and expanding the data
collection tool used in 2012 Sectoral Synthesis Report to extract substantive findings from evaluation reports. These revisions will focus on aligning the questions around technical thematic areas so as to capture emerging, promising and good practices, and allow for aggregation within and across sectors. The questions will also be revised to reduce ambiguity for the scorers. The meta-analysis tool is attached as Annex A.
o Meta-evaluation - The Project team will review those meta-evaluation questions about evaluation quality that were included in the tool used in the 2012 Synthesis Report, and integrate them with checklists from the Meta-Evaluation of Quality and Coverage of USAID Evaluations 2009-2012 report in order to prepare a final meta-evaluation scoring tool. The updated meta-evaluation checklist is attached as Annex B.
o Supplemental Gender Analysis – The Project team will develop additional questions to address how gender equity and women’s empowerment are dealt with in the evaluation reports. The gender analysis data collection tool is attached as Annex C.
2. Defining the Data Set o The Project team will work to define the universe of evaluations to be included in this
report. The universe will be based on those evaluations completed in the defined time period (January 1, 2013 to September 30, 2014) relevant to E3 sectors (linked to standard foreign assistance Program Elements) that are publicly available on USAID’s Development Experience Clearinghouse (DEC). These evaluations will be identified based on the FY13 and FY14 PPRs to be shared by USAID as well as searching the DEC.
3. Extraction of Substantive Findings for the Meta-Analysis o The Project team will hold a refresher training on the updated meta-analysis tool and
will help the E3 M&E staff calibrate their approaches to the meta-analysis task. o Once the universe of evaluations for inclusion in this new synthesis is confirmed, sets of
evaluations will be sent to E3 offices to have their staff extract important topical and management-related evaluation findings by office.
4. Meta-Evaluation and Gender Scoring o Staff from the Project will conduct a parallel review on the quality of evaluation reports
using the meta-evaluation tool developed. The same universe of evaluations that will receive the meta-analysis review will be the subject of this meta-evaluation. Prior to the team commencing this review, training sessions and inter-rater reliability calibration will be conducted with team members to ensure consistency in the scoring of evaluation reports.

SECTORAL SYNTHESIS OF 2013 -2014 EVALUATION FINDINGS: E3 BUREAU 112
o This review will also allow for the comparison of the E3 Bureau’s average evaluation quality “score” for 2013-2014 to its average score on those same factors in the earlier, Agency-wide meta-evaluation.
o Staff from the project will extract data related to gender equality and women’s empowerment using the supplemental gender analysis tool.
5. Analysis o Following completion of the meta- analysis, meta-evaluation, and gender analysis
reviews, the Project will organize a collaborative cross-office workshop to identify findings and lessons that cut across offices, as well as findings from this new synthesis review that echo findings published in the first synthesis report.
o The Project team will then systematically organize and analyze the data from the meta-analysis, meta-evaluation, and gender analysis reviews, and prepare a draft report for USAID.
o A validation session, in which all of the participating E3 office-level M&E staff will review the synthesized findings, study conclusions, and preliminary recommendations, will be held to ensure that final interpretations of what the Bureau has learned reflect individual perceptions and collective knowledge based on this review process.
6. Dissemination and Utilization o As part of the validation session, the team as a whole will work to conceptualize a
dissemination and utilization plan for the Sectoral Synthesis Report, consolidating ideas from each office about what can collectively be done to apply the lessons from this new synthesis going forward. The development of the dissemination and utilization plan will involve personnel from the E3 PLC/CKM unit.
5. Data Collection Methods
There are three primary data collection elements for this Sectoral Synthesis. Two scoring checklists will be developed, one to be prepared and completed by the Project team for the meta-evaluation quality review of evaluation reports, and the other to be prepared collaboratively between the Project and E3 teams and completed by E3 staff for the meta-analysis of technical lessons from the evaluation reports. A third data collection instrument will be prepared and completed by the Project team to collect additional information for the gender analysis.
6. Data Analysis Methods
Statistical software will be used by the Project team to combine and analyze the data from the two data collection tools. The sectoral synthesis report will include descriptive statistics on findings from the data set. In addition, the Project team will conduct content analysis of the qualitative data collected through the meta-analysis checklist, using MAXQDA or similar software to extract trends as appropriate.
7. Gender Considerations
USAID requires that project designs, performance monitoring and evaluations adequately address gender concerns outlined in USAID’s Gender Policy. The Sectoral Synthesis Report on 2013-14 Evaluation Findings will include analysis of how gender equality and women’s empowerment are integrated into project design and project implementation, as well as how they represented in evaluation findings and project results. This analysis will be done across E3 and also at the office level where possible.

SECTORAL SYNTHESIS OF 2013 -2014 EVALUATION FINDINGS: E3 BUREAU 113
8. Deliverables and Reporting Requirements
The following deliverables are envisioned as part of this support activity.
Deliverable Estimated Due Date
1. Draft meta-analysis data collection tool (checklist) o/a January 16, 2015
2. Draft Sectoral Synthesis Report on 2013-14 Evaluation Findings
o/a April 30, 2015
3. Final Sectoral Synthesis Report on 2013-14 Evaluation Findings
o/a May15, 2015 (depending on timely receipt of USAID feedback on draft report)
All documents will be provided electronically to USAID no later than the dates indicated above, pending further discussion with USAID about the schedule for this activity. All debriefs will include a formal presentation with slides delivered both electronically and in hard copy for all attendees.
9. Team Composition
The support team for this activity is expected to consist of the following members:
Technical Director: Will provide overall guidance on the technical direction of the synthesis, including review of the tools developed and oversight of the data analysis and report preparation. Responsible for the overall quality of the reports prepared for USAID/E3 under this support activity. The Technical Director should have extensive experience with designing and reviewing evaluations and familiarity with USAID evaluation policy and guidance.
Activity Coordinator: Will support the Project team to ensure the successful completion of the required deliverables and all tasks and sub-tasks. This may include drafting of data collection instruments, training and managing the Project team carrying out the meta-evaluation review, conducting data analysis tasks and preparing inputs for the required reports. The Activity Coordinator should have familiarity with USAID evaluation policy and guidance.
Additional Researchers: A team of researchers is expected to support the meta-evaluation review, including participating in training and inter-rater reliability calibration exercises, and reviewing and scoring the evaluations according to the established checklist. Relevant experience with evaluations and familiarity with USAID evaluation policy and guidance is preferred.
Home Office support by the E3 Analytics and Evaluation Project team members will be provided to the activity team, including technical guidance, research assistance, administrative oversight, data analysis, and logistical support.
10. USAID Participation
An interactive and collaborative process is envisioned between the E3 Analytics and Evaluation Project team and USAID/E3 to carry out this activity. The E3 office-level M&E staff will form an integral part of the data collection team for the meta-analysis. This team, as well as the PLC/CKM unit in E3, will also participate in a validation workshop to develop the report dissemination and utilization plan.
11. Schedule
Tasks included in this SOW are expected to be completed between December 2013 and May 2015.

SECTORAL SYNTHESIS OF 2013 -2014 EVALUATION FINDINGS: E3 BUREAU 114
ANNEX B: EVALUATION REFERENCE LIST
Economic Growth – Economic Policy – 14 Evaluations # Country Evaluation Name Project Description DEC URL
1 Bolivia
Final evaluation : Bolivian productivity and competitiveness project (BPC)
BPC was designed to increase productivity and sales of micro, small and medium enterprises (MSMEs) The project was implemented to help the development of sectors including textiles, manufacturing, processed foods, bio-products and handicrafts.
http://pdf.usaid.gov/pdf_docs/PDACU955.pdf
2 Bosnia and Herzegovina
Performance evaluation : USAID Bosnia & Herzegovina PARE activity
The PARE activity was designed to advance financial sector development in Bosnia and Herzegovina. While a broad range of financial subsectors and institutions were covered, the primary focus was on strengthening banking supervision and deposit insurance, the subject areas of this evaluation.
http://pdf.usaid.gov/pdf_docs/PA00JP6T.pdf
3 Colombia
Post-implementation evaluation of the programs More Investment in Sustainable Alternative Development (MIDAS) and Areas for Municipal-Level Alternative Development (ADAM)
This evaluation covers two USAID/Colombia programs that aimed to improve conditions for rural citizens through productive projects; community participation; social infrastructure development; forestry projects; support to agribusinesses, micro-enterprises, small-and medium-sized enterprises (SMEs); strengthening municipal governments; improving access to credit; and public policy development.
http://pdf.usaid.gov/pdf_docs/PA00JRMK.pdf
4 El Salvador
Final performance evaluation of the USAID municipal competitiveness project in El Salvador
MCP was designed to improve the competitiveness of Salvadoran municipalities through the development of a model with inter-related components designed to (1) enhance municipal effectiveness and efficiency, (2) measure the local business climate, (3) encourage private-public and inter-jurisdictional engagement and dialogue, and (4) provide incentive funds to encourage municipalities to mobilize financial resources for improving economic development and security.
http://pdf.usaid.gov/pdf_docs/PA00JQ4Q.pdf

SECTORAL SYNTHESIS OF 2013 -2014 EVALUATION FINDINGS: E3 BUREAU 115
Economic Growth – Economic Policy – 14 Evaluations # Country Evaluation Name Project Description DEC URL
5 Georgia
Mid-term performance evaluation of the Georgia economic prosperity initiative (EPI)
EPI is designed to improve enterprise, industry, and country-level competitiveness in Georgia. EPI's assistance to firms in agricultural, manufacturing and the service sectors aims to increase investment; open new markets; raise productivity; drive domestic and export sales; and create jobs
http://pdf.usaid.gov/pdf_docs/PDACY472.pdf
6 Kenya
Evaluation of the USAID-KARI partnership for increased rural household incomes (2004-2013)
The KARI component of Agriculture Development Support Project (ADSP) aimed to increase participation and efficiency of the private sector in supplying agricultural inputs to smallholders and providing output market services. The evaluated partnership included a focus on biotechnology, maize, dairy, soil fertility and horticulture.
http://pdf.usaid.gov/pdf_docs/PDACX749.pdf
7 Liberia Smallholder oil palm support (SHOPS) final impact evaluation
SHOPS was designed to foster grassroots economic growth in rural Liberia by building local capacity in technological manufacturing and commercialization; agricultural production and processing; and small business development.
http://pdf.usaid.gov/pdf_docs/PA00K1K9.pdf
8 Nepal
Nepal economic, agriculture, and trade (NEAT) activity performance evaluation
NEAT was designed to provide assistance in building the foundations for rapid, sustained, and inclusive economic growth, which will theoretically lessen pressures caused by conflict, reduce poverty, and improve lives.
http://pdf.usaid.gov/pdf_docs/PA00JWVC.pdf
9 Serbia
Mid-term performance evaluation of the USAID/Serbia sustainable local development project (SLDP)
SLDP was designed to contribute to both USAID economic growth and good governance goals by supporting municipalities, business advocacy organizations, and civil society organizations (CSOs) to move beyond municipality-by-municipality solutions in favor of cooperative, inter-municipal approaches to improving public services and invigorating their economies.
http://pdf.usaid.gov/pdf_docs/PDACX763.pdf
10 Somalia
Mid-term performance evaluation of the Somalia partnership for economic growth program
PEG works closely with private sector businesses, government ministries, non-governmental organizations (NGOs), and civil society organizations (CSOs) to promote economic growth and stabilization in Somaliland and Puntland. Program activities focus on two areas: private sector development and strengthening specific productive value chains.
http://pdf.usaid.gov/pdf_docs/PA00K3B6.pdf

SECTORAL SYNTHESIS OF 2013 -2014 EVALUATION FINDINGS: E3 BUREAU 116
Economic Growth – Economic Policy – 14 Evaluations # Country Evaluation Name Project Description DEC URL
11 Sri Lanka Evaluation : USAID/Sri Lanka eastern garment alliance (EGA) project
The EGA project’s aim is to boost social and economic development in Sri Lanka’s Ampara District by increasing incomes through direct employment of 1000 people in three apparel factories, with a goal towards increasing prosperity and stability in the district.
http://pdf.usaid.gov/pdf_docs/PDACW255.pdf
12 Timor-Leste
Performance evaluation of the USAID/Timor-Leste consolidating cooperative and agribusiness recovery (COCAR) project
COCAR is a follow-on project to the Timor Economic Rehabilitation and Development Project (TERADP). Like TERADP before it, COCAR's agriculture interventions include applied research and development activities to promote the commercial development of resource poor farm families.
http://pdf.usaid.gov/pdf_docs/PDACX381.pdf
13 Ukraine
Final performance evaluation of the financial sector rehabilitation project (FINREP) in Ukraine
The goal of FINREP is to assist Ukraine in building a sound, transparent and resilient financial system. In particular, the project has focused on capacity building with financial institutions.
http://pdf.usaid.gov/pdf_docs/PDACX380.pdf
14 Ukraine
Evaluation of local investment and national competitiveness: final performance evaluation
The LINC project was designed to improve the business and investment environment as measured through progress in enterprise indices, increases in investment activity, and enterprise competitiveness.
http://pdf.usaid.gov/pdf_docs/PA00JZTF.pdf

SECTORAL SYNTHESIS OF 2013 -2014 EVALUATION FINDINGS: E3 BUREAU 117
Economic Growth – Trade and Regulatory Reform – 9 Evaluations No. Country Evaluation Name Project Description DEC URL
15 Azerbaijan
Final performance evaluation of the Azerbaijan competitiveness and trade (ACT) project
ACT was designed to help eliminate or mitigate technical and administrative barriers that were deemed to be hindering economic progress in Azerbaijan with respect to private sector development.
http://pdf.usaid.gov/pdf_docs/PDACY063.pdf
16 Bangladesh
Poverty reduction by increasing the competiveness of enterprises (PRICE) final performance evaluation
The main mission of PRICE project was to sustainably reduce poverty by increasing enterprise competitiveness across three main sectors in Bangladesh: horticulture, aquaculture, and leather.
http://pdf.usaid.gov/pdf_docs/PA00JTTP.pdf
17
Ethiopia, Ghana, Senegal, Kenya, Mauritius, Tanzania, Uganda, Rwanda
Africa trade hubs export promotion evaluation
USAID’s Africa Trade Hubs operate under the development hypothesis that AGOA trade access, coupled with USAID technical assistance and training activities, will help achieve the development goal of expanding non-traditional exports from sub-Saharan Africa to the U.S. and other destinations.
http://pdf.usaid.gov/pdf_docs/PDACX958.pdf
18
Indonesia, Singapore, Malaysia, Australia, Peru, Japan, Thailand, Vietnam, People's Republic of China, South Korea
APEC U.S. TATF mid-term contractor evaluation
USAID/RDMA created a project to establish the TATF “in furtherance of U.S. foreign policy goals of greater Regional Economic Integration and to strengthen APEC as a regional institution.” The APEC TATF would work in three technical areas: (1) trade and investment liberalization; (2) business facilitation; and (3) economic and technical cooperation.
http://pdf.usaid.gov/pdf_docs/PDACW256.pdf
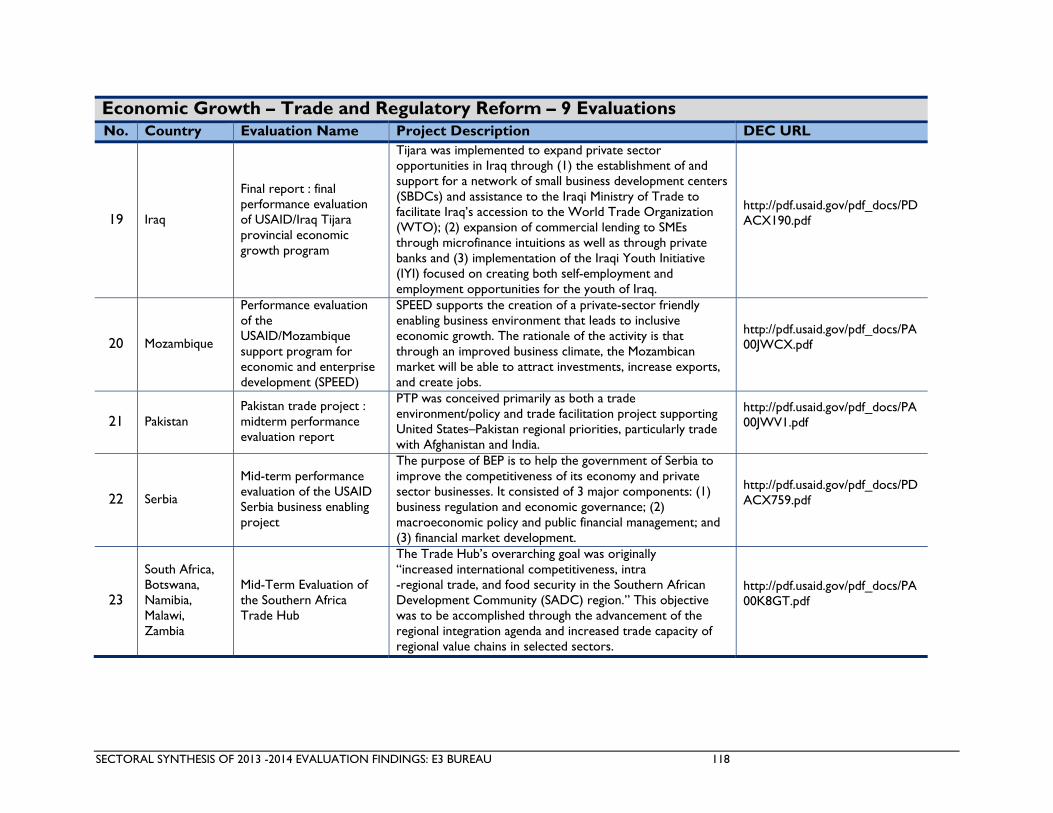
SECTORAL SYNTHESIS OF 2013 -2014 EVALUATION FINDINGS: E3 BUREAU 118
Economic Growth – Trade and Regulatory Reform – 9 Evaluations No. Country Evaluation Name Project Description DEC URL
19 Iraq
Final report : final performance evaluation of USAID/Iraq Tijara provincial economic growth program
Tijara was implemented to expand private sector opportunities in Iraq through (1) the establishment of and support for a network of small business development centers (SBDCs) and assistance to the Iraqi Ministry of Trade to facilitate Iraq’s accession to the World Trade Organization (WTO); (2) expansion of commercial lending to SMEs through microfinance intuitions as well as through private banks and (3) implementation of the Iraqi Youth Initiative (IYI) focused on creating both self-employment and employment opportunities for the youth of Iraq.
http://pdf.usaid.gov/pdf_docs/PDACX190.pdf
20 Mozambique
Performance evaluation of the USAID/Mozambique support program for economic and enterprise development (SPEED)
SPEED supports the creation of a private-sector friendly enabling business environment that leads to inclusive economic growth. The rationale of the activity is that through an improved business climate, the Mozambican market will be able to attract investments, increase exports, and create jobs.
http://pdf.usaid.gov/pdf_docs/PA00JWCX.pdf
21 Pakistan Pakistan trade project : midterm performance evaluation report
PTP was conceived primarily as both a trade environment/policy and trade facilitation project supporting United States–Pakistan regional priorities, particularly trade with Afghanistan and India.
http://pdf.usaid.gov/pdf_docs/PA00JWV1.pdf
22 Serbia
Mid-term performance evaluation of the USAID Serbia business enabling project
The purpose of BEP is to help the government of Serbia to improve the competitiveness of its economy and private sector businesses. It consisted of 3 major components: (1) business regulation and economic governance; (2) macroeconomic policy and public financial management; and (3) financial market development.
http://pdf.usaid.gov/pdf_docs/PDACX759.pdf
23
South Africa, Botswana, Namibia, Malawi, Zambia
Mid-Term Evaluation of the Southern Africa Trade Hub
The Trade Hub’s overarching goal was originally “increased international competitiveness, intra -regional trade, and food security in the Southern African Development Community (SADC) region.” This objective was to be accomplished through the advancement of the regional integration agenda and increased trade capacity of regional value chains in selected sectors.
http://pdf.usaid.gov/pdf_docs/PA00K8GT.pdf

SECTORAL SYNTHESIS OF 2013 -2014 EVALUATION FINDINGS: E3 BUREAU 119
Economic Growth – Private Capital Management – 3 Evaluations # Country Evaluation Name Project Description DEC URL
24 India
Final evaluation : transforming access to housing microfinance in India
The project was designed as a collaboration between Habitat for Humanity International, Development Innovations Group and Opportunities International to improve housing conditions in low-income communities through technical assistance in construction and housing microfinance (HMF).
http://pdf.usaid.gov/pdf_docs/PDACY439.pdf
25 Lebanon
Lebanon Investment in Microfinance (LIM) Program: Mid-Term Evaluation Report
The LIM program has partnered with eight Microfinance Institutions (MFI), to maximize access of finance to micro-enterprises and small businesses, operating in the Agribusiness; Tourism; and Information and Communication Technology (ICT) value chains
http://pdf.usaid.gov/pdf_docs/PA00K8Q1.pdf
26 Philippines
Final performance evaluation USAID/Philippines' microenterprise access to banking services program-4 (MABS-4)
Initially designed to assist twenty (20) RBs in Mindanao to develop their capability to profitably provide both loan and deposit services to microenterprises, with said banks collectively providing services to some 8,000 micro-borrowers and 15,000 micro-depositors. It was hoped that participating banks would find their microfinance experience sufficiently profitable and decide to make microfinance services a permanent and substantial part of their business.
http://pdf.usaid.gov/pdf_docs/PDACX377.pdf
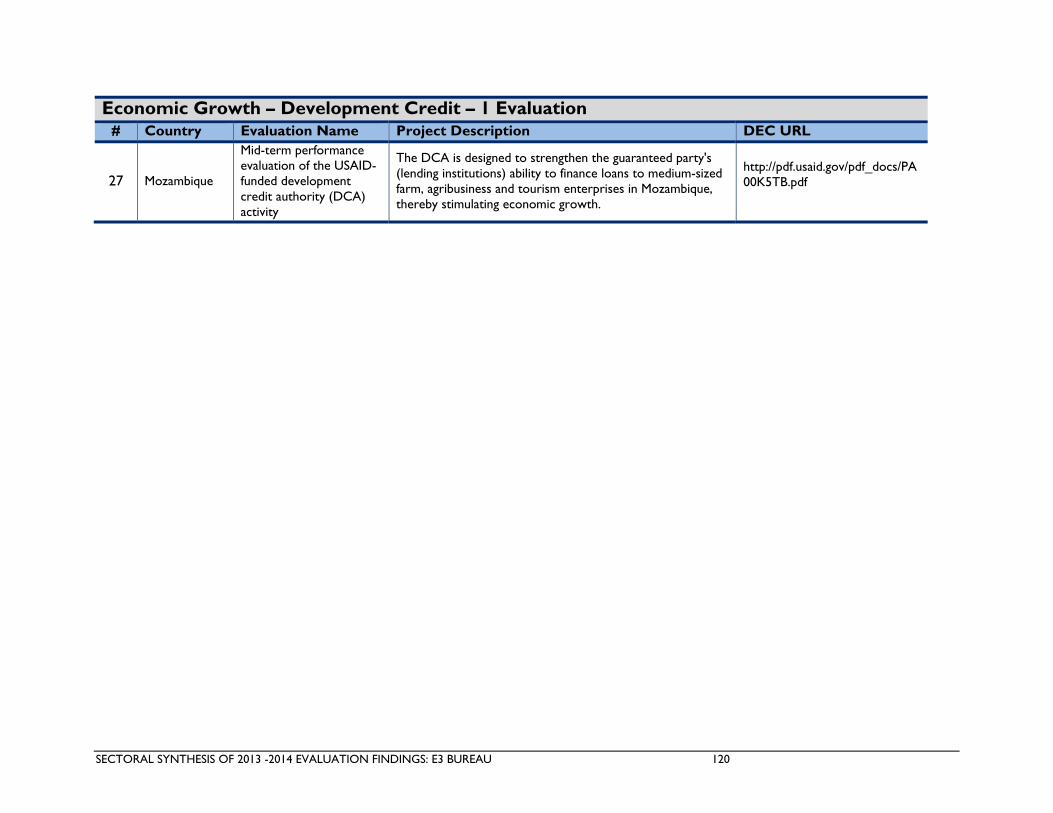
SECTORAL SYNTHESIS OF 2013 -2014 EVALUATION FINDINGS: E3 BUREAU 120
Economic Growth – Development Credit – 1 Evaluation # Country Evaluation Name Project Description DEC URL
27 Mozambique
Mid-term performance evaluation of the USAID-funded development credit authority (DCA) activity
The DCA is designed to strengthen the guaranteed party's (lending institutions) ability to finance loans to medium-sized farm, agribusiness and tourism enterprises in Mozambique, thereby stimulating economic growth.
http://pdf.usaid.gov/pdf_docs/PA00K5TB.pdf

SECTORAL SYNTHESIS OF 2013 -2014 EVALUATION FINDINGS: E3 BUREAU 121
Education – 42 Evaluations # Country Evaluation Name Project Description DEC URL
28 Afghanistan
Mid-term performance evaluation (April 2012-October 2013) : Afghanistan workforce development program (AWDP) project
The Afghanistan Workforce Development Program (AWDP) as a whole aims to increase job placements, salaries and wages, and self-employment opportunities for 25,000 Afghans; at least 25 percent of whom will be women.
http://pdf.usaid.gov/pdf_docs/PA00K48W.pdf
29 Armenia
Mid-term performance evaluation of junior achievement of Armenia (JAA) entrepreneurship and civic activism for young people
The JAA project combines a longer-standing effort to improve youth education in economics with the added goals of increasing entrepreneurship and community-based civic activities that address community needs by equipping Armenian youth with the skills and knowledge necessary to compete and succeed in tomorrow’s world. JAA operates a number of related programs to educate students on international business practices, ethics, and corporate social responsibility (CSR) issues.
http://pdf.usaid.gov/pdf_docs/PA00JTJH.pdf
30 Azerbaijan
Final Performance Evaluation of the Youth Business Leadership Project (YBLP) in Azerbaijan
YBLP was designed to empower the next generation of business leaders in Azerbaijan by providing undergraduate business students with hands-on professional development workshops to enhance business skills, the opportunity to gain real world experience through internships at various private companies, mentorship with successful businessmen and businesswomen, and networking opportunities with like-minded peers.
http://pdf.usaid.gov/pdf_docs/PA00K9M6.pdf
31 Benin
Girls' education & community participation project (GECP) : final evaluation
GECP did not directly provide formal education service. Rather, it followed intervention principles applied in earlier projects by acting on key components of the school's environment; governance; as well as community and parental involvement.
http://pdf.usaid.gov/pdf_docs/PA00JR45.pdf
32 Benin
Teacher motivation and training (TMT) project, Benin 2009-2013 : final evaluation report
The project had two main result areas: (1) improving the quality of pre-service teacher training in five public École Normal des Instituteurs (ENIs) (teacher training colleges); and (2) improving teacher performance in primary schools through the training of officials from the Ministère des Enseignements Maternel et Primaire (MEMP) including Conseillers Pedagogiques (CPs) and Chefs de Circonscription Scolaire (CCs) and primary school directors.
http://pdf.usaid.gov/pdf_docs/PDACX671.pdf

SECTORAL SYNTHESIS OF 2013 -2014 EVALUATION FINDINGS: E3 BUREAU 122
Education – 42 Evaluations # Country Evaluation Name Project Description DEC URL
33 Cambodia
End of project performance evaluation of the improved basic education in Cambodia project : promoting better educated youth in Cambodia with increased access to a quality and relevant basic education
The strategic objective of this project is to improve access, quality, and relevance of basic education in Cambodia. More specifically, the IBEC project is to increase lower secondary school enrollments, retention, and completion rates, providing Cambodia’s adolescent youth population with an opportunity to be better educated and lead productive lives.
http://pdf.usaid.gov/pdf_docs/PA00K2NV.pdf
34 Djibouti Projet AIDE performance evaluation 2009-2013 : evaluation report final
Projet AIDE (Assistance Internationale pour le Dévelopepment de l’Education) was designed to strengthen systems and Ministry of National Education and Professional Training's management capacity through (1) decentralized teacher training and community participation (2) strengthened strategic information and communication capacity through an Education (3) Education Management Information System (EMIS); and (4) increased community participation and education and job opportunities for out-of-school youth.
http://pdf.usaid.gov/pdf_docs/PDACY251.pdf
35 Dominican Republic
USAID/Dominican Republic education portfolio mid-term performance evaluation : integrated report
The USAID/DR education portfolio is focused on improvement in the quality of basic education, particularly in grades one through four. Improvement in quality will be achieved through three Intermediate Results (IRs): improved student performance in reading and math in grades 1 to 4 (IR1); strengthened community and private sector involvement in education (IR2); and increased learning opportunities for at-risk youth (IR3). The integrated evaluation of the portfolio draws on performance evaluations of the key projects tied to each of the three intermediate results.
http://pdf.usaid.gov/pdf_docs/PDACU985.pdf

SECTORAL SYNTHESIS OF 2013 -2014 EVALUATION FINDINGS: E3 BUREAU 123
Education – 42 Evaluations # Country Evaluation Name Project Description DEC URL
36 Ethiopia
Final Performance Evaluation of the School-Community Partnership Serving Orphan and Vulnerable Children Affected by HIV/AIDS (SCOPSO) Project
The SCOPSO project aimed in part to strengthen the ability of schools and communities to participate actively in the design, implementation and management of OVC support activities at schools in sustainable way. The overall objective of the project was to build the capacity of 400 primary schools to serve as focal points for OVC care and support to at least 52,000 HIV affected or infected OVC leading to increased enrollment, retention and academic performance.
http://pdf.usaid.gov/pdf_docs/PBAAA329.pdf
37 Georgia
Performance evaluation of the Georgia education management project (EMP)
EMP was designed to (1) improve the long-term capacity of higher education and Educational Resource Centers to better manage Georgia's education sector and (2) support the ability of Georgia's Ministry of Education and Science and associated educational agencies to develop and implement appropriate policies on educational administration and on school financing.
http://pdf.usaid.gov/pdf_docs/PDACU911.pdf
38 Ghana Final evaluation of Ghana transition and persistence (TAP) project
TAP aimed to increase junior high school enrollment and completion rates in 156 junior high schools across 13 districts in 4 regions. The overall goal of the project was to help Ghana meet its Education for All goal of universal primary completion.
http://pdf.usaid.gov/pdf_docs/PA00JPRV.pdf
39 Ghana
Final performance evaluation of USAID/Ghana's partnership for accountable governance in education (PAGE) project
The goal of the PAGE project was to improve student achievement in basic schools through strengthened educational governance and supervision.
http://pdf.usaid.gov/pdf_docs/PBAAA020.pdf
40 Guatemala Evaluation : education reform in the classroom (ReAula) project
Project REAULA has organized into two main areas of action: (1) improvement of educational institutions, training and professional development for teachers–referring to transformation at the system level in order to impact the educational system and (2) "Quality Classrooms" – referring to pilots of models and policies in select areas of the country in accordance with concrete experience.
http://pdf.usaid.gov/pdf_docs/PA00JP35.pdf

SECTORAL SYNTHESIS OF 2013 -2014 EVALUATION FINDINGS: E3 BUREAU 124
Education – 42 Evaluations # Country Evaluation Name Project Description DEC URL
41 Indonesia
Evaluation of the Indonesia university partnerships program : phase two, partnerships #3 and #4
The UP program was designed to help improve the quality and relevance of higher education in Indonesia by establishing university partnerships which leverage US universities' expertise to strengthen the research and teaching capacity of Indonesian institutions.
http://pdf.usaid.gov/pdf_docs/PDACY092.pdf
42 Indonesia
Evaluation of the Indonesia university partnerships : program: phase three -- partnerships #5-#8
The UP program was designed to help improve the quality and relevance of higher education in Indonesia. Under this Task Order projects looking at Climate risk, health systems, marine biotechnology and geothermal educational capacity were evaluated.
http://pdf.usaid.gov/pdf_docs/PA00JRCZ.pdf
43 Indonesia
Evaluation of the Opportunities for Vulnerable Children Program Indonesia
The OVC program was designed to (1) improve the coordination of policy, planning, and funding among the national, provincial, and district levels (2) improve the capacity of universities (3) improve in-service training programs and (4) increase awareness of inclusive education within the education system and the public.
http://pdf.usaid.gov/pdf_docs/PA00JM2M.pdf
44 Jamaica
Midterm performance evaluation of the USAID/Jamaica basic education project : in support of the Jamaica education transformation project
This project aimed to improve student performance in reading and mathematics in grades 1-3; to strengthen accountability in the primary education system through use of measurement tools and establishment of standards; and to build regional capacity for school management oversight.
http://pdf.usaid.gov/pdf_docs/PDACX310.pdf
45 Jordan
JSP : a transformational change' -- evaluation of the Jordan school construction and rehabilitation project
JSP intended to (1) reduce overcrowding in classrooms (2) reduce rented facilities, (3) reduce double-shifting schools, (4) provide the capacity for improved enrollment rates for basic education for the growing population and (5) improve the design and quality of educational architecture so as to enhance the relationship of the students with their place of learning and to increase their learning performance.
http://pdf.usaid.gov/pdf_docs/PDACX664.pdf
46 Jordan
Final performance evaluation : USAID/Jordan learning environment technical support program
The LETS program was designed to (1) build capacity within schools to support enabling environments and (2) build the Ministry of Educations' capacity to sustain and institutionalize environment improvements and to prepare LETS partner ASK to compete directly for USAID-funded projects.
http://pdf.usaid.gov/pdf_docs/PA00K1QB.pdf

SECTORAL SYNTHESIS OF 2013 -2014 EVALUATION FINDINGS: E3 BUREAU 125
Education – 42 Evaluations # Country Evaluation Name Project Description DEC URL
47 Kenya Yes youth can! impact evaluation : final report
The goal of YYC is to address the underlying social, economic, and political factors that drive youth marginalization in Kenya. The evaluation thus considers the impact of the program on a broad range of outcomes divided into five categories: economic opportunities, political empowerment and inclusion, trust and social capital, attitudes/behaviors towards ethnicity and violence, and self- efficacy.
http://pdf.usaid.gov/pdf_docs/PA00JZQX.pdf
48 Kenya
Global give back circle program mid-term performance evaluation report
The GGBC program recruits college and university-bound orphaned and vulnerable students and provides them with a comprehensive package of assistance intended to move them from poverty to prosperity and from recipients of assistance to givers of assistance to needy communities. Under the program, every beneficiary receives: a tertiary level scholarship including living expenses; a nine-month course in information and communications technology (ICT); assignment of a Kenyan or international mentor; life skills training in financial literacy, reproductive health, HIV/AIDS prevention, employment readiness, and other subjects; and an opportunity to intern with a private sector firm during their years in university or college
http://pdf.usaid.gov/pdf_docs/PDACX748.pdf
49 Kenya
Final performance evaluation of the teacher education and professional development project in Kenya
TEPD has been funded in two phases, with three emphases: (1) Teacher Education, (2) Information and Communication Technology (ICTs) in Education, and (3) HIV/AIDS education.
http://pdf.usaid.gov/pdf_docs/PDACX751.pdf
50 Kosovo
Mid-term performance evaluation of the Kosovo basic education program (BEP)
BEP aims to strengthen the capacity of Kosovo’s teachers and schools to provide relevant skills for its students. Its overarching goal is to strengthen the Government of Kosovo’s (GOK) institutional capacity in the education sector and improve the quality of primary education.
http://pdf.usaid.gov/pdf_docs/PA00JZGH.pdf

SECTORAL SYNTHESIS OF 2013 -2014 EVALUATION FINDINGS: E3 BUREAU 126
Education – 42 Evaluations # Country Evaluation Name Project Description DEC URL
51 Kyrgyzstan
Learning evaluation of USAID/Kyrgyz Republic's national admissions test (NAT) project
The NAT (initially called the National Scholarship Test (NST) when it was used only to determine scholarship awardees) was introduced to create a standardized means for academically proficient students to be awarded one of approximately 5,700 state scholarships.
http://pdf.usaid.gov/pdf_docs/PBAAA094.pdf
52 Liberia Mid-term assessment of the Liberia teacher training program phase II
LTTP II is a five-year project that focuses on three areas (components): (1) strengthening the institutional capacity, policymaking and systems of the Ministry of Education (MOE), particularly those systems necessary to enable teachers to provide quality services; (2) supporting pre-service and in-service teacher training and creating a reliable, transparent system for teacher recruitment, certification, promotion and compensation; and (3) support to the national plan to ensure all children are reading by grade 3 and introducing an early grade reading and math curricula in a selected sample of school
http://pdf.usaid.gov/pdf_docs/PA00JNC4.pdf
53 Macedonia
Midterm performance evaluation of USAID/Macedonia's interethnic integration in education project
IIEP was designed to build broad public understanding of the benefits of an integrated educational system in Macedonia. It works with a variety of actors to create "the political, social, and economic environment need for Macedonia to achieve sustained interethnic integration in schools, in other educational institutions and eventually all of society".
http://pdf.usaid.gov/pdf_docs/PA00K15Q.pdf
54 Malawi
Evaluation of the Malawi teacher professional development support (MTPDS) program
MTPDS was designed to (1) strengthen teacher policy, support and management systems; (2) enhance teacher performance; (3) improve early grade literacy; (4) enhance quality of primary teaching and learning materials; and (5) improve monitoring and evaluation systems on teacher competencies and learner outcomes.
http://pdf.usaid.gov/pdf_docs/PDACX458.pdf
55 Mexico, Guatemala, El Salvador
Evaluation of LAC higher education scholarships program
A series of three scholarship programs targeting technical training for employment, leadership development, and civil society diplomacy needs throughout seven countries in Latin America.
http://pdf.usaid.gov/pdf_docs/PDACX232.pdf

SECTORAL SYNTHESIS OF 2013 -2014 EVALUATION FINDINGS: E3 BUREAU 127
Education – 42 Evaluations # Country Evaluation Name Project Description DEC URL
56 Nepal Final evaluation report : education for income generation project (EIG)
The EIG program combined literacy and life skills education; technical and vocational training linked to employment; training to increase agricultural productivity and raise rural incomes; and targeted scholarships for disadvantaged Dalit youth to increase access to higher (10+2 and college certificate) education.
http://pdf.usaid.gov/pdf_docs/PBAAA002.pdf
57 Nicaragua
Mid-term evaluation of the education for success project on the Atlantic coast of Nicaragua
EFS was designed to serve as an integrated program for at-risk children and youth in targeted municipalities in Región Autónoma del Atlántico Sur (RAAS) that would provide opportunities for formal and non-formal education, life skills, and workforce competencies.
http://pdf.usaid.gov/pdf_docs/PA00JK6H.pdf
58 Nicaragua
Nicaragua strategic alliance for social investment in education and health (Alliances 2) project : final evaluation
Under Alliances 2 sub-grants were issued to six local NGOs that committed to establishing partnerships with private-sector entities with the hope of raising counterpart funds equal to twice the amount provided by USAID. Programs funded included educational; democracy and governance; and health activities.
http://pdf.usaid.gov/pdf_docs/PA00JK6G.pdf
59 Nigeria
Northern education initiative (NEI) project : mid-term performance evaluation
NEI's goal is to deliver quality basic education services to children in the two states, through achievement of two objectives: (1) strengthened state and local government capacity to deliver basic education services; and (2) increased access of orphans and vulnerable children (OVCs) to basic education and other services.
http://pdf.usaid.gov/pdf_docs/PDACY473.pdf
60 Pakistan
Higher Education Commission : university and technical support and higher education support program
The USAID University and Technical Education Support Program was part of a larger U.S. Government emergency response program whose goal was to stabilize Pakistani society affected by extremist insurgencies, fiscal crisis, and weak local institutions. The objective of the Higher Education Support Program was to further the “Investing in People” objective under the U.S. Foreign Assistance Framework
http://pdf.usaid.gov/pdf_docs/PBAAA234.pdf

SECTORAL SYNTHESIS OF 2013 -2014 EVALUATION FINDINGS: E3 BUREAU 128
Education – 42 Evaluations # Country Evaluation Name Project Description DEC URL
61 Pakistan
Fulbright student program evaluation in Pakistan midterm performance evaluation report
The Fulbright Student Program in Pakistan awards merit-based scholarships for both master and doctoral level study in the U.S. to early and mid-career professionals with high academic achievement and potential for leadership. The Program is intended to support awardees’ academic development, create mutual understanding between the people of Pakistan and the U.S., and facilitate linkages between American and Pakistani academic institutions and scholars.
http://pdf.usaid.gov/pdf_docs/PA00JTWS.pdf
62 Pakistan
Pakistan-United States science and technology cooperation (S&T) program : mid-term performance evaluation report
The S&T Program provides research grants to Pakistani and American universities and research institutions to carry out joint research projects. The objective of these research partnerships is to build capacity in the sciences and technology at the institutional level in Pakistan and to strengthen U.S.-Pakistan cooperative relationships
http://pdf.usaid.gov/pdf_docs/PA00K48G.pdf
63 Philippines
Literacy for peace and development' (LIPAD) project performance evaluation
The focus of the Project is to increase their literacy and numeracy skills through a three-month, 140-hour classroom intervention. As part of the learning process, participants were to be introduced to conflict prevention and peacemaking skills to better enable them to participate meaningfully in the fashioning of peace, democracy and development in their own communities
http://pdf.usaid.gov/pdf_docs/PDACY456.pdf
64 Senegal
USAID basic education project mid-term evaluation : 'a committed and successful educational community'
The EdB project targets 10 of the 14 regions which make up the Senegal by conducting activities in Middle schools around five components: (1) vulnerable children; (2) curriculum and instruction; (3) Information Communication Technology for Education(ICT4E); (4) governance and management; and (5) Public-Private Partnerships.
http://pdf.usaid.gov/pdf_docs/PDACX672.pdf
65 Somalia
Mid-term performance evaluation of the USAID Somali youth leaders initiative (SYLI)
The specific goal of the Somali Youth Leaders Initiative is to increase education and economic opportunities for Somali youth. Its aim is to reduce instability in its target areas.
http://pdf.usaid.gov/pdf_docs/PA00K3XD.pdf
66 Tanzania Performance Evaluation of the BridgeIT Project
The main goal of Bridge IT is to significantly increase the educational quality and achievement in mathematics, science and life skills among primary school pupils through the innovative use of cell phones and digital technology.
http://pdf.usaid.gov/pdf_docs/PA00JSSH.pdf

SECTORAL SYNTHESIS OF 2013 -2014 EVALUATION FINDINGS: E3 BUREAU 129
Education – 42 Evaluations # Country Evaluation Name Project Description DEC URL
67 Ukraine Final project evaluation : USETI legacy alliance project in Ukraine
The USETI Alliance aims to (1) support a sustainable Ukraine Center for Educational Quality Assessment capable of independently and transparently developing and implementing secure tests that meet international standards; (2) contribute to a secure legislative basis for testing and higher education admission, and an institutionalized partnership between business, higher education, and policymakers; (3) transform public support for testing into a proactive contemporary public expectation, so that grass roots support will ensure the sustainability of testing; and (4) develop a basic and quality test-preparation industry driven by informed consumer demand.
http://pdf.usaid.gov/pdf_docs/PDACY081.pdf
68 Vietnam
Mid-term evaluation of the higher engineering education alliance program (HEEAP)
HEEAP aims to transform engineering education in Vietnam from what is described as "passive, theory-based instruction to active, project-based instruction" with the goal of producing "work-ready" graduates for the country's booming high-tech sector.
http://pdf.usaid.gov/pdf_docs/PDACX675.pdf
69 Vietnam
Kon Ray Boarding School and central highlands education project : end-of-project evaluation
The original objective of the project was to improve access to education for ethnic minority children, as well as children with disabilities through the construction of a boarding school. The scope was expanded to include teacher training and sustainability of gains.
http://pdf.usaid.gov/pdf_docs/PDACX676.pdf
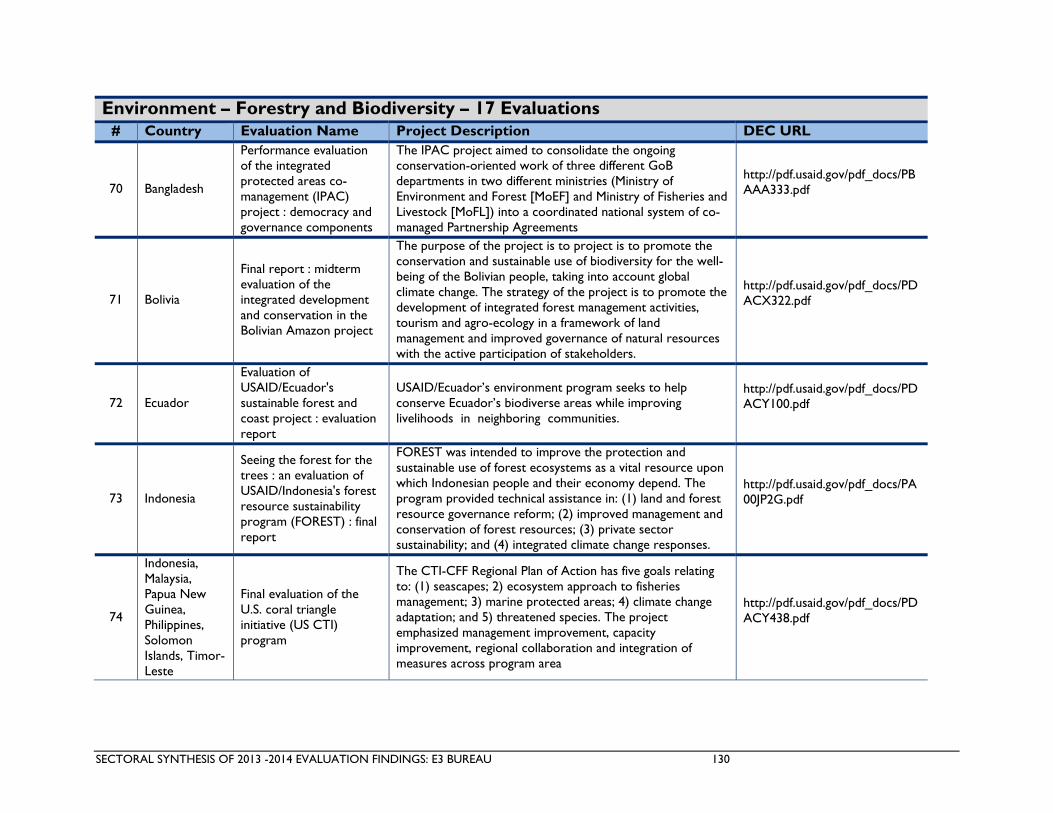
SECTORAL SYNTHESIS OF 2013 -2014 EVALUATION FINDINGS: E3 BUREAU 130
Environment – Forestry and Biodiversity – 17 Evaluations # Country Evaluation Name Project Description DEC URL
70 Bangladesh
Performance evaluation of the integrated protected areas co-management (IPAC) project : democracy and governance components
The IPAC project aimed to consolidate the ongoing conservation-oriented work of three different GoB departments in two different ministries (Ministry of Environment and Forest [MoEF] and Ministry of Fisheries and Livestock [MoFL]) into a coordinated national system of co-managed Partnership Agreements
http://pdf.usaid.gov/pdf_docs/PBAAA333.pdf
71 Bolivia
Final report : midterm evaluation of the integrated development and conservation in the Bolivian Amazon project
The purpose of the project is to project is to promote the conservation and sustainable use of biodiversity for the well-being of the Bolivian people, taking into account global climate change. The strategy of the project is to promote the development of integrated forest management activities, tourism and agro-ecology in a framework of land management and improved governance of natural resources with the active participation of stakeholders.
http://pdf.usaid.gov/pdf_docs/PDACX322.pdf
72 Ecuador
Evaluation of USAID/Ecuador's sustainable forest and coast project : evaluation report
USAID/Ecuador’s environment program seeks to help conserve Ecuador’s biodiverse areas while improving livelihoods in neighboring communities.
http://pdf.usaid.gov/pdf_docs/PDACY100.pdf
73 Indonesia
Seeing the forest for the trees : an evaluation of USAID/Indonesia's forest resource sustainability program (FOREST) : final report
FOREST was intended to improve the protection and sustainable use of forest ecosystems as a vital resource upon which Indonesian people and their economy depend. The program provided technical assistance in: (1) land and forest resource governance reform; (2) improved management and conservation of forest resources; (3) private sector sustainability; and (4) integrated climate change responses.
http://pdf.usaid.gov/pdf_docs/PA00JP2G.pdf
74
Indonesia, Malaysia, Papua New Guinea, Philippines, Solomon Islands, Timor-Leste
Final evaluation of the U.S. coral triangle initiative (US CTI) program
The CTI-CFF Regional Plan of Action has five goals relating to: (1) seascapes; 2) ecosystem approach to fisheries management; 3) marine protected areas; 4) climate change adaptation; and 5) threatened species. The project emphasized management improvement, capacity improvement, regional collaboration and integration of measures across program area
http://pdf.usaid.gov/pdf_docs/PDACY438.pdf
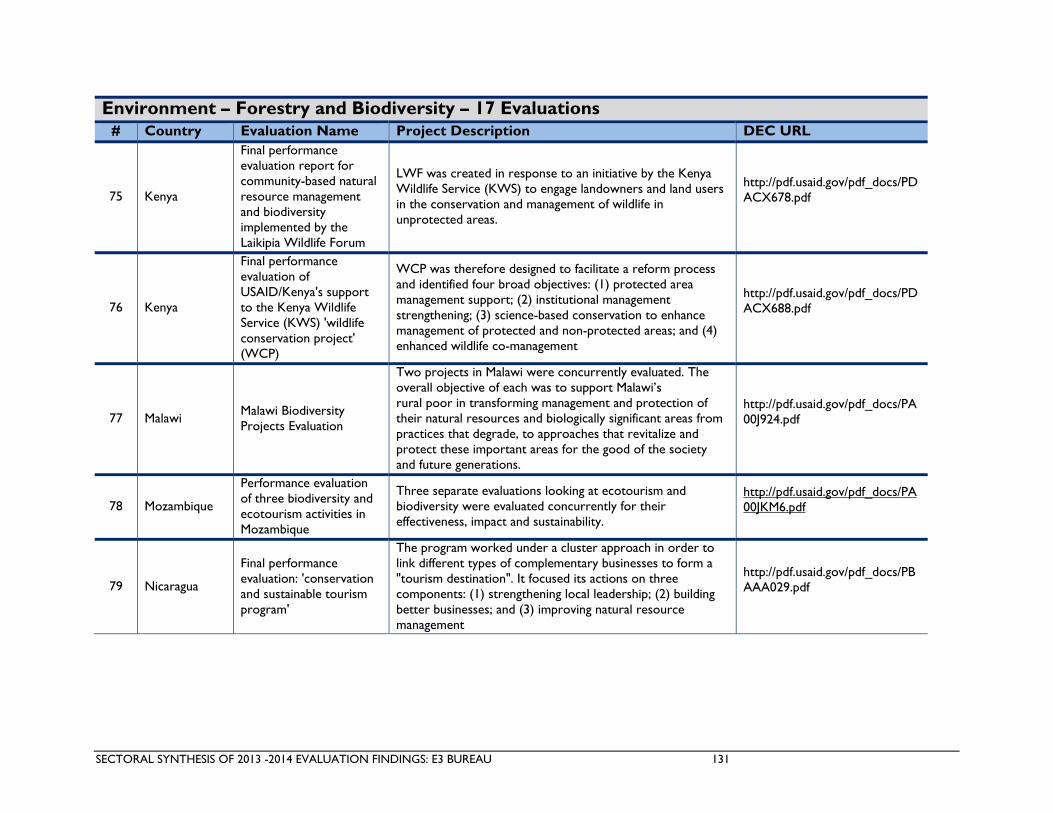
SECTORAL SYNTHESIS OF 2013 -2014 EVALUATION FINDINGS: E3 BUREAU 131
Environment – Forestry and Biodiversity – 17 Evaluations # Country Evaluation Name Project Description DEC URL
75 Kenya
Final performance evaluation report for community-based natural resource management and biodiversity implemented by the Laikipia Wildlife Forum
LWF was created in response to an initiative by the Kenya Wildlife Service (KWS) to engage landowners and land users in the conservation and management of wildlife in unprotected areas.
http://pdf.usaid.gov/pdf_docs/PDACX678.pdf
76 Kenya
Final performance evaluation of USAID/Kenya's support to the Kenya Wildlife Service (KWS) 'wildlife conservation project' (WCP)
WCP was therefore designed to facilitate a reform process and identified four broad objectives: (1) protected area management support; (2) institutional management strengthening; (3) science-based conservation to enhance management of protected and non-protected areas; and (4) enhanced wildlife co-management
http://pdf.usaid.gov/pdf_docs/PDACX688.pdf
77 Malawi Malawi Biodiversity Projects Evaluation
Two projects in Malawi were concurrently evaluated. The overall objective of each was to support Malawi’s rural poor in transforming management and protection of their natural resources and biologically significant areas from practices that degrade, to approaches that revitalize and protect these important areas for the good of the society and future generations.
http://pdf.usaid.gov/pdf_docs/PA00J924.pdf
78 Mozambique
Performance evaluation of three biodiversity and ecotourism activities in Mozambique
Three separate evaluations looking at ecotourism and biodiversity were evaluated concurrently for their effectiveness, impact and sustainability.
http://pdf.usaid.gov/pdf_docs/PA00JKM6.pdf
79 Nicaragua
Final performance evaluation: 'conservation and sustainable tourism program'
The program worked under a cluster approach in order to link different types of complementary businesses to form a "tourism destination". It focused its actions on three components: (1) strengthening local leadership; (2) building better businesses; and (3) improving natural resource management
http://pdf.usaid.gov/pdf_docs/PBAAA029.pdf

SECTORAL SYNTHESIS OF 2013 -2014 EVALUATION FINDINGS: E3 BUREAU 132
Environment – Forestry and Biodiversity – 17 Evaluations # Country Evaluation Name Project Description DEC URL
80 Peru
Enhancing forestry governance in the Peruvian Amazon : mid-term evaluation of the Peru forest sector initiative
The USFS/PFSI objective is to contribute to sustainable forest management in Peru by developing technical capacities, tools and methodologies and by strengthening key actors in the public and private sector in designated priority areas.
http://pdf.usaid.gov/pdf_docs/PA00JX3D.pdf
81 Peru
Performance evaluation : 'Promoting long-term sustainability of Parque Nacional Cordillera Azul'
The Parque Nacional Cordillera Azul (PNCAZ) is a park in Peru which has received support to build protection infrastructure, train and implement patrols, remove illegal logging, and involve communities living in the buffer zone in park-related activities
http://pdf.usaid.gov/pdf_docs/PA00JJSF.pdf
82 Rwanda Evaluation of USAID investments in Nyungwe National Park
Three separate evaluations looking at ecotourism and biodiversity were evaluated concurrently for their impact on economic growth and the improvement in biodiversity conservation in and around Nyungwe National Park.
http://pdf.usaid.gov/pdf_docs/PDACX669.pdf
83 Tanzania
Tanzania wildlife management areas (WMA) evaluation : final evaluation report
WMAs have been increasingly seen as an effective means to deal with growing concerns in Tanzania around land and land tenure security, increasing population growth, and pressure of communities on protected areas
http://pdf.usaid.gov/pdf_docs/PDACY083.pdf
84 Uganda, Brazil
Measuring Impact: US Forest Service Participating Agency Program Agreement (PAPA) Evaluation Report
This program had a broad technical range covering sustainable forest management policies and practices; protected area management and forest biodiversity conservation; fire prevention and fire response; forest monitoring; remote sensing and geographic information systems; global climate change analysis and mitigation; tree-based biofuels production; community forestry; agro forestry; smallholder wood production systems; regional forest planning; invasive species and forest pest/disease management; disaster planning and mitigation; and governance of natural resources
http://pdf.usaid.gov/pdf_docs/PA00K62N.pdf

SECTORAL SYNTHESIS OF 2013 -2014 EVALUATION FINDINGS: E3 BUREAU 133
Environment – Forestry and Biodiversity – 17 Evaluations # Country Evaluation Name Project Description DEC URL
85
Vietnam, Philippines, Tanzania, Gabon, Indonesia, Ghana, Cambodia, Nepal, Madagascar, Zimbabwe, DR Congo, Mongolia, Bolivia
Promoting Transformations by Linking Nature, Wealth and Power (TransLinks) Performance Evaluation Report
The goal of TransLinks was “increasing social, economic, biodiversity, resilience, and other environmental benefits through sustainable natural resource management.” It focused on knowledge generation and capacity building, principally through the documentation and dissemination of lessons from experience in natural resource management.
http://pdf.usaid.gov/pdf_docs/PA00K43H.pdf
86
Vietnam, Thailand, Philippines, Indonesia, China
Mid-term performance evaluation of Asia's regional response to endangered species trafficking (ARREST) program
The ARREST program promotes a three-pronged approach to curb wildlife trafficking through: (1) reduction in consumption of endangered species in key markets in Asia by reducing consumer demand; (2) reduction in poaching and trafficking of endangered species across Asia by strengthening law enforcement capacity; and (3) continuation and sustainability of these positive trends beyond the life of the program by strengthening and sustaining regional learning networks and partnerships.
http://pdf.usaid.gov/pdf_docs/PDACY224.pdf

SECTORAL SYNTHESIS OF 2013 -2014 EVALUATION FINDINGS: E3 BUREAU 134
Environment – Water – 13 Evaluations # Country Evaluation Name Project Description DEC URL
87 Afghanistan
Final performance evaluation : Afghan engineering support program (AESP)
AESP was designed to provide architectural and engineering technical services to USAID-supported infrastructure projects in Afghanistan in the sectors of transportation; vertical structures; energy; and water and sanitation.
http://pdf.usaid.gov/pdf_docs/PA00K48R.pdf
88 Afghanistan
Performance evaluation : engineering quality assurance & logistical support (EQUALS) project
The purpose of EQUALS is to provide USAID’s Afghanistan Office of Infrastructure and Economic Growth (OEGI) with an Afghanistan-based team to provide independent quality assurance for ongoing and planned construction, and design and maintenance projects in the four infrastructure areas, namely: transportation; vertical structures; energy; and water and sanitation.
http://pdf.usaid.gov/pdf_docs/PA00K6BZ.pdf
89 Afghanistan
Final evaluation report : the commercialization of Afghanistan water and sanitation activity (CAWSA) project
The primary purpose of the project was to establish a viable business model for water service delivery in Afghanistan by enhancing both the technical and commercial operations at the AUWSSC’s water supply and sanitation utilities.
http://pdf.usaid.gov/pdf_docs/PA00K48X.pdf
90 Dominican Republic
Evaluation : USAID/Dominican Republic Batey community development project
The Project sought to induce sustainable improvements in the living conditions of the “Bateys”: former sugar cane work camps which are home to poor Haitian migrant workers and Dominicans. The Project aimed to focus on basic health, education services, income generating activities and linkages to other programs that can also contribute to provide livelihood improvements to said communities.
http://pdf.usaid.gov/pdf_docs/PDACY353.pdf
91 Ethiopia
Final performance evaluation of water sanitation and hygiene transformation for enhanced resiliency (WaTER) project
WaTER was designed to contribute toward the alleviation of water and sanitation problems in Ethiopia through the construction and rehabilitation of borehole-based systems with corresponding distribution networks as well as training to develop local capacity.
http://pdf.usaid.gov/pdf_docs/PA00JWVB.pdf

SECTORAL SYNTHESIS OF 2013 -2014 EVALUATION FINDINGS: E3 BUREAU 135
Environment – Water – 13 Evaluations # Country Evaluation Name Project Description DEC URL
92
Ethiopia, Kenya, Liberia, Mozambique, Nigeria, Senegal, South Sudan, Uganda, Zambia
USAID/Washington mid-term performance evaluation of the sustainable water and sanitation in Africa (SUWASA) project
The design of the SUWASA project emphasized the role that institutional reform would play to improve direct service delivery in providing access to water and sanitation services. This emphasis on institutional reform included the development of cost-based tariffs, a process by which tariffs are adjusted; the development of governing boards overseeing and planning utility operations and investment; and training provided at the local utility level.
http://pdf.usaid.gov/pdf_docs/PDACY091.pdf
93 Ghana Evaluation of the USAID Ghana water, sanitation, and hygiene program
The GWASH goal is to support improved access to safe, adequate, water supply and basic sanitation facilities (latrines) for homes, schools, clinics and markets while promoting complementary hygiene practices.
http://pdf.usaid.gov/pdf_docs/PA00JX93.pdf
94 Indonesia
Indonesia urban water, sanitation and hygiene (IUWASH) project : mid-term evaluation review
IUWASH is a five-year USAID-funded program whose core objective is a significant increase of access to safe water supply and improved sanitation in Indonesia’s urban areas, with a particular focus on facilitating better access to these services for the urban poor. This core objective is defined by the following four high-level targets: (1) expanded access to safe water supply for an additional 2,000,000 people in urban areas; (2) access for an additional 250,000 people in urban areas to improved sanitation facilities; (3) the unit cost of safe water paid by the poor in targeted communities to decrease by at least 20 percent, and (4) 75,000 additional people to be trained in IUWASH activities.
http://pdf.usaid.gov/pdf_docs/PDACY328.pdf
95 Jordan
End-of-project evaluation of the institutional support and strengthening program (ISSP)
The goal of ISSP was to identify and then implement a range of institutional reforms to address key institutional constraints to more effective and efficient management of the water sector to enable Jordan to better manage demands on its water resources.
http://pdf.usaid.gov/pdf_docs/PA00JQT3.pdf
96
Namibia, Botswana, Angola, South Africa
Southern Africa regional environment program performance evaluation
SAREP’s objective is to support the initiatives of the Southern Africa Development Community (SADC) to integrate improved water and sanitation services with strategies that address threats to ecosystem services and biodiversity within priority shared river basins and to strengthen regional capacity to adapt and respond to effects of climate change.
http://pdf.usaid.gov/pdf_docs/PA00JZJT.pdf
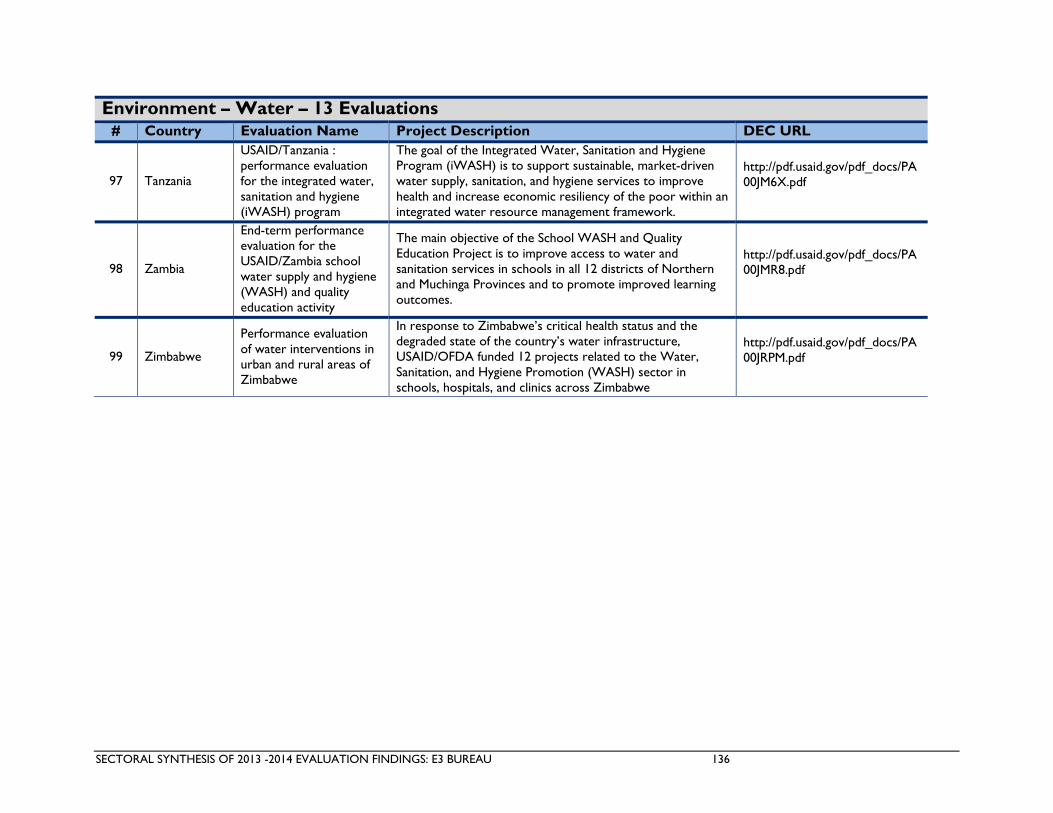
SECTORAL SYNTHESIS OF 2013 -2014 EVALUATION FINDINGS: E3 BUREAU 136
Environment – Water – 13 Evaluations # Country Evaluation Name Project Description DEC URL
97 Tanzania
USAID/Tanzania : performance evaluation for the integrated water, sanitation and hygiene (iWASH) program
The goal of the Integrated Water, Sanitation and Hygiene Program (iWASH) is to support sustainable, market-driven water supply, sanitation, and hygiene services to improve health and increase economic resiliency of the poor within an integrated water resource management framework.
http://pdf.usaid.gov/pdf_docs/PA00JM6X.pdf
98 Zambia
End-term performance evaluation for the USAID/Zambia school water supply and hygiene (WASH) and quality education activity
The main objective of the School WASH and Quality Education Project is to improve access to water and sanitation services in schools in all 12 districts of Northern and Muchinga Provinces and to promote improved learning outcomes.
http://pdf.usaid.gov/pdf_docs/PA00JMR8.pdf
99 Zimbabwe
Performance evaluation of water interventions in urban and rural areas of Zimbabwe
In response to Zimbabwe’s critical health status and the degraded state of the country’s water infrastructure, USAID/OFDA funded 12 projects related to the Water, Sanitation, and Hygiene Promotion (WASH) sector in schools, hospitals, and clinics across Zimbabwe
http://pdf.usaid.gov/pdf_docs/PA00JRPM.pdf

SECTORAL SYNTHESIS OF 2013 -2014 EVALUATION FINDINGS: E3 BUREAU 137
Environment – Energy and Infrastructure – 8 Evaluations # Country Evaluation Name Project Description DEC URL
100 Afghanistan
Final performance evaluation : rehabilitation projects at regional airports
In 2010, USAID executed a government-to-government financial assistance program with the Islamist Government of Afghanistan; the Ministry of Finance; and the Ministry of Transportation and Civil Aviation to support the completion of regional airport upgrades originally funded by the Asian Development Bank.
http://pdf.usaid.gov/pdf_docs/PA00K6Q2.pdf
101 Armenia
Performance evaluation of the energy security and regional integration project (ESRI) : end of project evaluation report
The goal of ESRI project is to assist Armenia is securing diversified sources of energy; including nuclear, renewables and international electricity trade.
http://pdf.usaid.gov/pdf_docs/PA00JR2M.pdf
102 Bosnia and Herzegovina
Performance evaluation of the regulatory and energy assistance program (REAP)
The REAP project was composed of two major tasks: (1) a fully integrated energy sector into the regional market and the EU; and (2) restructuring and commercialization of energy companies.
http://pdf.usaid.gov/pdf_docs/PDACY479.pdf
103
Burundi, DR Congo, Egypt, Ethiopia, Libya, Kenya, Rwanda, Sudan, Tanzania, Uganda
Powering progress project : end of project performance evaluation report
The purpose of PPP was to provide technical assistance and capacity building support to key entities in eastern Africa and to establish a regional electricity market. The primary focus of PPP was to: (1) develop model bilateral Electricity Trade Agreements (ETAs) and Wheeling Agreements (WAs); (2) develop Regional Power Transmission Standards for Eastern Africa Power Pool (EAPP) member countries; and (3) to build capacity to exploit clean and renewable energy resources, harmonize regional policies and regulations for improved cross-border trade, and improvement of the technical and financial performance of EAPP member utilities.
http://pdf.usaid.gov/pdf_docs/PDACW314.pdf
104 Georgia
Mid-term performance evaluation of USAID/Georgia power and gas infrastructure project (PGIP)
PGIP was designed to: (1) promote energy security through greater access to electricity and natural gas supplies for households and businesses in Western Georgia; (2) promote the development of the Poti Free Industrial Zone (FIZ) on the Black Sea; and (3) secure power exports through reliable transmission infrastructure improvements domestically.
http://pdf.usaid.gov/pdf_docs/PDACY463.pdf
105 Lebanon Small villages wastewater treatment systems program (SVWTS)
SVWTS targeted communities in the Upper Litani River basin not currently served by wastewater treatment facilities.
http://pdf.usaid.gov/pdf_docs/PDACY065.pdf

SECTORAL SYNTHESIS OF 2013 -2014 EVALUATION FINDINGS: E3 BUREAU 138
Environment – Energy and Infrastructure – 8 Evaluations # Country Evaluation Name Project Description DEC URL
106 Liberia Mid-term evaluation of the Liberian energy sector support program
LESSP's goal is to build upon the successes of previous activities aimed at increasing access to electricity in Liberia through creating and rehabilitating energy infrastructure and facilitating Liberia's macroeconomic development strategy.
http://pdf.usaid.gov/pdf_docs/PA00JR3N.pdf
107 Philippines
Final performance evaluation USAID/Philippines' alliance for Mindanao off-grid renewable energy (AMORE) 3 program
AMORE 3 was a decentralized energy activity originally conceived as a fully commercial implementation program. However its objective changed from that in AMORE 1 of “improving the quality of life in un-electrified rural communities” to “[continuing] its contribution to rural development and peace initiatives in Mindanao."
http://pdf.usaid.gov/pdf_docs/PA00JX3J.pdf

SECTORAL SYNTHESIS OF 2013 -2014 EVALUATION FINDINGS: E3 BUREAU 139
Environment – Global Climate Change – 6 Evaluations # Country Evaluation Name Project Description DEC URL
108
Cambodia, Laos, Vietnam, Thailand, Malaysia
Mid-term evaluation of the lowering emissions in Asia's forests (LEAF) program
The program has an overall goal of strengthening capacities of developing countries in the Asia region to produce meaningful and sustainable reductions in GHG emissions from the forestry/land-use sector, allowing them to benefit from the emerging international REDD+ framework.
http://pdf.usaid.gov/pdf_docs/PDACY434.pdf
109 Cambodia
Mid-Term Performance Evaluation of the Cambodia HARVEST Project (Helping Address Rural Vulnerabilities and Ecosystem STability)
The program is comprised of four components: (1) Increasing food availability; (2) increasing food access through rural income diversification; (3) increasing natural resource management and resilience to climate change; and (4) increasing capacity of Public, Private and Civil Society to address food security and climate change.
http://pdf.usaid.gov/pdf_docs/PA00K123.pdf
110 Indonesia
Final evaluation report : adapting to climate change in eastern Indonesia
This program aimed to strengthen the ability of vulnerable, upland communities in ecologically fragile areas of Nusa Tenggara to effectively respond to the impact of climate change and to prepare plans to mitigate the disasters they may face as a result of climate change.
http://pdf.usaid.gov/pdf_docs/PA00JZFC.pdf
111 Mexico
Performance evaluation of the Mexico low emissions development (MLED) program
The MLED program was launched to: (1) support GOM's efforts to develop and implement a Low-Emissions Development Strategy (LEDS); (2) strengthen robust systems for monitoring, reporting and verification of emissions across all emitting sectors of the economy; and (3) promote the widespread adoption of clean energy technologies and best practices through the development of energy policies, financing mechanisms and intuitional and technical capacity in Mexico.
http://pdf.usaid.gov/pdf_docs/PA00JT95.pdf
112 Mongolia
Evaluation of the Ulaanbaatar school buildings thermo-technical retrofitting project
The project was designed to achieve: (1) increased efficiency of energy use in the three buildings, and consequent reductions in coal consumption, coal costs, and coal-related GHG emissions; (2) a more comfortable learning environment for children and staff at the schools; and (3) trained and knowledgeable local builders, engineers, and architects who are able to design and implement retrofits.
http://pdf.usaid.gov/pdf_docs/PDACU987.pdf

SECTORAL SYNTHESIS OF 2013 -2014 EVALUATION FINDINGS: E3 BUREAU 140
Environment – Global Climate Change – 6 Evaluations # Country Evaluation Name Project Description DEC URL
113
Swaziland, Lesotho, Seychelles, South Africa
Development grants program performance evaluation
The Development Grants Program (DGP) is a competitive small grants program, established in 2008 by Section 674 of the US Consolidated Appropriations Act of 2008, that provides targeted support to U.S. Private Voluntary Organizations (PVOs) and local non-government organizations (NGOs) that have limited or no experience in managing direct USAID grants. Successful PVO/NGO applicants receive awards (usually up to $2 mn) to implement activities in the field over a period of up to five years. Awards include a capacity development component providing awardees with access to resources for technical assistance and/or organizational strengthening.
http://pdf.usaid.gov/pdf_docs/PA00K3Q6.pdf
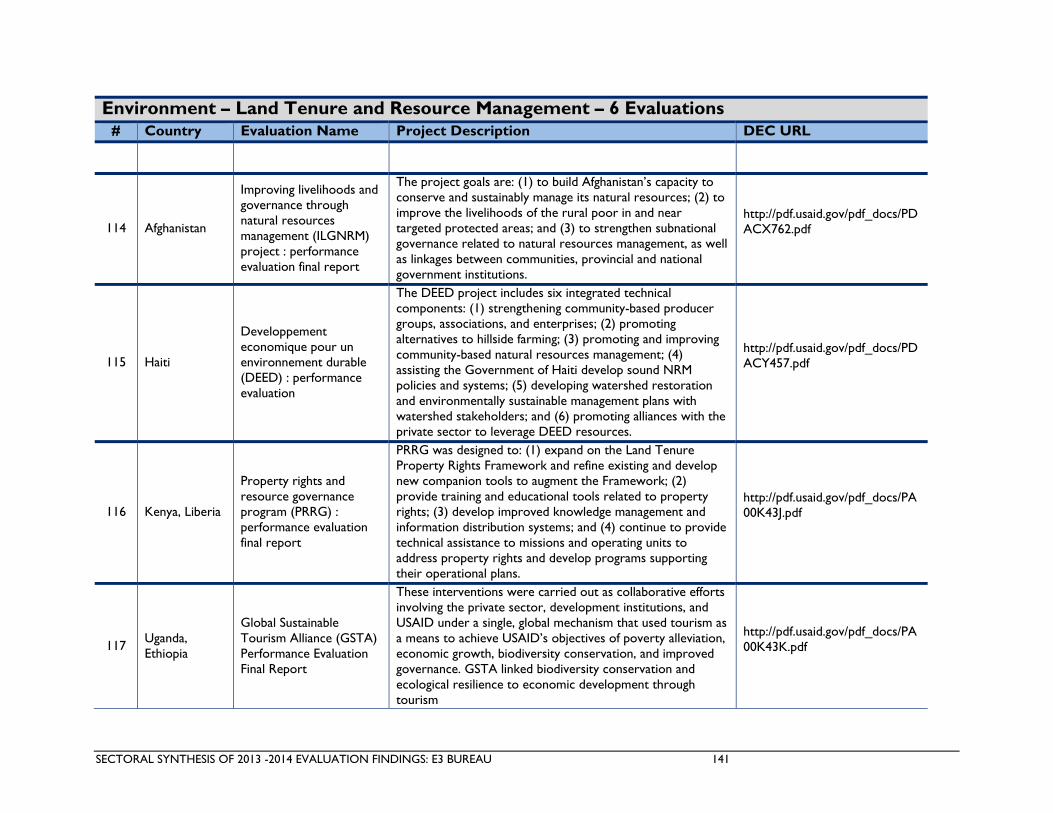
SECTORAL SYNTHESIS OF 2013 -2014 EVALUATION FINDINGS: E3 BUREAU 141
Environment – Land Tenure and Resource Management – 6 Evaluations # Country Evaluation Name Project Description DEC URL
114 Afghanistan
Improving livelihoods and governance through natural resources management (ILGNRM) project : performance evaluation final report
The project goals are: (1) to build Afghanistan’s capacity to conserve and sustainably manage its natural resources; (2) to improve the livelihoods of the rural poor in and near targeted protected areas; and (3) to strengthen subnational governance related to natural resources management, as well as linkages between communities, provincial and national government institutions.
http://pdf.usaid.gov/pdf_docs/PDACX762.pdf
115 Haiti
Developpement economique pour un environnement durable (DEED) : performance evaluation
The DEED project includes six integrated technical components: (1) strengthening community-based producer groups, associations, and enterprises; (2) promoting alternatives to hillside farming; (3) promoting and improving community-based natural resources management; (4) assisting the Government of Haiti develop sound NRM policies and systems; (5) developing watershed restoration and environmentally sustainable management plans with watershed stakeholders; and (6) promoting alliances with the private sector to leverage DEED resources.
http://pdf.usaid.gov/pdf_docs/PDACY457.pdf
116 Kenya, Liberia
Property rights and resource governance program (PRRG) : performance evaluation final report
PRRG was designed to: (1) expand on the Land Tenure Property Rights Framework and refine existing and develop new companion tools to augment the Framework; (2) provide training and educational tools related to property rights; (3) develop improved knowledge management and information distribution systems; and (4) continue to provide technical assistance to missions and operating units to address property rights and develop programs supporting their operational plans.
http://pdf.usaid.gov/pdf_docs/PA00K43J.pdf
117 Uganda, Ethiopia
Global Sustainable Tourism Alliance (GSTA) Performance Evaluation Final Report
These interventions were carried out as collaborative efforts involving the private sector, development institutions, and USAID under a single, global mechanism that used tourism as a means to achieve USAID’s objectives of poverty alleviation, economic growth, biodiversity conservation, and improved governance. GSTA linked biodiversity conservation and ecological resilience to economic development through tourism
http://pdf.usaid.gov/pdf_docs/PA00K43K.pdf

SECTORAL SYNTHESIS OF 2013 -2014 EVALUATION FINDINGS: E3 BUREAU 142
ANNEX C: SECTORAL SYNTHESIS METHODOLOGY
Identification of Evaluations
The timeframe for this study included evaluations published between January 1, 2013 and September 30, 2014. A total of 117 evaluations related to E3 sectors were identified using two sources. First, a list of evaluations was compiled in November 2014 from the USAID Development Experience Clearinghouse (DEC) through searches using the document type, publication date, and primary subject fields. Second, the E3 Analytics and Evaluation Project reviewed 2013 and 2014 Performance Plan and Reports (PPR) in December 2014 for any additional evaluations completed within the study period. Seventeen evaluations were identified that had either not been uploaded to the DEC at the time the original list was produced or alternatively had been misclassified when uploaded as a document type other than an evaluation or tagged with a primary subject unrelated to E3 sectors. Four evaluations were identified that were not posted on the DEC and were therefore not included in this study.
Evaluations were screened by the E3 Analytics and Evaluation Project team to confirm that they fell within the date range and to determine which E3 office would review the evaluation. E3 staff also provided feedback on the evaluation list to determine office assignment.
The roster of evaluations coded for this study is included as Annex B.
Data Collection Instruments and Process
Three data collection tools were used for the Sectoral Synthesis.
Content Analysis Questionnaire
The first was a content analysis questionnaire to extract substantive findings from evaluation reports, which was completed for each evaluation by a reviewer from the E3 Bureau. This tool was a revision and expansion of the data collection tool used by the E3 Bureau for the 2012 Sectoral Synthesis report. The E3 Analytics and Evaluation Project facilitated an orientation session with the E3 reviewers, at which additional questions were added at the request of E3 staff members. The content analysis tool is attached as Annex D.
Evaluation Report Quality Review Checklist
Second, in order to assess the quality of the evaluation reports, the Sectoral Synthesis used the Evaluation Report Quality Review checklist used by PPL/LER for the Meta-Evaluation of Quality and Coverage of USAID Evaluations 2009 – 2012. This checklist, which was first used in the MSI Certificate Program in Evaluation provided to USAID staff between 2000 and 2010, was updated following issuance of the USAID Evaluation Policy in 2011 and used in USAID’s Evaluation for Program Managers (EPM) and Evaluation for Evaluation Specialists (EES) courses through 2014. This 37-point checklist is designed to verify the extent to which an evaluation report complies with USAID’s Evaluation Policy and associated ADS 203 requirements and the Agency’s “how to” guide and evaluation report template. A subset of 11 key factors was used in this study, as it was in USAID’s 2009-2012 Meta-Evaluation, to calculate an overall evaluation report score. By using this checklist, this study was able to examine changes over time in evaluation quality from 2009 to 2014 for both the overall quality of the evaluation report as well as on individual quality factors.

SECTORAL SYNTHESIS OF 2013 -2014 EVALUATION FINDINGS: E3 BUREAU 143
The Evaluation Report Quality Review Checklist is supported by an Evaluation Descriptive Data Checklist, which was also used in USAID’s 2009-2012 Meta-Evaluation.
In order to score the 2013 – 2014 evaluations using the Meta-Evaluation checklists, the E3 Analytics and Evaluation Project team went through a series of training and calibration sessions following the same methodology as the 2009- 2012 study. Those individuals who scored evaluations for MSI on the prior study worked closely with the new scorers during the calibration process to ensure comparable scoring. The Evaluation Report Quality Review checklist and rater’s guide are publically available in the USAID Meta-Evaluation report (http://pdf.usaid.gov/pdf_docs/pdacx771.pdf) as well as on the E3 Bureau’s M&E support website, Project Starter (http://usaidprojectstarter.org/) The Evaluation Report Quality Review checklist and the Rater’s Handbook used for this study are included as Annex E.
Gender Integration Analysis Questionnaire
With guidance from the E3 Office of Gender Equality and Women’s Empowerment, the E3 Analytics and Evaluation Project also developed a third data collection tool to address how gender equity and women’s empowerment are dealt with in the evaluation reports. The Project team extracted data relating to these questions from each evaluation report. The gender integration analysis data collection tool is attached as Annex F.
Data Analysis
The E3 Analytics and Evaluation Project team complied the qualitative and quantitative data collected from the content analysis questionnaire, evaluation report quality review, and gender integration analysis reviews. The qualitative data were analyzed for patterns and themes at the E3 Bureau and office levels using MAXQDA. The quantitate data were analyzed using Excel and Tableau to provide descriptive statistics and trends across time and offices.
Team Composition
The E3 Sectoral Synthesis of 2013 – 2014 Evaluation Findings was a collaborative study conducted by a team consisting of both E3 Bureau staff and E3 Analytics and Evaluation Project team members.
A team of 44 sector specialists from 10 offices across the E3 Bureau extracted key lessons learned, project results, areas for improvement, and innovative practices from the evaluation reports. They also looked at cross-cutting topics such as gender equality and women’s empowerment, private sector engagement and governance.
Each evaluation was also reviewed by a team of 11 E3 Analytics and Evaluation Project representatives, using the Evaluation Report Quality Review Checklist, the Evaluation Report Characteristics checklist, and the Gender questionnaire. Six E3 Analytics and Evaluation Project team members then compiled and analyzed the results. The report was written by the MSI Activity Coordinator.
Limitations
The E3 Sectoral Synthesis of 2013 – 2014 Evaluation Findings is intended to be a comprehensive review of evaluations published from January 1, 2013 and September 30, 2014. However, as the study is limited to only those evaluations that had been posted on the DEC as of December 31, 2014, some evaluations completed during this timeframe may have not been submitted to the DEC, were not properly coded as evaluations, or for official reasons are not publically available. Additionally, this study relied on the document type and primary subject classifications on the DEC, which are entered by the group that
SECTORAL SYNTHESIS OF 2013 -2014 EVALUATION FINDINGS: E3 BUREAU 144
completed the evaluation when they uploaded it to the DEC. All efforts were made to be as inclusive as possible, including cross-referencing the DEC list with the PPR evaluation lists in an attempt to identify as many publically available evaluations as possible.
The Evaluation Report Quality Review checklist relies on a set of objective factors based on USAID guidance and best practice. Conversely, the content analysis questionnaire is designed to provide a more nuanced understanding of the technical and thematic aspects of evaluation reports and therefore introduces some subjectivity on the part of the reviewer during data collection. To ensure a high-caliber content review, the content analysis questionnaire was completed by E3 Bureau staff who are well versed in their respective sector. The reviewers were provided with detailed explanations of the data collection questions in order to standardize responses to the extent possible. Finally, the content analysis data were cleaned and analyzed by the E3 Analytics and Evaluation Project team in order to be able to draw conclusions across sectors and the Bureau.

SECTORAL SYNTHESIS OF 2013 -2014 EVALUATION FINDINGS: E3 BUREAU 145
ANNEX D: CONTENT ANALYSIS QUESTIONNAIRE
What is a "project?": An evaluation could be looking at any number of USAID interventions, including activities, projects, programs, DO-level programming, etc. Throughout this tool, the questions refer to the evaluand as a "project". This should be interpreted as whatever intervention or set of interventions the evaluation is addressing.
Source of Information: This questionnaire aims to collect information contained in the evaluation report. Do not use sources outside of the report to answer the questions (i.e. additional program documents, web searches, etc.).
Types of Questions: There are two types of questions: ones that are asking you to report what the evaluation report stated and ones that ask you to provide your insight as a reader and an expert in your field to draw any additional conclusions from the report. The questions that ask you to provide your insight all begin with "As a reader". These questions are optional, and should only be answered with a "yes" as needed.
Providing Text from the Evaluation Report: This questionnaire includes questions that ask you to provide text from the evaluation report. When copying and pasting, please provide enough text that the response is in context (i.e. the whole paragraph that mentions innovation, not just one sentence). If the text is more than a page long (i.e. a whole section on gender equality and women’s empowerment related to project implementation), please provide the key paragraphs as well as the relevant page numbers so that the analysts can review it in detail.
Questionnaire Focus: This questionnaire is broken down into six sections, which will ask you to focus on different aspects of the evaluation report.
Project Design - Information in the evaluation report that describes how the project was initially conceived or planned. Focus on "what did the project plan to do".
Project Implementation / Management - Information in the evaluation report that describes how the project was implemented or managed. Focus on "what did the project actually do".
Technical / Subject Matter - Information in the evaluation report that is about the technical aspects of the intervention. Focus on lessons and innovations about the intervention itself, beyond those related to design or management.
Project Results - Information in the evaluation report that documents the results of the project as a whole. Focus on "what did the project achieve".
Evaluation Innovative Practices - this is the only section that is asking you for information about the evaluation report itself. Focus on innovative practices in evaluation, not the project.
Additional Comments - any additional information about the evaluation report that you feel is important to document. Note that this is only one of two data collection tools that will be used for this study. The other data collection tool focuses on the quality of the evaluation report itself, including adherence to USAID policy and guidance and best practices in evaluation.

SECTORAL SYNTHESIS OF 2013 -2014 EVALUATION FINDINGS: E3 BUREAU 146
# Question Response Options
Guidance
Project Design
1
a Did the evaluation report include lessons learned related to project design?
Y – N These should be identified by the evaluation as “lessons learned”, either in a distinct section of the report or in the conclusions. Do not make any value judgments as to whether they are actually lessons learned, as that will be done during further analysis from the text provided below.
b Provide the text from the evaluation report of the lessons learned in relation to project design.
text Copy/paste the relevant text from the report.
c
As a reader, were there any additional lessons about project design included in the evaluation report that you, as an expert in your field, think would be of interest to others or have implications for effectively addressing similar issues/problems in another setting, such as another county/region or sector?
Y – N
This field allows you to record lessons learned in reading the evaluation report that were not specifically cited as such in the report. These should be things that would be of interest to those outside of the specific project/country context, related to project design. The ADS Glossary defines lessons learned as “the conclusions extracted from reviewing a development program or activity by participants, managers, customers or evaluators with implications for effectively addressing similar issues/problems in another setting.”
d Please describe the additional lessons learned that you identified in relation to project design.
text Provide your additional insight into lessons learned, above and beyond those identified as such in the evaluation report.
2
a Did the evaluation report describe any aspect of the project design as innovative? Y – N
These should be practices identified in the evaluation report as “innovation”, “innovative”, etc. Do not make any judgments as to whether it is actually an innovation, as that will be done during further analysis from the text provided below.
b Provide the text from the evaluation report that describes the innovative practice in project design.
text Copy/paste the relevant text from the report.
c As a reader and an expert in your field, did you identify any additional innovative practices in relation to project design?
Y – N
This field allows you to record any innovative practices in project design that were not specifically cited as such by the evaluation report. As described by Development Innovation Ventures, “Innovation” and “innovative” can describe a variety of concepts, from anything new to something interesting or unexpected. At USAID, we use innovation to refer to novel business or organizational models, operational or production processes, or products or services that lead to substantial improvements (not incremental “next steps”) in addressing development challenges. Innovation may incorporate science and technology but is often broader, to include new processes or business models.”
d Please describe the additional innovative practice(s) you identified in relation to project design.
text Provide your additional insight into an innovative practice in project design, above and beyond those identified as such in the evaluation report.
3 a Did the evaluation report identify any failures and/or problems in the project design? Y – N
These should be specifically cited in the evaluation report as failures, shortcomings or problems in the project design. Do not make any value judgments as to whether the project design actually had failures/shortcomings, as that will be done during further analysis from the text provided below.
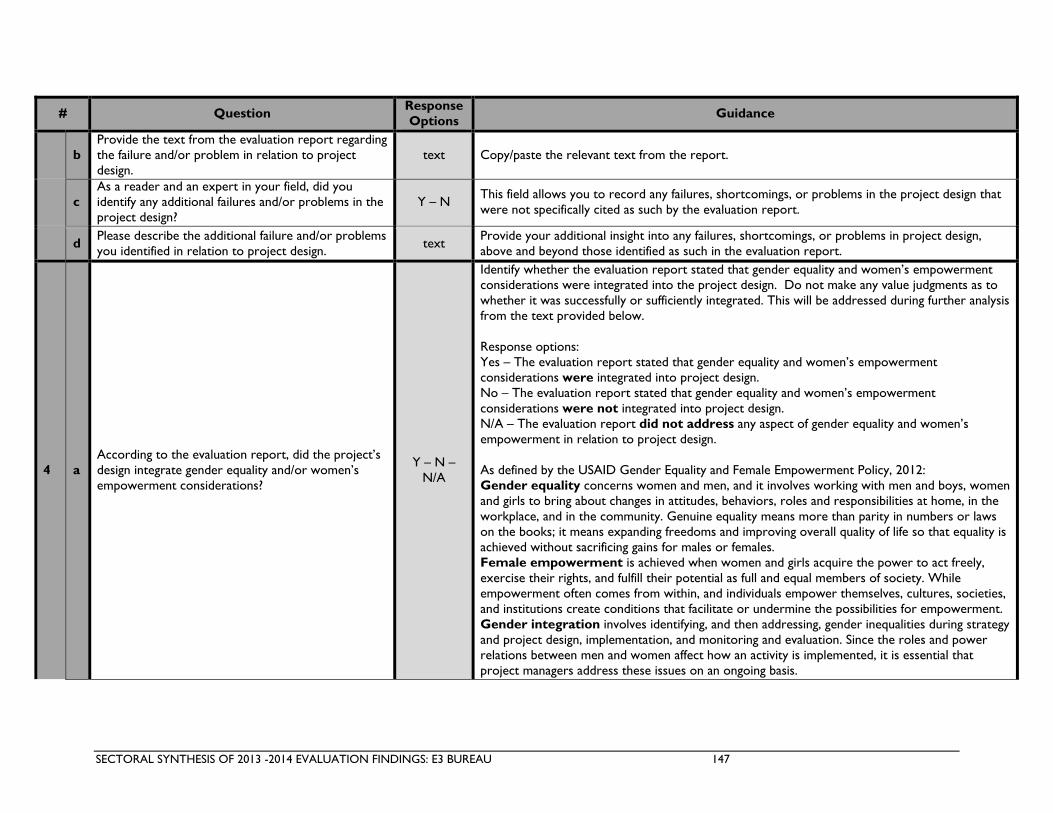
SECTORAL SYNTHESIS OF 2013 -2014 EVALUATION FINDINGS: E3 BUREAU 147
# Question Response Options
Guidance
b Provide the text from the evaluation report regarding the failure and/or problem in relation to project design.
text Copy/paste the relevant text from the report.
c As a reader and an expert in your field, did you identify any additional failures and/or problems in the project design?
Y – N This field allows you to record any failures, shortcomings, or problems in the project design that were not specifically cited as such by the evaluation report.
d Please describe the additional failure and/or problems you identified in relation to project design. text
Provide your additional insight into any failures, shortcomings, or problems in project design, above and beyond those identified as such in the evaluation report.
4 a According to the evaluation report, did the project’s design integrate gender equality and/or women’s empowerment considerations?
Y – N – N/A
Identify whether the evaluation report stated that gender equality and women’s empowerment considerations were integrated into the project design. Do not make any value judgments as to whether it was successfully or sufficiently integrated. This will be addressed during further analysis from the text provided below. Response options: Yes – The evaluation report stated that gender equality and women’s empowerment considerations were integrated into project design. No – The evaluation report stated that gender equality and women’s empowerment considerations were not integrated into project design. N/A – The evaluation report did not address any aspect of gender equality and women’s empowerment in relation to project design. As defined by the USAID Gender Equality and Female Empowerment Policy, 2012: Gender equality concerns women and men, and it involves working with men and boys, women and girls to bring about changes in attitudes, behaviors, roles and responsibilities at home, in the workplace, and in the community. Genuine equality means more than parity in numbers or laws on the books; it means expanding freedoms and improving overall quality of life so that equality is achieved without sacrificing gains for males or females. Female empowerment is achieved when women and girls acquire the power to act freely, exercise their rights, and fulfill their potential as full and equal members of society. While empowerment often comes from within, and individuals empower themselves, cultures, societies, and institutions create conditions that facilitate or undermine the possibilities for empowerment. Gender integration involves identifying, and then addressing, gender inequalities during strategy and project design, implementation, and monitoring and evaluation. Since the roles and power relations between men and women affect how an activity is implemented, it is essential that project managers address these issues on an ongoing basis.

SECTORAL SYNTHESIS OF 2013 -2014 EVALUATION FINDINGS: E3 BUREAU 148
# Question Response Options
Guidance
b Provide the text from the evaluation report on how gender equality and women’s empowerment considerations were integrated in the project design.
text Copy/paste the relevant text from the report.
c As a reader, did you identify any additional aspects of integrating gender equality and women’s empowerment into the project design?
Y – N This field allows you to record any aspects of integrating gender equality and women’s empowerment in the project design that were not specifically cited as such by the evaluation report.
d Please describe the additional gender equality and women’s empowerment considerations you identified in relation to project design.
text Provide your additional insight into aspects of integrating gender equality and women’s empowerment in project design, above and beyond those identified as such in the evaluation report.
5
a According to the evaluation report, was governance addressed in the project's design, such as in the theory of change, assumptions, activities, etc.?
Y – N – N/A
Identify whether the evaluation report stated that governance issues were addressed in the project design. Do not make any value judgments as to whether it was successfully or sufficiently integrated. This will be addressed during further analysis from the text provided below. Response options:
Yes – The evaluation report stated that governance issues were integrated into project design.
No – The evaluation report stated that governance issues were not integrated into project design.
N/A – The evaluation report did not address any aspect of governance issues in relation to project design.
Governance, as defined in the USAID Strategy on Democracy, Human Rights, and Governance, and by the United Nations Development Programme, refers to the exercise of economic, political and administrative authority to manage a country’s affairs at all levels. It involves the process and capacity to formulate, implement, and enforce public policies and deliver services.
b Provide the text from the evaluation report on how governance was addressed in relation to project design.
text Copy/paste the relevant text from the report.
c As a reader, did you identify any additional governance issues relating to project design?
Y – N This field allows you to record any governance issues related to project design that were not specifically cited as such by the evaluation report.
d Please describe the additional information on governance issues you identified in relation to project design.
text Provide your additional insight into the governance issues in project design, above and beyond those identified as such in the evaluation report.

SECTORAL SYNTHESIS OF 2013 -2014 EVALUATION FINDINGS: E3 BUREAU 149
# Question Response Options
Guidance
6
a
According to the evaluation report, was private sector engagement addressed in the project's design, such as in the approach, assumptions, intended partnering?
Y – N – N/A
Identify whether the evaluation report stated that private sector engagement was addressed in the project design. Do not make any value judgments as to whether it was successfully or sufficiently addressed. This will be addressed during further analysis from the text provided below. Response options:
Yes – The evaluation report stated that private sector engagement was integrated into project design.
No – The evaluation report stated that private sector engagement was not integrated into project design.
N/A – The evaluation report did not address any aspect of governance issues in relation to project design.
Private sector engagement is characterized by partnerships between USAID and private sector firms. More information can be found at: http://www.usaid.gov/work-usaid/partnership-opportunities/corporate/commercial-engagement One example provided on the website: The Coca-Cola Company and USAID have created a unique partnership, the Water and Development Alliance (WADA), to address community water needs in developing countries. In conjunction with local USAID missions, Coca-Cola system partners, and the Global Environment & Technology Foundation, WADA contributes to improving the sustainability of watersheds, increasing access to water supply and sanitation services, and enhancing productive uses of water. With a combined investment of $28.1 million since 2005, WADA is impacting the lives of people in 22 countries throughout Africa, Asia, the Middle East, and Latin America.
b Provide the text from the evaluation report on how private sector engagement was addressed in regards to project design.
text Copy/paste the relevant text from the report.
c As a reader, did you identify any additional aspects of private sector engagement in relation to project design?
Y – N This field allows you to record any private sector engagement related to project design that was not specifically cited as such by the evaluation report.
d Please describe the additional information on governance issues you identified in relation to project design.
text Provide your additional insight into the private sector engagement in project design, above and beyond those identified as such in the evaluation report.

SECTORAL SYNTHESIS OF 2013 -2014 EVALUATION FINDINGS: E3 BUREAU 150
# Question Response Options
Guidance
Project Management / Implementation
7
a Did the evaluation report include lessons learned related to project management / implementation?
Y – N These should be identified by the evaluation as “lessons learned”, either in a distinct section of the report or in the conclusions. Do not make any value judgments as to whether they are actually lessons learned, as that will be done during further analysis from the text provided below.
b Provide the text from the evaluation report of the lessons learned in relation to project management / implementation.
text Copy/paste the relevant text from the report.
c
As a reader, were there any additional lessons about project management / implementation included in the evaluation report that you, as an expert in your field, think would be of interest to others or have implications for effectively addressing similar issues/problems in another setting, such as another county/region or sector?
Y – N
This field allows you to record lessons learned in reading the evaluation report that were not specifically cited as such in the report. These should be things that would be of interest to those outside of the specific project/country context, related to project management / implementation. The ADS Glossary defines lessons learned as “the conclusions extracted from reviewing a development program or activity by participants, managers, customers or evaluators with implications for effectively addressing similar issues/problems in another setting.”
d Please describe the additional lessons learned you identified in relation to project management / implementation.
text Provide your additional insight into lessons learned, above and beyond those identified as such in the evaluation report.
8
a Did the evaluation report describe any aspect of the project management / implementation as innovative?
Y – N These should be practices identified in the evaluation report as “innovation”, “innovative”, etc. Do not make any judgments as to whether it is actually an innovation, as that will be done during further analysis from the text provided below.
b Provide the text from the evaluation report that describes the innovative practice in project management / implementation.
text Copy/paste the relevant text from the report.
c As a reader and an expert in your field, did you identify any additional innovative practices in relation to project management / implementation?
Y – N
This field allows you to record any innovative practices in project management / implementation that were not specifically cited as such by the evaluation report. As described by Development Innovation Ventures, “Innovation” and “innovative” can describe a variety of concepts, from anything new to something interesting or unexpected. At USAID, we use innovation to refer to novel business or organizational models, operational or production processes, or products or services that lead to substantial improvements (not incremental “next steps”) in addressing development challenges. Innovation may incorporate science and technology but is often broader, to include new processes or business models.”
d Please describe the additional innovative practice(s) you identified in relation to project management / implementation.
text Provide your additional insight into an innovative practice in project management / implementation, above and beyond those identified as such in the evaluation report.

SECTORAL SYNTHESIS OF 2013 -2014 EVALUATION FINDINGS: E3 BUREAU 151
# Question Response Options
Guidance
9
a Did the evaluation report identify any failures and/or problems in the project management / implementation?
Y – N
These should be specifically cited in the evaluation report as failures, shortcomings or problems in the project management / implementation. Do not make any value judgments as to whether the project design actually had failures/shortcomings, as that will be done during further analysis from the text provided below.
b Provide the text from the evaluation report regarding the failure and/or problem in relation to project management / implementation.
text Copy/paste the relevant text from the report.
c As a reader and an expert in your field, did you identify any additional failures and/or problems in the project management / implementation?
Y – N This field allows you to record any failures, shortcomings, or problems in the project management / implementation that were not specifically cited as such by the evaluation report.
d Please describe the additional failure and/or problems you identified in relation to project management / implementation.
text Provide your additional insight into any failures, shortcomings, or problems in project management / implementation, above and beyond those identified as such in the evaluation report.

SECTORAL SYNTHESIS OF 2013 -2014 EVALUATION FINDINGS: E3 BUREAU 152
# Question Response Options
Guidance
10
a
According to the evaluation report, did the project’s management / implementation integrate gender equality and/or women’s empowerment considerations?
Y – N – N/A
Identify whether the evaluation report stated that gender equality and women’s empowerment considerations were integrated into the project management / implementation. Do not make any value judgments as to whether it was successfully or sufficiently integrated. This will be addressed during further analysis from the text provided below. Yes – The evaluation report stated that gender equality and women’s empowerment considerations were integrated into project management / implementation. No – The evaluation report stated that gender equality and women’s empowerment considerations were not integrated into project management / implementation. N/A – The evaluation report did not address any aspect of gender equality and women’s empowerment in relation to project management / implementation. As defined by the USAID Gender Equality and Female Empowerment Policy, 2012: Gender equality concerns women and men, and it involves working with men and boys, women and girls to bring about changes in attitudes, behaviors, roles and responsibilities at home, in the workplace, and in the community. Genuine equality means more than parity in numbers or laws on the books; it means expanding freedoms and improving overall quality of life so that equality is achieved without sacrificing gains for males or females. Female empowerment is achieved when women and girls acquire the power to act freely, exercise their rights, and fulfill their potential as full and equal members of society. While empowerment often comes from within, and individuals empower themselves, cultures, societies, and institutions create conditions that facilitate or undermine the possibilities for empowerment. Gender integration involves identifying, and then addressing, gender inequalities during strategy and project design, implementation, and monitoring and evaluation. Since the roles and power relations between men and women affect how an activity is implemented, it is essential that project managers address these issues on an ongoing basis.
b
Provide the text from the evaluation report on how gender equality and/or women’s empowerment considerations were integrated in the project management / implementation.
text Copy/paste the relevant text from the report.
c
As a reader, did you identify any additional aspects of integrating gender equality and women’s empowerment into the project management / implementation?
Y – N This field allows you to record any aspects of integrating gender equality and women’s empowerment in the project management / implementation that were not specifically cited as such by the evaluation report.
d Please describe the additional gender equality and women’s empowerment considerations you identified in relation to project management / implementation.
text Provide your additional insight into aspects of integrating gender equality and women’s empowerment in project management / implementation, above and beyond those identified as such in the evaluation report.

SECTORAL SYNTHESIS OF 2013 -2014 EVALUATION FINDINGS: E3 BUREAU 153
# Question Response Options
Guidance
11
a
According to the evaluation report, was governance addressed in the project's management / implementation, such as in the theory of change, assumptions, activities, etc.?
Y – N – N/A
Identify whether the evaluation report stated that governance issues were addressed in the project management / implementation. Do not make any value judgments as to whether it was successfully or sufficiently integrated. This will be addressed during further analysis from the text provided below. Response options:
Yes – The evaluation report stated that governance issues were integrated into project management / implementation.
No – The evaluation report stated that governance issues were not integrated into project management / implementation.
N/A – The evaluation report did not address any aspect of governance issues in relation to project management / implementation.
Governance, as defined in the USAID Strategy on Democracy, Human Rights, and Governance, and by the United Nations Development Programme, refers to the exercise of economic, political and administrative authority to manage a country’s affairs at all levels. It involves the process and capacity to formulate, implement, and enforce public policies and deliver services.
b Provide the text from the evaluation report on how governance was addressed in relation to project management / implementation.
text Copy/paste the relevant text from the report.
c As a reader, did you identify any additional governance issues relating to project management / implementation?
Y – N This field allows you to record any governance issues related to project management / implementation that were not specifically cited as such by the evaluation report.
d Please describe the additional information on governance issues you identified in relation to project management / implementation.
text Provide your additional insight into the governance issues in project management / implementation, above and beyond those identified as such in the evaluation report.
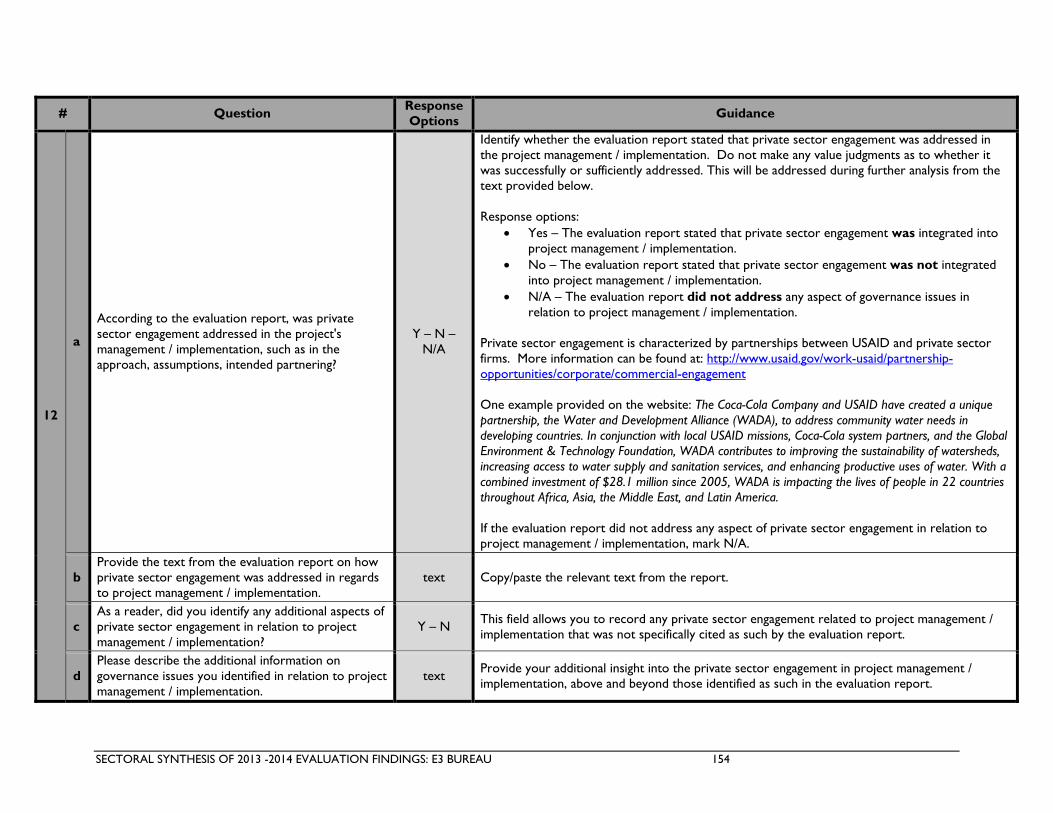
SECTORAL SYNTHESIS OF 2013 -2014 EVALUATION FINDINGS: E3 BUREAU 154
# Question Response Options
Guidance
12
a
According to the evaluation report, was private sector engagement addressed in the project's management / implementation, such as in the approach, assumptions, intended partnering?
Y – N – N/A
Identify whether the evaluation report stated that private sector engagement was addressed in the project management / implementation. Do not make any value judgments as to whether it was successfully or sufficiently addressed. This will be addressed during further analysis from the text provided below. Response options:
Yes – The evaluation report stated that private sector engagement was integrated into project management / implementation.
No – The evaluation report stated that private sector engagement was not integrated into project management / implementation.
N/A – The evaluation report did not address any aspect of governance issues in relation to project management / implementation.
Private sector engagement is characterized by partnerships between USAID and private sector firms. More information can be found at: http://www.usaid.gov/work-usaid/partnership-opportunities/corporate/commercial-engagement One example provided on the website: The Coca-Cola Company and USAID have created a unique partnership, the Water and Development Alliance (WADA), to address community water needs in developing countries. In conjunction with local USAID missions, Coca-Cola system partners, and the Global Environment & Technology Foundation, WADA contributes to improving the sustainability of watersheds, increasing access to water supply and sanitation services, and enhancing productive uses of water. With a combined investment of $28.1 million since 2005, WADA is impacting the lives of people in 22 countries throughout Africa, Asia, the Middle East, and Latin America. If the evaluation report did not address any aspect of private sector engagement in relation to project management / implementation, mark N/A.
b Provide the text from the evaluation report on how private sector engagement was addressed in regards to project management / implementation.
text Copy/paste the relevant text from the report.
c As a reader, did you identify any additional aspects of private sector engagement in relation to project management / implementation?
Y – N This field allows you to record any private sector engagement related to project management / implementation that was not specifically cited as such by the evaluation report.
d Please describe the additional information on governance issues you identified in relation to project management / implementation.
text Provide your additional insight into the private sector engagement in project management / implementation, above and beyond those identified as such in the evaluation report.
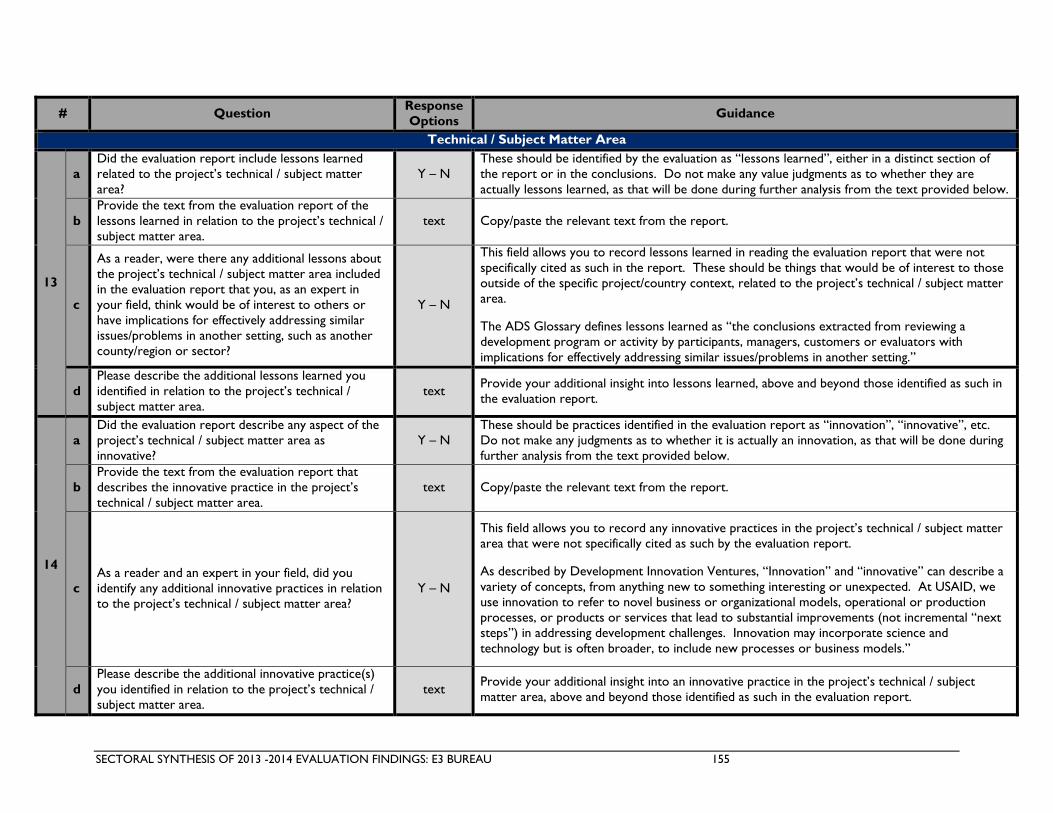
SECTORAL SYNTHESIS OF 2013 -2014 EVALUATION FINDINGS: E3 BUREAU 155
# Question Response Options
Guidance
Technical / Subject Matter Area
13
a Did the evaluation report include lessons learned related to the project’s technical / subject matter area?
Y – N These should be identified by the evaluation as “lessons learned”, either in a distinct section of the report or in the conclusions. Do not make any value judgments as to whether they are actually lessons learned, as that will be done during further analysis from the text provided below.
b Provide the text from the evaluation report of the lessons learned in relation to the project’s technical / subject matter area.
text Copy/paste the relevant text from the report.
c
As a reader, were there any additional lessons about the project’s technical / subject matter area included in the evaluation report that you, as an expert in your field, think would be of interest to others or have implications for effectively addressing similar issues/problems in another setting, such as another county/region or sector?
Y – N
This field allows you to record lessons learned in reading the evaluation report that were not specifically cited as such in the report. These should be things that would be of interest to those outside of the specific project/country context, related to the project’s technical / subject matter area. The ADS Glossary defines lessons learned as “the conclusions extracted from reviewing a development program or activity by participants, managers, customers or evaluators with implications for effectively addressing similar issues/problems in another setting.”
d Please describe the additional lessons learned you identified in relation to the project’s technical / subject matter area.
text Provide your additional insight into lessons learned, above and beyond those identified as such in the evaluation report.
14
a Did the evaluation report describe any aspect of the project’s technical / subject matter area as innovative?
Y – N These should be practices identified in the evaluation report as “innovation”, “innovative”, etc. Do not make any judgments as to whether it is actually an innovation, as that will be done during further analysis from the text provided below.
b Provide the text from the evaluation report that describes the innovative practice in the project’s technical / subject matter area.
text Copy/paste the relevant text from the report.
c As a reader and an expert in your field, did you identify any additional innovative practices in relation to the project’s technical / subject matter area?
Y – N
This field allows you to record any innovative practices in the project’s technical / subject matter area that were not specifically cited as such by the evaluation report. As described by Development Innovation Ventures, “Innovation” and “innovative” can describe a variety of concepts, from anything new to something interesting or unexpected. At USAID, we use innovation to refer to novel business or organizational models, operational or production processes, or products or services that lead to substantial improvements (not incremental “next steps”) in addressing development challenges. Innovation may incorporate science and technology but is often broader, to include new processes or business models.”
d Please describe the additional innovative practice(s) you identified in relation to the project’s technical / subject matter area.
text Provide your additional insight into an innovative practice in the project’s technical / subject matter area, above and beyond those identified as such in the evaluation report.

SECTORAL SYNTHESIS OF 2013 -2014 EVALUATION FINDINGS: E3 BUREAU 156
# Question Response Options
Guidance
Project Results
15
A Did the evaluation report identify the project’s performance targets? Y – N
Performance targets relate to the project’s monitoring and evaluation plan, which in some reports may be referred to as the performance management plan or performance monitoring plan (PMP). ADS Glossary definition of performance target: Specific, planned level of result to be achieved within an explicit timeframe.
b As a whole, did the evaluation report state that the project exceeded, met, or fell short of its performance targets?
Exceeded – Met – Fell Short –
N/A
Note that this question is for the project as a whole, not for individual indicators. When in doubt about whether a project achieved its targets, round up. For example, if half of the performance targets were met and half fell slightly short, mark “met”. If the evaluation report included discussion of the project’s performance targets but did not address whether the project exceeded/met/fell short, mark N/A.
c As a reader, is there any contextual information that you think is important to consider related to performance targets?
text This space allows for any contextual information about performance targets which was included in the evaluation report that you as the reviewer find important.
16 a
Did the evaluation report identify any outcomes that were achieved? Respond yes only if you, as the reader, identify these achievements as outcomes, and not outputs.
Y – N
This question is asking about outcomes of the project, not outputs. An outcome is the change that the project achieved (i.e. demonstrated learning), whereas an output is the activity or product that the project produced (i.e. number of people trained). The evaluation team may or may not be using the term “outcome” correctly. Only answer “yes” if specific outcomes (as defined above) are identified. ADS Glossary definition of outcome: A higher level or end result at the assistance objective level. Development Objectives should be outcomes. An outcome is expected to have a positive impact on and lead to change in the development situation of the host country.
b Provide the text from the evaluation report regarding the outcomes.
text Copy/paste the relevant text from the report.

SECTORAL SYNTHESIS OF 2013 -2014 EVALUATION FINDINGS: E3 BUREAU 157
# Question Response Options
Guidance
c Did the evaluation report state that the change in these outcomes could be attributed to the project?
Y – N – N/A
This question is about attribution or causality. Response options: Yes - The evaluation report states that the change in outcome(s) can be attributed to the project. No - The evaluation report states that the change in outcome(s) cannot be attributed to the project. N/A - The evaluation report discusses a change in outcome(s), but does not address attribution or causality at all. An evaluation report may attempt to establish attribution or causality in reference to an experimental (control group, randomized assignment, or randomized controlled trial) or quasi-experimental (comparison group, propensity score matching, interrupted time series, or regression discontinuity) design. Terminology associated with a non-experimental design might include language identifying and eliminating alternative possible causes (modus operandi), outcome mapping, action research, contribution analysis, or case study.
d Provide the text from the evaluation report attributing the change in outcomes to the project.
text Copy/paste the relevant text from the report.
Innovative Practices in Evaluation
17 a
Did the evaluation report describe any aspect of the evaluation itself as innovative, such as the evaluation design, methodology, analysis, etc.?
Y – N
These should be practices identified in the evaluation report as “innovation”, “innovative”, etc. pertaining to the evaluation itself (not the project being evaluated). Do not make any judgments as to whether it is actually an innovation, as that will be done during further analysis from the text provided below.
b Provide the text from the evaluation report that describes the innovative evaluation practice.
text Copy/paste the relevant text from the report.
Additional Information
18 a
Please provide any additional notes about the project or evaluation that are relevant to this study, such as additional strengths, weaknesses, or concerns that were not addressed above.
text

SECTORAL SYNTHESIS OF 2013 -2014 EVALUATION FINDINGS: E3 BUREAU 158
ANNEX E: EVALUATION REPORT QUALITY REVIEW CHECKLISTS AND RATER’S GUIDES
Evaluation Report Quality Review Checklist
Evaluation Report Quality Review Checklist Yes No N/A9
Executive Summary 1. Does the Executive Summary accurately reflect the most critical elements of the
report?
Program/Project Background 2. Are the basic characteristics of the program, project or activity described (title,
dates, funding organization, budget, implementing organization, location/map, target group, contextual information)?
3. Is the program or project’s “theory of change” described (intended results (in particular the project purpose); development hypotheses; assumptions)
Evaluation Purpose 4. Does the evaluation purpose identify the management reason(s) for undertaking the
evaluation?
Evaluation Questions How many evaluation questions does the evaluation report state that the evaluation addressed (in the body of the report, not the SOW)?10 Count the number of visible question marks.
Enter a number below
5. Are the evaluation questions stated in the body of the report clearly related to the evaluation purpose?
6. Are the evaluation questions in the report identical to the evaluation questions in the evaluation SOW?
7. If the questions in the body of the report and those found in the SOW differ, does the report (or annexes) state that there was written approval for changes in the evaluation questions?
Methodology 8. Does the report (or methods annex) describe specific data collection methods the
team used?
9. Are the data collection methods presented (in the report or methods annex) in a manner that makes it clear which specific methods are used to address each evaluation question? (e.g., matrix of questions by methods)
10. Does the report (or methods annex) describe specific data analysis methods the team used? (frequency distributions, cross-tabulations; correlation; reanalysis of secondary data)
11. Are the data analysis methods presented (in the report or methods annex) in a manner that makes it clear how they are associated with the evaluation questions or specific data collection methods?
Team Composition 12. Did the report (or methods annex) indicate that the evaluation team leader was
external to USAID?
13. Did the report (or methods annex) identify at least one evaluation specialist on the
9 In this instrument we define N/A as “the conditions required to answer the question are not all present.” 10 This question is not a numbered checklist question as it cannot be answered yes or no, but it nevertheless provides important information about the evaluation report.

SECTORAL SYNTHESIS OF 2013 -2014 EVALUATION FINDINGS: E3 BUREAU 159
Evaluation Report Quality Review Checklist Yes No N/A9
team? 14. Did the report (or methods annex) identify local evaluation team members? 15. Did the report indicate that team members had signed Conflict of Interest forms or
letters? (check if the report says this or the COI forms are included in an annex)
Study Limitations 16. Does the report include a description of study limitations (lack of baseline data;
selection bias as to sites, interviewees, comparison groups; seasonal unavailability of key informants)?
Responsiveness to Evaluation Questions 17. Is the evaluation report structured to present findings in relation to evaluation
questions, as opposed to presenting information in relation to program/project objectives or in some other format?
18. Are all of the evaluation questions, including sub-questions, answered primarily in the body of the report (as opposed to in an annex)
19. If any questions were not answered, did the report provide a reason why? Findings 20. Did the findings presented appear to be drawn from social science data collection
and analysis methods the team described in its study methodology (including secondary data it assembled or reanalyzed)?
21. For findings presented within the evaluation report is there a transparent connection to the source(s) of the data? (60% of the beneficiaries’ interviews reported that…)
22. In the presentation of findings, did the team draw on data from the range of methods they used rather than answer using data from primarily one method?
23. Are findings clearly distinguished from conclusions and recommendations in the report, at least by the use of language that signals transitions (“the evaluation found that…..” “the team concluded that …..”)?
24. Are quantitative findings reported precisely, i.e., as specific numbers or percentages rather than general statements like “some”, “many”, or “most”?
25. Does the report present findings about unplanned/unanticipated results? 26. Does the report discuss alternative possible causes of results/outcomes it
documents?
27. Are evaluation findings disaggregated by sex at all levels (activity, outputs, outcomes) when data are person-focused?
28. Does the report explain whether access/ participation and/or outcomes/benefits were different for men and women when data are person-focused?
Recommendations 29. Is the report’s presentation of recommendations limited to recommendations? (free
from repetition of information already presented or new findings not previously revealed)
30. Do evaluation recommendations meet USAID policy expectations with respect to being specific? (states clearly what is to be done, and possibly how?)
31. Do evaluation recommendations meet USAID policy expectations with respect to being directed to a specific party? (identifies who should do it)
32. Are all the recommendations supported by the findings and conclusions presented? (Can a reader can follow a transparent path from findings to conclusions to recommendations?)
Annexes 33. Is the evaluation SOW included as an annex to the evaluation report? 34. Are sources of information that the evaluators used listed in annexes? 35. Are data collection instruments provided as evaluation report annexes?

SECTORAL SYNTHESIS OF 2013 -2014 EVALUATION FINDINGS: E3 BUREAU 160
Evaluation Report Quality Review Checklist Yes No N/A9
36. Is there a matching instrument for each and every data collection method the team reported that they used?
37. Were any “Statements of Differences” included as evaluation annexes (prepared by team members, the Mission, the Implementing Partner, or other stakeholder)?
Evaluation Data Warehousing 38. Does the evaluation report explain how/in what form the evaluation data will be
transferred to USAID (survey data, focus group transcripts)?
Link to Evaluation Policy quality standards (proxy for evaluation team awareness of expectations) 39. Does the evaluation SOW include a copy or the equivalent of Appendix 1 of the
evaluation policy?
Additional Questions About Basic Evaluation Characteristics 40. Does the report include a Table of Contents? 41. Does the report include a glossary and/or list of acronyms? 42. Is the report well-written (clear sentences, reasonable length paragraphs) and
mostly free of typos and other grammatical errors?
43. Is the report well-organized (each topic is clearly delineated, subheadings used for easy reading)?
44. Is the date of the report given on the report cover or inside cover? 45. Is the name of the team leader present in the report or on the report cover, inside
cover or in the preface or introduction to the report?
Calculating the Quality of Evaluation Report Score Following the same methodology used in the the USAID Meta-Evaluation of Quality and Coverage of USAID Evaluations 2009 – 2012 (http://pdf.usaid.gov/pdf_docs/PDACX771.pdf), the E3 Sectoral Synthesis includes evaluation report quality scores. This score is based on based on a subset of eleven of the factors included in this checklist. To calculate the score, award 1 point for “yes” on items 1, 8, 10, 16, 20, 23, 32, 33 and 35. Award 1 point if the evaluation received a “yes” on items 2 and 3.

SECTORAL SYNTHESIS OF 2013 -2014 EVALUATION FINDINGS: E3 BUREAU 161
Evaluation Descriptive Data Checklist
Rater’s Name Date
Report Title Evaluation Descriptive Data Checklist Y/N or text 1. What kind of document is it? (Select only one option) Evaluation Audit (IG or GAO)
Assessment Meta-analysis Meta-evaluation Evaluation guidance Other Please insert exact language from there report here.) Unable to determine If this document is not an evaluation, STOP HERE. 2. Year Published (read spreadsheet and confirm, if correct enter Yes to the
right, if No, enter correct answer directly below)
3. Month the Report was Published (enter the month, e.g., May 4. Document Title (answer as above)
5. Authorizing Organization (answer as above)
6. Sponsoring Organization (answer as above)
7. Geographic Descriptors (answer as above)
8. Primary Subject (answer as above) 9. Report Length a. Executive Summary alone (pages) b. Report, including Executive Summary, excluding annexes
(pages = final page number for body of the report)
10. Evaluation Type (choose only one) Performance Impact Both (hybrid) Unable to determine
11. Timing (choose only one) During Implementation Towards End of Program/Project Continuous (parallel Impact Evaluation) Ex-Post Unable to determine
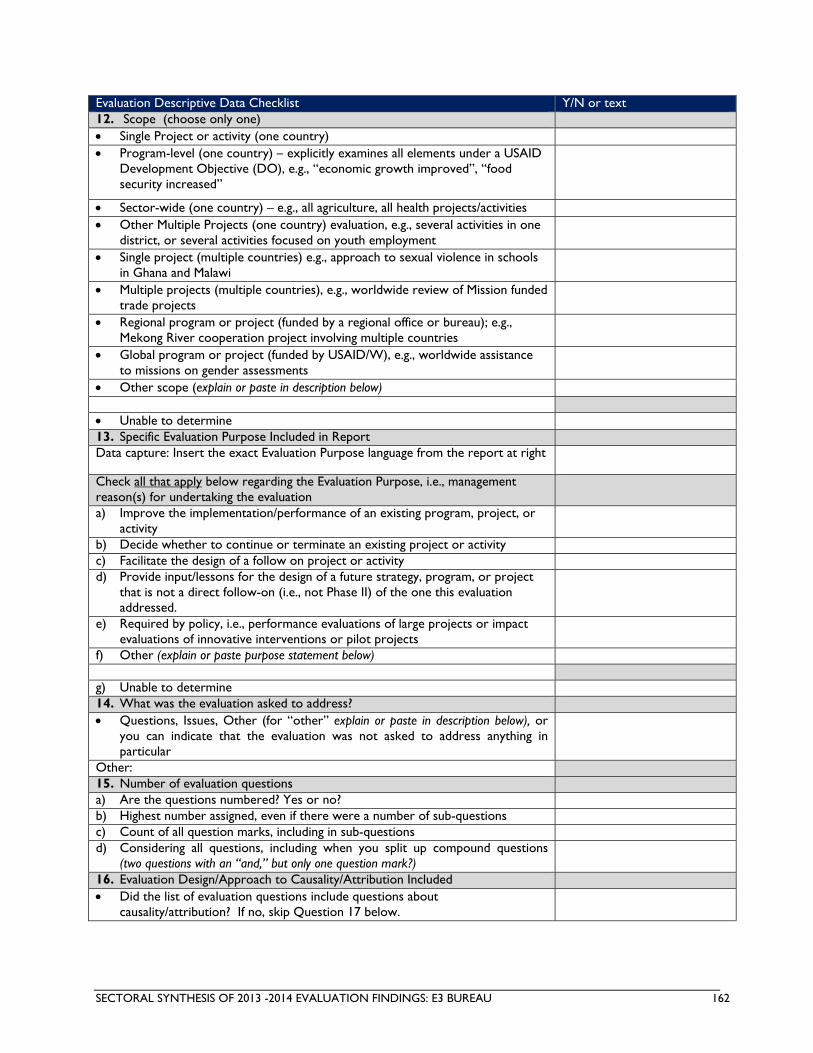
SECTORAL SYNTHESIS OF 2013 -2014 EVALUATION FINDINGS: E3 BUREAU 162
Evaluation Descriptive Data Checklist Y/N or text 12. Scope (choose only one) Single Project or activity (one country) Program-level (one country) – explicitly examines all elements under a USAID
Development Objective (DO), e.g., “economic growth improved”, “food security increased”
Sector-wide (one country) – e.g., all agriculture, all health projects/activities Other Multiple Projects (one country) evaluation, e.g., several activities in one
district, or several activities focused on youth employment
Single project (multiple countries) e.g., approach to sexual violence in schools in Ghana and Malawi
Multiple projects (multiple countries), e.g., worldwide review of Mission funded trade projects
Regional program or project (funded by a regional office or bureau); e.g., Mekong River cooperation project involving multiple countries
Global program or project (funded by USAID/W), e.g., worldwide assistance to missions on gender assessments
Other scope (explain or paste in description below)
Unable to determine 13. Specific Evaluation Purpose Included in Report Data capture: Insert the exact Evaluation Purpose language from the report at right
Check all that apply below regarding the Evaluation Purpose, i.e., management reason(s) for undertaking the evaluation
a) Improve the implementation/performance of an existing program, project, or activity
b) Decide whether to continue or terminate an existing project or activity c) Facilitate the design of a follow on project or activity d) Provide input/lessons for the design of a future strategy, program, or project
that is not a direct follow-on (i.e., not Phase II) of the one this evaluation addressed.
e) Required by policy, i.e., performance evaluations of large projects or impact evaluations of innovative interventions or pilot projects
f) Other (explain or paste purpose statement below)
g) Unable to determine 14. What was the evaluation asked to address? Questions, Issues, Other (for “other” explain or paste in description below), or
you can indicate that the evaluation was not asked to address anything in particular
Other: 15. Number of evaluation questions a) Are the questions numbered? Yes or no? b) Highest number assigned, even if there were a number of sub-questions c) Count of all question marks, including in sub-questions d) Considering all questions, including when you split up compound questions
(two questions with an “and,” but only one question mark?)
16. Evaluation Design/Approach to Causality/Attribution Included Did the list of evaluation questions include questions about
causality/attribution? If no, skip Question 17 below.
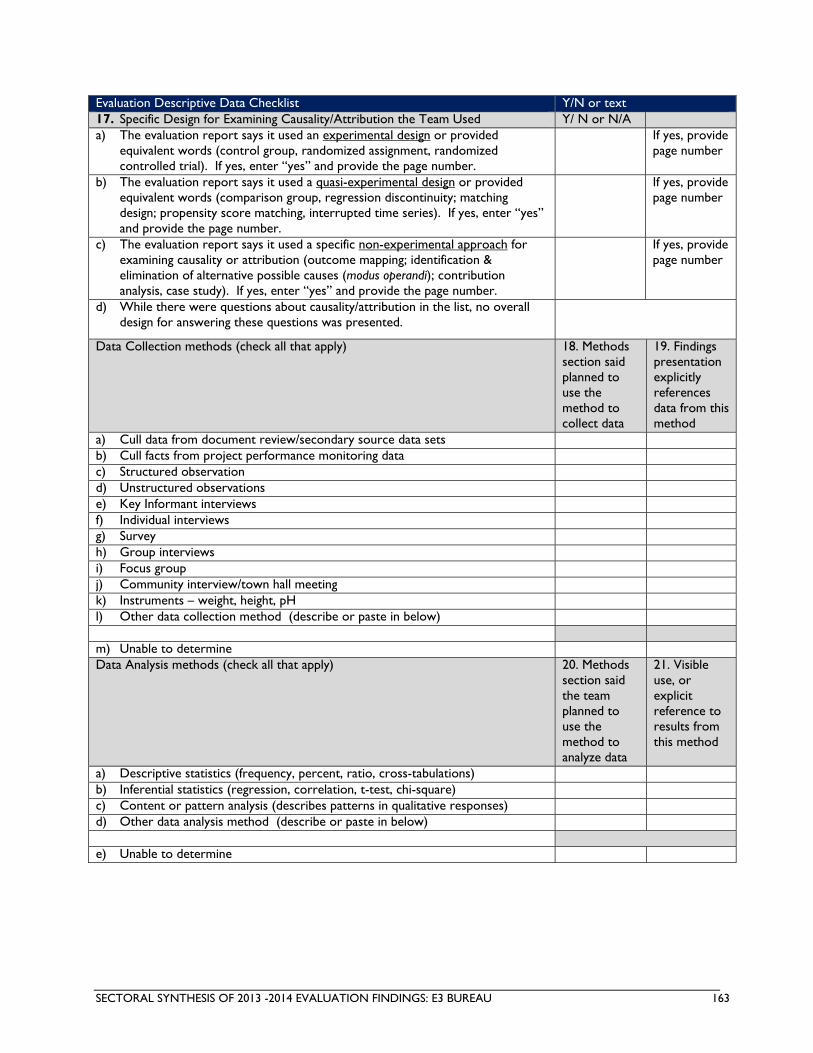
SECTORAL SYNTHESIS OF 2013 -2014 EVALUATION FINDINGS: E3 BUREAU 163
Evaluation Descriptive Data Checklist Y/N or text 17. Specific Design for Examining Causality/Attribution the Team Used Y/ N or N/A a) The evaluation report says it used an experimental design or provided
equivalent words (control group, randomized assignment, randomized controlled trial). If yes, enter “yes” and provide the page number.
If yes, provide page number
b) The evaluation report says it used a quasi-experimental design or provided equivalent words (comparison group, regression discontinuity; matching design; propensity score matching, interrupted time series). If yes, enter “yes” and provide the page number.
If yes, provide page number
c) The evaluation report says it used a specific non-experimental approach for examining causality or attribution (outcome mapping; identification & elimination of alternative possible causes (modus operandi); contribution analysis, case study). If yes, enter “yes” and provide the page number.
If yes, provide page number
d) While there were questions about causality/attribution in the list, no overall design for answering these questions was presented.
Data Collection methods (check all that apply)
18. Methods section said planned to use the method to collect data
19. Findings presentation explicitly references data from this method
a) Cull data from document review/secondary source data sets b) Cull facts from project performance monitoring data c) Structured observation d) Unstructured observations e) Key Informant interviews f) Individual interviews g) Survey h) Group interviews i) Focus group j) Community interview/town hall meeting k) Instruments – weight, height, pH l) Other data collection method (describe or paste in below)
m) Unable to determine Data Analysis methods (check all that apply) 20. Methods
section said the team planned to use the method to analyze data
21. Visible use, or explicit reference to results from this method
a) Descriptive statistics (frequency, percent, ratio, cross-tabulations) b) Inferential statistics (regression, correlation, t-test, chi-square) c) Content or pattern analysis (describes patterns in qualitative responses) d) Other data analysis method (describe or paste in below)
e) Unable to determine

SECTORAL SYNTHESIS OF 2013 -2014 EVALUATION FINDINGS: E3 BUREAU 164
Evaluation Descriptive Data Checklist Y/N or text 22. Did the evaluation report state that a participatory approach or method was
used? If yes, indicate who participated (beyond contributing data) and at what stage of the evaluation in questions 23 and 24 below. If not, please skip questions 23 and 24.
23. Participatory – who participated (check all that apply) a) USAID staff b) Contractor/grantee partner staff c) Country partner - government d) Other donor (as in joint evaluation) e) Beneficiaries – farmers, small enterprises, households f) Others who participated (describe or paste in below)
a) Unable to determine 24. Participatory – phase of evaluation (check all that apply) b) Evaluation design/methods selection c) Data collection d) Data analysis e) Formulation of recommendations f) Other type of participation (describe or paste in below) g) Unable to determine 25. Recommendations Number of recommendation provided in the report’s recommendations
section or summary of recommendations.

SECTORAL SYNTHESIS OF 2013 -2014 EVALUATION FINDINGS: E3 BUREAU 165
Evaluation Report Quality Review Rater’s Guide
Evaluation Report Quality Review Checklist - Rater’s Guide11
Executive Summary
1. Does the executive summary present an accurate reflection of the most critical elements of the report?
An executive summary must provide an accurate representation of the gist of the evaluation report without adding any new “material” information or contradicting the evaluation report in any way. “Critical” implies that not all information included in the evaluation report needs to be present in the executive summary, but that critical information from all major elements should be discussed (i.e., evaluation purpose, questions, background information, methods, study limitations, findings, and recommendations). If an executive summary is not present, mark “N/A.”
Program/Project Background 2. Are the basic characteristics of the
project or program described (title, dates, funding organization, budget, implementing organization, location/map, target group)?
The project description plays a critical role in enabling the reader to understand the context of the evaluation, and involves several characteristics such as the title, dates, funding organization, budget, implementing organization, location/map, and target group. All of these characteristics play an important role and virtually all should be present to receive credit for this item in order to take a holistic view of whether the project is sufficiently well-described. If one or two characteristics are missing or weak but you get the gist of the project and can answer all future questions, then check “yes.”
3. Is the project or program’s “theory of change” described (intended results (in particular the project Purpose); development hypotheses; assumptions)
The “theory of change” describes, via narrative and/or graphic depiction of the intended results and causal logic, how anticipated results will be achieved. You may see this described as the development hypotheses and assumptions underlying the project or program. We expect that a clear explanation of the theory of change/development hypotheses will be presented in the evaluation report before the evaluation’s finding are presented.
Evaluation Purpose 4. Does the evaluation purpose
identify the management reason(s) for undertaking the evaluation?
Evaluation policy states that USAID is conducting evaluations for learning and accountability purposes. Beyond that, it is important that the evaluation purpose identifies the specific decisions or actions the evaluation is expected to inform (e.g., continue, terminate, expand, or redesign an intervention). If a statement of the evaluation purpose is not found, or is only present in the SOW, mark “N/A.”
Evaluation Questions 5. Are the evaluation questions
clearly related to the evaluation purpose?
The evaluation questions, as stated in the evaluation report, should have a direct and clear relationship to the stated evaluation purpose. If no evaluation questions are provided in the body of the report before the findings, or in the SOW, check “N/A.” Even if questions are provided, this question cannot be answered if no evaluation purpose was included. Thus if item (4) above indicated that there was no purpose stated, then this question must be marked “N/A.”
11 For this checklist the term N/A means that the conditions needed to rate a particular item are not present. for example, if no evaluation questions were included in the evaluation repot, then later items that ask about characteristics of the evaluation questions cannot be answered and should be rated N/A. Shading on the checklist response column indicates with N/A is an allowable answer.

SECTORAL SYNTHESIS OF 2013 -2014 EVALUATION FINDINGS: E3 BUREAU 166
Evaluation Report Quality Review Checklist - Rater’s Guide11
6. Are the evaluation questions in the report identical to the evaluation questions in the SOW?
This question is about evaluation questions found in the body of the report and in the SOW. There must be questions in both places in order address this question. If questions are present in only one of these two places, mark “N/A.”
7. If the questions in the body of the report and those found in the SOW differ, does the report (or annexes) state that there was written approval for changes in the evaluation questions?
The evaluation SOW is the contract evaluators work from, so it is imperative that the questions/issues in the body of the evaluation report match those included in the SOW word for word. If the evaluation team changed, removed, or added evaluation questions/issues, USAID policy states that they should only have done so with written approval from USAID. While this written approval does not need to be included in an annex, it does need to be mentioned in the body of the report. If the answer to 6 is “yes” or “N/A” then mark 7 as “N/A.” If the answer to 6 is “no” then answer 7 with a “yes” or “no.”
Methodology 8. Does the report (or methods
annex) describe specific data collection methods the team used?
USAID requires that an evaluation report identify the data collection methods used, but does not indicate where this information must be presented. It is common to include the methodology description in the body of the report with a longer and more detailed methods annex, so be sure and check the annex. To receive credit, the methods description must be specific on how and from whom data will be collected. It is insufficient to say, “interviews will be conducted.” To be adequate a description of methods must indicate what types of interviews, estimated numbers, and with whom they will be conducted (e.g., key informant interviews, individual interviews with beneficiaries, group interviews).
9. Are the data collection methods presented (in the report or methods annex) in a manner that makes it clear which specific methods are used to address each evaluation question (e.g., matrix of questions by methods)?
USAID How-To guidance on evaluations advises that data collection methods should be explained in relation to each evaluation question/issue the evaluation team addressed. This information may be found within the body of the report or may be presented in a methods or design annex. While the methods can be associated to questions in a variety of ways, some evaluations use a matrix for this purpose that lists an evaluation question and then describes the data sources, data collection methods, sampling strategies, and data analysis methods. If no data collection methods are provided, or if no questions/issues exist, check the box for “N/A.”
10. Does the report (or methods annex) describe specific data analysis methods the team used? (frequency distributions; cross-tabulations; correlation; reanalysis of secondary data)
USAID requires that an evaluation report identify the data analysis methods used, but does not indicate where this information must be presented. It is common to include the methodology description in the body of the report with a longer and more detailed methods annex. To receive credit, the data analysis methods description must be specific about how, or through what method, data will be analyzed. It is insufficient to say, “qualitative and quantitative analyses will be conducted” and instead must provide detailed information on the kinds of analyses to be conducted (e.g., frequency distributions, cross-tabs, correlations, content analysis, pattern analysis).

SECTORAL SYNTHESIS OF 2013 -2014 EVALUATION FINDINGS: E3 BUREAU 167
Evaluation Report Quality Review Checklist - Rater’s Guide11
11. Are the data analysis methods presented (in the report or methods annex) in a manner that makes it clear how they are associated with the evaluation questions or specific data collection methods?
The evaluation report should make it clear which data analysis methods described were used to analyze data to answer specific evaluation questions/issues. [The question parallels #9 above for data collection methods.] Information on data analysis methods may be available within the body of the report or may be found in a methods or design annex. As indicated under item (9), some report include a matrix that describes data analysis approaches as well as data collection methods in relation to each evaluation question. Note that wherever a discussion of data analysis methods takes place, it is acceptable for this description to relate data analysis methods to data collection methods, instead of directly to evaluation questions. If no data analysis methods are provided (marked “no” for previous question, #9), or if no questions exist, check the box for “N/A.”
Team Composition 12. Did the report (or methods
annex) indicate that the evaluation team leader was external to USAID?
USAID counts an evaluation as being external if the team leader is external, meaning that the team leader is an independent expert from outside of USAID who has no fiduciary relationship with the implementing partner. If the evaluation is a self-evaluation (USAID or its Implementing Partner is evaluating their own project/activity) then this answer must be no. To receive credit, the evaluation must indicate the team leader in either the body of the report (including cover or title page) or in the methods section. A search for the term “team leader” may expedite this process. If the report is not explicit in stating the team leader was external, it may be inferred from a description of the team leader or the organization with which they are associated (e.g., university professor or evaluation firm that is not the project implementer). Independence may also be confirmed via a “no-conflict of interest” statement often included as an annex. If the report identifies that the team was independent, but there is no designated team leader, check “N/A.”
13. Did the report (or methods annex) identify at least one evaluation specialist on the team?
At least one member of the evaluation team must be an evaluation specialist and clearly indicated as such in either the body of the report or in the methods annex. The term “evaluation specialist” must be explicit and not implied.
14. Did the report (or methods annex) identify local evaluation team members?
USAID encourages the participation of country nationals on evaluation teams. The report need not use the word “local” specifically, but can be referred to by designation such as “Brazilian education specialist,” if in Brazil. This person could be any country national, including a foreign service national (FSN). Simply guessing a person’s country of origin based on their name is insufficient. Do not guess.
15. Did the report indicate that team members had signed Conflict of Interest forms or letters (check if the report says this or the COI forms are included in an annex)?
USAID requires that evaluation team members certify their independence by signing statements indicating that they have no conflict of interest or fiduciary involvement with the project or program they will evaluate. USAID guidance includes a sample Conflict of Interest form. It is expected that an evaluation will indicate that such forms, or their equivalent, are on file and available or are provided in an evaluation annex.
Study Limitations

SECTORAL SYNTHESIS OF 2013 -2014 EVALUATION FINDINGS: E3 BUREAU 168
Evaluation Report Quality Review Checklist - Rater’s Guide11
16. Does the report include a description of study limitations (lack of baseline data; selection bias as to sites, interviewees, comparison groups; seasonal unavailability of key informants)?
It is common for evaluators to encounter unexpected interferences with anticipated study designs such as unavailability of key informants or lack of access to activity sites. In other instances, stakeholder preferences may introduce selection biases. In any such instance, evaluators are obligated to include these “study limitations” and a description of the impact they have had on the evaluation. Study limitations may only be included for this item if they directly impact the evaluator’s ability to credibly and effectively answer an evaluation question (i.e., if all data can still be collected, even if inconveniently or at a higher cost, it is not a limitation). Limitations do not need to have their own distinct section provided they are located towards the end of the methodology description and before the introduction of findings.
Report Structure Responsiveness to Evaluation Questions 17. Is the evaluation report
structured to present findings in relation to evaluation questions, as opposed to presenting information in relation to project objectives or in some other format?
The most straightforward way to meet USAID’s requirement that every evaluation question/issue be addressed, is a question-by-question (or issue-by-issue) report structure. Historically, evaluations have not always taken this approach, and instead structured the report around such things as project objectives, or locations. If no evaluation questions/issues exist around which a report could be structured, check “N/A.” If the evaluation questions/issues and the team’s answers to those questions/issues are the dominant structure of the report, check “yes.”
18. Are all of the evaluation questions, including sub-questions, answered primarily in the body of the report (as opposed to in an annex)
The purpose of an evaluation report is to provide the evaluators’ findings and recommendations on each and every evaluation question. Accordingly, USAID expects that the answers to all evaluation questions/issues, including any sub-questions/issues, will be provided primarily in the body of the report. Answering main questions/issues in the body and sub-questions/issues in an annex is not consistent with USAID expectations. If no evaluation questions/issues are provided (either in the body of the report or in an annex) to which a team could respond, check “N/A.”
19. If any questions were not answered, did the report provide a reason why?
If the answer to question 18 is “yes,” mark this answer as “N/A.” If the answer to question 18 is “no,” does the evaluation report provide an explanation as to why specific questions were not answered or were answered somewhere other than in the body of the report?
Findings 20. Did the findings presented
appear to be drawn from social science data collection and analysis methods the team described in study methodology (including secondary data assembled or reanalyzed)?
USAID’s commitment to evidence-based decision-making is necessitating a shift to stronger and more replicable approaches to gathering data and presenting action recommendations to the agency. The more consistent use of credible social science data collection and analysis methods in evaluations is an important step in that direction (e.g., structured and well documented interviews, observation protocols, survey research methods). If the report did not describe the data collection and analysis methods used, check “N/A.”

SECTORAL SYNTHESIS OF 2013 -2014 EVALUATION FINDINGS: E3 BUREAU 169
Evaluation Report Quality Review Checklist - Rater’s Guide11
21. For the findings presented within the evaluation report is there a transparent connection to the source(s) of the data? (60% of the beneficiaries interviews reported that…; reanalysis of school records shows….; responses from mayors indicate that…)
While most evaluation reports present sets of findings, it is not always clear where those findings came from. It is helpful to the reader to connect the sources of data to the findings those data are being used to support. For example, “children’s consumption of protein increased” does not indicate where that finding came from. Alternatively, “60% of mothers who participated in the survey stated that their children’s consumption of protein had increased” does a good job of connecting the finding to the source. This is true for both qualitative and quantitative findings. If the findings in the report were connected to sources of data as indicated above, check “yes.” If findings are generally presented without reference to their source, check “no.”
22. In the presentation of findings, did the team draw on data from the range of methods they used rather than answer using data from or primarily one method?
In addressing this question, only include those methods specifically referenced in the methods section of the report or in the methods annex. Of the methods actually used, the evaluation should demonstrate a balanced use of data from all data collection methods. If no methodologies were introduced from which they could later be drawn on, check “N/A.”
23. Are findings clearly distinguished from conclusions and recommendations in the report, at least by the use of language that signals transitions (“the evaluation found that...” or “the team concluded that…”)?
As defined by the evaluation policy, evaluation findings are “based on facts, evidence, and data…[and] should be specific, concise, and supported by quantitative and qualitative information that is reliable, valid, and generalizable”. The presence of opinions, conclusions, and/or recommendations mixed in with the descriptions of findings reduces a finding’s ability to meet USAID’s definition.
24. Are quantitative findings reported precisely, i.e., as specific numbers or percentages rather than general statements like “some,” “many,” or “most”?
When presenting quantitative findings it is important to be precise so that the reader knows exactly how to interpret the findings and is able to determine the accuracy of the conclusions drawn by the evaluators. Precision implies the use of specific numbers and/or percentages as opposed to general statements like “some,” “many,” or “most.” If no potentially quantitative findings are provided, check “N/A.”
25. Does the report present findings about unplanned/ unanticipated results?
While evaluators may be asked to look for unplanned or unanticipated results in an evaluation question, it is common to come across such results unexpectedly. If such results are found, by request or unexpectedly, they should be included in the report.
26. Does the report discuss alternative possible causes of results/ outcomes it documents?
Though evaluators may be asked to look for alternative causes of documented results or outcomes in an evaluation question, it is possible for evaluators to come across such potential alternative causes unexpectedly. If any such causes are found, it is important that the evaluators bring such information to the attention of USAID.
27. Are evaluation findings disaggregated by sex at all levels (activity, outputs, outcomes) when data are person-focused?
The evaluation policy and USAID in general are making a big push for gathering sex-disaggregated data whenever possible. To support this focus, it is valuable for evaluators to include data collection and analysis methods that enable sex-disaggregation whenever the data they anticipate working with will be person-focused. Such data should be represented at all project levels from activities to outputs to outcomes to the extent possible. If no person-focused data was collected and therefore there was no data that could be disaggregated by sex, check “N/A.”

SECTORAL SYNTHESIS OF 2013 -2014 EVALUATION FINDINGS: E3 BUREAU 170
Evaluation Report Quality Review Checklist - Rater’s Guide11
28. Does the report explain whether access/ participation and/or outcomes/benefits were different for men and women when data are person-focused?
USAID expects that evaluations will identify/discuss/explain how men and women have participated in, and/or benefited from, the programs and projects it evaluates. This involves more than simply collecting data on a sex-disaggregated basis. Addressing this issue can be presented in one general section or on a question-by-question basis; either is acceptable. If data was not collected in a person-focused manner for the evaluation, check “N/A.”
Recommendations 29. Is the report’s presentation of
recommendations limited to recommendations (free from repetition of information already presented or new findings not previously revealed)?
Presentation of recommendations in an evaluation report affects the usability of the report. Recommendations build on information previously introduced through findings and conclusions. Therefore, the presentation of recommendations does not need supporting findings and conclusions repeated or any new supporting findings or conclusions introduced. The presence of any information other than the specific, practical, and action-oriented recommendations could have a diminishing effect on report usability. If no recommendations are present in the report, check “N/A.”
30. Do evaluation recommendations meet USAID policy expectations with respect to being specific (states what exactly is to be done, and possibly how)?
Recommendations that are specific are inherently more actionable than those which are not. The recommendation, “improve management of the project,” is much less specific than one that says “streamline the process for identifying and responding to clinic needs for supplies in order to reduce gaps in service delivery.” If no recommendations are presented in the evaluation report, check “N/A.”
31. Do evaluation recommendations meet USAID policy expectations with respect to being directed to a specific party?
USAID encourages evaluation teams to identify the parties who need to take action on each recommendation. Doing so makes it easier for USAID staff to understand and act on and evaluations implications. If no recommendations are presented in the evaluation report, check “N/A.”
32. Are all the recommendations supported by the findings and conclusions presented (Can a reader can follow a transparent path from findings to conclusions to recommendations)?
Managers are more likely to adopt evaluation recommendations when those evaluations are based on credible empirical evidence and an analysis that transparently demonstrates why a specific recommendation is the soundest course of action. To this end, USAID encourages evaluators to present a clear progression from Findings Conclusions Recommendations in their reports, such that none of a report’s recommendations appear to lack grounding, or appear out of “thin air.” If no recommendations are presented in the evaluation report, check “N/A.”
Annexes 33. Is the evaluation SOW included
as an annex to the evaluation report?
This question checks on evaluation team responsiveness to USAID’s Evaluation Policy, Appendix 1, requirement for including an evaluation SOW as an evaluation report annex.
34. Are sources of information that the evaluators used listed in annexes?
USAID’s Evaluation Policy, Appendix 1, requires sources of information to be included as an evaluation report annex. Sources include both documents reviewed and individuals who have been interviewed. Generally it is not expected that names of survey respondents or focus group participants will be individually provided, as these individuals are generally exempted based on common/shared expectations about maintaining confidentiality with respect to individual respondents.
35. Are data collection instruments provided as evaluation report annexes?
This question focuses on the inclusion of data collection instruments in an evaluation annex including interview guides or survey questionnaires.
36. Is there a matching instrument for each and every data collection method the team reported that they used?
This question examines how comprehensive a set of the instruments used for collecting data for a USAID evaluation a report provides. USAID’s standard in its evaluation policy is “all” tools.

SECTORAL SYNTHESIS OF 2013 -2014 EVALUATION FINDINGS: E3 BUREAU 171
Evaluation Report Quality Review Checklist - Rater’s Guide11
37. Were any “Statements of Differences” included as evaluation annexes (prepared by team members, or the Mission, or Implementing Partner, or other stakeholders)
Including “Statements of Differences” has long been a USAID evaluation report option. This question determines how frequently “Statements of Differences” are actually included in USAID evaluations. Statements are often written by evaluation team members, or alternatively by the Mission, a stakeholder, or implementing partner. If one or more “Statements of Differences” are included, check “yes.”
Evaluation Data Warehousing 38. Does the evaluation report
explain how the evaluation data will be transferred to USAID (survey data, focus group transcripts)?
USAID evaluation policy (p. 10) calls for the transfer of data sets from evaluations to USAID, so that, when appropriate, they can be reused in other assessment and evaluations. Given this requirement, it is helpful if an evaluation report indicates how and when that transfer was made.
SOW Leading Indicator of Evaluation Quality (answer if SOW is a report annex) 39. Does the evaluation SOW
include a copy or the equivalent of Appendix 1 of the evaluation policy?
USAID policy requires that statements of work (SOWs) for evaluations include the language of Appendix 1 of the USAID Evaluation Policy. If no SOW is included as an annex to the evaluation report, check “N/A.”
Additional Questions About Basic Evaluation Characteristics 40. Does the report include a table
of contents? Include a table of contents informs the reader on what the report covers and provides the reader with page numbers to better access information in a given section. Ideally a table of tables and/or a table of figures will also be included facilitate access to data.
41. Does the report include a glossary and/or list of acronyms?
A high-quality evaluation report should include a glossary and/or a list of acronyms used throughout the report since not all readers are familiar with the acronyms, abbreviations, or nuanced language specific to a given subject or country.
42. Is the report well-written (clear sentences, reasonable length paragraphs) and mostly free of typos and other grammatical errors?
High-quality evaluation reports give the appearance of having been edited or peer-reviewed to remove any grammatical, syntax, or punctuation inconsistencies or errors. Attempting to read an evaluation report that contains errors, inconsistencies, or unclear sentences prevents the reader from being able to digest or comprehend the content of the report.
43. Is the report well-organized (each topic is clearly delineated, subheadings used for easy reading)?
A high-quality evaluation report should be well-organized to facilitate ease of reading and ability for the reader to digest the content of the report in a logical manner. The use of section headings, sub-headings, and titles breaks up what may be long and dense sections of reports.
44. Is the date of the report given? The date of the report should be included in the report or on the front cover of the report. This may be the date submitted to or approved by USAID, or the date disseminated to the public.
45. Is the name of the evaluation team leader present in the report or on the report cover?
The names and roles of all team members should be included either in the body of the report or on the front cover. At very least the evaluation team leader must be readily identified by name as they are the person responsible for the final report deliverable
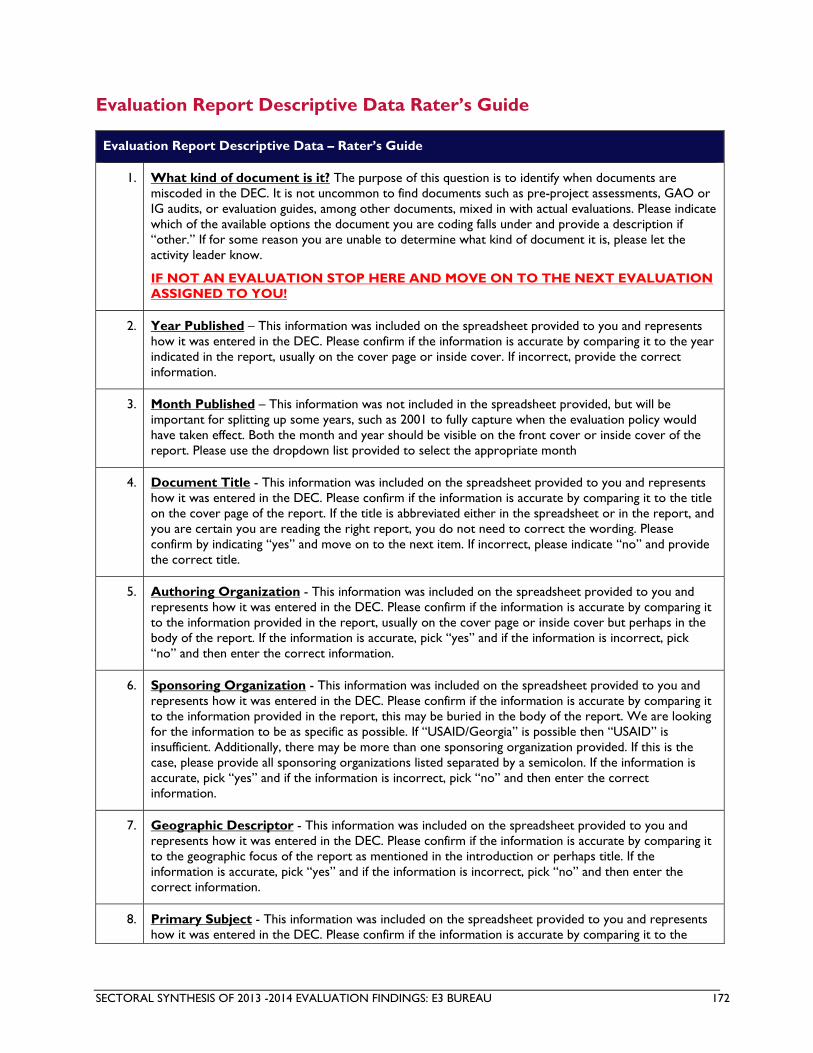
SECTORAL SYNTHESIS OF 2013 -2014 EVALUATION FINDINGS: E3 BUREAU 172
Evaluation Report Descriptive Data Rater’s Guide
Evaluation Report Descriptive Data – Rater’s Guide
1. What kind of document is it? The purpose of this question is to identify when documents are miscoded in the DEC. It is not uncommon to find documents such as pre-project assessments, GAO or IG audits, or evaluation guides, among other documents, mixed in with actual evaluations. Please indicate which of the available options the document you are coding falls under and provide a description if “other.” If for some reason you are unable to determine what kind of document it is, please let the activity leader know.
IF NOT AN EVALUATION STOP HERE AND MOVE ON TO THE NEXT EVALUATION ASSIGNED TO YOU!
2. Year Published – This information was included on the spreadsheet provided to you and represents how it was entered in the DEC. Please confirm if the information is accurate by comparing it to the year indicated in the report, usually on the cover page or inside cover. If incorrect, provide the correct information.
3. Month Published – This information was not included in the spreadsheet provided, but will be important for splitting up some years, such as 2001 to fully capture when the evaluation policy would have taken effect. Both the month and year should be visible on the front cover or inside cover of the report. Please use the dropdown list provided to select the appropriate month
4. Document Title - This information was included on the spreadsheet provided to you and represents how it was entered in the DEC. Please confirm if the information is accurate by comparing it to the title on the cover page of the report. If the title is abbreviated either in the spreadsheet or in the report, and you are certain you are reading the right report, you do not need to correct the wording. Please confirm by indicating “yes” and move on to the next item. If incorrect, please indicate “no” and provide the correct title.
5. Authoring Organization - This information was included on the spreadsheet provided to you and represents how it was entered in the DEC. Please confirm if the information is accurate by comparing it to the information provided in the report, usually on the cover page or inside cover but perhaps in the body of the report. If the information is accurate, pick “yes” and if the information is incorrect, pick “no” and then enter the correct information.
6. Sponsoring Organization - This information was included on the spreadsheet provided to you and represents how it was entered in the DEC. Please confirm if the information is accurate by comparing it to the information provided in the report, this may be buried in the body of the report. We are looking for the information to be as specific as possible. If “USAID/Georgia” is possible then “USAID” is insufficient. Additionally, there may be more than one sponsoring organization provided. If this is the case, please provide all sponsoring organizations listed separated by a semicolon. If the information is accurate, pick “yes” and if the information is incorrect, pick “no” and then enter the correct information.
7. Geographic Descriptor - This information was included on the spreadsheet provided to you and represents how it was entered in the DEC. Please confirm if the information is accurate by comparing it to the geographic focus of the report as mentioned in the introduction or perhaps title. If the information is accurate, pick “yes” and if the information is incorrect, pick “no” and then enter the correct information.
8. Primary Subject - This information was included on the spreadsheet provided to you and represents how it was entered in the DEC. Please confirm if the information is accurate by comparing it to the

SECTORAL SYNTHESIS OF 2013 -2014 EVALUATION FINDINGS: E3 BUREAU 173
Evaluation Report Descriptive Data – Rater’s Guide
general subject matter of the project being evaluated. If the information is accurate, pick “yes” and if the information is incorrect, pick “no” and then enter the correct information.
9. Report Length – This item has two parts
a) Executive Summary: Please provide the exact number of pages of the executive summary. If there is only one line on a fifth page it counts as five pages
b) Evaluation Report: This refers to the entire evaluation report including the executive summary, but excluding the annexes or cover pages. Begin your count when the narrative text begins. Please provide the exact number of pages of the evaluation report. If there is only one line on a twenty-fifth page it counts as twenty-five pages.
10. Evaluation Type - Evaluation type can include an impact evaluation, performance evaluation, or a hybrid of the two. Please refer to the Evaluation Policy (box 1 page 2) for specific definitions of impact and performance evaluations. A hybrid evaluation must include both performance and impact questions and must include a design with two parts, one that establishes at the counterfactual and one that does not. Please choose the appropriate evaluation type from the dropdown menu. If you are unable to determine, pick that option.
11. Timing – This item is identifying when the evaluation is taking place in relation to the project/program being evaluated. The options include during implementation (at a specific point during the project/program, e.g., in year 2 of 4), approaching the end of a project/program (e.g., in the final year of a long intervention or in the last months of a shorter evaluation), continuous (e.g., for an impact evaluation where the intervention is evaluated throughout its life cycle), or ex-post (any time from immediately after to several years after project close-out). Please choose the appropriate evaluation timing from the dropdown menu. If you are unable to determine, pick that option.
12. Scope – This item refers to what exactly was being evaluated. Evaluations can look at individual projects or can look at multiple projects at a time and they can focus on an individual country or a group of countries. It is important for our purposes to be able to distinguish evaluations based on their scope. Some of the scopes provided are fairly straightforward while others are a bit more nuanced and are given more detail below.
An evaluation of a single project or activity corresponds to one implementing mechanism (contract, grant, cooperative agreement), regardless of the number of subcontractors or tasks/activities within that implementing mechanism.
When evaluating multiple projects within a given country there are three options:
A program-level evaluation would explicitly examine every element within one of the country mission’s Development Objectives (DOs). DOs focus on large technical issues such as economic growth or food security and would encompass all elements that contribute to achieving the DO.
A sector-wide evaluation would look at all, or a sample of, the projects within a given technical sector such as agriculture or education. This may crosscut or be a subset of a DO.
The category “other multi-project single-country” might focus on all, or a sample of, the projects within a geographic region of a country or a group of activities, for example, focused on youth employment.
When evaluating projects or programs across multiple countries, there are four options:
An example of a single-project multi-country evaluation might focus on an approach to dealing with sexual violence in schools in Malawi and Ghana

SECTORAL SYNTHESIS OF 2013 -2014 EVALUATION FINDINGS: E3 BUREAU 174
Evaluation Report Descriptive Data – Rater’s Guide
An example of a multi-project multi-country evaluation might focus on a sample of Mission-funded trade projects around the world
A regional program or project evaluation is one that is funded by a regional office or bureau and is focused on a specific geographic region or group of countries. For example, climate change along the Mekong River.
A global project is funded through USAID/Washington. For example, a project that can help any mission do a gender assessment.
Please choose the appropriate evaluation scope from the dropdown menu. If you are unable to determine, pick that option.
If sufficient information is provided, but you are not confident in identifying the scope, please contact the team leader and activity manager for assistance.
13. Evaluation Purpose (management) – The management purpose of the evaluation must be explicit in regards to the decisions and actions the evaluation is intended to inform and should come from the body of the evaluation if possible before taking from the executive summary, but should not be taken from the SOW. An evaluation can have more than one management purpose. Response options based on the most common management purposes from previous studies are shown on the demographic sheet. Please indicate all options that apply by choosing “yes” or “no” for each option using the dropdown list provided. If you found a management purpose other than one of the options provided, please pick yes for the “other” option and paste the language into the space provided. If you were not able to identify a management purpose from any of the options provided, pick yes on the final option “unable to determine.”
Be sure you put either yes or no for every option in this set
14. What was the evaluation asked to address – Answer options for this question include: questions, issues, and other. For this item, identify what the evaluation team stated that they were asked to address in the evaluation. Please look in the body of the report for this item, and if no information is available there then look in the evaluation SOW. The two most likely responses will be questions or issues. USAID policy and supporting documents are requiring the use of questions, but it is not uncommon to find issues instead. If an evaluation team claims to be asked to address something other than questions or issues, please check “other” and include the language used in the report. If there is no language in the report, or in the SOW, on what the evaluation team was asked to address, please choose that option. If issues or anything other than questions are indicated please skip forward to Q16.
15. Number of Evaluation Questions – Complete this section only if you answered “questions” on 14, above. This section includes four elements.
SECTORAL SYNTHESIS OF 2013 -2014 EVALUATION FINDINGS: E3 BUREAU 175
Evaluation Report Descriptive Data – Rater’s Guide
a. Are the questions numbered? This is a yes/no question about whether questions (not issues) found in the body of the report, or in the SOW if there were none in the body of the report, had been assigned numbers. If there are questions in both the body of the report and the SOW, the questions in the body of the report take precedence in terms of answering all elements of this set of questions.
b. To how many questions were full numbers assigned and what is the total of those numbers? In the simplest instance, questions would be numbered 1-5. If there are sub-questions, (e.g., 5a, 5b) then the highest number of questions would still be 5. In other instances, questions might be in groups (e.g., A, 1-5, and then B, 1-6). In this type of case the number of numbered questions would be 11. If you answered “no” on 17 (a) above, enter 0 (zero) for 17 (b)
c. How many questions marks were included among the questions? This is a simple count of how many question marks were used in presenting the questions in the body of the report, or in the SOW if no questions were found in the body of the report. Don’t worry about hidden or compound questions, just count question marks. If there are questions with no question marks, they cannot be counted, only questions with question marks.
d. How many total questions, including compound (hidden) questions? For this item, we are looking for a count of all questions beyond those distinguished by a question mark. Compound, or hidden questions, are questions with an “and” in them or perhaps a list of items an evaluator is being asked to look at within a specific question. An example of this might be, “what was the yield and impact for each crop variety?”
16. Evaluation Design/Approach to Causality/Attribution Included – If the evaluation team is responsible for answering one or more questions or issues that ask about causality or attribution pick “yes” and move to the next item (#17). If there is no question or issue asking about causality or attribution, pick “no” and move on to item 18.
17. Evaluation Design Types – For questions or issues of causality and attribution, there are three categories of evaluation designs to choose from. In order to fall into one of these categories the evaluation design must be specifically discussed in the body of the evaluation report and not exclusively in an annex. If not discussed, or if discussed exclusively in an annex exclusively, please pick yes for the final option “design not presented.” If a design was discussed, please indicate which of the following three design categories it falls into and provide the page number where it can be found in the report.
Experimental design – this type of design will only be used for impact evaluations and might be referenced using one of the following keywords: experimental design, control group, randomized assignment, or randomized controlled trial.
Quasi-experimental design – this type of design will only be used for impact evaluations and might be referenced using one of the following keywords: quasi-experimental, comparison group, propensity score matching, interrupted time series, or regression discontinuity.
Non-experimental design – a design in this category uses an approach examining causality/attribution that does not include an experiment. Terminology associated with one of these designs might include language identifying and eliminating alternative possible causes (modus operandi), outcome mapping, action research, contribution analysis, or case study.
18. Data Collection Methods (team said it planned to use) – For this item, we are looking for every data collection method that the evaluation team stated that they planned to use (either in the body of the report or in a methodology annex). In the instance that the data collection team introduces a data
SECTORAL SYNTHESIS OF 2013 -2014 EVALUATION FINDINGS: E3 BUREAU 176
Evaluation Report Descriptive Data – Rater’s Guide
collection method, but misstates what the method actually is, and there is enough information provided for you as a coder to appropriately re-categorize it, please do so (e.g., if an evaluation claims to be doing quantitative interviews, but the description and a look at the data collection instrument indicate that it is actually a survey, mark it as a survey). An evaluation can use more than one data collection method. A list of data collection methods based on the most common methods used in previous studies are shown on the demographic sheet. Please indicate all options that apply by choosing “yes” or “no” for each option using the dropdown list provided. If you found a data collection method other than one of the options provided, please pick yes for the “other” option and paste the language into the space provided. If a data collection method is insufficiently detailed enough to fit into an option provided (i.e., “interviews” and not “key-informant interviews” or “other interviews”) then check “other” and in the area provided indicate “interviews – not specified.” If you were not able to identify a data collection method from any of the options provided, pick yes on the final option “unable to determine.”
Be sure you put either yes or no for every option in this set
19. Data Collection Methods (data actually used) - For this item, we are looking for the presentation of data that shows which data collection methods were actually used. For example, “20% of the survey respondents said” indicates that the survey method was actually used. The demographic sheet shows the same list of data collection methods as you saw in item 19. For every method you mark that they planned to use, look to see if there was data linked to words about the method that would indicate it was actually used. Additionally, for any data linked to methods that were used but which you did not code as methods they stated they planned to use, mark “yes” for that data collection method. In the instance that the data collection team introduces a data collection method, but misstates what the method actually is, and there is enough information provided for you as a coder to appropriately re-categorize it, please do so (e.g., if an evaluation claims to be doing quantitative interviews, but the description and a look at the data collection instrument indicate that it is actually a survey, mark it as a survey).
Please indicate all options that apply by choosing “yes” or “no” for each option using the dropdown list provided. If you found a data collection method other than one of the options provided, please pick yes for the “other” option and paste the language into the space provided. If you were not able to identify a data collection method from any of the options provided, pick yes on the final option “unable to determine.”
Be sure you put either yes or no for every option in this set
20. Data Analysis Methods (team said it planned to use) – For this item, we are looking for every data analysis method that the evaluation team stated that they planned to use (either in the body of the report or in a methodology annex). An evaluation can use more than one data analysis method. A list of data analysis methods based on the most common methods used in previous studies are shown on the demographic sheet. An additional option for noting where the team described how it planned to synthesize data from multiple methods (mixed methods) is also shown on the demographic sheet. Please indicate all options that apply by choosing “yes” or “no” for each option using the dropdown list provided. If you found a data analysis method other than one of the options provided, please pick yes for the “other” option and paste the language into the space provided. If you were not able to identify a data analysis method from any of the options provided, pick yes on the final option “unable to determine.”
Be sure you put either yes or no for every option in this set
21. Data Analysis Methods (data actually used) - For this item, we are looking for the presentation of data that shows which data analysis methods were actually used. Examples of the kinds of language you might find if they used particular methods can be found in the table below. The demographic sheet

SECTORAL SYNTHESIS OF 2013 -2014 EVALUATION FINDINGS: E3 BUREAU 177
Evaluation Report Descriptive Data – Rater’s Guide
shows the same list of data analysis methods as you saw in item 21. For every method you mark that they planned to use, look to see if there was analysis language, tables, or graphs that would indicate it was actually used. Additionally, for any analyses that were used but which you did not code as analyses they stated they planned to use, mark “yes” for that data analysis method.
Please indicate all options that apply by choosing “yes” or “no” for each option using the dropdown list provided. If you found a data analysis method other than one of the options provided, please pick yes for the “other” option and paste the language into the space provided. If you were not able to identify a data analysis method from any of the options provided, pick yes on the final option “unable to determine.”
Be sure you put either yes or no for every option in this set
Q.20 They Said They Plan to Do Q.21 They Show They Did Descriptive Statistics Frequency Question 28: 23 said yes; 7 said no Percentage 77% of respondents said “yes” Ratio The ratio of books to students is 1:6 Cross-tabulation Loan Status Men Women Total
Took a loan 16 8 24 Didn’t take a loan 8 16 24 Total 24 24 48
Inferential Statistics Correlation (tells how closely related two variables are)
Correlation coefficient; statistically significance
Regression Regression coefficient; statistical significance t-test (compares averages for groups with continuous variables, like money)
Difference between means; t value; statistical significance
Chi-square (compares answers for groups with discontinuous variables (high, medium, low)
Difference between groups; statistical significance
Content Analysis Code key words, phrases, concepts mentioned in open-ended questions, group interviews or focus groups; identity dominant patterns, or quantify the results of pattern coding
Discussion of dominant content or patterns of responses to open-ended (qualitative, or transformed into quantitative form)
22. Participatory Mentioned? For this item, if there was any mention of a participatory method or approach then it counts even if there is no further discussion of who participated or in which phase they participated.
If yes, indicate who participated (beyond contributing data) and at what stage of the

SECTORAL SYNTHESIS OF 2013 -2014 EVALUATION FINDINGS: E3 BUREAU 178
Evaluation Report Descriptive Data – Rater’s Guide
evaluation in questions 23 and 24 below. If not, please skip questions 23 and 24.
23. Participatory (when) – There are various stages at which people outside of the evaluation team may become involved in the evaluation. We are looking to identify participation at any of the stages that an evaluation report indicates that it occurred. Note that if a person is on the evaluation team, even if a country national, USAID staff, or implementing partner staff, they cannot be considered as participating in the evaluation for this item.
Please indicate all options that apply by choosing “yes” or “no” for each option using the dropdown list provided. If you found a stage or type of participation other than one of the options provided, please pick yes for the “other” option and paste the language into the space provided. If you were able to determine that participation took place but not at what particular stage of the process, pick yes on the final option “unable to determine.”
24. Participatory (who) – There are various groups of people outside of the evaluation team who may become involved in the evaluation. Such groups could include, but are not limited to, USAID representatives (other than the evaluation activity manager), project/program implementing partners including the government, other donors, or beneficiaries. Note that if a person is on the evaluation team, even if a country national, USAID staff, or implementing partner staff, they cannot be considered as participating in the evaluation for this item. Please indicate all options that apply by choosing “yes” or “no” for each option using the dropdown list provided. If you identified stakeholders who participated in the evaluation process other than one of the options provided, please pick yes for the “other” option, and paste the language into the space provided. If you were able to determine that participation took place but not who participated, pick yes on the final option “unable to determine.”
25. Recommendations – Please provide the number of recommendations provided in a recommendations section, or a summary of recommendations in the body of the report, and not in an executive summary. Count the number of identifiable recommendations, whether they are shown as numbers, letters, or bullets. Do not look inside the bullets or numbered recommendations to separate out where they are compound in nature.
If recommendations are not broken into sections (i.e. long paragraphs), please see Activity Manager for instructions on numbering recommendations.

SECTORAL SYNTHESIS OF 2013 -2014 EVALUATION FINDINGS: E3 BUREAU 179
ANNEX F: GENDER INTEGRATION ANALYSIS QUESTIONNAIRE
This tool is designed to extract additional information from the evaluation reports in order to inform an in-depth analysis of how the issues of gender equality and female empowerment are being addressed in evaluation. As defined by the 2012 USAID Gender Equality and Female Empowerment Policy:
Gender equality concerns women and men, and it involves working with men and boys, women and girls to bring about changes in attitudes, behaviors, roles and responsibilities at home, in the workplace, and in the community. Genuine equality means more than parity in numbers or laws on the books; it means expanding freedoms and improving overall quality of life so that equality is achieved without sacrificing gains for males or females.
Female empowerment is achieved when women and girls acquire the power to act freely, exercise their rights, and fulfill their potential as full and equal members of society. While empowerment often comes from within, and individuals empower themselves, cultures, societies, and institutions create conditions that facilitate or undermine the possibilities for empowerment.
Project outputs and outcomes
1. Did the evaluation report describe or analyze the gender equality and/or female empowerment aspects of any project outputs and/or outcomes? (Y/N)
1.1. If yes, provide the text from the evaluation report that describes or analyzes the outputs and/or outcomes.
1.2. If no, does the evaluation report provide an explanation about why these aspects were not included, such as that no information was available from the project? (Y/N)
1.2.1. Provide the explanatory text from the evaluation report.
Disaggregation of evaluation findings by sex
2. Please provide your response to the meta-evaluation question number 27: Are evaluation findings disaggregated by sex at all levels (activity, outputs, outcomes) when data are person-focused? (Y/N/NA)
2.1. If yes, provide a brief description of the findings that were disaggregated and any relevant references.
2.2. If no, does the evaluation report present any sex-disaggregated data at any levels? (Y/N)
2.2.1. If yes, provide a brief description of the findings that were disaggregated and any references.
Gender differential access or participation in project outcomes or benefits
3. Please provide your response to the meta-evaluation question number 28: Does the report explain whether access/participation and/or outcomes/benefits were different for men and women when data are person-focused? (Y/N/NA)
3.1. If yes, cut and paste the relevant text from the report. If copying the text is not feasible, please provide a summary of the report’s description of how access/participation and/or outcomes/benefits were different for men and women.
Additional Information
4. Does the report present any other gender-related information not already captured in your responses to the previous questions? (Y/N)
4.1. If yes, cut and paste the relevant text from the report. If copying the text is not feasible, please provide a summary of the relevant additional information.
Related Documents