1 Project code: 2012IB17 Final Report: Widening the coverage of PAT Scheme Sectoral Manual-Glass industry Prepared for Shakti Sustainable Energy Foundation

Welcome message from author
This document is posted to help you gain knowledge. Please leave a comment to let me know what you think about it! Share it to your friends and learn new things together.
Transcript
1
Project code: 2012IB17 Final Report:
Widening the coverage of PAT Scheme
Sectoral Manual-Glass industry
Prepared for
Shakti Sustainable Energy Foundation
I
DD iissccllaaiimmeerr
This report is part of Shakti Sustainable Energy Foundation (SSEF) and TERI‘s initiative to
highlight energy consumption trends and energy efficiency improvement opportunities of
the Indian Glass Sector. The views expressed in this document do not necessar ily reflect the
view of Shakti Sustainable Energy Foundation. The company accepts no liability for the
content of this document, or for the consequences of any actions taken on the basis of the
information provided. While every care has been taken in compiling this report, TERI and
Shakti Sustainable Energy Foundation accept no claim for any kind of compensation, if any
entry is wrong, abbreviated , omitted or inserted incorrectly either as to the wording space or
position in the booklet. The report is only an attempt to highlight energy consumption
trends and energy efficiency improvement opportunities of the Indian Glass Sector.
II
Suggested format for citation
T E R I. 2012
Widening the coverage of PAT Scheme
Sectoral Manual-Glass Industry
New Delhi: The Energy and Resources Institute. 40 pp.
[Project Report No. 2012IB17]
For more information
Project Monitoring Cell
T E R I Tel. 2468 2100 or 2468 2111
Darbari Seth Block E-mail [email protected]
IH C Complex, Lodhi Road Fax 2468 2144 or 2468 2145
New Delhi – 110 003 Web www.ter i in .org
India India +91 • Delhi (0)11
III
PPrreeffaaccee
The industrial sector represents more than one third of both global primary energy use and
energy-related carbon d ioxide emissions. In developing countries, the portion of the energy
supply consumed by the industrial sector is frequently in excess of 50% and can create
tension between economic development goals and a constrained energy supply. Further,
countries like India, with an emerging and rapid ly expanding industrial infrastructure, have
a particular opportunity to increase their competitiveness by applying energy -efficient best
practices from the outset in new industrial facilities.
Despite the potential, policymakers frequently overlook the opportunities presented by
industrial energy efficiency to make a significant impact on climate change mitigation,
energy security and sustainability. The common perception is that achieving energy
efficiency of the industrial sector is too complex to be addressed through public policy and,
further, that industrial facilities will achieve energy efficiency through competitive pressures
of the marketplace alone. One such initiative under the National Mission on Enhanced
Energy Efficiency (NMEEE) is the Perform Achieve and Trade (PAT) scheme. This is a
market based mechanism having the objective to enhance energy efficiency (target based) in
the country with an option to trade the additional energy savings, in the form of energy
saving certificates.
In the first phase eight industrial subsectors were covered under the PAT scheme. There are
further plans to widen the coverage by adding more new industrial subsectors depending
upon the energy consumption. Shakti Sustainable Energy Foundation (SSEF) and The
Energy and Resources Institute (TERI) intend to assist the Bureau of Energy Efficiency (BEE)
in expanding the PAT scheme to new sectors for subsequent phases.
As a part of this exercise, the country profile of a few selected subsectors along with its
energy intensity has been tried to establish. It has been done after interactions with
respective industrial associations / industry heads and compiling data from secondary
sources. For this report on the Glass sector, the d iscussions were carried out with The All
India Glass Manufacturers‘ Federation (AIGMF). Secondary data available in public sources
were used for preparing this report.
We believe that this sector manual will act as a guide for next steps and establish a need to
study the energy consumption in detail to set the threshold limit for eligibility for
designated consumers.

V
TTaabb ll ee oo ff CCoonntteennttss
D ISCLAIMER .................................................................................................................................... I
PREFACE ....................................................................................................................................... III
TA BLE O F CONTENTS ................................................................................................................ V
LIST OF TABLES........................................................................................................................... VII
LIST OF FIGURES ........................................................................................................................... IX
ABBREVIATIONS .......................................................................................................................... XI
EXECUTIVE SUMMARY ................................................................................................................... 1
1.0 INTRODUCTION ....................................................................................................................... 3
1.1 Product categorization ..................................................................................................... 3
1.1.1 Container glass ....................................................................................................... 3
1.1.2 Flat glass .................................................................................................................. 4
1.1.3 Speciality glass........................................................................................................ 4
1.1.4 Fibre glass ................................................................................................................ 4
1.2 Production data ................................................................................................................ 4
1.3 Sectoral importance .......................................................................................................... 4
1.4 International scenario ...................................................................................................... 5
1.5 International standing of sub-sector ............................................................................. 6
1.6 Growth in past and future perspective ........................................................................ 6
1.7 Important stakeholders ................................................................................................... 7
1.7.1 The All India Glass Manufacturers Federation, New Delhi ............................ 8
1.7.2 Central Glass and Ceramic Research Institute (CGCRI) .................................. 8
1.7.3 Centre for the Development of Glass Industry,Firozabad(UP) ....................... 8
1.7.4 Department of Ceramic Engineering,IIT, Varanasi ........................................... 8
1.8 Major players .................................................................................................................... 8
1.8.1 Saint Gobain ............................................................................................................. 8
1.8.2 Hindustan National Glass & Industries Ltd (HNG) .......................................... 9
1.8.3 AGI Glaspac ............................................................................................................. 9
1.8.4 Piramal Glass ........................................................................................................... 9
1.8.5 Gujarat Guardian Limited ..................................................................................... 9
1.8.6 AIS / Asahi India .................................................................................................... 9
1.8.7 Gold Plus Glass ..................................................................................................... 10
1.9 Current regulatory / policy scenario ........................................................................... 10
2.0 ENERGY PERFORMANCE ........................................................................................................ 11
2.1 Glass manufacturing process ....................................................................................... 11
2.2 Energy consumption in glass industry ....................................................................... 12
VI
2.2.1 Major energy consuming areas in glass manufacturing ................................. 12
2.2.2 International scenario in energy consumption ................................................ 13
2.2.3 Energy saving opportunities in glass industry ................................................ 15
2.2.4 Melting furnace .................................................................................................... 17
3.2.5 Glass recycling ...................................................................................................... 19
2.2.6 Batch and cullet preheating ................................................................................ 20
3.0 ANALYSIS OF ENERGY CONSUMPTION DATA ..................................................................... 21
3.1 Methodology ................................................................................................................... 21
3.1.1 Gross calorific value of fuels .............................................................................. 21
3.2 Energy consumption in major Indian glass industries ............................................ 21
3.2.1 Energy consumption in Indian Glass Industry ................................................. 25
3.2.2 Energy consumption in Firozabad glass cluster .............................................. 25
3.2.3 Energy consumption by large industries in India ........................................... 25
4.0 CONCLUSIONS ....................................................................................................................... 27
5.0 REFERENCE ............................................................................................................................. 29
ANNEXURE 1.7.1 ........................................................................................................................... 31
ANNEXURE 2.1.1 ........................................................................................................................... 32
VII
LLiisstt ooff ttaabblleess
Table 1.0 : Properties of Glass ........................................................................................................ 3
Table 1.2.1: Production of various types of glass .......................................................................... 4
Table 1.5.1: Country wise exports from India (2006–07) .............................................................. 6
Table 1.5.2: Value of export and import of glass items ................................................................ 6
Table 1.6.1: Sale of float glass in domestic market ....................................................................... 7
Table 1.6.2: Market share of flat glass products in India during 2012–13 ................................ 7
Table 1.8.7: Installed capacity and utilisation of float glass units............................................ 10
Table 2.2.2a: Comparison of float glass mfg process–India vs overseas company ................. 13
Table 2.2.2b: Specific Energy Consumption ................................................................................. 14
Table 2.2.2c: Average SEC of glass industry in USA ................................................................... 14
Table 2.2.4: Common refractory materials .................................................................................. 18
Table 2.2.5: End of life route of container glass in India ........................................................... 19
Table 3.1.1: Gross calorific value of various fuels ...................................................................... 21
Table 3.1.2: Conversion factors ..................................................................................................... 21
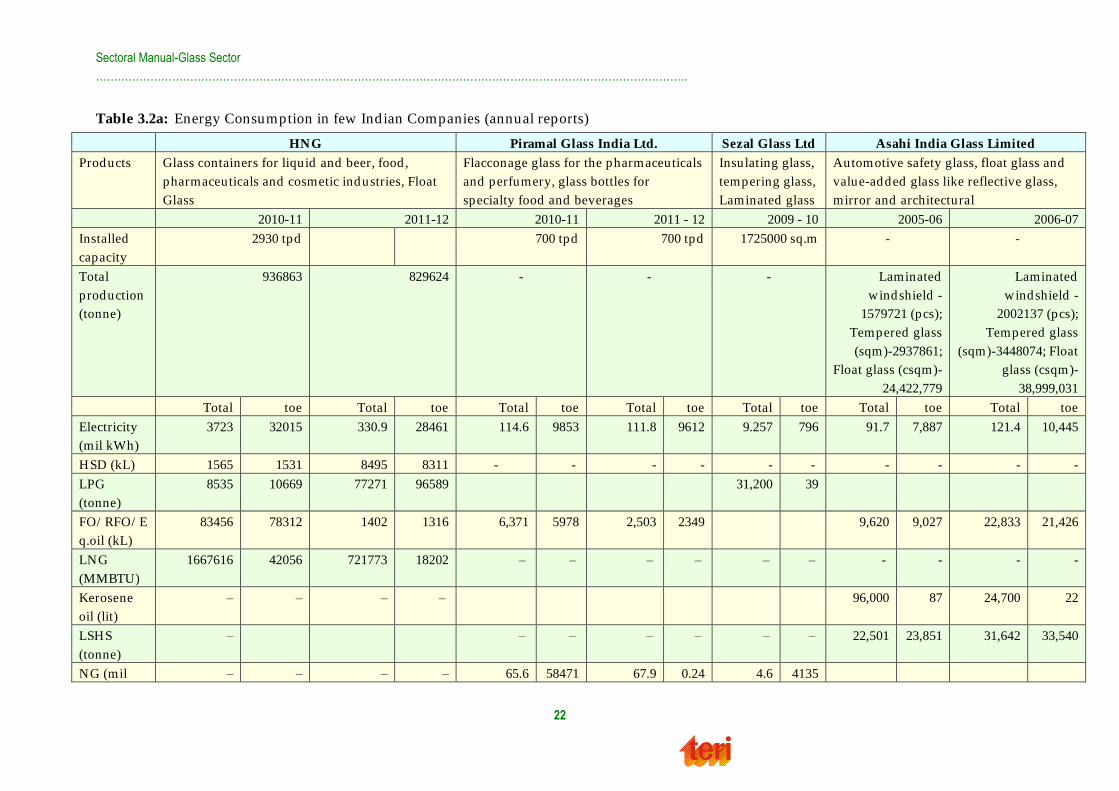
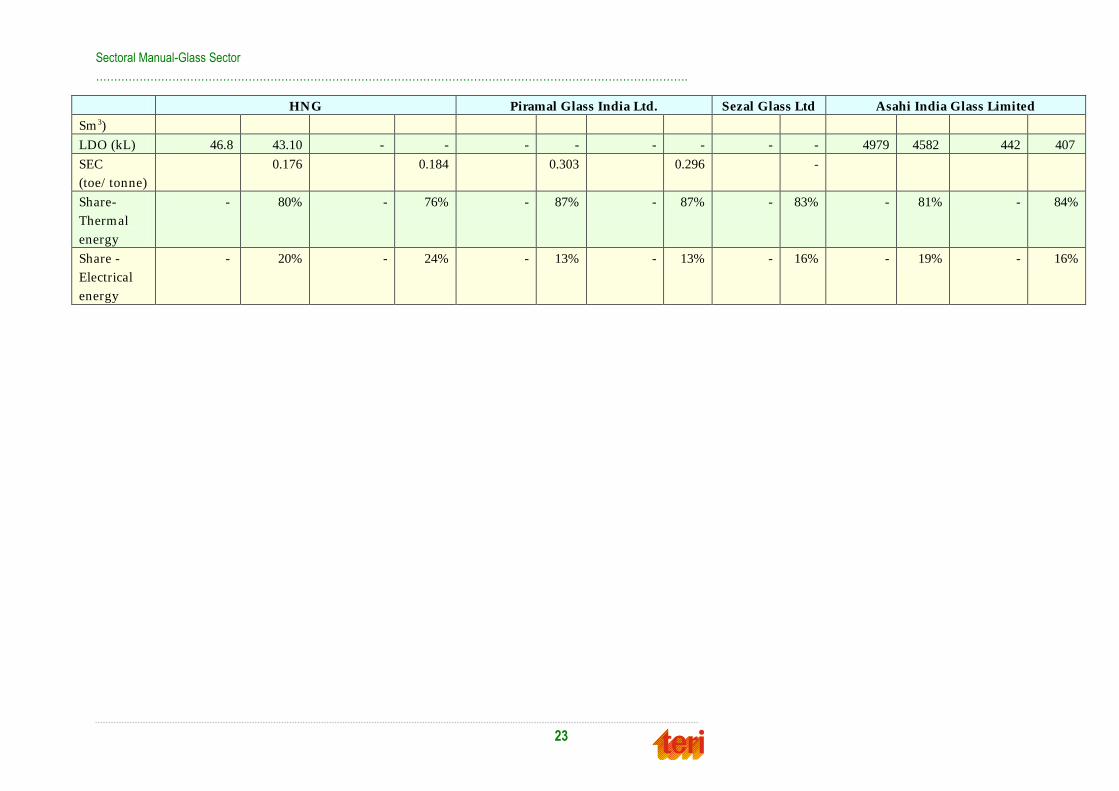
Table 3.2a: Energy Consumption in few Indian Companies (annual reports) ..................... 22
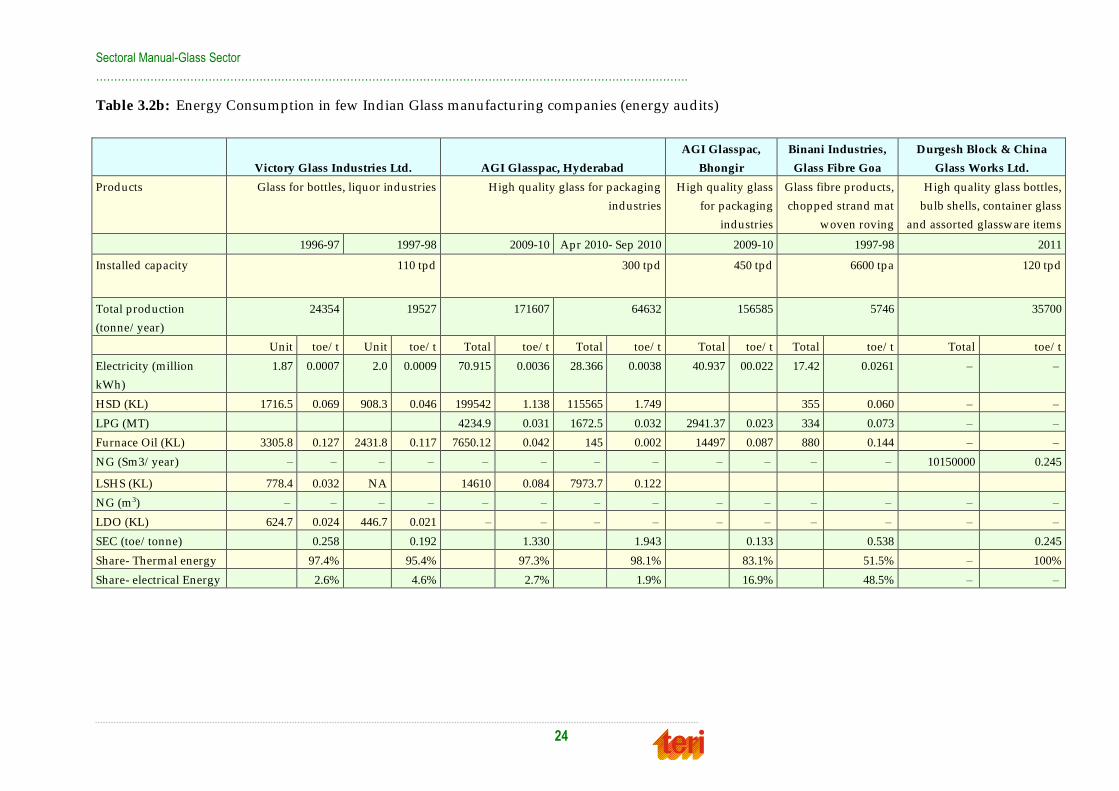
Table 3.2b: Energy Consumption in few Indian Glass manufacturing companies (energy
audits) ......................................................................................................................... 24
Table 3.2.1: Production and energy consumption in Indian glass industry .......................... 25
Table 3.2.3: Energy consumption by few large glass manufacturing companies ................. 26
Table 2.1a: Common glass components ..................................................................................... 32
Table 2.1b: Approximate composition of d ifferent glass types (weight percent) ................ 33
Table 2.1c: Summary of inputs and outputs for glass batch .................................................. 33
Table 2.2a Summary of inputs and outputs for glass melting .............................................. 35
Table 2.3.2: Summary of inputs and outputs for glass forming ............................................. 37
Table 2.4.3 Summary of inputs and outputs for glass post forming ..................................... 38

IX
LLiisstt ooff ff iigguurreess
Figure 1.4: Flat glass production by d ifferent countries in EU ............................................... 5
Figure 1.8.1: Company wise market share of Float Glass ......................................................... 10
Figure 2.1.1: Overview of Glass Manufacture ............................................................................ 11
Figure 2.2.2: SEC range of continuous container glass furnaces.............................................. 14
Figure 2.2.3a: Energy consumption in glass manufacturing industry ...................................... 16
Figure 2.2.3b: Energy balance of glass melting furnace .............................................................. 16
Figure 2.2.4: Seven steps to good melting process ..................................................................... 17
Figure 3.2.2: Estimated energy consumption by few large glass m fg companies ................. 26
Figure 2.2a Melting and refining processes .............................................................................. 34
Figure 2.2b Type of furnace ......................................................................................................... 35
Figure 2.3.1 Blow and Blow Process ........................................................................................... 37
Figure: 2.3.2 Press and Blow Process ........................................................................................... 37
Figure 2.4.1: Flat glass post forming / Annealing in the Lehr ................................................. 38

XI
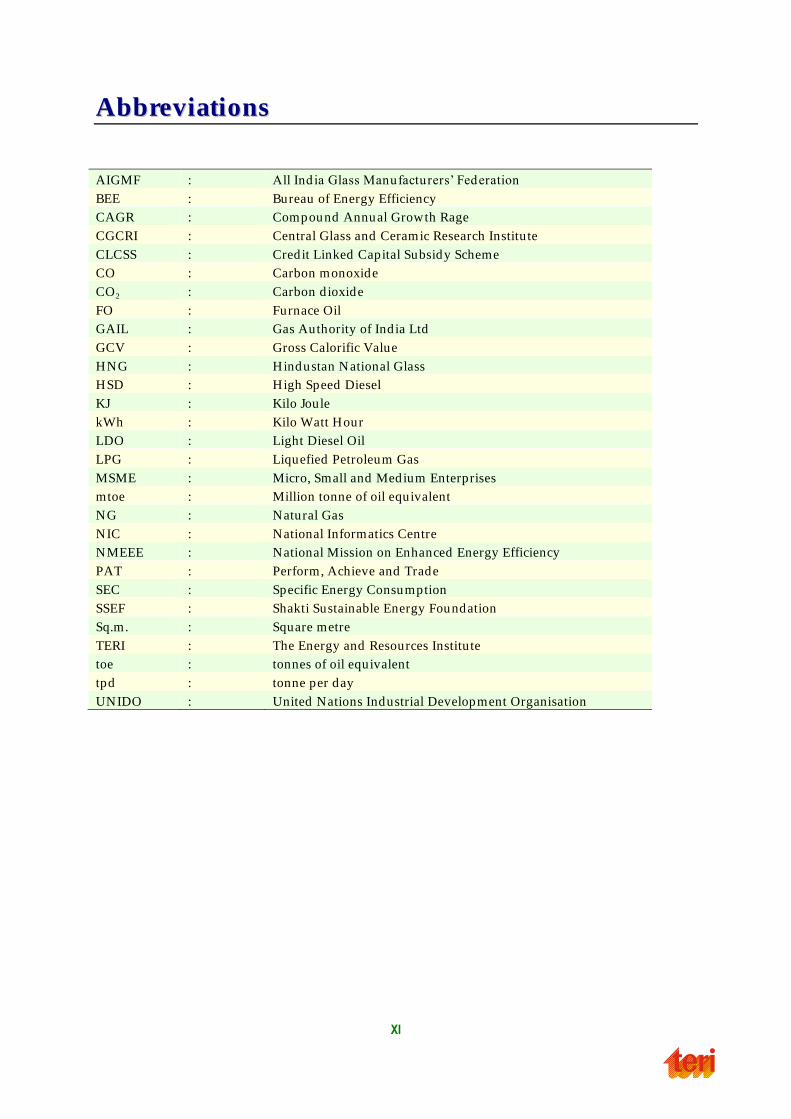
AAbbbbrreevviiaattiioonnss
AIGMF : All Ind ia Glass Manufacturers‘ Federation
BEE : Bureau of Energy Efficiency
CAGR : Compound Annual Growth Rage
CGCRI : Central Glass and Ceramic Research Institute
CLCSS : Cred it Linked Capital Subsidy Scheme
CO : Carbon monoxide
CO2 : Carbon d ioxide
FO : Furnace Oil
GAIL : Gas Authority of Ind ia Ltd
GCV : Gross Calorific Value
HNG : Hindustan National Glass
HSD : High Speed Diesel
KJ : Kilo Joule
kWh : Kilo Watt Hour
LDO : Light Diesel Oil
LPG : Liquefied Petroleum Gas
MSME : Micro, Small and Medium Enterprises
mtoe : Million tonne of oil equivalent
NG : Natural Gas
NIC : National Informatics Centre
NMEEE : National Mission on Enhanced Energy Efficiency
PAT : Perform, Achieve and Trade
SEC : Specific Energy Consumption
SSEF : Shakti Sustainable Energy Foundation
Sq.m. : Square metre
TERI : The Energy and Resources Institute
toe : tonnes of oil equivalent
tpd : tonne per day
UNIDO : United Nations Industrial Development Organisation
1
EExxeeccuuttiivvee ssuummmmaarryy
Glass is one of the most useful materials in our daily life. Today glass is so commonly used
that its presence often goes unnoticed . The Indian glass industry consists of seven segments
namely, sheet and flat glass (NIC1-26101), glass fibre and glass wool (NIC-26102), hollow
glassware (NIC- 26103), laboratory glassware (NIC- 26104), table and kitchen glassware
(NIC- 26105), glass bangles (NIC- 26106) and other glass wares (NIC – 26109). India is
among the top 15 markets for glass packaging globally and is 3rd fastest growing market
after Turkey and Brazil. The global market for Indian glassware is fragmented and spread
across several countries. Most of the glass demand in the country comes from container
glass which accounts for 50% of the country‘s glass consumption by value. Apart from few
big manufacturers, it is estimated that there are more than 1000 manufacturers in MSME
segment. There is no specific glass sector related policy in the country.
The Indian glass sector is growing across all segments. This growth has been driven
primarily by India‘s booming automotive and construction sectors which have been key
drivers of the economy for the past few years. The glass industry is highly energy intensive
and energy consumption is major cost driver. The total energy consumption in Indian glass
industry is about 1.17 million tonnes of oil equivalent. The average energy cost as a
percentage of manufacturing cost is about 40 per cent. Melting and refining are most energy-
intensive portion of the glass making process and accounts for 60–70% of total energy use in
the glass industry. Thermal energy consumption contributes to about 80% of total energy
consumption in the glass industry. The performance of a large number of glass industries
shows that (1) the energy consumptions of the individual units are relatively high, and (2)
there are wide variations in the performance of the units in terms of energy consumption of
the furnaces thereby offering scope for energy efficiency improvements. It would be
beneficial for the Indian glass industry to evolve glass-sector specific schemes that would
enable them to identify technology options, access to finance and adopt technology
modernisation in a methodical manner.
The energy consumption in glass industry shows th at substantial share of energy
consumption is accounted by thermal energy and there exists significant scope for energy
efficiency improvements both in process and utility areas. There are few large players in
glass industry engaged in the production of float and container glass accounting for major
energy consumption in glass sector. The total annual energy consumption of these major
players is estimated to be 0.78 mtoe, which is about 66 % of the total energy consumption of
glass sector. The energy consumption by glass industries is quite significant for d ifferent
group companies and a number of plants involved in the production of float glass and
container glass would qualify to be ‗Designated Consumers‘ (DCs). However, for a number
of such major players (e.g. Saint Gobain, Hindustan National Glass, Asahi Glass and Gold
Plus Glass), details like installed capacity, production and energy consumption of their
individual glass plants are not readily available. Energy consumption of individual plants
would be required to propose threshold limits and consider them as DCs. Therefore, it is
suggested to undertake a glass-sector specific study to estimate energy consumption and set
threshold limit for the glass sector.
1 NIC 26101 - Division 26 represents National Informatics Centre classification for manufacture of other non -metallic mineral products, group 261 and class 2610 represen ts manufacture of glass and glass products and 26101, 26102,26103,26104,26105, 26109 represents sub-class for manufacture of d ifferent types of glass

3
11..00 IInnttrroodduuccttiioonn
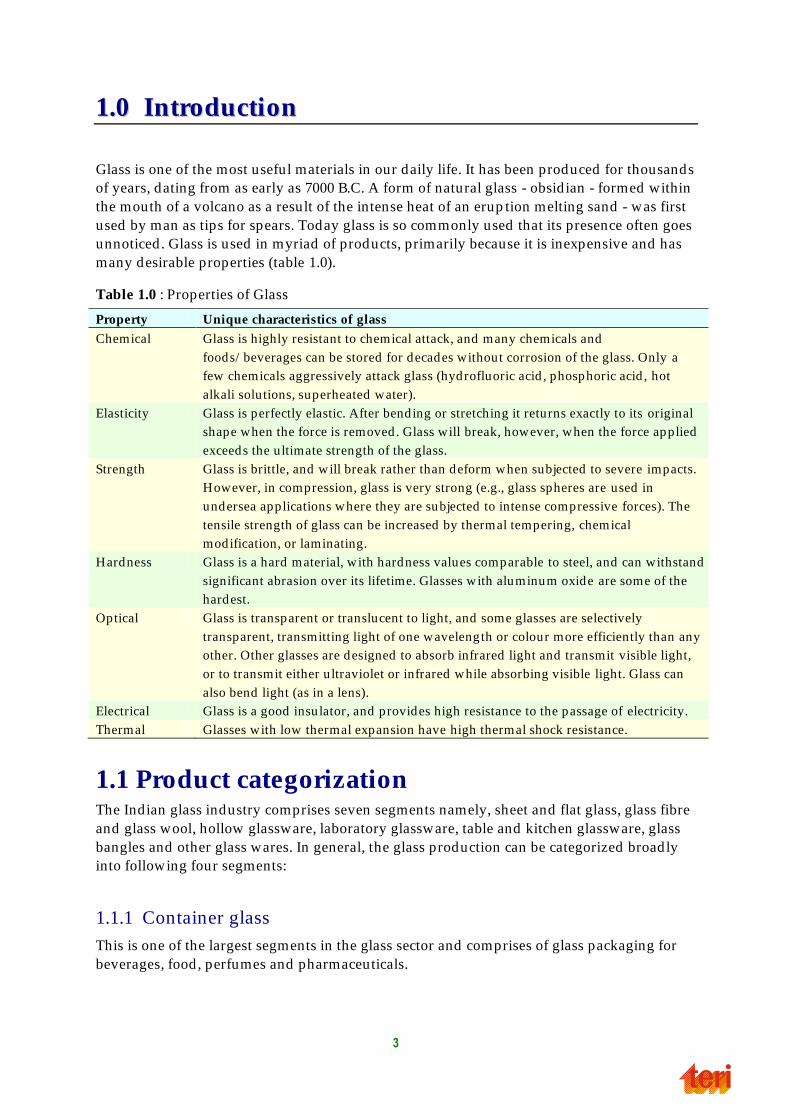
Glass is one of the most useful materials in our daily life. It has been produced for thousands
of years, dating from as early as 7000 B.C. A form of natural glass - obsid ian - formed within
the mouth of a volcano as a result of the intense heat of an erup tion melting sand - was first
used by man as tips for spears. Today glass is so commonly used that its presence often goes
unnoticed . Glass is used in myriad of products, primarily because it is inexpensive and has
many desirable properties (table 1.0).
Table 1.0 : Properties of Glass
Property Unique characteristics of glass
Chemical Glass is highly resistant to chemical attack, and many chemicals and
foods/ beverages can be stored for decades without corrosion of the glass. Only a
few chemicals aggressively attack glass (hydrofluoric acid , phosphoric acid , hot
alkali solutions, superheated water).
Elasticity Glass is perfectly elastic. After bending or stretching it returns exactly to its original
shape when the force is removed . Glass will break, however, when the force applied
exceeds the ultimate strength of the glass.
Strength Glass is brittle, and will break rather than deform when subjected to severe impacts.
However, in compression, glass is very strong (e.g., glass spheres are used in
undersea applications where they are subjected to intense compressive forces). The
tensile strength of glass can be increased by thermal tempering, chemical
modification, or laminating.
Hardness Glass is a hard material, w ith hardness values comparable to steel, and can withstand
significant abrasion over its lifetime. Glasses with aluminum oxide are some of the
hardest.
Optical Glass is transparent or translucent to light, and some glasses are selectively
transparent, transmitting light of one wavelength or colour more efficiently than any
other. Other glasses are designed to absorb infrared light and transmit visible light,
or to transmit either ultraviolet or infrared while absorbing visible light. Glass can
also bend light (as in a lens).
Electrical Glass is a good insu lator, and provides high resistance to the passage of electricity.
Thermal Glasses with low thermal expansion have high thermal shock resistance.
1.1 Product categorization The Indian glass industry comprises seven segments namely, sheet and flat glass, glass fibre
and glass wool, hollow glassware, laboratory glassware, table and kitchen glassware, glass
bangles and other glass wares. In general, the glass production can be categorized broadly
into following four segments:
1.1.1 Container glass
This is one of the largest segments in the glass sector and comprises of glass packaging for
beverages, food, perfumes and pharmaceuticals.
Sectoral Manual-Glass Sector
……………………………………………………………………………………………………………………………………………….
4
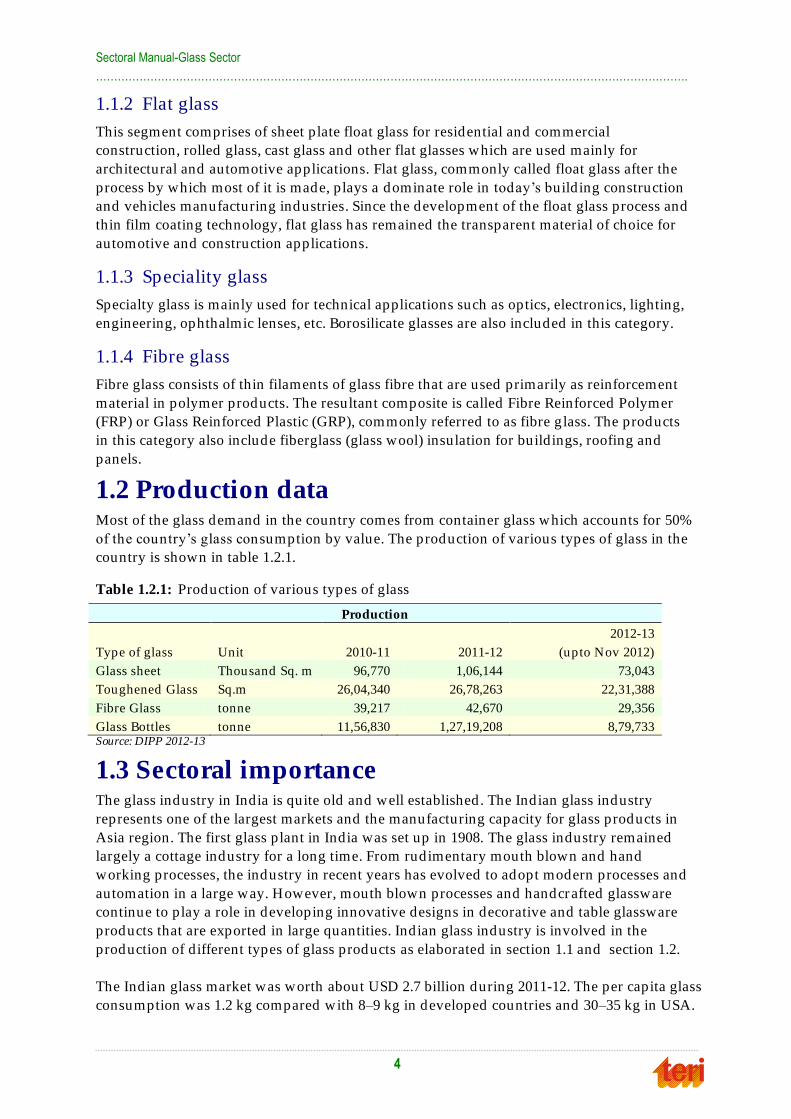
1.1.2 Flat glass
This segment comprises of sheet plate float glass for residential and commercial
construction, rolled glass, cast glass and other flat glasses which are used mainly for
architectural and automotive applications. Flat glass, commonly called float glass after the
process by which most of it is made, plays a dominate role in today‘s building construction
and vehicles manufacturing industries. Since the development of the float glass process and
thin film coating technology, flat glass has remained the transparent material of choice for
automotive and construction applications.
1.1.3 Speciality glass
Specialty glass is mainly used for technical applications such as optics, electronics, lighting,
engineering, ophthalmic lenses, etc. Borosilicate glasses are also included in this category.
1.1.4 Fibre glass
Fibre glass consists of thin filaments of glass fibre that are used primarily as reinforcement
material in polymer products. The resultant composite is called Fibre Reinforced Polymer
(FRP) or Glass Reinforced Plastic (GRP), commonly referred to as fibre g lass. The products
in this category also include fiberglass (glass wool) insulation for buildings, roofing and
panels.
1.2 Production data Most of the glass demand in the country comes from container glass which accounts for 50%
of the country‘s glass consumption by value. The production of various types of glass in the
country is shown in table 1.2.1.
Table 1.2.1: Production of various types of glass
Production
Type of glass Unit 2010-11 2011-12
2012-13
(upto Nov 2012)
Glass sheet Thousand Sq. m 96,770 1,06,144 73,043
Toughened Glass Sq.m 26,04,340 26,78,263 22,31,388
Fibre Glass tonne 39,217 42,670 29,356
Glass Bottles tonne 11,56,830 1,27,19,208 8,79,733 Source: DIPP 2012-13
1.3 Sectoral importance The glass industry in India is quite old and well established . The Indian glass industry
represents one of the largest markets and the manufacturing capacity for glass products in
Asia region. The first glass plant in India was set up in 1908. The glass industry remained
largely a cottage industry for a long time. From rudimentary mouth blown and hand
working processes, the industry in recent years has evolved to adopt modern processes and
automation in a large way. However, mouth blown processes and handcr afted glassware
continue to play a role in developing innovative designs in decorative and table glassware
products that are exported in large quantities. Indian glass industry is involved in the
production of different types of glass products as elaborated in section 1.1 and section 1.2.
The Indian glass market was worth about USD 2.7 billion during 2011-12. The per capita glass
consumption was 1.2 kg compared with 8–9 kg in developed countries and 30–35 kg in USA.
Sectoral Manual-Glass Sector
……………………………………………………………………………………………………………………………………………….
5
During the same period the flat glass market was 4500 tpd (tonnes per day) and was growing
at 16%. The market for container glass was about 7000 tpd which has a share of 55-60% of
overall market share in the country. The market for other glass products such as lighting,
bangle, beads, etc is about 1500 tpd .
1.4 International scenario The major glass producing countries in the world are Germany, USA, UK, China and Japan.
The main glass consuming regions are Europe, China and North America. Together, these
regions/ countries account for more than 74% of global demand for glass. Europe is the
most mature2 glass market followed by Japan and North America. Europe has the highest
proportion of value-added products. One of the main reasons for the growth of glass
industry is that it provides a very attractive packaging alternative. In Europe, the world‘s
largest producer of container glass (bottles, jars, etc.), glass stands for 34% of total packaging
market for beverages and has an annual growth rate of 4.2%.
The global glass industry is quite concentrated with four companies – Nippon Sheet Glass
(NSG)/ Pilkington (base at Japan/ United Kingdom) , Saint-Gobain (base at France), Asahi
(base at Japan) and Guardian (base at USA), producing 67% of the total high quality float
glass in the world . Lower quality float and sheet glass production is gradually being
replaced by high quality float glass across the globe. For automotive glazing, there are three
major players – NSG/ Pilkington, Asahi and Saint-Gobain, who along with their respective
associates meet nearly 75% of the world‘s original equipment glazing requirements.
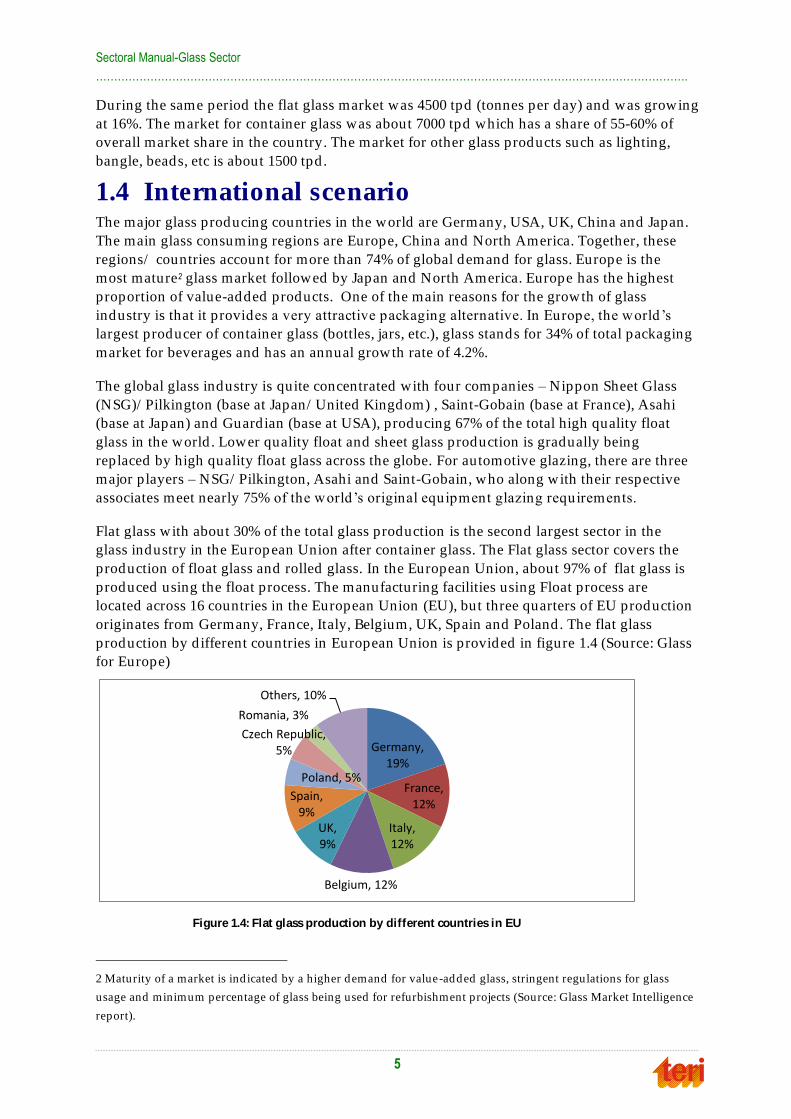
Flat glass with about 30% of the total glass production is the second largest sector in the
glass industry in the European Union after container glass. The Flat glass sector covers the
production of float glass and rolled glass. In the European Union, about 97% of flat glass is
produced using the float process. The manufacturing facilities using Float process are
located across 16 countries in the European Union (EU), but three quarters of EU production
originates from Germany, France, Italy, Belgium, UK, Spain and Poland. The flat glass
production by d ifferent countries in European Union is provided in figure 1.4 (Source: Glass
for Europe)
2 Maturity of a market is ind icated by a higher demand for value-added glass, stringent regulations for glass
usage and minimum percentage of glass being used for refurbishment projects (Source: Glass Market Intelligence
report).
Germany, 19%
France, 12%
Italy, 12%
Belgium, 12%
UK, 9%
Spain, 9%
Poland, 5%
Czech Republic, 5%
Romania, 3%
Others, 10%
Figure 1.4: Flat glass production by different countries in EU
Sectoral Manual-Glass Sector
……………………………………………………………………………………………………………………………………………….
6
China is the largest consumer of glass in the world , accounting for 50 % of global demand in
2009. China is also the largest producer of glass and glass products, producing over 50%of
the global output of flat glass in 2009. It has the greatest number of glass producing
enterprises, and has the largest number of float-glass production lines in the world .
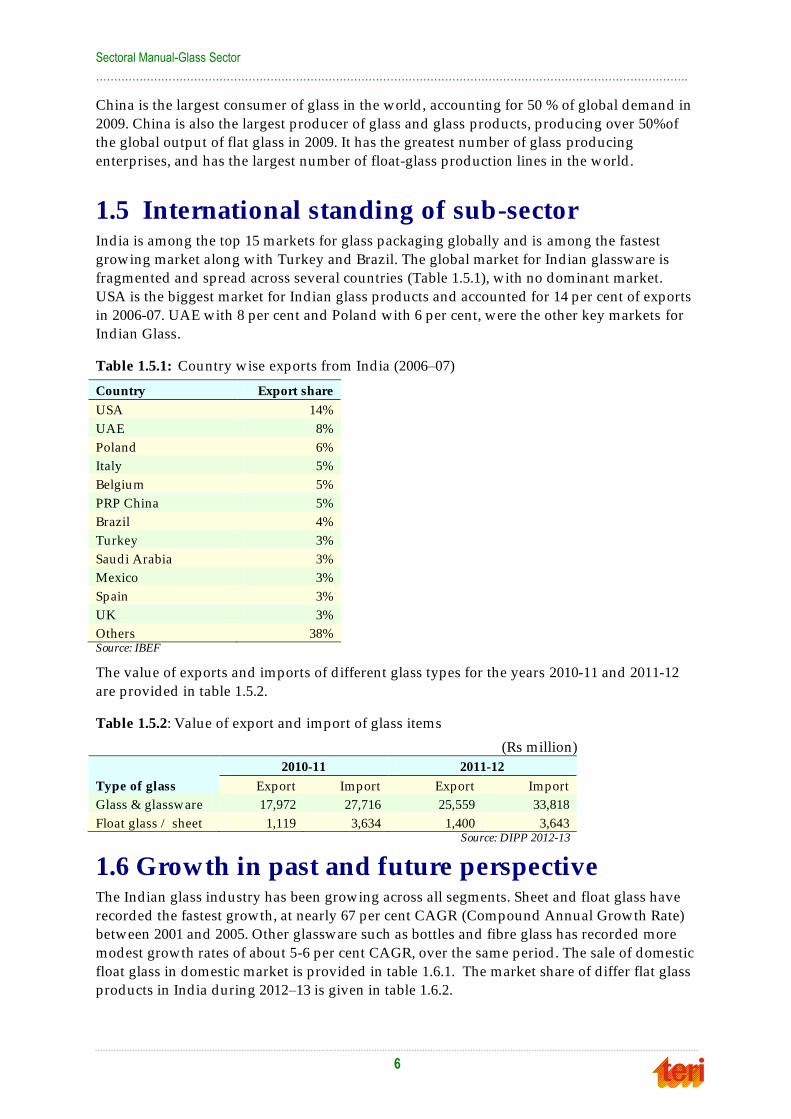
1.5 International standing of sub-sector India is among the top 15 markets for glass packaging globally and is among the fastest
growing market along with Turkey and Brazil. The global market for Indian glassware is
fragmented and spread across several countries (Table 1.5.1), with no dominant market.
USA is the biggest market for Indian glass products and accounted for 14 per cent of exports
in 2006-07. UAE with 8 per cent and Poland with 6 per cent, were the other key markets for
Indian Glass.
Table 1.5.1: Country wise exports from India (2006–07)
Country Export share
USA 14%
UAE 8%
Poland 6%
Italy 5%
Belgium 5%
PRP China 5%
Brazil 4%
Turkey 3%
Saudi Arabia 3%
Mexico 3%
Spain 3%
UK 3%
Others 38% Source: IBEF
The value of exports and imports of d ifferent glass types for the years 2010-11 and 2011-12
are provided in table 1.5.2.
Table 1.5.2: Value of export and import of glass items
(Rs million)
Type of glass
2010-11 2011-12
Export Import Export Import
Glass & glassware 17,972 27,716 25,559 33,818
Float glass / sheet 1,119 3,634 1,400 3,643 Source: DIPP 2012-13
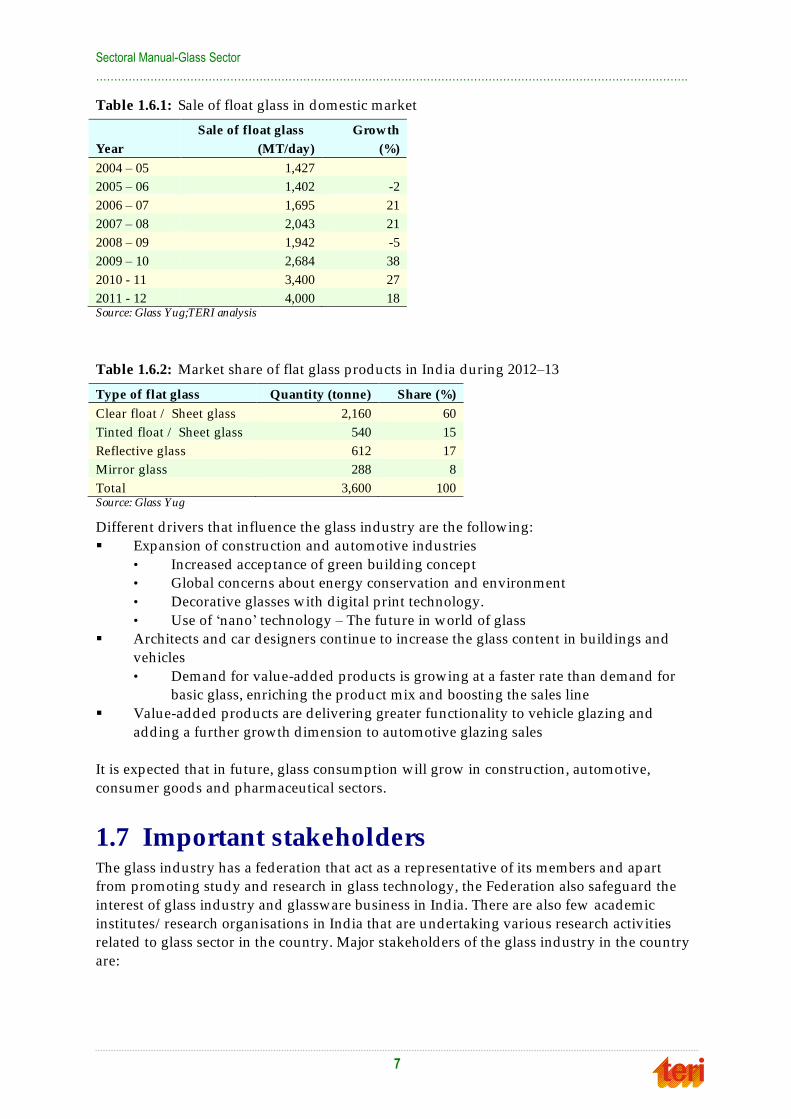
1.6 Growth in past and future perspective The Indian glass industry has been growing across all segments. Sheet and float glass have
recorded the fastest growth, at nearly 67 per cent CAGR (Compound Annual Growth Rate)
between 2001 and 2005. Other glassware such as bottles and fibre glass has recorded more
modest growth rates of about 5-6 per cent CAGR, over the same period . The sale of domestic
float glass in domestic market is provided in table 1.6.1. The market share of d iffer flat glass
products in India during 2012–13 is given in table 1.6.2.
Sectoral Manual-Glass Sector
……………………………………………………………………………………………………………………………………………….
7
Table 1.6.1: Sale of float glass in domestic market
Year
Sale of float glass
(MT/day)
Growth
(%)
2004 – 05 1,427
2005 – 06 1,402 -2
2006 – 07 1,695 21
2007 – 08 2,043 21
2008 – 09 1,942 -5
2009 – 10 2,684 38
2010 - 11 3,400 27
2011 - 12 4,000 18 Source: Glass Yug;TERI analysis
Table 1.6.2: Market share of flat glass products in India during 2012–13
Type of flat glass Quantity (tonne) Share (%)
Clear float / Sheet glass 2,160 60
Tinted float / Sheet glass 540 15
Reflective glass 612 17
Mirror glass 288 8
Total 3,600 100 Source: Glass Yug
Different drivers that influence the glass industry are the following:
Expansion of construction and automotive industries
• Increased acceptance of green building concept
• Global concerns about energy conservation and environment
• Decorative glasses with d igital print technology.
• Use of ‗nano‘ technology – The future in world of glass
Architects and car designers continue to increase the glass content in build ings and
vehicles
• Demand for value-added products is growing at a faster rate than demand for
basic glass, enriching the product mix and boosting the sales line
Value-added products are delivering greater functionality to vehicle glazing and
adding a further growth d imension to automotive glazing sales
It is expected that in future, glass consumption will grow in construction, automotive,
consumer goods and pharmaceutical sectors.
1.7 Important stakeholders The glass industry has a federation that act as a representative of its members and apart
from promoting study and research in glass technology, the Federation also safeguard the
interest of glass industry and glassware business in India. There are also few academic
institutes/ research organisations in India that are undertaking various research activ ities
related to glass sector in the country. Major stakeholders of the glass industry in the country
are:
Sectoral Manual-Glass Sector
……………………………………………………………………………………………………………………………………………….
8
1.7.1 The All India Glass Manufacturers Federation, New Delhi
The federation was founded in the year 1944 and was incorporated under the Companies
Act 1956 as a Limited Company in 1970. The All India Glass Manufacturers association is
made up of five regional associations representing Northern, Southern, Western and Eastern
region of the country. The contact details of the regional associations are provided in
Annexure 1.7.1.
1.7.2 Central Glass and Ceramic Research Institu te (CGCRI)
Central Glass and Ceramic Research Institute (CGCRI) is one of the first four laboratories
decided to be set up under the Council of Scientific & Industrial Research. Development of
various types of optical glasses brought CGCRI into limelight in the international arena.
1.7.3 Centre for the Development of Glass Industry, Firozabad (Uttar Pradesh)
Center for the Development of Glass Industry(CDGI) has been set up at Firozabad in India
in collaboration with UNDP/ UNIDO and Government of UP. CDGI aims to assist the glass
industry for improving its overall performance particularly in the areas of technology
upgradation, energy conservation , introduction of value added glass articles and skill
development.
1.7.4 Department of Ceramic Engineering, Indian Institu te of Technology (Banaras Hindu University), Varanasi
The course of ceramic technology was instituted in the year 1924 to advance the glass and
ceramic technology in India. The Department is pursuing active research in the emerging
areas of glass, glass - ceramics, refractories and other ceramic materials. Apart from these
institutes/ organisations, construction sector, automobile sector and glass packaging
industry like pharmaceuticals, perfumery, food and beverage etc. are also important
stakeholder in this sector.
1.8 Major players Glass industry is a de-licenced industry.Apart from few major manufacturers, there are more
than 1000 medium and small manufacturers. Majority of the glass manufacturing units are
located in Firozabad, Baroda, Ahmedabad, Mumbai, Kolkata, Bengaluru and Hyderabad. In
industry clusters such as Firozabad, Baroda and Kolkata, the glass industry has evolved from
cottage industry to the level of organized industry. A brief highlight of the major players in
the glass industry is provided in the following sub-sections:
1.8.1 Saint Gobain
With the presence in 64 countries, Saint Gobain is a dominant player in the global glass
sector. In India, Saint Gobain has established two companies- Saint Gobain Glass India Ltd .
and Saint Gobain Sekurit India Ltd. to manufacture and market glass. Saint Gobain Glass
India Ltd . manufactures and markets float glass and mirrors. The manufacturing facilities
are located at Sriperumbudur (Tamil nadu), Tada (Andhra Pradesh) and Jhagadia (Gujarat).
The manufacturing facility at Sriperumbudur has two float glass plants with cumulative
Sectoral Manual-Glass Sector
……………………………………………………………………………………………………………………………………………….
9
production capacity of 1500 tonnes per day. Saint Gobain Sekurit India Ltd . produces
laminated windshields and tempered glazing for the Indian automotive market. The
manufacturing facilities are located at Bhosari & Chakan near Pune (Maharashtra ) and
Sriperumbudur.
1.8.2 Hindustan National Glass & Industries Ltd (HNG)
The company founded in 1946 is a key player in India‘s container glass industry. HNG is the
largest container glass producer in India and occupies 55% market share in India. With an
installed capacity of 4395 tonnes per day, the plants of HNG are located at Rishra,
Bahadurgarh, Rishikesh, Neemrana, Nashik and Puducherry. The company has started one
of the largest end-fired container glass furnace of 650 tonnes per day capacity at Nasik in
2012. HNG Float Glass Limited is a HNG group company incorporated in Halol (Gujarat) in
2006. The company has an installed capacity of 600 tonnes per day.
1.8.3 AGI Glaspac
AGI Glaspac was established in the year 1972 and manufactures glass containers to meet the
packaging needs of the food, pharmaceuticals beverage, soft drink, liquor, cosmetic and
other industries. The manufacturing facilities are located in Hyderabad and Bhongir
(Andhra Pradesh) near to the raw-material sources. The Bhongir plant with two furnaces of
500 tonnes per day melting capacity each is largest container glass plant in the country at
single location. With four furnaces in two plants the AGI‘s melting capacity is 1600 tonnes
per day in flint, green and amber colour.
1.8.4 Piramal Glass
Piramal Glass with an installed capacity of 1115 tonnes per day is one of the largest
manufacturers of flacconage glass for the pharmaceuticals and perfumery and is among the
top five manufacturers of perfumery bottles in the world . Piramal glass also manu facture
glass bottles for specialty food and beverages. In India, Piramal glass has two major facilities
at Kosamba and Jambusar (Gujarat). The Kosamba facility with 6 furnaces has combined
capacity of 340 tones per day. The Jambusar facility with a capacity of 355 tonnes per day is
one of the world 's largest installed capacity for pharmaceutical packaging in amber glass.
1.8.5 Gujarat Guardian Limited
Gujarat Guardian Ltd . manufacturer of float glass and other allied products is a member of
Guardian Industries Corporation (U.S.A). The manufacturing facility is located at
Ankleshwar (Gujarat).
1.8.6 AIS / Asahi India
AIS is one of the largest manufacturer and supplier of automotive and float glass in the
country. The manufacturing facilities are located at Bawal (Haryana), Roorkee
(Uttarakhand), Chennai (Tamil Nadu ) and Taloja (Maharashtra).
Sectoral Manual-Glass Sector
……………………………………………………………………………………………………………………………………………….
10
1.8.7 Gold Plus Glass
Gold Plus Glass is the first 100% Indian owned company to manufacturing float glass in
country. The company has one float glass manufacturing unit (capacity 470 tonnes per day)
at Rorkee (Uttrakhand) and two processing units at Sonipat (Haryana) and Kala Amb
(Himachal Pradesh).
The installed capacity and the utilisation factor of the major glass manufacturers in India
during 2009-10 are shown in table 1.8.7.
Table 1.8.7: Installed capacity and utilisation of float glass units
Manufacturers Installed capacity
(tonnes per day)
Capacity
utilisation (%)
Gujarat Guard ian Ltd . 550 95
Asahi Ind ia Glass Ltd
(Two plants: 500+700)
1,200 80
Saint- Gobain Glass Ind ia Ltd
(Two plants: 600+800)
1,950 80
Gold Plus Float Glass Ind ustry Ltd 460 85
HNG Float Glass Ltd 600 75
Total 4760
Source: Glass Yug, Jan-Mar 2010
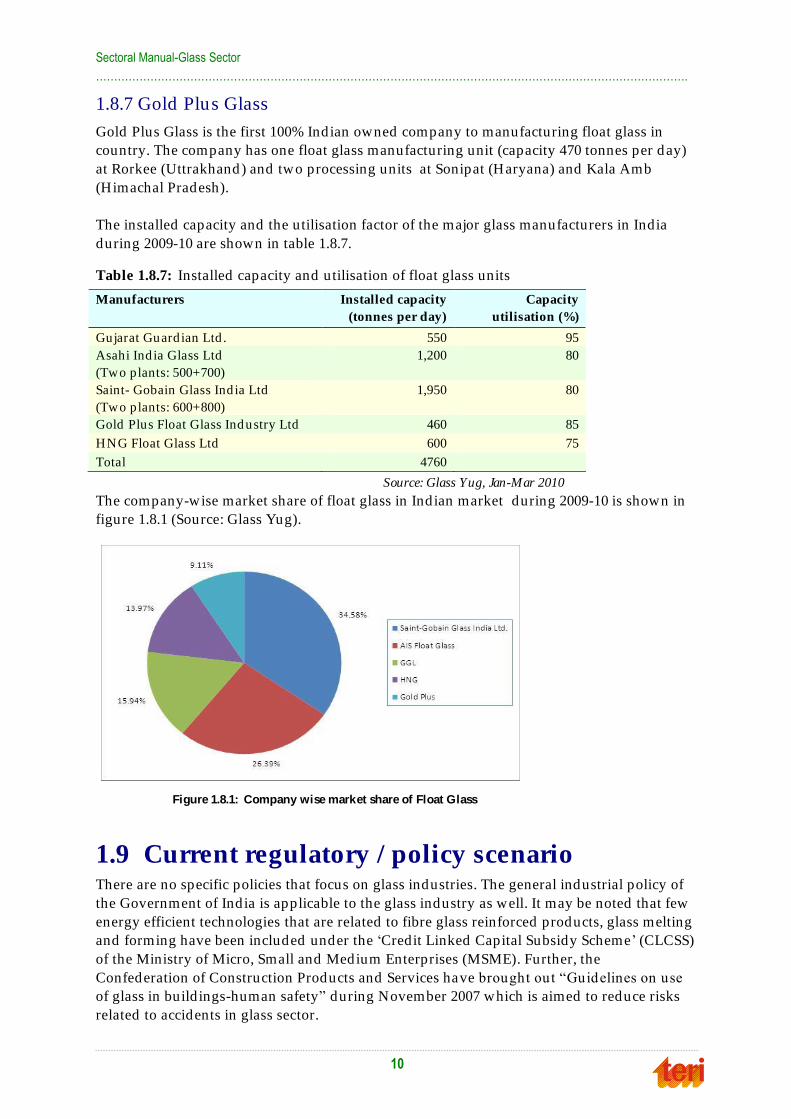
The company-wise market share of float glass in Indian market during 2009-10 is shown in
figure 1.8.1 (Source: Glass Yug).
1.9 Current regulatory / policy scenario There are no specific policies that focus on glass industries. The general industrial policy of
the Government of India is applicable to the glass industry as well. It may be noted that few
energy efficient technologies that are related to fibre glass reinforced products, glass melting
and forming have been included under the ‗Credit Linked Capital Subsidy Scheme‘ (CLCSS)
of the Ministry of Micro, Small and Medium Enterprises (MSME). Further, the
Confederation of Construction Products and Services have brought out ―Guidelines on use
of glass in build ings-human safety‖ during November 2007 which is aimed to reduce risks
related to accidents in glass sector.
Figure 1.8.1: Company wise market share of Float Glass
11
22..00 EEnneerrggyy ppeerrffoorrmmaannccee
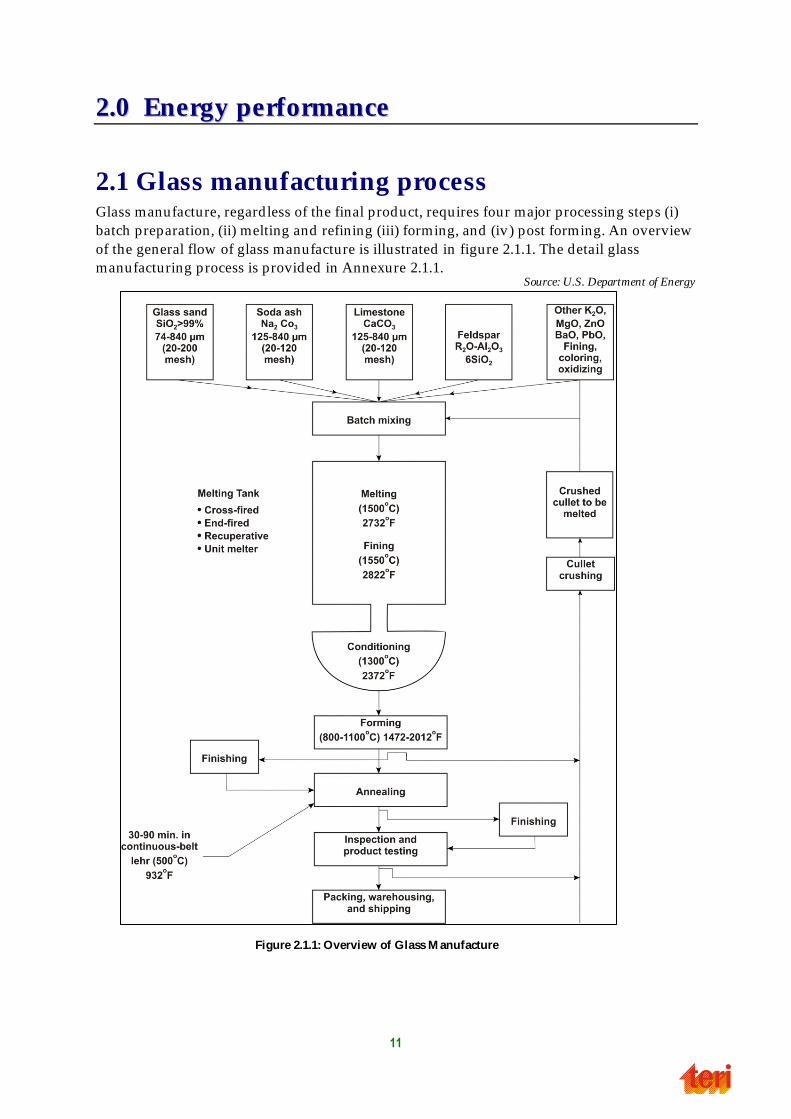
2.1 Glass manufacturing process Glass manufacture, regardless of the final product, requires four major processing steps (i)
batch preparation, (ii) melting and refining (iii) forming, and (iv ) post forming. An overview
of the general flow of glass manufacture is illustrated in figure 2.1.1. The detail glass
manufacturing process is provided in Annexure 2.1.1. Source: U.S. Department of Energy
Figure 2.1.1: Overview of Glass M anufacture
Sectoral Manual-Glass Sector
……………………………………………………………………………………………………………………………………………….
12
2.2 Energy consumption in glass industry The glass industry is highly energy intensive and energy consumption is a major cost driver.
Energy costs include power consumption and running cost of furnaces. The average energy
cost as a percentage of manufacturing cost is about 40 percent.
2.2.1 Major energy consuming areas in glass manufacturing
The most energy intensive portion of the glass-making process, regardless of product type,
is melting and refining. This portion of glass manufacturing accounts for 60–70% of the total
energy use in the glass industry.
i) Batch preparation
Electricity is mainly used in batch preparation for d ifferent equipment‘s like bucket
elevators, pneumatic conveyors, batch mixers or blenders and agglomeration of materials.
The blender or batch mixer accounts for the greatest share of electricity use in both batch
preparation and charging of the furnace.
ii) Melting and refining
Melting and refining of the glass batch is the most energy-intensive part of glass
manufacture as high temperature chemistry is involved in glass formation. Melting of raw
materials consumes about 60-70 percent of the total energy used in glass production. In
general, about 40 percent of the energy consum ed in melting goes toward heating the batch
and for the chemical conversion of the batch constituents.
Theoretically, 645 kWh are required to melt one short ton of glass. In reality, however, most
modern furnaces consume significantly more energy, depending on the percentage of cullet
in the feed . In general, only about 33-40% of the energy consumed by a continuous furnace
goes toward melting the glass. Up to 30% of the energy consumed by a furnace can be lost
through its structure, while another 30% can be lost through flue gas exiting the stack.
Melting furnaces are fired with fossil fuels (mostly natural gas) or by electricity (electrical
resistance heating). In some cases a combination of both is used . Most large continuous
furnaces are fuelled with natural gas. Many of these melters also use electrical boosting,
where the melt is ―boosted‖ by being resistively heated rather than by adding a resistive
heater. Electric boost and other techniques such as oxygen -enriched combustion air, cullet
preheating, better combustion control, or increased insulation, can lower fuel requirements
or increase glass production at the same fuel load .
iii) Glass forming
The energy used in forming is highly product dependent and can account from 12 % (flat
glass) to 34% (for fiber forming) of total primary energy consumed in glass production. In
flat glass production, electricity is used to maintain the molten state of the tin bath and to
drive rollers. In the production of glass containers, final form is obtained using either
compressed air (blow and blow method) or a combination of compressed air and electricity -
driven mechanical pressing (press and blow method). The primary forming processes used
in specialty glass production—press and blow, press-forming, lamp-forming, spinning, and
drawing—are also electricity-driven. In the production of glass wool, both electricity (for
rotary spinners and conveyors) and fuels (for steam blowing or flame attenuation) can be
consumed.
Sectoral Manual-Glass Sector
……………………………………………………………………………………………………………………………………………….
13
iv) Post forming and finishing operations
Annealing process typically consume 2 - 5% of the total final energy in a glass plant.
Tempering can occur in either an electric or natural gas-fired furnace. Automotive flat glass
typically undergoes mechanical bending prior to tempering to attain desired curvatu re.
Autoclaves are mostly powered with electricity .
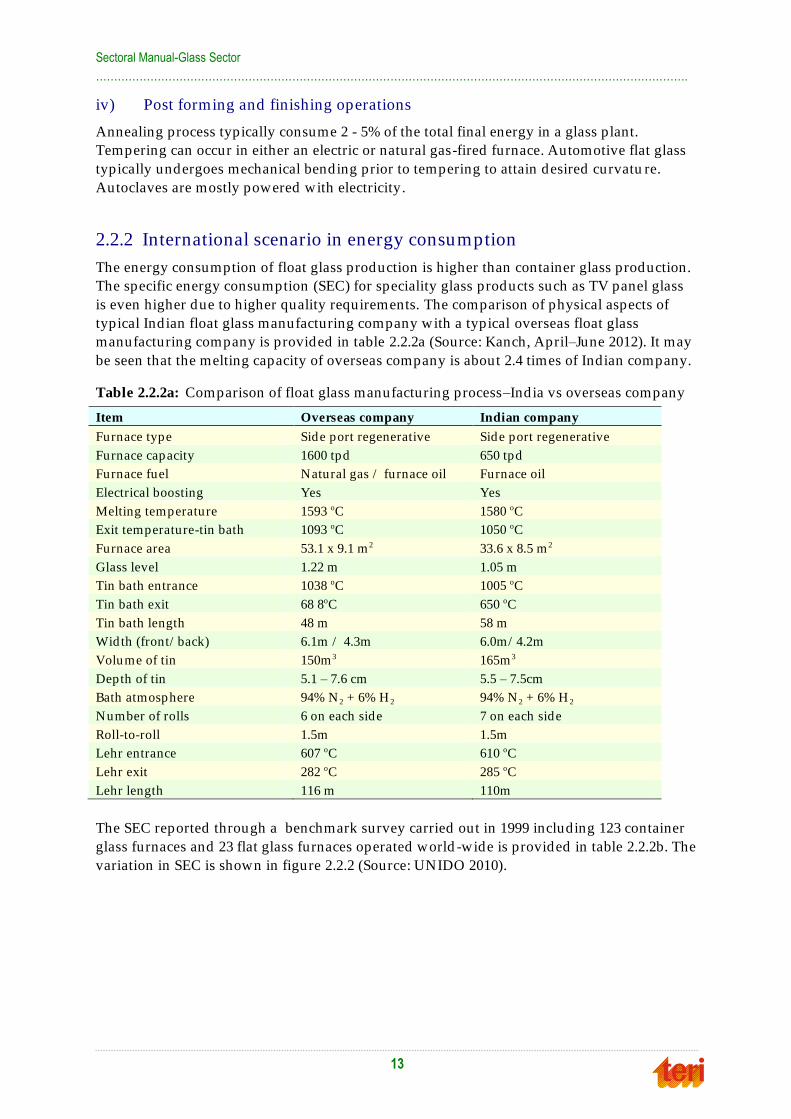
2.2.2 International scenario in energy consumption
The energy consumption of float glass production is higher than container glass production.
The specific energy consumption (SEC) for speciality glass products such as TV panel glass
is even higher due to higher quality requirements. The comparison of physical aspects of
typical Indian float glass manufacturing company with a typical overseas float glass
manufacturing company is provided in table 2.2.2a (Source: Kanch, April–June 2012). It may
be seen that the melting capacity of overseas company is about 2.4 times of Indian company.
Table 2.2.2a: Comparison of float glass manufacturing process–India vs overseas company
Item Overseas company Indian company
Furnace type Side port regenerative Side port regenerative
Furnace capacity 1600 tpd 650 tpd
Furnace fuel Natural gas / furnace oil Furnace oil
Electrical boosting Yes Yes
Melting temperature 1593 oC 1580 oC
Exit temperature-tin bath 1093 oC 1050 oC
Furnace area 53.1 x 9.1 m 2 33.6 x 8.5 m 2
Glass level 1.22 m 1.05 m
Tin bath entrance 1038 oC 1005 oC
Tin bath exit 68 8oC 650 oC
Tin bath length 48 m 58 m
Width (front/ back) 6.1m / 4.3m 6.0m/ 4.2m
Volume of tin 150m 3 165m 3
Depth of tin 5.1 – 7.6 cm 5.5 – 7.5cm
Bath atmosphere 94% N 2 + 6% H 2 94% N 2 + 6% H 2
Number of rolls 6 on each side 7 on each side
Roll-to-roll 1.5m 1.5m
Lehr entrance 607 oC 610 oC
Lehr exit 282 oC 285 oC
Lehr length 116 m 110m
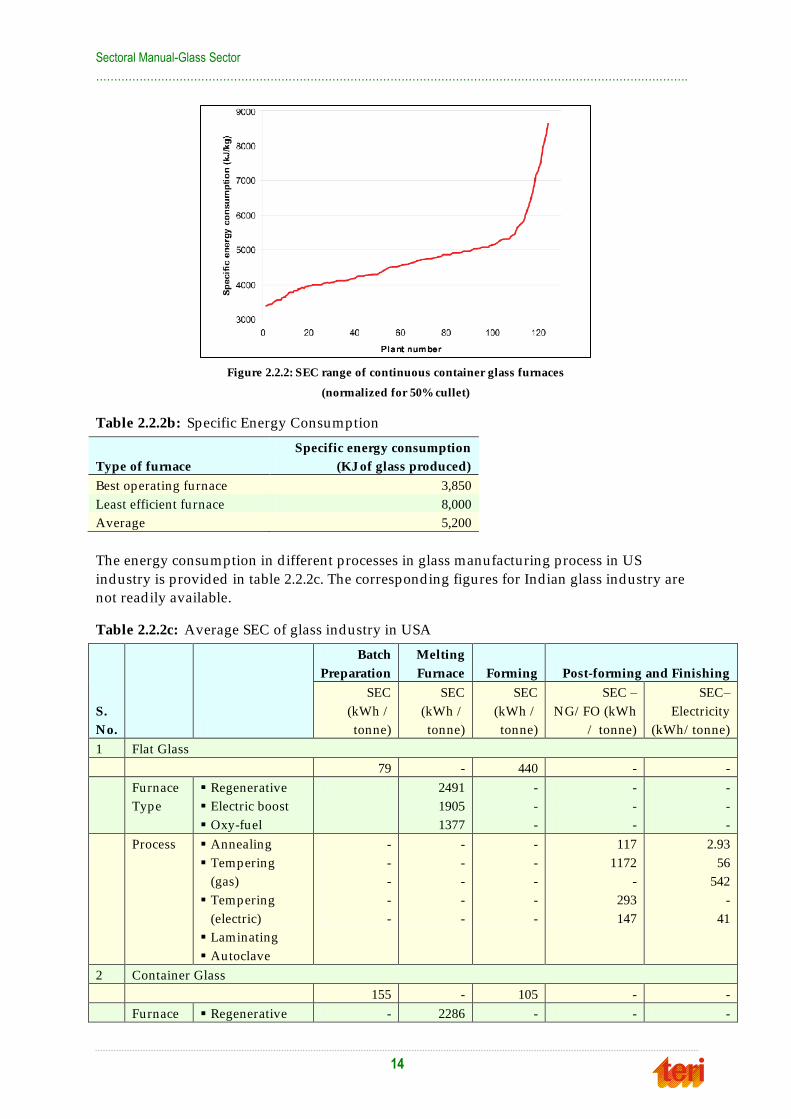
The SEC reported through a benchmark survey carried out in 1999 including 123 container
glass furnaces and 23 flat glass furnaces operated world -wide is provided in table 2.2.2b. The
variation in SEC is shown in figure 2.2.2 (Source: UNIDO 2010).
Sectoral Manual-Glass Sector
……………………………………………………………………………………………………………………………………………….
14
Figure 2.2.2: SEC range of continuous container glass furnaces
(normalized for 50% cullet)
Table 2.2.2b: Specific Energy Consumption
Type of furnace
Specific energy consumption
(KJ of glass produced)
Best operating furnace 3,850
Least efficient furnace 8,000
Average 5,200
The energy consumption in d ifferent processes in glass manufacturing process in US
industry is provided in table 2.2.2c. The corresponding figures for Indian glass industry are
not readily available.
Table 2.2.2c: Average SEC of glass industry in USA
S.
No.
Batch
Preparation
Melting
Furnace Forming Post-forming and Finishing
SEC
(kWh /
tonne)
SEC
(kWh /
tonne)
SEC
(kWh /
tonne)
SEC –
NG/ FO (kWh
/ tonne)
SEC–
Electricity
(kWh/ tonne)
1 Flat Glass
79 - 440 - -
Furnace
Type
Regenerative
Electric boost
Oxy-fuel
2491
1905
1377
-
-
-
-
-
-
-
-
-
Process Annealing
Tempering
(gas)
Tempering
(electric)
Laminating
Autoclave
-
-
-
-
-
-
-
-
-
-
-
-
-
-
-
117
1172
-
293
147
2.93
56
542
-
41
2 Container Glass
155 - 105 - -
Furnace Regenerative - 2286 - - -
Sectoral Manual-Glass Sector
……………………………………………………………………………………………………………………………………………….
15
S.
No.
Batch
Preparation
Melting
Furnace Forming Post-forming and Finishing
Type Electric boost
Oxy-fuel
Electric melter
Direct melter
-
-
-
-
1377
1172
821
2491
-
-
-
-
-
-
-
-
-
-
-
-
Process Annealing and
Finishing
- - - 469 67
3 Pressed and Blown Glass
223 - 1553 - -
Furnace
Type
Regenerative
Direct Melters
Oxy-fuel fired
Electric melters
-
-
-
-
1612
3517
1055
3019
-
-
-
-
-
-
-
-
-
-
-
-
Process Annealing and
Polishing
- - - 879 15
4 Fibrous Glass
337 - 2110 - -
Furnace
Type
Electric melters
Recuperative
melters
Oxy-fuel fired
-
-
-
2198
2051
1641
-
-
-
-
-
-
-
-
-
Glass wool
Textile Fibre
-
-
-
-
-
-
1290
961
-
-
5
Textile / reinforcement fibers
Furnace
Type
Recuperative
melters
Oxy-fuel fired
-
-
3077
1641
-
-
-
-
-
-
Source: U.S. Department of Energy, 2002
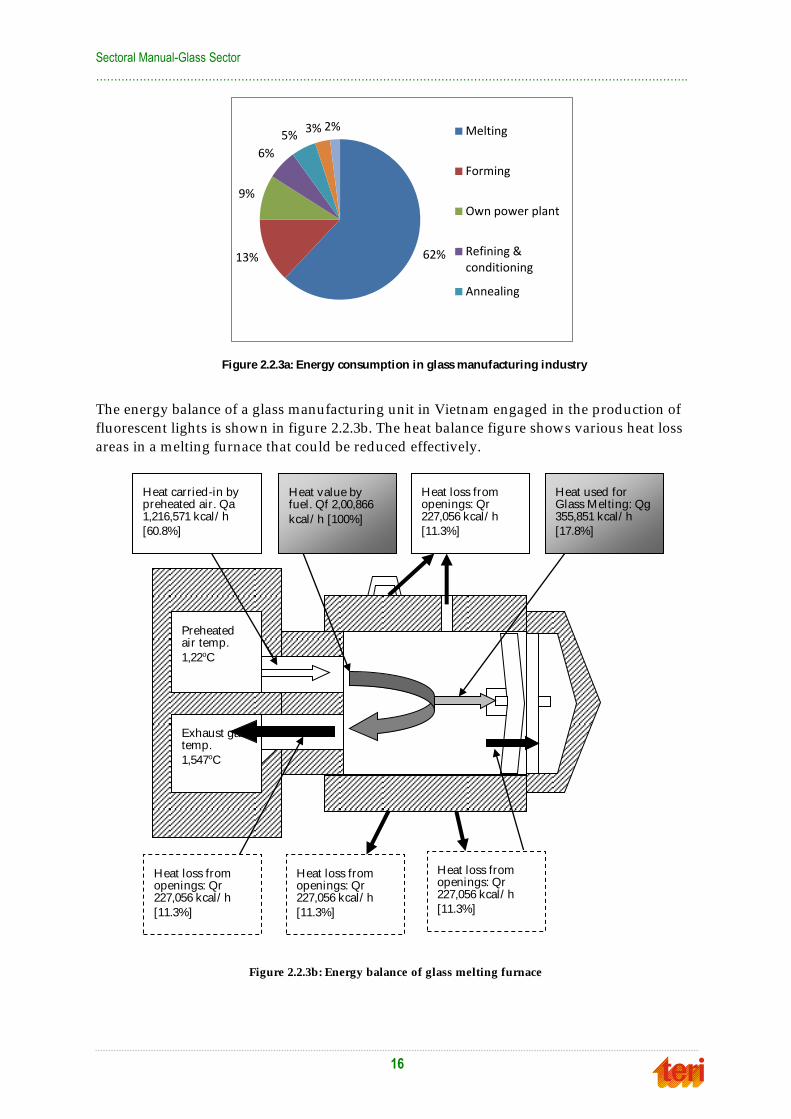
2.2.3 Energy saving opportunities in glass industry
Melting process accounts for more than 60% of the total energy consumption in glass
industry. The share of energy consumption of different processes in glass industry is shown
in figure 2.2.3a (Source: Kanch, Vol 5, No 4, Jul-Sep 2012). Other major processes such as
forming and refining & conditioning are other major energy consuming areas.
Sectoral Manual-Glass Sector
……………………………………………………………………………………………………………………………………………….
16
The energy balance of a glass manufacturing unit in Vietnam engaged in the production of
fluorescent lights is shown in figure 2.2.3b. The heat balance figure shows various heat loss
areas in a melting furnace that could be reduced effectively.
Figure 2.2.3b: Energy balance of glass melting furnace
Preheated air temp.
1,22oC
Exhaust gas temp.
1,547oC
Heat carried-in by preheated air. Qa 1,216,571 kcal/ h
[60.8%]
Heat value by fuel. Qf 2,00,866
kcal/ h [100%]
Heat loss from openings: Qr 227,056 kcal/ h
[11.3%]
Heat used for Glass Melting: Qg 355,851 kcal/ h
[17.8%]
Heat loss from openings: Qr 227,056 kcal/ h
[11.3%]
Heat loss from openings: Qr 227,056 kcal/ h
[11.3%]
Heat loss from openings: Qr 227,056 kcal/ h
[11.3%]
Figure 2.2.3a: Energy consumption in glass manufacturing industry
62% 13%
9%
6%
5% 3% 2% Melting
Forming
Own power plant
Refining &conditioning
Annealing
Sectoral Manual-Glass Sector
……………………………………………………………………………………………………………………………………………….
17
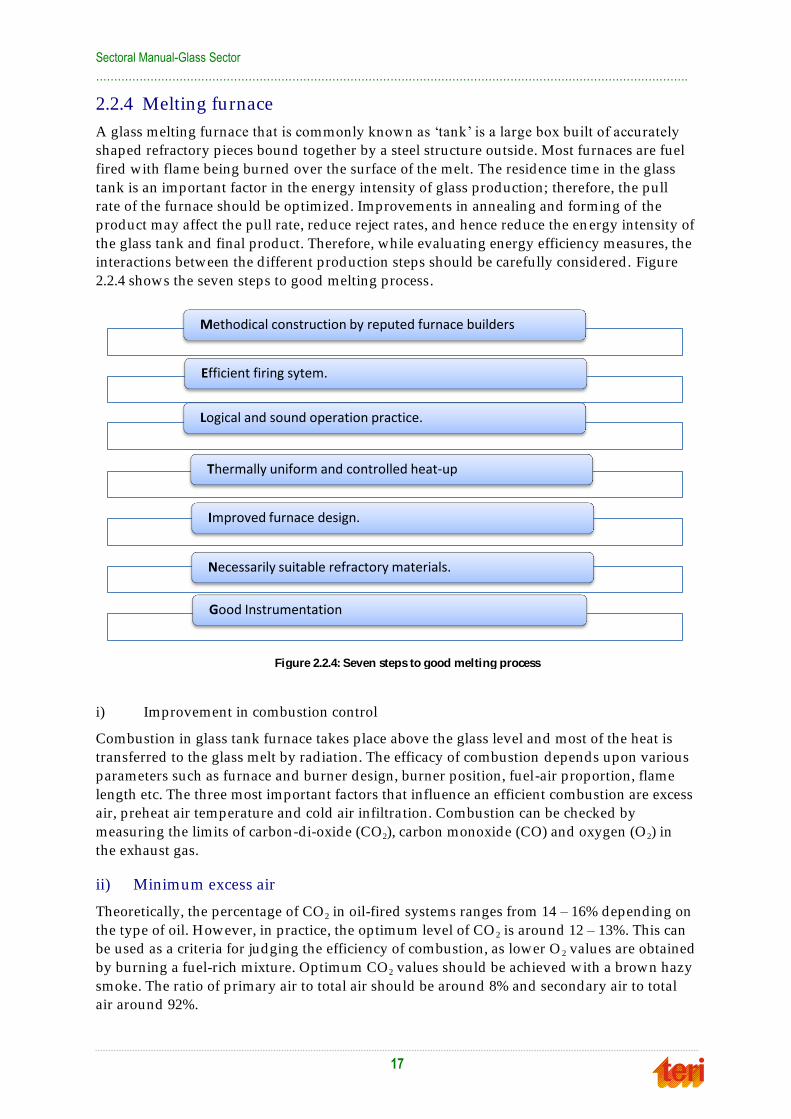
2.2.4 Melting furnace
A glass melting furnace that is commonly known as ‗tank‘ is a large box built of accurately
shaped refractory pieces bound together by a steel structure outside. Most furnaces are fuel
fired with flame being burned over the surface of the melt. The residence time in the glass
tank is an important factor in the energy intensity of glass production; therefore, the pull
rate of the furnace should be optimized. Improvements in annealing and forming of the
product may affect the pull rate, reduce reject rates, and hence reduce the en ergy intensity of
the glass tank and final product. Therefore, while evaluating energy efficiency measures, the
interactions between the d ifferent production steps should be carefully considered . Figure
2.2.4 shows the seven steps to good melting process.
i) Improvement in combustion control
Combustion in glass tank furnace takes place above the glass level and most of the heat is
transferred to the glass melt by radiation. The efficacy of combustion depends upon various
parameters such as furnace and burner design, burner position, fuel-air proportion, flame
length etc. The three most important factors that influence an efficient combustion are excess
air, preheat air temperature and cold air infiltra tion. Combustion can be checked by
measuring the limits of carbon-di-oxide (CO2), carbon monoxide (CO) and oxygen (O 2) in
the exhaust gas.
ii) Minimum excess air
Theoretically, the percentage of CO 2 in oil-fired systems ranges from 14 – 16% depending on
the type of oil. However, in practice, the optimum level of CO 2 is around 12 – 13%. This can
be used as a criteria for judging the efficiency of combustion, as lower O 2 values are obtained
by burning a fuel-rich mixture. Optimum CO2 values should be achieved with a brown hazy
smoke. The ratio of primary air to total air should be around 8% and secondary air to total
air around 92%.
Methodical construction by reputed furnace builders
Efficient firing sytem.
Logical and sound operation practice.
Thermally uniform and controlled heat-up
Improved furnace design.
Necessarily suitable refractory materials.
Good Instrumentation
Figure 2.2.4: Seven steps to good melting process
Sectoral Manual-Glass Sector
……………………………………………………………………………………………………………………………………………….
18
iii) Preheating combustion air
Exhaust gases leave the furnace at high temperatures between 1500oC and 1580oC, a
substantial part of the latent heat of these gases can be used to pre-heat the air supplied for
combustion.
v) Influence of cold air
The secondary air used for combustion is preheated by the heat exchanger. The prim ary air
for spraying and air intruding from the clearance of the burner tiles enter the furnace in cold
conditions. Reduction in volume of intruding cold air helps to conserve energy. It has been
observed that a cold air reduction by 1% results in fuel sav ings by 0.5%.
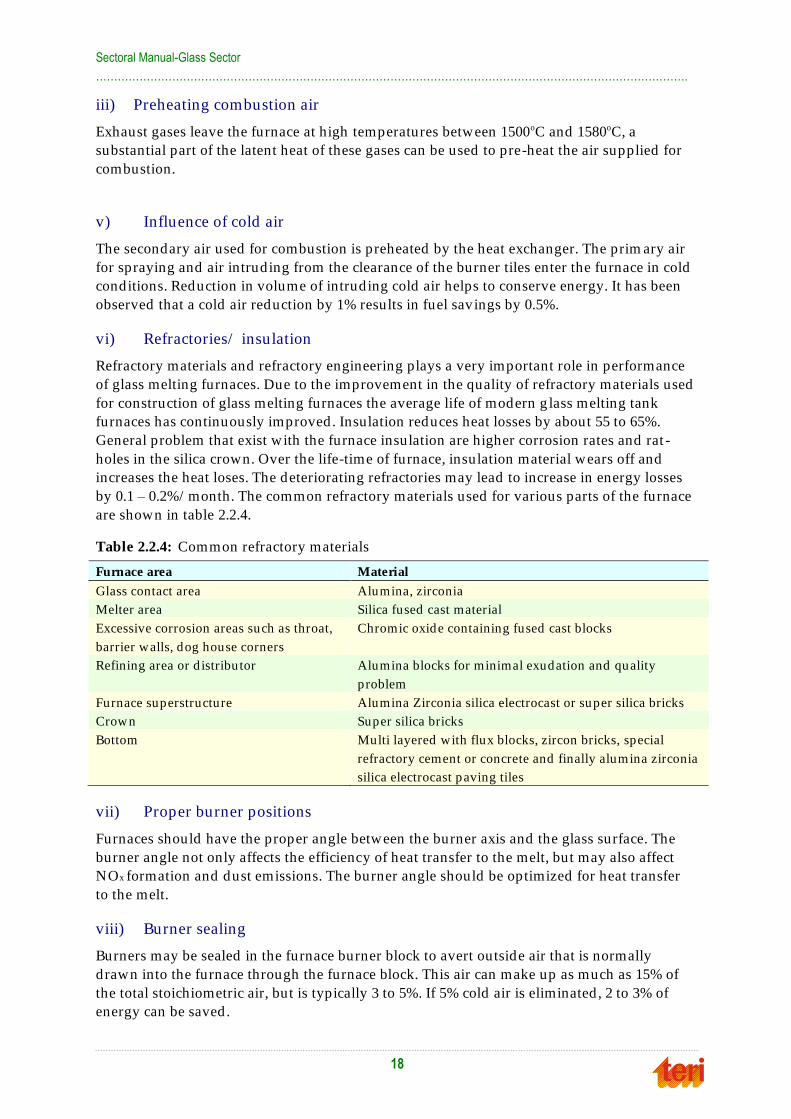
vi) Refractories/ insulation
Refractory materials and refractory engineering plays a very important role in performance
of glass melting furnaces. Due to the improvement in the quality of refractory materials used
for construction of glass melting furnaces the average life of modern g lass melting tank
furnaces has continuously improved. Insulation reduces heat losses by about 55 to 65%.
General problem that exist with the furnace insulation are higher corrosion rates and rat -
holes in the silica crown. Over the life-time of furnace, insulation material wears off and
increases the heat loses. The deteriorating refractories may lead to increase in energy losses
by 0.1 – 0.2%/ month. The common refractory materials used for various parts of the furnace
are shown in table 2.2.4.
Table 2.2.4: Common refractory materials
Furnace area Material
Glass contact area Alumina, zirconia
Melter area Silica fused cast material
Excessive corrosion areas such as throat,
barrier walls, dog house corners
Chromic oxide containing fused cast blocks
Refining area or d istribu tor Alumina blocks for minimal exudation and quality
problem
Furnace superstructure Alumina Zirconia silica electrocast or super silica bricks
Crown Super silica bricks
Bottom Multi layered with flux blocks, zircon bricks, special
refractory cement or concrete and finally alumina zirconia
silica electrocast paving tiles
vii) Proper burner positions
Furnaces should have the proper angle between the burner axis and the glass surface. The
burner angle not only affects the efficiency of heat transfer to the melt, but may also affect
NOx formation and dust emissions. The burner angle should be optimized for heat transfer
to the melt.
viii) Burner sealing
Burners may be sealed in the furnace burner block to avert outside air that is normally
drawn into the furnace through the furnace block. This air can make up as much as 15% of
the total stoichiometric air, but is typically 3 to 5%. If 5% cold air is eliminated , 2 to 3% of
energy can be saved.
Sectoral Manual-Glass Sector
……………………………………………………………………………………………………………………………………………….
19
ix) Oxygen enrichment
During combustion, oxygen com bines with carbon and hydrogen of fuel to liberate heat. The
inert gases of air absorb heat from the combustion and carry it out of the furnace resulting in
heat loss in addition to reduction in flame temperature and reduced rate of heat transfer to
stock. Reduction in inert content of the air can result in more efficient combustion. This can
be done by addition of oxygen to combustion air. With the same fuel input, enriched air
helps in raising the flame temperature, increasing heat transfer and enhancing production
rate. It is reported that additional 1.6% oxygen in combustion air can result in fuel savings of
8 to 10%.
x) Furnace operation
The furnace should be operated at a slightly positive pressure. Negative pressure leads to air
infiltration, affecting air-fuel ratio and furnace temperature resulting in increased fuel
consumption. However, excessive positive pressure lead to exfiltration resulting in leaping
out of flames, overheating of furnace refractories, reduced brick life and other associated
problems. A reasonable pressure would be 0.25 mm wg.
xi) Exhaust recovery by regeneration
The regenerator is commonly used with glass melting tank furnaces. The regenerator
comprises chequer bricks to absorb the heat of exhaust gas. After combustion, gas is fed t o
the regenerator for 15 to 20 minutes to heat the bricks. Combustion air is then fed to absorb
heat from the chequer bricks. This procedure is repeated at specific intervals known as
reversal time. Hence, two regenerators are required for each furnace. With an effectiveness
of 85-90%, the regenerators produce extremely high levels of air preheat (about 85% of
process temperature) bring about substantial fuel savings of up to 65%.
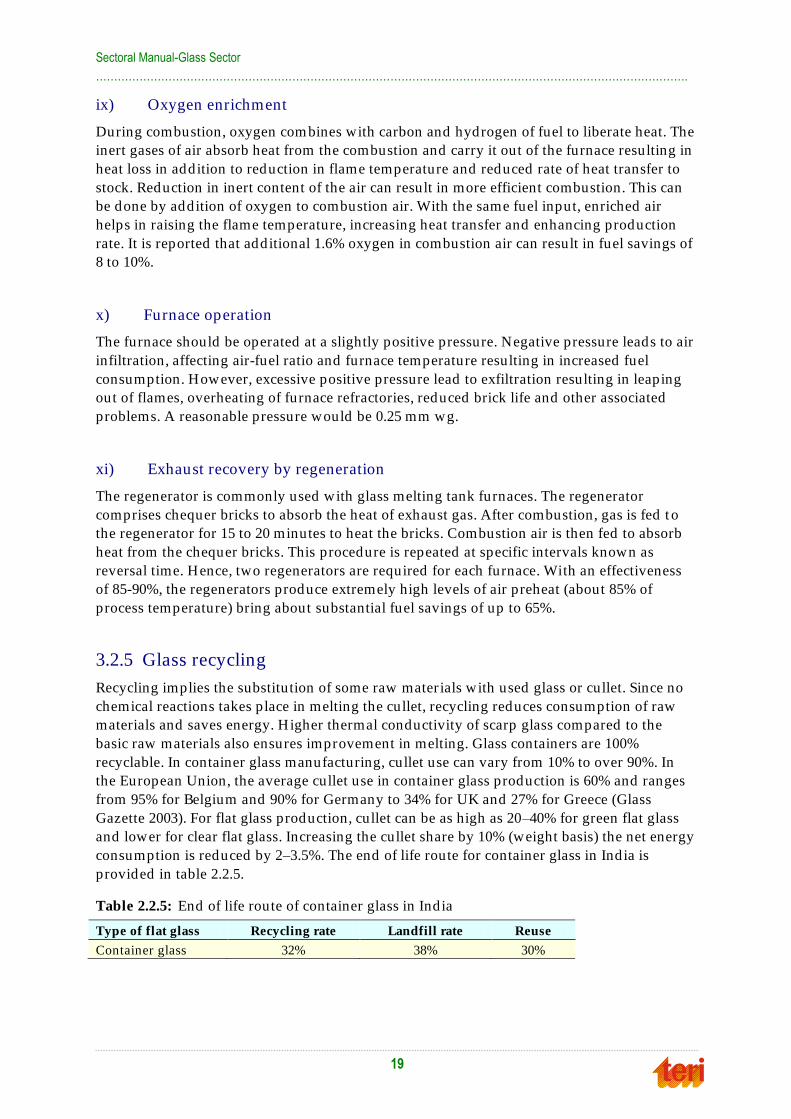
3.2.5 Glass recycling
Recycling implies the substitution of some raw mater ials with used glass or cullet. Since no
chemical reactions takes place in melting the cullet, recycling reduces consumption of raw
materials and saves energy. Higher thermal conductivity of scarp glass compared to the
basic raw materials also ensures improvement in melting. Glass containers are 100%
recyclable. In container glass manufacturing, cullet use can vary from 10% to over 90%. In
the European Union, the average cullet use in container glass production is 60% and ranges
from 95% for Belgium and 90% for Germany to 34% for UK and 27% for Greece (Glass
Gazette 2003). For flat glass production, cullet can be as high as 20–40% for green flat glass
and lower for clear flat glass. Increasing the cullet share by 10% (weight basis) the net energy
consumption is reduced by 2–3.5%. The end of life route for container glass in India is
provided in table 2.2.5.
Table 2.2.5: End of life route of container glass in India
Type of flat glass Recycling rate Landfill rate Reuse
Container glass 32% 38% 30%

Sectoral Manual-Glass Sector
……………………………………………………………………………………………………………………………………………….
20
2.2.6 Batch and cullet preheating
In a cullet preheater, the waste heat of the fuel-fired furnace is used to preheat the incoming
cullet batch. Batch preheating is more d ifficult than cullet preheating, as clumping of
incoming materials can affect the product quality and melting efficiency. In theory, any
system with over 50% cullet in the batch can install preheaters. Energy saving of cullet
preheaters is estimated to be around 12 – 20%.
21
33..00 AAnnaallyyssiiss ooff eenneerrggyy ccoonnssuummppttiioonn ddaattaa
3.1 Methodology The following methodology has been adopted to analyze the energy consumption data:
Analysis of energy consumption data measured and collected during energy audits
of d ifferent types of major glass industries by TERI
Analysis of data collected during energy efficiency study in MSME units involved in
glass manufacturing in Firozabad glass cluster
Collation of data from annual reports of major glass manufacturing units
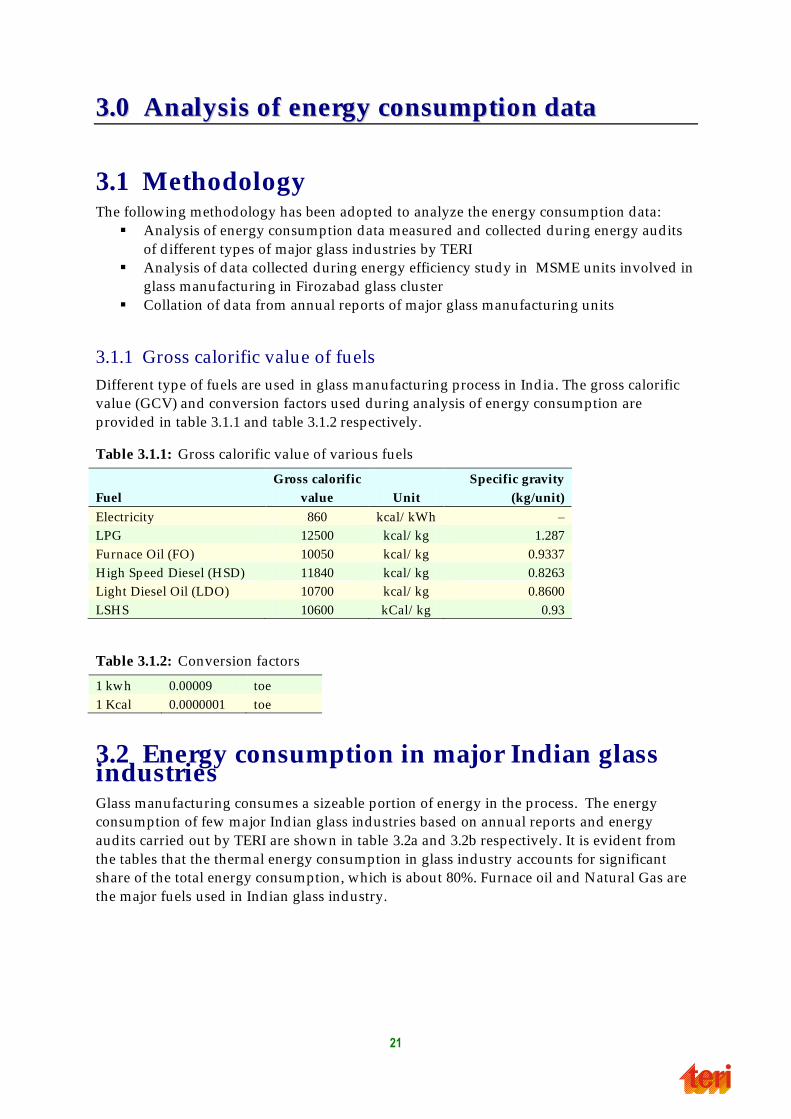
3.1.1 Gross calorific value of fuels
Different type of fuels are used in glass manufacturing process in India. The gross calorific
value (GCV) and conversion factors used during analysis of energy consumption are
provided in table 3.1.1 and table 3.1.2 respectively.
Table 3.1.1: Gross calorific value of various fuels
Fuel
Gross calorific
value Unit
Specific gravity
(kg/unit)
Electricity 860 kcal/ kWh –
LPG 12500 kcal/ kg 1.287
Furnace Oil (FO) 10050 kcal/ kg 0.9337
High Speed Diesel (HSD) 11840 kcal/ kg 0.8263
Light Diesel Oil (LDO) 10700 kcal/ kg 0.8600
LSHS 10600 kCal/ kg 0.93
Table 3.1.2: Conversion factors
1 kwh 0.00009 toe
1 Kcal 0.0000001 toe
3.2 Energy consumption in major Indian glass industries Glass manufacturing consumes a sizeable portion of energy in the process. The energy
consumption of few major Indian glass industries based on annual reports and energy
audits carried out by TERI are shown in table 3.2a and 3.2b respectively. It is evident from
the tables that the thermal energy consumption in glass industry accounts for significant
share of the total energy consumption, which is about 80%. Furnace oil and Natural Gas are
the major fuels used in Indian glass industry.
Sectoral Manual-Glass Sector
……………………………………………………………………………………………………………………………………………….
22
Table 3.2a: Energy Consumption in few Indian Companies (annual reports)
HNG Piramal Glass India Ltd. Sezal Glass Ltd Asahi India Glass Limited
Products Glass containers for liquid and beer, food ,
pharmaceuticals and cosmetic industries, Float
Glass
Flacconage glass for the pharmaceuticals
and perfumery, glass bottles for
specialty food and beverages
Insulating glass,
tempering glass,
Laminated glass
Automotive safety glass, float glass and
value-added glass like reflective glass,
mirror and architectural
2010-11 2011-12 2010-11 2011 - 12 2009 - 10 2005-06 2006-07
Installed
capacity
2930 tpd 700 tpd 700 tpd 1725000 sq.m - -
Total
production
(tonne)
936863 829624 - - - Laminated
wind shield -
1579721 (pcs);
Tempered glass
(sqm)-2937861;
Float glass (csqm)-
24,422,779
Laminated
wind shield -
2002137 (pcs);
Tempered glass
(sqm)-3448074; Float
glass (csqm)-
38,999,031
Total toe Total toe Total toe Total toe Total toe Total toe Total toe
Electricity
(mil kWh)
3723 32015 330.9 28461 114.6 9853 111.8 9612 9.257 796 91.7 7,887 121.4 10,445
HSD (kL) 1565 1531 8495 8311 - - - - - - - - - -
LPG
(tonne)
8535 10669 77271 96589 31,200 39
FO/ RFO/ E
q.oil (kL)
83456 78312 1402 1316 6,371 5978 2,503 2349 9,620 9,027 22,833 21,426
LNG
(MMBTU)
1667616 42056 721773 18202 – – – – – – - - - -
Kerosene
oil (lit)
– – – – 96,000 87 24,700 22
LSHS
(tonne)
– – – – – – – 22,501 23,851 31,642 33,540
NG (mil – – – – 65.6 58471 67.9 0.24 4.6 4135
Sectoral Manual-Glass Sector
……………………………………………………………………………………………………………………………………………….
23
HNG Piramal Glass India Ltd. Sezal Glass Ltd Asahi India Glass Limited
Sm 3)
LDO (kL) 46.8 43.10 - - - - - - - - 4979 4582 442 407
SEC
(toe/ tonne)
0.176 0.184 0.303 0.296 -
Share-
Thermal
energy
- 80% - 76% - 87% - 87% - 83% - 81% - 84%
Share -
Electrical
energy
- 20% - 24% - 13% - 13% - 16% - 19% - 16%
Sectoral Manual-Glass Sector
……………………………………………………………………………………………………………………………………………….
24
Table 3.2b: Energy Consumption in few Indian Glass manufacturing companies (energy audits)
Victory Glass Industries Ltd. AGI Glasspac, Hyderabad
AGI Glasspac,
Bhongir
Binani Industries,
Glass Fibre Goa
Durgesh Block & China
Glass Works Ltd.
Products Glass for bottles, liquor industries High quality glass for packaging
industries
High quality glass
for packaging
industries
Glass fibre products,
chopped strand mat
woven roving
High quality glass bottles,
bulb shells, container glass
and assorted glassware items
1996-97 1997-98 2009-10 Apr 2010- Sep 2010 2009-10 1997-98 2011
Installed capacity 110 tpd 300 tpd 450 tpd 6600 tpa 120 tpd
Total production
(tonne/ year)
24354 19527 171607 64632 156585 5746 35700
Unit toe/ t Unit toe/ t Total toe/ t Total toe/ t Total toe/ t Total toe/ t Total toe/ t
Electricity (million
kWh)
1.87 0.0007 2.0 0.0009 70.915 0.0036 28.366 0.0038 40.937 00.022 17.42 0.0261 – –
HSD (KL) 1716.5 0.069 908.3 0.046 199542 1.138 115565 1.749 355 0.060 – –
LPG (MT) 4234.9 0.031 1672.5 0.032 2941.37 0.023 334 0.073 – –
Furnace Oil (KL) 3305.8 0.127 2431.8 0.117 7650.12 0.042 145 0.002 14497 0.087 880 0.144 – –
NG (Sm3/ year) – – – – – – – – – – – – 10150000 0.245
LSHS (KL) 778.4 0.032 NA 14610 0.084 7973.7 0.122
NG (m 3) – – – – – – – – – – – – – –
LDO (KL) 624.7 0.024 446.7 0.021 – – – – – – – – – –
SEC (toe/ tonne) 0.258 0.192 1.330 1.943 0.133 0.538 0.245
Share- Thermal energy 97.4% 95.4% 97.3% 98.1% 83.1% 51.5% – 100%
Share- electrical Energy 2.6% 4.6% 2.7% 1.9% 16.9% 48.5% – –
Sectoral Manual-Glass Sector
……………………………………………………………………………………………………………………………………………….
25
3.2.1 Energy consumption in Indian Glass Industry
In India, container glass production is more than the float glass production. As per All India
Glass Manufacturing Federation, total container and float glass production during 2011-12
was 7500 tonnes per day and 4760 tonnes per day respectively. Considering 80% of the total
energy consumption in glass manufacturing is accounted by the thermal energy
requirements, the estimated total energy consumption of Indian glass industry is given in
table 3.2.1.
Table 3.2.1: Production and energy consumption in Indian glass industry
Type of
glass
Production
during 2011-12
(million tonne
per year*)
Energy consumption per year
(mtoe) #
Share Thermal Electrical Total
Container 2.74 0.60 0.15 0.75 65%
Float 1.74 0.24 0.06 0.30 26%
Others 0.19 0.07 0.02 0.12 9%
Total 4.66 0.91 0.23 1.17 100%
* Source: All India Glass Manufacturing Federation, Glass Yug and TERI
# Energy consumption of 6800 kcal/kg for container glass and 4400 kcal/kg for flat glass are considered for
melting (UNIDO 2010)
3.2.2 Energy consumption in Firozabad glass cluster
Firozabad, a small town about 40 kilometres from Agra is one of the leading glass clusters in
India. There is a large agglomeration of small-scale units engaged in the manufacture of
bangles, hollow wares, decorative items, glass beads and headlight covers etc. The cluster is
very important because of the fact that the bangles in India are almost exclusively produced
in this cluster.
Closed & open pot furnace and tank furnace are the major glass melting technologies used
in the cluster. There are other auxiliary furnaces such as muffle furnace, reheating furnace
etc. which are involved in glass processing chain. The major forms of energy used in the
cluster are piped natural gas (NG) supplied by Gas Authority of India Limited (GAIL). The
total energy consumption of the cluster in producing melt-glass is about 0.19 million tonnes
of oil equivalent per year. Considering the importance and high energy consumption in th e
cluster, possibility of considering the cluster as a ‗Designate Cluster‘ may be explored in the
future3.
3.2.3 Energy consumption by large industries in India
The energy consumption of few large glass manufacturing industries has been provided in
table 3.2.2. The energy consumption levels are estimated based on the average Specific
Energy Consumption of float and container glass respectively. The actual energy
consumption by these industries could be verified by carrying out actua l measurements
during field visits. However, estimates clearly highlight the large energy consumption by
3 The idea of ‗Designated Cluster‘ was put forward during the National Summit on ‗Energy Efficiency in MSMEs‘ organized in July 2012 by TERI, SDC, BEE and MoMSME
Sectoral Manual-Glass Sector
……………………………………………………………………………………………………………………………………………….
26
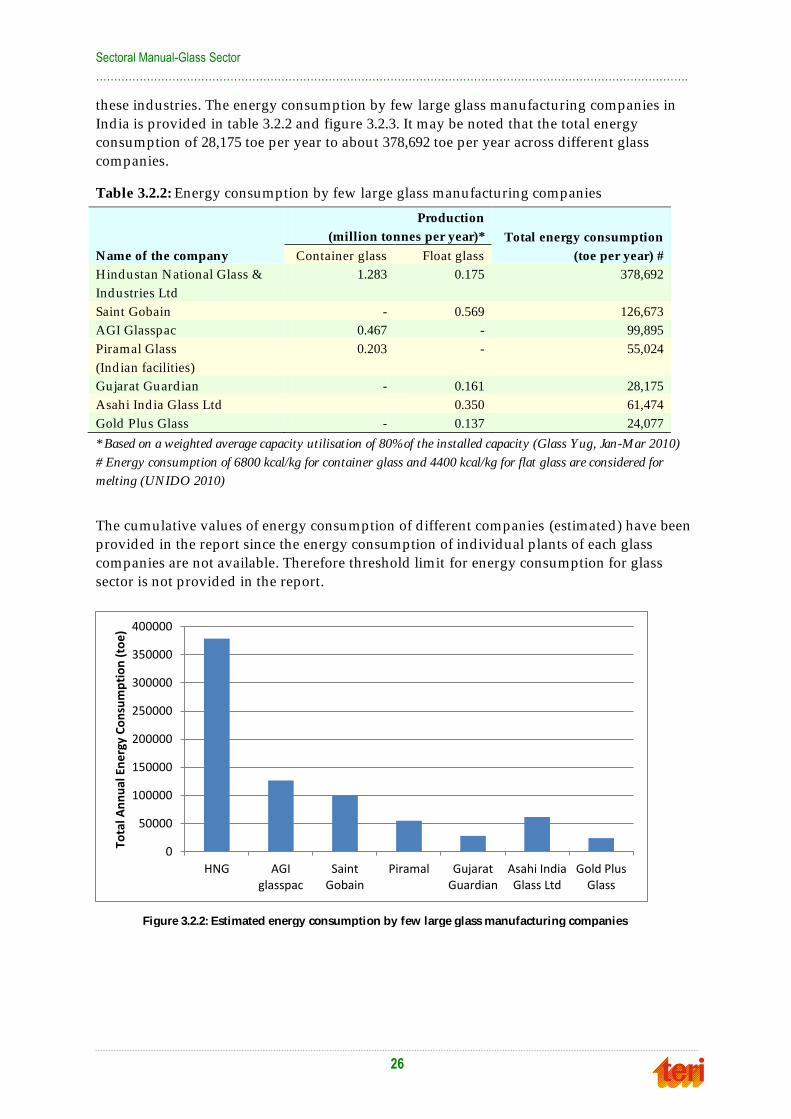
these industries. The energy consumption by few large glass manufacturing companies in
India is provided in table 3.2.2 and figure 3.2.3. It may be noted that the total energy
consumption of 28,175 toe per year to about 378,692 toe per year across different glass
companies.
Table 3.2.2: Energy consumption by few large glass manufacturing companies
Name of the company
Production
(million tonnes per year)* Total energy consumption
(toe per year) # Container glass Float glass
Hindustan National Glass &
Industries Ltd
1.283 0.175 378,692
Saint Gobain - 0.569 126,673
AGI Glasspac 0.467 - 99,895
Piramal Glass
(Ind ian facilities)
0.203 - 55,024
Gujarat Guard ian - 0.161 28,175
Asahi Ind ia Glass Ltd 0.350 61,474
Gold Plus Glass - 0.137 24,077
* Based on a weighted average capacity utilisation of 80%of the installed capacity (Glass Yug, Jan-Mar 2010)
# Energy consumption of 6800 kcal/kg for container glass and 4400 kcal/kg for flat glass are considered for
melting (UNIDO 2010)
The cumulative values of energy consumption of d ifferent companies (estimated) have been
provided in the report since the energy consumption of individual plants of each glass
companies are not available. Therefore threshold limit for energy consumption for glass
sector is not provided in the report.
0
50000
100000
150000
200000
250000
300000
350000
400000
HNG AGIglasspac
SaintGobain
Piramal GujaratGuardian
Asahi IndiaGlass Ltd
Gold PlusGlass
Tota
l An
nu
al E
ne
rgy
Co
nsu
mp
tio
n (
toe
)
Figure 3.2.2: Estimated energy consumption by few large glass manufacturing companies
Sectoral Manual-Glass Sector
……………………………………………………………………………………………………………………………………………….
27
44..00 CCoonncclluussiioonnss
The energy consumption in glass industry shows that substantial share of energy
consumption is accounted by thermal energy and there exists significant scope for energy
efficiency improvements both in process and utility areas. There are few large players in
glass industry engaged in the production of float and container glass accounting for major
energy consumption in glass sector. The total annual energy consumption of these major
players is estimated to be 0.78 mtoe, which is about 66 % of the total energy consumption of
glass sector.
The energy consumption by glass industries is quite significant for d ifferent group
companies and a number of plants involved in the production of float glass and container
glass would qualify to be ‗Designated Consumers‘ (DCs). However, for a number of such
major players (e.g. Saint Gobain, Hindustan National Glass, Asahi Glass and Gold Plus
Glass), details like installed capacity, production and energy consumption of their
individual glass plants are not readily available. Energy consumption of individual plants
would be required to propose threshold limits and consider them as DCs. Therefore, it is
suggested to undertake a glass-sector specific study to estimate energy consumption and set
threshold limit for the glass sector.

29
55..00 RReeffeerreennccee
1. Glass Industry, Practical Energy Audit Manual, TERI, August 1999
2. Report on Improving Energy Efficiency in the Firozabad Glass Industry Cluster, 2012
3. Energy and Environmental Profile of the U.S. Glass Industry, U.S. Department of
Energy, April 2002
4. Energy Efficiency Improvement and Cost Saving Opportunities for the Glass Industry,
Ernest Orlando Lawrence Berkeley National Laboratory, March 2008
5. Glass and Ceramics Market and Opportunities, IBEF
6. Global Industrial Energy Efficiency Benchmarking, An Energy Policy Tool, Working
Paper, UNIDO, November 2010
7. British Glass, website www.britglss.co.uk assessed during 15 May – 25 May, 2013
8. Indian Glass Directory 2012, The All India Glass Manufacturing Federation
9. Marketing Trend, An evaluation of Indian Float Glass Industry Trade during the FY
2009 – 10, Glass Yug,Jan-Mar 2010
(http:/ / www.hngfloat.com/ images/ glassyug_report_jan_to_march_2010.pdf)
10. Marketing Trend, An evaluation of Indian Float Glass Business during 2012 –13, Glass
Yug
11. Securing a bright future for glass packaging, Kanch, Vol 6, No. 1, Oct – Dec 2012
12. Annual Report 2010 – 11, Department of Industrial Policy and Promotion, Ministry of
Commerce and Industries, Government of India
13. http:/ / www.business-standard .com/ article/ companies/ glass-industry-lines-up-rs-7-
000-cr-111063000001_1.html (as assessed on 17th May 2013)
14. Annual Report 2006 – 07, Asahi In d ia Glass Limited
15. Annual Report 2009 -10, Sezal Glass Limited
16. Annual Report 2011 – 12, Hindustan National Glass and Industries Limited
17. Annual Report 2011 – 12,Piramal Glass India Limited
18. Department of Industrial Policy and Promotion, Annual Report 2011- 12
19. Department of Industrial Policy and Promotion, Annual Report 2012- 13
20. Web-site http:/ / www.hngil.com/ aboutus.php as assessed on 22 August 2013
21. Web-site http:/ / www.piramalglass.com as assessed on 26 July 2013
22. Web-site http:/ / www.glassforeurope.com/ en/ industry/ index.php as assessed on 15
July 20113
23. http:/ / www.pilkington.com/ resources/ pfgi2010.pdf as assessed on 22 August 2013
24. Kanch (Quarterly Journal of AIGMF), Volume 5, No. 4, July-Sep 2012,
25. Kanch (Quarterly Journal of AIGMF), Volume 5, No. 3, Apr-Jun 2012

31
AAnnnneexxuurree 11..77..11
Contact details of regional associations of All India Glass Manufacturing Federation
1. Northern India Glass Manufacturers‘ Association (NIGMA)
c/ o Universal Glass (A division of Jagatjit Industries Limited), Plot No. 17, Site
IV, Industrial Area, Sahibabad, Ghaziabad – 201010 (UP)
2. South India Glass Manufacturers‘ Association (SIGMA)
c/ o Universal Glass (An SBU of HSIL Ltd .),
Glass Factory Road, Off Motinagar,
P B No. 1930, Sanathnagar, PO Hyderabad – 500018
3. Western India Glass Manufacturers‘ Association (WIGMA)
c/ o Pragati Glass Works (P) Ltd .,
111, Damji Shamji Industrial Complex,
9, LBS Marg, Kurla (W), Mumbai – 400 070
4. Eastern India Glass Manufacturers‘ Association (EIGMA)
c/ o Asoke Enamel & Glass Works (P) Ltd .,
34-A, Metcalfe Street, 1st Floor,
Kolkata - 700013
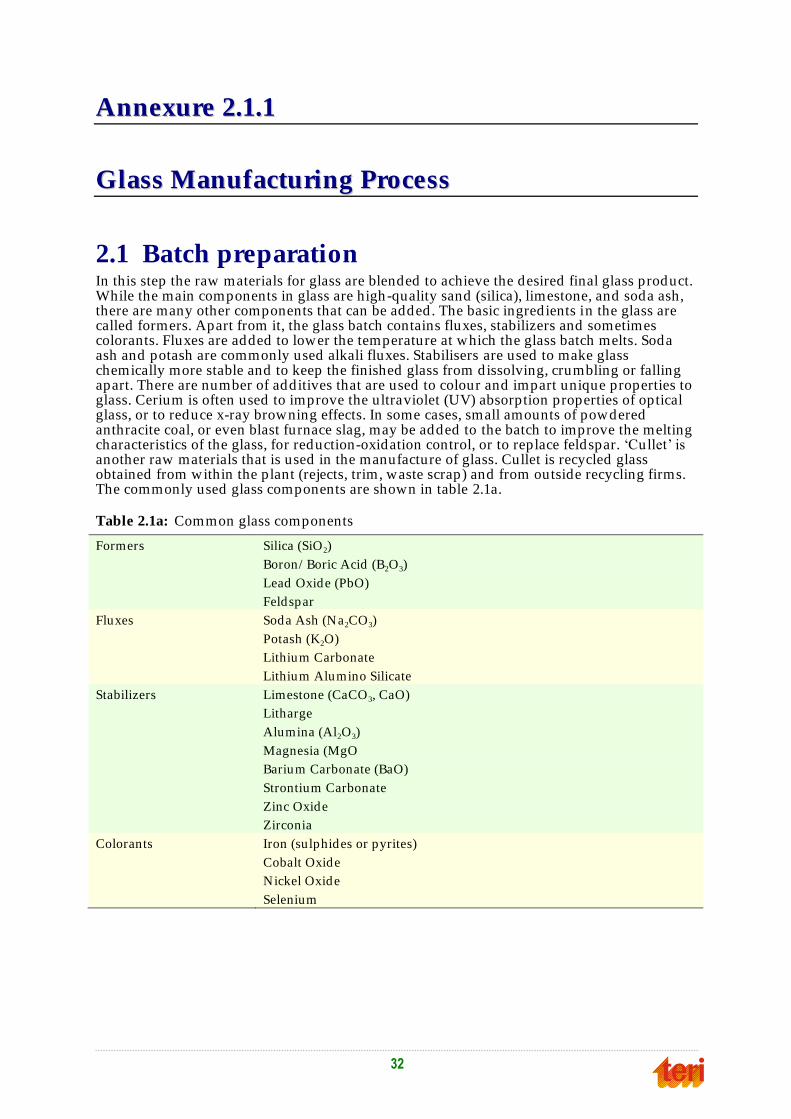
32
AAnnnneexxuurree 22..11..11
GGllaassss MMaannuuffaaccttuurriinngg PPrroocceessss
2.1 Batch preparation In this step the raw materials for glass are blended to achieve the desired final glass product. While the main components in glass are high -quality sand (silica), limestone, and soda ash, there are many other components that can be added. The basic ingredients in the glass are called formers. Apart from it, the glass batch contains fluxes, stabilizers and sometimes colorants. Fluxes are added to lower the temperature at which the glass batch melts. Soda ash and potash are commonly used alkali fluxes. Stabilisers are used to make glass chemically more stable and to keep the finished glass from dissolving, crumbling or falling apart. There are number of additives that are used to colour and impart unique properties to glass. Cerium is often used to improve the ultraviolet (UV) absorption properties of optical glass, or to reduce x-ray browning effects. In some cases, small amounts of powdered anthracite coal, or even blast furnace slag, may be added to the batch to improve the melting characteristics of the glass, for reduction-oxidation control, or to replace feldspar. ‗Cullet‘ is another raw materials that is used in the manufacture of glass. Cullet is recycled glass obtained from within the plant (rejects, trim, waste scrap) and from outside recycling firms. The commonly used glass components are shown in table 2.1a.
Table 2.1a: Common glass components
Formers Silica (SiO2)
Boron/ Boric Acid (B2O3)
Lead Oxide (PbO)
Feldspar
Fluxes Soda Ash (Na2CO3)
Potash (K2O)
Lithium Carbonate
Lithium Alumino Silicate
Stabilizers Limestone (CaCO3, CaO)
Litharge
Alumina (Al2O3)
Magnesia (MgO
Barium Carbonate (BaO)
Strontium Carbonate
Zinc Oxide
Zirconia
Colorants Iron (sulphides or pyrites)
Cobalt Oxide
Nickel Oxide
Selenium
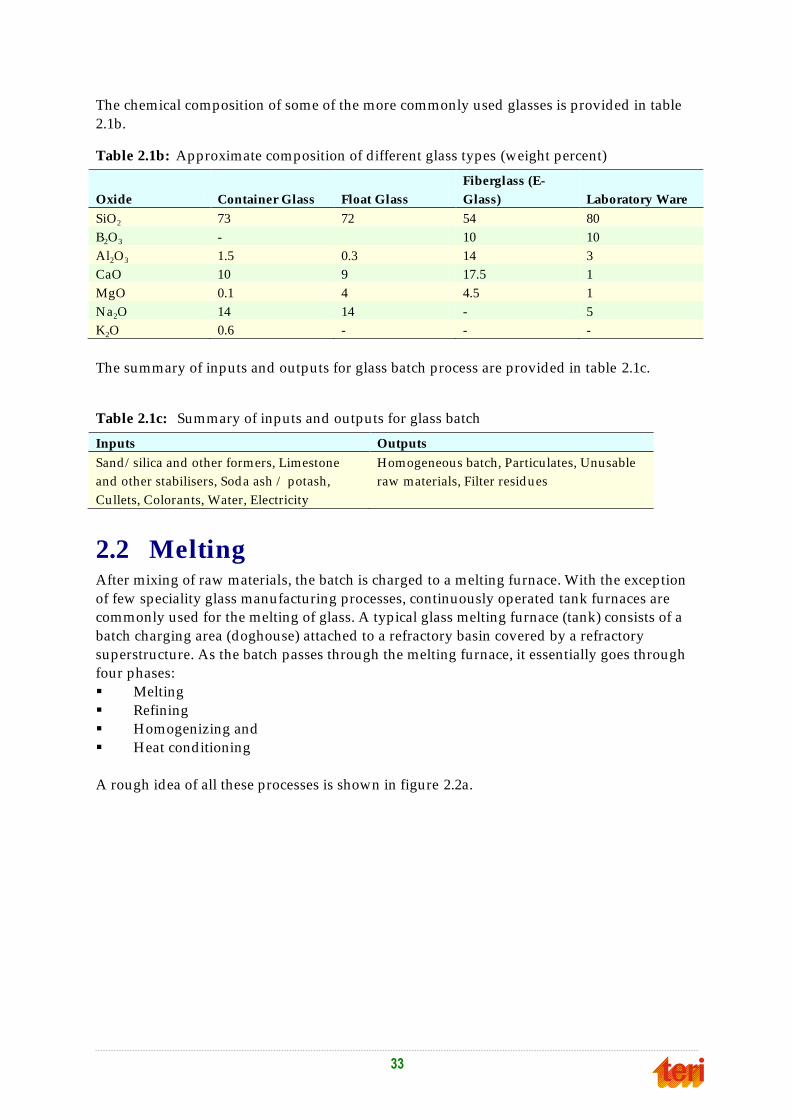
33
The chemical composition of some of the more commonly used glasses is provided in table
2.1b.
Table 2.1b: Approximate composition of different glass types (weight percent)
Oxide Container Glass Float Glass
Fiberglass (E-
Glass) Laboratory Ware
SiO2 73 72 54 80
B2O3 - 10 10
Al2O3 1.5 0.3 14 3
CaO 10 9 17.5 1
MgO 0.1 4 4.5 1
Na2O 14 14 - 5
K2O 0.6 - - -
The summary of inputs and outputs for glass batch process are provided in table 2.1c.
Table 2.1c: Summary of inputs and outputs for glass batch
Inputs Outputs
Sand/ silica and other formers, Limestone
and other stabilisers, Sod a ash / potash,
Cullets, Colorants, Water, Electricity
Homogeneous batch, Particulates, Unusable
raw materials, Filter resid ues
2.2 Melting After mixing of raw materials, the batch is charged to a melting furnace. With the exception
of few speciality glass manufacturing processes, continuously operated tank furnaces are
commonly used for the melting of glass. A typical glass melting furnace (tank) consists of a
batch charging area (doghouse) attached to a refractory basin covered by a refractory
superstructure. As the batch passes through the melting furnace, it essentially goes through
four phases:
Melting
Refining
Homogenizing and
Heat conditioning
A rough idea of all these processes is shown in figure 2.2a.
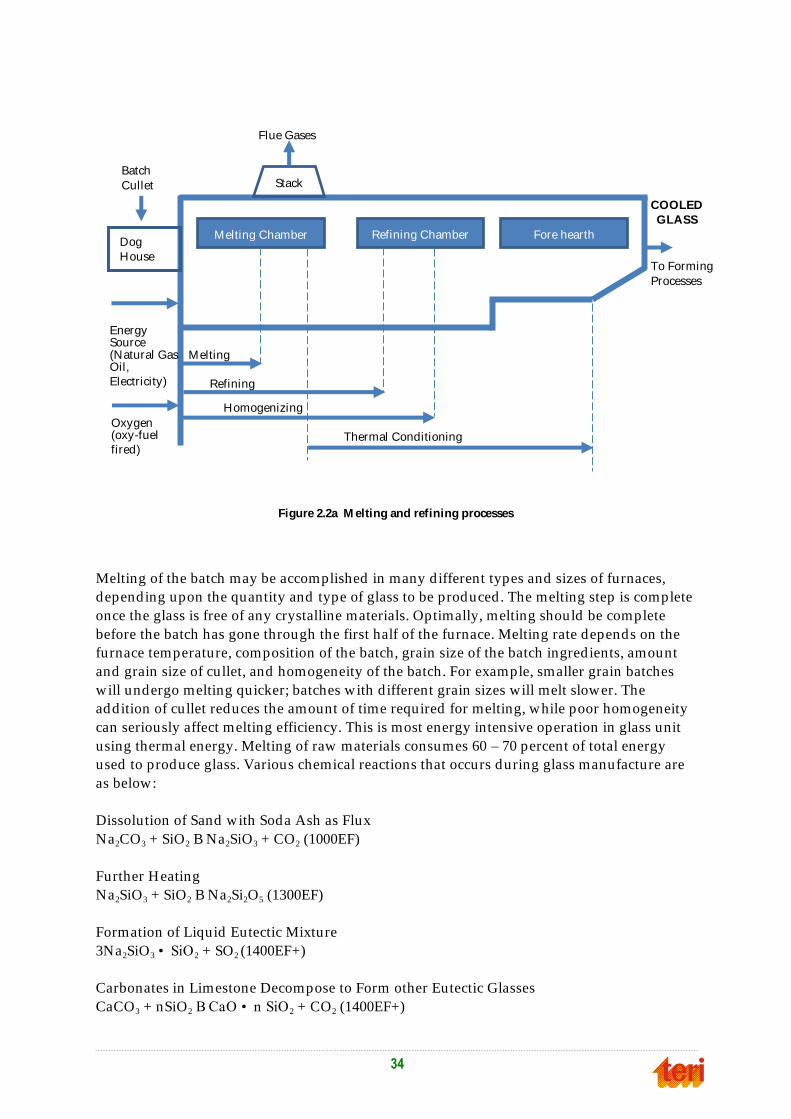
34
Melting of the batch may be accomplished in many d ifferent types and sizes of furnaces,
depending upon the quantity and type of glass to be produced. The melting step is complete
once the glass is free of any crystalline materials. Optimally, melting should be complete
before the batch has gone through the first half of the furnace. Melting rate depends on the
furnace temperature, composition of the batch, grain size of the batch ingredients, amount
and grain size of cullet, and homogeneity of the batch. For example, smaller grain batches
will undergo melting quicker; batches with d ifferent grain sizes will melt slower. The
addition of cullet reduces the amount of time required for melting, while poor homogeneity
can seriously affect melting efficiency. This is most energy intensive operation in glass unit
using thermal energy. Melting of raw materials consumes 60 – 70 percent of total energy
used to produce glass. Various chemical reactions that occurs during glass manufacture are
as below:
Dissolution of Sand with Soda Ash as Flux
Na2CO3 + SiO2 B Na2SiO3 + CO2 (1000EF)
Further Heating
Na2SiO3 + SiO2 B Na2Si2O5 (1300EF)
Formation of Liquid Eutectic Mixture
3Na2SiO3 • SiO2 + SO2 (1400EF+)
Carbonates in Limestone Decompose to Form other Eutectic Glasses
CaCO3 + nSiO2 B CaO • n SiO2 + CO2 (1400EF+)
Melting Chamber Refining Chamber Fore hearth
Thermal Conditioning
Energy Source (Natural Gas, Oil,
Electricity)
Homogenizing
Batch
Cullet
Refining
Melting
To Forming
Processes
COOLED
GLASS
Dog
House
Oxygen (oxy-fuel
fired)
Stack
Flue Gases
Figure 2.2a M elting and refining processes
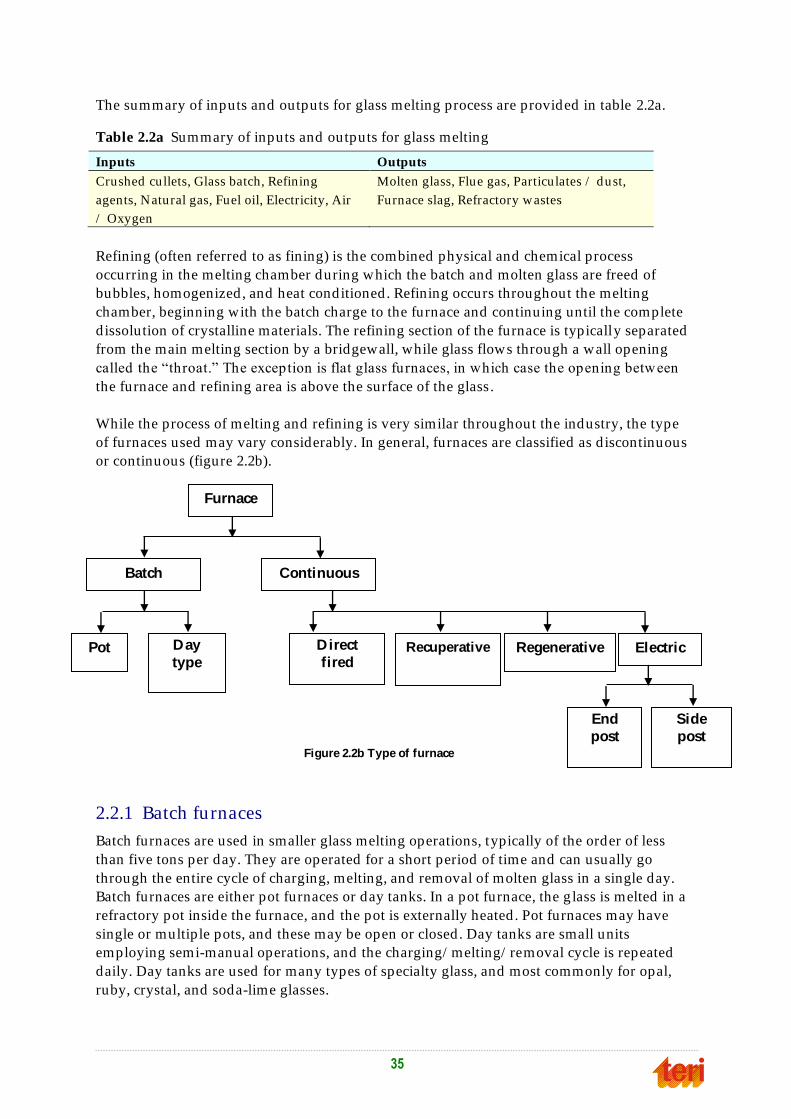
35
The summary of inputs and outputs for glass melting process are provided in table 2.2a.
Table 2.2a Summary of inputs and outputs for glass melting
Inputs Outputs
Crushed cullets, Glass batch, Refining
agents, Natural gas, Fuel oil, Electricity, Air
/ Oxygen
Molten glass, Flue gas, Particulates / dust,
Furnace slag, Refractory wastes
Refining (often referred to as fining) is the combined physical and chemical process
occurring in the melting chamber during which the batch and molten glass are freed of
bubbles, homogenized , and heat conditioned. Refining occurs throughout the melting
chamber, beginning with the batch charge to the furnace and continuing until the complete
d issolution of crystalline materials. The refining section of the furnace is typically separated
from the main melting section by a bridgewall, while glass flows through a wall opening
called the ―throat.‖ The exception is flat glass furnaces, in which case the opening between
the furnace and refining area is above the surface of the glass.
While the process of melting and refining is very similar throughout the industry, the type
of furnaces used may vary considerably. In general, furnaces are classified as d iscontinuous
or continuous (figure 2.2b).
2.2.1 Batch furnaces
Batch furnaces are used in smaller glass melting operations, typically of the order of less
than five tons per day. They are operated for a short period of time and can usually go
through the entire cycle of charging, melting, and removal of molten glass in a single day.
Batch furnaces are either pot furnaces or day tanks. In a pot furnace, the g lass is melted in a
refractory pot inside the furnace, and the pot is externally heated . Pot furnaces may have
single or multiple pots, and these may be open or closed . Day tanks are small units
employing semi-manual operations, and the charging/ melting/ removal cycle is repeated
daily. Day tanks are used for many types of specialty glass, and most commonly for opal,
ruby, crystal, and soda-lime glasses.
Furnace
Batch Continuous
Pot Day
type
Direct
fired Recuperative Regenerative Electric
End
post
Side
post Figure 2.2b Type of furnace
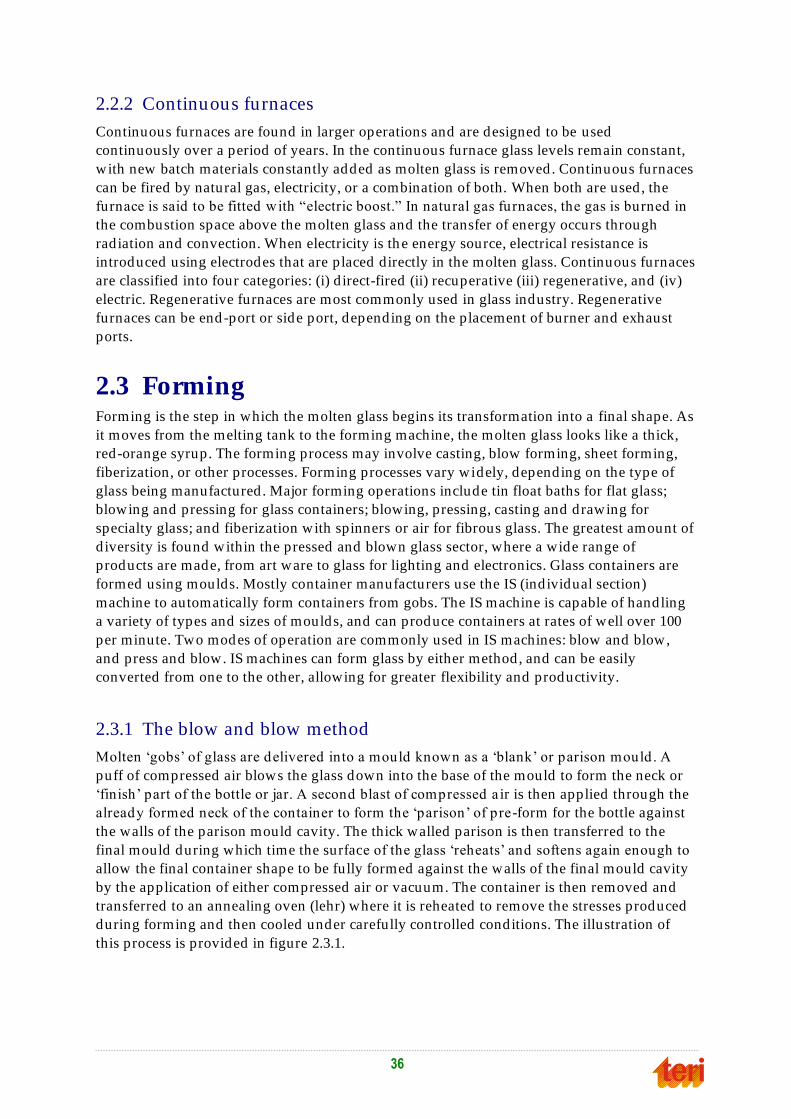
36
2.2.2 Continuous furnaces
Continuous furnaces are found in larger operations and are designed to be used
continuously over a period of years. In the continuous furnace glass levels remain constant,
with new batch materials constantly added as molten glass is removed. Continuous furnaces
can be fired by natural gas, electricity, or a combination of both. When both are used , the
furnace is said to be fitted with ―electric boost.‖ In natural gas furnaces, the gas is burned in
the combustion space above the molten glass and the transfer of energy occurs through
radiation and convection. When electricity is th e energy source, electrical resistance is
introduced using electrodes that are placed directly in the molten glass. Continuous furnaces
are classified into four categories: (i) d irect-fired (ii) recuperative (iii) regenerative, and (iv)
electric. Regenerative furnaces are most commonly used in glass industry. Regenerative
furnaces can be end -port or side port, depending on the placement of burner and exhaust
ports.
2.3 Forming Forming is the step in which the molten glass begins its transformation into a final shape. As
it moves from the melting tank to the forming machine, the molten glass looks like a thick,
red-orange syrup. The forming process may involve casting, blow forming, sheet forming,
fiberization, or other processes. Forming processes vary widely, depending on the type of
glass being manufactured . Major forming operations include tin float baths for flat glass;
blowing and pressing for glass containers; blowing, pressing, casting and drawing for
specialty glass; and fiberization with spinners or air for fibrous glass. The greatest amount of
d iversity is found within the pressed and blown glass sector, where a wide range of
products are made, from art ware to glass for lighting and electronics. Glass containers are
formed using moulds. Mostly container manufacturers use the IS (individual section)
machine to automatically form containers from gobs. The IS machine is capable of handling
a variety of types and sizes of moulds, and can produce containers at rates of well over 100
per minute. Two modes of operation are commonly used in IS machines: blow and blow,
and press and blow. IS machines can form glass by either method, and can be easily
converted from one to the other, allowing for greater flexibility and productivity.
2.3.1 The blow and blow method
Molten ‗gobs‘ of glass are delivered into a mould known as a ‗blank‘ or parison mould . A
puff of compressed air blows the glass down into the base of the mould to form the neck or
‗finish‘ part of the bottle or jar. A second blast of compressed a ir is then applied through the
already formed neck of the container to form the ‗parison‘ of pre-form for the bottle against
the walls of the parison mould cavity. The thick walled parison is then transferred to the
final mould during which time the surface of the glass ‗reheats‘ and softens again enough to
allow the final container shape to be fully formed against the walls of the final mould cavity
by the application of either compressed air or vacuum. The container is then removed and
transferred to an annealing oven (lehr) where it is reheated to remove the stresses produced
during forming and then cooled under carefully controlled conditions. The illustration of
this process is provided in figure 2.3.1.
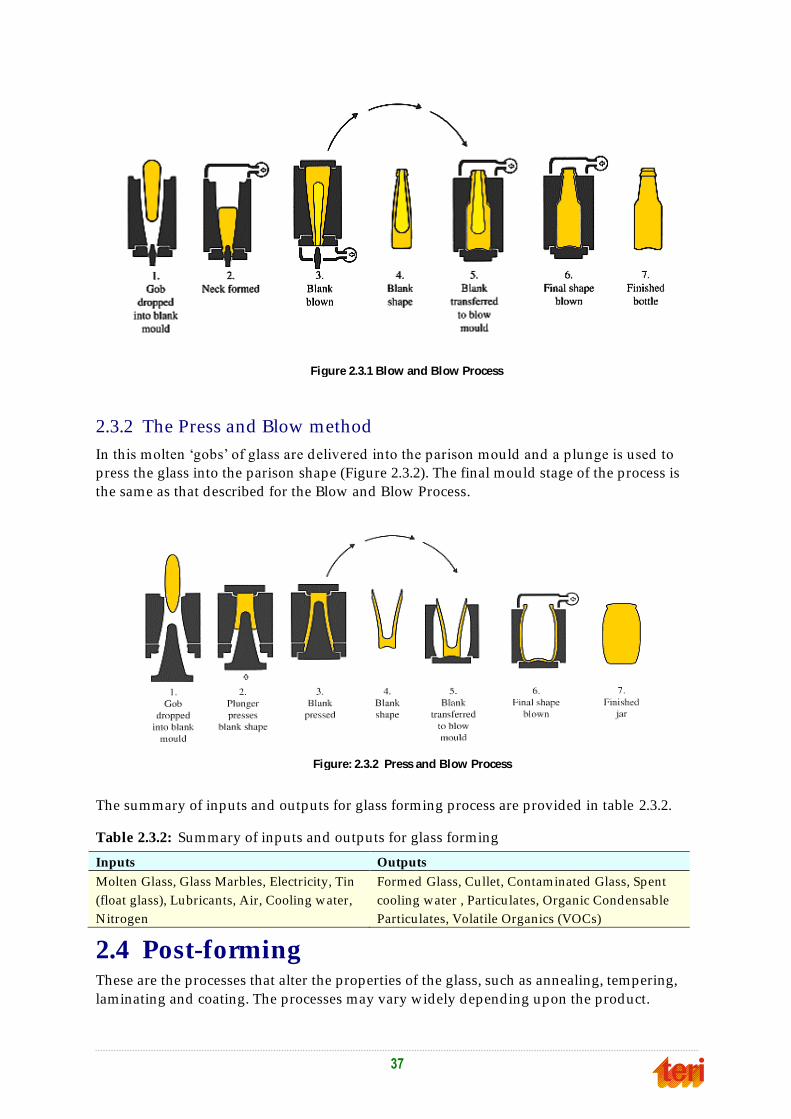
37
2.3.2 The Press and Blow method
In this molten ‗gobs‘ of glass are delivered into the parison mould and a plunge is used to
press the glass into the parison shape (Figure 2.3.2). The final mould stage of the process is
the same as that described for the Blow and Blow Process.
The summary of inputs and outputs for glass forming process are provided in table 2.3.2.
Table 2.3.2: Summary of inputs and outputs for glass forming
Inputs Outputs
Molten Glass, Glass Marbles, Electricity, Tin
(float glass), Lubricants, Air, Cooling water,
Nitrogen
Formed Glass, Cullet, Contaminated Glass, Spent
cooling water , Particu lates, Organic Condensable
Particulates, Volatile Organics (VOCs)
2.4 Post-forming These are the processes that alter the properties of the glass, such as annealing, tempering,
laminating and coating. The processes may vary widely depending upon the product.
Figure 2.3.1 Blow and Blow Process
Figure: 2.3.2 Press and Blow Process
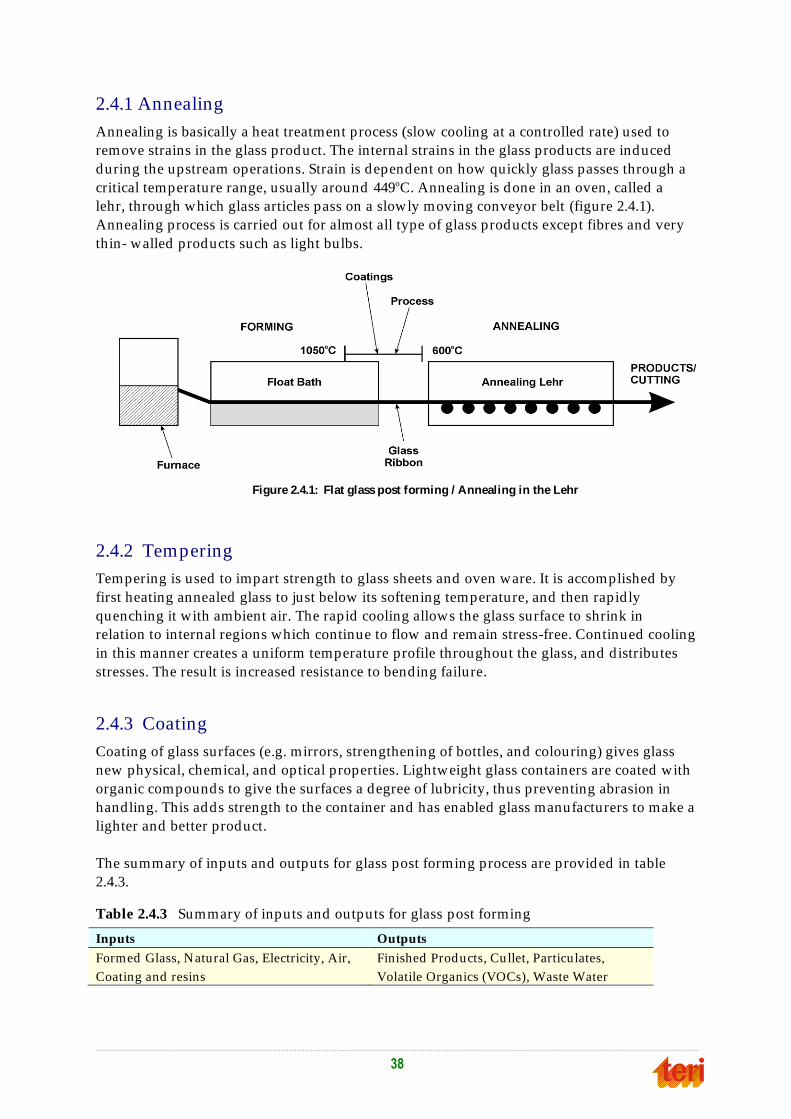
38
2.4.1 Annealing
Annealing is basically a heat treatment process (slow cooling at a controlled rate) used to
remove strains in the glass product. The internal strains in the glass products are induced
during the upstream operations. Strain is dependent on how quickly glass passes through a
critical temperature range, usually around 449oC. Annealing is done in an oven, called a
lehr, through which glass articles pass on a slowly moving conveyor belt (figure 2.4.1).
Annealing process is carried out for almost all type of glass products except fibres and very
thin- walled products such as light bulbs.
2.4.2 Tempering
Tempering is used to impart strength to glass sheets and oven ware. It is accomplished by
first heating annealed glass to just below its softening temperature, and then rapid ly
quenching it with ambient air. The rapid cooling allows the glass surface to shrink in
relation to internal regions which continue to flow and remain stress-free. Continued cooling
in this manner creates a uniform temperature profile throughout the glass, and d istributes
stresses. The result is increased resistance to bending failure.
2.4.3 Coating
Coating of glass surfaces (e.g. mirrors, strengthening of bottles, and colouring) gives glass
new physical, chemical, and optical properties. Lightweight glass containers are coated with
organic compounds to give the surfaces a degree of lubricity, thus preventing abrasion in
handling. This adds strength to the container and has enabled glass manufacturers to make a
lighter and better product.
The summary of inputs and outputs for glass post forming process are provided in table
2.4.3.
Table 2.4.3 Summary of inputs and outputs for glass post forming
Inputs Outputs
Formed Glass, Natural Gas, Electricity, Air,
Coating and resins
Finished Products, Cullet, Particulates,
Volatile Organics (VOCs), Waste Water
Figure 2.4.1: Flat glass post forming / Annealing in the Lehr
Related Documents