WORLD BANK TECHNICAL PAPER NUMBER 71 SECTORAL LIBRARY Reservoir Sedimentation WTP71 Impact, Extent, and Mitigation September 1987 K. Mahmood *396 *M25 FILE C .-. Public Disclosure Authorized Public Disclosure Authorized Public Disclosure Authorized Public Disclosure Authorized

Welcome message from author
This document is posted to help you gain knowledge. Please leave a comment to let me know what you think about it! Share it to your friends and learn new things together.
Transcript
WORLD BANK TECHNICAL PAPER NUMBER 71
SECTORAL LIBRARY
Reservoir Sedimentation WTP71
Impact, Extent, and Mitigation September 1987
K. Mahmood
*396
*M25 FILE C .-.
Pub
lic D
iscl
osur
e A
utho
rized
Pub
lic D
iscl
osur
e A
utho
rized
Pub
lic D
iscl
osur
e A
utho
rized
Pub
lic D
iscl
osur
e A
utho
rized

RECENT WORLD BANK TECHNICAL PAPERS
No. 20. Water Quality in Hydroelectric Projects: Considerations for Planning in TropicalForest Regions
No. 21. Industrial Restructuring: Issues and Experiences in Selected Developed Economies
No. 22. Energy Efficiency in the Steel Industry with Emphasis on Developing Countries
No. 23. The Twinning of Institutions: Its Use as a Technical Assistance Delivery System
No. 24. World Sulphur Survey
No. 25. Industrialization in Sub-Saharan Africa: Strategies and Performance(also in French, 25F)
No. 26. Small Enterprise Development: Economic Issues from African Experience(also in French, 26F)
No. 27. Farming Systems in Africa: The Great Lakes Highlands of Zaire, Rwanda, and Burundi(also in French, 27F)
No. 28. Technical Assistance and Aid Agency Staff: Alternative Techniques for GreaterEffectiveness
No. 29. Handpumps Testing and Development: Progress Report on Field and Laboratory Testing
No. 30. Recycling from Municipal Refuse: A State-of-the-Art Review and Annotated Bibliography
No. 31. Remanufacturing: The Experience of the United States and Implications forDeveloping Countries
No. 32. World Refinery Industry: Need for Restructuring
No. 33. Guidelines for Calculating Financial and Economic Rates of Return for DFC Projects(also in French, 33F, and Spanish, 33S)
No. 34. Energy Efficiency in the Pulp and Paper Industry with Emphasis on Developing Countries
No. 35. Potential for Energy Efficiency in the Fertilizer Industry
No. 36. Aguaculture: A Component of Low Cost Sanitation Technology
No. 37. Municipal Waste Processing in Europe: A Status Report on Selected Materialsand Energy Recovery Projects
No. 38. Bulk Shipping and Terminal Logistics
No. 39. Cocoa Production: Present Constraints and Priorities for Research
No. 40. Irrigation Design and Management: Experience in Thailand
No. 41. Fuel Peat in Developing Countries
No. 42. Administrative and Operational Procedures for Programs for Sites and Servicesand Area Upgrading
No. 43. Farming Systems Research: A Review
No. 44. Animal Health Services in Sub-Saharan Africa: Alternative Approaches
No. 45. The International Road Roughness Experiment: Establishing Correlation andand a Calibration Standard for Measurements
No. 46. Guidelines for Conducting and Calibrating Road Roughness Measurements
No. 47. Guidelines for Evaluating the Management Information Systems of Industrial Enterprises
No. 48. Handpumps Testing and Development: Proceedings of a Workshop in China
No. 49. Anaerobic Digestion: Principals and Practices for Biogas Systems
No. 50. Investment and Finance in Agricultural Service Cooperatives
(List continues on the inside back cover.)
TO
WORLD BANK TECHNICAL PAPER NUMBER 71
Reservoir SedimentationImpact, Extent, and Mitigation
K. Mahmood
The World BankWashington, D.C.
The International Bank for ReconstrLctionand Development IHE W\ORLD BANK
1818 H Street, N.WWashington, D.C. 20433, U.S.A.
All rights reservedManufactured in thc United States of AmericaFirst printing September 1987
Tcchnical Papers are not formal pLubLlicatiolns of thec World Bank. and af-C Cil cLlatedto encourage discussion and commenit antd to commullicate the results of thc Bank'swork quickly to the development community: citatioln and the use of these pap.er sshould take account of their provisional chiaracter. The findlings, interpretatiois, andconclusions expressed in this paper are entirely thosc of thc autJor(s and should notbe attributed in any maniner to the VVorld Bank. to its affiliated organizations, or tomembers of its Board of Execuitvxe Directors or the COUlnttries thCe r epresent. Any m.apsthat accompany thc text have been p.repal-red solely for- the' Colnvlniece 1of readers; thedesignations and presentation of material in themii do not im plV thc expressioll of allyopinion whatsoever oni the part of the WVorld Banik. its affiliates, or its Boardn or membercountries conceriiing the legal status of any) Country. territory, city, or alca or of theauthorities thereof or concerning the delimitation (f its b5ouni;daries or its nationalaffiliation.
Because of the informality and to present the results of research \ ith thc leastpossible delay, the typescript has not been prepared in accordance ith thc Proceduresappropriate to formal printed texts, and tile Worldi1 Bank accepts no) respionsibility forerrors. The publication is supplied at a token charlge to defray part of the cost ofmanufacture and distrib1utioll.
The most recent World Bank putblicationis are desciribed in the catalog 'fezvP'tiblications, a newv edition of which is issued in thle sprinig and fall of eacih year. Tlecomnplete backlist of publications is shown ill the annual h1lex1 oI'Plfbhaionwls. whichicontains an alphabetical title list and indexes of subiects, authors, anid Coulitries antdregions; it is of value principally to libiraries and institutiolnal purchasers. The latestedition of eacih of these is available free of charge fromii the Publications Sales Unit,Department F. The World Bank. 1818 H Street. N.W. Washington. D.C. 20433, U.S.A.,or from Publications, The World Bank, oo, aJVCnuvLe d'1na, 75 i 1o Paris, France.
K. Mahmood is Professor of Enginicering at The George Washington University,Washington, D.C., and a consultant to the World Bank.
Library of Congress Cataloging-in-Publication DataMahmood, H.
Reservoir sedimentation.
(World Bank technical paper, ISSN 0253-7494no. 71)
Bibliography: p.1. Reservoir sedimentation. 2. Water resources
development. I. Title. II. Series.TD396.M37 1987 628.1'32 87-23003ISBN 0-8213-0952-8

ABSTRACT
The role of storage reservoirs in water resource development is
described. It is pointed out that whereas the future demands will
require additions, the present capacity is being continually eroded
by siltation. It is estimated that on a world wide basis the
replacement cost of the capacity annually lost to siltation is
around $6 billion. The world picture of erosion and sediment yield
from drainage basins is reviewed to show that the world average
yield at ocean level is a modest 500 ppm, but large variations exist
and local values can be much higher due to natural conditions.
Human actions and natural events that further effect sediment yields
are illustrated with case histories. Physical phenomena related to
reservoir siltation are described to provide a basic understanding
of the problem. This is followed by a critical evaluation of
currently available predictive methods. Finally, a fairly complete
survey is presented of the design and operational strategies that
can be used to alleviate reservoir siltation. Important areas of
research and development are identified and it is recommended that
in view of the magnitude of this problem, a concerted effort should
be undertaken.
liii
ACKNOWLEDGEMENTS
This study has been sponsored by Agriculture and Rural
Department of the World Bank. It was partially supported by U.S.
National Science Foundation Research Grant No. CEE-8313603. The
writer expresses his deep appreciation to Guy LeMoigne, Irrigation
Advisor, the World Bank, for his encouragement during this study.
iv
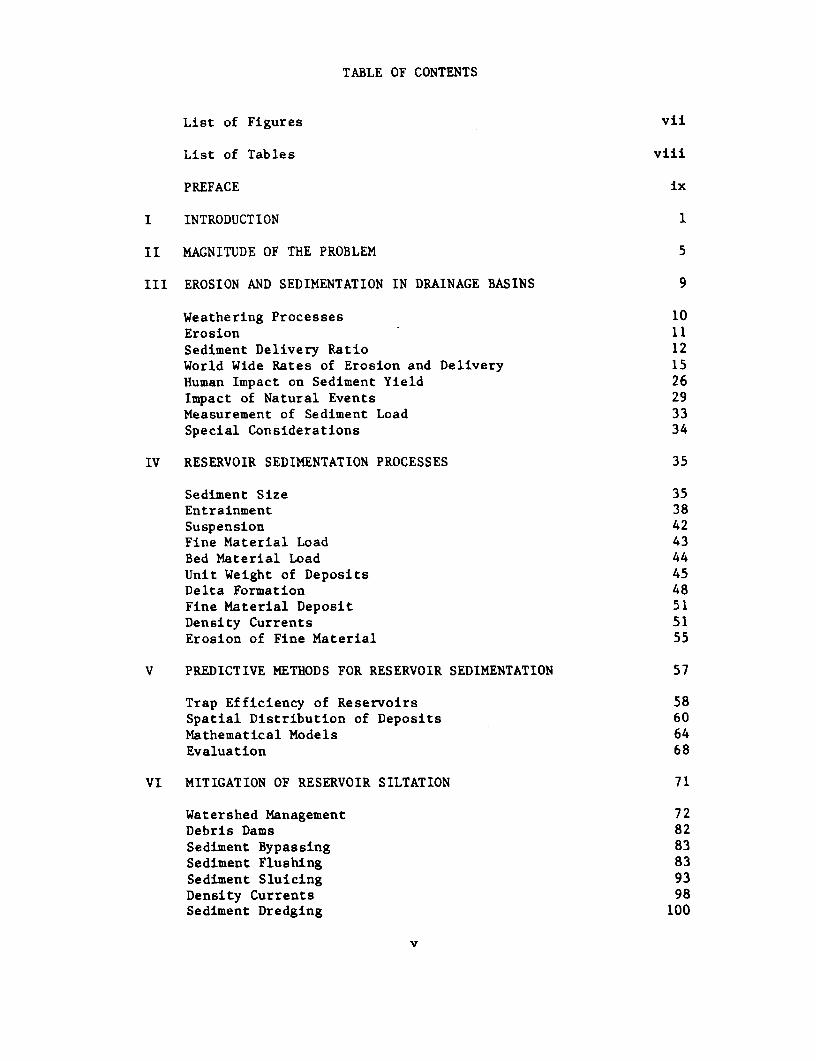
TABLE OF CONTENTS
List of Figures vii
List of Tables viii
PREFACE ix
I INTRODUCTION 1
II MAGNITUDE OF THE PROBLEM 5
III EROSION AND SEDIMENTATION IN DRAINAGE BASINS 9
Weathering Processes 10Erosion 11Sediment Delivery Ratio 12World Wide Rates of Erosion and Delivery 15Human Impact on Sediment Yield 26Impact of Natural Events 29Measurement of Sediment Load 33Special Considerations 34
IV RESERVOIR SEDIMENTATION PROCESSES 35
Sediment Size 35Entrainment 38Suspension 42Fine Material Load 43Bed Material Load 44Unit Weight of Deposits 45Delta Formation 48Fine Material Deposit 51Density Currents 51Erosion of Fine Material 55
V PREDICTIVE METHODS FOR RESERVOIR SEDIMENTATION 57
Trap Efficiency of Reservoirs 58Spatial Distribution of Deposits 60Mathematical Models 64Evaluation 68
VI MITIGATION OF RESERVOIR SILTATION 71
Watershed Management 72Debris Dams 82Sediment Bypassing 83Sediment Flushing 83Sediment Sluicing 93Density Currents 98Sediment Dredging 100
v
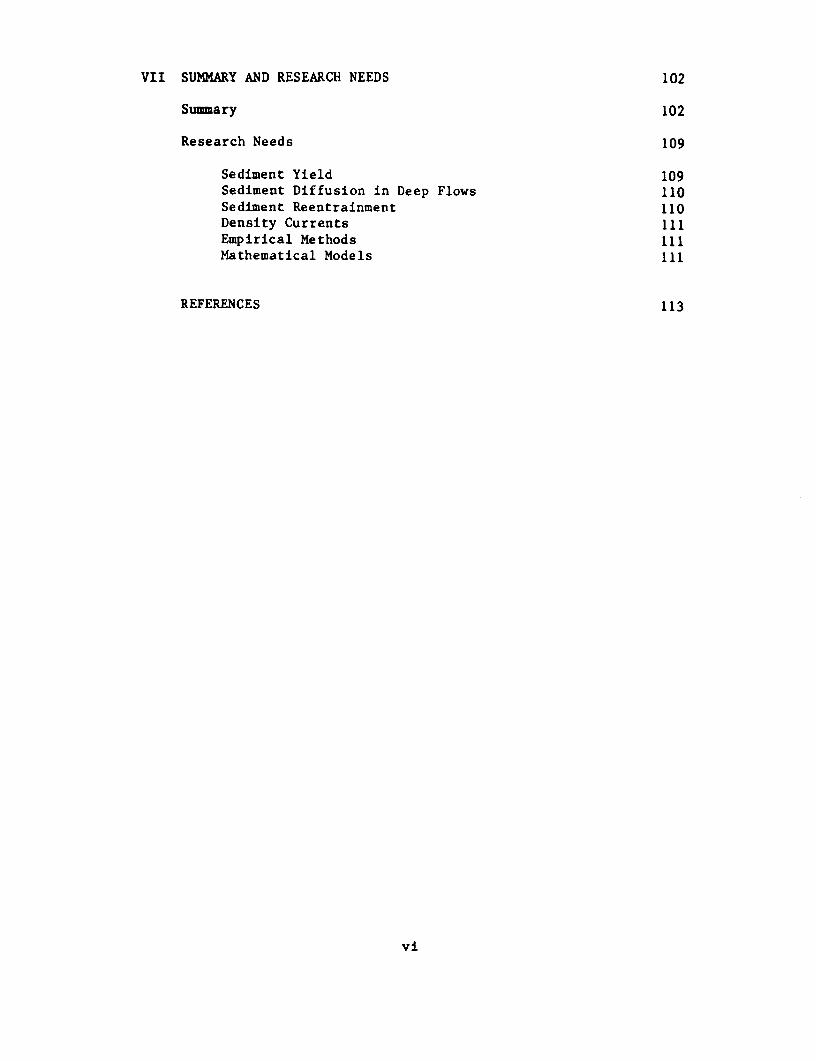
VII SUMMARY AND RESEARCH NEEDS 102
Summary 102
Research Needs 109
Sediment Yield 109Sediment Diffusion in Deep Flows 110Sediment Reentrainment 110Density Currents 111Empirical Methods 111Mathematical Models 111
REFERENCES 113
vi
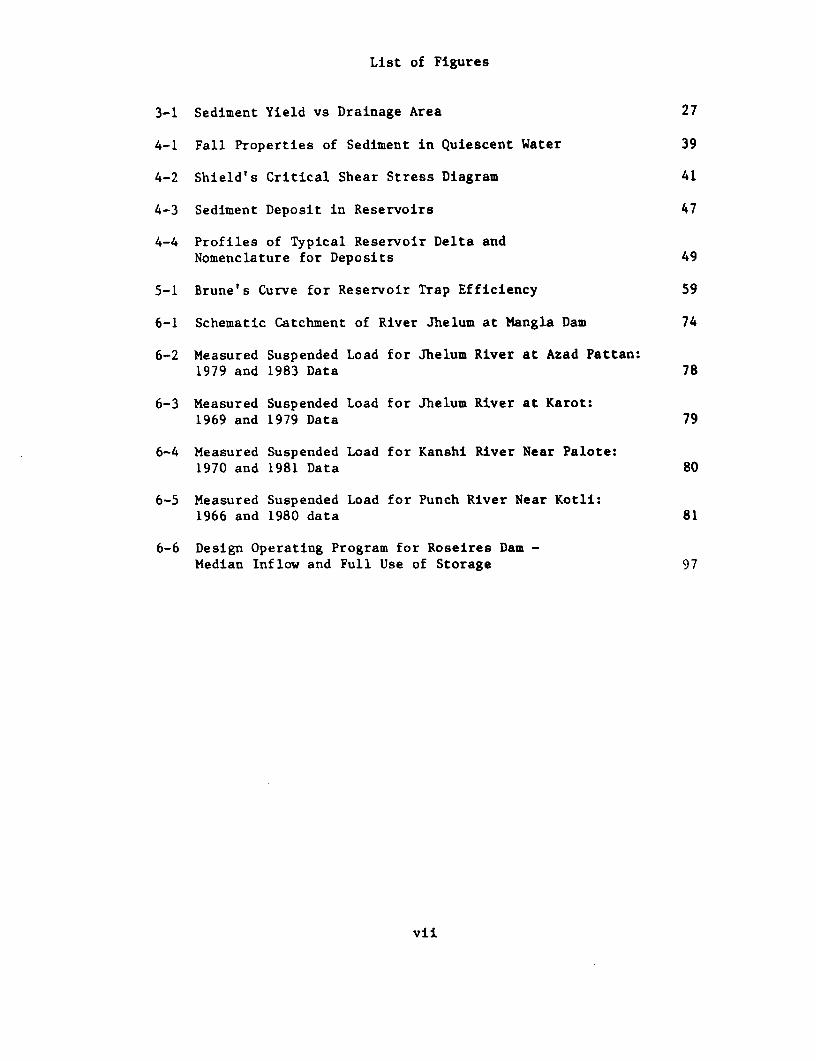
List of Figures
3-1 Sediment Yield vs Drainage Area 27
4-1 Fall Properties of Sediment in Quiescent Water 39
4-2 Shield's Critical Shear Stress Diagram 41
4-3 Sediment Deposit in Reservoirs 47
4-4 Profiles of Typical Reservoir Delta andNomenclature for Deposits 49
5-1 Brune's Curve for Reservoir Trap Efficiency 59
6-1 Schematic Catchment of River Jhelum at Mangla Dam 74
6-2 Measured Suspended Load for Jhelum River at Azad Pattan:1979 and 1983 Data 78
6-3 Measured Suspended Load for Jhelum River at Karot:1969 and 1979 Data 79
6-4 Measured Suspended Load for Kanshi River Near Palote:1970 and 1981 Data 80
6-5 Measured Suspended Load for Punch River Near Kotli:1966 and 1980 data 81
6-6 Design Operating Program for Roseires Dam -Median Inflow and Full Use of Storage 97
vii
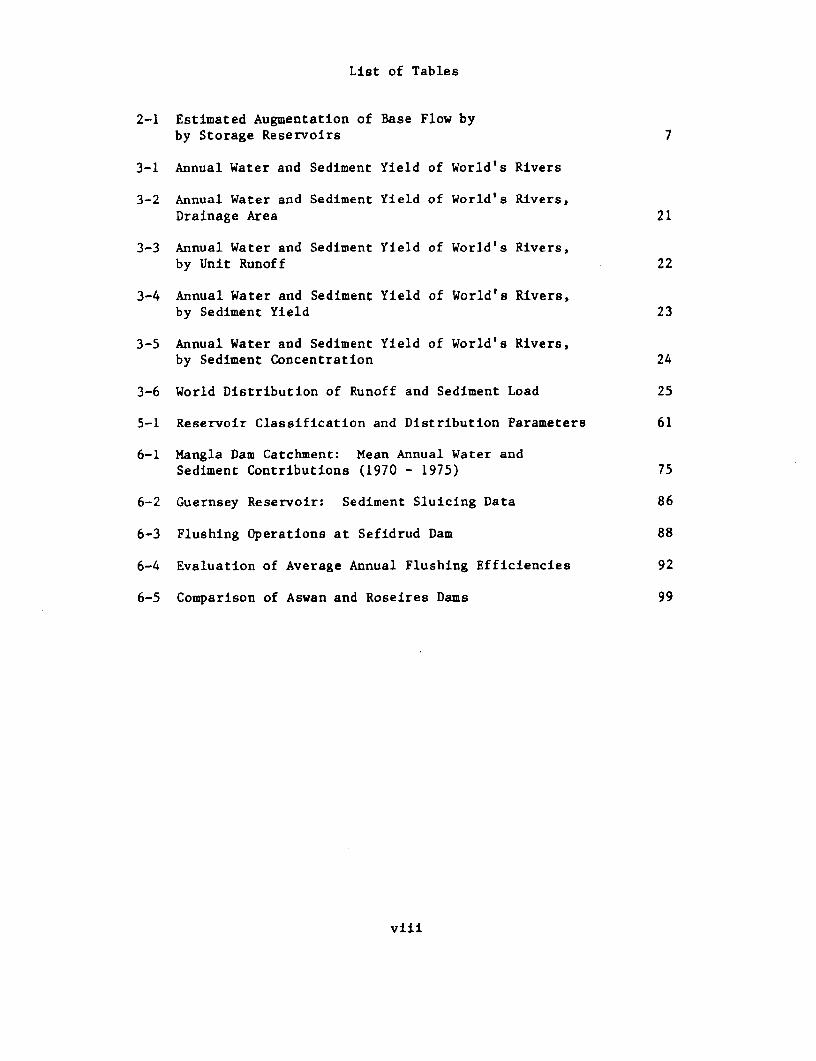
List of Tables
2-1 Estimated Augmentation of Base Flow byby Storage Reservoirs 7
3-1 Annual Water and Sediment Yield of World's Rivers
3-2 Annual Water and Sediment Yield of World's Rivers,Drainage Area 21
3-3 Annual Water and Sediment Yield of World's Rivers,by Unit Runoff 22
3-4 Annual Water and Sediment Yield of World's Rivers,by Sediment Yield 23
3-5 Annual Water and Sediment Yield of World's Rivers,by Sediment Concentration 24
3-6 World Distribution of Runoff and Sediment Load 25
5-1 Reservoir Classification and Distribution Parameters 61
6-1 Mangla Dam Catchment: Mean Annual Water andSediment Contributions (1970 - 1975) 75
6-2 Guernsey Reservoir: Sediment Sluicing Data 86
6-3 Flushing Operations at Sefidrud Dam 88
6-4 Evaluation of Average Annual Flushing Efficiencies 92
6-5 Comparison of Aswan and Roseires Dams 99
viii
PREFACE
This monograph deals with reservoir sedimentation--a subject of
considerable import to the development of water resources in the
world. Storage reservoirs are the primary line of defense against
the vagaries of hydrological cycle. They protect against floods,
as well as droughts. Add to this, the hydro-power, recreation, and
navigation benefits of dams, and they emerge as the single most
important structural factor in the world development. The present
worth of all the dams in the world may well approach $600 billion.
It is only prudent to evaluate their life against the insidious
encroachment by sediment.
The average age of man made storage reservoirs in the world is
estimated to be around 22 years. The loss of capacity due to silta-
tion is already being felt at a number of structures. It is entire-
ly possible that, unless ingenious solutions are developed, we will
lose the struggle to enhance the available water resources.
Professor Mahmood has used his considerable experience in water
resource and sedimentation engineering to develop a comprehensive
and readable expose that can be easily followed by an interested and
well informed non-specialist. His report should also help clear
some of the commonly held misconceptions about reservoir sedimenta-
tion problems.
ix

It is evident that the problem of reservoir sedimentation can
be solved, at least to an extent, and that it will require greater
consideration in the existing and future projects. With the $6
billion estimated annual loss there is sufficient incentive to start
a concerted research and development effort in this field.
I wish to join the author in expressing our gratitude to many
colleagues in the Bank who generously gave their time and wisdom to
critically review the initial draft and made many valuable sugges-
tions. I believe this monograph will be useful to development
professionals around the world.
G. Edward Schuh
Director, Agriculture and
Rural Development Department
x
CHAPTER I
INTRODUCTION
Geological erosion is a part of drainage process. Erosion
starts with the weathering of parent rock and ends with the deposit
of eroded material in the delta. Sediment load, the clastic parti-
cles transported by streams is a concomitant part of surface water
resources. It can be both an asset and a liability. In the context
of storage reservoirs, it is a multifaceted liability.
Dams have been built for at least 5,000 years (Jansen, 1980)
and, their functions have evolved with the developing needs of
society. Most likely, the earliest dams were built to store water
for domestic and agricultural water supply. With the onset of
industrial era, hydro-power became a major reason for building dams.
Presently, dams are built to serve many other functions, such as,
flood control, navigation and recreation.
In all reservoirs created by dams, the volume of storage is a
critical determinant of their efficacy. Excepting the low head
irrigation dams--more appropriately called barrages, the utility of
a reservoir diminishes as its storage capacity is reduced.
The downstream movement of a stream's sediment load is inter-
rupted by reservoirs. Dams create potential energy by locally
reducing the energy consumption of a stream flow. Smaller velo-
cities upstream result in saving frictional head loss which is then
concentrated as potential energy at the dam. The smaller veloci-
ties also mean that the sediment transport capacity within the
reservoir is substantially reduced, if not altogether lost. The
incoming sediment load starts depositing as soon as the stream
enters the reservoir. From that point, the deposit extends both
1

upstream and downstream.
The upstream deposits are called "backwater deposits" in refer-
ence to the causative hydraulic phenomenon. The deposits within the
reservoir are called "delta", "overbank" and "bottom-set beds" in
accordance with their shape and location. The delta constitutes
deposit of coarse material that is the first to drop out and bottom-
set beds are fine sediments that may be transported farther down-
stream by density currents or otherwise. Overbank deposits comprise
sediment that has settled over the former high bank or valley
slopes. Engineering consequences of backwater and reservoir deposits
are somewhat different. By raising the bed level of channel up-
stream of reservoir limit, backwater deposits create problems of
flooding, waterlogging and non-beneficial use of water by phreato-
phytes. The physical impact of in-reservoir deposits is to reduce
the volume of storage available for water.
As the sediment deposits approach the dam, they are released,
to an extent, with the flow passing through outlet works and power
turbines. Here, the sediment has another harmful effect. It abrades
the structures it passes through.
There are other impacts related to dams. On the upstream side,
the thermal regime of flow is changed so that the impounded water
may become anaerobic or it may become hostile to the wildlife pre-
viously supported by the river. On the downstream side, the flow
tends to pick up the sediment load from the stream bed leading to
retrogression of channel bed and water level, erosion of banks,
elimination of nutrients carried by the fine sediments, deteriora-
tion of channel morphology, increase in the hydraulic resistance of
flow, elimination of oxbow lakes and reduction of wildlife food
supply.
2
This monograph is concerned with the depletion of reservoir
storage by sediment deposits. Its purpose is to provide a compre-
hensive review of the reservoir sedimentation problem; its asso-
ciated processes, and the methods available to predict and control
the loss of storage. It is addressed to engineers and planners
involved in the planning, design and operation of storage reser-
voirs. Environmental impacts of storage reservoirs, other than
those presented herein, are discussed in Goodland (1985). Physical
impacts of dams on the downstream river channel are covered in
Williams and Wolman (1984) and Harrison and Mellema (1982).
Chapter II starts with an assessment of the problem and its
economic implications. Physical concepts of erosion and sedimenta-
tion related to drainage basins are introduced in Chapter III. This
chapter contains considerable discussion of sediment production and
transport out of drainage basins. Current estimates of sediment
load in some 62 basins from around the world are presented, more to
indicate geographic distribution of problem and to define range of
sediment loads that may be expected. Man's impact on sediment load
in rivers and the role played by infrequent natural events like
floods, hurricanes and earthquakes are also described. Finally,
some special conditions relating to the measurement of sediment load
in rivers, that must be carried out to provide design information,
are briefly discussed. Chapter IV deals with important properties
of sediment particles and sedimentation processes within the reser-
voirs. These are: particle size, critical conditions of entrain-
ment, delta formation, bottom-set deposits and density currents.
State-of-the-art methods for predicting the sedimentation aspects of
design are presented in Chapter V. Chapter VI deals with the ulti-
mate question of what can be done to mitigate the impact of sedimen-
tation on reservoir life. Three categories of methods which are
available to combat reservoir sedimentation--from watershed manage-
ment to dredging, are discussed in regard to their scope and limita-
tions. Case histories are used in support of their evaluation.
3

Chapter VII summarizes the main conclusions and makes recommenda-
tions for future research and development studies which are needed.
It is emphasized that the economic cost of reservoir sedimentation
in the world is large and that it will worsen in the future, so that
vigorous research on this problem is urgently needed.
4

CHAPTER II
MAGNITUDE OF THE PROBLEM
In regard to their temporal distribution, surface water
resources can be divided into two classes: base flow and direct
runoff. Base flow is the minimum available over a yearly cycle and
the direct runoff is the fluctuating component which is only availa-
ble during a part of the year. The base flow comes from the ground-
water and due to its assuredness is the most valuable component.
One of the principal aims of water resource development is to aug-
ment the base flow at a site. This can be economically and relia-
bly achieved by temporarily storing the direct runoff in man-made
reservoirs.
In its natural state, the base flow constitutes about 36
percent of the world-wide surface runoff and dams have been histor-
ically built by man to regulate direct runoff into base flow. There
are, of course, other benefits associated with flow regulation. For
example, the magnitude of flood peak is reduced and the potential
energy created by water impoundment can be used to generate power.
According to a 1974 world estimate (UNESCO, 1978 - Table 8),
the volume of all storage reservoirs with gross capacities of 5 km3
and above, amounts to 4,050 km3. This includes the projects then
under construction, which are assumed to be complete at this
time(1986). Another 20 percent storage is estimated to lie in smal-
ler reservoirs so that the gross volume of storage in the world is
around 4,900 km3 which is roughly 13 percent of total annual runoff.
In the present context, gross capacity of a storage reservoir can be
broadly divided into the usable and non-usable components. The
latter is not available for base flow augmentation due to physical
or regulatory constraints or due to its prior allocation to other
5

uses such as flood control. Usable storage is the storage volume
used to retain direct runoff for later release. The ratio of usable
to gross capacity of reservoirs varies in different geographical
regions between 38 to 59 percent with a storage weighted world
average of around 50 percent. The usable capacity is nearly used
once every year. Using a conservative estimate of base runoff
augmentation equal to 40 percent of gross capacity, the net
augmentation of world's base flow by storage reservoirs is estimated
to be about 16 percent. See Table 2-1.
Beginning with the 1950's, construction of large reservoirs has
experienced a major growth in the world. In fact, all of the reser-
voirs with a capacity over 50 km3 were constructed after 1950.
During the two decades of 50's and 60's, the gross storage capacity
in the world increased by 25 time (UNESCO, 1978). In the two-year
period, 1966-68 alone, about 375 km3 of storage were added to the
world total (Mermal, 1970). Accelerated construction of reservoirs
around the world is continuing and it is likely to do so in the
future. Most scenarios of future developments in water resources
agree that ultimately, say, by the mid-twenty-first century, all of
the direct surface runoff must be stored by reservoirs or other
methods. L'vovich (1979) estimates that by the turn of this century
the usable storage will have to increase about 2.5-fold.
All reservoirs trap a part of sediment load transported by
incoming flows and, therefore, experience a continual reduction of
storage volume. The time rate of siltation in a reservoir varies
with its design and the magnitude of sediment load. Hoover Dam,
since its closure in 1935, has been losing gross capacity at an
average rate of 0.3 percent per year. On the other hand, in Tarbela
Dam, the average siltation rate is 1.5 percent per year, and that in
Sanmexia Reservoir (China) is about 1.7 percent per year. There
have been some notably high rates of siltation at other sites. The
76 m high Warsak Dam on Kabul River (Pakistan) lost 18 percent of
6

Table 2-1
ESTIMATED AUGMENTATION OF BASE FLOW BY STORAGE RESERVOIRS
Geographic Annual Runoff Gross Reservoir Capacity Augmentation ofArea Volume Base Flow
Total Natural Volume % of x of total Volume % ofBase World Runoff NaturalFlow Base Flow
(km3) (km3) (km3) (km3)
North America 5,950 1,900 975 20.0 16.4 390 23.1
Asia 13,190 3,440 1,770 36.3 13.4 710 23.2
Africa 4,225 1,500 1,280 26.2 30.3 510 38.7
So. America 10,380 3,740 340 7.0 3.3 140 4.0
Europe 3,100 1,125 450 9.2 14.5 180 17.8
Australia 1,965 465 65 1.3 3.3 30 6.5
World 38,810 12,170 4,880 100.0 12.6 1,960 16.1
Notes: 1. Annual runoff and base flow volumes after L'vovich (1979)
2. Gross capacity of all reservoirs in a region is estimatedas 1.20 times capacity of reservoirs above 5 km3
3. Base flow augmentation based on 40 percent of gross capacity
4. Australia includes Tasmania, New Guinea and New Zealand
5. All figures rounded off and approximate
7

its storage volume in the very first year's operation.
World-wide data on the siltation of reservoirs is not avail-
able. It can be roughly estimated to be around 1 percent of the
gross capacity per year. That is, on the global scale about 50 km3
of capacity is being lost to sediment every year. The immediate
implication of this loss is that the world capacity to augment base
flow is being continuously eroded and that it must be replaced
before any improvement can be made in the available water resources.
A part of the non-usable storage in reservoirs is specifically
allocated to sediment storage. Generally, it lies below the eleva-
tion to which water can be drawn by gravity and it is then called
the dead storage. The life of a storage is commonly, but erroneous-
ly, estimated as the volume of dead storage divided by the expected
mean annual volume of sediment deposits. As explained in Chapter
IV, such extrapolations are not valid. Reservoir sedimentation
patterns are such that the usable capacity starts diminishing before
all of the non-usable component is filled up with sediment.
On the basis of 1974 data on major world dams (capacity above 5
km3, UNESCO, 1978) used with some extrapolations, the capacity
weighted average age of world storages is presently (1986) estimated
to be about 22 years. Total loss of usable capacity of world reser-
voirs to date is, thus, estimated to be around 540 km3 with a
resulting loss of base flow augmentation of around 220 km3. This
means that, around 1,100 km3 of gross capacity have to be added at
the present time to replace what has been lost so far. The cost of
this replacement, at a modest rate of about $120 million per kmi3, is
$130 billion. This is equivalent to an annual loss of $6 billion in
replacement costs alone. In many basins, additional sites are hard
to find, and in general, remaining sites for storage reservoirs are
more difficult and, hence, more expensive to develop. This is the
magnitude of reservoir sedimentation problem in the world.
8

CHAPTER III
EROSION AND SEDIMENTATION IN DRAINAGE BASINS
Genesis of solid load in rivers lies in weathering of parent
rock by chemical, mechanical and chemico-biological processes. Two
different types of material result from weathering - the solution of
mineral components and a crust of weathering. The former, appears
as the dissolved solid content of river flow; is flushed almost
continuously through the system and is largely irrelevant to the
present context. Clastic sediment - our main concern in storage
reservoirs, undergoes a series of mechanical processes like erosion,
entrainment, transportation and deposition in its journey from the
crust to the continental shelf and beyond. These processes are
discontinuous and a sediment particle takes a series of transport
and deposit steps. The latter sometimes being of the order of
centuries.
Variables operative in weathering processes and those in
subsequent mobilization by a transport agent - chiefly water, are
theoretically independent, so that, sediment load at any location in
a drainage basin may be limited by one set of processes or the
other. Certain correlations, however, exist within the climatic
variables and, they create a zonal pattern of sediment load in the
world rivers. These processes and zonal estimates are the subject
of this chapter. The purpose is to present a global picture of
sediment load distribution in rivers including a discussion of man-
made and natural factors, that may result in major deviations from
otherwise well established patterns.
9
Weathering Processes
Weathering processes are classified as mechanical or chemical,
depending on the dominance of forces that break up the parent rock.
Mechanical processes imply disintegration by forces which overcome
internal strength of rock such as in its shearing by glacier
movement or the break up by freezing of water in the pores. The
chemical processes are more complex. They start with the solution of
easily dissolved salts under an alkaline environment followed by an
acidic phase when the poorly soluble compounds also begin to
migrate. Both processes are strongly dependent on climatic factors -
availability of water, its phase and atmospheric temperature. When
water is available in liquid phase and average annual temperatures
are above 100 C, the chemical processes are dominant. When water is
absent in liquid phase, as in arid to semi-arid, or glacial zones,
the mechanical processes govern.
Strakhov (1967), has used the above line of reasoning to
classify weathering into Humid, Arid and Glacial types. He
estimates that the chemical weathering is most active in the Tropics
- average annual temperatures of 24-26 degrees Centigrade and 1,200-
3,000 mm rainfall, whereas, its rate in the temperate zones is only
2-5 percent of that in the Tropics. In arid zones, the temperature
regime is favorable, but, water is scarce and organic matter is
sparse so that chemical weathering becomes insignificant. Within
each zone of weathering, other climatic and geologic factors, also,
have important influences. For example, precipitation occurring
only as episodic thunderstorms means that vegetal cover in the basin
will be sparse and, hence, there will be a diminution of organic
matter and chemical weathering. Among the geologic factors,
tectonics is most important: with tectonic movements, mechanical
weathering will be enhanced. With rapid movements, however,
weathering crust does not develop.
10
Erosion
Erosion is defined as the detachment and removal of rock
particles by water or by wind. The former is by far the most
important agent. Weathering prepares the parent rock for erosion
and rainfall acts as the chief agent for erosion. The combined
effect of weathering and erosion is called mechanical denudation.
The rate of mechanical denudation is measured in terms of the weight
of clastic material removed per unit area and time, e.g.,
tons/km2/yr or as the average thickness of crust layer removed over
a unit time, e.g., meters/1,OOO yr. When spatially applied over
drainage basins, mechanical denudation is also measured by sediment
yield which is defined as the mass rate of sediment outflow at a
cross section of reference (e.g., as tons/km2/yr).
Rate of mechanical denudation increases with all of the factors
that add to the erosive power of rainfall such as higher relief,
more intense rainfall and sparseness of vegetal cover. For this
reason, within a homogeneous zone of weathering and relief, it has
been possible to express sediment yield as the sole function of mean
annual rainfall and temperature (Schumm, 1977). At low values of
rainfall, the surface runoff is not enough to carry away the
available material and beyond an optimal amount of rainfall, vegetal
cover is well established to reduce the rate of erosion. Higher
annual temperatures result in larger evapotranspiration losses so
that a comparatively larger amount of rain is needed to produce the
same density of vegetation and protection against erosion. Thus, in
homogeneous zones of weathering, a maxima of sediment yield occurs
at an intermediate amount of annual rain which is an increasing
function of temperature.
11
Sediment Delivery Ratio
Removal of a detached sediment particle from its location
occurs by its entrainment and transport by water. Not all of the
detached particles are transported out of a basin. A majority is
deposited on the slopes, bottom of slopes, in the channels and on
the flood plains. The percentage of on-site eroded sediment per unit
of basin area that is transported to a given downstream location is
called: Sediment Delivery Ratio, D. It depends on the size and
texture of eroded particles, relief and more importantly, on the
areas of sediment storage available within the basin. For small
basins, say of 0.002 km2 area, the delivery ratio is generally
assumed to be 100 percent. For larger basins, it is assumed to vary
as
bD - a / A (3.1)
where a - constant, A - basin area and, b varies from 1/4 to 1/8.
Values of D have been investigated up to basin areas of around 1,000
km2.
Various attempts have been made in the past to express D as a
power function of basin area and its morphometric parameters (e.g.,
Roehl, 1962). In view of the current knowledge on sediment storage
within a drainage basin, these empirical relations must be
considered site-specific, approximate and trend-indicative only.
Also, there is evidence that the exponent b in Eq. (3.1) may,indeed,
be an increasing function of A itself, so that, for basins of 10,000
kM2 and larger, the overall value of D may be much smaller than that
indicated above. At the present state-of-the-art, it is not
possible to predict values of D for large basins. These values, the
details of sediment storage in a basin and its subsequent movement
can only come through a long and difficult set of sedimentation
measurements.
12
A number of studies have been made to measure short and long-
term storage of sediment in river channels [e.g., Emmett and Leopold
(1963), Foley and Sharp (1976), Emmett, et al (1980) and Meade, et
al (1985)]. Similar studies at the level of drainage basins are,
however, rare. A river channel has a largely confined domain. The
drainage basin, on the other hand, presents a diffused sedimentation
environment and is orders of magnitude more difficult to study.
Trimble (1983) has analyzed sediment balance data over 120
years period on 360 km2 Coon Creek basin in Wisconsin. Over the
first 85 years of the study period, accelerated erosion caused by
forest clearing and agriculture, contributed about 2,080 t/km2/yr of
which 36% were retained on the hill slope, about 59% were stored in
the valley and only about 5% (116t/km2/yr) appeared at the mouth.
During the next 37 years: the rate of erosion declined to
1,640t/km2/yr due to improved land management practice; the rate of
hill slope storage increased to account for 56 percent of supply;
that in the valley storage declined to 38 percent and the outflow
increased to 7 percent (llOt/km2/yr). Sediment delivery ratio in
these data corresponds to an index of around 1/4 in Eq. (3.1), which
is somewhat on the higher side and is probably caused by the ongoing
saturation of sediment sinks within the basin. Hillslope and valley
storage processes are dominant in these data. Even in this rela-
tively small basin, the sediment yield at the mouth remains unalter-
ed (in absolute terms) after 37 years of erosion control that
reduced the rate of on-site erosion by more than 20 percent. In
larger basin, the role of valley storage is expected to be larger.
Space and time variations of on-site erosion are largely
dampened by storage within the basin which occurs wherever the
transport capacity of flow declines. A drainage basin acts as a low
pass filter between the on-site erosion and sediment yield. The
strength of filter is related to factors that effect hydraulics of
flow and sediment transport capacity such as, morphometry of the
13
basin, topology of the drainage network, morphology of the channels,
and behavioral size of particles constituting the sediment load.
Drainage basins also exert a strong sorting of the particle size of
sediment load. The average size of sediment particles at the mouth
of a basin will be smaller than that of the eroded material. As
shown by Rana, et al. (1973), sediment sorting occurs even in
confined channel flows.
Coon Creek data also show that sediment sinks within a basin
are more effective when the basin is first disturbed. The sinks,
ultimately, tend to become sources as they are saturated, although
most of the sediment trapped within a basin may never reappear at
its mouth. Stream channels play a dual role in sediment delivery.
Streambank erosion constitutes a significant source of sediment
supply, [e.g., Missouri-Mississippi System, (Robbins, 1976) and
Sacramento River,(Sing, 1986)] and to a large extent, the sediment
delivery from a basin is controlled by the transport capacity of the
channels. In the case of large storage reservoirs that trap nearly
all of the incoming sediment load, stream channel erosion is the
only source, other than the tributary inflows, for the sediment load
that appears in the downstream flow.
In general, as the flow progresses along a drainage basin, it
increases in volumetric rate, but declines in its sediment
concentration and sediment particle size at a rate which is
proportional to a small power of the drainage area. Some notable
exceptions to this general pattern exist. The sediment load in
Yellow River dramatically increases from a small fraction to about
1.5 billion tons/year as the river passes through the loess region
some 350 km from its source, (Milliman and Meade, 1983). The
mechanics of sediment storage and pick up within the drainage basin
are well understood, but the results have not been adequately
quantified.
14
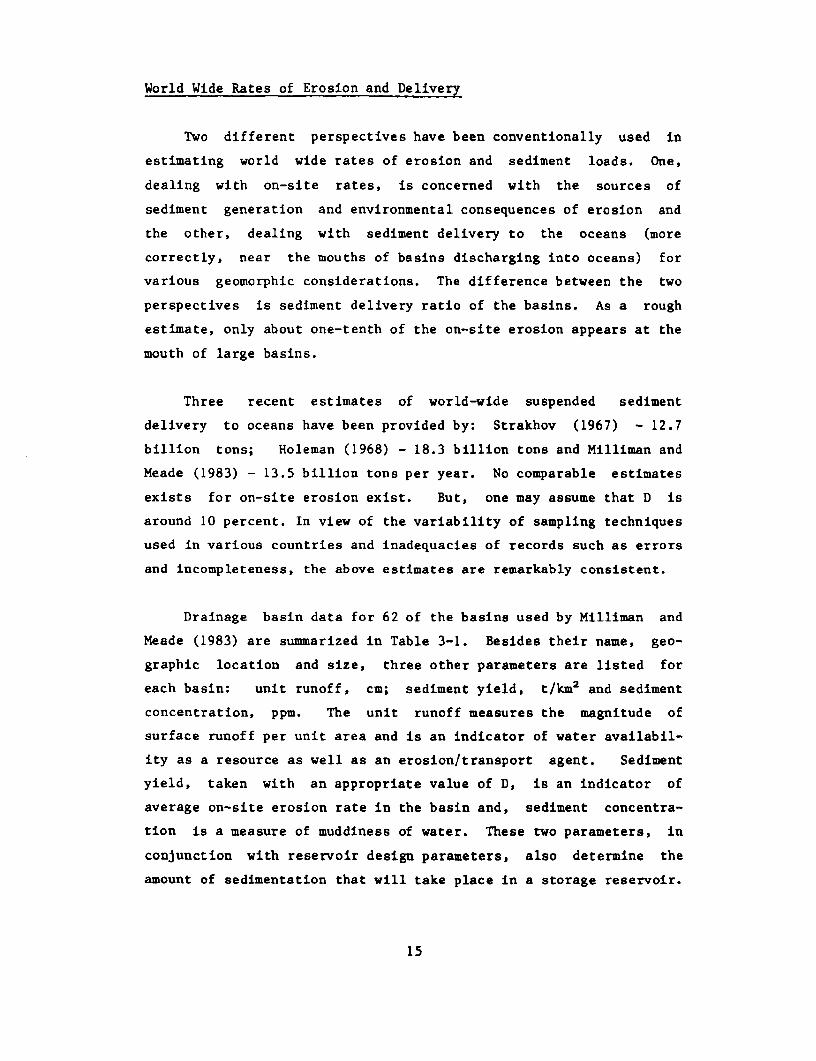
World Wide Rates of Erosion and Delivery
Two different perspectives have been conventionally used in
estimating world wide rates of erosion and sediment loads. One,
dealing with on-site rates, is concerned with the sources of
sediment generation and environmental consequences of erosion and
the other, dealing with sediment delivery to the oceans (more
correctly, near the mouths of basins discharging into oceans) for
various geomorphic considerations. The difference between the two
perspectives is sediment delivery ratio of the basins. As a rough
estimate, only about one-tenth of the on-site erosion appears at the
mouth of large basins.
Three recent estimates of world-wide suspended sediment
delivery to oceans have been provided by: Strakhov (1967) - 12.7
billion tons; Holeman (1968) - 18.3 billion tons and Milliman and
Meade (1983) - 13.5 billion tons per year. No comparable estimates
exists for on-site erosion exist. But, one may assume that D is
around 10 percent. In view of the variability of sampling techniques
used in various countries and inadequacies of records such as errors
and incompleteness, the above estimates are remarkably consistent.
Drainage basin data for 62 of the basins used by Milliman and
Meade (1983) are summarized in Table 3-1. Besides their name, geo-
graphic location and size, three other parameters are listed for
each basin: unit runoff, cm; sediment yield, t/km2 and sediment
concentration, ppm. The unit runoff measures the magnitude of
surface runoff per unit area and is an indicator of water availabil-
ity as a resource as well as an erosion/transport agent. Sediment
yield, taken with an appropriate value of D, is an indicator of
average on-site erosion rate in the basin and, sediment concentra-
tion is a measure of muddiness of water. These two parameters, in
conjunction with reservoir design parameters, also determine the
amount of sedimentation that will take place in a storage reservoir.
15

Table 3-1
ANNUAL WATER AND SEDIMENT YIELD OF WORLD'S RIVERSAT OCEAN LEVEL
No Continent Country/ River D. Area Runoff Sediment YieldEconomy (mill km2) (cm) (t/kM2) (ppm)
1 N. America Canada St. Lawrence 1.030 43 4 9
2 N. America USA Hudson .020 60 50 83
3 N. America USA Mississippi 3.270 18 107 602
4 N. America USA Brazos .110 6 145 2,286
5 N. America Mexico Colorado .640 3 211 6,750
6 N. America USA Eel .008 79 1,750 2,222
7 N. America USA Columbia .670 37 12 32
8 N. America Canada Fraser .220 51 91 179
9 N. America USA Yukon .840 23 71 308
10 N. America USA Copper .060 65 1,167 1,795
11 N. America USA Susitna .050 80 500 625
12 N. America Canada Mackenzie 1.810 17 55 327
13 S. America Peru Chira .020 25 2,000 8,000
14 S. America Colombia Magdelena .240 99 917 928
15 S. America Venezuela Orinoco .990 111 212 191
16 S. America Brazil Amazon 6.150 102 146 143
17 S. America Brazil Sao Francisco .640 15 9 62
18 S. America Argentina La Plata 2.830 17 33 196
19 S. America Argentina Negro .100 30 130 433
20 Europe France Rhone .090 54 111 204
16

Table 3-1
ANNUAL WATER AND SEDIMENT YIELD OF WORLD'S RIVERSAT OCEAN LEVEL - cont'd...
No Continent Country/ River D. Area Runoff Sediment YieldEconomy (mill km2 ) (cm) (t/kM2) (ppM)
21 Europe Italy Po .070 66 214 326
22 Europe Romania Danube .810 25 83 325
23 Eu. Arctic USSR Yana .220 13 14 103
24 Eu. Arctic USSR Ob 2.500 15 6 42
25 Eu. Arctic USSR Yenisei 2.580 22 5 23
26 Eu. Arctic USSR Sev. Dvina .350 30 13 42
27 Eu. Arctic USSR Lena 2.500 21 5 23
28 Eu. Arctic USSR Kolyma .640 11 9 85
29 Eu. Arctic USSR Indigirka .360 15 39 255
30 Asia USSR Amur 1.850 18 28 160
31 Asia China Liaohe .170 4 241 6,833
32 Asia China Daling .020 5 1,800 36,000
33 Asia China Haiho .050 4 1,620 40,500
34 Asia China Yellow .770 6 1,403 22,041
35 Asia China Yangtze 1.940 46 246 531
36 Asia China Pearl .440 69 157 228
37 Asia Viet Nan Hungho .120 103 1,083 1,057
38 Asia Viet Nam Mekong .790 59 203 340
39 Asia Burma Irrawaddy .430 100 616 619
40 Asia Bangladesh Ganges/Brahm 1.480 66 1,128 1,720
17

Table 3-1
ANNUAL WATER AND SEDIMENT YIELD OF WORLD'S RIVERSAT OCEAN LEVEL - cont'd...
No Continent Country/ River D. Area Runoff Sediment YieldEconomy (mill kM2) (cm) (t/km2) (ppm)
41 Asia India Mehandi .130 52 15 30
42 Asia India Damodar .020 50 1,400 2,800
43 Asia India Godavari .310 27 310 1,143
44 Asia Pakistan Indus .970 25 454 1,849
45 Asia Iraq Tigris-Eupha 1.050 4 50 1,152
46 Africa Egypt Nile 2.960 1 38 3,700
47 Africa Nigeria Niger 1.210 16 33 208
48 Africa Zaire Zaire 3.820 33 11 34
49 Africa S. Africa Orange 1.020 1 17 1,545
50 Africa Mozambique Zambesi 1.200 19 17 90
51 Africa Mozambique Limpopo .410 1 80 6,600
52 Africa Tanzania Rufiji .180 5 94 1,889
53 Oceania Australia Murray 1.060 2 28 1,364
54 Oceania New Zealand Haast .001 600 13,000 2,167
55 Oceania New Guinea Fly .061 126 492 390
56 Oceania New Guinea Purari .031 248 2,581 1,039
57 Oceania Taiwan Choshui .003 200 22,000 11,000
58 Oceania Taiwan Kaoping .003 300 13,000 4,333
59 Oceania Taiwan Tsengwen .001 200 28,000 14,000
60 Oceania Taiwan Hualien .002 200 9,500 4,750
18

Table 3-1
ANNUAL WATER AND SEDIMENT YIELD OF WORLD'S RIVERSAT OCEAN LEVEL - cont'd...
No. Continent Country/ River D. Area Runoff Sediment YieldEconomy (mill km2) (cm) (t/km2) (ppm)
61 Oceania Taiwan Peinan .002 200 9,500 4,750
62 Oceania Taiwan Hsiukuluan .002 200 8,000 4,000
Notes:
1. Data based on Milliman and Meade (1983).2. For Colorado, Mississippi, Indus and Nile rivers, sediment data are based
on Holeman (1968) to reflect pre-dam condition. Sediment yields(tons/km2/yr) are:
Colorado Mississ. Indus NileHoleman (1968): 210.9 106.7 453.6 37.5Milliman & Meade (1983): 0.2 64.2 103.1 0.0
19

For comparative purposes, the top 20 basins ranked by drainage
area, unit runoff, sediment yield and sediment concentration are
listed in Tables 3-2 thru 3-5, respectively. In the ranking tables,
minor basins with areas less than 10,000 km2 have been excluded.
World-wide data on precipitation, unit runoff and sediment
yield for various geographic regions are summarized in Table 3-6.
Water data in this table are based on Table 11 of UNESCO (1977), and
the sediment data on Milliman and Meade (1983).
In viewing the sediment data in the above tables, it should be
noted that they are based on measured suspended loads near ocean
level and that about 15 percent should be added to these figures to
account for the unmeasured load and measurements missed during rare
events. Further, the data in Table 3-6 should be viewed as
indicative of world-wide distribution of relevant hydrologic para-
meters and not as definitive information. In the original sources,
used herein, extensive extrapolations have been made due to sparse-
ness of information and slightly different definitions of geographic
regions have been used in the runoff and sediment load data.
The above data show:
1. The largest amount of meteoric precipitation and runoff occurs
in South America, followed by Asia. However, the sediment
erosion rates in Asia are about four times larger. In fact,
Asia's sediment yield is more than twice of the world average.
2. The largest sediment yields occur in Oceania. For the smaller
basins in New Zealand, New Guinea and Taiwan, sediment yields
are 2-3 orders of magnitude larger than the world average.
3. The world-wide average yield is around 165 t/k=2/yr. With
additional 15 percent, see footnote 4 of Table 2, this would
20
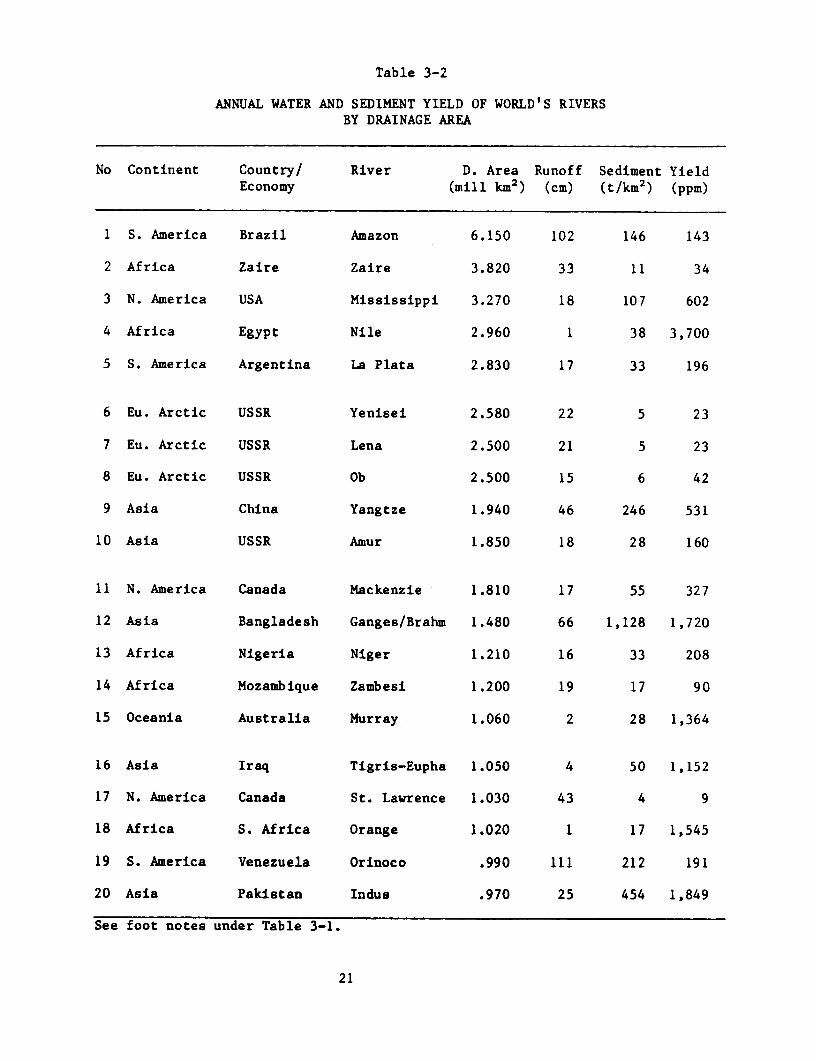
Table 3-2
ANNUAL WATER AND SEDIMENT YIELD OF WORLD'S RIVERSBY DRAINAGE AREA
No Continent Country/ River D. Area Runoff Sediment YieldEconomy (mill kM2) (cm) (t/km2) (ppm)
1 S. America Brazil Amazon 6.150 102 146 143
2 Africa Zaire Zaire 3.820 33 11 34
3 N. America USA Mississippi 3.270 18 107 602
4 Africa Egypt Nile 2.960 1 38 3,700
5 S. America Argentina La Plata 2.830 17 33 196
6 Eu. Arctic USSR Yenisei 2.580 22 5 23
7 Eu. Arctic USSR Lena 2.500 21 5 23
8 Eu. Arctic USSR Ob 2.500 15 6 42
9 Asia China Yangtze 1.940 46 246 531
10 Asia USSR Amur 1.850 18 28 160
11 N. America Canada Mackenzie 1.810 17 55 327
12 Asia Bangladesh Ganges/Brahm 1.480 66 1,128 1,720
13 Africa Nigeria Niger 1.210 16 33 208
14 Africa Mozambique Zambesi 1.200 19 17 90
15 Oceania Australia Murray 1.060 2 28 1,364
16 Asia Iraq Tigris-Eupha 1.050 4 50 1,152
17 N. America Canada St. Lawrence 1.030 43 4 9
18 Africa S. Africa Orange 1.020 1 17 1,545
19 S. America Venezuela Orinoco .990 111 212 191
20 Asia Pakistan Indus .970 25 454 1,849
See foot notes under Table 3-1.
21

Table 3-3
ANNUAL WATER AND SEDIMENT YIELD OF WORLD'S RIVERSBY UNIT RUNOFF
No Continent Country/ River D. Area Runoff Sediment YieldEconomy (mill kM2) (cm) (t/km2) (ppm)
1 Oceania New Guinea Purari .031 248 2,581 1,039
2 Oceania New Guinea Fly .061 126 492 390
3 S. America Venezuela Orinoco .990 11l 212 191
4 Asia Viet Nam Hungho .120 103 1,083 1,057
5 S. America Brazil Amazon 6.150 102 146 143
6 Asia Burma Irrawaddy .430 100 616 619
7 S. America Colombia Magdelena .240 99 917 928
8 N. America USA Susitna .050 80 500 625
9 Asia China Pearl .440 69 157 228
10 Europe Italy Po .070 66 214 326
11 Asia Bangladesh Ganges/Brahm 1.480 66 1,128 1,720
12 N. America USA Copper .060 65 1,167 1,795
13 N. America USA Hudson .020 60 50 83
14 Asia Viet Nam Mekong .790 59 203 340
15 Europe France Rhone .090 54 111 204
16 Asia India Mehandi .130 52 15 30
17 N. America Canada Fraser .220 51 91 179
18 Asia India Damodar .020 50 1,400 2,800
19 Asia China Yangtze 1.940 46 246 531
20 N. America Canada St. Lawrence 1.030 43 4 9
See foot notes under Table 3-1.
22

Table 3-4
ANNUAL WATER AND SEDIMENT YIELD OF WORLD'S RIVERS,BY SEDIMENT YIELD
No Continent Country/ River D. Area Runoff Sediment YieldEconomy (mill km2) (cm) (t/km2) (ppm)
1 Oceania New Guinea Purari .031 248 2,581 1,039
2 S. America Peru Chira .020 25 2,000 8,000
3 Asia China Daling .020 5 1,800 36,000
4 Asia China Haiho .050 4 1,620 40,500
5 Asia China Yellow .770 6 1,403 22,041
6 Asia India Damodar .020 50 1,400 2,800
7 N. America USA Copper .060 65 1,167 1,795
8 Asia Bangladesh Ganges/Brahm 1.480 66 1,128 1,720
9 Asia Vietnam Hungho .120 103 1,083 1,057
10 S. America Colombia Magdelena .240 99 917 928
11 Asia Burma Irrawaddy .430 100 616 619
12 N. America USA Susitna .050 80 500 625
13 Oceania New Guinea Fly .061 126 492 390
14 Asia Pakistan Indus .970 25 454 1,849
15 Asia India Godavari .310 27 310 1,143
16 Asia China Yangtze 1.940 46 246 531
17 Asia China Liaohe .170 4 241 6,833
18 Europe Italy Po .070 66 214 326
19 S. America Venezuela Orinoco .990 111 212 191
20 N. America Mexico Colorado .640 3 211 6,750
See foot notes under Table 3-1.
23
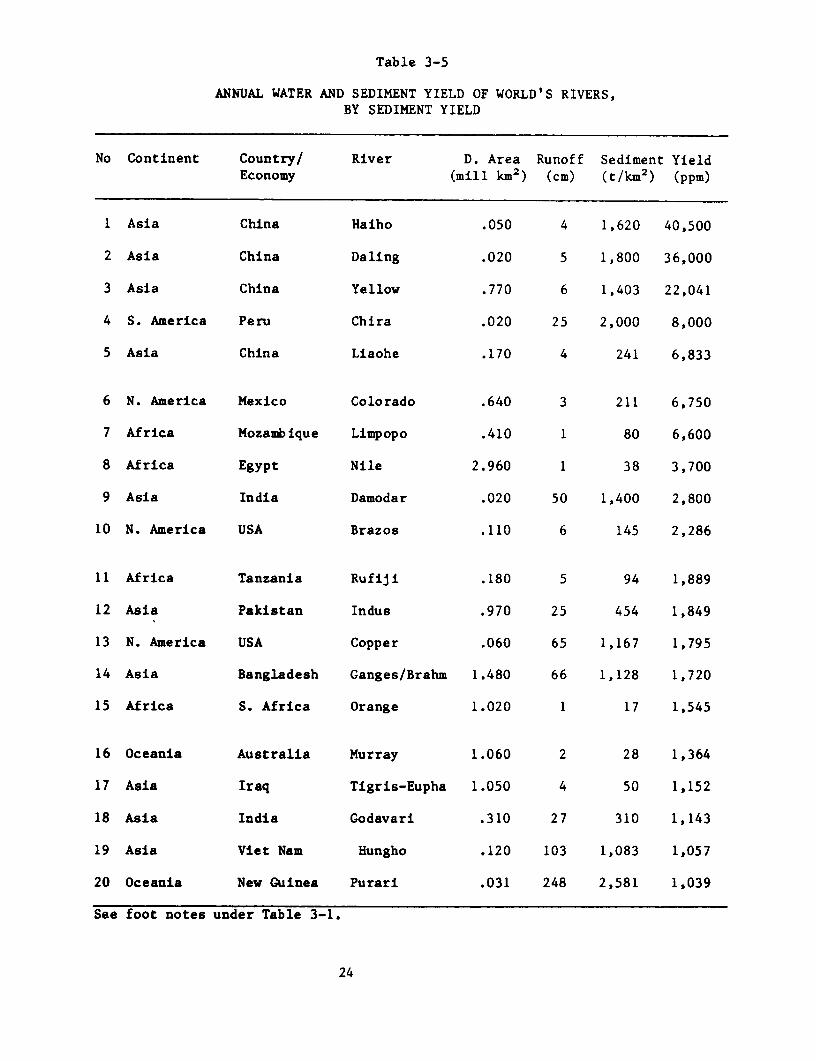
Table 3-5
ANNUAL WATER AND SEDIMENT YIELD OF WORLD'S RIVERS,BY SEDIMENT YIELD
No Continent Country/ River D. Area Runoff Sediment YieldEconomy (mill kM2 ) (cm) (t/kM 2 ) (ppm)
1 Asia China Haiho .050 4 1,620 40,500
2 Asia China Daling .020 5 1,800 36,000
3 Asia China Yellow .770 6 1,403 22,041
4 S. America Peru Chira .020 25 2,000 8,000
5 Asia China Liaohe .170 4 241 6,833
6 N. America Mexico Colorado .640 3 211 6,750
7 Africa Mozambique Limpopo .410 1 80 6,600
8 Africa Egypt Nile 2.960 1 38 3,700
9 Asia India Damodar .020 50 1,400 2,800
10 N. America USA Brazos .110 6 145 2,286
11 Africa Tanzania Rufiji .180 5 94 1,889
12 Asia Pakistan Indus .970 25 454 1,849
13 N. America USA Copper .060 65 1,167 1,795
14 Asia Bangladesh Ganges/Brahm 1.480 66 1,128 1,720
15 Africa S. Africa Orange 1.020 1 17 1,545
16 Oceania Australia Murray 1.060 2 28 1,364
17 Asia Iraq Tigris-Eupha 1.050 4 50 1,152
18 Asia India Godavari .310 27 310 1,143
19 Asia Viet Nam Hungho .120 103 1,083 1,057
20 Oceania New Guinea Purari .031 248 2,581 1,039
See foot notes under Table 3-1.
24

Table 3-6
WORLD DISTRIBUTION OF RUNOFF AND SEDIMENT LOAD
Geographic Precipitation Runoff Measured SuspendedArea mm km3 km Sediment Load
billion Z yieldtons/yr (t/km 2 /yr)
(1) (2) (3) (4) (5) (6) (7) (8) (9)
North America 756 15.8 15.4 6.6 17.1 1.46 10.9 84
Asia 740 25.7 25.0 10.8 28.0 6.35 47.4 380
Africa 740 19.7 19.2 4.2 10.9 0.53 3.9 35
South America 1,600 27.0 26.2 11.8 30.5 1.79 13.3 97
Europe 790 7.5 7.3 2.7 7.0 0.23 1.7 50
Australia 791 7.1 6.9 2.5 6.5} 0.06 0.4 28
Oceania 3.00 22.4 1,000
TOTAL - 102.8 100.0 38.6 100.0 13.42 100.0 165
Notes: 1. Above data should be viewed as indicative rather thandefinitive, mainly because of extrapolations necessi-tated in original sources. Also, slightly differentdefinitions of geographic areas have been used in therunoff and sediment data.
2. Precipitation and Runoff data, Columns (2) - (6) basedon UNESCO (1977), Table 11. Runoff includes groundwaternot drained by rivers.
3. Sediment data, Columns (7) - (9) based on Milliman andMeade (1983), Table 4. Their data on Eurasian Arctic hasbeen excluded from average field.
4. Sediment data pertain to measured suspended load atmouth of basins, near ocean level. To these, add about10 percent for unmeasured suspended and bedload andanother 5 percent for unmeasured load during catastroph-ic events.
25
amount to about 190 t/km2/yr. The average sediment yield for
the measured rivers is 148 t/km2/yr and it corresponds to a
concentration of 425 ppm. With the additional 15 percent, the
measured concentration would be 490 ppm.
4. Of the measured parameters, sediment yield is most correlated
with drainage area (Fig. 3-1) The best-fit trendline between
sediment yield and drainage area would indicate a value of b in
Eq. (3.1) of around 0.8. Notwithstanding the different
climatic, pedologic, tectonic and land use conditions between
different basins, the sediment yield does appear to strongly
decline for larger basins.
5. Sediment concentration is inversely correlated with the unit
runoff. If unit runoff is looked at as an indicator of the
excess of precipitation over actual evapotranspiration, then a
small unit runoff would indicate aridity and, hence, poor
vegetal cover. For basins larger than 20,000 kM2, eight
largest concentrations (1,890 - 40,500 ppm) are associated with
runoff of 6 cm or less.
Human Impact on Sediment Yield
Within the zonal distributions mentioned above, human actions
have made their impact on sediment yield. Over the last century or
two, a great deal of world's forests have been cleared for
agricultural and urbanization needs. Agricultural activity along
with strip mining and other large construction projects, increases
the on-site erodibility of soil by loosening it and destroying its
protective layer. Studies in the U.S. show that conversion of forest
land to row cropping can increase on-site erosion by a factor of
100-1,000 and from pasture land to construction of about 200
(Mahmood, 1977).
26

-3 -2 -I 0 I
510 2 5. 10 2. 10 2 5 10 2. 10
10* p I p
4 z10 z 10
0 i10 10 10 0 10
'-4 01X (1) 0 0 2
>4~ ~~~~~Dang Ara+ A m
102 3-1 10
10R ( Ss Load) 1010- V Y ,1DringeAra006km
FIG. 3-1 SEDIMENT YIELD VERSUS DRAINAGE AREA OF WORLDRIVER (Measured Suspended Load)
Accelerated erosion has serious implications for water quality;
agricultural productivity and channel flooding. In the context of
reservoir sedimentation, unless the disturbance is made over large
areas, their impact is generally small. As illustrated by the Coon
Creek basin, referred to earlier, sediment storage within the basin
results in long time lags between the inception of a disturbance and
the arrival of its effect at the mouth of basin. Two major areas of
disturbance in the world are the plain's region of Europe and U.S.A.
In both cases, large scale conversion of forest land to agriculture
has made a measurable impact on sediment yield. According to
Strakhov (1967), mechanical denudation measured at basin mouths has
been increased by a factor of 3 to 5 in these two regions.
All of man's activities, however, do not increase sediment
yield. Large storage reservoirs significantly decrease and, many a
time, totally eliminate the sediment load downstream. There are
three major examples of this effect on Colorado, Nile and Indus
Rivers.
Dramatic reduction in the sediment load of Colorado River - one
of the muddiest major rivers in the U.S., has occurred as a conse-
quence of Hoover Dam. This has been documented by Meade and Parker,
(1985), from the analysis of suspended sediment discharge at Yuma,
Arizona where the river leaves the U.S. According to them, the
sediment discharge in this river has declined from 135 million
tons/yr of Holeman's estimate to its current value of 0.1 million
tons/yr. Similarly, River Nile, that used to transport about 110
million tons/yr of sediment at its delta, is virtually free of
sediment, as a result of the completion of High Aswan Dam in 1964.
River Indus in Pakistan, which used to deliver about 440 million
tons/yr, now delivers only about 100 million tons/yr due to the
construction of: two major dams (Mangla, 1965 and Tarbela, 1974), a
number of low diversion dams (barrages) and an increased transfer of
water and sediment into the irrigation canal system.
28

The case of Missouri-Mississippi river system is even more
illustrative. In this case, the construction of six major dams in
the Missouri basin (Gavins Point, the most downstream one, completed
in 1953), coupled with extensive channel stabilization along the
whole river, mainly for navigation and flood control purposes, has
reduced the sediment discharge to the Gulf of Mexico to one-half of
what it was in 1953. The contribution of channel bank erosion to
sediment yield can be rather large. In Sacramento River,
California, 60 percent of the total sediment inflow of 12.7 million
tons/year has been estimated to come from streambank erosion (Sing,
1986). The effect of channel stabilization is that the valley
deposit which can be reworked by the nascent river are no more
available as a sediment source.
Impact of Natural Events
Sediment production from a basin is a discontinuous process. It
is usually associated with rainfall events. Floods, earthquakes,
volcanos and mudflows are some of the other events that cause
unusually large amounts of sediment production. In recent times, all
of these have been documented in various parts of the world.
New Madrid Earthquake: Between December, 1811 and February,
1812, the greatest earthquake in the continental U.S was experienced
near New Madrid in South Missouri. There were three major shocks and
many aftershocks. The one in 1874 was large enough to be felt as far
away as 500 km. The area of greatest shaking was about 100,000 km2.
Large scale bank caving and fissuring introduced an undetermined,
but major quantities of sediment in Mississippi. Both Winkely
(1977) and Walters (1975) believe that, as a result of New Madrid
Earthquake, the sediment loading of Mississippi was significantly
increased, and the channel morphology was changed because of that.
29

Kosi River Mudflow: Sapt Kosi is the third largest river
emanating from the Himalayan Range. It is exceeded in size only by
Indus and Brahamaputra Rivers. Kosi watershed extends across the
Himalayan range into the Tibetan Plateau and it has the distinction
of draining Mount Everest, Kinchunchunga and Makato. This river has
three main tributaries, Sun Kosi, Arun and Tamur. Arun, which draws
about 58 percent of the catchment extends northward into the Tibet
Plateau. Precipitation in Kosi watershed comprises both rainfall
(89%) and snowfall (11%). About 80-85 percent of total annual rain-
fall occurs during monsoon months of June - August. Between June
and September, the runoff amounts to 85 percent and the sediment
load about 98 percent of the annual value (Mahmood, 1981).
Regular stream gaging and rainfall measurements on Kosi were
started in 1947 and 1948, respectively, at Barahkshtra in the
foothills. Details of sediment sampling procedures used in Kosi
gaging are not documented. The writer's investigation in 1979
revealed that up to a discharge of 15,000 m3/s, a single suspended
load sample was obtained at 0.6 times the flow depth below the water
surface, and at higher stages dip samples from the surface were
being used. At the gaging site, the river is a confined channel with
steep gradient and high velocities. Under these conditions, most of
the sand size load will be uniformly distributed in the channel
depth, but some underestimation of sediment load is likely.
Himalayas are geologically young and abound in seismic activi-
ty. It is estimated (Chaudhry, H.M, 1973) that about two percent of
the total annual global energy release takes place in the Himalayan
region. Two of the world's worst earthquakes, in terms of lives
lost, occurred in Assam in 1897 and 1950, not far from the Kosi
catchment. Kathmandu earthquake of 1934, which levelled most of the
city was reportedly centered 120 km off Barahkhstra gaging site.
30

At the gaging site, Kosi has a drainage area of 59,000 km2 with
an average annual runoff of 53,000 Mm3. The average annual sediment
yield based on measured suspended sediment is about 2,800 t/km2 of
which about 16 percent is coarse sand; 29 percent medium sand and 55
percent is silt and clay. The average annual measured concentration
is 3,110 ppm.
On the night of June 23-24, 1980, after three days of heavy
rainfall, a major landslide occurred in the catchment of Tamur, the
eastern tributary. The slide blocked Yangma Khola, a tributary of
Tamur. The blockage was naturally breached in the early hours of
June 24 and the impounded water and sediment were released in Tamur.
About 130 kms downstream of the original slide, the first effect of
the event was noticed at about mid-day. In two hours the water
level rose by 3.6 m and the flow carried (Revio, 1980) "... huge
quantities of debris, logs, animal carcasses and about four
bodies..." By about 15:15, the water level dropped by 1.5 m and
debris was almost completely absent. Between 15:30 and 15:45, the
level rose again, but this time, the flow seemed to be of a viscous
fluid. The surface was greasy smooth with loud rumbling and
grinding noise. Boulders, as large as 150 tons were moving in the
shallow side of the channel section rather easily. Samples taken at
this stage showed a sediment content of 80 percent by volume with
particle sizes 10 mm and under with 23 percent lying below 0.075 mm.
The solids were non-plastic, with a specific gravity of 2.68 and a
liquid limit of 17.5%. The velocity of flow was 10 m/sec during the
initial rise and 6-7 m/sec during the flood flow. The writer flew
over the effected catchment and Kosi River channel during October
1980. From aerial and field inspections of deposits, he estimated
that the mudflow transported between 55-65 million tons of sediment
over a period of about 14 hours. This is equivalent to 36 percent
of the annual load or five times the average monthly load for the
month of June.
31
Eruption of Mount St. Helens: Mount St. Helens in Southwestern
Washington, erupted on May 18, 1980. As a result, mudflows developed
in the main drainage channels. (Cummans, 1981). It has been
estimated that following the eruption, a massive debris avalanche
deposited about a billion tons of rock, ice and other materials in
the upper 17 miles of the North Fork Toutle River Valley. Following
the avalanche, a mudflow developed which deposited about 50 million
tons of sediment in Cowlitz River channel. It has been estimated
(Meade and Parker, 1985) that in the first four months after
eruption, about 140 million tons of suspended sediment were
deposited by the Cowlitz River into the Columbia River. In the last
few years, this has diminished to about 30 million tons/year. As a
result of Mount St. Helen's eruption, the sediment yield of
Columbia River has currently increased to 40 million tons/year from
the pre-eruption value of 10 million tons/yr.
Sediment load in rivers, generally increases as a power
function of discharge. Disproportionately larger quantities of
sediment are, therefore, transported during high flow than the low
flows. Meade and Parker (1985) estimate that in the coterminous
United States, about one-half of the annual sediment load is
transported during 5-10 days flow. Flood flows are also caused by
hurricanes, and the above named authors estimate that hurricane
induced floods in Juniata, Delaware and Eel rivers transported 3-10
years of average sediment load in a matter of 10 days. Schumm
(1977) cites accelerated denudation in New Guinea where the
earthquakes of 1970 triggered debris avalanches that denuded slopes
over 60 km2 and resulted in an almost instantaneous denudation of
11.5 cm compared to the regional normal rate of 20 cm/1000 yrs.
32
Measurement of Sediment Load
As shown above, a great deal is understood about the weather-
ing, erosion and transport processes that contribute to the sediment
load in river basins. Regional average information and short-term
average sediment yields are usually available in major basins.
However, they are not adequate for the sedimentation design of
storage reservoirs. Sediment loads contributed by infrequent events
alone are sufficient to undo many estimates based on short-term
data. The writer was actively involved in the design of remedial
sediment control works for Chattra Main Canal offtaking from Kosi
River in Nepal. The design was at a fairly advanced stage when the
mudflow of June, 1980 occurred. In addition to the problem of
sudden, extreme sediment load, the mudflow caused a major change in
the alignment and bed level of the river channel. As a result, a
substantial revision of designs became necessary and was carried
out. The mudflow in Kosi had not been anticipated and the previous
10 years of sediment data had no record of similar events.
It is customary and necessary to measure sediment loads at or
near the proposed sites of storage reservoirs. Sediment measure-
ments are made in conjunction with water discharge measurements.
Standard practice for these measurement has been outlined in various
U.S. Geological Survey Publications. Guy (1969, 1970) and Guy and
Norman (1970) present a useful summary of basic sedimentation
concepts, measurement procedures and laboratory methods needed for
sediment load measurements in rivers. Site data for sediment load
are invaluable. Ideally, one would like to have data for a period,
at least, equal to about one-half the project life. However, except
in fairly developed water resources systems, or in special cases
where the project formulation has dragged on for decades, such data
are not available. In these circumstances, one has to be content to
use whatever data and ancillary information can be collected. It is
rare that a project implementation has been voided for lack of
33

adequate sediment load data. In all cases and, especially, when
sediment load records are inadequate, specialist help in the inter-
pretation of data and estimation of long-term average sediment loads
is invaluable.
Special Considerations
Some general principles can be formulated about the collection
and analysis of sediment load data for reservoir design. Hydrologic
series in arid and semi-arid climates show larger variability than
in the humid climates. Given similar circumstances, a longer
sediment load data base will be required in the former climates.
Experience with the sediment load transported by floods indicates
that, in case of limited resources, it is better to carry out more
frequent measurements during high flows than the low flows. Efforts
should be made to measure the extreme flow events, if one is lucky
enough to experience them before the construction stage.
Anthropogenic changes and natural events in a basin can alter
past trends. In large basins, man's actions will usually have
relatively milder impact on reservoir sedimentation than the natural
events. In the sedimentation design of storage reservoirs,
contributions from earthquakes, volcanos, mudflows and hurricanes
are especially relevant and should be investigated. Generally, the
seismic activity at the project site is studied for other design
considerations, such as the stability of embankment and foundation
and, hurricanes are investigated in the estimation of design floods.
The sediment production by mudflows is not normally included in the
design studies and is likely to be ignored. This should be given
special attention. Techniques, such as geomorphic analysis of
drainage basins, should be used to define the extent and magnitude
of hillslope instability and to check estimates derived from gaging
data.
34
CHAPTER IV
RESERVOIR SEDIMENTATION PROCESSES
Sediment load carried by a flow will drop out if the transport
capacity of flow is diminished. In general, the capacity of a given
flow decreases with a reduction of its velocity. As a river enters
the reservoir, the cross-sectional area of flow is increased, the
average velocity is decreased and sediment load starts dropping out.
The order in which different sediment sizes settle down and the
location of deposits depends on three physical phenomena--cessation
of drag force on particles rolling along the stream bed (bedload);
reduction in turbulence level which determines the capacity of flow
to maintain sediment suspension and, development of density
currents. In all of these, the physical size of sediment particle
plays an important role. Once the sediment particles have settled
out of flow, they assume a certain initial density which is also a
function, of particle size. The density of deposits is an important
variable because a given mass of sediment will occupy a larger share
of the storage volume if its density is low. This chapter presents
basic information about the properties of sediment, entrainment and
transport of sediment by flow and the processes of deposition in
storage reservoirs.
Sediment Size
The range of particle sizes found in nature is rather large--
fraction of a micron for clay to large boulders a few meters across.
From the viewpoint of reservoir sedimentation, however, the range of
interest varies from clay to gravel as the mass rate of transport
associated with larger particles is insignificant.
35

The following descriptive names are used to classify different
size fractions of sediments:
Gravel: 64 mm - 2 mm
Sand: 2 mm - 62 microns
Silt: 62 microns - 4 microns
Clay: 4 microns - 0.24 microns
This nomenclature was initially adopted by American Geophysical
Union in 1947 and is accepted as a standard terminology in sedimen-
tation engineering. Further sub-classes, each covering a two-fold
range of size, have also been established within the above and they
are based on adjectives, such as, coarse, medium or fine. In some
parts of the world, slightly different size ranges have been conven-
tionally used, especially to describe the sub-classes. For example,
the lower size limit for sand may be given as 75 microns, and that
for clay as 5.5 microns. This discrepancy is not overly critical in
the interpretation of sediment load data, provided the distribution
of total load amongst all the classes is available.
It is difficult to describe the size of a sediment particle by
a single linear dimension due to variations of its shape. Various
'sizes" have been used in sedimentation engineering and its allied
disciplines. However, in sedimentation engineering, two sizes are
most commonly used: sieve size, which is the side length of
smallest square sieve opening through which the particle will pass,
and fall diameter, which is the diameter of a sphere with a specific
gravity of 2.65 that will have the same terminal fall velocity in
quiescent water at 24°C as the original particle. Sieve diameters
are more commonly used for sand and gravel, mainly because of the
wide-spread use of sieving in size analysis. The fall diameter can
be looked at as a hydraulic behavioral size, for it represents the
combined effect of a number of variables, such as, specific gravity,
size, shape and texture of particle. In suspended mode of sediment
36
transport, the behavioral size is more relevant, and empirical
curves have been developed to translate the sieve diameter of water
borne sediments to fall diameter for given shape factors (Federal
Inter-Agency Sedimentation Project, 1957).
The fall velocity of a sediment particle is, generally,
described in terms of its terminal value when falling in quiescent
water. Although direct measurements have not been made, it is
generally agreed on the basis of theoretical considerations and some
indirect evidence that the fall velocity of a given sediment
particle will be smaller in turbulent fluids than in quiescent ones.
In the case of a spherical particle, the terminal fall velocity can
be determined by equating the gravitational force with the fluid
drag to yield
w - 4/3 . [(S - 1)gD]I/C (4.1)g ~~D
where, w - fall velocity, S - specific gravity, g - gravitational
acceleration, D - diameter and C , the drag coefficient is aD
function of fall velocity Reynold Number
C = f [R] (4.2)D
R - w D/v (4.3)
where, v - kinematic viscosity of the fluid and function f [.1 has
to be empirically determined. Only when R < 0.1 (D roughly less
than 50 microns), theoretical value of C isD
C - 24 /R . (4.4)D
The fall velocity decreases with particle size, but in the sand
to clay size range, it decreases at a much faster rate than Eq.
(4.1) would indicate. For example, when the particle size reduces
37
by one-fiftieth from 250 to 5 microns, the fall velocity reduces by
1/500, mainly due to the increase in C . For practical computations,
Eq. (4.4) can be applied to the silt and clay size range. For sands,
curves developed by Federal Inter-Agency Sedimentation Project
(1957) are available. However, the following empirical equation
developed by Rubey (1933) will also yield acceptable values.
g(Sg- 1)D3+ 36 92_ 6v
w = . (4.5)
D
All of the variables in Rubey's Equation should be expressed in
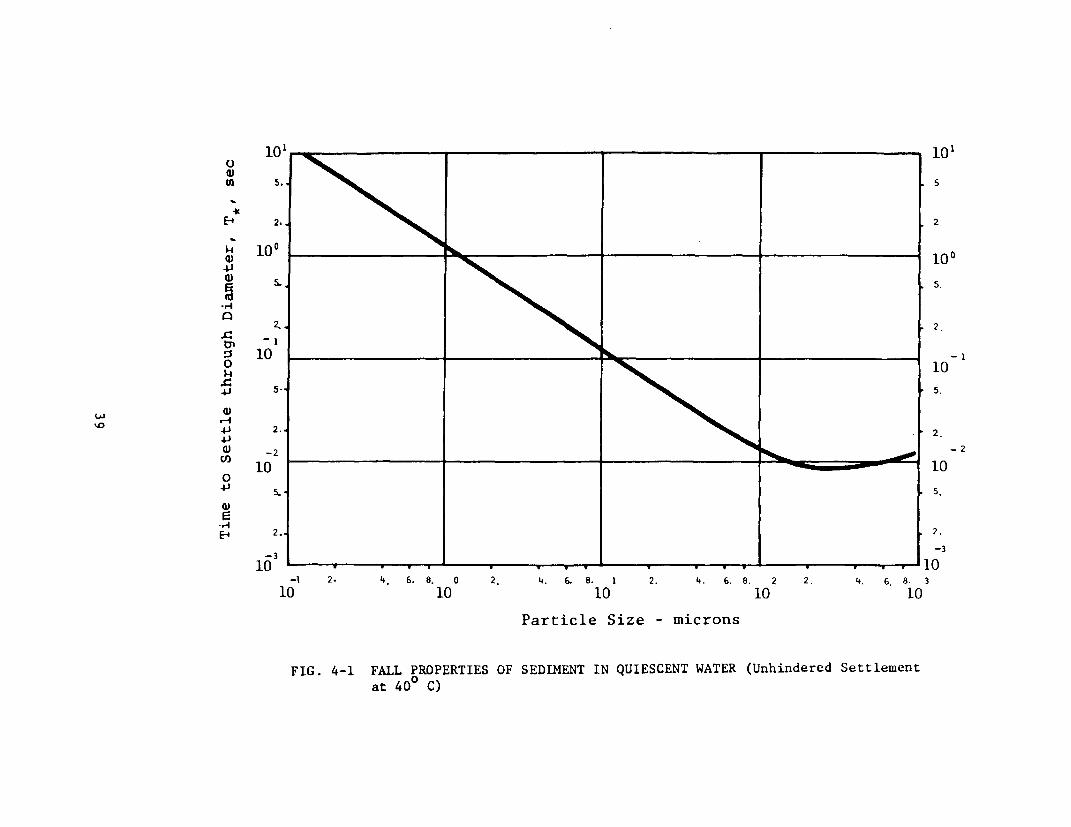
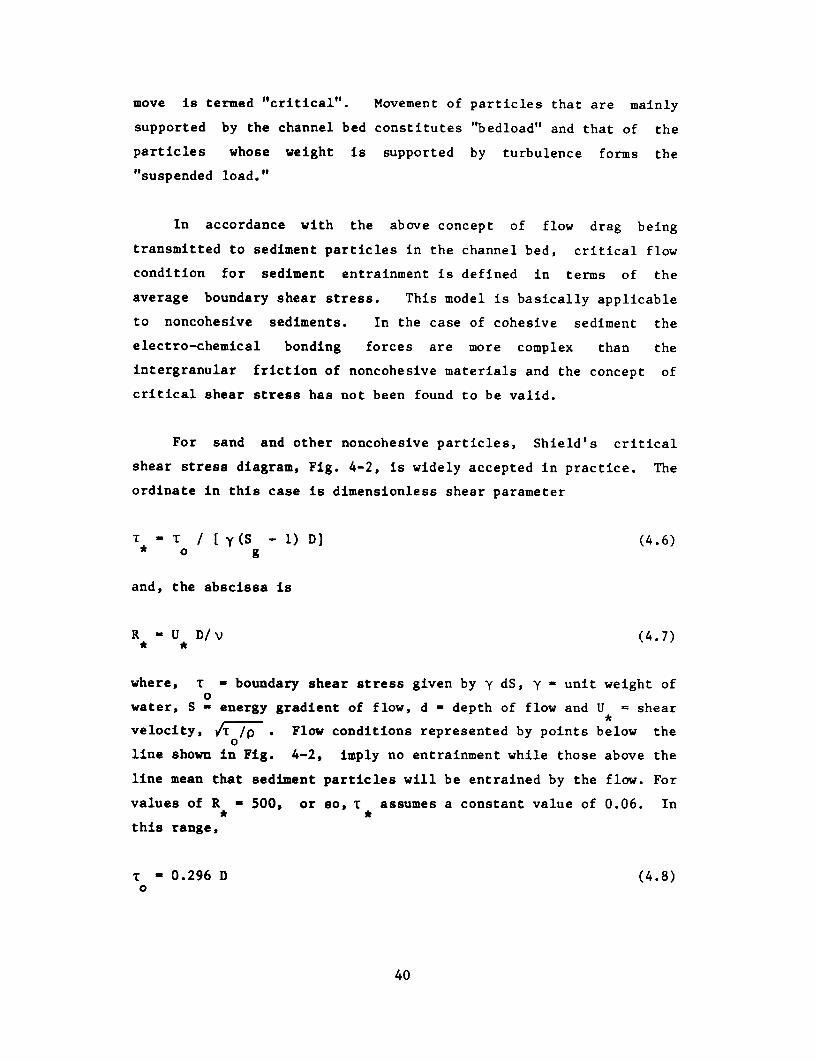
consistent units. The writer likes to express the fall velocity in
terms of parametric time, T , which is time in seconds taken by a
sediment particle to fall through its own diameter. The variation
of T with sediment particle size over a range of 0.1 to 1000
microns is shown in Fig. 4-1. In the very fine-to-coarse sand
range, the value of T is around 0.008 sec. For 1 micron clay
particle, T* is slightly more than 1 sec.
Entrainment
In smooth boundary flows, the frictional drag emanates from the
shear stress exerted on the solid boundary. In alluvial channel
flows with bed forms, part of the drag comes from the shear force
and the remainder from pressure drag on the bed forms. The shear
force is transmitted to individual particles which start to move if
the force is large enough to overcome their frictional resistance.
The movement of individual grains on the bed is not continuous. It
is punctuated by rest periods and the average rate of travel of
particles is much slower than the velocity of flow. As the flow
rate and the boundary shear stress increase further, the sediment
particles are lifted into the flow where they are supported by the
vertical component of turbulence and they move at the velocity of
surrounding fluid. Flow condition when the particles just start to
38
.,l~~~~~~~~~~~~~~~~~~~~~~~~~~~~~~~~~~~~~~~~~~~~~~~~~~~~~~5
. ~~~~~~_ 2'
101101
U) 5 5.
21 24
100 10 10
S.~~~~~~~~~~~~~~~~~~~~~~~~~~~~~~~~~~~~~~~~~~~~5
2.- 2.
~~~~~~~~~~~~~~~~~~1 ~ ~ ~ ~ ~ ~ ~ ~ ~ ~ ~ ~ ~ ~ ~ -
10 -10
o 1 1 010
Par tic le S ize -microns
FIG. 4-1 FALL PROPERTIES OF SEDIMENT IN QUlESCENT WATER (Unhindered Settlement
at 40°0 C)
move is termed "critical". Movement of particles that are mainly
supported by the channel bed constitutes "bedload" and that of the
particles whose weight is supported by turbulence forms the
"suspended load."
In accordance with the above concept of flow drag being
transmitted to sediment particles in the channel bed, critical flow
condition for sediment entrainment is defined in terms of the
average boundary shear stress. This model is basically applicable
to noncohesive sediments. In the case of cohesive sediment the
electro-chemical bonding forces are more complex than the
intergranular friction of noncohesive materials and the concept of
critical shear stress has not been found to be valid.
For sand and other noncohesive particles, Shield's critical
shear stress diagram, Fig. 4-2, is widely accepted in practice. The
ordinate in this case is dimensionless shear parameter
T - T / [ y (S - 1) D] (4.6)*s o g
and, the abscissa is
R U D/v (4.7)
where, T - boundary shear stress given by y dS, y - unit weight of0
water, S - energy gradient of flow, d - depth of flow and U = shear
velocity, /p . Flow conditions represented by points below the
line shown in Fig. 4-2, imply no entrainment while those above the
line mean that sediment particles will be entrained by the flow. For
values of R - 500, or so, T assumes a constant value of 0.06. In
this range,
T[ = 0.296 D (4.8)0
40

100 - - - - - - 100
>5 2
- -i --
-r -:5
. a 2 5. 2. 5. . 5 1O~~~~~~~~~~~~~~~~~~~~~~~~~~~~~~~~~~~~~~5
U)
4-i
00 10 - - -- - - _______ - - ~~~~~~~~~~~10
U)
.Is ~ ~ ~ ~ ~ ~ ~ ~ ~ ~~ Ryod s ube,R
.FS4
-2 ~~~~~~~~~~~~~~~~~~~~~~~~~~~~~~~~-2.
10 2.5. 2 5. 2. 5. 2. 5.
io- 10 ~~0 10 10 2 10 3
Reynold's Number, R*
FIG. 4-2 SHIELD'S CRITICAL SHEAR STRESS DIAGRAH

where, T is expressed in N/m2, D in mm and S = 2.65.O g
Conventionally, the shear stress used in Shield's diagram is
the average bed shear stress. Measurement of boundary shear stress
on the bed of sand bed canals with ripple and dune bed forms
(Mahmood and Haque, 1985), shows that due to the pressure drag on
bed forms, the average shear stress is smaller than the value of0
given above and that it experiences considerable spatial variation
related to the existence of secondary flow cells and temporal
variations related to turbulence. Nevertheless, Shield's diagram
has been validated by a number of other investigators and it is
recognized as an acceptable method to predict critical condition for
movement of noncohesive bed sediments. A similar criterion for
cohesive materials is not available.
Suspension
There is a continuous exchange of particles between bedload and
suspended load. However, under equilibrium flow conditions, where
stable time and space averages of bedload and suspended load exist,
it is possible to define an average distribution of suspended
sediment concentration along the depth of flow. The concentration
profile most widely accepted in literature is given by
a [ d-a ] (4.9)
where, C - mass concentration of sediment at a distance y above the
channel bed, C - concentration at a reference distance y = a, z -
aW/( K U ), and, K von Karman's constant = 0.4. According to this
equation, the concentration of suspended sediment decreases from
near the channel bed towards the free surface. The form of Eq.
(4.9) has been extensively verified on laboratory flumes as well as
sand bed canal and river data. Measured values of exponent z,
42
however, show considerable variation from the theoretical value
given above. This exponent plays an important role in determining
the nonuniformity of concentration profile and the mass of sediment
carried in suspension. If the value of z is greater than about 5,
there will be almost no suspended load and if it is less than 0.1,
the sediment profile will have a nearly uniform distribution.
Fine Material Load
In sediment transport theory, the load that consists of
particle sizes found in the bed material is called the bed material
load. Often, the sediment load will contain a large proportion of
particles which are not significantly represented in the bed
material. This part of the load is called wash load. In sand bed
channels, the wash load, generally, comprises of particle in silt
and clay size range, so that the cutoff size for wash load is 62.5
microns. For this reason, the silt and clay load in such channels
is called the fine material load. The bed material load can be
theoretically calculated, within acceptable degree of accuracy, from
the local hydraulic conditions and bed material composition. The
wash load cannot be so calculated. Its value can only be determined
by actual measurement.
The quantity of fine material load in a flow depends on its
generation within the drainage basin including its supply from
sediment sources such as slope and bank erosion. The proportion of
fine material load in total sediment load carried by a flow varies
with the flow discharge and the order of flow in the yearly sequence
of high discharges. In general, the first flood of the season will
produce the highest amount of fine material load. On an annual
basis, most sand bed rivers carry more fine material than sand load.
The proportion of different size fractions in some typical rivers is
given below.
43
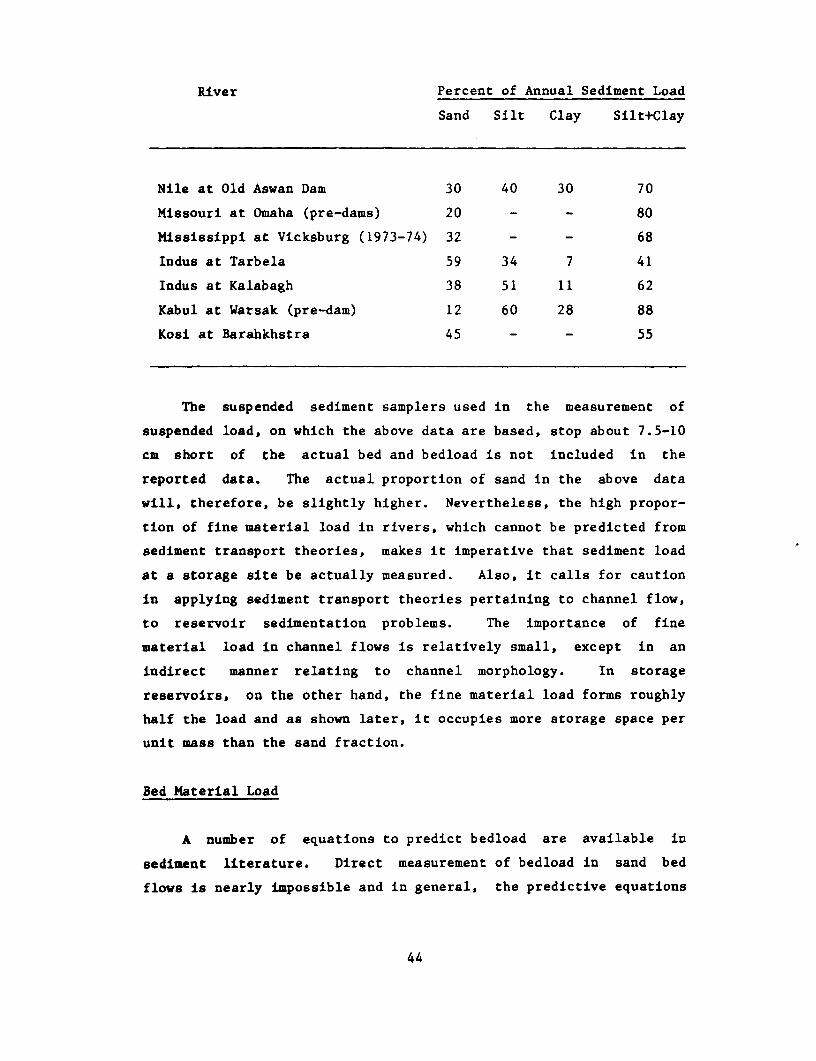
River Percent of Annual Sediment Load
Sand Silt Clay Silt+Clay
Nile at Old Aswan Dam 30 40 30 70
Missouri at Omaha (pre-dams) 20 - - 80
Mississippi at Vicksburg (1973-74) 32 - - 68
Indus at Tarbela 59 34 7 41
Indus at Kalabagh 38 51 11 62
Kabul at Warsak (pre-dam) 12 60 28 88
Kosi at Barahkhstra 45 - - 55
The suspended sediment samplers used in the measurement of
suspended load, on which the above data are based, stop about 7.5-10
cm short of the actual bed and bedload is not included in the
reported data. The actual proportion of sand in the above data
will, therefore, be slightly higher. Nevertheless, the high propor-
tion of fine material load in rivers, which cannot be predicted from
sediment transport theories, makes it imperative that sediment load
at a storage site be actually measured. Also, it calls for caution
in applying sediment transport theories pertaining to channel flow,
to reservoir sedimentation problems. The importance of fine
material load in channel flows is relatively small, except in an
indirect manner relating to channel morphology. In storage
reservoirs, on the other hand, the fine material load forms roughly
half the load and as shown later, it occupies more storage space per
unit mass than the sand fraction.
Bed Material Load
A number of equations to predict bedload are available in
sediment literature. Direct measurement of bedload in sand bed
flows is nearly impossible and in general, the predictive equations
44

can only be tested in the context of bed material load. Bedload and
bed material load equations available in literature differ in their
theoretical content. Verifications of sediment transport equations
on prototype data (Mahmood et al, 1979. and Mahmood, 1980) conclude
that whereas Einstein's Bedload Function is the most profound,
Toffaleti's method is most accurate when tested against Missouri
River and Pakistan's ACOP canal data.
A package of computer programs to calculate bed material load
in sand bed and gravel channels by various transport functions is
available (Mahmood, 1982 and 1983). However, in view of the
implicit nature of most bedload equations, a simplified empirical
form is sometimes used.
bg - a[ ]b o
where, g - bedload in units of mass per unit time per unit width
and b = constant over a narrow range. Values of b vary from about
4.0 at the commencement of entrainment to about 1.5 at higher rates
of transport.
Unit Weight of Deposits
When sediment is first deposited in a reservoir, its density is
determined by the mode of deposition, its particle size distribution
and the chemical regime of water. Later on, as the deposits are
loaded with additional deposits, the silts and clays are compacted
to higher densities. The unit weight of deposit at a given time is
a function of: weight of overburden; particle size distribution;
degree of exposure to drying; permeability and the elapsed time
since first deposit. The exposure to drying is most important for
clays whose density may as much as double in a matter of few months
exposure. Direct measurement of in-situ density of deposits is
difficult due to the disturbance caused by usual geotechnical
45
sampling methods. Density measurements can be made by Gamma Probe
(McHenry et al, 1965, 1971; U.S. Army Corps of Engineers, 1965).
Many a time, the values reported in literature have been indirectly
obtained by using the measured volume of deposits and sediment load
inflow.
A method for predicting the unit weight of reservoir deposits
is given by Lane and Koelzer (1943). This is based on indirect
measurements and is most commonly used in practice. In this method,
the dry density of deposits W at a given age of T years is
t
W - W + B log(T) . (4.11)
t I
Variables W . the unit weight at the end of first year, and B are
expressed in terms of particle size classification, and the exposure
environment of deposits. The latter is, of necessity, qualitative
and it is specified in four classes as: always or nearly submerged;
exposed by moderate drawdown; exposed by considerable drawdown, and
exposed by a normally empty reservoir. The variation of W , basedt
on the above method, for sand, silt and clay size fractions is
graphically presented in Fig. 4-3. It is noted that the density for
sand is independent of age and exposure environment and that for
clay is most sensitive to these variables. It is also noted, that
the exposure environment tends to become less important with
increasing age of deposits. In applying Lane and Koelzer method,
unit weight of sediment deposited in a given year, at age T years is
given by
W = p W + p W + p W (4.12)ave s ts m tm c tc
where, p = fraction of given size fraction in the deposit and sub-
script s, m and c stand for sand, silt and clay, respectively. It is
recognized that W represents spatially averaged value and indivi-ave
dual measurements may show considerable deviations. For example,
46

16- 1
14 14SILT - I
SILT - 2
't 10 001
6 -. .... .. .. .. .. ... .. .. . D epesI.t Scy .rger.. Conditl.ons1. Inervolr mlorully PtW 6
- ~~~~~~~~~~~~~~2. Coesidrabi. reservoir drswdn- ~~~~~~~~~~~~~~~3. b*rate reservoir drawdan
4. Deposits nearly always sulmerged
1 0 2 3 - s 2 i8g I 2 3 I s 6 ;89 2
FIC. 4-3 SEDIMENT DEPOSIT IN RESERVOIRS: VARIATION OF DENSITY WITH ACE ANDSUBMERGEN4CE
Lara and Pemberton (1965) in their analysis of 1316 samples found
standard errors of 0.17-0.22 ton/m3 from their best-fit values.
Delta Formation
The sand and coarser fractions of sediment load entering a
reservoir are the first to deposit. The deposits start at the
commencement of the backwater curve and the shape of deposit is like
a delta. See Fig. 4-4. This part of reservoir deposit is the one
most amenable to treatment by channel flow sediment transport theo-
ries. Mathematical modeling of delta formation as a part of simula-
tion of reservoir sedimentation is discussed in Chapter V.
As sediment deposition continues, the delta grows in both the
upstream and downstream directions by a feedback mechanism. Up-
stream limit of backwater curve is extended by the initial deposits
and so is point of commencement of delta. On the downstream side,
longitudinal growth of delta requires sediment transport on top of
delta itself. For this reason, after the delta has intruded partly
into the reservoir, it will undergo a period of (vertically) upward
growth before commencing its downstream migration.
Within the reservoir, the cross-sectional width increases in
the downstream direction and except in steep walled, narrow gorges,
the width becomes too large for the river current. In such cases,
the flow tends to concentrate on a width slightly larger than that
of the incoming channel, and the delta growth is temporarily con-
fined to this width. Based on the sedimentation experience at some
U.S. reservoirs, Harrison (1983) has described the sequence of
delta growth as it fills the reservoir width. As the delta is
growing at one location, there will be low-level areas on its side
with relatively quiescent water where silts and clays may be depo-
sited. At a certain stage of growth, the current will abandon the
earlier delta and move into an adjacent low-level area. It will
48
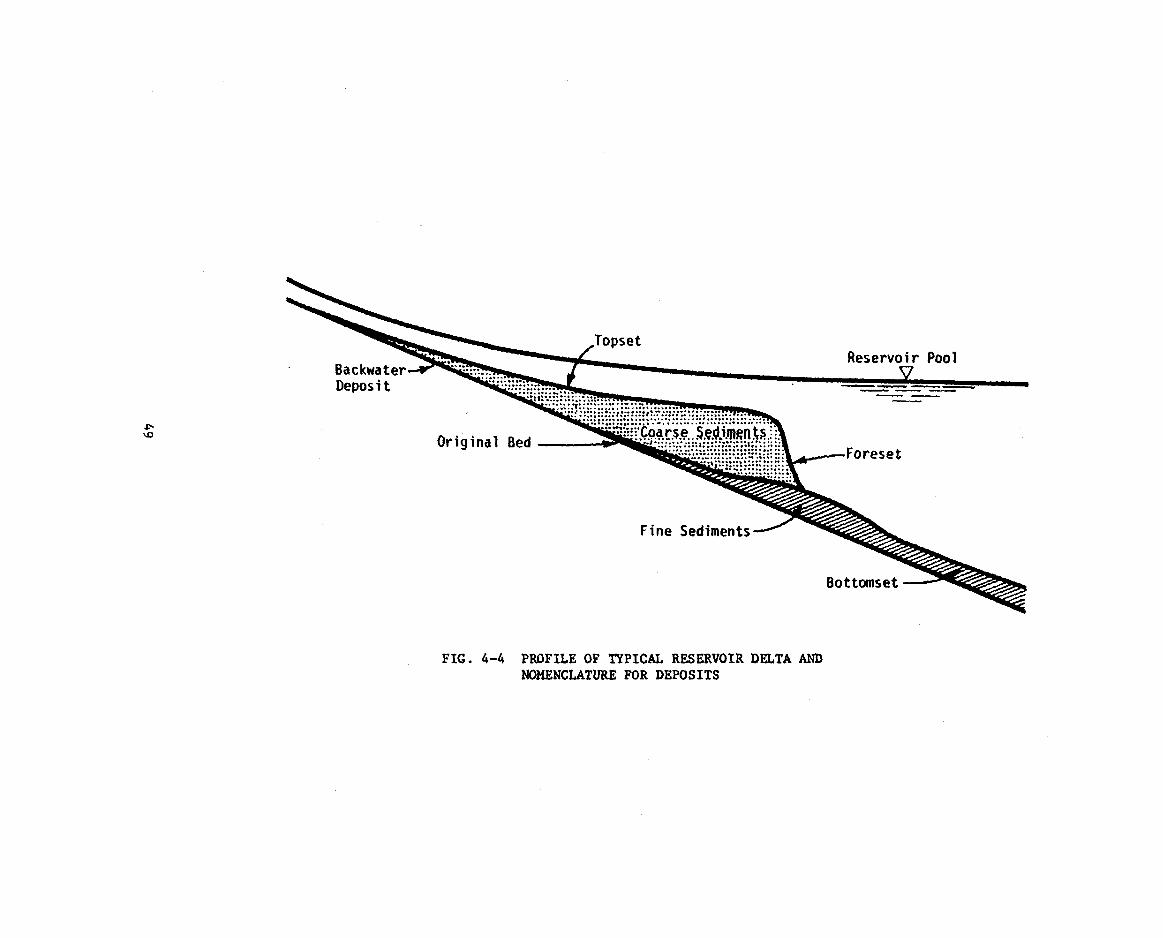
~~ -- ~TopsetReservoir Poolr~~~~~~~~~
Deposit ~ i_-7! 4_
> ~ ~ ~ ~ ~ ~ ~ ~ 'iiQg '~~~~~~~~~.:`,:Coarse Sei£nE.@ ~~~~~~~~Original Bed ____*tE;-:i-i.r:: ................ ::Foreset
Fine Sediments
Bottomset
FIG. 4-4 PROFILE OF TYPICAL RESERVOIR DELTA ANDNOMENCLATURE FOR DEPOSITS
then fill up this channel and move to another deeper channel. The
delta, thus, fills up the valley by lateral avulsions. Harrison
(1983) also observes that the sinuosity of channel decreases within
the aggrading part of the reservoir so that, ultimately, the channel
will follow the valley alignment and not that of the original river
channel.
Due to their larger settling velocities, the coarser size
fractions of the sediment load--gravels and sands, are the main
constituents of delta. However, as stated above, some silts and
clays are deposited in the deep channels adjacent to the main
current and further, clay flocs may develop within the reservoirs to
deposit on the delta itself. The above description of delta
formation shows that, primarily, it is a three-dimensional process,
which may be simplified to a two-dimensional (along the reservoir
and laterally across the width) case. However, the set of governing
equations commonly used to model delta growth are a one-dimensional
approximation, (See Chapter V), which cannot predict the three-
dimensional features of delta deposits. The results computed from a
one-dimensional model should be interpreted as the average condition
across the reservoir width.
Dead storage in a reservoir is defined as the storage volume
between the stream bed and the lowest elevation from which water
can be withdrawn by gravity. Conventionally, the dead storage is
allocated to the accumulation of sediment deposition within the
economic life of the storage. The top of delta develops a slope
which is about one-half to two-third of the original slope of the
river bed and it is definitely not horizontal. The concept of a
dead storage below a horizontal plane, entirely devoted to sediment
deposition thus becomes invalid. In fact, a part of the usable
capacity will be lost even before the dead storage has been comple-
tely filled up. For example, the 1980 survey of Tarbela Reservoir
showed that after 6 years of operation, 44 percent of deposit lay in
50
the usable storage zone even though 78 percent of dead storage was
still available. Similarly, in the reservoir at High Aswan Dam,
approximate analysis of sediment surveys by the writer shows that
whereas the total sediment deposit upto 1986 amounts to just under 2
km3 against a dead storage volume of 31.6 km3, the net loss of live
storage capacity is already more than 1 km3. At this dam, the total
storage capacity is 162 km3 and, consequently, the recorded loss may
not be critical, but it does show the fallacy of computing economic
life of a storage on the basis of a uniform rate of depletion of
dead storage equal to the volume of annual deposits. This factor
should be considered in estimating future usable capacities.
Fine Material Deposit
Discrete particles of silt and clay have rather small settling
velocities, Fig. 4-1. Even in the absence of turbulence, these
particles can travel considerable distances into a storage reservoir
before settling down. As an example, consider a trapezoidal reser-
voir with a bed width of 100 m, valley side slope of 2H:1V and a bed
slope of 0.0002. If 2 micron clay particles enter this reservoir
with a flow of 500 m3/sec, they would travel about 60 km before
completely settling down. Under normal circumstances, fine material
deposits are, therefore, spread all over the reservoir. They do,
however, show size gradation with distance from inlet same as the
bed material particles. Two physical aspects of fine material
deposits require special mention: the formation of density currents
and erosion resistance of clay deposits.
Density Currents
Density currents constitute a special class of flow, where two
fluids with similar state and slightly different densities move with
respect to each other (Harleman, 1961.) The heavier fluid moving
under a lighter fluid is effectively subjected to a reduced
51
gravitational field
g = g (P - P)/P2 (4.13)2 1 2 (.3
where, p , p = density of the lighter and heavier fluid, respec-
tively.
Storage reservoirs frequently develop density stratifications
due to temperature, salinity and turbidity differences between
different layers. River flow entering a reservoir may, therefore,
develop into an overflow, interflow or underflow depending on its
density relative to that of various layers. From sedimentation
point of view, the most important of reservoir density currents is
the underflow developing due to the relatively higher density of
turbid river flow. This, turbidity current, is discussed in the
following.
The distinguishing features of turbidity current are: a plunge
point, where the river flow dives under the reservoir; a head that
forms in the front to provide the potential energy necessary to
overcome the inertia of reservoir water ahead of the current and the
main density current. The plunge point, Figure 4-5, is the point of
separation between the forward moving current and the induced
reverse flow in the reservoir. This point is physically marked by
collection of floating debris on the reservoir surface. The flow
after the plunge point may or may not be uniform and depending on
the bed slope, it may develop into a supercritical flow. A certain
amount of mixing between the current and reservoir water takes place
at the interface. This is not critical, at least in the subcritical
flows and turbidity currents are known to maintain their identity
over long distances. For example, during the year before the clo-
sure of diversion tunnels, density currents travelled through 120
miles length of Lake Mead to deliver about 8.5 million tons of
reservoir over a month and a half of turbidity flows (Bell, 1942).
52
Studies of velocity distribution in the density current head
show that there is an upward movement of sediment within the head
itself. In the body of the current, however, coarse silt, sand and
gravel particles settle down, so that the sediment load transported
by a reservoir turbidity current primarily consists of fine silt
and clay particles. In Lake Mead 90 Z of sediment transported by
density currents was smaller than 20 microns and 76 % finer than 5
microns with a current velocity of about 21 cm/sec (Bell, 1942).
Similarly, in his laboratory studies, Jia-Hua (1960) found that at
current velocities of 4-8 cm/sec, 90 Z of sediment lay below 10
microns and 50 % below 3 microns. He also quotes experience on
Kuanting Reservoir where, with a current velocity of about 20
cm/sec, 90 Z of sediment transported by the density current remained
below 130 microns and 50 Z below 3 microns. It appears that floccu-
lation of clay particles does not induce settlement of clay out of
the density currents.
Realizing the capacity of density currents to convey large
concentrations of fine sediments from inlet to the dam, Bell (1942a)
made an impassioned plea for selective withdrawal from reservoirs to
mitigate siltation. In such a system, the dam would be provided with
outlets at different levels from which the turbidity current can be
evacuated.
A number of theoretical studies on the dynamics of density
currents have been made in the past, e.g., Keulegan, (1944) and
(1949); Schijf and Schonfeld (1953); Jia-Hua (1960); Benjamin
(1968); Savage and Brimberg (1975); Kao (1977). Most laboratory
studies on density currents have been made with salt solutions.
Studies using solid particles have been reported by Bell (1942a);
Kuenen and Migliorini (1950); Jia-Hua (1960) and, Middleton (1966)
among others. Prototype measurements of density currents are even
fewer, especially, in large reservoirs. Both Bell (1942) and Howard
(1953) have reported data on Lake Mead; Geza and Bogich (1953) have
53

reported measurements on a small water supply and a medium sized
hydro-power reservoir; and Jia-Hua (1960) has quoted data from
measurements on Kuanting Reservoir. When the density current arrives
at the dam, it will rise and be reflected. Effective aspiration of
density current requires proper size and location of outlets.
Theoretical and experimental studies on the aspiration of density
currents have been reported by Yih (1965) and Jia-Hua (1960).
The existence of a plunge point is a necessary condition for
the formation of a density current. In general, the condition for
the development of a plunge point is
F - V / gH (4.14)o o 0
where, V - velocity and H = depth of flow at the plunge point.o 0
Theoretical value of F based on frictionless flow is 0.5. Savage0
and Brimberg (1975) estimate F to lie between 0.3 and 0.8. Jia-Hua0
(1960) has measured value of 0.78 in laboratory experiments. The
ratio of depths at the plunge point to that in the density current
according to Jia-Hua's data can be roughly estimated by
0.76H /H = 0.64 F (4.15)o 2
Under uniform flow conditions, the velocity of density current can
be estimated from Darcy-Weisbach friction equation
V/U - 8/f (4.16)
where, U , the shear velocity - g H ; f = friction factor and S
= bed slope. Measured value of f for the lower boundary of the flow
lie between 0.020 and 0.025 and it should be increased by about
0.005 to account for the additional shear force at the interface.
54

Erosion of Fine Material
In contrast with the bed material, the erosion or, for that
matter, the deposition of fine material depends much more on the
interparticle physico-chemical forces than on the particle size
itself. For this reason, the concept of critical shear stress as a
relation between mechanical forces tending to entrain the particle
in the bed and the granular friction tending to resist the motion,
(Chapter IV, Entrainment), is no longer valid.
The forces required to keep the fine particles in suspension
are almost negligible. Given appropriate mineral structure of clay
and water, clay particle colliding with each other will form flocs
which are a loose lattice of clay particles with a variable degree
of bonding forces. Flocs have larger settling velocity than
individual particles and as they settle to the lower flow boundary,
those with weaker strength are sheared again. Once the flocs
deposit in the bed, they form floc aggregates and aggregate
networks, which are still characterized by low density and a small
shear strength. With increasing overburden, the interparticle
distance is reduced and the bonding force is considerably increased.
The present (1986) understanding of deposition and erosion of
fine material has largely come from the extensive work done by
Partheniades (1972) in this field. Due to large variation of
relevant conditions in storage reservoirs, it is not possible at
this time to specify critical entrainment conditions for silt and
clays. In the mathematical modeling of reservoirs with significant
fine material load, two critical values are commonly defined. One,
for the threshold of deposition and the other, for threshold of
erosion. Typical value for the former are 0.5-1.0 N/mr2 and those
for erosion are 5-10 N/m 2. The following qualitative principles are
useful in understanding the deposition and erosion behavior of
clays.
55
If an initial concentration of clay particles is introduced in
a flow, it will soon develop an equilibrium concentration which is
nearly uniform along the depth and which is a constant fraction of
the initial value. This constant is a function of the boundary
shear stress and the clay mineralogy and as shown by Partheniades'
experiments, it is sensitive to small changes in temperature and
chemical composition of water. Once the material has been
deposited, the shear stress required to reentrain the particles is
much larger than that required to prevent its deposition. Further,
the critical shear stress for erosion increases with the age and
compaction of deposit. The gross soil mechanics parameters for
describing the strength of soils, such as shear strength, cohesion,
dry density and Atterberg limits do not correlate with the
initiation or rate of erosion, except in a limiting sense.
The erosion resistance of aged clay deposits in reservoirs is
well known. In river mechanics, the role played by old clay plugs
has been emphasized by Winkley (1977) and Mahmood (1963) has
described the problems created by clay layers in the development of
man-made cutoffs. Harrison (1983) cites his observation on South
Canadian River, where an old clay layer was exposed after about 3 m
cut through sandy stratum and it would not erode even though the
flow was competent to move cobbles.
56
CHAPTER V
PREDICTIVE METHODS FOR RESERVOIR SEDIMENTATION
The engineering interest in reservoir sedimentation primarily
concerns three physical aspects: total volume of trapped sediment;
spatial distribution of deposit volume and, sediment load carried by
flow releases including its particle size distribution. The volume
of deposit represents loss of storage capacity which reduces the
efficacy of a reservoir to regulate flow. The distribution of
deposit determines the relative impact of trapped sediments on the
usable storage as well as the prospect of flushing it. The sediment
load carried by flow releases is the potential source of abrasion
damage to power turbines and outlet works.
At the design stage, sediment load data for the stream are
expressed as seasonal rating functions of flow discharge. The load
may be measured in units of mass per unit time or as concentration
in the flow , e.g., ppm. The sediment inflow hydrograph to the
reservoir is then computed from the rating functions and flow
hydrograph. Part of the sediment inflow, that will be trapped in the
reservoir is calculated and with an estimated mass density for the
deposit, it is converted to the volume of deposit. The estimation
of density is an important step in this process because any
uncertainty in its value directly translates into a corresponding
uncertainty in the volume of sediment deposit.
Methods used to predict various aspects of reservoir
sedimentation can be broadly divided into two classes: empirical
methods that are founded on fairly correct understanding of the
physical processes but are based on the inductive analysis of data
and, mathematical models that are based on an analytical treatment
of hydraulic and sedimentary processes in the reservoir. Neither of
57
them is presently equipped to completely handle all of the three
areas of engineering interest and in practice a combination of the
two is used. Existing mathematical models will use the empirical
methods for estimation of density of deposits because a theoretical
model for this does not exist. Similarly, the present day empirical
methods cannot predict the concentration and particle size
distribution of sediment carried by flow releases from a reservoir.
This information, if required, must be obtained from an appropriate
mathematical model.
Most mathematical models are based on coupled or sequential
application of one-dimensional equations of motion for the water
phase and equation of mass conservation for the sediment. A few
exploratory attempts have been made to use two-dimensional models
based on sediment diffusion equation. Currently available methods
for predicting various aspects of reservoir sedimentation, both
empirical and mathematical models, are described in this chapter to
elucidate their scope and limitations.
Trap Efficiency of Reservoirs
Trap efficiency of reservoirs is defined as the proportion of
incoming sediment load that is retained in the reservoir. Empirical
methods to predict trap efficiency of reservoirs are represented by
the graphical techniques developed by Churchill (1947), Brune (1953)
and Heinemann (1981). Of these, the Brune's curve, Figure 5-1, is
most popular in practice mainly because it uses a rather simple and
readily available predictor. The independent parameter in this
method is the volume ratio of reservoir storage to annual water
inflow and the dependent variable is trap efficiency. Factors such
as reservoir shape and frequency of drawdown are not considered.
Churchill's curves are based on a more appropriate parameter, called
sedimentation index. This is defined as the average retention time
divided by the mean velocity of flow in the reservoir. Heinemann
58

80Ff~~I I II:XH ° o0 __//__Mei_a_Cure_fo_Nomal_e_eroir
Z 0// 6nvlp Cre
90
~8OCe)L"JCL70
Med an Curve for Normal Reservoirs60
50
'.0~ ~ 4
Envelope Curves
20-
10
10-3 2 4 6 8 10-2 2 4 6 8 10-1 2 4 6 8 100 2 4 6 8 10'
CAPACITY - INFLOW RATIO
FIG. 5-1 BRUNE'S CURVE FOR RESERVOIR TRAP EFFICIENCY
curve is a revision of Brune curve for reservoirs with catchment
areas less than 40 km2.
Brune's curve is based on data obtained from 44 reservoirs
covering drainage areas of 4 - 480,000 km2 . The capacity: inflow
ratio in his data varies from 0.0016 to 4.65 and the trap efficiency
from 0 to 100 percent. In the analysis of his data, Brune made a
distinction between reservoirs that are normally ponded, i.e.,
operated without any effort to sluice sediment; those where sluicing
has been used as an operational policy and, the desilting basins.
His median curve, (Fig. 5-1), can be approximated by
T = 100. r 1 (5.1)1222.92 log ( V(H )/I (.
where, T - trap efficiency in percent; V(H ) - reservoir capacitym
upto H - mean operating level, and I - average annual flow. Both Vm
and I are expressed in similar units of volume. This method, or for
that matter the Churchill and Heinemann curves, cannot be used for
durations less than a year. According to U.S. Bureau of Reclamation
(1977), the period of computation for Brune's method should not be
less than 10 years.
Heinemann's data show that Brune's curve overestimates the trap
efficiency of small reservoirs to some extent. In general,
reservoirs with storage capacity larger than about 0.1 km3 will trap
nearly 100 percent of incoming load. In practical applications,
Brune's median curve should be treated as a good approximation.
Spatial Distribution of Deposits
An empirical method to predict the spatial distribution of
deposits is given by U.S. Bureau of Reclamation (1977). The "Area
Reduction Method" is based on the premise that sediment load in a
60
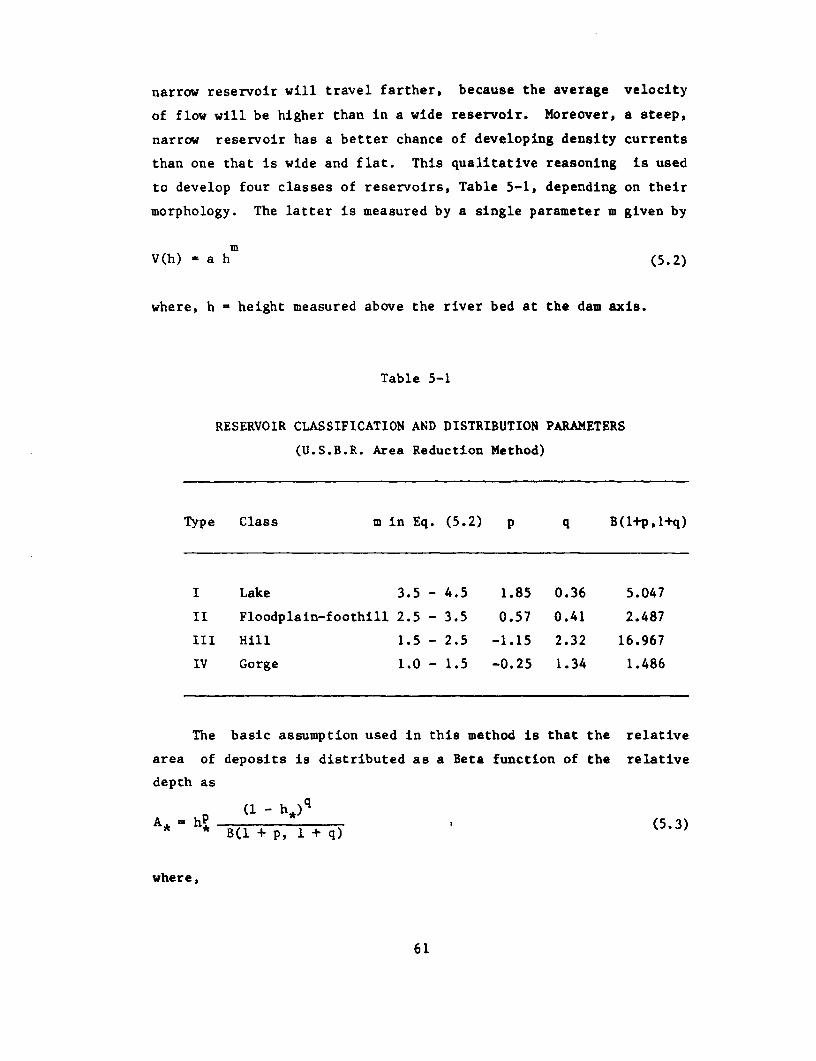
narrow reservoir will travel farther, because the average velocity
of flow will be higher than in a wide reservoir. Moreover, a steep,
narrow reservoir has a better chance of developing density currents
than one that is wide and flat. This qualitative reasoning is used
to develop four classes of reservoirs, Table 5-1, depending on their
morphology. The latter is measured by a single parameter m given by
mV(h) - a h (5.2)
where, h - height measured above the river bed at the dam axis.
Table 5-1
RESERVOIR CLASSIFICATION AND DISTRIBUTION PARAMETERS
(U.S.B.R. Area Reduction Method)
Type Class m in Eq. (5.2) p q B(1+p,1+q)
I Lake 3.5 - 4.5 1.85 0.36 5.047
II Floodplain-foothill 2.5 - 3.5 0.57 0.41 2.487
III Hill 1.5 - 2.5 -1.15 2.32 16.967
IV Gorge 1.0 - 1.5 -0.25 1.34 1.486
The basic assumption used in this method is that the relative
area of deposits is distributed as a Beta function of the relative
depth as
(1 - h*) q
* B(l + p, l + q)
where,
61
A (h *) A ' (5.)Af
ref
h h (5.5)H
B(.,.) = Beta function, parameters p and q are functions of
reservoir class, See Table 5-1, A(h) surface area of deposit at
elevation h, A 5 parametric area of deposit and, H - value of href c
for the active conservation pool level. The vertical distribution
of volume of deposit, V is a function of h, asd
h
Vd(h) f dA(y) dy ; h4L H (5.6)
0
and, the total volume of deposits upto the active conservation level
is V (H ). The value of parameter A can be computed from thed c ref
fact that for the level of deposit at the dam axis, the surface area
of deposit is equal to the surface area of the reservoir itself.
This condition is expressed as
Vd (Hc Vd(h) 1 |d( o)
H A(h ) A*(h* ) L:(H;)
where, h - height of deposit at the dam axis and h h /H . Both0 *0 0 c
the left and right hand sides of Eq. (5.7) represent the average
height of deposits above h , taken as the prismatic volume above0
A(h ) and, expressed as a fraction of H . The left hand side is ao c
function of reservoir morphology and h and, the right hand side is0
a function of parameters, p and q and h . Eq. (5.7) is solved by
trial and error for h . The corresponding value of A is obtained*0 *o
from Eq. (5.3) and of A from Eq. (5.4). Values of A are thenref *
62
calculated for other values of h* and the volume of deposits from
bed upward is computed by numerical integration. A step by step
procedure for the above method based on graphs of Beta functions is
given in U.S. Bureau of Reclamation (1977).
Reservoir pool level is a fluctuating quantity. The
distribution given by the area reduction method is based on the
volume accumulated upto the top of active conservation pool. A part
of deposit, related to the sediment inflow during floods, will be
located above the active conservation level, H . This has to bec
separately estimated and the above method applied to the balance
distributed between O L h 4 H . The proportion of total depositc
above H will be larger for reservoirs that have a greater componentc
of storage capacity allocated to flood control and this may sometime
reduce the utility of area reduction method inasmuch as it does not
treat the volume of deposit above Hc
The area-reduction method has been based on data obtained from
30 reservoirs. It does not account for temporary or prolonged
reservoir drawdown brought about as an operational necessity or as
a deliberate sediment sluicing operation. Also, it does not
consider the sediment size distribution as a factor in the problem.
In practice, these conditions can be accounted for by shifting the
computed reservoir class in Table 5-1 upward or downward. For
example, if the fine material constitutes a large component of the
sediment load, or if the reservoir experiences considerable
drawdown, its class should be shifted downward.
Frequently, a reservoir will not have a unique value of m for
its entire depth. In such cases, the reservoir class in Table 5-1
is selected on the basis of m value in the segment where most of the
deposit will occur. A problem in selecting the reservoir class is
also experienced in compound reservoirs. The only recourse in that
case is to use some judgment in selecting the reservoir class and to
63
apportion the volume of deposit to each segment of the reservoir
(Dorough, 1986).
This method is to be applied to the distribution of deposits
accumulated over long periods, such as a few decades and not for the
year-to-year accumulation. Application of the method to reservoirs
that significantly differ in design, operation and sediment
characteristics from those used in its derivation may yield
substantially inaccurate results.
Mathematical Models
Mathematical analysis of sedimentation transients is based on
the premise that the dynamic action of flow acting through sediment
transport is the driving force and sediment deposit (or scour) takes
place due to the spatial variations in the transport rate. As the
sediment transients move at a much small rate compared to the celer-
ity of water waves, the discharge can be considered to be steady
during the time interval used to compute scour/deposition [e.g.,
Mahmood, (1975), Chen, et al (1975)]. Given this simplification, the
govern-ing equations for the sediment transient are
Equations of Motion:
-3 Q I Q 2 ~~~~~~~~~~~~~(5.8)at (gA )+ x (g +Y
Equation of Continuity of the Bed Material:
aG ac a a (5.9)b + s + (C A) + p*- (B z) =0
3x 3x at s at d
where, Q - discharge; g - gravitational acceleration; A - area of
cross section; y - water surface elevation; S - energy gradient;
64
G = bed load; G = suspended load; C average spatial sedimentb s sconcentration in the cross-section; p* = density of sediment in the
bed; B = the deformable bed width; z = bed elevation; x = distanced
along the channel bed measured in the downstream direction and, t -
time.
Eqs. (5.8) and (5.9) form a set of hyperbolic equations. They
require two supplementary equations. One relating S and the other
relating sediment transport quantities: G , G and C , to the flowb s s
and sediment size values. For uniqueness, they also require the
initial conditions and boundary conditions to be specified. In
reservoir sedimentation, the accuracy of initial conditions is not
very critical because they are overtaken by the deposition process.
At the downstream end, hydrograph of reservoir pool elevation
provides appropriate boundary condition and at the upstream end, the
discharge and sediment inflow hydrographs provide the necessary
boundary conditions. The model results are very sensitive to the
sediment inflow boundary condition and to the accuracy of
supplementary equations used to compute sediment transport
quantities.
The above equations constitute a one-dimensional representation
of sediment transients. They can be solved by one of the finite
difference schemes. In implicit formulations (e.g., Mahmood and
Ponce, 1976), that solve the two equations simultaneously over the
total space domain, the numerical stability problems are much
smaller but, the development of computer program is more expensive.
In a simple, sequential-explicit formulation, the dynamic Eq. (5.9)
is first reduced to steady nonuniform flow by dropping out the
unsteady term. It is solved by backwater computation methods and is
followed by the calculation of bed level changes through Eq. (5.10).
The advantage is a rather simple solution algorithm but numerical
stability considerations will require small time steps. Total
computational time, however, may or may not be larger than the
65
implicit method. Other advantages of this method are that any
sediment transport function, irrespective of its complexity can be
used in the computer analysis and channel networks can be easily
handled.
Another consideration in mathematical modeling of reservoir
sedimentation is that because of strong hydraulic sorting of
sediment sizes in reservoirs, bookkeeping of sediment deposit is to
be maintained by various grain size fractions at different
elevations in the deposit. This is necessary to realistically model
the reentrainment of deposits under lower pool elevations and is
especially critical if the size distribution of sediment is such
that an armor layer may develop during sediment reentrainment phase.
Such a bookkeeping is much easier done with the sequential-explicit
algorithms. The most popular and commonly available program pack-
age, based on this algorithm, is U.S Army Corps of Engineers' HEC-6
program (1977). HEC-6 provides for bookkeeping of deposits by
various particle size classes and any sediment transport function
appropriate to the conditions at a site can be built into it. This
model has been adapted to the special conditions at proposed
Kalabagh Dam for investigations relating to Project Planning Report,
executed under the World Bank supervision (Pakistan WAPDA, 1984).
A major difficulty in the application of available reservoir
sedimentation models arises from the fact that none of the available
bed material load functions has been tested on deep reservoirs flows
or for the degree of nonuniformity of flow experienced in large
reservoirs. Toffaleti's method (1969), among all of the available
functions, is based on the largest range of flow depths but even
that falls short of the depth found in large reservoirs. The bed
material load functions are, also, deficient in their treatment of
fine material load (Chapter IV). In most sandbed rivers, this is a
serious handicap because 50 percent or more of the total load in
these streams lies in clay-silt size range. In general, the bed
66

transient models will adequately simulate the sedimentation
processes over the delta but downstream of that their reliability is
questionable. These difficulties have given rise to another type of
models that treat the reservoirs as desilting basins.
Hurst and Chao (1975) abandoned the one-dimensional transient
model in their planning studies for Tarbela Dam. Instead, they
adopted Camp's (1944) trap efficiency curves for desilting basins.
Such a model will most likely succeed in the early life of
reservoirs that do not experience significant drawdown. When the
delta has formed in the reservoir and at least part of the reservoir
flow is of riverine type, the method will fail because desilting
basin models, such as Camp's, are based on the assumption that the
lower boundary of the basin is an absorbing boundary with no
reentrainment. The operational experience at Tarbela shows that
Hurst and Chao's analysis grossly under-estimated the streamwise
progression of delta. The actual delta crest after 9 years operation
was located about 12 miles upstream of the dam instead of 30 miles
predicted by their model. This is directly attributable to the
afore mentioned reason.
A sediment diffusion model has been used by Merrill (1980) to
simulate the sedimentation in three reservoirs in Nebraska and
Illinois in which 90 percent of sediment load consists of clay-silt
sizes. This model is based on two dimensional diffusion equation
solved by an explicit numerical scheme. The reservoir is divided
into cells of similar area in plan and incoming sediment load is
routed through these cells from the inlet to the outlet. The
diffusion constant is a key parameter of the problem and it was
empirically computed from the available reservoir sedimentation
data. The conceptual approach of Merrill's study is appropriate and
it shows that diffusion type models can be applied to reservoir
sedimentation where the primary sediment load is in clay-silt range
and reentrainment of deposits is not present. At present (1986),
67
realistic values of sediment diffusion coefficient in reservoir
flows are not available and the erosion functions for silt and
clays, that are important in fine material dominant streams are not
sufficiently known.
Evaluation
Reservoir sedimentation is a complex phenomenon in the sense
that definitive knowledge on many of its physical processes is not
available. Examples of processes that strongly influence the form
and location of deposits but which cannot be predicted with
sufficient certainty are: three dimensional nature of flow; chemical
regimes and stratification in the reservoir; three dimensional
features of density currents; flocculation of clays; fall properties
of flocs and, threshold conditions as well as rate of reentrainment
of fine material deposits.
Two primary inputs to the reservoir, water discharge and
sediment load, naturally vary from year to year and in certain
cases, catastrophic events in a catchment may impose unprecedented
loading, far different from the average. The use of a reservoir is
bound to undergo some change during its lifetime and more
importantly, economic factors may evolve in the future with a
consequent shift in the project objectives. Under these
circumstances, predictive methods in reservoir design analysis can
only be expected to provide a statistically averaged answer based on
the present perception of the future. In the actual future,
csubstantial deviations from the present predictions may occur
because, there is no control on the magnitude and sequence of future
inputs and, future operation policies may differ from those assumed
at the design stage.
68
With the increasing age of world reservoirs, their problem of
siltation is currently in the fore front. There is a greater
emphasis on prolonging the life of reservoirs both in the design of
new projects and in the operation of existing structures. Predictive
methods are needed to evaluate the performance of measures such as
sediment sluicing and flushing used to alleviate the rate of
reservoir sedimentation. Also, there are new areas of concern such
as the particle size distribution of sediment carried by flow
releases that were not quantitatively treated in the past. The
evaluation of empirical and mathematical modeling techniques has to
be viewed in this context.
The essential difference between the empirical and mathematical
modeling techniques for reservoir sedimentation lies in their scope.
The empirical techniques are simple and mostly graphic. They are
expected to yield an approximate answer. They do not require
advanced technical skills or computers in their application. Hence,
they are relatively inexpensive to use. Empirical models cannot be
used to predict the time-dependent behavior of reservoirs within a
yearly cycle or even, over a few years. Also, they are not suitable
for special operational conditions applicable to mitigative measures
discussed in Chapter VI.
The mathematical models, on the other hand, are broader in
scope. They require specialist technical inputs and computational
skills and more importantly, they require considerably greater data
inputs. They are, consequently, two to three orders of magnitude
more expensive than the empirical methods. In contrast with their
empirical counterparts, properly developed and calibrated
mathematical models can be used to analyze time-dependent behavior
of reservoirs, including special conditions imposed by sediment
sluicing and flushing operations (See, Chapter VI). At the current
(1986)'state of-the-art, mathematical models are based on hydraulic
resistance and sediment transport functions that have been derived
69
from open channel flow. Their applicability to the deep flow in
storage reservoirs has not been investigated so far. Bed material
type transport functions derived from channel flows are not expected
to apply to the fine material load which is the dominant fraction
and which plays an important role in reservoirs. The lack of know-
ledge on the reentrainment of clays after they have initially
deposited in reservoirs and the sensitivity of density current
formation to thermal and chemical regimes of impounded waters, also,
makes the results of present day mathematical models approximate to
an extent.
Many small projects, cannot bear the cost of detailed
investigations by mathematical models and will have to rely on the
empirical models. On most of the large projects, engineering
investigations, involving simultaneous applications of different
mathematical models for various components of the problem and some
original investigations will be found to be economically
justifiable. There is a need to improve the accuracy of both the
empirical methods and mathematical models. This is discussed in
Chapter VII.
70

CHAPTER VI
MITIGATION OF RESERVOIR SILTATION
Loss of reservoir storage to siltation is the primary concern
in this monograph. Reservoirs have other sediment related impacts
on the river channel upstream and downstream, such as retrogression
of river bed level on the downstream side and the aggradation and
flooding on the upstream side. Some of these adverse effects are
also mitigated if the accumulation of sediment within the reservoir
is reduced. For example, if the incoming load is flushed through,
the channel deterioration is ameliorated to a large extent. In this
chapter, the mitigation of loss of storage to sediment accumulation
remains to be the main concern. Benefits accruing to other areas
will, however, be identified where applicable.
The methods for controlling reservoir sedimentation can be
divided into three categories. The first category consists of
methods that reduce sediment inflow into the reservoirs. These are:
control of sediment generation through watershed management; reten-
tion of sediment in debris basins before the river enters the reser-
voir and, bypassing sediment. The second category consist of
methods that use hydraulics of flow to reduce the accumulation of
load that has entered the reservoir. Sediment flushing operations,
sediment sluicing through specially designed reservoir operation
policies and release of density currents belong to this category.
The third category consists of hydraulic dredging of existing
sediment deposits. All of these methods have been tried to some
extent and, generally, none of them will provide a complete
mitigation. These methods, their scope and limitations are discussed
in the following.
71
Watershed Management
Intuitively, the first method of reducing reservoir siltation
would be to reduce sediment yield from the basin upstream of the
reservoir by watershed management. Such a scheme would involve
afforestation, land use change and construction of micro structures
to control gulley erosion and to trap sediment. The forests are an
indispensable component of world's ecological system. As such,
watershed management as a means to provide sediment control in
reservoirs always finds strong moral support. Facts, on the other
hand do not support its efficacy, as far as reservoirs are
concerned.
The world average for sediment load concentration is less than
500 ppm, (See Chapter III, page 26). This is almost an ideal
situation for reservoirs. With this concentration, a storage built
with a gross volume equal to mean annual flow will lose less than
0.04 percent of volume to siltation each year, compared to about 1
percent of the estimated average rate of siltation of world dams.
Consideration of sediment load in world rivers in Chapter III has
shown that high concentrations of sediment are largely associated
with climatic, tectonic and geological factors. The effectiveness of
human actions in controlling these processes is doubtful. There is
the additional factor of watershed acting as a strong low pass
filter which dampens the space and time variations of sediment
generation within the basin. Coon Creek data (Chapter III--Human
Impact on Sediment Yield) appear to support the conclusion one would
draw from the physical processes operative in drainage basins, that
over periods of engineering or economic interest, the sediment
yields are largely unaffected by watershed management. The
sediment sources within the basin, including its hillslopes, valley
floors and river channels will amply make up for whatever reduction
of erosion can be effected by watershed control. A case in point is
Mangla watershed in Pakistan, where an extensive watershed
72

management project was initiated before the construction of dam.
Mangla Dam is a multipurpose, 112 m high earth-rockfill dam on
Jhelum River in Pakistan with a crest level of 376.1 m. The design
maximum reservoir elevation is 374.3 m, the top of conservation pool
is at elevation 366.4 m and that of the dead capacity at 317.0 m.
The total storage capacity of the reservoir to elevation 374.3 is
9.47 km3; usable capacity from elevation 317.0 to 366.4 is 6.58 km3
and the dead capacity is 0.67 km3. The catchment area of Mangla is
33,333 km 2 . A schematic of Mangla catchment, including gaging
stations, is shown in Fig. 6-1. Also shown in this figure are sub-
catchment areas, their mean annual flow and measured suspended load
concentration for WAPDA's 1970-75 data (Rehman, A., undated).
Relevant data for sub-catchments are tabulated in Table 6-1. It is
seen that of the gaged streams, Kanshi River brings in the highest
concentration of sediment followed by Kunhar and Punch, both of
which have roughly equal concentrations. The main sediment
contribution of 73.4 percent comes from area below Kohala which
contributes only 11.7 percent of flow volume.
Two reservoir sedimentation surveys were carried out in Mangla
reservoir during 1970 and 1973. They measured average annual deposit
of 0.037 km3. According to its design operation, the reservoir is
filled up in late August when most of the heavy sediment
concentration has passed. Field inspections have shown no backwater
deposits at the reservoir inlets. Power inlets are located about 31
m above the original river bed. Sediment concentrations have been
periodically measured in the power flow and generally average about
25 ppm. Larger concentrations associated with high river flows have
been measured up to 430 ppm (river flow - 11,160 m3/sec; reservoir
level - 365m). They are, probably, associated with weak density
currents. The average trap efficiency of the reservoir is estimated
to be around 99 percent.
73

..Q.. Gaging StationA - Drainage area Neelum at MuzzarabadF - Mean annual flow A a 7,278 Km2
C - Measured suspended concentration F - 10.1 Km3A. F. C: Average from WAPDA's 1970- C a 440 ppm1975 data.Data for Mangla Dam site based onsome extrapolation for ungaged area(Rehmam, undated).
Jhelum at ChinariA - 13,598 Km2
Kunhar at Garhi Habibullah F - 9.2 Km3
A a 2,383 Km2 C - 270 ppmF - 3.1 Km33
C - 1,350 ppm
L Jhelum at KohalaA - 24,890 Km2
,hu a A_a_ a F a 21.8 KM3
C a 880 ppmJhelum at Azad Pattan t
Kanshi at PoloteA - 1.197 Km2 Jhelum at KaroteF - 0.2 KM3
C - 13,950 ppm
Punch at Kotli_0= A - 3.238 Km2
F - 3.3 KM 3
C - 1,330 ppmJhelum at ManglaA - 33,333 Km2F a 24.7 KM3 0C - 2,900 ppm _ ....
mangla Dam
FIG. 6-1 SCHEMATIC CATCHMENT OF RIVER JHELUM AT MANGLE DAM
74

Table 6-1
MANGLA DAM CATCXMENT:MEAN ANNUAL WATER AND SEDIMENT
CONTRIBUTIONS (1970 - 1975)
River Station Drainage Flow Measured SuspendedArea Sediment Load(kM2) km3 cm % 10 tons C x
Neelum Muzaffabad 7,278 10.1 139 40.9 4.4 440 6.2
Jhelum Chinari 13,598 9.2 68 37.4 2.5 270 3.5
Kunhar Garhi Habibullah 2,383 3.1 130 12.6 4.2 1350 5.9
Jhelum Kohala 24,890 21.8 88 88.3 19.1 880 26.6
Kanshi Polote 1,197 0.2 17 0.6 2.2 13,950 3.0
Punch Kotli 3,238 3.3 102 13.5 4.4 1,330 6.2
Jhelum Mangla 33,333 24.7 74 100.0 71.5 2,900 100.0
Notes:
1. Data adapted from Rehman (undated). In the original,data for Mangla are based on extrapolations for un-gaged area, which may be in error. For example,annual flow volumes at Mangla always less than thepartial sum: (Jhelum at Kohala + Kanshi at Polote +Punch at Kotli). Similarly, the estimated sedimentload at Mangla is significantly higher than surveyeddeposit volumes. Numerical values of flows and sedi-ment load at Mangla should be viewed with caution.Percent values for sub-catchments are judged to berepresentative.
2. Percentages refer to values at Mangla.
3. All values rounded off.
75
A brief description of various sub-catchments at Mangla Dam
(Pakistan WAPDA, 1961) follows:
River Neelum rises at about 5,200 m elevation and has a
gradient of about 1.86 percent in 240 km length. A significant
part of its runoff originates in the glaciers and permanent
snow fields of Nanga Parbat Massif. Mean annual precipitation
in its catchment is about 150 cm.
River Kunhar rises at an elevation of about 4,270 m. Glaciers
and small ice fields of Kaghan with mountain peaks around 5,000
m elevation, are an important source of its water supply. In
its upper 130 km, the river has a slope of about 1.89 percent.
Mean annual precipitation in its catchment is about 150 cm.
River Jhelum at Chinari passes through a number of lakes in
Kashmir Valley where it loses most of its sediment load. In
the last 130 kms, it has a gradient of about 0.62 percent.
Mean annual precipitation in this catchment is around 120 cm.
Kanshi River rises in gravel uplands at an elevation of about
760 m. It has an average gradient of about 0.47 percent.
Average annual precipitation in this catchment is around 95 cm.
Punch River rises at an elevation of about 3,050 m. Over a
length of about 130 km, it has a gradient of about 1.89 per-
cent.
A watershed management project was prepared for Mangla in 1959.
This comprised two sub areas. An area of 7,640 kM2, in the lower
catchment, considered to be the most serious sediment contributor,
was selected for priority treatment. This area was photographed and
mapped for land use and capability. Another area of about 7,800 km2
covering the northern tributaries of Neelum and Kunhar was
76

considered to be less serious and it was not photographed. Most of
the rocks in the study area are inherently erodible--from the uncon-
solidated loess to the limestones and schists which have suffered
continual disturbance by earth movement. The overall geologic
erosion is judged to be high due to precipitous hill slopes. The
vegetal cover, even at high altitudes, has been disturbed by human
activity, to an extent that it is ineffective against erosion. In
the priority area, good protective forest covers less than one
percent of the area.
The management project comprising a large number of structural
and non-structural measures in the priority area, started in 1959-60
with the primary objective of reducing the sediment load at Mangla.
It was anticipated that as a result of the project, sediment load at
Mangla will reduce by about 30 percent, with most of the reduction
effected in the loads contributed by Kanshi and Punch Rivers. The
project also aimed at ameliorating local environmental conditions
and improving productivity. The 30-year project has been phased
into a seven-year demonstration phase (1959 - 1966), followed by a
23-year operation phase. Estimated total cost of project, up to
1988, is Rs 339.3 millions.
In order to evaluate the effect of project on sediment load,
discharge and measured suspended sediment data for 4 stations in
Mangla catchment are shown in Figs. 6-2 thru 6-5. They have been
extracted from published stream gaging data. In each case, no dis-
cernible difference in the sediment loads is noted over a period of
4-14 years of treatment. Note that, Figs. 6-4 and 6-5 pertain to
measured sediment data in Kanshi and Punch rivers, especially
targeted for the management activity. with time lapse of 11 and 14
hears, respectively. Judged from the trend of measured sediment data
and Coon Creek experience (Chapter III) the impact of watershed
management plan on the sediment load at Mangla Dam is likely to be
insignificant. That is, not to say, however, that this project is
77
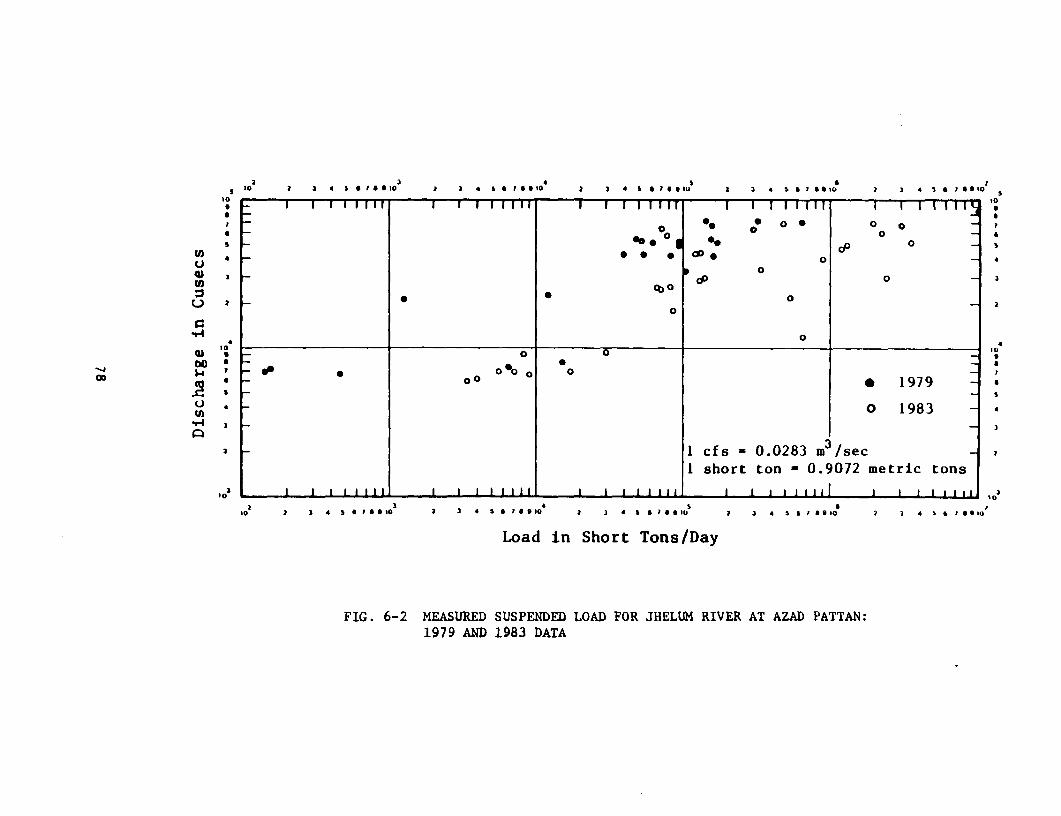
3 10 a 3 4 567I6a0 3 3 4 a61a930 3 4 *16au 30 lo3 4 3Ia9 0S
10 30~~~~~~~~~~~~~~~~~~~~~~~
u: 0s 0.0 4 0D 03
in~ ~ ~ ~ ~~~odi hotTn/a
0~~~~~
p4 o~~~~~~~~~~~~~~~~~ 30 3
00 0 0 J ,0 ao
S a0~~~~~~~~~~~~~ 0 *~~~~~~~~ 1979
1979 AD0 1983 D
I cfs 0.0283 m3 /sec3I short ton - 0.9072 metric tons
30 3 4 5 a1I 30 30 3 4 561a51 a l 3 4 56100I a3 o 3 49153 2 3 45S6 I0030
Load in Short Tons/Day
FIG. 6-2 MEASURED SUSPENDED LOAD FOR JHIELUM RIVER AT AZAD PATTAN:1979 AND 1983 DATA

5 10 3 Z 1671t10 a 3 4 s 4 80 a 3 t o a 1 0 10 2 3 4 1 0 2 a 9 00 2 3 4 0 Soto0 ?
(0 10~~~~~~~~~~~~~~~~~~~~~~
a a 0~~~~~~~~~~~~~~~~~~~~~~
. S 0 0 0 "
* *0 0 0 - ° 0 0
vo .r o ° o ° | 1 o 1977~~~~~~~~~~~~~~~~so0 0 '
(0~~~~ ~~~~~~~~~~~~~ 0g * 0 4
U ~~~~0 0 0 3
(0~~~~~~~~~~~~~~~~~~~~,
V4 /0 0 4 0~~~~~~~~0 0 c
,.) _ I cfs -
41~~~~~~~~~~~~~ shr on-0902mtrctn
00 0 0 0 0~~~~~~~~~~o
.. . , . .... * , , . .,, ......... 0 10 90
o) o 9I
I cfs 0.0283 n3 /sec 1 short ton - 0.9072 metric tons
20 3
t0 2 3 4 1610I a 3t 3 4 & s,Iso, o 2 3 4 a61001 ** 3 4 S0100810 2 3 4101a00Sos
Load in Short Tons/Day
FIG. 6-3 MEASURED SUSPENDED LOAD FOR JHELUM RIVER AT KAROT:1969 AND 1979 DATA
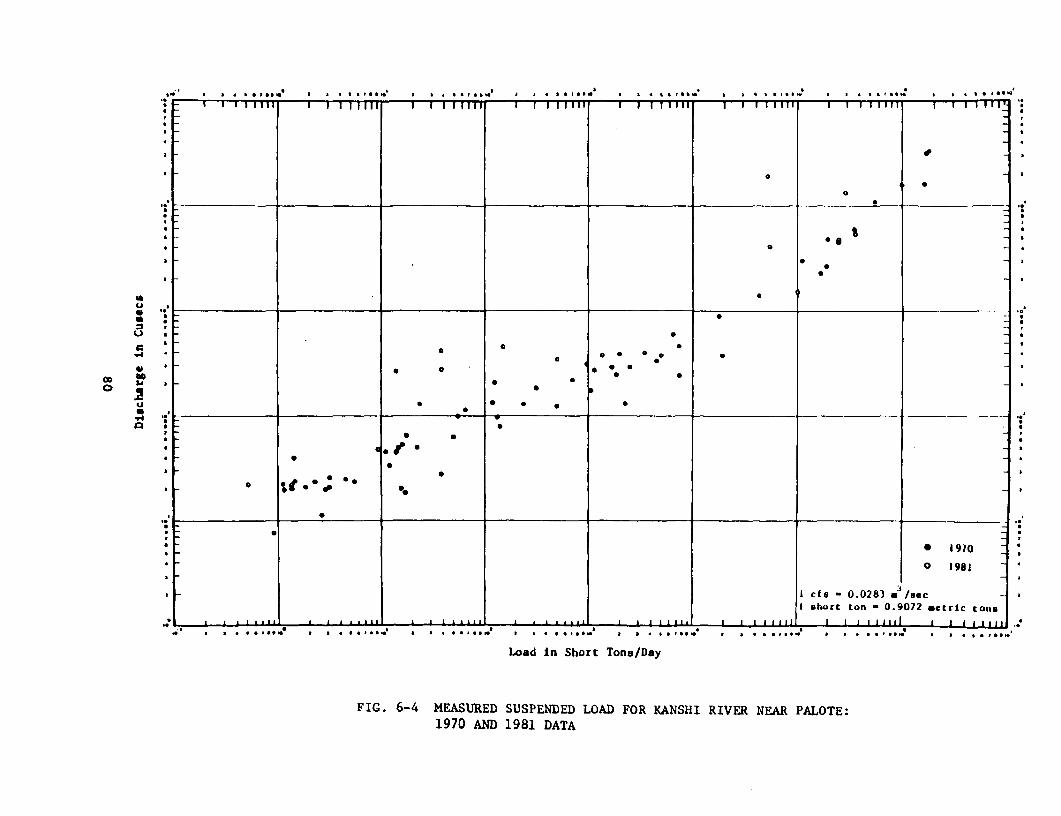
.0B S 8 * * *p**U S | a a ChC S C a CISI. U I * hC a e*@ a . .b .. af ^* a * C |*II . a .a I*. . a a9t a %*., ., ,,,, ,,11 ,,,, ,, ,,,,,,, ,, ,,,,,,, ,- 111111 I 1111 """ '111 ' """11 ' ' ""'1 '
* i * a-1gi
I. _________ _I cfs 0.0283 a3/ec - .
I sbort ton - 0.9072 metric totnc
Load in Short Tons/Day
FIG. 6-4 MEASURED SUSPENDED LOAD FOR KANSHI RIVER NEAR PALOTE:1970 AND 1981 DATA
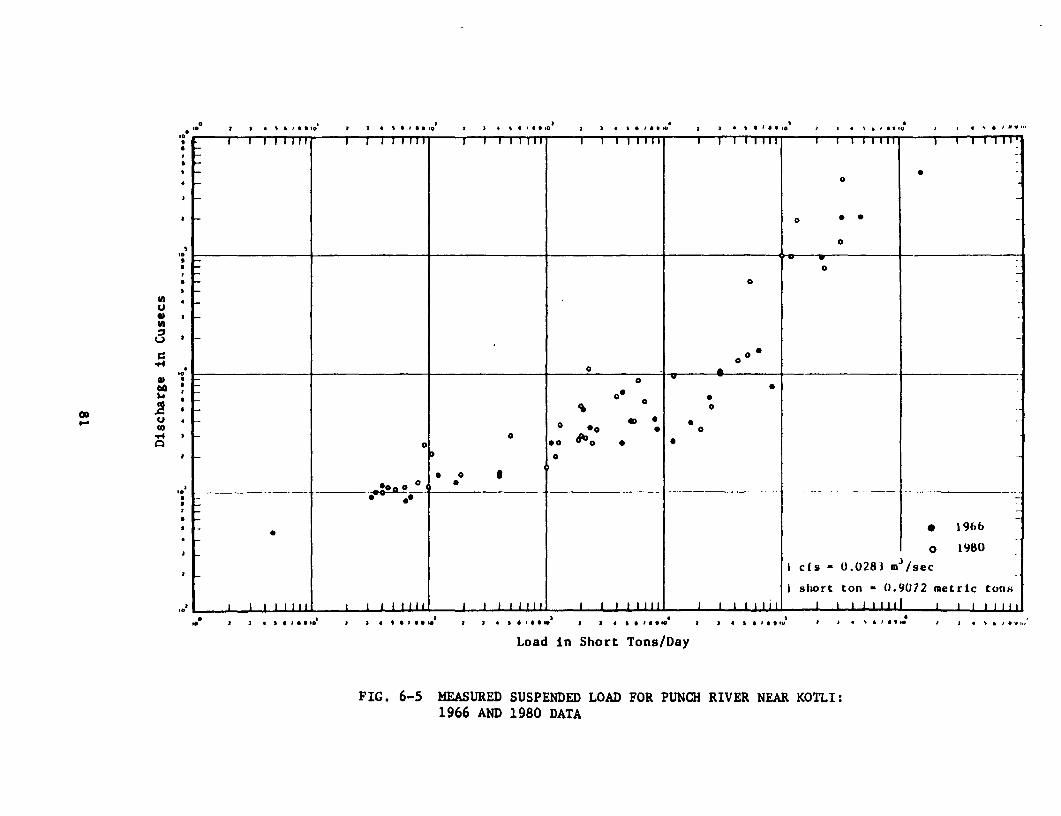
eo a a , s , * * ^,,' a X s * 3 * * oa I 3 4 1 3 I 0 1 ,*
*o I I iiiiil I I 11111) I I 111111 I I 111111 I I I Illil1 I I 1 111t11 , ,, ,,,,,
0~~~~~~~~~~~~~~~~~~~~~~~~~~~~~~~~~~
* 0~~~~~~~~~~~~~~~~~~~~~~~~~g
*0 0 *
*~~~~~~~~~~~~~~ 0
0 0 ~ ~ ~ ~ ~ ~ ~ ~ 0
.0... .. w. *,.. , .................... *.,. ,, ,,.. 19.66..., ,, ,
Load in Short Tons/Day
FIC, 6-5 MEASURED SUSPENDED LOAD FOR PUNCH RIVER NEAR KOTLI:1966 AND 1980 DATA
not useful or that it is unproductive. Its beneficial impact on the
local environment and productivity must be high; but, in the context
of Mangla reservoir sedimentation, its contribution is doubtful.
Debris Dams
The concept of a debris dam is to control the sediment inflow
into a reservoir by damming up one or more of its main sediment
contributing tributaries. Debris dams are generally much smaller
than the main dam. However, for their own safety, they are provided
with spillway structures of appropriate discharge capacity.
Experience with the silting up of two sediment reservoirs on
mountain streams is given by Armatov et al (1974). These reservoirs
silt up faster than the main dam and due to their smaller capacity,
sediment deposits in such reservoirs approach the original river bed
material more so than in the larger reservoirs.
In general, two factors work against the economic viability of
debris dams. One is their short life and the second is the economy
of scale. The larger the sediment concentration in a tributary, the
smaller will be the life of a debris dam built on it. A significant
portion of the cost of a storage is related to the foundation
treatment at the dam and the construction of appurtenant structures,
such as spillways. The storage at a debris dam is short lived and
it is not expected to reduce the design flood at the main dam. In
general, a debris dam provides no relief to the main dam except in
the sediment storage capacity. The cost of a debris dam is,
therefore, to be weighed against the provision of an equivalent
storage in the main dam and, the latter is generally much cheaper.
Debris dams are sometimes found to be useful in retaining the coarse
material, which may induce serious problems due to backwater deposit
in the main reservoir.
82
Sediment Bypassing
Conceptually, it is possible to bypass a portion of the
incoming sediment load around the storage. This has been attempted
on small irrigation reservoirs (Urlapov, 1977). The flood flows in
this case are passed through the main channel, while the irrigation
supplies are stored in a reservoir formed on the flood plain.
In large reservoirs, the difficulties of handling large volumes
of flow in sediment excluding structures and in locating areas for
sediment disposal require a bold design approach, which has not been
attempted. The size distribution of sediment load is also a
critical factor in the design of bypassing works. In general, it is
not possible to remove significant quantities of silts and clay
through sediment excluders. Of the sand load, the excluders can
optimally remove only about half of the load with one-tenth of the
flow. A variant of sediment bypassing is the off-channel storage
reservoirs. In these reservoirs, sediment exclusion can be achieved
by sediment excluders for coarse material and by shutting off
diversion during floods.
Sediment Flushing
Sediment flushing is, herein, used to describe the method of
hydraulically clearing existing sediment accumulation in a dam,
possibly, through a low-level outlet. In these operations, it is
sometimes erroneously assumed that merely releasing the flow will
erode the deposits which can be flushed through the outlet
structures. To understand the operation of sediment flushing, one
refers to the sediment continuity Eq. (5.9), rewritten, after
dropping out the spatial concentration term, as:
aG + B P - 0(61ax d * At
83
where, G - total sediment transport and other terms have been
defined under Eq.(5.10). Equation (6.1) states that the time rate
of lowering of bed level, z, is proportional to the spatial rate of
change in G. Thus, at any cross-section
_z 1 3G____ - - ~~~~~~~~~~~~~(6.2)
a t Bdp* 3x
With a given flushing discharge, in a reservoir with level pool, G
decreases along the direction of flow, because the area of cross
section increases and the velocity decreases. Thus, and
would be greater than 0. That is, with a level pool, the deposits in
the upper reaches tends to aggrade. In the lower and deeper parts
of reservoir, where G - 0 and 0, there will be no change in3x
the elevation of deposit. This is the typical process of deposit
formation in reservoirs so that with a level pool, flushing will not
move the main bulk of deposits any closer to the outlets.
As the low-level outlets are first opened in a reservoir with a
level pool, the local concentration of flow entrains the fine
material deposits close to the outlet. This gives a false impression
to a lay observer of extensive desilting of the reservoir. As soon
as the local deposits are removed, this action will stop. The
velocity of flow away from the outlet decreases, roughly, faster
than the square of the distance. So that, in a relatively short
distance, the velocity becomes too small even to move the fine
material.
Sediment flushing is not effective unless the reservoir is
drawn down to an extent that flow conditions over the deposits
approach that of the original river. In such a case, the erosion
over the delta starts from both ends. On the downstream end, a
negative step (scour) develops and it moves upstream, if the local
flow is supercritical. Similarly on the upstream end, a negative
84
step starts moving downstream. Effective sluicing of sediment would
take place when both the steps meet. The celerity of bed transients
(Mahmood and Ponce, 1976) is very small, so that in a long
reservoir, effective flushing will require that the reservoir is
appreciably drawn down for a period of several months.
Sediment flushing data on Guernsey Dam (Jarecki and Murphy,
(1965), Warsak Dam (Chaudhry, 1982) and Sefidrud Reservoir
(Farhoodi, 1985), are discussed below in order to bring out
prototype experience.
Guernsey Dam is a multipurpose, earth-fill dam on North Platte
River which was completed in 1927. The dam with a height of 41.1 m
is located in a rocky canyon. The length of reservoir is 23.5 km
and the mean annual flow is 0.89 km3. Due to siltation, the capacity
of the dam in 1959 had reduced by 40 percent. On the average,
reservoir deposits, at that time, consisted of 17 percent sand, 61
percent silt and 22 percent clay. The average density of deposits
based on gamma probe and other investigations, was measured as
1.074 tons/mi3 (which is judged to be on the low side). The
reservoir is naturally drawn down every year due to withdrawals
during dry periods. Sediment concentration data at 5 stations within
the reservoir and one station below the dam were collected during
1959 - 62 periods of drawdown. Table 6-2 summarizes the relevant
sediment sluicing data for the period when the outflow was larger
than the inflow. The average sediment concentration in the release
was only 182 ppm and over 34 days aggregate period, 65,000 m3 of
sediment, equivalent to 0.1 percent of the capacity, were removed.
Warsak Dam is a multipurpose, 76.m high concrete dam built in
1960 on Kabul River in Pakistan. The spillway crest level is 374.9
m and the conservation pool level is 387.1 m. The length of
reservoir is 41.8 km and the catchment area is 67,340 km2. During
1961-70, the mean annual flow at the site was 21.7 km3 with an
85

GUERNSEY RESERVOIR
SEDIMENT SLUICING DATA
Period Reservoir Level Inflow Outflow AverageSediment Release
(m) (Mm3) (Mm3) (ppm)
July 10-July 19, 1960 1342.8 - 1335.3 90.0 110.1 182
Aug. 08-Aug. 17, 1960 1342.6 - 1335.1 95.9 114.2 136
July 23-July 29, 1961 1341.3 - 1334.4 64.9 77.1 222
July 26-Aug. 02, 1962 1342.6 - 1334.4 65.2 82.2 209
TOTAL: 316.0 383.6 182
average measured suspended sediment concentration of 727 ppm.
Maximum and minimum discharges during this period were observed as
4,276 and 87 m3/s, respectively, and the maximum and minimum
sediment concentrations were 19,200 and 7 ppm, respectively.
Particle size distribution of measured suspended load consisted of
12% sand, 60% silt and 28% clay. Gross storage capacity of the
reservoir at construction was 0.17 km3, up to 387.1 m elevation, and
the dead storage was 0.08 km3 below the spillway crest. After first
year's operation, a deposit of 0.03 km3 was measured in the reser-
voir and in 5 years operation, the deposit volume amounted to about
0.07 km3. By 1980, the reservoir had completely silted up to the
conservation pool elevation, except for a 60 m by 6 m deep channel
on the right bank where the power and irrigation intakes are
located. The river does carry gravel and cobbles, which are not
reflected in the measured load. Sediment deposits in the reservoir
show accumulation of gravel, cobbles and boulders on the surface.
During a site visit in 1983, it was found that gravel particles up
to 75 mm are passed from the reservoir with irrigation supplies,
(Mahmood, 1984).
86

During 1976 and 1979, five flushing operations were carried out
in the reservoir by purposely lowering the pool level to the
spillway crest. Total duration of flushing was 490.5 hours and it
has been estimated (Chaudhry, 1982) that about 4.2 Mm3 of deposits
were cleared during the flushing. Assuming an average discharge of
1,410 m3/s, the average sediment concentration passed through the
spillway is around 1,610 ppm. The quantity of average annual sedi-
ment removal in the flushing operations is around 6.4 percent of
average annual measured load.
Sluicing conditions at Warsak are a great deal more favorable
than at Guernsey because the river upstream is flowing in a riverine
condition over the silted reservoir. However, Chaudhry (1982) notes
that it will not be possible to flush the deposits below the
spillway crest level unless deeper sluices are provided.
Sefidrud Dam (Farhoodi, 1985) is a 106 m high buttress gravity
dam on Ghazel Ozan River in northwest Iran. This is also a multi-
purpose project which was completed in 1961. The dam is situated
just below the confluence of Ghazel Ozan with Shah Rud. The length
of reservoir is 25 km and its capacity is 1.8 km3. The maximum,
average annual and minimum runoff for the site is 12.0, 4.5 and 1.55
km3, respectively. The sediment load shows a similar year to year
fluctuation. The maximum, average annual and minimum sediment load
is 218, 50 and 13.7 million tons. The average sediment
concentration is 11,000 ppm with 15 percent sand, 56 percent silt
and 29 percent clay. During 1979, before annual sediment flushing
operations were tried for four years (1980-1983), measurements of
sediment outflow showed that the trap efficiency of the reservoir
was about 70 percent.
The flushing operation implemented at Sefidrud Reservoir is
more intense than the two cases discussed above. The dam is provided
with outlets at three levels. The lowest, bottom outlets, are
87
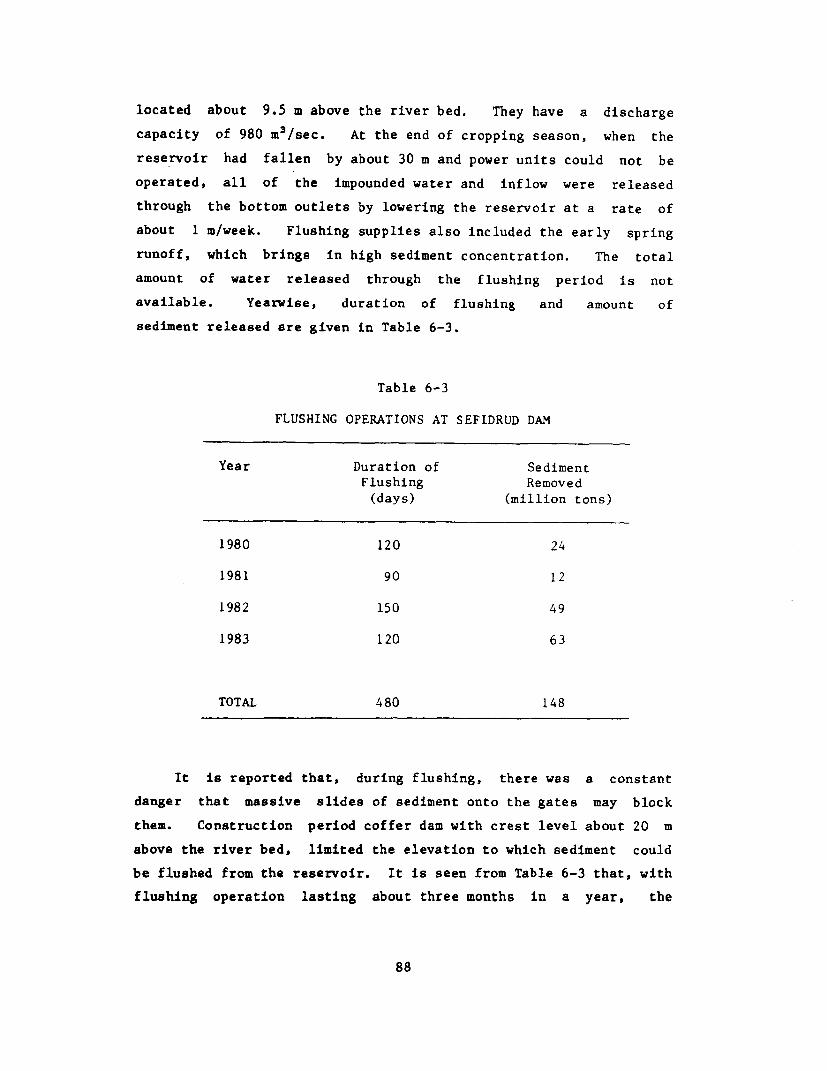
located about 9.5 m above the river bed. They have a discharge
capacity of 980 m3/sec. At the end of cropping season, when the
reservoir had fallen by about 30 m and power units could not be
operated, all of the impounded water and inflow were released
through the bottom outlets by lowering the reservoir at a rate of
about 1 m/week. Flushing supplies also included the early spring
runoff, which brings in high sediment concentration. The total
amount of water released through the flushing period is not
available. Yearwise, duration of flushing and amount of
sediment released are given in Table 6-3.
Table 6-3
FLUSHING OPERATIONS AT SEFIDRUD DAM
Year Duration of SedimentFlushing Removed
(days) (million tons)
1980 120 24
1981 90 12
1982 150 49
1983 120 63
TOTAL 480 148
It is reported that, during flushing, there was a constant
danger that massive slides of sediment onto the gates may block
them. Construction period coffer dam with crest level about 20 m
above the river bed, limited the elevation to which sediment could
be flushed from the reservoir. It is seen from Table 6-3 that, with
flushing operation lasting about three months in a year, the
88
average amount of sediment removed was 74 percent of the average
annual load.
The three cases of sediment flushing described above bring out
some problems inherent in this operation. The tractive force
required to reentrain reservoir sediments that have been allowed to
deposit is larger than that needed to prevent its deposition. This
condition is more pronounced for the fine material. In reservoirs,
the fine material and bed material deposits may coexists in
horizontal layers, or may be intermixed. When the deposits are
intermixed, or are mostly fine material, the stream power necessary
to remove a given mass of sediment is much larger than that required
to initially transport it. Clay layers, even a few years old, can
form a stubborn bottleneck and retard flushing by creating a control
section. In Sefidrud Reservoir, releasing early spring floods at
low flushing levels was a decided advantage from this point of view.
In reservoirs with no carry-over storage, prolonged duration
flushing operations of sediment can be adopted as a routine
operation, perhaps, once every few years, if the impoundment is not
needed during a part of the year. As shown by both Guernsey and
Sefidrud, efficacy of sediment flushing is high if the sluicing is
started at a time when the reservoir is already low during its
annual operation, because, effective sediment transport within the
reservoir commences when the flow over the deposits approaches
riverine conditions.
Sediment flushing is more effective in narrow gorge-type reser-
voirs. As shown by the prototype experience, flushing flows carve
out a deep channel, which is initially narrower than the original
river width. With periodic flushing the scoured channel will
approach the pre-dam width of the river. Thus, flushing cannot
remove the valley deposits. In flood-plain type of reservoirs,
rejuvenation of storage is only possible up to the size of original
channel.
89

The scouring efficiency of flushing is, herein, defined by
E 100. V / Q (6.3)s a f
where, V storage volume added by flushing - (V - V ); V , V -
storage capacity of reservoir before and after flushing; Q - volume
of water used in flushing and E = scouring efficiency in percent.s
According to theoretical concepts of sediment erosion and transport,
E is an increasing function of energy gradient between the inlets
and the discharge outlet. It is also a function of the fraction of
storage filled by sediment; particle size of deposits; discharge
rate used during flushing and the concentration of sediment entering
with reservoir inflow during the flushing operation. Values of E5
for Guernsey and Warsak are 0.017 and 0.169 percent, respectively.
Water use data are not available for Sefidrud flushing operation.
The scouring efficiency in this case is estimated from the particle
size distribution of reservoir deposits and scoured material to be
around 0.8 percent. Low values of E for Guernsey can be attributeds
to small energy gradient and for Warsak to coarse material deposits.
The effectiveness of a flushing operation can also be measured
by two other parameters: the ratio of capacity added by flushing to
the original live capacity of the reservoir
E - 100. V / V (6.4)c a 0
and a time factor, E , defined as the ratio between the timet
required by river's sediment load to refill the added capacity to
that required to create it by flushing.
E - T /(1 - T ) (6.5)t r f
where V - original live capacity of the reservoir; T - fraction ofo r
a year that the river's sediment load will take to refill V and,a
90
T - fraction of a year used in flushing. Based on average dailyf
sediment load and 100 percent trap efficiency,
E = V / [V (1 - T )2] (6.6)t a g f
where, V volume of annual sediment load in terms of dry densityg
of deposits. Maximum value of E is less than 100 percent, and itc
depends on Q , E and morphology of the reservoir expressed as ratio
of channel to reservoir width. The upper limit on feasible E ist
1.0. For E less than 1, it will be possible to increase thet
available storage volume from year to year. For E greater than 1,t
the capacity must reduce from year to year and flushing is not
effective. Volume of water used in flushing can be estimated from
Q - E . V / 100. (6.7)f s a
This quantity will normally be unavailable for other uses at the
reservoir. At Guernsey, Q was used for irrigation and power
releases. At Warsak and Sefidrud, it was exclusively used for
flushing. With high desirable values of E , it will not be possibles
to use Q for power generation nor, for irrigation diversions at the
dam. It will be, however, available for other uses farther
downstream. Based on these considerations, an economic efficiency of
flushing may also be defined in terms of the cost incurred by
excluding other uses for Q and the benefit accruing due to the gain
in capacity.
Values of operation parameters for the three cases of flushing
considered herein are given in Table 6-4. Ratio V /V in this table
is an indicator for the seriousness of siltation problem in a reser-
voir. Guernsey reservoir with its present sediment inflow would not
pose a critical situation. The situation prevailing at the time of
reported study was a legacy of past sediment loading which gives
V /V - 50, close to the value for Sefidrud.o g
91
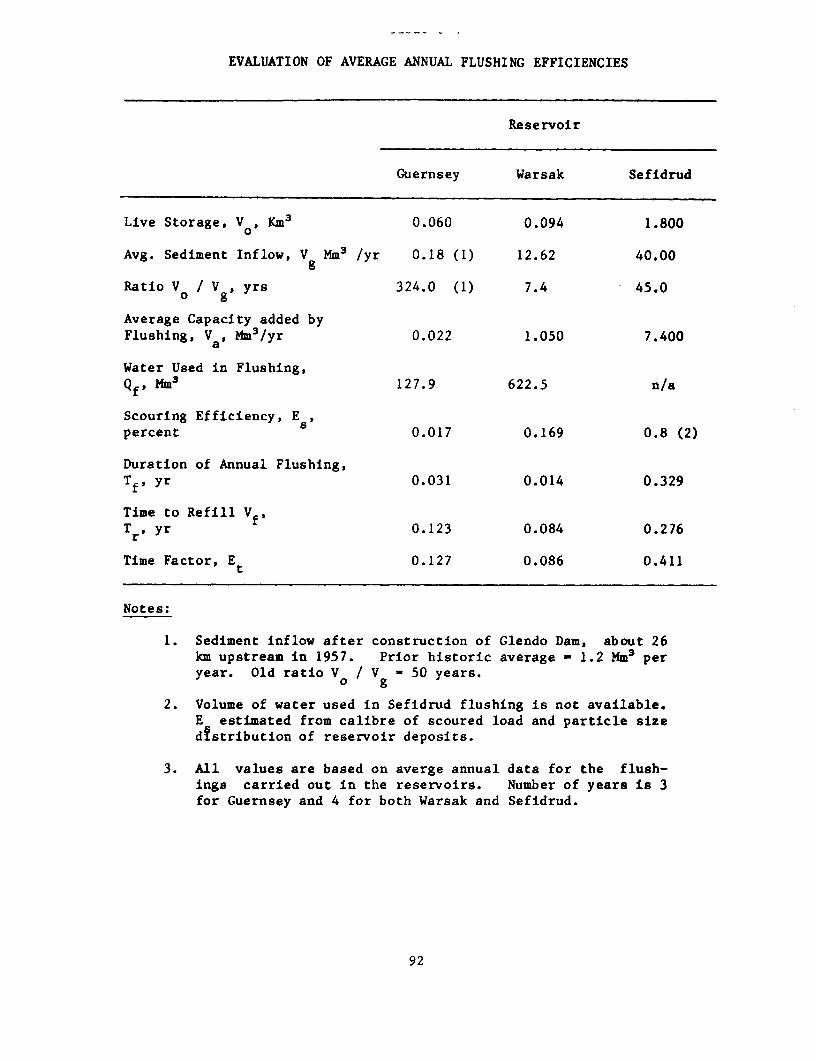
EVALUATION OF AVERAGE ANNUAL FLUSHING EFFICIENCIES
Reservoir
Guernsey Warsak Sefidrud
Live Storage, V0, Km3 0.060 0.094 1.800
Avg. Sediment Inflow, V Mm3 /yr 0.18 (1) 12.62 40.00g
Ratio V / V , yrs 324.0 (1) 7.4 45.00
Average Capacity added byFlushing, Va, Mm3/yr 0.022 1.050 7.400
Water Used in Flushing,Qfi Mm3 127.9 622.5 n/a
Scouring Efficiency, E.,percent 8 0.017 0.169 0.8 (2)
Duration of Annual Flushing,Tfs yr 0.031 0.014 0.329
Time to Refill Vf5Tr, yr 0.123 0.084 0.276
Time Factor, Et 0.127 0.086 0.411
Notes:
1. Sediment inflow after construction of Glendo Dam, about 26km upstream in 1957. Prior historic average - 1.2 Mm3 peryear. Old ratio VO / Vg - 50 years.
2. Volume of water used in Sefidrud flushing is not available.E estimated from calibre of scoured load and particle sized!stribution of reservoir deposits.
3. All values are based on averge annual data for the flush-ings carried out in the reservoirs. Number of years is 3for Guernsey and 4 for both Warsak and Sefidrud.
92
Judging from value of E , it appears that increasing the durationt
T , under the present conditions, would be most beneficial forf
Warsak, Guernsey and Sefidrud, in that order.
The flushing operations, by releasing sediment load to the
downstream river channel will tend to counter the retrogression set
in by the impoundment to some extent. However, due to the sudden
release of large sediment slugs, channel blockage may take place and
create problem of flooding and channel deterioration over the short
run. On the upstream side, the flushing operation will tend to clear
the backwater deposits to some extent. If the bedload comprises
gravel, this action will be limited by the development of an armor
layer. There are other problems related to flushing, such as, the
abrasion caused by high sediment concentrations and possible
blockage of outlet gates by sediment deposits. The former will
require special abrasion resistant treatment for the outlet
structure and possibly, periodic repairs. To prevent the blockage
of gates, special protective devices should be built. A siphon inlet
to cope with the blockage problem has been provided in Santo Domingo
Reservoir (Krumdieck and Chamot, 1979).
Sediment Sluicing
in contrast with sediment flushing, sediment sluicing is an
operational design, in which the main sediment load coming into a
reservoir is released along with the flow-mostly before it can
settle down. The earliest and perhaps the most successful example
of sediment sluicing is the Old Aswan Dam on Nile River in Egypt.
Aswan Dam (Assiouti, 1986, Leliavsky, 1960) was originally
built as a single purpose regulation structure during 1898 - 1902 to
provide summer irrigation supplies to the Middle Egypt. The struc-
tural height of the dam was 38.8 m, with a length of 1.95 km and a
storage capacity of 1.06 km3 . At that time, the mean annual flow of
93

Nile at Aswan was estimated to be 84 km3. The design of Aswan Dam
was predicated on the principle that the sediment load of the river
has historically formulated the main fertilizer of Egypt and that it
should not be held back in the dam. This led to a pattern of
operation that allowed the flood flow to be passed through without
significant heading up, till most of the heavy sediment concentra-
tion in the river has passed. The measure was a gage height of 88 m
at a location of 15 km downstream. The reservoir was filled in
about 3 months with nearly clear water, which was then used over
the next 4 months till the beginning of next year's flood. To allow
the flood waters to be passed unobstructed through the dam, about
2,000 m 2 of sluice gates opening were provided near the river bed.
The design proved to be successful and the dam was twice raised--in
1912 and 1933.
After the last raising, the structural height of the dam
increased to 52.80 m, design reservoir level was raised from the
original elevation 106 m to 121 m, the length increased to 2.14 km
and the storage capacity to 5.6 km3. The increased capacity made it
necessary to start impoundment, somewhat earlier--at the reference
gage height of 90.5 m. In the final design, the dam had 180 sluices
in four groups with their sill levels at the river bed elevations of
87.65, 92.00, 96.00 and 100.00 m, respectively. The sluices, with a
total cross sectional area of 2,240 m2, were kept fully open during
flood months of July, August and September. They could pass about
6,000 m3/s during normal flood or more than twice this flow rate
during a high flood. The sluices were closed in October, and the
reservoir was filled to elevation 121 m. This was held constant
from January to April when the river flow was sufficient to meet
irrigation requirements. The storage was used upto elevation 100 m
from May to Mid-July. With this regulation, the amount of siltation
measured in the reservoir was insignificant. In 1960, the construc-
tion of a power house was completed and hydropower generation
started at the dam. For power, the minimum reservoir level was
94
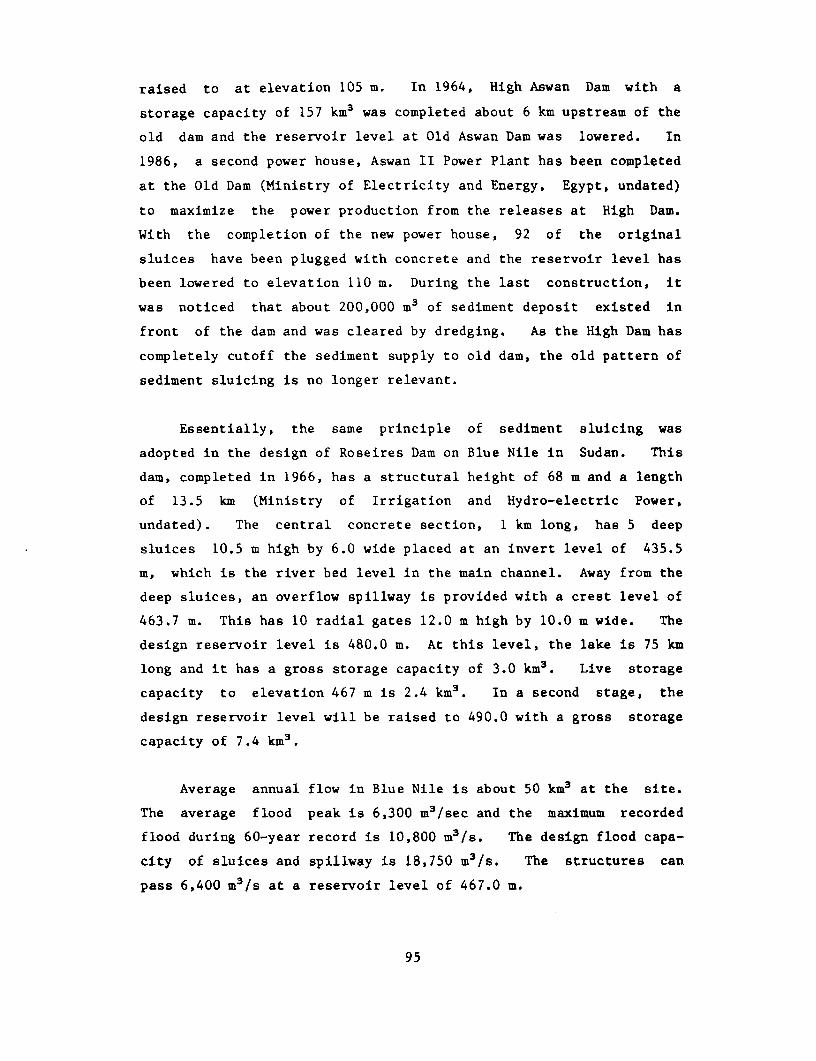
raised to at elevation 105 m. In 1964, High Aswan Dam with a
storage capacity of 157 km3 was completed about 6 km upstream of the
old dam and the reservoir level at Old Aswan Dam was lowered. In
1986, a second power house, Aswan II Power Plant has been completed
at the Old Dam (Ministry of Electricity and Energy, Egypt, undated)
to maximize the power production from the releases at High Dam.
With the completion of the new power house, 92 of the original
sluices have been plugged with concrete and the reservoir level has
been lowered to elevation 110 m. During the last construction, it
was noticed that about 200,000 m3 of sediment deposit existed in
front of the dam and was cleared by dredging. As the High Dam has
completely cutoff the sediment supply to old dam, the old pattern of
sediment sluicing is no longer relevant.
Essentially, the same principle of sediment sluicing was
adopted in the design of Roseires Dam on Blue Nile in Sudan. This
dam, completed in 1966, has a structural height of 68 m and a length
of 13.5 km (Ministry of Irrigation and Hydro-electric Power,
undated). The central concrete section, 1 km long, has 5 deep
sluices 10.5 m high by 6.0 wide placed at an invert level of 435.5
m, which is the river bed level in the main channel. Away from the
deep sluices, an overflow spillway is provided with a crest level of
463.7 m. This has 10 radial gates 12.0 m high by 10.0 m wide. The
design reservoir level is 480.0 m. At this level, the lake is 75 km
long and it has a gross storage capacity of 3.0 km3. Live storage
capacity to elevation 467 m is 2.4 km3. In a second stage, the
design reservoir level will be raised to 490.0 with a gross storage
capacity of 7.4 km3.
Average annual flow in Blue Nile is about 50 km3 at the site.
The average flood peak is 6,300 m3/sec and the maximum recorded
flood during 60-year record is 10,800 m3/s. The design flood capa-
city of sluices and spillway is 18,750 m3/s. The structures can
pass 6,400 m3/s at a reservoir level of 467.0 m.
95
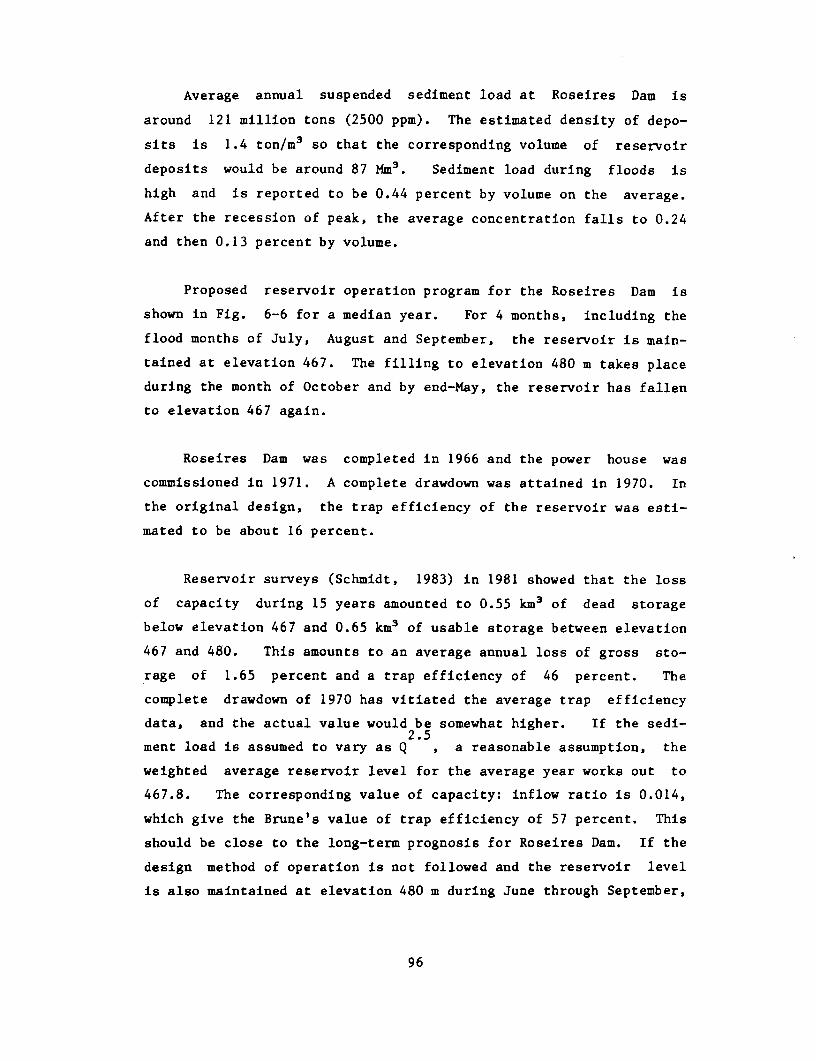
Average annual suspended sediment load at Roseires Dam is
around 121 million tons (2500 ppm). The estimated density of depo-
sits is 1.4 ton/mr3 so that the corresponding volume of reservoir
deposits would be around 87 Mm3. Sediment load during floods is
high and is reported to be 0.44 percent by volume on the average.
After the recession of peak, the average concentration falls to 0.24
and then 0.13 percent by volume.
Proposed reservoir operation program for the Roseires Dam is
shown in Fig. 6-6 for a median year. For 4 months, including the
flood months of July, August and September, the reservoir is main-
tained at elevation 467. The filling to elevation 480 m takes place
during the month of October and by end-May, the reservoir has fallen
to elevation 467 again.
Roseires Dam was completed in 1966 and the power house was
commissioned in 1971. A complete drawdown was attained in 1970. In
the original design, the trap efficiency of the reservoir was esti-
mated to be about 16 percent.
Reservoir surveys (Schmidt, 1983) in 1981 showed that the loss
of capacity during 15 years amounted to 0.55 km3 of dead storage
below elevation 467 and 0.65 km3 of usable storage between elevation
467 and 480. This amounts to an average annual loss of gross sto-
rage of 1.65 percent and a trap efficiency of 46 percent. The
complete drawdown of 1970 has vitiated the average trap efficiency
data, and the actual value would be somewhat higher. If the sedi-2.5
ment load is assumed to vary as Q , a reasonable assumption, the
weighted average reservoir level for the average year works out to
467.8. The corresponding value of capacity: inflow ratio is 0.014,
which give the Brune's value of trap efficiency of 57 percent. This
should be close to the long-term prognosis for Roseires Dam. If the
design method of operation is not followed and the reservoir level
is also maintained at elevation 480 m during June through September,
96
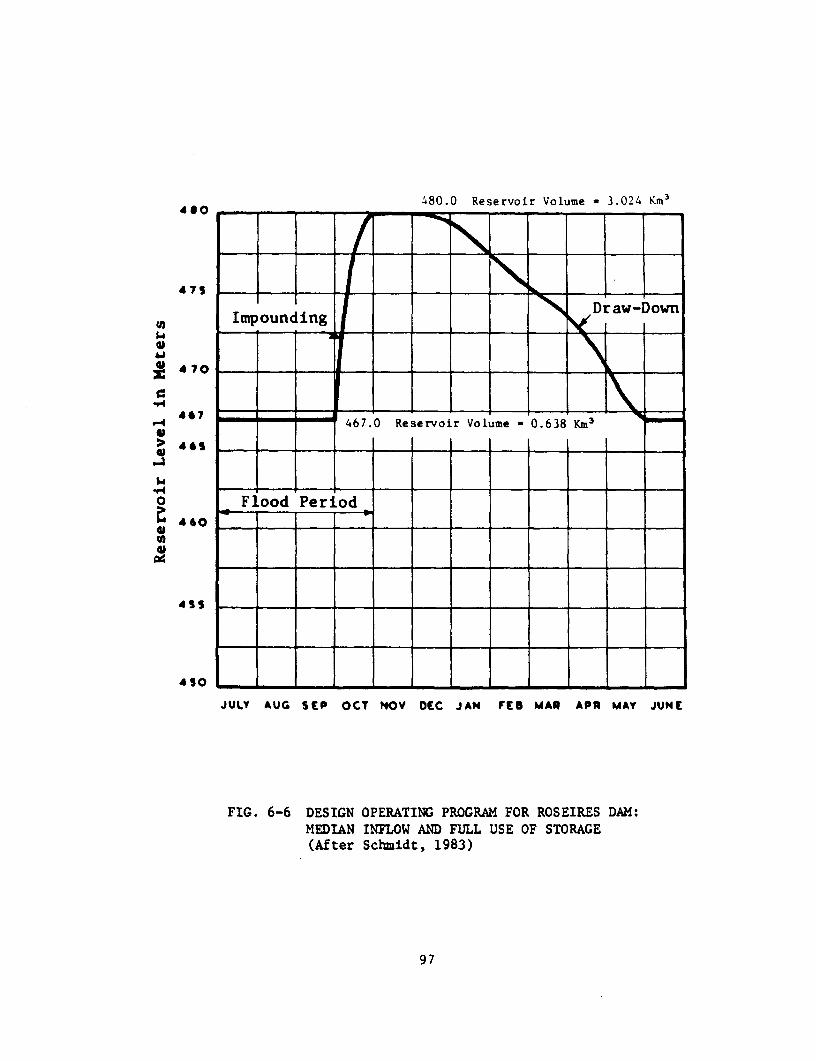
480.0 Reservoir Volume - 3.024 Km34 80 -0
Draw-DownImpounding __ _
*40
r-4 467 ~~~467.0 Reser-voir Volume 0.638 KM3
>S _4____ ___GD
0 Flood Perio
4sO _ ___ _
4 SO t - - - I I - - I
JULY AUG SEP OCT NOV DEC JAN FES MAR APR MAY JUNE
FIG. 6-6 DESIGN OPERATING PROGRAM FOR ROSEIRES DAM:MEDIAN INFLOW AND FULL USE OF STORAGE(After Schaidt, 1983)
97

the weighted average reservoir level would be close to 480 m, with
Brune's trap efficiency of 83 percent. The sluices and the
operation schedule are, thus, seen to save about 3.6 Mm3 of deposit
per year.
The efficacy of sediment sluicing obtained at Roseires Dam is
not as high as that at the Old Aswan Dam. The key to this
difference, lies in the greater width of reservoir at the Roseires
Dam. A comparison between relevant data of the two dams is given in
Table 6-5. It is seen that the ratio of reservoir width to maximum
height (at the top of conservation pool) at Roseires Dam is five
times larger than that at Old Aswan. At Roseires, even when the
reservoir is operated at a lower level, a great deal of sediment
load carried by the flood flows would deposit on the overbank area,
which is not effected by the sluicing operation. This shows that
reservoir morphology is an important variable in the design of
sediment sluicing.
Another important factor in the design and implementation of
sediment sluicing type of operation is the confidence with which the
flow hydrograph can be predicted at the dam site. The operators
will always have a fear that they might miss the opportunity to fill
the reservoir if they wait too long and thus there will be a
tendency to start filling the reservoir sooner than they should.
Comparing the location of Roseires and Aswan dams, this problem must
have been relatively minor at the latter due to its downstream
location in the basin.
Density Currents
Density currents, if they develop in a reservoir, are an
attractive method of ejecting high concentration of fine material.
In general, the width of deposits as well as the depth of flow
increases as the flow approaches the dam. The top level of deposit
98
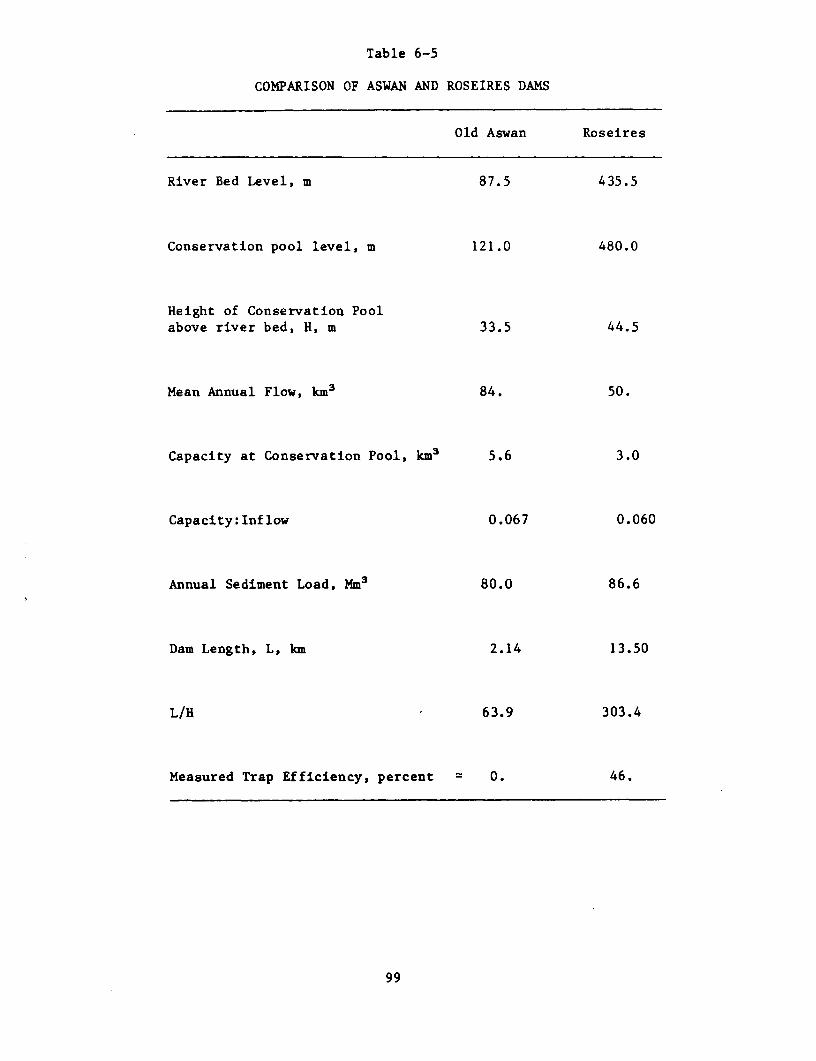
Table 6-5
COMPARISON OF ASWAN AND ROSEIRES DAMS
Old Aswan Roseires
River Bed Level, m 87.5 435.5
Conservation pool level, m 121.0 480.0
Height of Conservation Poolabove river bed, H, m 33.5 44.5
Mean Annual Flow, km3 84. 50.
Capacity at Conservation Pool, km3 5.6 3.0
Capacity: Inflow 0.067 0.060
Annual Sediment Load, Mm3 80.0 86.6
Dam Length, L, km 2.14 13.50
L/H 63.9 303.4
Measured Trap Efficiency, percent 0. 46.
99
is also irregular across the width and a deep channel may exist in
the deposit on one or both banks of the reservoir. Also, thermal
stratifications, if existing, will be more pronounced close to the
dam itself. All these factors introduce some uncertainty about the
path that will be followed by the density current, so that it is
necessary to provide multi-level, multiple outlets for aspiration of
density currents. As pointed out by Bell (1942) tapping a density
current requires more elaborate monitoring of thermal and salinity
related stratification of reservoirs than has been done in the past.
To an extent, an advanced stage of deposits within the reser-
voir works against the development of density current because, the
slope of deposits is smaller than the original bed of the river.
Development and behavior of density currents is an area where both
laboratory and prototype research can be very productive. This is
discussed, along with other research needs in Chapter VII.
Sediment Dredging
The second most popular suggestion in dealing with reservoir
sedimentation is that of sediment dredging. Cost of the dredging by
present day techniques, which have been developed for river and
harbor conditions is, however, strongly unfavorable. The cost of
conventional dredging alone, without the additional cost of
providing disposal areas and containment facilities, varies from $2
- 3 per m3. The cost of replacement of storage on the other hand is
about $0.12 - 0.15 per m3. If dredged waste cannot be delivered to
the downstream river channel, the cost of dredging will become even
higher and the economic comparison more unfavorable.
Mechanical excavation of small reservoirs in urban setting is
commonly practiced. In this case, the cost and availability of land
for replacement structures is a major consideration and the waste
can be used for industrial or landfill purposes so that, mechanical
100
removal of deposits including haulage of waste by trucks is found to
be economical.
In the conventional dredging methods, a major part of the cost
goes in pumping the sediment-water mixture. In reservoirs,
substantial hydraulic heads are available between the upstream pool
and downstream river level. It should, therefore, be possible to
develop newer dredging techniques for storage reservoirs that
combine dust-pan type dredging with the potential energy of the
reservoir to convey the dredged slurry downstream. A commercial
system, that uses cutter heads, is presently available (Roveri,
1984). The price of this system will vary with location, but it
may be about 3 - 4 times the cost of storage replacement indicated
above. Most likely, there will be hydraulic, sedimentation and
structural problems associated with large heads exceeding 100 m.
As the demand for combating reservoir sedimentation grows,
technological innovations will certainly evolve and will make
hydraulic dredging an economically viable solution in large reser-
voirs. Of all the possible alternatives, hydraulic dredging can
restore the maximum amount of storage because it can treat overbank
deposits which flushing and sluicing cannot handle in wide reser-
voirs. Also, this method under a continuous operation mode, can be
used to stabilize the location of delta within the reservoir.
Hydraulic dredging can also be used to clear the backwater deposits,
thereby mitigating the flooding and water loss problems causes by
coarse material deposits.
The scouring efficiency, E (Eq 6.3), for hydraulic dredging5
will lie between 0.25 and 0.50 percent which is much better than
that possible with prolonged hydraulic flushing. It will take a
smaller amount of water to remove a unit volume of deposits by
dredging than by flushing.
101

CHAPTER VII
SUMMARY AND RESEARCH NEEDS
This monograph has been prepared to present a review of
reservoir sedimentation--its worldwide extent, impacts, methods of
prediction and alternatives available to mitigate the problem. A
summary of the main conclusions is given herein. It is followed by
a brief statement of need for research and development in the
subject area.
Summary
1. One of the principal aims of water resource development is to
augment the base flow in rivers. This can be economically and
reliably achieved by storage reservoirs.
2. At this time (1986), the gross volume of storage reservoirs in
the world is around 4,900 km2 or roughly 13 percent of the
total annual runoff. This storage is being used to augment the
base flow by about 16 percent.
3. Construction of storage reservoirs saw a major growth in the
1950's. In the two decades of 50's and 60's, the gross
capacity of world reservoirs increased by 25 times. Reservoir
construction will continue to expand due to the increasing
demand for base-flow augmentation. It is estimated that by the
turn of the century, useable storage in the world will have to
increase by about 2.5 fold.
4. Geologic erosion is a part of the drainage process. In the
context of storage reservoirs, clastic material--the product of
geologic erosion, often enhanced by human actions, is a grave
102
liability.
5. The world reservoirs are losing storage capacity to
sedimentation at an average annual rate of about 1 percent, or
about 50 km2 per year. The cost of replacement for this loss
is modestly estimated at $6 billion per year. The weighted
average age of reservoir storage capacity in the world is
about 22 years. The magnitude of capacity already lost is very
large.
6. Genesis of clastic sediment load lies in the process of
weathering. Worldwide zones of weathering have been developed
and they show tht it is most active in the tropics and much
less so in the temperate zone. Within various zones of
weathering, climatic, geologic and tectonic factors cause large
variations.
7. Weathering only prepares the parent rock for erosion. Water,
as the most important agent, entrains and then transports the
product to the basin outlet. Rate of erosion from a basin is
strongly influenced by factors that add to the erosive power of
rainfall, such as higher relief, more intense rainfall, sparse
vegetal cover, tectonic disturbance and man's actions that
destroy the vegetal cover and loosen the soil.
8. Not all of the clastic material eroded from a basin appears at
its outlet. A drainage basin acts as a strong low-pass filter
and it dampens space and time variations in the rate of ero-
sion. Delivery ratio is a measure of the proportion of eroded
material that appears at the outlet. Large basins typically
deliver less than 10 percent of the eroded material. Rest of
the material is stored on hillslopes, in the valleys and within
stream channels. To an extent, the sediment load delivered from
a basin is delimitated by the carrying capacity of the
103
channels.
9. Average worldwide delivery of sediment load from basins amounts
to less than a concentration of 500 ppm. However, large varia-
tions exist. Among major basins with drainage area larger than
10,000 kM2, the three largest concentrations of sediment vary
from 22,000 - 40,000 ppm., and they are all located in China.
Among various geographic regions, Oceania produces the largest
yield (about 1,000 t/km2/yr) followed by Asia (380 t/km2/yr),
whereas, the world average is about 165 t/km2/yr. The lowest
sediment yield, 28 t/kM2/yr, is reported in Australia due to
its aridity, and the next higher, 38 t/km2/yr, in Africa due to
its smaller surface runoff. Two most significant variables
correlating with sediment yield are the basin area and unit
runoff. Sediment delivery decreases roughly with 0.8 power of
drainage area and it sharply increases when the unit runoff
falls below 6 cm.
10. Human action can both increase and decrease sediment yield from
a basin. Agriculture and other activities that loosen the soil
increase sediment yield. Plain areas in Europe and USA may be
experiencing 3 - 5 times higher rates of erosion due to large
scale conversion of forest land to agricultural use. Reser-
voirs constructed by man, drastically decrease sediment yield
from basins. Channel stabilization also decreases sediment
yield by preventing erosion and reentrainment of valley
storage. Sediment delivery by Colorado River has diminished
from 135 to 0.1 million tons per year due to the construction
of storage reservoirs. In River Nile, 110 million tons/year
has been almost completely cutoff by High Aswan Dam and for
River Indus, it has declined from 440 to 110 million tons/year.
In Mississippi-Missouri System, the construction of dams and
channel stabilization works has decreased the sediment load by
about 50 percent.
104
11. Natural events, such as earthquakes, tectonic disturbancesc and
volcanos can produce abnormally high sediment loads. Sediment
load generated by New Madrid earthquake (1811 - 1812) in
Missouri had a long-term impact on Mississippi River. A single
mud-flow developing in a small sub-catchment of Kosi River in
Nepal contributed about one-third of the average annual sedi-
ment load within a period of 14 hours. Mount St. Helen's
eruption has increased the sediment yield of Columbia River by
4-fold.
12. It is customary and necessary to measure sediment load at or
near the proposed storage sites. Many a time, sediment load
measurements are not available for sufficient duration.
Specialist help is needed to develop reliable estimates.
13. Simply stated, the sediment load carried by a river is
deposited in the reservoir because the transport capacity of
flow diminishes with decreasing velocity.
14. Sediment load can be divided into two broad categories, depend-
ing on its particle size. The fine material load comprises
particles of silt and clay and, bed material load the coarser
particles. This distinction was originally made necessary by
sediment transport theories. It is even more valid in reser-
voir sedimentation. The dry density of fine material is, at
least initially, much smaller than that of sand, so that the
same mass of clay and silt will occupy a much larger volume of
storage than would sand and gravel. The fine material also
becomes highly erosion resistant with increasing age of deposit.
15. Most rivers carry more fine than bed material load. Worldwide
average for fine material may be around 50 percent. Methods to
predict average dry density of reservoir deposits are
available. However, individual deposits will show large
105

variations.
16. Reservoir deposits can be described, in terms of the process of
deposition, as backwater deposits, delta deposits and bottom-
set deposits. The backwater deposits cause problems, such as,
flooding in channel upstream of reservoir and non-beneficial
water use by phreatophytes. Delta deposits and bottom-set
deposits directly curtail the storage capacity of reservoirs.
17. Density currents develop in storage reservoirs when flow with
large sediment concentration plunges below the surface and then
flows as a distinct layer up to the reservoir. They can be used
to aspirate their load through the outlets. Sediment load
transported by density currents is mostly the fine material.
Density currents have been observed in Lake Mead and some other
reservoirs. Analytical and model study results on the behavior
of density currents are available. Prototype measurements are
sporadic and few.
18. Predictive methods are available for the trap efficiency of
reservoirs; dry density of deposits an-' -patial distribution of
deposits within the reservoir. These methods can be divided
into two classes. The empirical methods are inductive methods
based on data observed from actual storages. Analytical methods
are mostly mathematical models that use equation of motion for
the flow and mass conservation equation for the sediment load.
Empirical methods are simple and use commonly available data.
Accuracy expected from these is around 10 percent under
favorable conditions. Their scope is, however, limited. For
example, they cannot be used to analyze sediment flushing or
sluicing operations or the particle size distribution of depo-
sits. Mathematical models are broader in scope, but they
require more detailed data as well as skilled manpower and
computers. Existing mathematical models are one-dimensional
106
and they are based on sediment transport theories developed in
rivers and canals. Experience shows that two or three mathema-
tical models may be necessary to simulate various aspects of
reservoir sedimentation. At the present state-of-the-art, it
is not possible to predict micro details of sedimentation in
reservoirs.
19. Given the magnitude of reservoir siltation in the world, the
key question is what can be done to mitigate it. A number of
methods have been tried in the past. They can be divided into
three classes: methods that aim to control the sediment inflow
into the reservoirs; those which try to hydraulically remove
the sediment load that has already entered the reservoir and,
finally, the dredging of existing deposits.
20. Watershed management is commonly suggested to reduce the sedi-
ment yield from a basin. While, watershed management is a noble
activity, it cannot be very useful in alleviating reservoir
sedimentation. The reason is that drainage basins store about
90 percent of eroded material, which remains available for
reentrainment even after further erosion is completely cutoff.
Data from a small basin in the U.S. and from Mangla watershed
support this conclusion.
21. Debris dams are used to dam up one or more tributaries that
contribute large sediment loads. In general, due to economy of
scale, it is cheaper to provide additional storage within the
main reservoir. In special cases, where mountainous streams
contribute coarse material that may cause serious problems by
backwater deposits, debris dams will be found to be useful.
22. Sediment bypassing can be easily practiced in off-channel
storages. It has also been successfully used in small
irrigation reservoirs. At other sites, they would require a
107
bold and innovative design that has not yet been attempted.
Sediment bypassing would be difficult to achieve in streams
that carry large content of fine material.
23. Sediment flushing is the practice of hydraulically eroding and
discharging existing deposits in reservoirs. To be effective,
it requires that the reservoir is drawn down for long periods
of time. Theoretical consideration show that sediment flushing
will not effect the overbank deposits and its efficacy may be
reduced where even a few years old clay and silt deposits
exists. New parameters defining scouring efficiency and time
factor are introduced. They will provide a convenient tool to
evaluate flushing operations. Two considerations will always
govern sediment flushing. The amount of storage water and
duration that can be exclusively devoted to flushing, and the
value of time factor E . With the time factor less than 1,t
flushing can be carried out annually and will yield a cumcula-
tive improvement in storage volume. With a value greater than
1, the storage is bound to decrease from year to year in spite
of flushing.
24. Sediment sluicing is an operational design in which the bulk of
sediment load is released with the flow and only sediment free
water is stored. It is the only method that resulted in a
deposit free reservoir at Old Aswan Dam. However, in this
method, the storage capacity is limited to a small fraction of
the annual runoff and the reservoir operation is limited to a
part of the year. Effectiveness of sluicing operation also
depends on the reservoir morphology. Old Aswan Dam was success-
fully designed and operated to store the river flow at the tail
end of the flood season, when it is nearly sediment free. Same
design principle was adopted At Roseires Dam, but it has
resulted in an average trap efficiency of 46 percent. The
difference between Roseires and Old Aswan reservoirs is that
108

the former is much wider than the latter and accumulates large
amount of sediment deposit in overbank areas that are not
effected by sluicing.
25. Density currents, where they form, can be trapped to release
fine material load. This requires a number of multiple level
outlets. Exploitation of density currents also requires a more
detailed monitoring of the reservoir than has been practiced so
far.
26. Dredging of existing deposits is commonly suggested to reclaim
the storage lost to sediment deposits. At this time (1986),
conventional hydraulic dredging is about 20 times more
expensive than the cost of storage replacement and is not
economically viable. However, if the potential energy made
available by the dam is used to obviate pumping costs, the
dredging can become viable. At least, one commercial method is
available whose cost may become competitive in the future.
Research Needs
As a result of the preceding review, a number of research and
development problems suggest themselves. They are listed below in
the order of their appearance in the preceding chapters.
Sediment Yield Sediment load carried by the flow is the
primary variable that determines the rate of sedimentation in a
reservoir. This is also the first area where research is needed to
improve our understanding of processes involved in the generation
and delivery of sediment from large basins. The role of sediment
sources and sinks has not been studied in large basins and the
effect of watershed management practices has not been critically
evaluated by controlled experiments. Prototype research on the fate
of eroded material in its journey to the outlet and the efficacy of
109

both structural and non-structural measures is needed. This research
will enhance the possibility of controlling sediment yield from the
drainage basins. A likely candidate for this research is the water-
shed management project area at Mangla Dam. This area has already
been mapped, its relevant historic data on sediment load and land
use are available and, an administrative infrastructure exists at
site.
Sediment Diffusion in Deep Flows For want of any better
information, the sediment transport and deposition functions used in
the mathematical modeling of reservoirs are those developed from
laboratory flumes, canals and rivers. Most likely, the decay of
turbulence intensity significantly changes these processes in deep
reservoirs. This would be especially true of the silt and clay
particles, that dominate the sediment load in rivers. Measurements
of flow field and sediment concentration profiles in large reser-
voirs are needed to develop appropriate hydraulic and sedimentation
functions.
Sediment Reentrainment Sediment flushing is a useful method to
rid of the existing deposits. It becomesimore attractive when the
silting up of a reservoir has reached an advanced stage. In the
future, it will find a wider use as sedimentation of world reser-
voirs becomes worse. The efficacy of flushing depends on the rate
with which the deposits can be reentrained by the flow. Existing
knowledge, mostly gained from laboratory studies and theoretical
investigations, suggests that rate of reentrainment in reservoirs
will be strongly effected by the clay content of deposits; mineralo-
gy of clays and the chemical regime of water. For sand particles,
the rate of reentrainment depends on the velocity distribution
within the reservoir and especially, that near the bed. The flow in
reservoirs is strongly nonuniform, much more so than can be expected
in streams. Processes of and relating to reentrainment of deposits
have not been investigated in reservoirs. Prototype research in
110

this area will be highly rewarding.
Density Currents In the future, reservoirs will be monitored
and operated to manage their thermal, salinity and sediment content
in addition to the water flows. Theoretical aspects of density
currents have been primarily developed from laboratory studies.
Their validation on prototype structures has not been attempted so
far. Field data on sediment related density currents are scarce.
Research on the formation, behavior and fate of density currents in
reservoirs is needed. The results will be directly useful in
alleviating the rate of sedimentation of existing reservoirs and
will help in planning and design of future structures.
Empirical Methods Currently available empirical methods for
the prediction of trap efficiency and distribution of deposits are
20-30 years old. In the meantime, an extensive data base has
developed on the gross behavior of reservoirs. Theoretical under-
standing of reservoir siltation has also improved in this period.
Empirical methods will continue to be used to provide preliminary
analysis for the large and the final analysis for small projects.
The time is now right to develop a second generation of empirical
methods with expanded scope and improved accuracy.
Mathematical Models Presently available mathematical models
for reservoir siltation are patterned after channel flow models. In
general, the hydraulic and sedimentation processes in reservoirs are
strongly three-dimensional and stratification can have a major
effect on these processes. Due to their speed, declining costs of
computer use and their potential to predict micro details, mathema-
tical models will find much greater use in the future planning,
design and operation of reservoirs. A need exists to develop more
comprehensive mathematical models than the present one-dimensional
variety.
111

I
REFERENCES
Armatov, K.F., Kroshkin, A.N., and Bystrov, N.N., 1974. SedimentReservoirs in the Channels of Small Mountain Rivers, (EnglishTrans), Soviet Hydrology, Selected Papers, AGU, Issue No. 3.
Assiouti, I.M., 1986, "History and Operation of Old Aswan Dam,Egypt," personal communication, Cairo University, Cairo,.
Bell, H.S., 1942a. Stratified Flow in Reservoirs and its Use inPrevention of Silting, Miscellaneous Publication No. 491, USDA.
---, 1942, "Density Currents as Agents for Transporting Sediments,"Journal of Geology, Vol. 50, 1942.
Benjamnin, T.B., 1968, "Gravity Currents and Related Phenomena,"Journal of Fluid Mechanics, Vol. 31, Part 2.
Brune, G.M., 1953, "Trap Efficiency of Reservoirs," Trans. AGU,Vol. 34, No. 3.
Camp. T.R., 1944, Discussion of Paper No. 2218, Effects ofTurbulence on Sedimentation, by W.E. Dobbins, Trans. ASCE, Vol.109.
Chaudhry, H.M., 1973, Earthquake Occurrence in the Himalayan Regionand the New Tectonics, Proceedings, Seminar on Geodynamics of theHimalayan Region, National Geophysical Research Institute,Hyderabad, India.
Chaudhry, M.R., 1982, Flushing Operations of Warsak ReservoirSediment, Paper No. 454, Proceeding, Pakistan Engineering Congress,Vol. 58, Lahore.
Chen, Y.H., Holly, F.M., Mahmood, K., and Simons, D.B., 1975."Transport of Material by Unsteady Flow," Vol. I, Chapter 8,Unsteady Flow in Open Channels (Eds: K. Mahmood and V. Yevjevich),Water Resources Publications, Fort Collins, CO.
Churchill, M.A., 1947, Discussion of "Analysis and Use of ReservoirSedimentation Data," by L.C. Gottschalk, Proceedings of FederalInteragency Sedimentation Conference, Denver, CO.
Cummans, J., 1981, Mudflows Resulting from the May 18, 1980 Eruptionof Mount St. Helens, Washington, U.S. Geological Survey Circular850-B, Alexandria VA, 1981.
Dorough, W.G., 1986, "Practical Problems in Using Area-Reduction-Method," personal communication, U.S. Army Engineer District, U.S.Army Corps of Engineers, Omaha, Nebraska.
Emmett, W.W., and Leopold, L.B., 1963, Downstream Pattern ofRiverbed Scour and Fill, Paper No. 46, Proceedings of the FederalInter-Agency Sedimentation Conference, Miscellaneous PublicationNo. 970, USDA, Washington, D.C.
113

Emmett, W.W., Myrick, R.M., and Meade, R.H., 1980. Field DataDescribing the Movement and Storage of Sediment in East Fork River,Wyoming, USGS Open-File Report 80-1189, Denver, Colo.
Farhoodi, J., 1985, Sediment Flushing at Sefidrud Reservoir,Proceedings Second International Workshop on Alluvial RiverProblems, University of Roorkee, India.
Federal Inter-Agency Sedimentation Project, Some Fundamentals ofParticle Size Analysis, Report No. 12, U.S. Government PrintingOffice, Washington, D.C.
Foley, M.G., and Sharp, R.P., 1976, General Scour and Fill along aStream Reach, California Institute of Technology, Pasadena, Ca.,(NTIS No. AD-A025 771).
Geza, Bata, and Bogich, K., 1953, Some Observations On DensityCurrents in the Laboratory and in the Field, Proceedings, MinnesotaInternational Hydraulics Convention, IAHR-ASCE, Minneapolis, MN.
Goodland, R., Environmental Aspects of Hydroelectric Power and WaterStorage Projects (with special reference to India), Paper presentedto International Seminar, Environmental Impact Assessment of WaterResources Projects, University of Roorkee, India, 1985.
Guy, H.P., 1969, Laboratory Theory and Methods for SedimentAnalysis, Techniques of Water Resources Investigations, USGS,Washington, DC.
of Water Resources Investigations, USGS, Washington, D.C.
Guy, H.P., and Norman, V.W., 1970, Field Methods for Measurement ofFluvial Sediment, Techniques of Water Resources Investigations,USGS, Washington, D.C.
Harleman, D.R.F., 1961, "Stratified Flow," Section 26,Handbook of Fluid Dynamics, V.L. Streeter, Editor-in-Chief, McGraw-Hill Book Company.
Harrison, A.S.,December 1983, Deposition at the Heads of Reservoirs,U.S. Army corps of Engineers, Missouri River Division, MRD SedimentSeries, No. 31.
Harrison, A.S., and Mellema, W.J., 1982, Sedimentation Aspects ofthe Missouri River Dams, Q54, R15, Proceedings, ICOLD, Rio deJaneiro, Brazil.
Heinemann, H. G., October 1981, "A New Sediment Trap EfficiencyCurve for Small Reservoirs," Water Resources Bulletin, Vol. 17,No. 5.
Holeman, J.N., August 1968, "The Sediment Yield of Major Rivers ofthe World," Water Resources Research, Vol 4, No. 4.
114
Howard, C.S., 1953, Density Currents in Lake Mead, Proceedings,Minnesota International Hydraulics Convention, IAHR-ASCE,Minneapolis, MN.
Hurst, A.J., and Chao, P.C., September 3-5, 1975, SedimentDeposition Model for Tarbela Reservoir, Proceedings Symposium onModeling Techniques, Modeling '75, Waterways, Harbors and CoastalEngineering Division, ASCE.
Jansen, R.B., 1980, Dams and Public Safety, A Water ResourcesTechnical Publication, U.S. Department of Interior, Water and PowerResources Service, (USBR) Denver, CO.
Jarecki, E.A., and Murphy, T.D., 1965, Sediment WithdrawalInvestigation - Guernsey Reservoir, Proceedings Federal InteragencySedimentation Conference, ARS, Misc. Publication No. 970, USDA,Washington, D.C.
Jia-Hua, F., February 1960, " Experimental Studies on DensityCurrents," Scientia Sinica, Vol. IX, No. 2.
Kao, T.W., May 1977, "Density Currents and Their Applications,"Journal of Hydraulic Engineering, ASCE, Vol. 103, No. HY5.
Keulegan, G.H., 1944, "Laminar Flow at the Interface of TwoLiquids," Research Paper 1591, Journal of Research, National Bureauof Standards, Vol. 32.
--- ! November 1949, "Interfacial Instability and Mixing inStratified Flows," Journal of Research, National Bureau ofStandards, Vol. 43.
Krumdieck, A., and Chamot, P., December 1979, Sediment Flushing atthe Santo Domingo Reservoir, Water Power and Dam Construction.
Kuenen, H., Ph and Migliorini, C.I., 1950, Turbidity Currents as aCause of Graded Bedding, The Journal of Geology, Vol. 58, No. 2.
Lane, E.W., and Koelzer, V.A., 1943, Density of Sediment Depositedin Reservoirs, Report No. 9, Federal Interagency SedimentationProject, St. Anthony Falls Hydraulics Lab, Minneapolis, MN.
Lara, J.M., and Pemberton, E.L., 1965, Initial Unit Weight ofDeposited Sediments, Froceedings Federal Interagency. SedimentationConference ARS, Misc. Publication No. 970, USDA, Washington, DC.
Leliavsky, S., 1960, Irrigation and Hydraulic Design, Vol. III,Chapman and Hall, London.
L'Vovich, M.I., 1979, World Water Resources and Their Future,(English Translation Editor: Nace, R.L.), American GeophysicalUnion.
Mahmood, K., 1975, Mathematical Modeling of Morphological Transients inSand-bed Channels, Proceedings 16th Congress, IAHR, Vol 2. Sao PauloBrazil.
115
Considerations, Prepared for 1975 National Water ResourceAssessment, USDA (D.W. Gottlieb and Associates).
Series No. 19, U.S. Army Engineer Division, Missouri River, Corps ofEngineers, Omaha, NE.
note prepared for the World Bank.
Manual, MRD Series No. 26, U.S. Army Engineer Division, MissouriRiver, Corps of Engineers, Omaha, NE.
Programmer's Manual, MRD Series No. 27, U.S. Army Engineer Division,Missouri River, Corps of Engineers, Omaha, NE.
U.S.AID, Islamabad, Pakistan.
Mahmood, K., and Akhtar, A.B., 1962, Artificial Cut-Off at IslamHeadworks, Paper No. 352, Annual Proceedings, West PakistanEngineering Congress, Lahore.
Mahmood, K., Dorough, W.G., and Tarar, R.N., 1979, Verification ofSediment Transport Functions on Alluvial Channel Data, Proceedings,Symposium on the Mechanics of Alluvial Channels, Lahore, Pakistan.
Mahmood, K., and Haque, M.I.,1985, Boundary Shear Stress Measurementand Analysis, Proceedings, Third US-Pakistan Binational Symposium onMechanics of Alluvial Channels, Lahore, Pakistan.
Mahmood, K., and Ponce, V.M., April 1976, Mathematical Modeling ofSedimentation Transients in Sand-Bed Channels, Technical Report CER75-76-KM-VMP-28, Engineering Research Center, Colorado StateUniversity, Fort Collins, CO.
McHenry, J.r., and Hawks, Paul H., 1965, Measurement of SedimentDensity with Gamma Probes, Proceedings Federal InteragencySedimentation Conference, ARS, Publication No. 970, USDA,Washington, D.C.
McHenry, J.R., Hawks, P.H., Harmon, W.C., Kelly, W. J., Gill, A.C.,and Heinemann, H.G., September 1971, Determination of SedimentDensity with a Gamma Probe: A Manual of Theory, Operation andMaintenance for Technical Operations Model 497, ARS 41-183, USDA.
Meade, R.H., and Parker, R.S., 1985, Sediment in Rivers of theUnited States, National Water Summary 1984, U.S.G.S. Water SupplyPaper 2275, Washington, D.C.
Meade, R.H., Dunne, T, Richey, J.E., Santos, U.M., April 1985, andSalala, E., "Storage and Remobilization of Suspended Sediment in theLower Amazon River of Brazil," Science, Vol. 228.
Mermal, T.W., 1970, Progress of Dam Construction in the World, World DamsToday '70, The Japan Dam Association, Tokyo.
116

Merrill, W.M., April 1980, Simulation of Reservoir and LakeSedimentation, Kansas Water Research Institute, University ofKansas.
Middleton, G.V., August 1966, Experiments on Density and TurbidityCurrents, Canadian Journal of Earth Sciences, Vol. 3, No. 4.
Milliman, J.D., and Meade, R.H., January 1983, "World-wide Deliveryof River Sediments to Ocean," Journal of Geology, Vol. 91, No. 1.
Ministry of Electricity and Energy, undated, "Aswan II Power Plant,"Arab Republic of Egypt, Cairo.
Ministry of Irrigation and Hydro-Electric Power, undated, "RoseiresDam," Khartoum, Sudan.
Pakistan Water and Power Development Authority (WAPDA) ManglaWatershed Management Study, Vol. I, 1961.
Report No. HS-7, Kalabagh Consultants, Lahore, Pakistan.
Partheniades, E., 1972, Results of Recent Investigations On Erosionand Deposition of Cohesive Sediments, Chapter 20, Sedimentation -Symposium to Honor Professor H.A. Einstein, Ed. H.W. Shen, FortCollins, CO.
Rana, S.A., Simons, D.B., and Mahmood, K., 1973, "Analysis of SedimentSorting in Alluvial Channels," Journal of Hydraulics Division, ASCE,Vol. 99, No. HY11.
Rehman, A., undated, "Life of Mangla Reservoir--Ways and Means ofImprovement," mimeographed note, Dams Monitoring Organization,Pakistan WAPDA, Lahore.
Revio, B., June 1980, "Tamur Flood," mimeographed note; GeneralDirectorate of Hydrology and Irrigation, Kathmandu, Nepal.
Robbins, L.G., 1976, Suspended Sediment and Bed Material Studies onthe Lower Mississippi River, U.S. Army Engineer District, Vicksburg,MS.
Roehl, J.W., 1962, Sediment Source Areas, Delivery Ratios andInfluencing Morphological Factors, IASH Publication No. 59.
Roveri, E., 1984, "Geolidro System," Parma, Italy, personalcommunication.
Rubey, W.W., 1933, "Settling Velocities of Gravel, Sand and Silt,"American Journal of Science, Vol. 25.
Savage, S.B., and Brimberg, J., 1975, "Analysis of PlungingPhenomena in Water Reservoirs," Journal of Hydraulic Research, Vol.13, No. 2,
117

Schiff, J.B., and Schonfeld, J.C., 1953, Theoretical Considerationson the Motion of Salt and Fresh Water., Proceedings, MinnesotaInternational Hydraulics Convention, IAHR-ASCE, Minneapolis, MN.
Schmidt, G., 1983, "Siltation Experience on Roseires Dam," Coyne etBellier, Paris, personal communication.
Schumm, S.A., The Fluvial System, 1977, John Wiley and Sons, NewYork.
Sing, E.F., 1986, River Sediment Budget, Proceedings Fourth FederalInter-Agency Sedimentation Conference, Las Vegas, Nevada.
Strakhov, N.M., 1967. Principles of Lithogenesis, Vol. I (EnglishTr. by Fitzsimmons, J.P.), Consultants Bureau, New York.
Toffaleti, F.B., January 1969, "Definitive Computations of SandDischarge in Rivers, Journal of Hydraulic Engineering,ASCE, Vol. 95,No. HYI.
Trimble, S.W., May 1983, "A Sediment Budget for Coon Creek Basin inthe Driftless Area, Wisconsin, 1853-1977," American Journal ofScience, Vol. 283.
UNESCO, 1977, Atlas of World Water Balance, 1977, Korzoun, V.I.,Editor-in-Chief, Paris.
UNESCO, 1978, World Water Balance and Water Resources of the Earth,Leningrad
Urlapov, G.A., 1977, Irrigation Reservoir That Silts UpInsignificantly, (English Trans), Soviet Hydrology, Selected Papers,AGU, Vol. 16, No. 3.
U.S. Army Corps of Engineers, July 1965, Operation Manual for theRadioactive Sediment Density Probe, U.S. Army Engineer District,Omaha, NE.
--- , March 1977, Scour and Deposition in Rivers and Reservoirs, HEC-6, User's Manual, Hydrologic Engineer Center, Davis, CA.
U.S. Bureau of Reclamation, 1977, Design of Small Dams, Denver, CO.
Walters, W.H., Jr., 1975, Regime Changes of the Lower MississippiRiver, M.S. Thesis, Colorado State University, Fort Collins, CO.
Williams, G.P., and Wolman, M.G., 1984, Downstream Effects of Damson Alluvial Rivers, USGS Professional Paper 1286, Washington D.C.
Winkely, B.R., 1977, Man-Made Cut-Offs on the Lower MississippiRiver, Conception, Construction and River Response, PotamologyInvestigations, Report 300-2, U.S. Army Engineer District,Vicksburg, MS.
Yih, S-H., 1965, Dynamics of Non-Homogeneous Fluids, Macmillan, NewYork.
118

DISTRIBUTORS OF WORLD BANK PUBLICATIONS
ARGENTINA FRANCE KENYA SPAIN
Carlos Hirsch. SRL Worid Bank Publications Afnca Book Service )E.A.I Ltd. Mundi-Prensa Libros, S.A
Galerna Guemes 66 Avenue d'Iena P 0 Box 45245 Castelio 37
Florida 165. 4th Floor-Ofc. 4531465 75116 Paris Nairobi 28001 Madnd
1333 Buenos Aires GERMANY, FEDERAL KOREA, REPUBLIC OF SRI LANKA AND
AUSTRALIA, PAPUA NEW REPUBLIC OF Pan Korea Book Corporaton THE MALDIVES
GUINEA, FIJI, SOLOMON UNO-Verlag P O Bou. 101, Kwngwhamun Lake House Bookshop
ISLANDS, AND VANUATU D-5300 Bonn I Seoul PO box 244
Info-Line Sunrrockstrasse 23 KUWAIT 100, Sir Chittampalam A. Gardiner
Overseas Document Delivery GREECE MEMRB Mawatha
box de6, GPO KEME P 0 Bo. 54t5 Colombo 2
SYd.ev. NSW 2il01 24. ippodamou Street MALAYSIA SWEDEN
AUSTRIA Athsens-11635 University of Malava Cooperative Fr igeile
Gerold and Co GUATEMALA Rooksthp Limited ABCE Fritzes Kungl
A-l01l Wien LibresPletr Sbnt P 0 Box 1127. Jala Pan Bam H-ovbokhandel
Graben 31 Centr Pitura nta Santa Kuala Lump1B Regenngsgatan 12, Box 16356Centro CUltUral Ptedra Santa Kua a Lump 5-103 27 Stockholm
BAHRAIN tI caile 6-50 zona I MEXICO For SiCscription orders.
MEMRB Information Services Guatemala Citv yN OTEo We,heren-WisA
PMO. box T750 HONG KONG, MACAU San Fernando No 37 Box 30004
Manama Town 317 Asia 2000 Ltd. Cal Torello Guerre S-104 25 Stockholm
BANGLADESH 6 Ft., 146 Pnnce Edward Road, W, Thalpan. Mexico D F
Micro Industies Development Kowloon MOROCCO SWITZERitAND9
Assistance Societv (MIDAS) Hong Kon Socete d Etudes MarkengLbrare PaotSociet dEtues Mareting 6 Rue Grenus
G P.O Box BM HUNGARY Marocaune Case postal 381Dhaka Kultura 2 Rue Molere. Sd d'Anfa CH 1211 Geneva 11
BELGIUM P.O Box 139 Casablan-aPublcatons des Nations Unies 1389 Budapest 62 TANZANIA
THE NETHERLANDS Oxtord Umversitv PressAv du Rot 202 INDIA Medical Books Europe. BY (MBE) P 0. Box 5299
1eOi Brussels FlIr ssyle titles Noorderwal 38, Dar es Salaam
BRAZIL UBS Publishers' Distibutors Ltd. 7241 BL Lochem
Pubhcacoes Tecmcas Post Box 7015 TtHAILAND
Intenaacionais Ltda. Nesv Delhi t10002 NEW ZEALAND Central Department Store
Rua Peuxoto Gomide, 209 10 First Main Road ills Librarv and Informaon ba0 k k
01409 Sao Paulo. SP Gandhi Nagar Pnvate Bag ngko
CANADA Bangalore 560el09 New Market TRINIDAD & TOBAGO,
Le Diffuseur Apeetav Chambers. P 0 Box 736 Auckland ANTIGUA, BARBUDA,
C.P 85, 1501 Anpere Stneet S Wallace Street BARBADOS, DOMINICA,
Boucherville, Quebec Bombay 400C01 GRENADA, GUYANA,14B SE6 4.11-B, Ctiowringhee Lane Universitv Press Limited MONTSERRAT, ST. KITTS
CHI5E6 Calcutta 00016 CLhree Crowns Bulding lencho AND NEVIS, ST. LUCIA,
CHILE Cdc.tta 700016 Pnvate Mail Bag 5095 ST. VINCENT & GRENADINES
Editoral Renacimiento tlt. IIA), Swarup Nagar ibadan Svstemaucs Studies Unit
ntraglores 354 Kanpur 2(RaXI NORWAY 55 Eastern Main Road
Santago Swvaganga Road Tanum Karl johtn. A S CurepeNlungambakkam ~~P 0 Box 1177 Sentruni Trinslad, West Indie
COLOMBIA Madras 60(134 Oslo I TJIIEnlace Ltda. A °5'0 'gTUNISIACaBro a 6 F. Piaha 85121 PAKISTAN S Societe Tunisienise de Diffusion
Bog-ta D E. ~~~~~~~~~~~IraBkAeny5vnudvCiagApartado Aereo 4430 For subscription ordiers 65i,. Book iAh--naide-A A veTunued arhg
Cali, Valle Universal Subscription Agency P6.Bo5 .Shh 729Q i-eAari TuruEYAPvt. Ltd. P O. Box No. 729 TURus
COSTA RICA 18-19 Community Centre Saket Lahore 3 Haset Kitapevi A S.
Librena Treeox New Delhi 110 017 PERU 469, [sttklal Caddesi
Cave 11-13 INDOfESIA Editorial Desa-rollo SA Bevogiu-istanbui
A. Femandeo Pt Indira N mited Apartado 382A UGANDA
11 Sam Ratulangs 37 Limo Uganda Bookshop
COTE D'IVOIRE lakarta Pusat THE PHILIPPINES P.O Box 7145
Centre d'Editon et de Diftusion P O Box 181 Natonal Book Store Kampala
Afiines (CEDA) IRELAND 701 Rival Avenue UNITED ARAB EMIRATES0l4SP 41M MEMRB Gall CoAbidjan 04 Plateau TDC Publsher Mefto MaICilar
12 North Fredenck Street PORTUGAL P O2. Bos 6097CYPRUS Dublin I Livrana Portugal Sharjaah
MEMRB Inforimation ServcesRuDoCro774UIEKNGOP . Box 2098 ISRAEL R Do C bo UNITED KINGDOMNicosia The lerusalem Post 120 Lisbon Mrmto Ltd
The Jerusaliem Post Budding SAUDI ARABIA, QATAR r. 0 Box 3
DENMARK PO Boa 81 Janr Book 9tore klton, Hampshire CU 34 2PG
SamfundsLitteratur Romena Jerusalem 910(90 P 0 B.x 31% England
Rosenoems Alle 11 R3vadh H471 VENEZUELA
DK-1970 Frederiksberg C. ITALY Rvdi17Licosa Commissionana SINGAPORE, TAIWAN, Librena del Este
DOMINICAN REPUBLIC S.nsom SPA BURMA, BRUNEI Aptdo nil 337
Editora Taller, C poT A Via Lamarnora 45 Information Publicaton, Caracas 1Blf -A
Restaurarcun Casella Postale 552 Pnvate. Ltd. WESTERN SAMOA
Apdo postal 2190 50121 Florence 02-06 Ist Fl . Pe,-Fu Industrial Wesles Bookshop
Santo Domingo JAPAN Bldg . 24 New Inlustral RKoad n Box 207
EGYPT, ARAB REPUBLIC OF Eastern Book Service Singapore Apia
Al Ahram 37-3, Hongo 3-Chome. SOUTH AFRICA YUGOSLAVIA
Al Galaa Street Bunkvu-ku 113 For inigle Titles lugoslovenska Kniiga
Cairo Tokvo Oxford Universitv Press YU-11000 Belgrade I rg RepubilikeSouthern Africa
FINLAND JORDAN Pr0 Bo 1141 ZIMBABWE
Akateemmen Kirtakauppa Jordan Center for Marketing Cape Town 8W0M Testbook Sales P t Ltd
P 0 Box 128 Re,earth ik,' 3799
SF 00101 P 0 Box 3143 Fr bisi-riton irders Har-
Helsihki 10 Jabal Int-riabonal Suts-pp,on Seri-ie
Amman PO Box 41095Craigsall
Johannesburg 2024

I~~~ ~~~~~~~~~~~~~~~~~~~~~~~~~~~~~~~~~~~~~~ ~~ ~~ ~~ ~~ ~~ ~~ ~~ ~~ ~~ ~~ ~~ ~~ ~~~~~~~~~~~~~~~~~~~~~~~~~~~~~~~~~~~~~~~~~~~~~~~~~~~~~~~~~~~~~~~~~~~~~~~~~~~~~~~~~~~~~~~~~~~~~~~~~~~~~~~~~~~~~~~~~~~~~~~~~~~~~~~~~~~~

RECENT WORLD BANK TECHNICAL PAPERS (continued)
No. 51. Wastewater Irrigation: Health Effects and Technical Solutions
No. 52. Urban Transit Systems: Guidelines for Examining Options
No. 53. Monitoring and Evaluating Urban Development Programs: A Handbook for Program Managers
and Researchers
No. 54. A Manager's Guide to "Monitoring and Evaluating Urban Development Programs"
No. 55. Techniques for Assessing Industrial Hazards: A Manual
No. 56. Action-Planning Workshops for Development Management: Guidelines
No. 57. The Co-composing of Domestic Solid and Human Wastes
No. 58. Credit Guarantee Schemes for Small and Medium Enterprises
No. 59. World Nitrogen Survey
No. 60. Community Piped Water Supply Systems in Developing Countries: A Planning Manual
No. 61. Desertification in the Sahelian and Sudanian Zones of West Africa
No. 62. The Management of Cultural Property in World Bank-Assisted Projects: Archaeological,Historical, Religious, and Natural Unique Sites
No. 63. Financial Information for Management of a Development Finance Institution:Some Guidelines
No. 64. The Efficient Use of Wat, C ar Improving
Irrigation in Arid and S
** TD 396 .M25 1987 c.2No. 65. Management Contracts: M
No. 66F.Preparation of Land DevE Mahmood, K.
No. 67 *Household Energy Handbo Reservoir sedimentation
No. 68. Bus Services: Reducin
No. 69. Corrosion Protection o
No. 70. Desertification Contrc
and Sudanian Zones of

ISSN 0253-7494Cover design by Bill Fraser ISBN 0-8213-0952-8
Related Documents