20 DEC, 2021 Sector Trends goldilocksresearch.com Private & Confidential. Please see the important disclaimer at the end of this report. Market Indices Sensex 55822 Nifty 16614 52-Week Range 13131 - 18604 India VIX 18.96 IT Real Estate Capital Goods Metals Auto Men Have Been Separated From The Boys Opportunity Knocking Again The market has recently reached a point where every sector and segment has been impacted. The index has seen a 10% cut from the highs that has separated the “men from the boys”. This correction was overdue. With 16000/34000 as major supports on the Nifty/Bank Nifty, the risk-reward is turning in favour of longs again. Large-caps look better placed at this juncture as they could recover with the indices. Global volatility is here to stay and the news flow around the Covid variant is not helping. Hence, expect a period of time correction ahead. Price correction could be more or less done with. The IT, Real Estate, Cap Goods, Infrastructure and Banking sectors look like outperformers from here. Nifty Bank – Critically Placed At Supports Bank Nifty has seen a large fall in the last many weeks. After nearly hitting 42000 in Oct ’21 the index tested 34000 yesterday. It seems that a down cycle is getting completely. The index is oversold and should get into recovery mode. While some resistance is seen at 35300 (200-DMA), the next numbers to work with are 36500/37500. ICICI Bank & SBI are still the best bets. NSE IT – More Upside Coming For the last few months the IT index has been in a range. Now we have evidence to believe that this was consolidation. Hence, the chances of an upward breakout and outperformance over the Nifty is quite high. Many opportunities are developing. BSE Real Estate – Best In Class After a spectacular rally in the middle of the year the index has gone through a “normal” correction. With support levels nearby we see the current fall as an opportunity for medium and long- term investors. NSE Pharma – Nothing To Cheer About The Pharma index remains at a make or break point. The area around 13000-13200 is a huge support. Either it turns around from here and resumes the bull trend (preferred view) or if a breakdown were to happen then major incremental weakness could be seen. NSE Metals – At Medium-term Supports The Metals index has been volatile in a range in the last few months. It is back near the major support of 5200. Till this is safe the chances of a rebound remain. Have to stay stock specific. For Subscribers Only Gautam Shah (CMT, CFTe, MSTA) [email protected] +91 98300 35900 Outperforming Sectors Underperforming Sectors

Welcome message from author
This document is posted to help you gain knowledge. Please leave a comment to let me know what you think about it! Share it to your friends and learn new things together.
Transcript

20 DEC, 2021
Sector Trends
goldilocksresearch.comPrivate & Confidential. Please see the important disclaimer at the end of this report.
Market Indices
Sensex 55822
Nifty 16614
52-Week Range 13131 - 18604
India VIX 18.96
IT
Real Estate
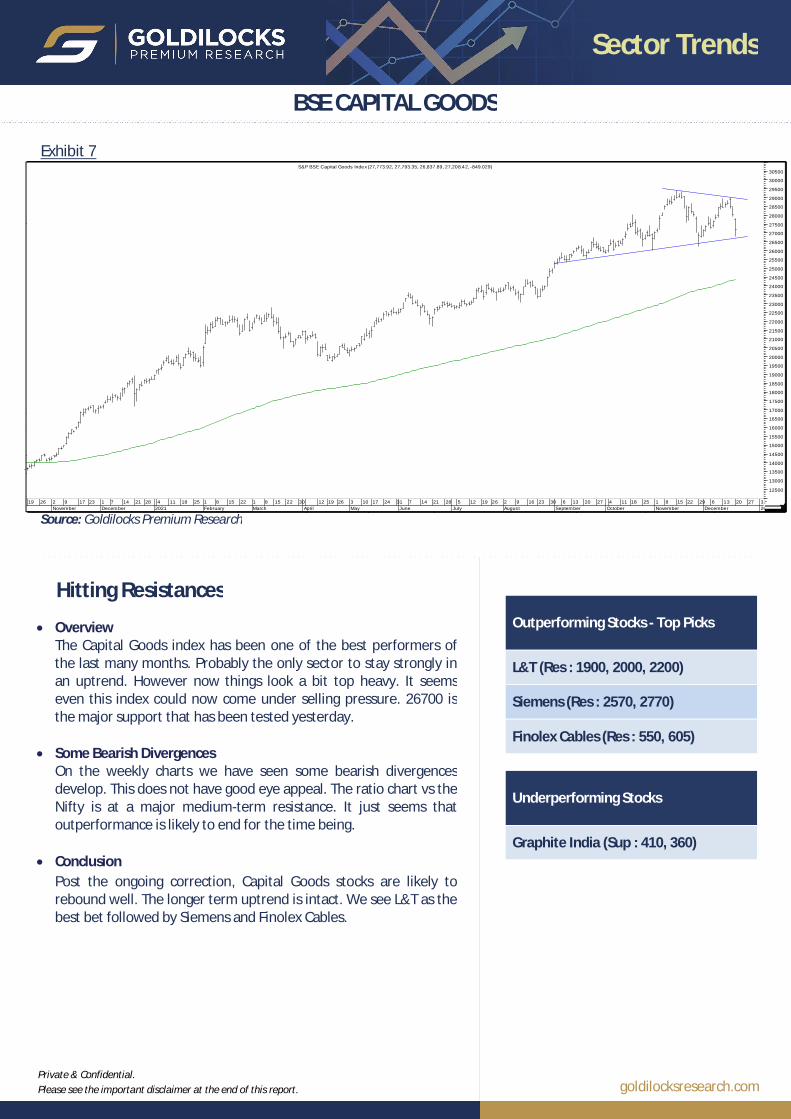
Capital Goods
Metals
Auto
Men Have Been Separated From The Boys
Opportunity Knocking Again The market has recently reached a point where every sector and segment has been impacted. The index has seen a 10% cut from the highs that has separated the “men from the boys”. This correction was overdue. With 16000/34000 as major supports on the Nifty/Bank Nifty, the risk-reward is turning in favour of longs again. Large-caps look better placed at this juncture as they could recover with the indices. Global volatility is here to stay and the news flow around the Covid variant is not helping. Hence, expect a period of time correction ahead. Price correction could be more or less done with. The IT, Real Estate, Cap Goods, Infrastructure and Banking sectors look like outperformers from here.
Nifty Bank – Critically Placed At Supports Bank Nifty has seen a large fall in the last many weeks. After nearly hitting 42000 in Oct ’21 the index tested 34000 yesterday. It seems that a down cycle is getting completely. The index is oversold andshould get into recovery mode. While some resistance is seen at 35300 (200-DMA), the next numbers to work with are 36500/37500. ICICI Bank & SBI are still the best bets.
NSE IT – More Upside Coming For the last few months the IT index has been in a range. Now we have evidence to believe that this was consolidation. Hence, the chances of an upward breakout and outperformance over the Nifty is quite high. Many opportunities are developing.
BSE Real Estate – Best In Class
After a spectacular rally in the middle of the year the index has gone through a “normal” correction. With support levels nearby we see the current fall as an opportunity for medium and long-term investors.
NSE Pharma – Nothing To Cheer About The Pharma index remains at a make or break point. The area around 13000-13200 is a huge support. Either it turns around from here and resumes the bull trend (preferred view) or if a breakdown were to happen then major incremental weakness could be seen.
NSE Metals – At Medium-term Supports The Metals index has been volatile in a range in the last few months. It is back near the major support of 5200. Till this is safe the chances of a rebound remain. Have to stay stock specific.
For Subscribers Only
Gautam Shah (CMT, CFTe, MSTA)[email protected]
+91 98300 35900
Outperforming Sectors
Underperforming Sectors
goldilocksresearch.comPrivate & Confidential. Please see the important disclaimer at the end of this report.
Sector Trends
Underperforming Stocks
Bandhan Bank (Sup : 230, 200)
Outperforming Stocks - Top Picks
ICICI Bank (Res : 740, 770, 800)
SBI (Res : 466, 480, 507)
Kotak Bank (Res : 1815, 1890, 2000)
November December 2018 February March April May June July August September October November December 2019 February March April May June July Augus t September October November December 2020 February March
23000
23500
24000
24500
25000
25500
26000
26500
27000
27500
28000
28500
29000
29500
30000
30500
31000
31500
32000
32500
33000
* CNX BANK INDEX (29,252.95, 29,273.65, 28,125.15, 28,653.70, -523.352)
August September November 2017 February April May June July August September November 2018 February April May June July August September November December2019 February April May June July August September November December2020 February March April May June July
15000
15500
16000
16500
17000
17500
18000
18500
19000
19500
20000
20500
21000
21500
22000
22500
23000
23500
24000
24500
25000
25500
26000
26500
27000
27500
28000
28500
29000
29500
30000
30500
31000
31500
32000
32500
33000
33500
34000
0
10
20
30
40
50
60
70
80
90
100Relative Strength Index (46.3985)
25 2July
9 16 23 30 6August
13 20 27 3 10 17September
24 1 8October
15 22 29 5 12November
19 26 3 10December
17 24 31 72019
14 21 28 4 11February
18 25 5 11March
18 25 1April
8 15 22 30May
13 20 27 3 10June
17 24 1July
8 15 22 29 5August
13 19 26 3 9 16September
23 30 7October
14 22 29 4 11November
18 25 2 9December
16 23 3023500236002370023800239002400024100242002430024400245002460024700248002490025000251002520025300254002550025600257002580025900260002610026200263002640026500266002670026800269002700027100272002730027400275002760027700278002790028000281002820028300284002850028600287002880028900290002910029200293002940029500296002970029800299003000030100302003030030400305003060030700308003090031000311003120031300314003150031600317003180031900320003210032200323003240032500326003270032800
* CNX BANK INDEX (31,775.55, 32,105.05, 31,770.50, 32,014.25, +348.801)
10December
17 24 312019
7 14 21 28 4February
11 18 25 5March
11 18 25 1April
8 15 22 30 6May
13 20 27 3June
10 17 24 1July
8 15 22 29 5August
13 19 26 3 9September
16 23 30 7October
14 22 29 4 11November
18 25 2 9December
16 23 30 62020
13 20 27 3February
25000
25500
26000
26500
27000
27500
28000
28500
29000
29500
30000
30500
31000
31500
32000
32500
33000
2.45
2.46
2.47
2.48
2.49
2.50
2.51
2.52
2.53
2.54
2.55
2.56
2.57
2.58
2.59
2.60
2.61
2.62
2.63
2.64
2.65
2.66
2.67
Relative Strength Compara tive(* CNX NIFTY) (2.55746, -0.02065)
22 29 4November
11 18 25 2December
9 16 23 302020
6 13 20 27 3February
10 17 24 2March
9 16 23 30April
7 13 20 27 4May
11 18 26 1June
8 15 22 29July
6
15000
15500
16000
16500
17000
17500
18000
18500
19000
19500
20000
20500
21000
21500
22000
22500
23000
23500
24000
24500
25000
25500
26000
26500
27000
27500
28000
28500
29000
29500
30000
30500
31000
31500
32000
32500
33000
33500
34000
1.901.952.002.052.102.152.202.252.302.352.402.452.502.552.602.652.70Relative Strength Comparative(* CNX NIFTY) (2.08290, +0.00631)
29 4 11November
18 25 2 9December
16 23 30 62020
13 20 27 3February
10 17 24 2March
9 16 23 30 7April
13 20 27 4May
11 18 26 1June
8 15 22 29July
6 13 20 27 3August
10
15000
15500
16000
16500
17000
17500
18000
18500
19000
19500
20000
20500
21000
21500
22000
22500
23000
23500
24000
24500
25000
25500
26000
26500
27000
27500
28000
28500
29000
29500
30000
30500
31000
31500
32000
32500
33000
33500
34000* CNX BANK INDEX (22,853.20, 22,854.05, 22,417.20, 22,662.05, -421.850)
28 5July
12 19 26 2 9August
16 23 30 6 13 20September
27 4 11October
18 27 1 8 15November
22 29 6 13 20December
27 3 102020
17 24 1 7 14February
20 28 6 13March
20 27 3 9April
17 24 30 8May
15 22 29 5 12June
19 26 3July
10 17 24 31 7 14August
21 25 1 8 15September
22 29 6 13October
20 27 3 10November
15000
15500
16000
16500
17000
17500
18000
18500
19000
19500
20000
20500
21000
21500
22000
22500
23000
23500
24000
24500
25000
25500
26000
26500
27000
27500
28000
28500
29000
29500
30000
30500
31000
31500
32000
32500
33000
33500
34000* CNX BANK INDEX (22,436.85, 23,180.30, 22,410.05, 23,092.15, +792.551)
16 23 30 62020
13 20 27 3 10February
17 24 2March
9 16 23 30 7April
13 20 27 4May
11 18 26 1June
8 15 22 29July
6 13 20 27 3August
10 17 24 31 7September
14 21 28 5October
12
15000
15500
16000
16500
17000
17500
18000
18500
19000
19500
20000
20500
21000
21500
22000
22500
23000
23500
24000
24500
25000
25500
26000
26500
27000
27500
28000
28500
29000
29500
30000
30500
31000
31500
32000
32500
33000
33500
34000* CNX BANK INDEX (21,685.25, 22,293.75, 21,664.15, 22,246.00, +794.199)
20 27 4May
11 18 26 1June
8 15 22 29July
6 13 20 27 3August
10 17 24 31 7September
14 21 28 5October
12 19 26 2 9November
16 23 30
16500
17000
17500
18000
18500
19000
19500
20000
20500
21000
21500
22000
22500
23000
23500
24000
24500
25000
25500
26000
26500
27000
27500
28000
28500
29000
29500
30000Nifty Bank Index (28,685.70, 28,752.45, 28,431.85, 28,594.30, +128.602)
August September October November December 2020 February March April May June July August September October November December 2021
150001550016000165001700017500180001850019000195002000020500210002150022000225002300023500240002450025000255002600026500270002750028000285002900029500300003050031000315003200032500330003350034000
10152025303540455055606570758085Relative Strength Index (55.0572)
August September October November December 2020 February March April May June July August September October November December 2021 February
15000
15500
16000
16500
17000
17500
18000
18500
19000
19500
20000
20500
21000
21500
22000
22500
23000
23500
24000
24500
25000
25500
26000
26500
27000
27500
28000
28500
29000
29500
30000
30500
31000
31500
32000
32500
33000
33500
34000Nifty Bank Index (32,082.90, 32,464.95, 31,863.95, 32,424.85, +613.100)
June July August September November 2019 February March April May June July August September November 2020 February April May June July August September November 2021 February March
15000
16000
17000
18000
19000
20000
21000
22000
23000
24000
25000
26000
27000
28000
29000
30000
31000
32000
33000
34000
35000
36000
37000
38000
39000
1.851.901.952.002.052.102.152.202.252.302.352.402.452.502.552.602.65
Relative Strength Comparative(.NSEI) (2.39235, -0.02759)
August September October November December 2020 February March April May June July August September October November December 2021 February March April
15000160001700018000190002000021000220002300024000250002600027000280002900030000310003200033000340003500036000370003800039000
1.851.90
1.95
2.002.05
2.10
2.152.20
2.25
2.302.35
2.40
2.45
2.50
2.55
2.602.65
Relative Strength Comparative(.NSEI) (2.32567, +0.00052)
2 9March
16 23 30 7April
13 20 27 4May
11 18 26 1 8June
15 22 29 6July
13 20 27 3 10August
17 24 31 7 14September
21 28 5 12October
19 26 2 9November
17 23 1 7 14December
21 28 42021
11 18 25 1 8February
15 22 1 8March
15 22 30April
12 19 26 3May
10
150001600017000
180001900020000
210002200023000
240002500026000
2700028000
290003000031000
320003300034000
3500036000
370003800039000
10
15
20
25
30
35
40
45
50
55
60
65
70
75
80
85Relative Strength Index (41.6646)
13 20 27 3 10August
17 24 31 7September
14 21 28 5October
12 19 26 2 9November
17 23 1 7December
14 21 28 42021
11 18 25 1 8February
15 22 1March
8 15 22 30 5April
12 19 26 3May
10 17 24 31June
19000
20000
21000
22000
23000
24000
25000
26000
27000
28000
29000
30000
31000
32000
33000
34000
35000
36000
37000
38000
3900025
30
35
40
45
50
55
60
65
70
75
80
Relative Strength Index (55.2559)
14 21 28 5October
12 19 26 2 9November
17 23 1 7December
14 21 28 42021
11 18 25 1 8February
15 22 1March
8 15 22 30 5April
12 19 26 3May
10 17 24 31June
7 14 21 28 5July
12 19 26
19000
1950020000
20500
21000
21500
2200022500
23000
23500
24000
2450025000
25500
26000
2650027000
27500
28000
28500
29000
29500
30000
30500
31000
3150032000
32500
33000
33500
34000
34500
35000
35500
36000
3650037000
37500
38000
3850039000
Nifty Bank Index (35,163.75, 35,225.20, 34,859.90, 35,071.95, -202.152)
November December 2021 February March April May June July August2700027500280002850029000295003000030500310003150032000325003300033500340003450035000355003600036500370003750038000
Nifty Bank Index (36,000.75, 36,233.30, 35,937.10, 36,169.35, +232.301)
December 2021 February March April May June July August September October
285002900029500300003050031000315003200032500330003350034000345003500035500360003650037000375003800038500Nifty Bank Index (37,954.00, 38,112.60, 37,680.00, 37,830.30, +58.6016)
April May June July August September October November December 2021 February March April May June July August September October November
1500015500160001650017000175001800018500190001950020000205002100021500220002250023000235002400024500250002550026000265002700027500280002850029000295003000030500310003150032000325003300033500340003450035000355003600036500370003750038000385003900039500400004050041000415004200042500430004350044000Nifty Bank Index (41,057.75, 41,367.25, 40,867.60, 40,954.80, -237.598)
A S O N D 2017 M A M J J A S O N D 2018 M A M J J A S O N D 2019 M A M J J A S O N D 2020 M A M J J A S O N D 2021 M A M J J A S O N D 2022140001500016000170001800019000200002100022000230002400025000260002700028000290003000031000320003300034000350003600037000380003900040000410004200043000
10
15
20
25
30
35
40
45
50
55
60
65
70
75
80
85Relative Strength Index (60.7902)
9November
17 23 1 7 14December
21 28 42021
11 18 25 1 8February
15 22 1 8March
15 22 30April
12 19 26 3May
10 17 24 31 7June
14 21 28 5July
12 19 26 2 9August
16 23 30 6 13September
20 27 4 11October
18 25 1 8 15November
22 29 6 13December
20 27 32022
26000
26500
27000
27500
28000
28500
29000
29500
30000
30500
31000
31500
32000
32500
33000
33500
34000
34500
35000
35500
36000
36500
37000
37500
38000
38500
39000
39500
40000
40500
41000
41500
42000
42500
43000Nifty Bank Index (35,124.35, 35,231.10, 34,018.45, 34,439.85, -1,178.80)
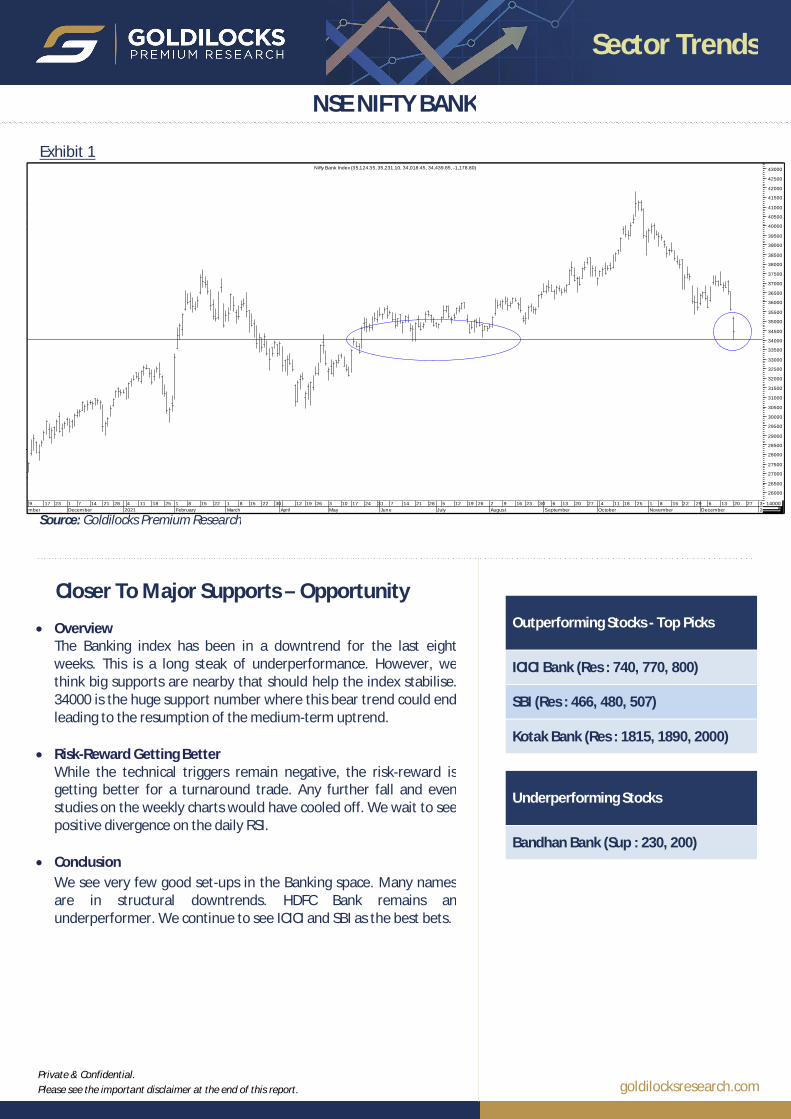
NSE NIFTY BANK
Exhibit 1
Closer To Major Supports – Opportunity
Overview The Banking index has been in a downtrend for the last eight weeks. This is a long steak of underperformance. However, we think big supports are nearby that should help the index stabilise. 34000 is the huge support number where this bear trend could end leading to the resumption of the medium-term uptrend.
Risk-Reward Getting Better While the technical triggers remain negative, the risk-reward is getting better for a turnaround trade. Any further fall and even studies on the weekly charts would have cooled off. We wait to see positive divergence on the daily RSI.
Conclusion We see very few good set-ups in the Banking space. Many names are in structural downtrends. HDFC Bank remains an underperformer. We continue to see ICICI and SBI as the best bets.
Source: Goldilocks Premium Research
goldilocksresearch.comPrivate & Confidential. Please see the important disclaimer at the end of this report.
Sector Trends
Outperforming Stocks - Top Picks
United Breweries (Res : 1620, 1730)
ICICI Sec. (Res : 800, 885)
Indian Hotels (Res : 190, 205, 230)
Underperforming Stocks
Dhani (Sup : 133, 104)
2017 February March April May June July August September October November December 2018 February March April May June July August September November December 2019 February March April May June July August September October November December13800139001400014100142001430014400145001460014700148001490015000151001520015300154001550015600157001580015900160001610016200163001640016500166001670016800169001700017100172001730017400175001760017700178001790018000181001820018300184001850018600187001880018900190001910019200193001940019500196001970019800199002000020100202002030020400205002060020700208002090021000211002120021300214002150021600217002180021900220002210022200223002240022500* NIFTY MIDCAP 100 (16,826.40, 16,947.05, 16,822.15, 16,932.40, +160.900)
Oct Nov Dec 2016 Feb Mar Apr May Jun Jul Aug Sep Oct Nov Dec 2017 Feb Mar Apr May Jun Jul Aug Sep Oct Nov Dec 2018 Feb Mar Apr May Jun Jul Aug Sep Oct Nov Dec 2019 Feb Mar Apr May Jun Jul Aug Sep Oct Nov Dec 2020 Feb Mar Apr
11000
11500
12000
12500
13000
13500
14000
14500
15000
15500
16000
16500
17000
17500
18000
18500
19000
19500
20000
20500
21000
21500
22000
22500
23000* NIFTY MIDCAP 100 (17,459.90, 18,113.30, 17,455.95, 18,073.90, +687.551)
12November
19 26 3 10December
17 24 31 72019
14 21 28 4 11February
18 25 5March
11 18 25 1April
8 15 22 30 6May
13 20 27 3June
10 17 24 1July
8 15 22 29 5August
13 19 26 3 9 16September
23 30 7October
14 22 29 4 11November
18 25 2 9December
16 23 30 62020
13 20 27 3 10February
17 24 2March
9 16146501470014750148001485014900149501500015050151001515015200152501530015350154001545015500155501560015650157001575015800158501590015950160001605016100161501620016250163001635016400164501650016550166001665016700167501680016850169001695017000170501710017150172001725017300173501740017450175001755017600176501770017750178001785017900179501800018050181001815018200182501830018350184001845018500185501860018650187001875018800
0.0%
50.0%
61.8%
100.0%
16300-16400 Important
* NIFTY MIDCAP 100 (17,035.25, 17,083.85, 16,490.40, 16,746.45, -257.900)
Sep Oct Nov Dec 2014 Feb Mar Apr May Jun Jul Aug Sep Oct Nov Dec 2015 Feb Mar Apr May Jun Jul Aug Sep Oct Nov Dec 2016 Feb Mar Apr May Jun Jul Aug Sep Oct Nov Dec 2017 Mar Apr May Jun Jul Aug Sep Oct Nov Dec 2018 Mar Apr May Jun Jul Aug Sep Oct Nov Dec 2019 Mar Apr May Jun Jul Aug Sep Oct Nov Dec 2020 Mar Apr May Jun Jul
5000
5500
6000
6500
7000
7500
8000
8500
9000
9500
10000
10500
11000
11500
12000
12500
13000
13500
14000
14500
15000
15500
16000
16500
17000
17500
18000
18500
19000
19500
20000
20500
21000
21500
22000
22500
23000* NIFTY MIDCAP 100 (12,847.50, 13,598.35, 12,824.90, 13,502.00, +806.300)
18 25 5March
11 18 25 1April
8 15 22 30 6May
13 20 27 3 10June
17 24 1July
8 15 22 29 5August
13 19 26 3 9 16September
23 30 7October
14 22 29 4 11November
18 25 2 9December
16 23 30 62020
13 20 27 3 10February
17 24 2March
9 16 23 30 7April
13 20 27 4May
11 18 26 1June
8 15 22 29 6July
1010010200103001040010500106001070010800109001100011100112001130011400115001160011700118001190012000121001220012300124001250012600127001280012900130001310013200133001340013500136001370013800139001400014100142001430014400145001460014700148001490015000151001520015300154001550015600157001580015900160001610016200163001640016500166001670016800169001700017100172001730017400175001760017700178001790018000181001820018300184001850018600187001880018900190001910019200* NIFTY MIDCAP 100 (14,494.80, 14,592.55, 14,433.75, 14,565.85, +138.300)
Sep Oct Nov Dec 2018 Feb Mar Apr May Jun Jul Aug Sep Oct Nov Dec 2019 Feb Mar Apr May Jun Jul Aug Sep Oct Nov Dec 2020 Feb Mar Apr May Jun Jul Aug Sep Oct
10000
10500
11000
11500
12000
12500
13000
13500
14000
14500
15000
15500
16000
16500
17000
17500
18000
18500
19000
19500
20000
20500
21000
21500
22000
22500* NIFTY MIDCAP 100 (15,321.60, 15,594.65, 15,312.20, 15,528.55, +286.250)
4 11November
18 25 2 9December
16 23 30 62020
13 20 27 3 10February
17 24 2March
9 16 23 30 7April
13 20 27 4May
11 18 26 1June
8 15 22 29July
6 13 20 27 3August
10 17 24 31 7September
10500
11000
11500
12000
12500
13000
13500
14000
14500
15000
15500
16000
16500
17000
17500
18000
18500
19000* NIFTY MIDCAP 100 (17,220.00, 17,266.15, 17,083.60, 17,159.65, +58.2012)
29 4 11November
18 25 2 9December
16 23 30 62020
13 20 27 3 10February
17 24 2March
9 16 23 30 7April
13 20 27 4May
11 18 26 1June
8 15 22 29 6July
13 20 27 3 10August
17 24 31 7September
14 21 28 5October
12
10500
11000
11500
12000
12500
13000
13500
14000
14500
15000
15500
16000
16500
17000
17500
18000
18500
19000* NIFTY MIDCAP 100 (17,125.95, 17,186.05, 17,086.40, 17,125.00, +141.949)
July August September November 2019 February March April May June July August September November 2020 February March April May June July August September October November
10000
10500
11000
11500
12000
12500
13000
13500
14000
14500
15000
15500
16000
16500
17000
17500
18000
18500
19000
19500
20000
20500
NIFTY Midcap 100 (18,491.25, 18,532.90, 18,397.75, 18,447.65, +94.2500)
Aug Sep Oct Nov Dec 2018 Feb Mar Apr May Jun Jul Aug Sep Oct Nov Dec 2019 Feb Mar Apr May Jun Jul Aug Sep Oct Nov Dec 2020 Feb Mar Apr May Jun Jul Aug Sep Oct Nov Dec 2021
10000
10500
11000
11500
12000
12500
13000
13500
14000
14500
15000
15500
16000
16500
17000
17500
18000
18500
19000
19500
20000
20500
21000
21500
22000
22500NIFTY Midcap 100 (20,037.25, 20,472.60, 19,983.45, 20,439.95, +475.049)
May Jun Jul Aug Sep Oct Nov Dec 2017 Mar Apr May Jun Jul Aug Sep Oct Nov Dec 2018 Mar Apr May Jun Jul Aug Sep Oct Nov Dec 2019 Mar Apr May Jun Jul Aug Sep Oct Nov Dec 2020 Feb Mar Apr May Jun Jul Aug Sep Oct Nov Dec 2021 Mar Apr
100001050011000115001200012500130001350014000145001500015500160001650017000175001800018500190001950020000205002100021500220002250023000
15
20
25
30
35
40
45
50
55
60
65
70
75
80
85Relative Strength Index (76.7354)
4May
11 18 26 1June
8 15 22 29 6July
13 20 27 3August
10 17 24 31 7September
14 21 28 5October
12 19 26 2 9November
17 23 1 7December
14 21 28 42021
11 18 25 1 8February
15 22 1March
8115001200012500130001350014000145001500015500160001650017000175001800018500190001950020000205002100021500220002250023000235002400024500
35
40
45
50
55
60
65
70
75
80
85Relative Strength Index (63.0655)
Jun Jul Aug Sep Oct Nov Dec 2017 Mar Apr May Jun Jul Aug Sep Oct Nov Dec 2018 Mar Apr May Jun Jul Aug Sep Oct Nov Dec 2019 Mar Apr May Jun Jul Aug Sep Oct Nov Dec 2020 Mar Apr May Jun Jul Aug Sep Oct Nov Dec 2021 Mar Apr May Jun
1000010500110001150012000125001300013500140001450015000155001600016500170001750018000185001900019500200002050021000215002200022500230002350024000245002500025500
1.35
1.40
1.45
1.50
1.55
1.60
1.65
1.70
1.75
1.80
1.85
1.90
1.95
2.00
2.05Relative Strength Comparative(.NSEI) (1.58882, -0.01557)
October November December 2020 February March April May June July August September October November December 2021 February March April May
1000010500110001150012000125001300013500140001450015000155001600016500170001750018000185001900019500200002050021000215002200022500230002350024000245002500025500
1.35
1.40
1.45
1.50
1.55
1.60
Relative Strength Comparative(.NSEI) (1.63811, +0.01154)
N D 2015 M A M J J A S O N D 2016 M A M J J A S O N D 2017 M A M J J A S O N D 2018 M A M J J A S O N D 2019 M A M J J A S O N D 2020 M A M J J A S O N D 2021 M A M J J A700075008000850090009500
10000105001100011500120001250013000135001400014500150001550016000165001700017500180001850019000195002000020500210002150022000225002300023500240002450025000255002600026500
1.35
1.40
1.45
1.50
1.55
1.60
1.65
1.70
1.75
1.80
1.85
1.90
1.95
2.00
2.05Relative Strength Comparative(.NSEI) (1.66270, +0.00280)
Dec 2018 Feb Mar Apr May Jun Jul Aug Sep Oct Nov Dec 2019 Feb Mar Apr May Jun Jul Aug Sep Oct Nov Dec 2020 Feb Mar Apr May Jun Jul Aug Sep Oct Nov Dec 2021 Feb Mar Apr May Jun Jul Aug Sep
10000
11000
12000
13000
14000
15000
16000
17000
18000
19000
20000
21000
22000
23000
24000
25000
26000
27000
28000
15
20
25
30
35
40
45
50
55
60
65
70
75
80Relative Strength Index (73.5831)
October November December 2021 February March April May June July August1600017000180001900020000210002200023000240002500026000270002800029000
50
60
70
80Relative Strength Index (51.5530)
12 19 26 3May
10 17 24 31 7June
14 21 28 5July
12 19 26 2 9August
16 23 30 6 13September
20 27 4 11October
2300024000
25000
2600027000
2800029000
30000
31000
40
50
60
70
80Relative Strength Index (65.1754)
22 30 5April
12 19 26 3May
10 17 24 31June
7 14 21 28 5July
12 19 26 2August
9 16 23 30 6September
13 20 27 4October
11 18 25 1 8November
22000225002300023500240002450025000255002600026500270002750028000285002900029500300003050031000315003200032500330003350034000
35
40
45
50
55
60
65
70
75
80
85Relative Strength Index (50.6693)
2018 Mar Apr May Jun Jul Aug Sep Oct Nov Dec 2019 Mar Apr May Jun Jul Aug Sep Oct Nov Dec 2020 Feb Mar Apr May Jun Jul Aug Sep Oct Nov Dec 2021 Feb Mar Apr May Jun Jul Aug Sep Oct Nov Dec 2022
900010000
1100012000
1300014000150001600017000
180001900020000
210002200023000
2400025000
2600027000280002900030000310003200033000
3400035000
15
20
2530
35
4045
50
55606570
75
8085
Relative Strength Index (71.0510)
8February
15 22 1March
8 15 22 30 5April
12 19 26 3May
10 17 24 31June
7 14 21 28 5July
12 19 26 2 9August
16 23 30 6 13September
20 27 4October
11 18 25 1 8November
15 22 29 6December
13 20 27 32022
21500
22000
22500
23000
23500
24000
24500
25000
25500
26000
26500
27000
27500
28000
28500
29000
29500
30000
30500
31000
31500
32000
32500
33000
33500
34000NIFTY Midcap 100 (29,530.30, 29,570.25, 28,396.10, 28,838.20, -1,101.10)
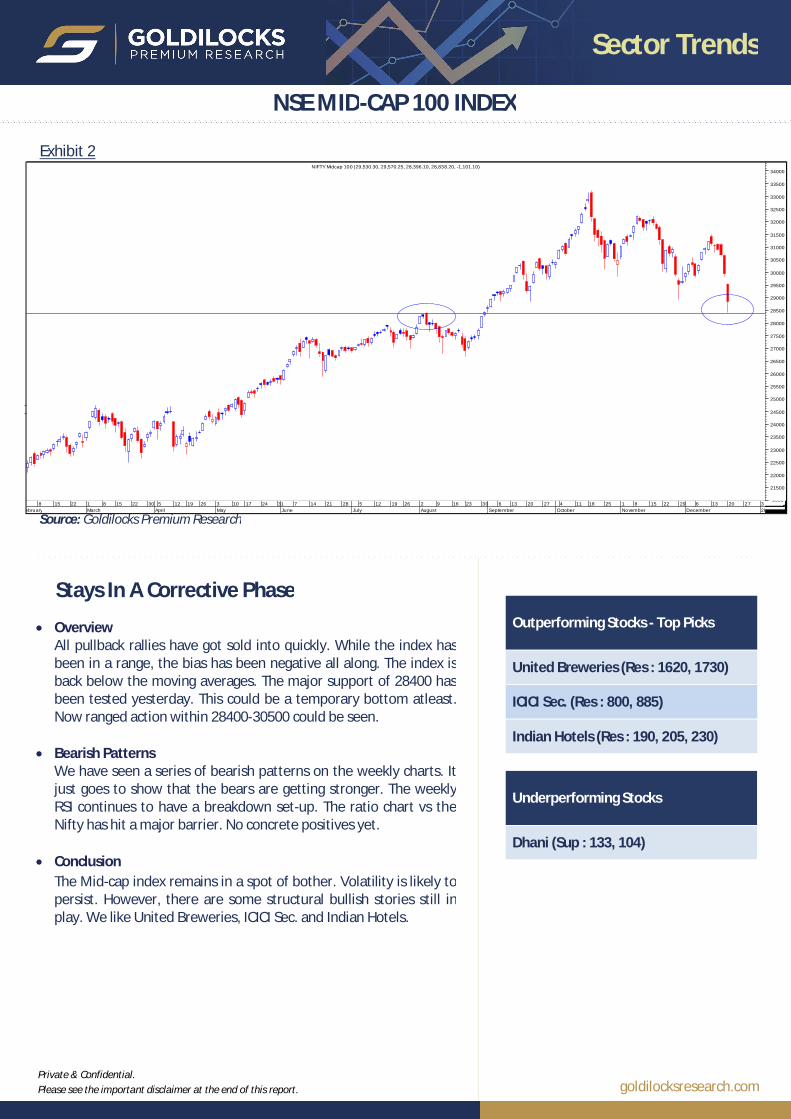
NSE MID-CAP 100 INDEX
Exhibit 2
Stays In A Corrective Phase
Overview All pullback rallies have got sold into quickly. While the index has been in a range, the bias has been negative all along. The index is back below the moving averages. The major support of 28400 has been tested yesterday. This could be a temporary bottom atleast. Now ranged action within 28400-30500 could be seen.
Bearish Patterns We have seen a series of bearish patterns on the weekly charts. It just goes to show that the bears are getting stronger. The weekly RSI continues to have a breakdown set-up. The ratio chart vs the Nifty has hit a major barrier. No concrete positives yet.
Conclusion The Mid-cap index remains in a spot of bother. Volatility is likely to persist. However, there are some structural bullish stories still in play. We like United Breweries, ICICI Sec. and Indian Hotels.
Source: Goldilocks Premium Research
goldilocksresearch.comPrivate & Confidential. Please see the important disclaimer at the end of this report.
Sector Trends
Outperforming Stocks - Top Picks
Gland Pharma (Res : 3760, 4000, 4300)
Sun Pharma (Res : 785, 820, 850)
Alkem Pharma (Res : 3500, 3650, 3890)
Underperforming Stocks
Biocon (Sup : 342, 314)
November 2017 February March April May June July August September October November 2018 February March April May June July August September November December2019 February March April May June July August September November December2020 February March April May
11500
11600
11700
11800
11900
12000
12100
12200
12300
12400
12500
12600
12700
12800
12900
13000
13100
13200
13300
13400
13500
13600
13700
13800
13900
14000
14100
14200
14300
14400
14500
14600
14700
14800
14900
15000
15100
15200
15300
15400
15500
15600
15700
15800
15900
16000
16100
16200
16300
16400
16500
16600
16700
16800
16900* S&P BSE HEALTHCARE (13,606.57, 14,172.87, 13,341.18, 14,080.49, +600.391)
Feb Mar Apr May Jun Jul Aug Sep Oct Nov Dec 2015 Feb Mar Apr May Jun Jul Aug Sep Oct Nov Dec 2016 Feb Mar Apr May Jun Jul Aug Sep Oct Nov Dec 2017 Mar Apr May Jun Jul Aug Sep Oct Nov Dec 2018 Mar Apr May Jun Jul Aug Sep Oct Nov Dec 2019 Mar Apr May Jun Jul Aug Sep Oct Nov Dec 2020 Feb
6500
7000
7500
8000
8500
9000
9500
10000
10500
11000
11500
12000
12500
13000
13500
14000
14500
25
30
35
40
45
50
55
60
65
70
75
80
85
Relative Strength Index (50.3085)
Dec 2016 Feb Mar Apr May Jun Jul Aug Sep Oct Nov Dec 2017 Feb Mar Apr May Jun Jul Aug Sep Oct Nov Dec 2018 Feb Mar Apr May Jun Jul Aug Sep Oct Nov Dec 2019 Feb Mar Apr May Jun Jul Aug Sep Oct Nov Dec 2020 Feb Mar Apr May Jun Jul
6000
6500
7000
7500
8000
8500
9000
9500
10000
10500
11000
11500
12000
12500
25
30
35
40
45
50
55
60
65
70
Relative Strength Index (62.9170)
Oct Nov Dec 2016 Feb Mar Apr May Jun Jul Aug Sep Oct Nov Dec 2017 Feb Mar Apr May Jun Jul Aug Sep Oct Nov Dec 2018 Feb Mar Apr May Jun Jul Aug Sep Oct Nov Dec 2019 Feb Mar Apr May Jun Jul Aug Sep Oct Nov Dec 2020 Feb Mar Apr
6500
7000
7500
8000
8500
9000
9500
10000
10500
11000
11500
12000
12500
13000
13500
14000
25
30
35
40
45
50
55
60
65
70
Relative Strength Index (57.3284)
16 23 30 6August
13 20 27 3 10 17September
24 1 8October
15 22 29 5 12 19November
26 3 10 17December
24 31 72019
14 21 28 4 11February
18 25 5 11March
18 25 1 8April
15 30May
13 20 27 3 10June
17 24 1July
8 15 22 29 5 13August
19 26 3 9 16September
23 30 7 14October
22 29 4 11 18November
25 2 9 16December
23 30 62020
13 20 27 3 10February
17 24 2 9March
16 23 30 7April
20 27 4May
11 18 26 1 8June
15 22 29 6July
5900
6000
6100
6200
6300
6400
6500
6600
6700
6800
6900
7000
7100
7200
7300
7400
7500
7600
7700
7800
7900
8000
8100
8200
8300
8400
8500
8600
8700
8800
8900
9000
9100
9200
9300
9400
9500
9600
9700
9800
9900
10000
10100
10200
10300
10400
10500
10600
10700
10800
10900
11000
11100
11200* CNX PHARMA (10,022.90, 10,098.85, 9,982.45, 10,002.15, +26.8506)
May June July August September November December 2019 February March April May June July August September November December 2020 February March April May June July August
59006000610062006300640065006600670068006900700071007200730074007500760077007800790080008100820083008400850086008700880089009000910092009300940095009600970098009900
100001010010200103001040010500106001070010800109001100011100
Jul Aug Sep Oct Nov Dec 2016 Mar Apr May Jun Jul Aug Sep Oct Nov Dec 2017 Mar Apr May Jun Jul Aug Sep Oct Nov Dec 2018 Mar Apr May Jun Jul Aug Sep Nov Dec 2019 Mar Apr May Jun Jul Aug Sep Oct Nov Dec 2020 Mar Apr May Jun Jul Aug Sep
6000
6500
7000
7500
8000
8500
9000
9500
10000
10500
11000
11500
12000
12500
13000
13500
14000
* CNX PHARMA (11,649.75, 11,674.55, 11,485.15, 11,500.00, -72.2500)
S O N D 2015 M A M J J A S O N D 2016 M A M J J A S O N D 2017 M A M J J A S O N D 2018 M A M J J A S O N D 2019 M A M J J A S O N D 2020 M A M J J A S O N D
6000
6500
7000
7500
8000
8500
9000
9500
10000
10500
11000
11500
12000
12500
13000
13500
14000
14500* CNX PHARMA (11,724.75, 12,015.70, 11,528.25, 11,822.90, +227.000)
May Jun Jul Aug Sep Oct Nov Dec 2016 Mar Apr May Jun Jul Aug Sep Oct Nov Dec 2017 Mar Apr May Jun Jul Aug Sep Oct Nov Dec 2018 Mar Apr May Jun Jul Aug Sep Nov Dec 2019 Mar Apr May Jun Jul Aug Sep Nov Dec 2020 Mar Apr May Jul Aug Sep Oct Nov
6000
6500
7000
7500
8000
8500
9000
9500
10000
10500
11000
11500
12000
12500
13000
13500
14000
Nifty Pharma Index (11,795.25, 11,804.95, 11,754.15, 11,772.45, +46.0000)
J A S O N D 2015 M A M J J A S O N D 2016 M A M J J A S O N D 2017 M A M J J A S O N D 2018 M A M J J A S O N D 2019 M A M J J A S O N D 2020 M A M J J A S O N D 2021 M
6000
6500
7000
7500
8000
8500
9000
9500
10000
10500
11000
11500
12000
12500
13000
13500
14000
14500Nifty Pharma Index (12,752.00, 12,869.70, 11,949.60, 12,753.25, -9.09961)
2014 M A M J J A S O N D 2015 M A M J J A S O N D 2016 M A M J J A S O N D 2017 M A M J J A S O N D 2018 M A M J J A S O N D 2019 M A M J J A S O N D 2020 M A M J J A S O N D 2021 M A
6000
6500
7000
7500
8000
8500
9000
9500
10000
10500
11000
11500
12000
12500
13000
13500
14000
14500Nifty Pharma Index (13,000.80, 13,013.45, 12,592.80, 12,866.05, -148.200)
11 18November
25 2 9 16December
23 30 62020
13 20 27 3 10February
17 24 2 9March
16 23 30 7April
20 27 4May
11 18 26 1 8June
15 22 29 6July
13 20 27 3 10August
17 24 31 7 14September
21 28 5 12October
19 26 2 9 17November
23 1 7 14December
21 28 4 112021
18 25 1 8February
15 22 1 8March
6000
6500
7000
7500
8000
8500
9000
9500
10000
10500
11000
11500
12000
12500
13000
13500
14000Nifty Pharma Index (12,499.90, 12,545.70, 12,236.15, 12,347.40, -170.100)
M A M J J A S O N D 2015 M A M J J A S O N D 2016 M A M J J A S O N D 2017 M A M J J A S O N D 2018 M A M J J A S O N D 2019 M A M J J A S O N D 2020 M A M J J A S O N D 2021 M A M
6000
6500
7000
7500
8000
8500
9000
9500
10000
10500
11000
11500
12000
12500
13000
13500
14000
14500Nifty Pharma Index (12,213.75, 12,215.15, 11,466.95, 11,514.45, -669.800)
S O N D 2015 M A M J J A S O N D 2016 M A M J J A S O N D 2017 M A M J J A S O N D 2018 M A M J J A S O N D 2019 M A M J J A S O N D 2020 M A M J J A S O N D 2021 M A M J J
6000
6500
7000
7500
8000
8500
9000
9500
10000
10500
11000
11500
12000
12500
13000
13500
14000
14500Nifty Pharma Index (13,233.20, 13,633.40, 12,999.80, 13,319.75, +85.5000)
S O N D 2015 M A M J J A S O N D 2016 M A M J J A S O N D 2017 M A M J J A S O N D 2018 M A M J J A S O N D 2019 M A M J J A S O N D 2020 M A M J J A S O N D 2021 M A M J J A
6000
6500
7000
7500
8000
8500
9000
9500
10000
10500
11000
11500
12000
12500
13000
13500
14000
14500
15000
S O N D 2015 M A M J J A S O N D 2016 M A M J J A S O N D 2017 M A M J J A S O N D 2018 M A M J J A S O N D 2019 M A M J J A S O N D 2020 M A M J J A S O N D 2021 M A M J J5500
6000
6500
7000
7500
8000
8500
9000
9500
10000
10500
11000
11500
12000
12500
13000
13500
14000
14500
15000
Nifty Pharma Index (14,260.45, 14,390.50, 14,243.85, 14,360.20, +90.9004)
September November 2021 February March April May June July August
11000
11500
12000
12500
13000
13500
14000
14500
30354045505560657075Relative Strength Index (39.4805)
December 2021 February March April May June July August September October
10500
11000
11500
12000
12500
13000
13500
14000
14500
15000Nifty Pharma Index (14,402.80, 14,457.70, 14,247.50, 14,289.15, -91.3496)
15 22 29 6July
13 20 27 3 10August
17 24 31 7 14September
21 28 12October
19 26 2 9 17November
23 1 7 14December
21 4 112021
18 25 8 15February
22 1 8March
15 22 30April
12 26 3May
10 24 31 7June
14 21 28 5July
12 19 2 9August
16 30 6 20September
27 4 11October
18 25 1 8November
8000
8500
9000
9500
10000
10500
11000
11500
12000
12500
13000
13500
14000
14500
15000
15500Nifty Pharma Index (14,004.25, 14,036.60, 13,930.35, 13,947.85, +4.00000)
2020 February March April May June July August September October November December 2021 February March April May June July August September October November
5500
6000
6500
7000
7500
8000
8500
9000
9500
10000
10500
11000
11500
12000
12500
13000
13500
14000
14500
15000
15500Nifty Pharma Index (13,790.45, 13,996.85, 13,770.90, 13,974.35, +199.699)
November December 2020 February March April May June July August September October November December 2021 February March April May June July August September October November December 2022
5500
6000
6500
7000
7500
8000
8500
9000
9500
10000
10500
11000
11500
12000
12500
13000
13500
14000
14500
15000
15500Nifty Pharma Index (13,177.15, 13,259.05, 13,005.20, 13,184.45, -46.2500)
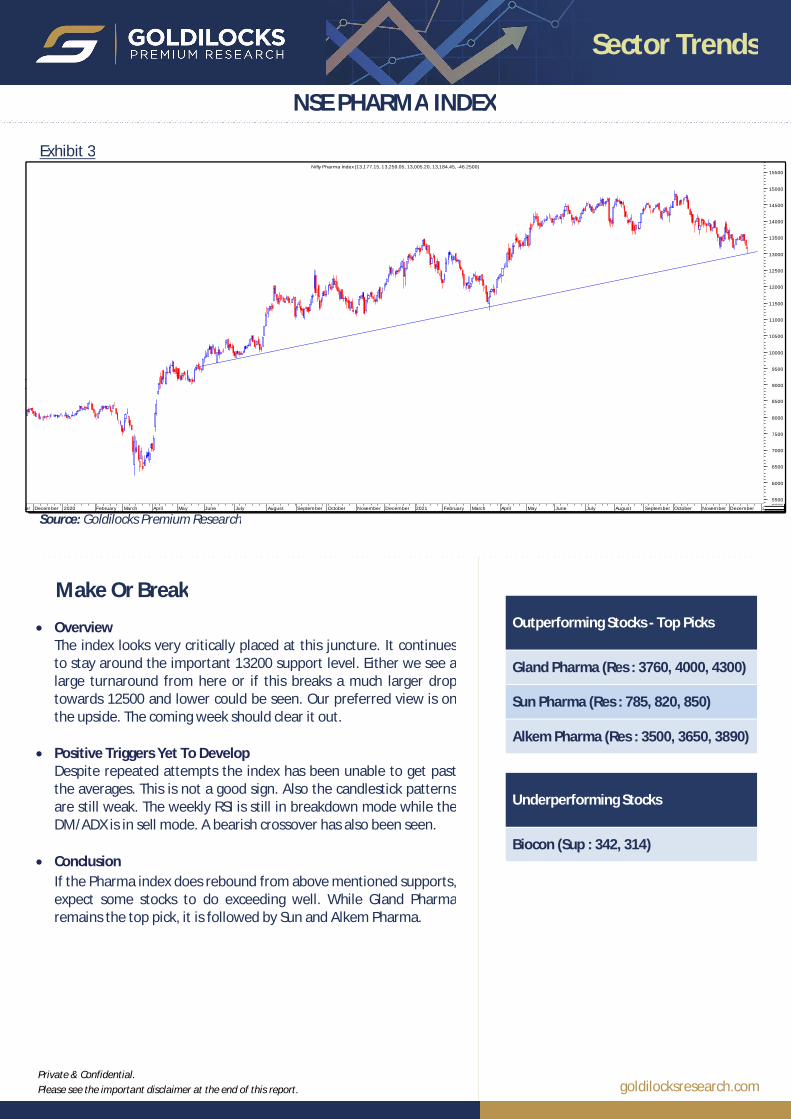
NSE PHARMA INDEX
Exhibit 3
Make Or Break
Overview The index looks very critically placed at this juncture. It continues to stay around the important 13200 support level. Either we see a large turnaround from here or if this breaks a much larger drop towards 12500 and lower could be seen. Our preferred view is on the upside. The coming week should clear it out.
Positive Triggers Yet To Develop Despite repeated attempts the index has been unable to get past the averages. This is not a good sign. Also the candlestick patterns are still weak. The weekly RSI is still in breakdown mode while the DM/ADX is in sell mode. A bearish crossover has also been seen.
Conclusion If the Pharma index does rebound from above mentioned supports, expect some stocks to do exceeding well. While Gland Pharma remains the top pick, it is followed by Sun and Alkem Pharma.
Source: Goldilocks Premium Research
goldilocksresearch.comPrivate & Confidential. Please see the important disclaimer at the end of this report.
Sector Trends
Outperforming Stocks - Top Picks
APL Apollo (Res : 1140, 1200)
JSW Steel (Res : 694, 770)
Underperforming Stocks
Coal India (Sup : 136, 125)
NMDC (Sup : 125, 112)
Oct Nov Dec 2014 Feb Mar Apr May Jun Jul Aug Sep Oct Nov Dec 2015 Feb Mar Apr May Jun Jul Aug Sep Oct Nov Dec 2016 Feb Mar Apr May Jun Jul Aug Sep Oct Nov Dec 2017 Mar Apr May Jun Jul Aug Sep Oct Nov Dec 2018 Mar Apr May Jun Jul Aug Sep Oct Nov Dec 2019 Mar Apr May Jun Jul Aug Sep Oct Nov Dec 2020 Feb
4200430044004500460047004800490050005100520053005400550056005700580059006000610062006300640065006600670068006900700071007200730074007500760077007800790080008100820083008400850086008700880089009000910092009300940095009600970098009900
10000101001020010300104001050010600107001080010900110001110011200113001140011500116001170011800119001200012100122001230012400125001260012700
* CNX AUTO (7,853.75, 8,090.75, 7,773.60, 8,069.70, +263.100)
Mar Apr May Jun Jul Aug Sep Oct Nov Dec 2016 Feb Mar Apr May Jun Jul Aug Sep Oct Nov Dec 2017 Feb Mar Apr May Jun Jul Aug Sep Oct Nov Dec 2018 Feb Mar Apr May Jun Jul Aug Sep Oct Nov Dec 2019 Feb Mar Apr May Jun Jul Aug Sep Oct Nov Dec 2020 Feb Mar Apr
6500
7000
7500
8000
8500
9000
9500
10000
10500
11000
11500
12000
12500
20
25
30
35
40
45
50
55
60
65
70
75
80Relative Strength Index (60.9760)
Sep Oct Nov Dec 2014 Feb Mar Apr May Jun Ju l Aug Sep Oct Nov Dec 2015 Feb Mar Apr May Jun Jul Aug Sep Oct Nov Dec 2016 Feb Mar Apr May Jun Jul Aug Sep Oct Nov Dec 2017 Mar Apr May Jun Jul Aug Sep Oct Nov Dec 2018 Mar Apr May Jun Jul Aug Sep Oct Nov Dec 2019 Mar Apr May Jun Jul Aug Sep Oct Nov Dec 2020 Mar Apr May8500
9000
9500
10000
10500
11000
11500
12000
12500
13000
13500
14000
14500
15000
15500
16000
16500
17000
17500
18000
18500
19000
19500
20000
20500
21000
21500
22000
22500
23000
23500
24000
24500
25000
25500
26000
26500
27000
27500
28000
28500* S&P BSE AUTO INDEX (15,735.25, 15,895.16, 15,283.88, 15,643.93, +75.4297)
2014 Feb Mar Apr May Jun Jul Aug Sep Oct Nov Dec 2015 Feb Mar Apr May Jun Jul Aug Sep Oct Nov Dec 2016 Feb Mar Apr May Jun Jul Aug Sep Oct Nov Dec 2017 Mar Apr May Jun Jul Aug Sep Oct Nov Dec 2018 Mar Apr May Jun Jul Aug Sep Oct Nov Dec 2019 Mar Apr May Jun Jul Aug Sep Oct Nov Dec 2020 Mar Apr May Jun Jul
3500
4000
4500
5000
5500
6000
6500
7000
7500
8000
8500
9000
9500
10000
10500
11000
11500
12000
12500
15
20
25
30
35
40
45
50
55
60
65
70
75
80
85Relative Strength Index (40.4019)
Jun Jul Aug Sep Oct Nov Dec 2016 Feb Mar Apr May Jun Jul Aug Sep Oct Nov Dec 2017 Feb Mar Apr May Jun Jul Aug Sep Oct Nov Dec 2018 Feb Mar Apr May Jun Jul Aug Sep Oct Nov Dec 2019 Feb Mar Apr May Jun Jul Aug Sep Oct Nov Dec 2020 Feb Mar Apr May Jun Jul Aug Sep1200
1300
1400
1500
1600
1700
1800
1900
2000
2100
2200
2300
2400
2500
2600
2700
2800
2900
3000
3100
3200
3300
3400
3500
3600
3700
3800
3900
4000
4100
4200
4300
4400
4500
15
20
25
30
35
40
45
50
55
60
65
70
75
80
Relative Strength Index (47.6782)
2009 2010 2011 2012 2013 2014 2015 2016 2017 2018 2019 2020
10001100120013001400150016001700180019002000210022002300240025002600270028002900300031003200330034003500360037003800390040004100420043004400450046004700480049005000510052005300
0.150.200.250.300.350.400.450.500.550.600.650.700.750.800.850.900.95Relative Strength Comparative(* CNX NIFTY) (0.18648, -0.00642)
4 11November
18 25 2 9December
16 23 30 62020
13 20 27 3 10February
17 24 2March
9 16 23 30 7April
13 20 27 4May
11 18 26 1June
8 15 22 29July
6 13 20 27 3August
10 17 24 31 7September
1350
1400
1450
1500
1550
1600
1650
1700
1750
1800
1850
1900
1950
2000
2050
2100
2150
2200
2250
2300
2350
2400
2450
2500
2550
2600
2650
2700
2750
2800
2850
2900
2950
3000
3050* CNX METAL (2,541.85, 2,542.45, 2,493.40, 2,507.50, -18.6001)
11November
18 25 2 9December
16 23 30 62020
13 20 27 3 10February
17 24 2March
9 16 23 30 7April
13 20 27 4May
11 18 26 1June
8 15 22 29 6July
13 20 27 3 10August
17 24 31 7September
14 21 28 5October
12
1400145015001550160016501700175018001850190019502000205021002150220022502300235024002450250025502600265027002750280028502900295030003050
15202530354045505560657075808590Relative Strength Index (44.8972)
Mar Apr May Jun Jul Aug Sep Oct Nov Dec 2018 Mar Apr May Jun Jul Aug Sep Oct Nov Dec 2019 Mar Apr May Jun Jul Aug Sep Oct Nov Dec 2020 Feb Mar Apr May Jun Jul Aug Sep Oct Nov Dec 2021 Feb
125013001350140014501500155016001650170017501800185019001950200020502100215022002250230023502400245025002550260026502700275028002850290029503000305031003150320032503300335034003450350035503600365037003750380038503900395040004050410041504200425043004350440044504500Nifty Metal Index (2,708.15, 2,712.00, 2,679.70, 2,694.15, +13.1499)
Mar Apr May Jun Jul Aug Sep Oct Nov Dec 2018 Mar Apr May Jun Jul Aug Sep Oct Nov Dec 2019 Mar Apr May Jun Jul Aug Sep Oct Nov Dec 2020 Feb Mar Apr May Jun Jul Aug Sep Oct Nov Dec 2021 Feb Mar
13001400150016001700180019002000210022002300240025002600270028002900300031003200330034003500360037003800390040004100420043004400
20
25
30
35
40
45
50
5560
65
70
75Relative Strength Index (71.4321)
Nov Dec 2016 Mar Apr May Jun Jul Aug Sep Oct Nov Dec 2017 Mar Apr May Jun Jul Aug Sep Oct Nov Dec 2018 Mar Apr May Jun Jul Aug Sep Nov Dec 2019 Mar Apr May Jun Jul Aug Sep Nov Dec 2020 Mar Apr May Jun Jul Aug Sep Nov Dec 2021 Mar Apr1200125013001350140014501500155016001650170017501800185019001950200020502100215022002250230023502400245025002550260026502700275028002850290029503000305031003150320032503300335034003450350035503600365037003750380038503900395040004050410041504200425043004350440044504500
Sep Oct Nov Dec 2018 Feb Mar Apr May Jun Jul Aug Sep Oct Nov Dec 2019 Feb Mar Apr May Jun Jul Aug Sep Oct Nov Dec 2020 Feb Mar Apr May Jun Jul Aug Sep Oct Nov Dec 2021 Feb Mar Apr May
125013001350140014501500155016001650170017501800185019001950200020502100215022002250230023502400245025002550260026502700275028002850290029503000305031003150320032503300335034003450350035503600365037003750380038503900395040004050410041504200425043004350440044504500
0.0%
100.0%
161.8%
Nifty Metal Index (3,508.25, 3,644.80, 3,463.15, 3,552.10, +65.8501)
2018 Feb Mar Apr May Jun Jul Aug Sep Oct Nov Dec 2019 Feb Mar Apr May Jun Jul Aug Sep Oct Nov Dec 2020 Feb Mar Apr May Jun Jul Aug Sep Oct Nov Dec 2021 Feb Mar Apr
125013001350140014501500155016001650170017501800185019001950200020502100215022002250230023502400245025002550260026502700275028002850290029503000305031003150320032503300335034003450350035503600365037003750380038503900395040004050410041504200425043004350440044504500Nifty Metal Index (3,795.65, 3,837.65, 3,722.60, 3,754.35, +1.65015)
J A S O N D 2015 M A M J J A S O N D 2016 M A M J J A S O N D 2017 M A M J J A S O N D 2018 M A M J J A S O N D 2019 M A M J J A S O N D 2020 M A M J J A S O N D 2021 M A M J J1200130014001500160017001800190020002100220023002400250026002700280029003000310032003300340035003600370038003900400041004200430044004500460047004800
15
20
25
30
35
40
45
50
55
60
65
70
75
80
85Relative Strength Index (79.7273)
October November December 2020 February March April May June July August September October November December 2021 February March April May
1500
2000
2500
3000
3500
4000
4500
5000
5500
0.0%
100.0%
161.8%
261.8%
15
20
25
30
35
40
45
50
55
60
65
70
75
80
85
90Relative Strength Index (65.2211)
Aug Sep Oct Nov Dec 2018 Feb Mar Apr May Jun Jul Aug Sep Oct Nov Dec 2019 Feb Mar Apr May Jun Jul Aug Sep Oct Nov Dec 2020 Feb Mar Apr May Jun Jul Aug Sep Oct Nov Dec 2021 Feb Mar Apr May Jun Jul
1500
2000
2500
3000
3500
4000
4500
5000
5500
0.170.180.190.200.210.220.230.240.250.260.270.280.290.300.310.320.330.340.350.360.370.380.390.40
Relative Strength Comparative(.NSEI) (0.33612, +0.00737)
September November 2021 February March April May June July August
2000
2500
3000
3500
4000
4500
5000
5500
6000Nifty Metal Index (5,742.00, 5,832.70, 5,669.90, 5,799.30, +30.0498)
Mar Apr May Jun Jul Aug Sep Oct Nov Dec 2021 Feb Mar Apr May Jun Jul Aug Sep Oct
1500
2000
2500
3000
3500
4000
4500
5000
5500
6000Nifty Metal Index (5,621.95, 5,627.30, 5,449.70, 5,498.20, -117.850)
14 21 28 5 12October
19 26 2 9November
17 23 1 7 14December
21 28 42021
11 18 25 1 8February
15 22 1 8March
15 22 30April
12 19 26 3May
10 17 24 31 7June
14 21 28 5July
12 19 26 2 9August
16 23 30 6 13September
20 27 4 11October
18 25 1 8November
2000
2500
3000
3500
4000
4500
5000
5500
6000
6500
202530354045505560657075808590
Relative Strength Index (49.5012)
June July August September October November December 2021 February March April May June July August September October November
1500
2000
2500
3000
3500
4000
4500
5000
5500
6000
6500
20
25
30
35
40
45
50
55
60
65
70
75
80
85
90Relative Strength Index (45.5349)
21 28 42021
11 18 25 1 8February
15 22 1 8March
15 22 30 5April
12 19 26 3May
10 17 24 31 7June
14 21 28 5July
12 19 26 2 9August
16 23 30 6 13September
20 27 4 11October
18 25 1 8November
15 22 29 6 13December
20 27 32022
2100220023002400250026002700280029003000310032003300340035003600370038003900400041004200430044004500460047004800490050005100520053005400550056005700580059006000610062006300640065006600
Nifty Metal Index (5,400.10, 5,409.20, 5,195.35, 5,269.60, -207.200)
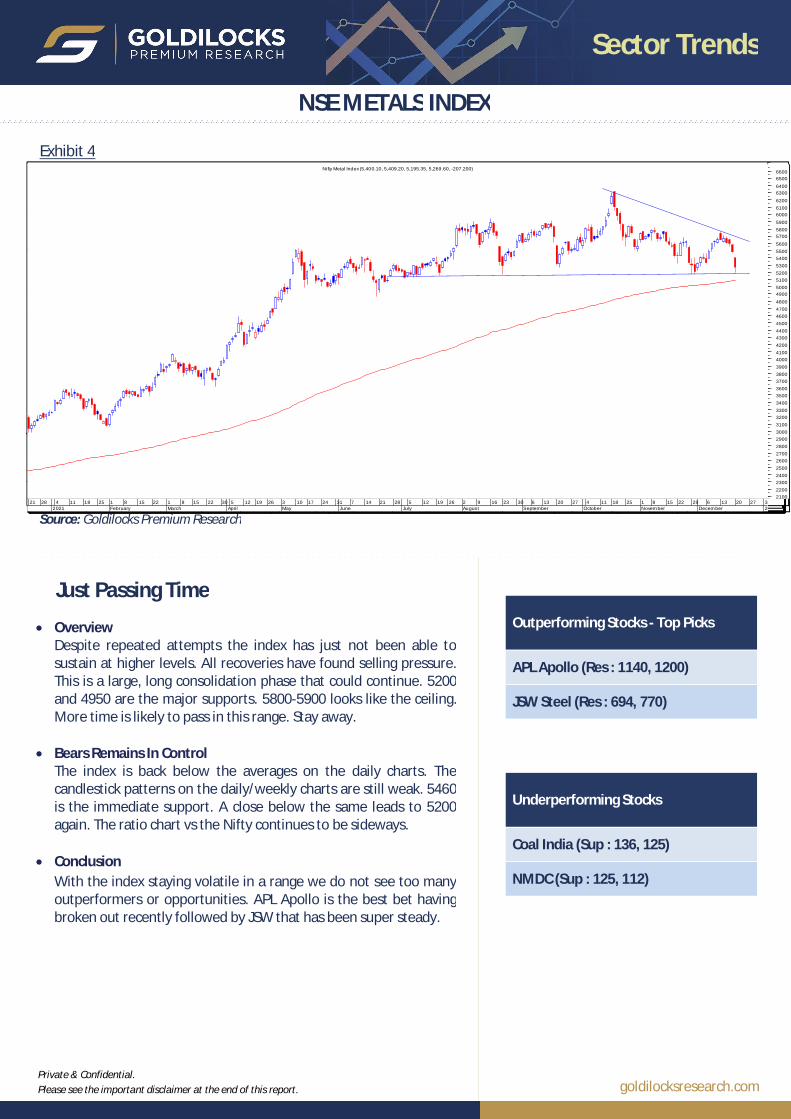
NSE METALS INDEX
Exhibit 4
Just Passing Time
Overview Despite repeated attempts the index has just not been able to sustain at higher levels. All recoveries have found selling pressure. This is a large, long consolidation phase that could continue. 5200 and 4950 are the major supports. 5800-5900 looks like the ceiling. More time is likely to pass in this range. Stay away.
Bears Remains In Control
The index is back below the averages on the daily charts. The candlestick patterns on the daily/weekly charts are still weak. 5460 is the immediate support. A close below the same leads to 5200 again. The ratio chart vs the Nifty continues to be sideways.
Conclusion With the index staying volatile in a range we do not see too many outperformers or opportunities. APL Apollo is the best bet having broken out recently followed by JSW that has been super steady.
Source: Goldilocks Premium Research
goldilocksresearch.comPrivate & Confidential. Please see the important disclaimer at the end of this report.
Sector Trends
Outperforming Stocks - Top Picks
Brigade (Res : 466, 510)
Oberoi Realty (Res : 833, 870, 950)
DLF (Res : 385, 420, 450)
Underperforming Stocks
Hemisphere Prop. (Sup : 122, 103)
December 2019 February March April May June July August September October November December 2020 February March April May June July August September October November December 2021
9000
9500
10000
1050011000
11500
12000
1250013000
13500
1400014500
15000
15500
16000
16500
17000
17500
18000
18500
1900019500
20000
20500
21000
1.10
1.15
1.20
1.25
1.30
1.35
1.40
1.45
1.50
1.55
1.601.65
1.70
Relative Strength Comparative(.NSEI) (1.35273, +0.00432)
2017 2018 Feb Mar Apr May Jun Jul Aug Sep Oct Nov Dec 2019 Feb Mar Apr May Jun Jul Aug Sep Oct Nov Dec 2020 Feb Mar Apr May Jun Jul Aug Sep Oct Nov Dec 2021 Feb Mar Apr
270280290300310320330340350360370380390400410420430440450460470480490500510520530540550560570580590600610620630640650660670680690700710720730740750760
HDFC Life Insurance Company Ord Shs (703.000, 709.300, 689.000, 698.550, -6.29999)
Apr May Jun Jul Aug Sep Oct Nov Dec 2017 Mar Apr May Jun Jul Aug Sep Oct Nov Dec 2018 Mar Apr May Jun Jul Aug Sep Oct Nov Dec 2019 Mar Apr May Jun Jul Aug Sep Oct Nov Dec 2020 Mar Apr May Jun Jul Aug Sep Oct Nov Dec 2021 Mar Apr May
7500
8000
8500
9000
9500
10000
10500
11000
11500
12000
12500
13000
13500
14000
14500
15000
15500
16000
16500
17000
17500
18000
18500
19000
19500
20000
Sep Oct Nov Dec 2017 Mar Apr May Jun Jul Aug Sep Oct Nov Dec 2018 Mar Apr May Jun Jul Aug Sep Oct Nov Dec 2019 Mar Apr May Jun Jul Aug Sep Oct Nov Dec 2020 Feb Mar Apr May Jun Jul Aug Sep Oct Nov Dec 2021 Feb Mar Apr May Jun
17501800185019001950200020502100215022002250230023502400245025002550260026502700275028002850290029503000305031003150320032503300335034003450350035503600365037003750380038503900395040004050410041504200425043004350440044504500455046004650Nifty PSE Index (3,310.70, 3,325.50, 3,130.70, 3,155.25, -141.100)
Oct Nov Dec 2018 Feb Mar Apr May Jun Jul Aug Sep Oct Nov Dec 2019 Feb Mar Apr May Jun Jul Aug Sep Oct Nov Dec 2020 Feb Mar Apr May Jun Jul Aug Sep Oct Nov Dec 2021 Feb Mar Apr May
3000
3500
4000
4500
5000
5500
6000
6500
7000
7500
8000
8500
9000
9500
10000
NIFTY Smallcap 100 (8,221.75, 8,308.65, 8,202.90, 8,250.55, +34.5498)
N D 2015 M A M J J A S O N D 2016 M A M J J A S O N D 2017 M A M J J A S O N D 2018 M A M J J A S O N D 2019 M A M J J A S O N D 2020 M A M J J A S O N D 2021 M A M J J A850090009500
10000105001100011500120001250013000135001400014500150001550016000165001700017500180001850019000195002000020500210002150022000225002300023500
10
15
20
25
30
35
40
45
50
55
60
65
70
75
80
85Relative Strength Index (64.1101)
N D 2016 M A M J J A S O N D 2017 M A M J J A S O N D 2018 M A M J J A S O N D 2019 M A M J J A S O N D 2020 M A M J J A S O N D 2021 M A M J J A S
105110115120125130135140145150155160165170175180185190195200205210215220225230235240245250255260265270275280285290295300305310315320325330335340345350355360365370375380385390395Nifty Realty Index (347.300, 367.450, 346.400, 366.150, +21.5500)
2014 2015 2016 2017 2018 2019 2020 2021
150
200
250
300
350
400
Nifty Realty Index (405.450, 407.800, 376.450, 394.550, -8.90002)
2010 2012 2013 2014 2015 2016 2017 2018 2019 2020 2021100
150
200
250
300
350
400
450
500
550Nifty Realty Index (408.400, 510.050, 403.350, 501.300, +87.7500)
N D 2014 M A M J J A S O N D 2015 M A M J J A S O N D 2016 M A M J J A S O N D 2017 A M J J A S O N D 2018 A M J J A S O N D 2019 A M J J A S O N D 2020 M A M J J A S O N D 2021 M A M J J A S O N D 2022
800900
1000110012001300140015001600170018001900200021002200230024002500260027002800290030003100320033003400350036003700380039004000410042004300440045004600
2025303540455055606570758085
Relative Strength Index (72.3775)
November December 2020 February March April May June July August September October November December 2021 February March April May June July August September October November
150
200
250
300
350
400
450
500
550
10
15
20
25
30
35
40
45
50
55
60
65
70
75
80
85Relative Strength Index (59.8965)
Nov Dec 2018 Mar Apr May Jun Jul Aug Sep Oct Nov Dec 2019 Mar Apr May Jun Jul Aug Sep Oct Nov Dec 2020 Feb Mar Apr May Jun Jul Aug Sep Oct Nov Dec 2021 Feb Mar Apr May Jun Jul Aug Sep Oct Nov Dec 2022 Mar
150
200
250
300
350
400
450
500
550
15
20
25
30
35
40
45
50
55
60
65
70
75
80
85Relative Strength Index (49.4613)
NSE REALTY INDEX
Exhibit 5
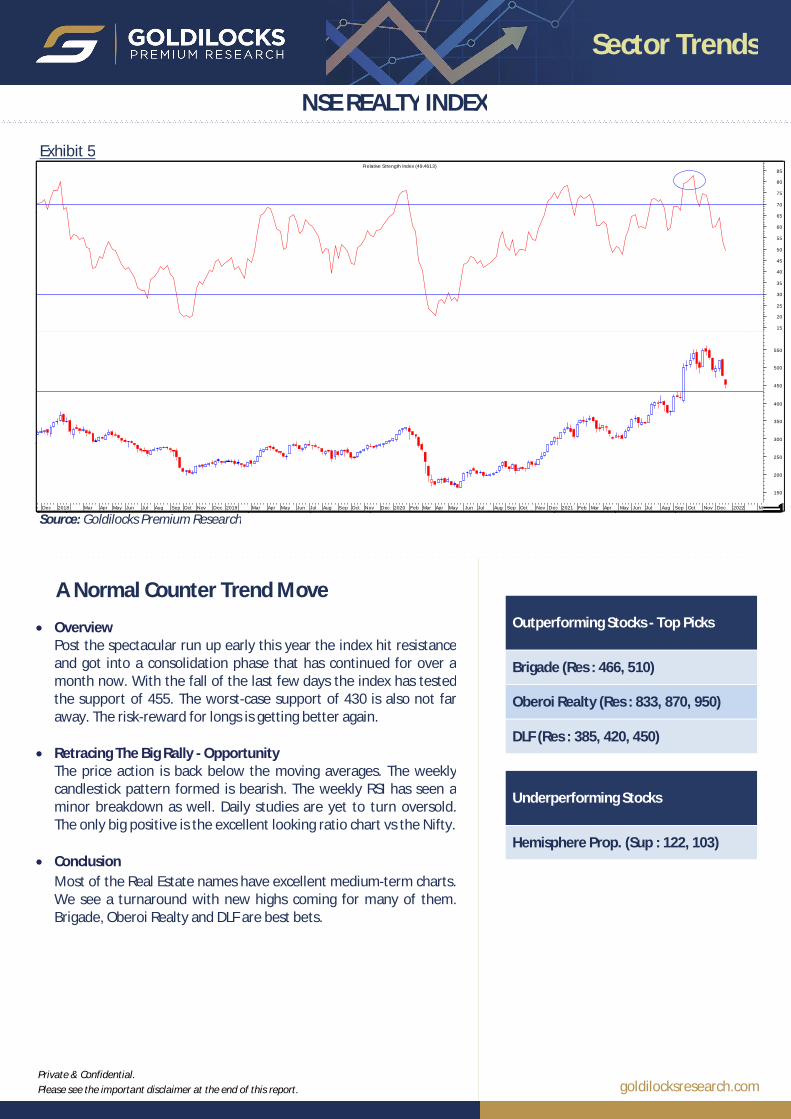
A Normal Counter Trend Move
Overview Post the spectacular run up early this year the index hit resistance and got into a consolidation phase that has continued for over a month now. With the fall of the last few days the index has tested the support of 455. The worst-case support of 430 is also not far away. The risk-reward for longs is getting better again.
Retracing The Big Rally - Opportunity The price action is back below the moving averages. The weekly candlestick pattern formed is bearish. The weekly RSI has seen a minor breakdown as well. Daily studies are yet to turn oversold. The only big positive is the excellent looking ratio chart vs the Nifty.
Conclusion Most of the Real Estate names have excellent medium-term charts. We see a turnaround with new highs coming for many of them. Brigade, Oberoi Realty and DLF are best bets.
Source: Goldilocks Premium Research
goldilocksresearch.comPrivate & Confidential. Please see the important disclaimer at the end of this report.
Sector Trends
Outperforming Stocks - Top Picks
Wipro (Res : 700, 740, 800)
Infosys (Res : 1890, 2000, 2220)
HCL Tech. (Res : 1214, 1334, 1400)
Underperforming Stocks
OFSS (Sup : 3900, 3810, 3605)
M J J A S O N D 2012 A M J J A S O N D 2013 A M J J A S O N D 2014 A M J J A S O N D 2015 A M J J A S O N D 2016 A M J J A S O N D 2017 A M J J A S O N D 2018 A M J J A S O N D 2019 A M J J A S O N D 2020 A M J J A S O N D 2021
400050006000700080009000
10000110001200013000140001500016000170001800019000200002100022000230002400025000
0.95
1.00
1.05
1.10
1.15
1.20
1.25
1.30
1.35
1.40
1.45
1.50
1.55
1.60
1.65
1.70
1.75
1.80
1.85Relative Strength Comparative(.NSEI) (1.77690, +0.08680)
22 29 4 11 18November
25 2 9 16December
23 30 62020
13 20 27 3 10February
17 24 2 9March
16 23 30 7April
20 27 4May
11 18 26 1 8June
15 22 29 6July
13 20 27 3 10August
17 24 31 7 14September
21 28 5 12October
19 26 2 9 17November
23 1 7 14December
21 28 4 112021
18 25 1February
10000
11000
12000
13000
14000
15000
16000
17000
18000
19000
20000
21000
22000
23000
24000
25000
26000
27000
28000
10
15
20
25
30
35
40
45
50
55
60
65
70
75
80
85
90Relative Strength Index (63.4381)
26 1June
8 15 22 29July
6 13 20 27 3August
10 17 24 31 7September
14 21 28 5October
12 19 26 2 9November
17 23 1 7December
14 21 28 42021
11 18 25 1 8February
15 22 1March
8
1250013000135001400014500150001550016000165001700017500180001850019000195002000020500210002150022000225002300023500240002450025000255002600026500270002750028000
40
45
50
55
60
65
70
75
80
85Relative Strength Index (49.3613)
7April
13 20 27 4May
11 18 26 1June
8 15 22 29 6July
13 20 27 3 10August
17 24 31 7 14September
21 28 5 12October
19 26 2 9November
17 23 1 7December
14 21 28 42021
11 18 25 1 8February
15 22 1 8March
15 22 29April
11000
11500
12000
12500
13000
13500
14000
14500
15000
15500
16000
16500
17000
17500
18000
18500
19000
19500
20000
20500
21000
21500
22000
22500
23000
23500
24000
24500
25000
25500
26000
26500
27000
27500
28000
28500Nifty IT Index (26,365.90, 26,395.95, 25,012.50, 25,373.35, -810.150)
D 2016 M A M J J A S O N D 2017 M A M J J A S O N D 2018 M A M J J A S O N D 2019 M A M J J A S O N D 2020 M A M J J A S O N D 2021 M A M J J8000
9000
10000
11000
12000
13000
14000
15000
16000
17000
18000
19000
20000
21000
22000
23000
24000
25000
26000
27000
28000
20
25
30
35
40
45
50
55
60
65
70
75
80
85
90Relative Strength Index (58.1309)
May June July August September October Novem ber December 2020 February March April May June July August September October November December 2021 February March April May9500
10000
10500
11000
11500
12000
12500
13000
13500
14000
14500
15000
15500
16000
16500
17000
17500
18000
18500
19000
19500
20000
20500
21000
21500
22000
22500
23000
23500
24000
24500
25000
25500
26000
26500
27000
27500
28000
28500
29000Nifty IT Index (25,650.45, 25,770.50, 25,499.45, 25,703.55, +115.352)
A S O N D 2012 A M J J A S O N D 2013 A M J J A S O N D 2014 A M J J A S O N D 2015 A M J J A S O N D 2016 A M J J A S O N D 2017 A M J J A S O N D 2018 A M J J A S O N D 2019 A M J J A S O N D 2020 A M J J A S O N D 2021 A M J J A S
400050006000700080009000
10000110001200013000140001500016000170001800019000200002100022000230002400025000260002700028000290003000031000
0.95
1.00
1.05
1.10
1.15
1.20
1.25
1.30
1.35
1.40
1.45
1.50
1.55
1.60
1.65
1.70
1.75
1.80
1.85
Relative Strength Comparative(.NSEI) (1.82680, -0.01823)
O N D 2019 M A M J J A S O N D 2020 M A M J J A S O N D 2021 M A M J J A S O
10000
15000
20000
25000
30000
Nifty IT Index (31,523.50, 32,821.90, 31,324.75, 32,678.80, +1,375.50)
February March April May June July August September October
25000
30000
35000
3540455055606570758085Relative Strength Index (76.5984)
31 7 14September
21 28 5 12October
19 26 2 9November
17 23 1 7 14December
21 28 42021
11 18 25 1 8February
15 22 1 8March
15 22 30April
12 19 26 3May
10 17 24 31 7June
14 21 28 5July
12 19 26 2 9August
16 23 30 6 13September
20 27 4 11October
18 25 1 8November
17000
18000
19000
20000
21000
22000
23000
24000
2500026000
2700028000
2900030000
31000
3200033000
3400035000
36000
37000
38000
39000
35
40
45
50
55
60
65
70
75
80
85
90Relative Strength Index (47.9579)
202111 18 25 1 8
February15 22 1
March8 15 22 30 5
April12 19 26 3
May10 17 24 31
June7 14 21 28 5
July12 19 26 2 9
August16 23 30 6 13
September20 27 4
October11 18 25 1 8
November15 22 29
23000
23500
24000
24500
25000
25500
26000
26500
27000
27500
28000
28500
29000
29500
30000
30500
31000
31500
32000
32500
33000
33500
34000
34500
35000
35500
36000
36500
37000
37500
38000
38500
39000Nifty IT Index (36,391.10, 36,646.25, 36,302.95, 36,465.30, +133.000)
9November
17 23 1 7 14December
21 28 42021
11 18 25 1 8February
15 22 1 8March
15 22 30April
12 19 26 3May
10 17 24 31 7June
14 21 28 5July
12 19 26 2 9August
16 23 30 6 13September
20 27 4 11October
18 25 1 8 15November
22 29 6 13December
20 27 32022
19500
20000
20500
21000
21500
22000
22500
23000
23500
24000
24500
25000
25500
26000
26500
27000
27500
28000
28500
29000
29500
30000
30500
31000
31500
32000
32500
33000
33500
34000
34500
35000
35500
36000
36500
37000
37500
38000
38500
39000Nifty IT Index (36,411.85, 36,598.35, 35,559.30, 35,916.45, -731.449)
NSE IT INDEX
Exhibit 6
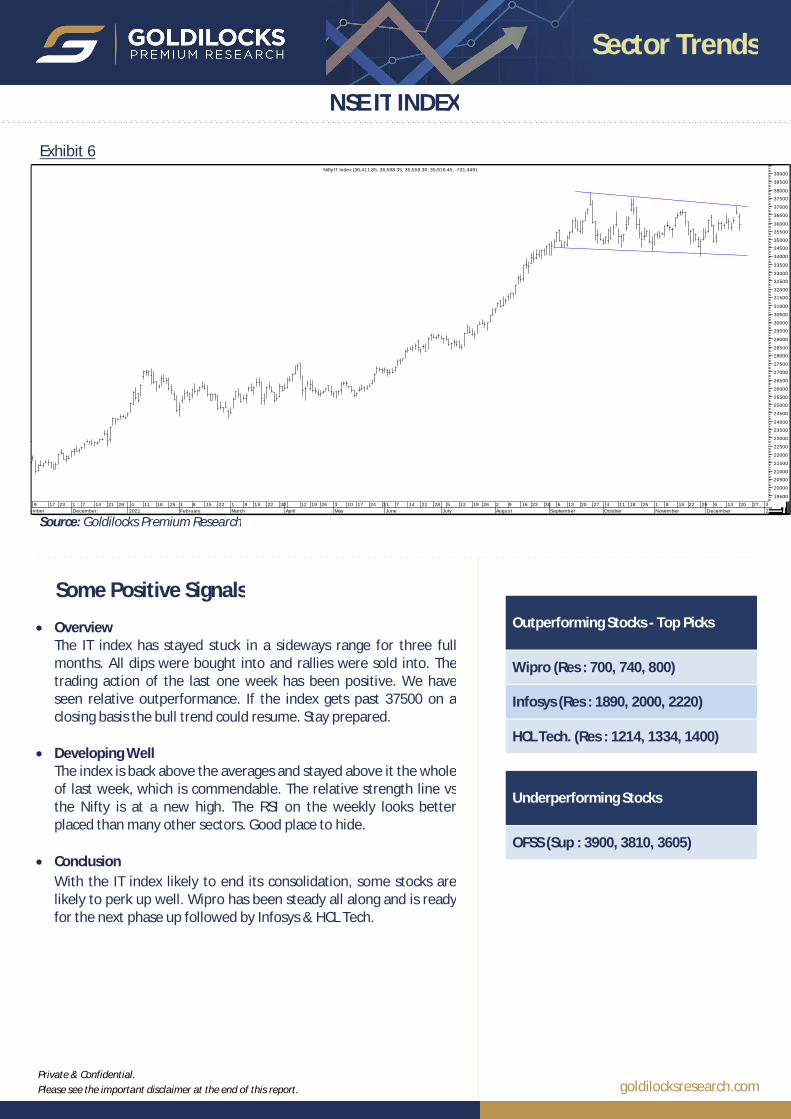
Some Positive Signals
Overview The IT index has stayed stuck in a sideways range for three full months. All dips were bought into and rallies were sold into. The trading action of the last one week has been positive. We have seen relative outperformance. If the index gets past 37500 on a closing basis the bull trend could resume. Stay prepared.
Developing Well The index is back above the averages and stayed above it the whole of last week, which is commendable. The relative strength line vs the Nifty is at a new high. The RSI on the weekly looks better placed than many other sectors. Good place to hide.
Conclusion With the IT index likely to end its consolidation, some stocks are likely to perk up well. Wipro has been steady all along and is ready for the next phase up followed by Infosys & HCL Tech.
Source: Goldilocks Premium Research
goldilocksresearch.comPrivate & Confidential. Please see the important disclaimer at the end of this report.
Sector Trends
Outperforming Stocks - Top Picks
L&T (Res : 1900, 2000, 2200)
Siemens (Res : 2570, 2770)
Finolex Cables (Res : 550, 605)
Underperforming Stocks
Graphite India (Sup : 410, 360)
September October November December 2018 February March April May June July August September October November December 2019 February March April May June July August September October November December
16000
16500
17000
17500
18000
18500
19000
19500
20000
20500
21000
1.35
1.40
1.45
1.50
1.55
1.60
1.65
1.70
1.75
1.80
1.85
Relative Strength Comparative(* CNX NIFTY) (1.40703, +0.00735)
Oct Nov Dec 2015 Feb Mar Apr May Jun Jul Aug Sep Oct Nov Dec 2016 Feb Mar Apr May Jun Jul Aug Sep Oct Nov Dec 2017 Feb Mar Apr May Jun Jul Aug Sep Oct Nov Dec 2018 Feb Mar Apr May Jun Jul Aug Sep Oct Nov Dec 2019 Feb Mar Apr May Jun Jul Aug Sep Oct Nov Dec 2020 Feb Mar Apr
1200125013001350140014501500155016001650170017501800185019001950200020502100215022002250230023502400245025002550260026502700275028002850290029503000305031003150320032503300335034003450350035503600365037003750380038503900395040004050410041504200425043004350440044504500* CNX METAL (2,851.85, 2,927.95, 2,846.15, 2,864.65, +23.8999)
Mar Apr May Jun Jul Aug Sep Oct Nov Dec 2016 Feb Mar Apr May Jun Jul Aug Sep Oct Nov Dec 2017 Feb Mar Apr May Jun Jul Aug Sep Oct Nov Dec 2018 Feb Mar Apr May Jun Jul Aug Sep Oct Nov Dec 2019 Feb Mar Apr May Jun Jul Aug Sep Oct Nov Dec 2020 Feb Mar
5500
6000
6500
7000
7500
8000
8500
9000
9500
10000
10500
11000
11500
12000
12500
13000
13500
14000
14500
15000
15500
16000
16500
17000* S&P BSE METAL INDEX (8,539.47, 8,549.80, 8,262.95, 8,474.96, -54.6299)
2003 2004 2005 2006 2007 2008 2009 2010 2011 2012 2013 2014 2015 2016 2017 2018 2019 2020 2021
0100020003000400050006000700080009000
1000011000120001300014000150001600017000180001900020000
2100022000230002400025000260002700028000290003000031000
32000330003400035000
35
40
45
50
55
60
65
70
75
80
85
Relative Strength Index (49.2449)
Apr May Jun Jul Aug Sep Oct Nov Dec 2016 Feb Mar Apr May Jun Jul Aug Sep Oct Nov Dec 2017 Feb Mar Apr May Jun Jul Aug Sep Oct Nov Dec 2018 Feb Mar Apr May Jun Jul Aug Sep Oct Nov Dec 2019 Feb Mar Apr May Jun Jul Aug Sep Oct Nov Dec 2020 Feb Mar Apr May Jun Jul Aug Sep
16000
16500
17000
17500
18000
18500
19000
19500
20000
20500
21000
21500
22000
22500
23000
23500
24000
24500
25000
25500
26000
26500
27000
27500
28000
28500
29000
29500
30000
30500
31000
31500
32000
32500
33000
33500
34000
34500* CNX FMCG (29,187.50, 29,215.85, 28,349.00, 28,709.45, -436.150)
15 22 29 5August
13 19 26 3 9 16September
23 30 7October
14 22 29 4 11November
18 25 2 9December
16 23 30 62020
13 20 27 3 10February
17 24 2 9March
16 23 30 7April
13 20 27 4May
11 18 26 1June
8 15 22 29 6July
13 20 27 3 10August
22000
22500
23000
23500
24000
24500
25000
25500
26000
26500
27000
27500
28000
28500
29000
29500
30000
30500
31000
31500
32000
32500
33000
33500* CNX FMCG (31,009.95, 31,138.55, 30,653.40, 31,018.85, -83.0508)
Dec 2018 Feb Mar Apr May Jun Jul Aug Sep Oct Nov Dec 2019 Feb Mar Apr May Jun Jul Aug Sep Oct Nov Dec 2020 Feb Mar Apr May Jun Jul Aug Sep Oct Nov Dec 2021
22000225002300023500240002450025000255002600026500270002750028000285002900029500300003050031000315003200032500330003350034000345003500035500
15202530354045505560657075808590Relative Strength Index (64.9091)
A S O N D 2016 M A M J J A S O N D 2017 M A M J J A S O N D 2018 M A M J J A S O N D 2019 M A M J J A S O N D 2020 M A M J J A S O N D 2021 M A1500015500160001650017000175001800018500190001950020000205002100021500220002250023000235002400024500250002550026000265002700027500280002850029000295003000030500310003150032000325003300033500340003450035000355003600036500
2025303540455055606570758085
Relative Strength Index (72.7308)
7April
13 20 27 4May
11 18 26 1June
8 15 22 29 6July
13 20 27 3 10August
17 24 31 7September
14 21 28 5 12October
19 26 2 9November
17 23 1 7December
14 21 28 42021
11 18 25 1 8February
15 22 1March
8
25500
26000
26500
27000
27500
28000
28500
29000
29500
30000
30500
31000
31500
32000
32500
33000
33500
34000
34500
35000
35500Nifty FMCG Index (33,396.80, 33,584.55, 33,115.10, 33,336.80, -37.0977)
May Jun Jul Aug Sep Oct Nov Dec 2018 Mar Apr May Jun Jul Aug Sep Oct Nov Dec 2019 Mar Apr May Jun Jul Aug Sep Oct Nov Dec 2020 Feb Mar Apr May Jun Jul Aug Sep Oct Nov Dec 2021 Feb Mar Apr May Jun18000
18500
19000
19500
20000
20500
21000
21500
22000
22500
23000
23500
24000
24500
25000
25500
26000
26500
27000
27500
28000
28500
29000
29500
30000
30500
31000
31500
32000
32500
33000
33500
34000
34500
35000
35500
36000Nifty FMCG Index (33,172.60, 33,595.60, 32,720.00, 33,222.60, +154.102)
Feb Mar Apr May Jun Jul Aug Sep Oct Nov Dec 2019 Feb Mar Apr May Jun Jul Aug Sep Oct Nov Dec 2020 Feb Mar Apr May Jun Jul Aug Sep Oct Nov Dec 2021 Feb Mar Apr May
22000
22500
23000
23500
24000
24500
25000
25500
26000
26500
27000
27500
28000
28500
29000
29500
30000
30500
31000
31500
32000
32500
33000
33500
34000
34500
35000
35500
36000
36500Nifty FMCG Index (33,938.10, 34,002.85, 33,631.70, 33,726.10, -316.949)
August September November 2019 February April May June July August September November 2020 February April May June July August September November 2021 February April May
22000
22500
23000
23500
24000
24500
25000
25500
26000
26500
27000
27500
28000
28500
29000
29500
30000
30500
31000
31500
32000
32500
33000
33500
34000
34500
35000
35500
36000
36500Nifty FMCG Index (35,050.60, 35,097.55, 34,755.20, 34,807.40, +25.8984)
O N D 2016 M A M J J A S O N D 2017 M A M J J A S O N D 2018 M A M J J A S O N D 2019 M A M J J A S O N D 2020 M A M J J A S O N D 2021 M A M J J A S
15500160001650017000175001800018500190001950020000205002100021500220002250023000235002400024500250002550026000265002700027500280002850029000295003000030500310003150032000325003300033500340003450035000355003600036500370003750038000
Nifty FMCG Index (36,379.00, 36,503.95, 36,083.20, 36,184.40, -32.3008)
A M J A S O N 2018 A M J A S O D 2019 A M J J A S O N D 2020 A M J J A S O N D 2021 A M J J A S O
2200023000240002500026000270002800029000300003100032000330003400035000360003700038000Nifty FMCG Index (36,816.65, 37,016.95, 36,088.25, 36,842.05, +172.250)
December 2021 February March April May June July August September October310003200033000340003500036000370003800039000400004100042000
30
40
50
60
70
80Relative Strength Index (69.1555)
December 2020 February March April May June July August September October November December 2021 February March April May June July August September October November
22000
23000
24000
25000
26000
27000
28000
29000
30000
31000
32000
33000
34000
35000
36000
37000
38000
39000
40000
41000
42000
43000
15202530354045505560657075808590Relative Strength Index (31.5128)
February April May June July August September November 2020 February April May June July August September November 2021 February April May June July August September November
10000
15000
20000
25000
30000
1015202530354045505560657075808590
1.10
1.15
1.20
1.25
1.30
1.35
1.40
1.45
1.50
1.55
1.60
1.65
1.70Relative Strength Comparative(.NSEI) (1.60107, -0.00671)
19 26 2 9November
17 23 1 7 14December
21 28 42021
11 18 25 1 8February
15 22 1 8March
15 22 30April
12 19 26 3May
10 17 24 31 7June
14 21 28 5July
12 19 26 2 9August
16 23 30 6 13September
20 27 4 11October
18 25 1 8 15November
22 29 6 13December
20 27 32022
12500
13000
13500
14000
14500
15000
15500
16000
16500
17000
17500
18000
18500
19000
19500
20000
20500
21000
21500
22000
22500
23000
23500
24000
24500
25000
25500
26000
26500
27000
27500
28000
28500
29000
29500
30000
30500S&P BSE Capital Goods Index (27,773.92, 27,793.35, 26,837.89, 27,208.42, -849.029)
BSE CAPITAL GOODS
Exhibit 7
Hitting Resistances
Overview The Capital Goods index has been one of the best performers of the last many months. Probably the only sector to stay strongly in an uptrend. However now things look a bit top heavy. It seems even this index could now come under selling pressure. 26700 is the major support that has been tested yesterday.
Some Bearish Divergences On the weekly charts we have seen some bearish divergences develop. This does not have good eye appeal. The ratio chart vs the Nifty is at a major medium-term resistance. It just seems that outperformance is likely to end for the time being.
Conclusion Post the ongoing correction, Capital Goods stocks are likely to rebound well. The longer term uptrend is intact. We see L&T as the best bet followed by Siemens and Finolex Cables.
Source: Goldilocks Premium Research
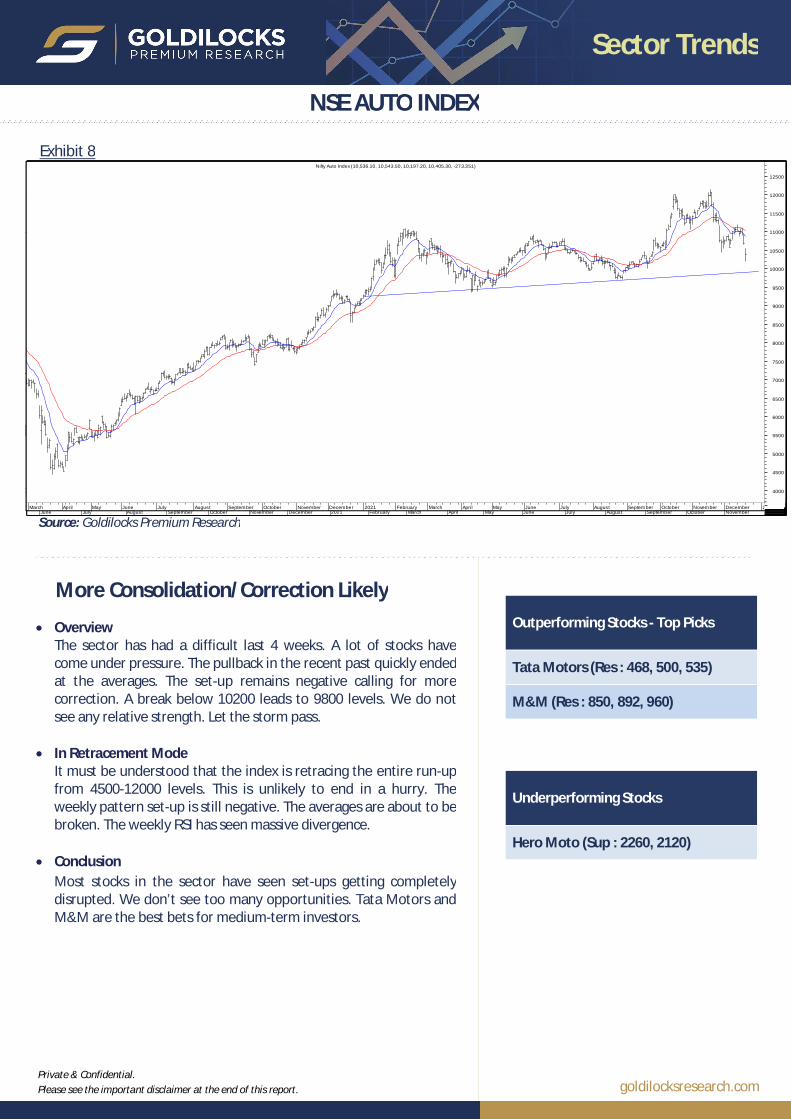
goldilocksresearch.comPrivate & Confidential. Please see the important disclaimer at the end of this report.
Sector Trends
Outperforming Stocks - Top Picks
Tata Motors (Res : 468, 500, 535)
M&M (Res : 850, 892, 960)
Underperforming Stocks
Hero Moto (Sup : 2260, 2120)
D 2006 A M J J A S O N D 2007 A M J J A S O N D 2008 A M J J A S O N D 2009 A M J J A S O N D 2010 A M J J A S O N D 2011 A M J J A S O N D 2012 A M J J A S O N D 2013 A M J J A S O N D 2014 A M J J A S O N D 2015 A M J J A S O N D 2016 A M J J A S O N D 2017 A M J J A S O N D 2018 A M J J A S O N D 2019 A M J J A S O N D 2020
1000
1500
2000
2500
3000
3500
4000
4500
5000
5500
6000
6500
7000
7500
8000
8500
9000
9500
10000
0.45
0.50
0.55
0.60
0.65
0.70
0.75
0.80
0.85
0.90
0.95
Relative Strength Compara tive(* CNX NIFTY) (0.46764, -0.01024)
September November December 2017 February March April May June July August September November December2018 February March April May June July August September November 2019 February March April May June July August September November 2020 February March
104001050010600107001080010900110001110011200113001140011500116001170011800119001200012100122001230012400125001260012700128001290013000131001320013300134001350013600137001380013900140001410014200143001440014500146001470014800149001500015100152001530015400155001560015700158001590016000161001620016300164001650016600167001680016900170001710017200
* S&P BSE OIL & GAS INDEX (12,789.84, 12,814.62, 12,487.70 , 12,652.67, -94.6504)
Feb Mar Apr May Jun Jul Aug Sep Oct Nov Dec 2017 Feb Mar Apr May Jun Jul Aug Sep Oct Nov Dec 2018 Feb Mar Apr May Jun Jul Aug Sep Oct Nov Dec 2019 Feb Mar Apr May Jun Jul Aug Sep Oct Nov Dec 2020 Feb Mar Apr
105
110115
120
125
130135
140145
150155
160
165
170175
180185
190195
200
205
210215
220225
230
235240
245
250
255260
265270
275280
285290
295300
305310
315320
325330
335340
345350
355
360
365370
375
380385
390395
* CNX REALTY (312.000, 325.050, 311.850, 324.150, +13.5000)
Jul Aug Sep Oct Nov Dec 2015 Feb Mar Apr May Jun Jul Aug Sep Oct Nov Dec 2016 Feb Mar Apr May Jun Jul Aug Sep Oct Nov Dec 2017 Mar Apr May Jun Jul Aug Sep Oct Nov Dec 2018 Mar Apr May Jun Jul Aug Sep Oct Nov Dec 2019 Mar Apr May Jun Jul Aug Sep Oct Nov Dec 2020 Mar Apr May Jun Jul
5000
10000
15000
20000
x100
600
700800900
10001100
1200
13001400
150016001700
18001900200021002200
2300240025002600
270028002900
30003100
320033003400
350036003700
38003900
4000
41004200
430044004500
46004700480049005000
510052005300
5400550056005700
5800ATUL LTD (4,585.25, 5,050.00, 4,584.00, 4,852.45, +252.850)
26 3 9September
16 23 30 7October
14 22 29 4November
11 18 25 2 9December
16 23 302020
6 13 20 27 3February
10 17 24 2March
9 16 23 30 7April
13 20 27 4May
11 18 26 1June
8 15 22 29July
6
50000
x1000
315320325330335340345350355360365370375380385390395400405410415420425430435440445450455460465470475480485490495500505510515520525530535540545550555560565570575580585590595600605610615620625630635640645650655660665670
HDFC STANDARD LIFE INSURANCE COMPANY (517.950, 524.000, 514.350, 521.100, +5.14996)
13 20 27 3 10June
17 24 1July
8 15 22 29 5 13August
19 26 3 9 16September
23 30 7 14October
22 29 4 11 18November
25 2 9 16December
23 30 62020
13 20 27 3 10February
17 24 2 9March
16 23 30 7April
13 20 27 4May
11 18 26 1 8June
15 22 29 6July
13 20 27 3 10August
410042004300440045004600470048004900500051005200530054005500560057005800590060006100620063006400650066006700680069007000710072007300740075007600770078007900800081008200830084008500860087008800
* CNX AUTO (7,228.40, 7,271.00, 7,178.85, 7,218.65, -82.3999)
7October
14 22 29 4 11November
18 25 2 9December
16 23 30 62020
13 20 27 3 10February
17 24 2March
9 16 23 30 7April
13 20 27 4May
11 18 26 1June
8 15 22 29 6July
13 20 27 3 10August
17 24 31 7September
410042004300440045004600470048004900500051005200530054005500560057005800590060006100620063006400650066006700680069007000710072007300740075007600770078007900800081008200830084008500860087008800* CNX AUTO (7,997.00, 8,034.40, 7,933.20, 7,983.60, +35.2002)
April May June July August September October November December 2020 February March April May June July August Septem ber October
410042004300440045004600470048004900500051005200530054005500560057005800590060006100620063006400650066006700680069007000710072007300740075007600770078007900800081008200830084008500860087008800890090009100920093009400
* CNX AUTO (7,985.35, 8,089.05, 7,953.90, 7,966.10, +58.0000)
April May June July August September October November December 2020 February March April May June July August September October November
2900300031003200
330034003500360037003800
390040004100420043004400
450046004700480049005000510052005300540055005600570058005900600061006200
630064006500660067006800
690070007100NIFTY Smallcap 100 (6,093.35, 6,107.20, 6,081.95, 6,089.10, +45.6001)
2018 February April May June July August September November 2019 February April May June July August September November 2020 February April May June July August September November 2021
4000
4500
5000
5500
6000
6500
7000
7500
8000
8500
9000
9500
10000
10500
11000
11500
12000
12500
May Jun Jul Aug Sep Oct Nov Dec 2018 Feb Mar Apr May Jun Jul Aug Sep Oct Nov Dec 2019 Feb Mar Apr May Jun Jul Aug Sep Oct Nov Dec 2020 Feb Mar Apr May Jun Jul Aug Sep Oct Nov Dec 2021 Feb
4000
4500
5000
5500
6000
6500
7000
7500
8000
8500
9000
9500
10000
10500
11000
11500
12000
12500
Nifty Auto Index (10,033.35, 10,166.20, 10,008.75, 10,136.80, +175.700)
Nov Dec 2018 Feb Mar Apr May Jun Jul Aug Sep Oct Nov Dec 2019 Feb Mar Apr May Jun Jul Aug Sep Oct Nov Dec 2020 Feb Mar Apr May Jun Jul Aug Sep Oct Nov Dec 2021 Feb Mar
4000
4500
5000
5500
6000
6500
7000
7500
8000
8500
9000
9500
10000
10500
11000
11500
12000
12500
Nifty Auto Index (10,785.05, 10,786.45, 10,450.55, 10,540.35, -286.650)
Apr May Jun Jul Aug Sep Oct Nov Dec 2018 Mar Apr May Jun Jul Aug Sep Oct Nov Dec 2019 Mar Apr May Jun Jul Aug Sep Oct Nov Dec 2020 Feb Mar Apr May Jun Jul Aug Sep Oct Nov Dec 2021 Feb Mar Apr May Jun
4000
4500
5000
5500
6000
6500
7000
7500
8000
8500
9000
9500
10000
10500
11000
11500
12000
12500
Nifty Auto Index (10,446.75, 10,450.20, 10,039.55, 10,143.95, -239.950)
August September October November December 2020 February March April May June July August September October November December 2021 February March April May
4000
4500
5000
5500
6000
6500
7000
7500
8000
8500
9000
9500
10000
10500
11000
11500
10
15
20
25
30
35
40
45
50
55
60
65
70
75
80
85Relative Strength Index (41.8194)
A S O N D 2015 M A M J J A S O N D 2016 M A M J J A S O N D 2017 M A M J J A S O N D 2018 M A M J J A S O N D 2019 M A M J J A S O N D 2020 M A M J J A S O N D 2021 M A M J J A
4000
4500
5000
5500
6000
6500
7000
7500
8000
8500
9000
9500
10000
10500
11000
11500
12000
12500
10
1520
25
3035
4045
505560
657075
80
85Relative Strength Index (56.4583)
December 2020 February March April May June July August September October November December 2021 February March April May June July
4000
4500
5000
5500
6000
6500
7000
7500
8000
8500
9000
9500
10000
10500
11000
11500Nifty Auto Index (10,444.00, 10,456.05, 10,386.05, 10,420.30, -35.7002)
J A S O N D 2018 A M J J A S O N D 2019 A M J J A S O N D 2020 A M J J A S O N D 2021 A M J J A S O400045005000550060006500700075008000850090009500
100001050011000115001200012500Nifty Auto Index (10,274.75, 10,348.80, 10,000.95, 10,178.30, -71.2002)
S O N D 2019 M A M J J A S O N D 2020 M A M J J A S O N D 2021 M A M J J A S O N D4000
4500
5000
5500
6000
6500
7000
7500
8000
8500
9000
9500
10000
10500
11000
11500Nifty Auto Index (10,286.95, 10,473.90, 10,021.35, 10,429.05, +77.5996)
Jul Aug Sep Oct Nov Dec 2018 Feb Mar Apr May Jun Jul Aug Sep Oct Nov Dec 2019 Feb Mar Apr May Jun Jul Aug Sep Oct Nov Dec 2020 Feb Mar Apr May Jun Jul Aug Sep Oct Nov Dec 2021 Mar Apr May Jun Jul Aug Sep Oct Nov
4000
4500
5000
5500
6000
6500
7000
7500
8000
8500
9000
9500
10000
10500
11000
11500
12000
12500
Nifty Auto Index (11,269.70, 11,408.30, 11,258.85, 11,349.60, +121.399)
June July August September October November December 2021 February March April May June July August September October November
5500
6000
6500
7000
7500
8000
8500
9000
9500
10000
10500
11000
11500
12000
1250020
25
30
35
40
45
50
55
60
65
70
75
80
85Relative Strength Index (60.8243)
March April May June July August September October November December 2021 February March April May June July August September October November December 2022
4000
4500
5000
5500
6000
6500
7000
7500
8000
8500
9000
9500
10000
10500
11000
11500
12000
12500
Nifty Auto Index (10,536.10, 10,543.50, 10,197.20, 10,405.30, -273.351)
NSE AUTO INDEX
Exhibit 8
More Consolidation/Correction Likely
Overview The sector has had a difficult last 4 weeks. A lot of stocks have come under pressure. The pullback in the recent past quickly ended at the averages. The set-up remains negative calling for more correction. A break below 10200 leads to 9800 levels. We do not see any relative strength. Let the storm pass.
In Retracement Mode It must be understood that the index is retracing the entire run-up from 4500-12000 levels. This is unlikely to end in a hurry. The weekly pattern set-up is still negative. The averages are about to be broken. The weekly RSI has seen massive divergence.
Conclusion Most stocks in the sector have seen set-ups getting completely disrupted. We don’t see too many opportunities. Tata Motors and M&M are the best bets for medium-term investors.
Source: Goldilocks Premium Research
goldilocksresearch.comPrivate & Confidential. Please see the important disclaimer at the end of this report.
Sector Trends
DISCLAIMER
Goldilocks Premium Research SEBI Registered Research Analyst - INH300007457
The information and views in this report are believed to be reliable, but we do not accept any responsibility (or liability) for errors of fact or opinion. Users have the right to choose the product/report that suits them the most.
Investment in equity shares has its own risks. Sincere efforts have been made to present the right investment perspective. The information contained herein is based on analysis and on sources that we consider reliable. We, however, do not vouch for the consistency or the completeness thereof. This material is for personal information and we are not responsible for any loss incurred due to it & take no responsibility whatsoever for any financial profits or loss which may arise from the recommendations above.
Our subscribers, a third party or anyone else have no rights to forward or share our calls or SMS or Reports or any information provided by us to/with anyone (through any medium) which is received directly or indirectly by them. If found so then legal actions can be taken. Please note, any evidence of distribution, copying, forwarding of reports/calls will lead to automatic cancellation of subscription without any refunds.
There are risks associated with utilizing internet and short messaging system (SMS) based information and research dissemination services. Subscribers are advised to understand that the services can fail due to failure of hardware, software, and Internet connection. While we ensure that the messages/emails are delivered in time to the subscribers Mobile Network, the delivery of these messages to the customer's mobile phone/handset/desktop/ipad/tablet/laptop is the responsibility of the customer's Mobile Network/internet connection/wifi. SMS/Emails may be delayed and/or not delivered to the customer's mobile phone/handset on certain days, owing to technical reasons and www.goldilocksresearch.com.com and its proprietor, analysts, employees, cannot be held responsible for the same.
You should strictly abide with the consultation provided by the qualified research analyst/s at www.goldilocksresearch.com and trade only as per the levels provided by us. Unlike an actual performance record, simulated results do not represent actual trading. No representation is being made that any account will or is likely to achieve profits or losses similar to those shown.
You, and not www.goldilocksresearch.com.com, assume the entire cost and risk of any trading you choose to undertake. You are solely responsible for making your own investment decisions. If you choose to engage in transactions with or without seeking advice from a licensed and qualified financial advisor or entity, then such decision and any consequences flowing there from are your sole responsibility. www.goldilocksresearch.com or any employees are in no way liable for the use of the information by others in investing or trading in investment vehicles.
www.goldilocksresearch.com.com, its management, its associate companies and/or their employees take no responsibility for the veracity, validity and the correctness of the expert recommendations or other information or research. Although we attempt to research thoroughly on information provided herein, there are no guarantees in consistency. The information presented in this report has been gathered from various sources believed to be providing correct information. www.goldilocksresearch.com.com, group, companies, associates and/or employees are not responsible for errors, inaccuracies if any in the content provided in this report.
www.goldilocksresearch.com.com has license to provide research advisory as a research analyst. Your use of this and all information contained on www.goldilocksresearch.com is governed by these Terms and Conditions of Use. This material is based upon information that we consider reliable, but we do not represent that it is consistent or complete, and that it should be relied upon, as such. You should not rely solely on the Information in making any investment. Rather, you should use the Information only as a starting point for doing additional independent research in order to allow you to form your own opinion regarding investments. By using www.goldilocksresearch.com.com including any software and content contained therein, you agree that use of the Service is entirely at your own risk. www.goldilocksresearch.com.com is a registered research analyst. You understand and acknowledge that there is a very high degree of risk involved in trading securities. www.goldilocksresearch.com.com makes no warranties and gives no assurances regarding the truth, timeliness, reliability, or good faith of any material posted on www.goldilocksresearch.com.
By visiting the website (www.goldilocksresearch.com) and reading/acting on this report as a visitor and/or as a subscriber, surfing and reading of the information on the website is the acceptance of this disclaimer and all other terms and conditions.
goldilocksresearch.comPrivate & Confidential. Please see the important disclaimer at the end of this report.
Sector Trends
www.goldilocksresearch.com strictly follows Trading Principle and Stop Loss Policy wherein Customer by default agree to not do/ enter any trade without Pre Informed/ Defined Stop Loss. If you trade against the stop loss policy, you alone shall be responsible for the same & www.goldilocksresearch.com shall have zero liability towards it.
Neither www.goldilocksresearch.com nor its associates or the Research Analyst(s) named in this report or his/her relatives individually owns one per cent or more securities of the company(ies) covered under this report, at the relevant date as specified in the SEBI (Research Analysts) Regulations, 2014.
Research Analysts or their relatives; (a) do not have any financial interest in the company(ies) covered under this report or (b) did not receive any compensation from the company(ies) covered under this report, or from any third party, in connection with this report or (c) do not have any other material conflict of interest at the time of publication of this report. Research Analyst(s) are not serving as an officer, director or employee of the company(ies) covered under this report.
Trading recommendations based on quantitative analysis are based on index/stock’s momentum, price movement, trading volume and other volatility parameters, as opposed to study of macro economic scenario and a company’s fundamentals. The trading calls and/or contents of this document are not made with regard to the specific investment objectives, financial situation or the particular needs of any particular person. Any action taken by you based on the aforesaid report and suffer adverse consequences or loss, you shall be solely responsible for the same. We expressly disclaim any liability and responsibility for any losses arising from any uses to which this communications is out.
Other Disclosures under RA Regulations,2014 There is no disciplinary action which is / was running / initiated against the Proprietor and there are no outstanding litigations against him. There are no financial dependant associates.
Securities Investments are subject to market risk, economic risk, interest rate risks, credit risks, political and geopolitical risks, currency risks, country risks and risks arising from changing business dynamics. The performance of company(ies) covered herein may be adversely affected by numerous factors including, for example, (i) business, economic, and political conditions; (ii) the supply of and demand for the goods and services produced, provided, or sold by such companies; (iii) changes and advances in technology that may, among other things, render goods and services sold by the such companies obsolete; and (iv) actual and potential competition from other companies, whether in India or abroad. (v) Certain companies may need substantial additional capital to support growth or to achieve or maintain a competitive position. Such capital may not be available on attractive terms or at all. (vi) adverse news about the company/sector, (vii) poor results of the company (ix) unforeseen force majeure events like war, hostilities, revolution, riots, civil commotion, strikes, lockouts, epidemic, fire, explosion, flood, earthquake, act of God, any act of Government or any such other cause. Hence, there is no assurance, insurance or guarantee that the forecast, recommendation, opinion, etc. given about the securities/companies in the report will be achieved.
DISCLAIMER
Related Documents