Sections 9.1 and 9.2 HYPOTHESIS TESTS FOR PROPORTIONS

Welcome message from author
This document is posted to help you gain knowledge. Please leave a comment to let me know what you think about it! Share it to your friends and learn new things together.
Transcript
Sections 9.1 and 9.2 HYPOTHESIS TESTS FOR PROPORTIONS

Inferential Statistics
� Two important features ◦ Information is obtained from a sample ◦ This information is used to draw a conclusion (an
inference) about the entire population from which the sample was drawn.
� Two major types ◦ Using confidence intervals ◦ Using hypothesis tests
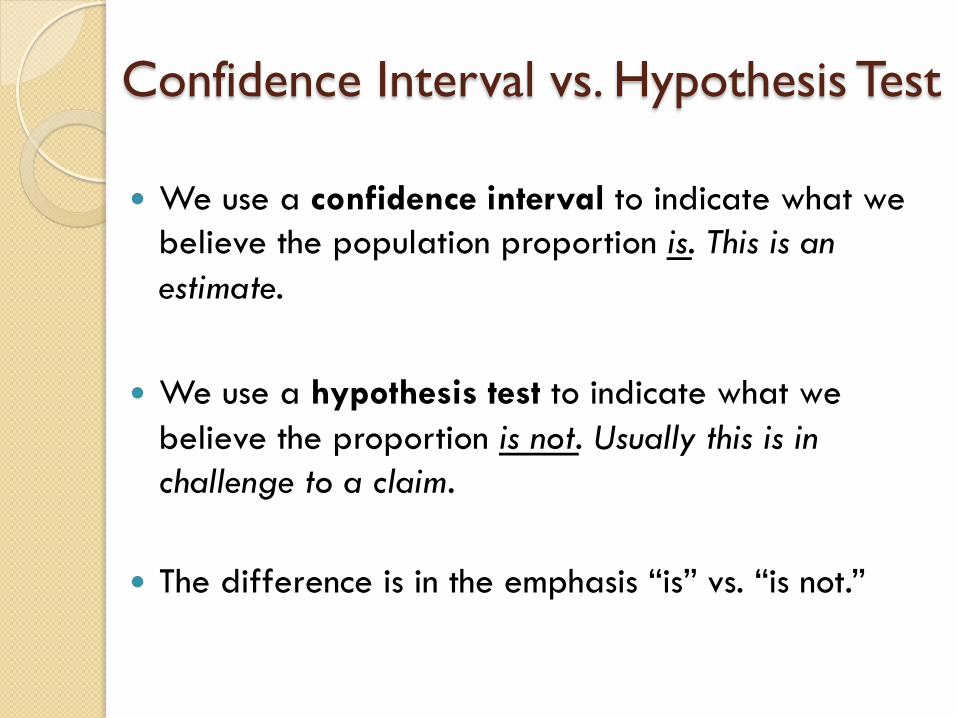
Confidence Interval vs. Hypothesis Test
� We use a confidence interval to indicate what we believe the population proportion is. This is an estimate.
� We use a hypothesis test to indicate what we believe the proportion is not. Usually this is in challenge to a claim.
� The difference is in the emphasis “is” vs. “is not.”

Example
� “Do you believe that the amount of taxes you pay is fair?”
� 54% responded “yes,” with a margin of error ±4.2%.
� We build the confidence interval (49.8%, 58.2%). � From the same survey, we would design a hypothesis
test for the following questions: ◦ Do you believe 60% of Americans believe their tax bill is
fair? I believe the proportion is not 60%. ◦ Do you believe 50% of Americans believe their tax bill is
fair? I believe the proportion could be 50%.
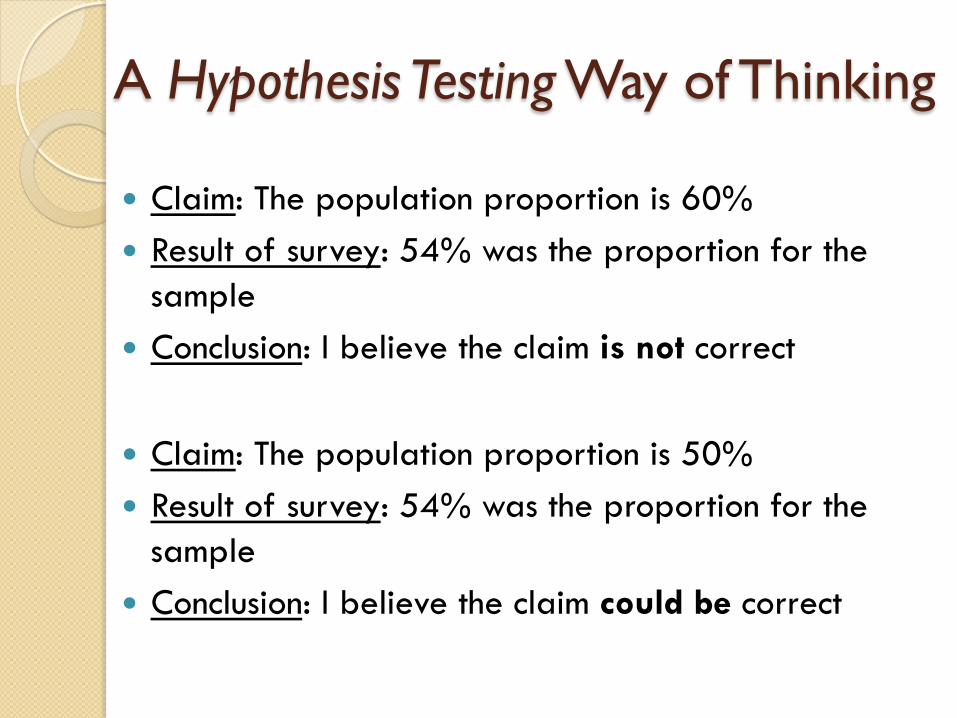
A Hypothesis Testing Way of Thinking
� Claim: The population proportion is 60% � Result of survey: 54% was the proportion for the
sample � Conclusion: I believe the claim is not correct
� Claim: The population proportion is 50% � Result of survey: 54% was the proportion for the
sample � Conclusion: I believe the claim could be correct

Another Example
� Setup ◦ If we roll a pair of fair dice, the total on the two dice
ranges from 2 to 12. ◦ The probability of totaling 7 is 6/36 = 1/6 = 0.1667. ◦ If the dice are loaded, this probability can be changed. ◦ State gaming commissions inspect casino equipment
including dice. Particularly important when machines are simulating dice, cards, etc.
� Claim: The casino claims that two dice are fair, i.e., that the probability of totaling 7 is 16.67%
Our Experiment
Roll the dice many times ◦ If the proportion of 7’s is not close to 1/6, we have
evidence that the probability is not 1/6. We will reject the claim. ◦ If the proportion of 7’s is close to 1/6, we
acknowledge that the claim could be true.

Our Experiment
� Roll the dice many times ◦ If the proportion of 7’s is not close to 1/6, we have
evidence that the probability is not 1/6. We will reject the claim ◦ If the proportion of 7’s is close to 1/6, we acknowledge
that the claim could be true.
Use the applet at http://webspace.ship.edu/jwcraw/flash/keepordiscarddicepart1.html

Are the dice fair or loaded?
To answer this question by experiment, we make two choices. ◦ How many rolls should we use to test the claim? (sample
size) ◦ How close should the sample proportion be to 1/6 for us
to believe the population proportion could be 1/6? (measure of closeness)

Example 2.
Suppose we think the casino is cheating by using dice that do not sum to seven as often as they should. We collect data on 1000 dice rolls and find that 153 of them sum to seven. Is this enough evidence to accuse them of cheating?

Are the dice fair or loaded?
� To answer this question by experiment, we make two choices. ◦ How many rolls? (sample size) ◦ How close should we be to 1/6? (measure of closeness)
� Two different ways to be correct, and two ways to be incorrect.

Types of Errors

Connection to Criminal Trials
Part II: The Logic of Hypothesis Testing
Logic of Hypothesis Testing: Dice Example � Using the dice example.
� Claim: The population proportion is 1/6. � There are two possible conclusions: ◦ The sample proportion was not close to 1/6, so we
reject the claim. ◦ The sample proportion was close to 1/6, so we do not
reject the claim.

The Logic of Hypothesis Testing: Unusual Data
To be more precise about what is “unusual,” we use z-scores and P-values. The sample value p-hat being “unusual” means we would not expect to have such a sample value given the claimed value for p.

“Unusual” Observations
q Adult male heights are normally distributed with a mean of 70 inches and a standard deviation of 4 inches.
q Consider these two q Sam is 79 inches tall (z-score is 2.25; corresponds to 0.9878 in
Table A) q Joe is 61 inches tall (z-score is -2.25; corresponds to 0.0122 in
Table A) For a given person, we can think of “unusual” in two ways
q Sam is unusually tall, he is in the rarest 1.22% of tall people. q Joe is unusually short, he is in the rarest 1.22% of short
people. q Both have unusual height, they are in the rarest 2.44%

P-Values
q The P-value is a measure of just how unusual the data is, in terms of probability.
Recall that q Sam is unusually tall, he is in the rarest 1.22% of tall people. q Joe is unusually short, he is in the rarest 1.22% of short
people. q Both have unusual height, they are in the rarest 2.44%
This can be restated as q Sam’s one-tail (right-tail) P-value is 0 .0122 q Joe’s one-tail (left-tail) P-value is 0.0122 q Either one of them has a two-tail P-value of 0.0244

Graphical Depiction of P-Values
Components of a Hypothesis Test
� Claim to be investigated
� Hypothetical sampling distributions based on claim.
� Calculations based on the sample
� Measure of closeness

Claim to be investigated
� Claim: The population proportion is p0 (a particular value known in advance)
� We will reject this claim if we obtain evidence that the population proportion is not equal to this value — either smaller or larger.
� But wait, a sample value will rarely be *exactly* the population value …so when should we reject?
Sampling Distribution
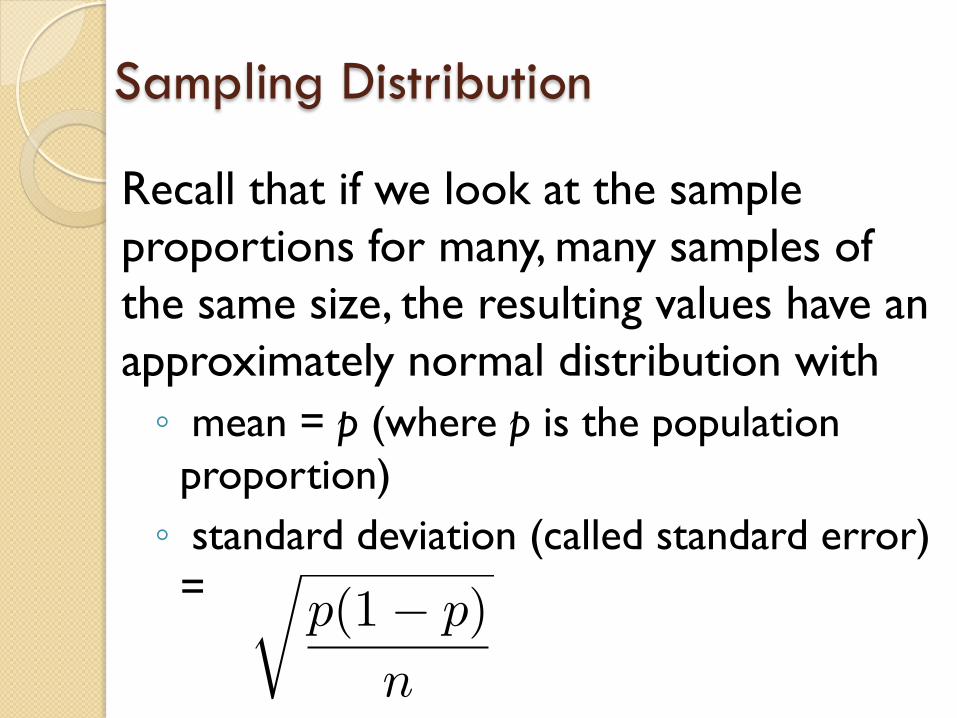
Recall that if we look at the sample proportions for many, many samples of the same size, the resulting values have an approximately normal distribution with ◦ mean = p (where p is the population
proportion) ◦ standard deviation (called standard error)
=
�p(1� p)
n

Sampling Distribution (cont.)
� We do not know the value of p. However, we know that it is claimed to be p0., so we can build a hypothetical distribution.
� Thus, we use p0 in our calculations. ◦ mean = p0 ◦ standard deviation (called standard error)
=
�p0(1� p0)
n

Calculations based on the sample
� We obtain a simple random sample, and compute the sample proportion
� From the sampling distribution we know what to expect if the claim is true:
should be close to p0.
p̂
p̂

Measure of closeness
� Reasoning: ◦ If the claim is true, the sample
proportion should not be unusually large or small. ◦ The smaller the P-value, the more
unusual the sample. The P-value is literally the probability that a p-hat would be this far from the mean, within the framework of our hypothetical distribution.

Measure of closeness
Reasoning: ◦ If the claim is true, the sample proportion
should not be unusually large or small. ◦ The smaller the (two-tail) P-value, the
more unusual the sample

Measure of closeness (cont.)
� But how small is small? � This decision should be made in advance,
prior to taking the sample and varies depending on the situation.
� For example, we might decide that small will mean “less than 0.05.” So, we reject the claim if our sample is in the most unusual 5% of all possible samples.

Conclusion
We reject the claim if the calculated P-value is less than the chosen value. Otherwise, we do not reject the claim. Recall: We calculate a P-value using the z-score and Table A or normalcdf(). For mean and standard deviation we use: ◦ mean = p0 ◦ standard deviation (called standard error)
=
�p0(1� p0)
n

An Example
Consider the applet again and let’s do a hypothesis test using 0.05 as our cut-off. ◦ (p. 12) ◦ Calculations on board. ◦ Were we correct? What type of error
might we have made?

Part III: Terminology and Two-Tail Tests

Our Assumptions
� We are taking a simple random sample. � We expect a normal sampling distribution.
For this we need our sample size n to satisfy both of the following: ◦ np0 ≥ 15 ◦ n(1-p0) ≥ 15
In other words, if you think in terms of a yes/no survey question, you need to reasonably expect at least 15 “yes”s and at least 15 “no”s.

The Null Hypothesis
� The null hypothesis is the claim that is to be investigated. (This gives us our hypothetical sampling distribution.)
� The claim is that the population proportion is equal to some value p0.
� We use the notation H0 : p = p0.
The Alternative Hypothesis
� The alternative hypothesis is the conclusion we will reach if we reject to null hypothesis.
� For a two-tail P-value test, we use the notation Ha : p ≠ p0.

An Example
� Recall the example when we had two dice and the casino claimed that the dice are fair, i.e., the probability of totaling 7 is 16.67%
� The null hypothesis: H0: p = 0.1667
� The alternative hypothesis: Ha: p ≠ 0.1667

Significance Level
� If the P-value of the sample proportion is less than a pre-specified cutoff, then we reject the claim.
� We have used 0.05 for this cutoff.
� This cutoff is called the significance level, and is denoted by α. So we might set α=0.05 or α=0.01.

Conclusion of Hypothesis Test
� If the P-value of the sample proportion is less than α, reject the null hypothesis, and conclude the alternative hypothesis is true. ◦ P-value < α → reject H0
� Otherwise, fail to reject the null hypothesis – it might be true, there is not enough evidence to conclude that the alternative hypothesis is true. ◦ P-value ≥ α → fail to reject H0
Hypothesis-Testing Steps
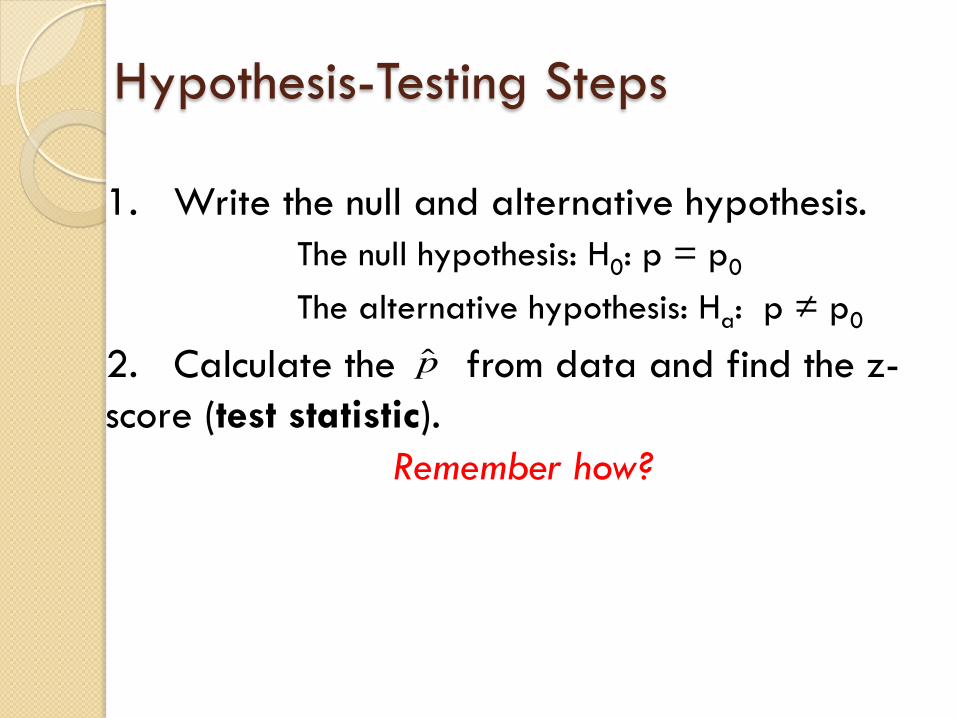
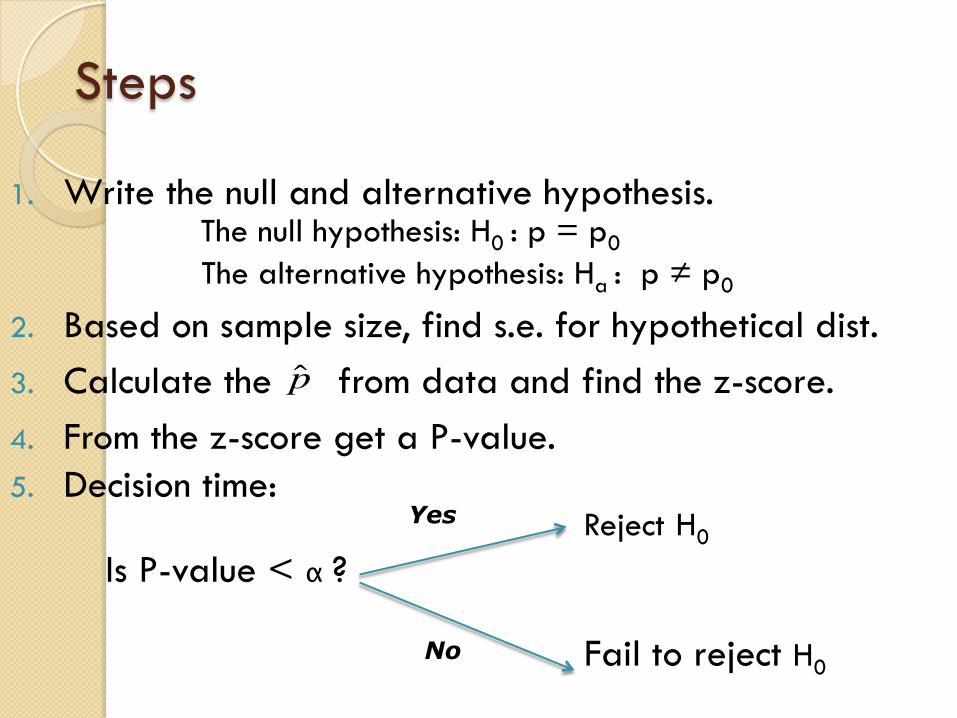
1. Write the null and alternative hypothesis. The null hypothesis: H0: p = p0
The alternative hypothesis: Ha: p ≠ p0
2. Calculate the from data and find the z-score (test statistic).
Remember how?
p̂

Steps (Step 2 details)
� We get z-scores by
Where for mean and standard deviation we use: ◦ mean = p0 ◦ standard deviation (called standard error) se
=
�p0(1� p0)
n
z = p̂− p0se

Steps
1. Write the null and alternative hypothesis. The null hypothesis: H0: p = p0
The alternative hypothesis: Ha: p ≠ p0
2. Calculate the from data and find the z-score. 3. From the z-score get a P-value.
Remember how?
p̂

Steps (Step 3 details)
� Given a z-score use Table A to calculate area.
A
z-score
Total Area= P-value
Will always DOUBLE area for a two-sided test. This total area is the P-value for your sample.
Steps (Step 3 details)
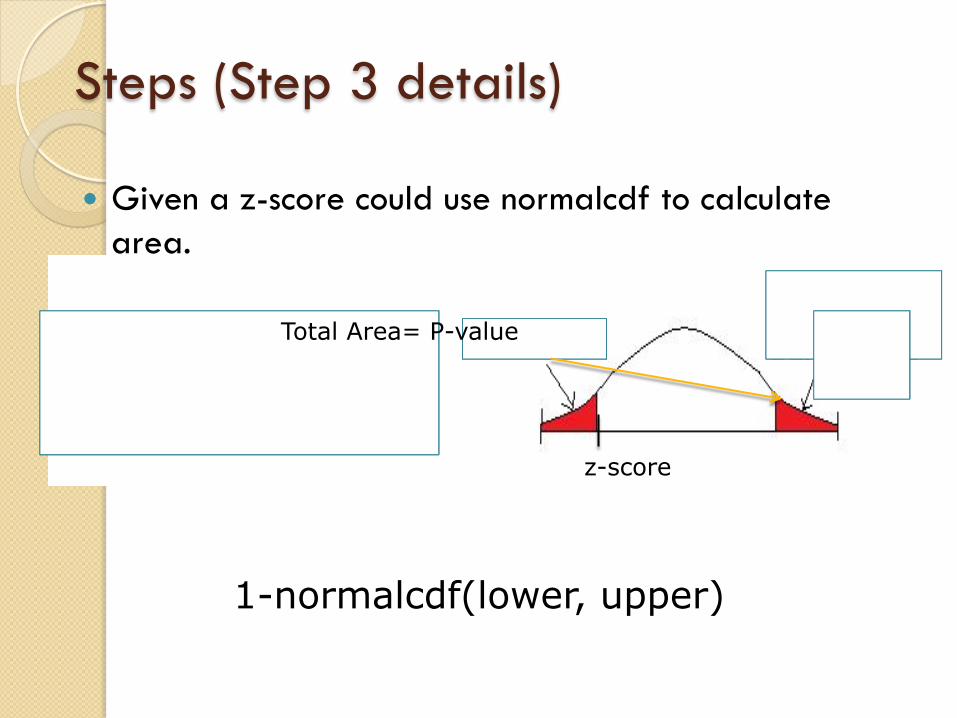
� Given a z-score could use normalcdf to calculate area.
A
z-score
Total Area= P-value
1-normalcdf(lower, upper)
Steps
1. Write the null and alternative hypothesis. The null hypothesis: H0 : p = p0
The alternative hypothesis: Ha : p ≠ p0
2. Based on sample size, find s.e. for hypothetical dist. 3. Calculate the from data and find the z-score. 4. From the z-score get a P-value. 5. Decision time:
Reject H0 Is P-value < α ? Fail to reject H0
p̂
Yes
No

Could We Have Made an Error?
� Yes, if we rejected H0 but in fact H0 is true that is a Type I error.
� If we failed to reject H0 when H0 was not true that is a Type II error.

One-Tail Test
� If a researcher, prior to taking the sample, has reason to believe that the proportion in the null hypothesis is too low, then Ha : p > p0.
� In this case, we use the one-tail (right-tail) P-value of the sample proportion.
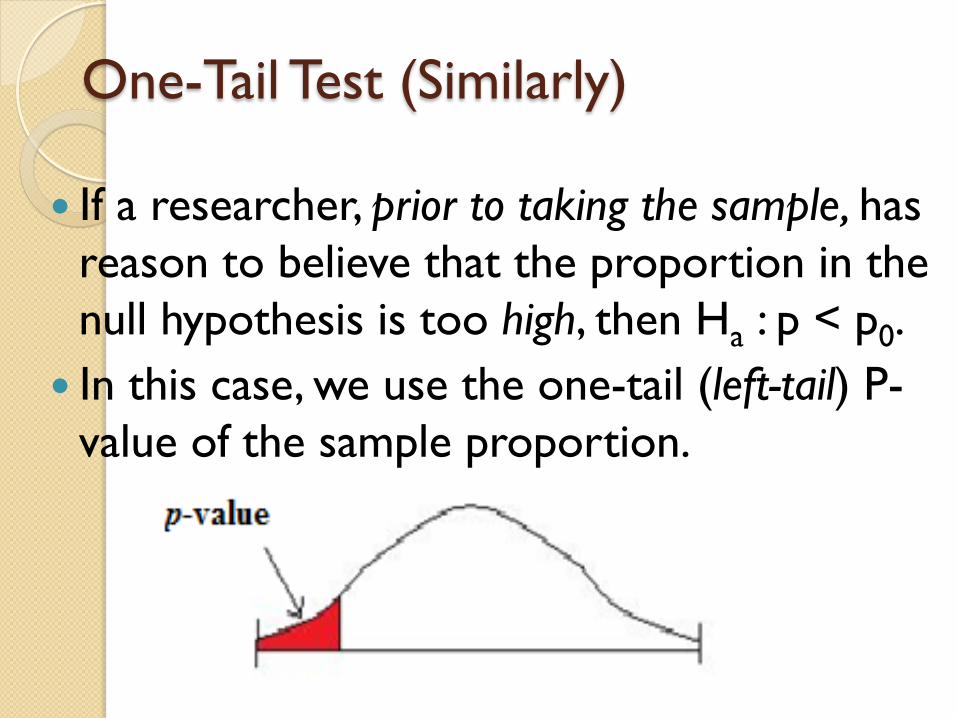
One-Tail Test (Similarly)
� If a researcher, prior to taking the sample, has reason to believe that the proportion in the null hypothesis is too high, then Ha : p < p0.
� In this case, we use the one-tail (left-tail) P-value of the sample proportion.
Worksheet - Example 1
The proportion of smokers among persons who graduated from a four-year college has been widely reported as 22%. A sociologist wonders if this is still true. a. Identify the population and parameter p the sociologist
wants to study. What is the null hypothesis?
b. What is the alternative hypothesis? (I.e., what does the sociologist wonder?)
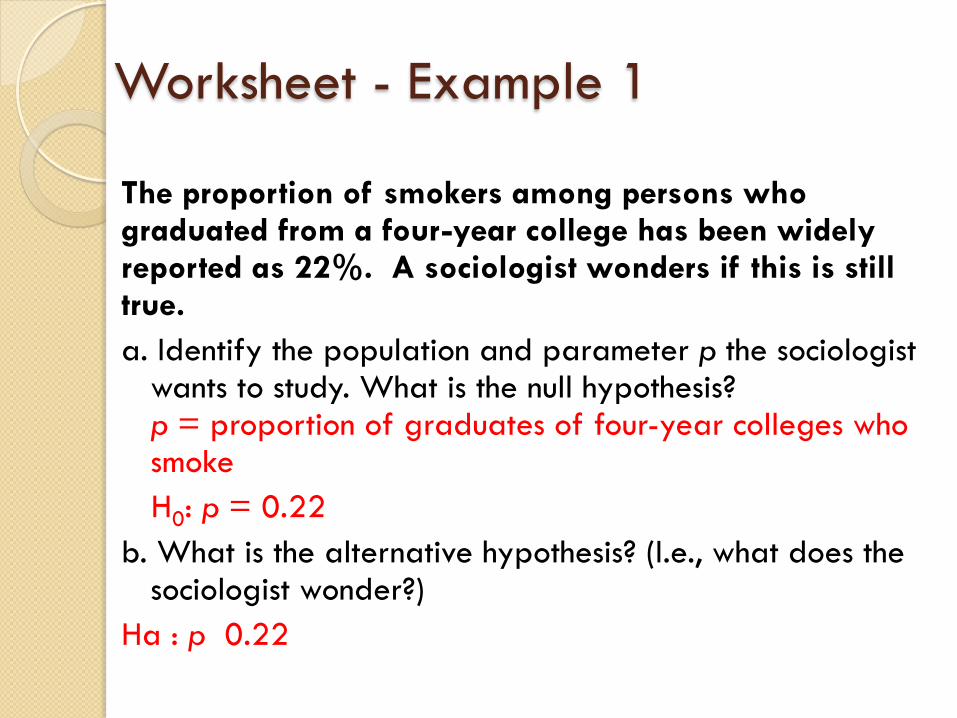
The proportion of smokers among persons who graduated from a four-year college has been widely reported as 22%. A sociologist wonders if this is still true. a. Identify the population and parameter p the sociologist
wants to study. What is the null hypothesis? p = proportion of graduates of four-year colleges who smoke H0: p = 0.22
b. What is the alternative hypothesis? (I.e., what does the sociologist wonder?)
Ha : p 0.22
Worksheet - Example 1

d. The sociologist plans to sample 785 college graduates. Her investigation will therefore be based on a hypothetical normal distribution with
mean ____ and standard error (se) _____ How do you know it’s a normal distribution?

d. The sociologist plans to sample 785 college graduates. Her investigation will therefore be based on a normal distribution with mean 0.22 and
standard error (se) How do you know it’s a normal distribution?
785*0.22 ≥15 and 785*0.78 ≥15.
0148.0785
)78(.22.0≈

Some time after setting up the claim to be investigated, the sociologist surveys a random sample of 785 college graduates and finds that 153 are smokers. e. Find p-hat from the data and draw a normal
curve showing where this sample falls in the distribution of all possible samples. Shade all the samples that are further away from the “claim” than this sample, consistent with Ha.
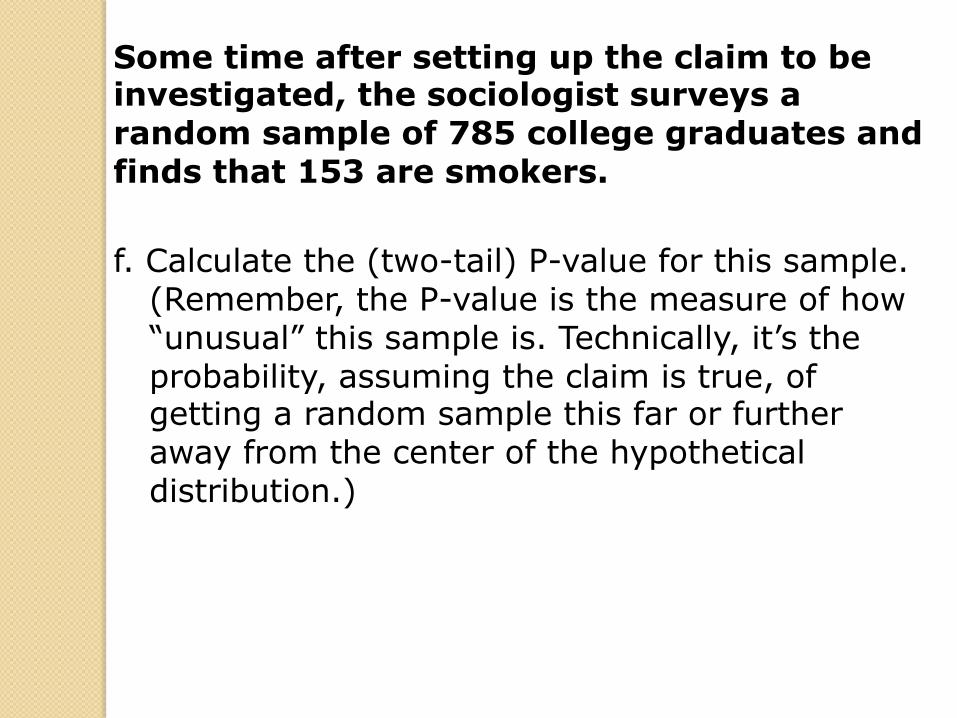
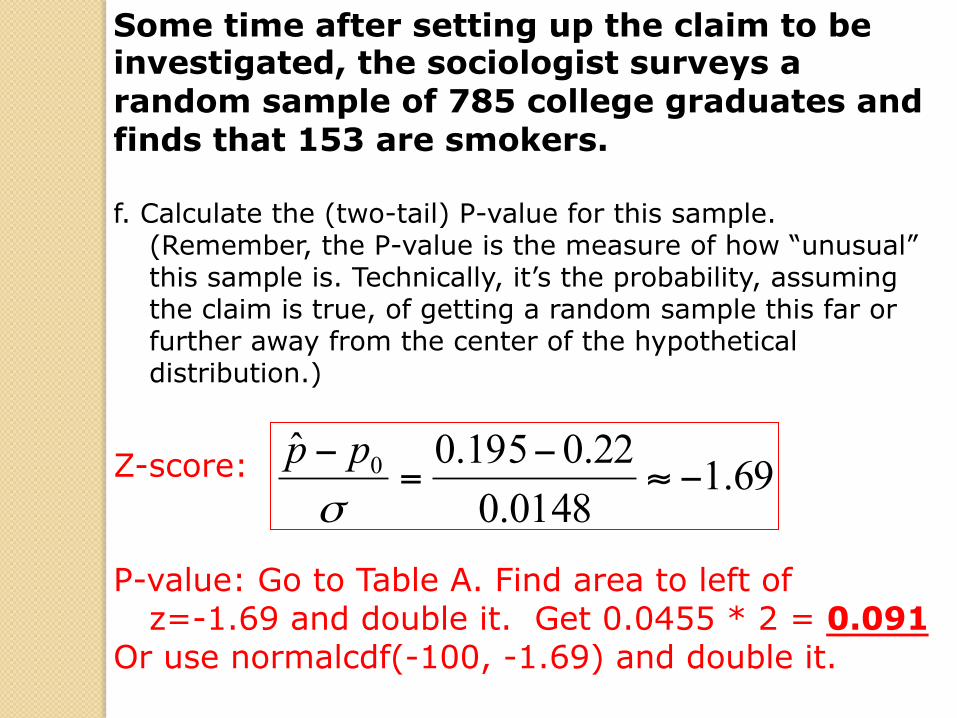
Some time after setting up the claim to be investigated, the sociologist surveys a random sample of 785 college graduates and finds that 153 are smokers. f. Calculate the (two-tail) P-value for this sample.
(Remember, the P-value is the measure of how “unusual” this sample is. Technically, it’s the probability, assuming the claim is true, of getting a random sample this far or further away from the center of the hypothetical distribution.)
Z-score: P-value: Go to Table A. Find area to left of
z=-1.69 and double it. Get 0.0455 * 2 = 0.091 Or use normalcdf(-100, -1.69) and double it.
69.10148.0
22.0195.0ˆ 0 −≈−
=−
σpp

(g, h, i). The researcher decided in advance to use a cutoff of = 0.05 in making her decision of whether or not to reject the claim. What is her decision, based on the P-value you calculated? Choose the correct answer. She did find enough evidence to conclude that p ≠ 0.22.
OR She did not find enough evidence to conclude that p ≠ 0.22.
α
Related Documents