Oklahoma State Regents for Higher Education Student Data Report 2006-07 Section III: Enrollments

Welcome message from author
This document is posted to help you gain knowledge. Please leave a comment to let me know what you think about it! Share it to your friends and learn new things together.
Transcript
Oklahoma State Regents for Higher Education Student Data Report
2006-07
Section III: Enrollments
Ten-Year Comparison of Annual Unduplicated Headcount Enrollment
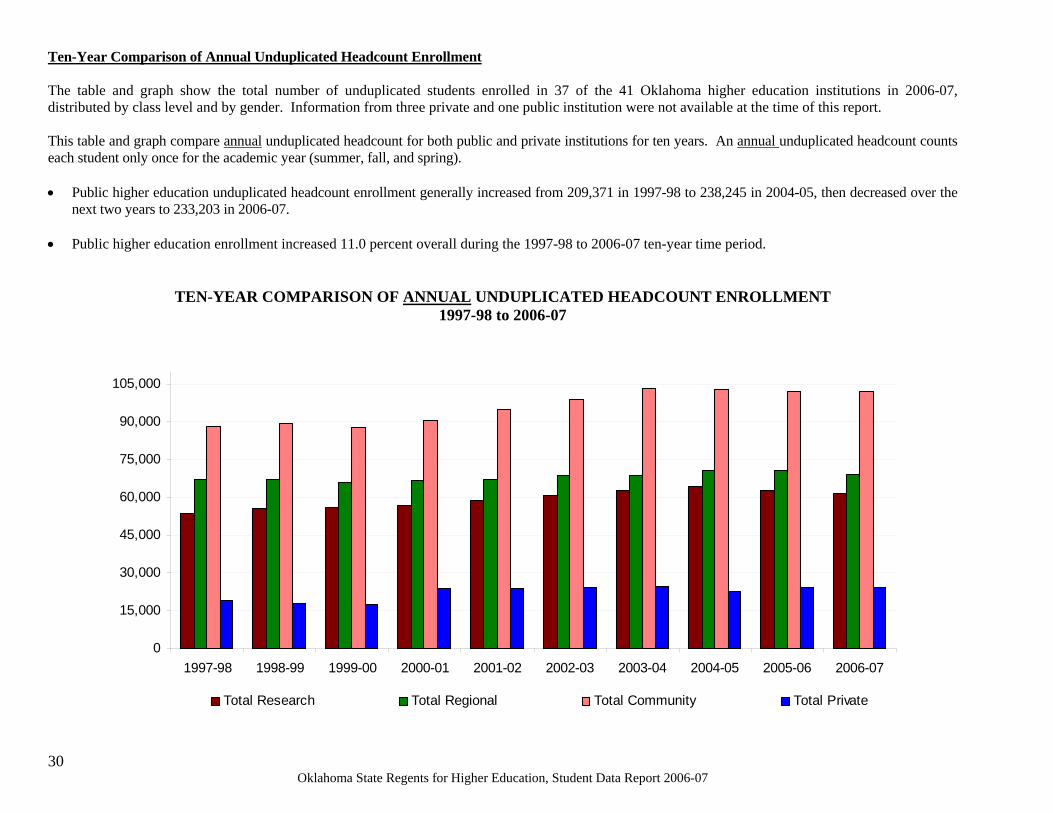
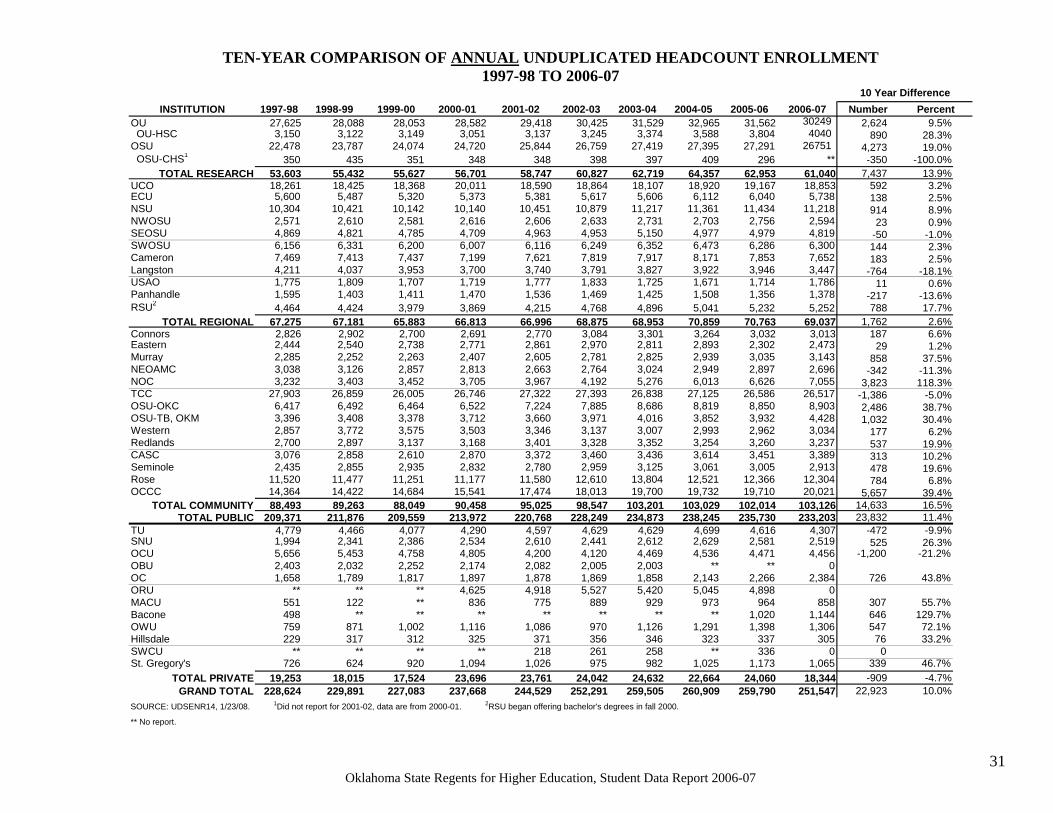
The table and graph show the total number of unduplicated students enrolled in 37 of the 41 Oklahoma higher education institutions in 2006-07, distributed by class level and by gender. Information from three private and one public institution were not available at the time of this report.
This table and graph compare annual unduplicated headcount for both public and private institutions for ten years. An annual unduplicated headcount counts each student only once for the academic year (summer, fall, and spring).
• Public higher education unduplicated headcount enrollment generally increased from 209,371 in 1997-98 to 238,245 in 2004-05, then decreased over the next two years to 233,203 in 2006-07.
• Public higher education enrollment increased 11.0 percent overall during the 1997-98 to 2006-07 ten-year time period.
TEN-YEAR COMPARISON OF ANNUAL UNDUPLICATED HEADCOUNT ENROLLMENT 1997-98 to 2006-07
105,000
90,000
75,000
60,000
45,000
30,000
15,000
0 1997-98 1998-99 1999-00 2000-01 2001-02 2002-03 2003-04 2004-05 2005-06 2006-07
Total Research Total Regional Total Community Total Private
30 Oklahoma State Regents for Higher Education, Student Data Report 2006-07
TEN-YEAR COMPARISON OF ANNUAL UNDUPLICATED HEADCOUNT ENROLLMENT 1997-98 TO 2006-07
10 Year Difference INSTITUTION 1997-98 1998-99 1999-00 2000-01 2001-02 2002-03 2003-04 2004-05 2005-06 2006-07 Number Percent
OU 27,625 28,088 28,053 28,582 29,418 30,425 31,529 32,965 31,562 30249 2,624 9.5% OU-HSC 3,150 3,122 3,149 3,051 3,137 3,245 3,374 3,588 3,804 4040 890 28.3% OSU 22,478 23,787 24,074 24,720 25,844 26,759 27,419 27,395 27,291 26751 4,273 19.0% OSU-CHS1 350 435 351 348 348 398 397 409 296 ** -350 -100.0%
TOTAL RESEARCH 53,603 55,432 55,627 56,701 58,747 60,827 62,719 64,357 62,953 61,040 7,437 13.9% UCO 18,261 18,425 18,368 20,011 18,590 18,864 18,107 18,920 19,167 18,853 592 3.2% ECU 5,600 5,487 5,320 5,373 5,381 5,617 5,606 6,112 6,040 5,738 138 2.5% NSU 10,304 10,421 10,142 10,140 10,451 10,879 11,217 11,361 11,434 11,218 914 8.9% NWOSU 2,571 2,610 2,581 2,616 2,606 2,633 2,731 2,703 2,756 2,594 23 0.9% SEOSU 4,869 4,821 4,785 4,709 4,963 4,953 5,150 4,977 4,979 4,819 -50 -1.0% SWOSU 6,156 6,331 6,200 6,007 6,116 6,249 6,352 6,473 6,286 6,300 144 2.3% Cameron 7,469 7,413 7,437 7,199 7,621 7,819 7,917 8,171 7,853 7,652 183 2.5% Langston 4,211 4,037 3,953 3,700 3,740 3,791 3,827 3,922 3,946 3,447 -764 -18.1% USAO 1,775 1,809 1,707 1,719 1,777 1,833 1,725 1,671 1,714 1,786 11 0.6% Panhandle 1,595 1,403 1,411 1,470 1,536 1,469 1,425 1,508 1,356 1,378 -217 -13.6% RSU2 4,464 4,424 3,979 3,869 4,215 4,768 4,896 5,041 5,232 5,252 788 17.7%
TOTAL REGIONAL 67,275 67,181 65,883 66,813 66,996 68,875 68,953 70,859 70,763 69,037 1,762 2.6% Connors 2,826 2,902 2,700 2,691 2,770 3,084 3,301 3,264 3,032 3,013 187 6.6% Eastern 2,444 2,540 2,738 2,771 2,861 2,970 2,811 2,893 2,302 2,473 29 1.2% Murray 2,285 2,252 2,263 2,407 2,605 2,781 2,825 2,939 3,035 3,143 858 37.5% NEOAMC 3,038 3,126 2,857 2,813 2,663 2,764 3,024 2,949 2,897 2,696 -342 -11.3% NOC 3,232 3,403 3,452 3,705 3,967 4,192 5,276 6,013 6,626 7,055 3,823 118.3% TCC 27,903 26,859 26,005 26,746 27,322 27,393 26,838 27,125 26,586 26,517 -1,386 -5.0% OSU-OKC 6,417 6,492 6,464 6,522 7,224 7,885 8,686 8,819 8,850 8,903 2,486 38.7% OSU-TB, OKM 3,396 3,408 3,378 3,712 3,660 3,971 4,016 3,852 3,932 4,428 1,032 30.4% Western 2,857 3,772 3,575 3,503 3,346 3,137 3,007 2,993 2,962 3,034 177 6.2% Redlands 2,700 2,897 3,137 3,168 3,401 3,328 3,352 3,254 3,260 3,237 537 19.9% CASC 3,076 2,858 2,610 2,870 3,372 3,460 3,436 3,614 3,451 3,389 313 10.2% Seminole 2,435 2,855 2,935 2,832 2,780 2,959 3,125 3,061 3,005 2,913 478 19.6% Rose 11,520 11,477 11,251 11,177 11,580 12,610 13,804 12,521 12,366 12,304 784 6.8% OCCC 14,364 14,422 14,684 15,541 17,474 18,013 19,700 19,732 19,710 20,021 5,657 39.4%
TOTAL COMMUNITY 88,493 89,263 88,049 90,458 95,025 98,547 103,201 103,029 102,014 103,126 14,633 16.5% TOTAL PUBLIC 209,371 211,876 209,559 213,972 220,768 228,249 234,873 238,245 235,730 233,203 23,832 11.4%
TU 4,779 4,466 4,077 4,290 4,597 4,629 4,629 4,699 4,616 4,307 -472 -9.9% SNU 1,994 2,341 2,386 2,534 2,610 2,441 2,612 2,629 2,581 2,519 525 26.3% OCU 5,656 5,453 4,758 4,805 4,200 4,120 4,469 4,536 4,471 4,456 -1,200 -21.2% OBU 2,403 2,032 2,252 2,174 2,082 2,005 2,003 ** ** 0 OC 1,658 1,789 1,817 1,897 1,878 1,869 1,858 2,143 2,266 2,384 726 43.8% ORU ** ** ** 4,625 4,918 5,527 5,420 5,045 4,898 0 MACU 551 122 ** 836 775 889 929 973 964 858 307 55.7% Bacone 498 ** ** ** ** ** ** ** 1,020 1,144 646 129.7% OWU 759 871 1,002 1,116 1,086 970 1,126 1,291 1,398 1,306 547 72.1% Hillsdale 229 317 312 325 371 356 346 323 337 305 76 33.2% SWCU ** ** ** ** 218 261 258 ** 336 0 0 St. Gregory's 726 624 920 1,094 1,026 975 982 1,025 1,173 1,065 339 46.7%
TOTAL PRIVATE 19,253 18,015 17,524 23,696 23,761 24,042 24,632 22,664 24,060 18,344 -909 -4.7% GRAND TOTAL 228,624 229,891 227,083 237,668 244,529 252,291 259,505 260,909 259,790 251,547 22,923 10.0%
SOURCE: UDSENR14, 1/23/08. 1Did not report for 2001-02, dat a are from 2000-01. 2RSU began offering bachelor's degrees in fall 2000.
** No report.
31
Oklahoma State Regents fo r Higher Education, Stude nt Data Report 2006-07
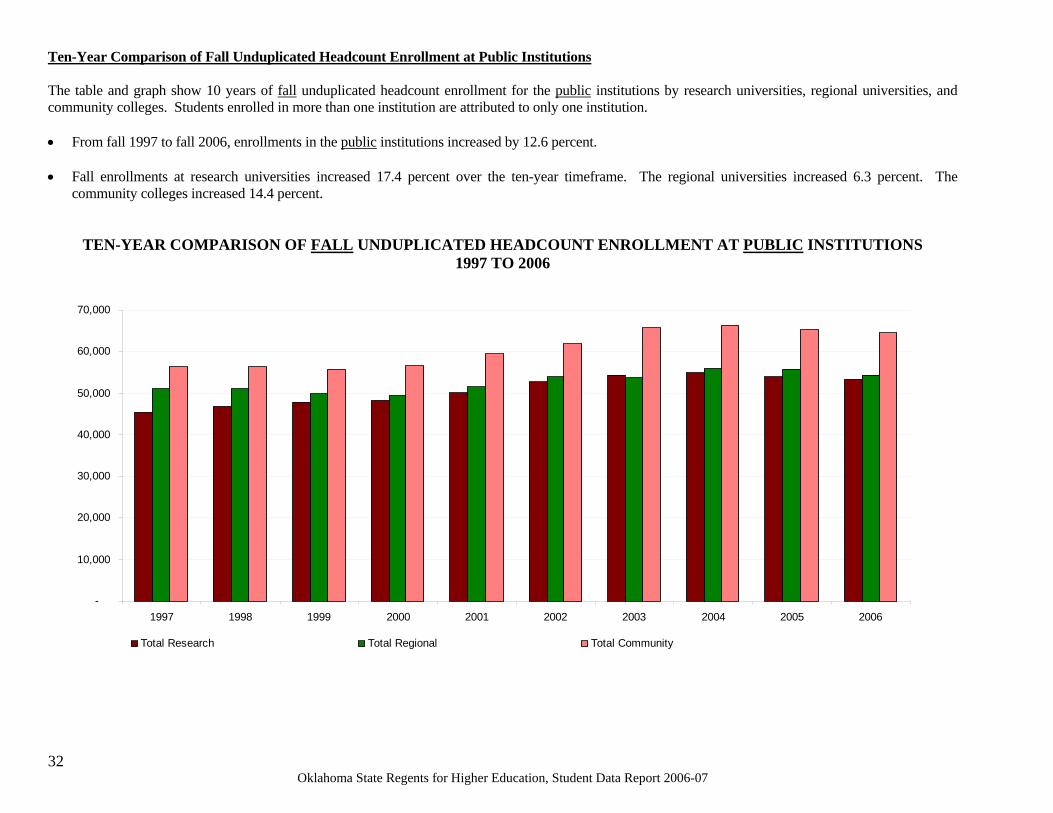
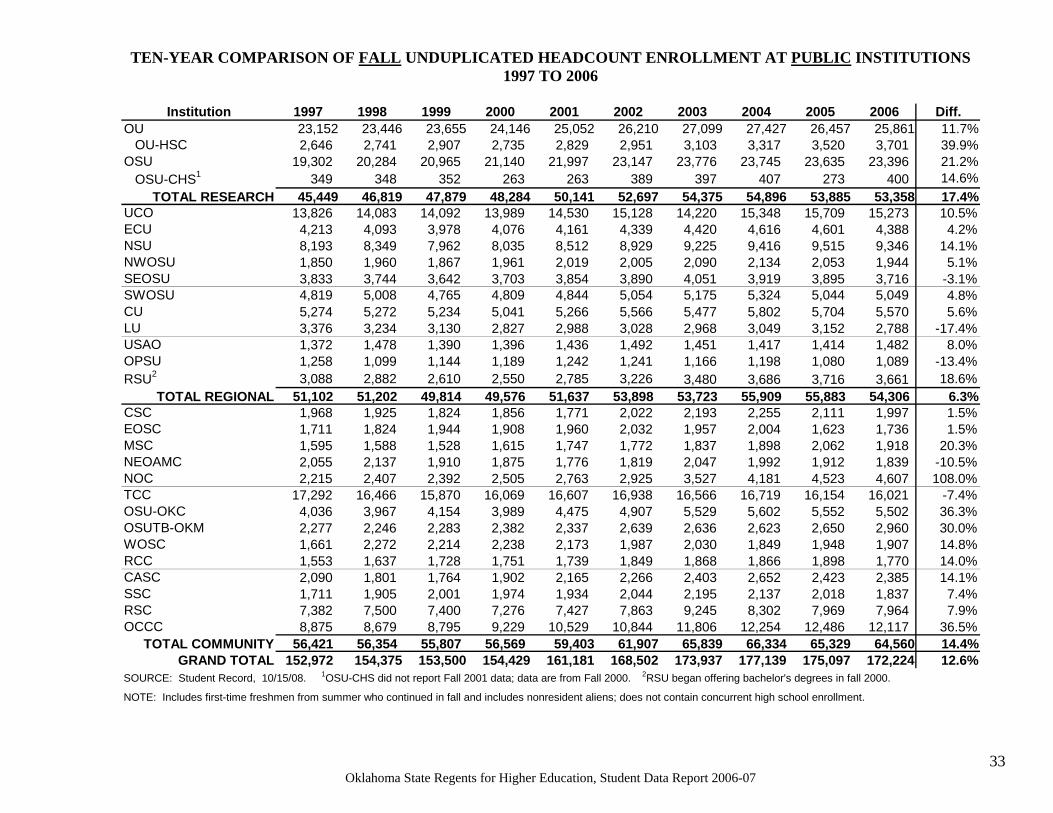
Ten-Year Comparison of Fall Unduplicated Headcount Enrollment at Public Institutions The table and graph show 10 years of fall unduplicated headcount enrollment for the public institutions by research universities, regional universities, and community colleges. Students enrolled in more than one institution are attributed to only one institution. • From fall 1997 to fall 2006, enrollments in the public institutions increased by 12.6 percent. • Fall enrollments at research universities increased 17.4 percent over the ten-year timeframe. The regional universities increased 6.3 percent. The
community colleges increased 14.4 percent.
TEN-YEAR COMPARISON OF FALL UNDUPLICATED HEADCOUNT ENROLLMENT AT PUBLIC INSTITUTIONS 1997 TO 2006
70,000
60,000
50,000
40,000
30,000
20,000
10,000
-1997 1998 1999 2000 2001 2002 2003 2004 2005 2006
Total Research Total Regional Total Community
32 Oklahoma State Regents fo r Higher Education, Stude nt Data Report 2006-07
33
TEN-YEAR COMPARISON OF FALL UNDUPLICATED HEADCOUNT ENROLLMENT AT PUBLIC INSTITUTIONS 1997 TO 2006
Institution
OU OU-HSCOSU OSU-CHS1
TOTAL RESEARCHUCO
1997 23,152 2,646 19,302 349 45,449 13,826
1998 23,446 2,741 20,284 348 46,819 14,083
1999 23,655 2,907 20,965 352 47,879 14,092
2000 24,146 2,735 21,140 263 48,284 13,989
2001 25,052 2,829 21,997 263 50,141 14,530
2002 26,210 2,951 23,147 389 52,697 15,128
2003 27,099 3,103 23,776 397 54,375 14,220
2004 27,427 3,317 23,745 407 54,896 15,348
2005 26,457 3,520 23,635 273 53,885 15,709
2006 Diff. 25,861 11.7% 3,701 39.9% 23,396 21.2% 400 14.6% 53,358 17.4% 15,273 10.5%
ECU 4,213 4,093 3,978 4,076 4,161 4,339 4,420 4,616 4,601 4,388 4.2%NSU 8,193 8,349 7,962 8,035 8,512 8,929 9,225 9,416 9,515 9,346 14.1%NWOSU 1,850 1,960 1,867 1,961 2,019 2,005 2,090 2,134 2,053 1,944 5.1%SEOSUSWOSUCULUUSAOOPSURSU2
TOTAL REGIONALCSC
3,833 4,819 5,274 3,376 1,372 1,258 3,088
51,102 1,968
3,744
5,008 5,272 3,234 1,478 1,099 2,882 51,202 1,925
3,642
4,765 5,234 3,130 1,390 1,144 2,610 49,814 1,824
3,703
4,809 5,041 2,827 1,396 1,189 2,550 49,576 1,856
3,854
4,844 5,266 2,988 1,436 1,242 2,785 51,637 1,771
3,890
5,054 5,566 3,028 1,492 1,241 3,226 53,898 2,022
4,051
5,175 5,477 2,968 1,451 1,166 3,480 53,723 2,193
3,919
5,324 5,802 3,049 1,417 1,198 3,686 55,909 2,255
3,895
5,044 5,704 3,152 1,414 1,080 3,716 55,883 2,111
3,716 -3.1%5,049 4.8%
5,570 5.6% 2,788 -17.4% 1,482 8.0% 1,089 -13.4% 3,661 18.6% 54,306 6.3% 1,997 1.5%
EOSC 1,711 1,824 1,944 1,908 1,960 2,032 1,957 2,004 1,623 1,736 1.5%MSC 1,595 1,588 1,528 1,615 1,747 1,772 1,837 1,898 2,062 1,918 20.3%NEOAMC 2,055 2,137 1,910 1,875 1,776 1,819 2,047 1,992 1,912 1,839 -10.5%NOCTCC
2,215 17,292
2,407 16,466
2,392 15,870
2,505 16,069
2,763 16,607
2,925 16,938
3,527 16,566
4,181 16,719
4,523 16,154
4,607 108.0% 16,021 -7.4%
OSU-OKC 4,036 3,967 4,154 3,989 4,475 4,907 5,529 5,602 5,552 5,502 36.3%OSUTB-OKM 2,277 2,246 2,283 2,382 2,337 2,639 2,636 2,623 2,650 2,960 30.0%WOSC 1,661 2,272 2,214 2,238 2,173 1,987 2,030 1,849 1,948 1,907 14.8%RCCCASCSSCRSCOCCC
TOTAL COMMUNITYGRAND TOTAL
SOURCE: Student Record, 10/
NOTE: Includes first-time fresh
1,553 2,090 1,711 7,382 8,875
56,421 152,972 15/08. 1OSU
men from summ
1,637 1,801 1,905 7,500 8,679 56,354 154,375 -CHS did not
er who contin
1,728 1,764 2,001 7,400 8,795 55,807 153,500
report Fall 2
ued in fall an
0
1,751 1,902 1,974 7,276 9,229 56,569 154,429
01 data; data
d includes no
1,739 2,165 1,934 7,427 10,529 59,403 161,181
are from Fall
nresident alie
1,849 2,266 2,044 7,863 10,844 61,907 168,502
2000. 2RS
ns; does not c
1,868 2,403 2,195 9,245 11,806 65,839 173,937
U began offeri
ontain concur
1,866 2,652 2,137 8,302 12,254 66,334 177,139
ng bachelor's
rent high sch
1,898 2,423 2,018 7,969 12,486 65,329 175,097
degrees in fall 2000.
ool enrollment.
1,770 14.0% 2,385 14.1% 1,837 7.4% 7,964 7.9% 12,117 36.5% 64,560 14.4% 172,224 12.6%
Oklahoma State Regents for Higher Education, Student Data Report 2006-07
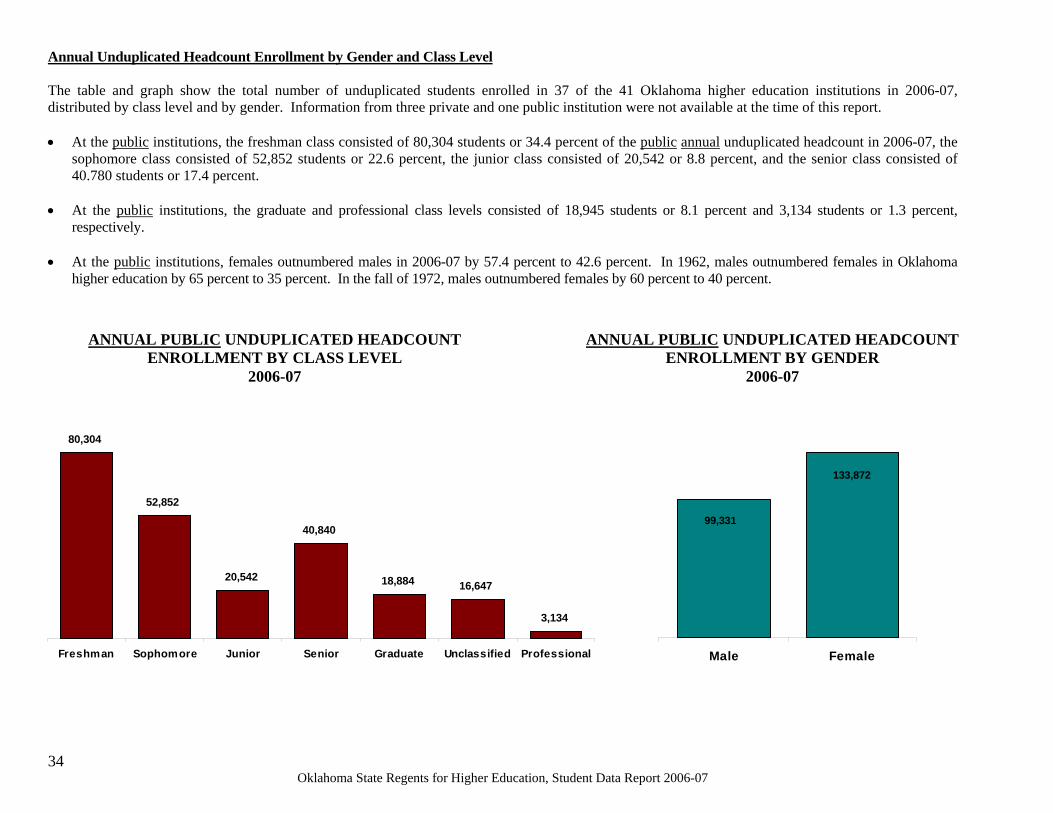
Annual Unduplicated Headcount Enrollment by Gender and Class Level The table and graph show the total number of unduplicated students enrolled in 37 of the 41 Oklahoma higher education institutions in 2006-07, distributed by class level and by gender. Information from three private and one public institution were not available at the time of this report. • At the public institutions, the freshman class consisted of 80,304 students or 34.4 percent of the public annual unduplicated headcount in 2006-07, the
sophomore class consisted of 52,852 students or 22.6 percent, the junior class consisted of 20,542 or 8.8 percent, and the senior class consisted of 40.780 students or 17.4 percent.
• At the public institutions, the graduate and professional class levels consisted of 18,945 students or 8.1 percent and 3,134 students or 1.3 percent,
respectively. • At the public institutions, females outnumbered males in 2006-07 by 57.4 percent to 42.6 percent. In 1962, males outnumbered females in Oklahoma
higher education by 65 percent to 35 percent. In the fall of 1972, males outnumbered females by 60 percent to 40 percent.
ANNUAL PUBLIC UNDUPLICATED HEADCOUNT ENROLLMENT BY CLASS LEVEL
2006-07
ANNUAL PUBLIC UNDUPLICATED HEADCOUNT ENROLLMENT BY GENDER
2006-07
80,304
52,852
20,542
40,840
18,884 16,647
3,134
Freshman Sophomore Junior Senior Graduate Unclassified Professional
133,872
99,331
Male Female
34 Oklahoma State Regents for Higher Education, Student Data Report 2006-07
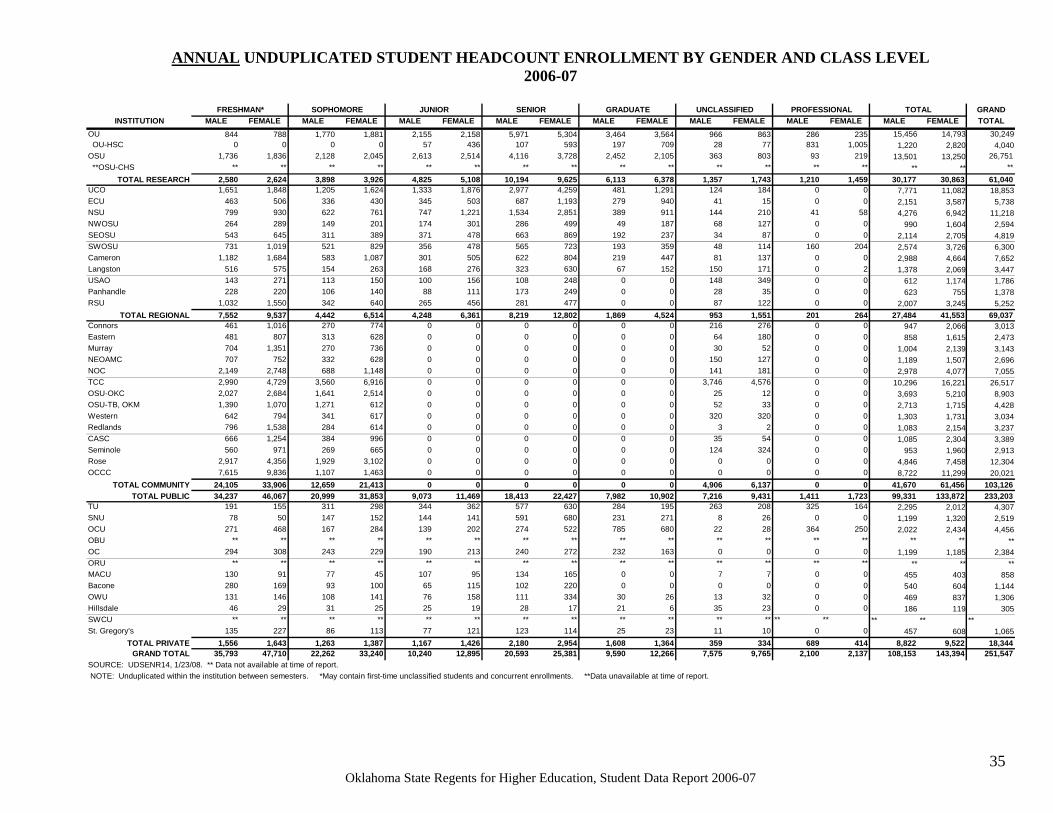
ANNUAL UNDUPLICATED STUDENT HEADCOUNT ENROLLMENT BY GENDER AND CLASS LEVEL
2006-07
FRESHMAN* SOPHOMORE JUNIOR SENIOR GRADUATE UNCLASSIFIED PROFESSIONAL TOTAL GRAND INSTITUTION MALE FEMALE MALE FEMALE MALE FEMALE MALE FEMALE MALE FEMALE MALE FEMALE MALE FEMALE MALE FEMALE TOTAL
OU 844 788 1,770 1,881 2,155 2,158 5,971 5,304 3,464 3,564 966 863 286 235 15,456 14,793 30,249 OU-HSC 0 0 0 0 57 436 107 593 197 709 28 77 831 1,005 1,220 2,820 4,040
OSU 1,736 1,836 2,128 2,045 2,613 2,514 4,116 3,728 2,452 2,105 363 803 93 219 13,501 13,250 26,751 **OSU-CHS ** ** ** ** ** ** ** ** ** ** ** ** ** ** ** ** **
TOTAL RESEARCH 2,580 2,624 3,898 3,926 4,825 5,108 10,194 9,625 6,113 6,378 1,357 1,743 1,210 1,459 30,177 30,863 61,040 UCO 1,651 1,848 1,205 1,624 1,333 1,876 2,977 4,259 481 1,291 124 184 0 0 7,771 11,082 18,853 ECU 463 506 336 430 345 503 687 1,193 279 940 41 15 0 0 2,151 3,587 5,738 NSU 799 930 622 761 747 1,221 1,534 2,851 389 911 144 210 41 58 4,276 6,942 11,218 NWOSU 264 289 149 201 174 301 286 499 49 187 68 127 0 0 990 1,604 2,594 SEOSU 543 645 311 389 371 478 663 869 192 237 34 87 0 0 2,114 2,705 4,819 SWOSU 731 1,019 521 829 356 478 565 723 193 359 48 114 160 204 2,574 3,726 6,300 Cameron 1,182 1,684 583 1,087 301 505 622 804 219 447 81 137 0 0 2,988 4,664 7,652 Langston 516 575 154 263 168 276 323 630 67 152 150 171 0 2 1,378 2,069 3,447 USAO 143 271 113 150 100 156 108 248 0 0 148 349 0 0 612 1,174 1,786 Panhandle 228 220 106 140 88 111 173 249 0 0 28 35 0 0 623 755 1,378 RSU 1,032 1,550 342 640 265 456 281 477 0 0 87 122 0 0 2,007 3,245 5,252
TOTAL REGIONAL 7,552 9,537 4,442 6,514 4,248 6,361 8,219 12,802 1,869 4,524 953 1,551 201 264 27,484 41,553 69,037 Connors 461 1,016 270 774 0 0 0 0 0 0 216 276 0 0 947 2,066 3,013 Eastern 481 807 313 628 0 0 0 0 0 0 64 180 0 0 858 1,615 2,473 Murray 704 1,351 270 736 0 0 0 0 0 0 30 52 0 0 1,004 2,139 3,143 NEOAMC 707 752 332 628 0 0 0 0 0 0 150 127 0 0 1,189 1,507 2,696 NOC 2,149 2,748 688 1,148 0 0 0 0 0 0 141 181 0 0 2,978 4,077 7,055 TCC 2,990 4,729 3,560 6,916 0 0 0 0 0 0 3,746 4,576 0 0 10,296 16,221 26,517 OSU-OKC 2,027 2,684 1,641 2,514 0 0 0 0 0 0 25 12 0 0 3,693 5,210 8,903 OSU-TB, OKM 1,390 1,070 1,271 612 0 0 0 0 0 0 52 33 0 0 2,713 1,715 4,428 Western 642 794 341 617 0 0 0 0 0 0 320 320 0 0 1,303 1,731 3,034 Redlands 796 1,538 284 614 0 0 0 0 0 0 3 2 0 0 1,083 2,154 3,237 CASC 666 1,254 384 996 0 0 0 0 0 0 35 54 0 0 1,085 2,304 3,389 Seminole 560 971 269 665 0 0 0 0 0 0 124 324 0 0 953 1,960 2,913 Rose 2,917 4,356 1,929 3,102 0 0 0 0 0 0 0 0 0 0 4,846 7,458 12,304 OCCC 7,615 9,836 1,107 1,463 0 0 0 0 0 0 0 0 0 0 8,722 11,299 20,021
TOTAL COMMUNITY 24,105 33,906 12,659 21,413 0 0 0 0 0 0 4,906 6,137 0 0 41,670 61,456 103,126 TOTAL PUBLIC 34,237 46,067 20,999 31,853 9,073 11,469 18,413 22,427 7,982 10,902 7,216 9,431 1,411 1,723 99,331 133,872 233,203
TU 191 155 311 298 344 362 577 630 284 195 263 208 325 164 2,295 2,012 4,307 SNU 78 50 147 152 144 141 591 680 231 271 8 26 0 0 1,199 1,320 2,519 OCU 271 468 167 284 139 202 274 522 785 680 22 28 364 250 2,022 2,434 4,456 OBU ** ** ** ** ** ** ** ** ** ** ** ** ** ** ** ** ** OC 294 308 243 229 190 213 240 272 232 163 0 0 0 0 1,199 1,185 2,384 ORU ** ** ** ** ** ** ** ** ** ** ** ** ** ** ** ** ** MACU 130 91 77 45 107 95 134 165 0 0 7 7 0 0 455 403 858 Bacone 280 169 93 100 65 115 102 220 0 0 0 0 0 0 540 604 1,144 OWU 131 146 108 141 76 158 111 334 30 26 13 32 0 0 469 837 1,306 Hillsdale 46 29 31 25 25 19 28 17 21 6 35 23 0 0 186 119 305 SWCU ** ** ** ** ** ** ** ** ** ** ** ** ** ** ** ** ** St. Gregory's 135 227 86 113 77 121 123 114 25 23 11 10 0 0 457 608 1,065
TOTAL PRIVATE 1,556 1,643 1,263 1,387 1,167 1,426 2,180 2,954 1,608 1,364 359 334 689 414 8,822 9,522 18,344 GRAND TOTAL 35,793 47,710 22,262 33,240 10,240 12,895 20,593 25,381 9,590 12,266 7,575 9,765 2,100 2,137 108,153 143,394 251,547
SOURCE: UDSENR14, 1/23/08. ** Data not available at time of report.
NOTE: Unduplicated within the institution between semesters. *May contain first-time unclassified students and concurrent enrollments. **Data unavailable at time of report.
Oklahoma State Regents for Higher Education, Student Data Report 2006-07 35
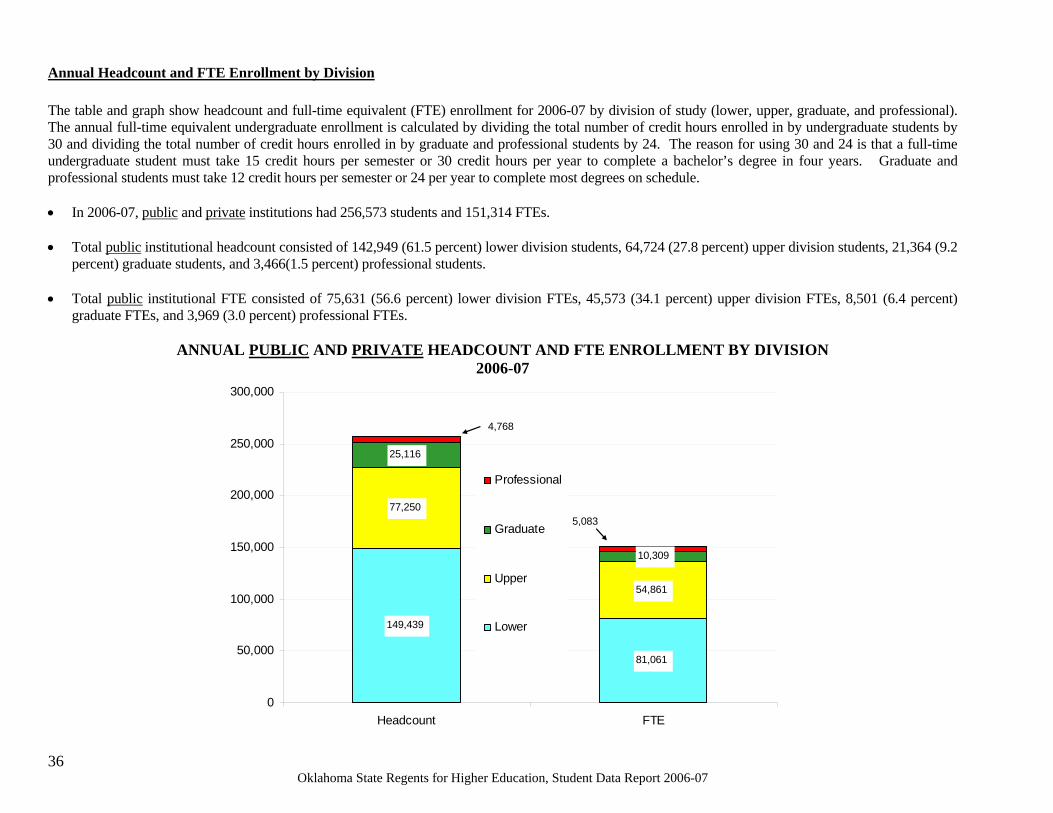
Annual Headcount and FTE Enroll ment by Division The table and graph show headcount and full-time equivalent (FTE) enrollment for 2006-07 by division o f study (lower, upper, graduate, and professional). The annual full-time equivalent und ergraduate enrollment is calculated by dividing the total number of credit hours enrolled in by undergraduate students by 30 and dividing the total number o f credit hours enrolled in by graduate and professional students by 24. The reason for using 30 and 24 is that a full-time undergraduate student must take 15 credit hours per semester or 30 credit hours per year to complete a bachelor’s degree in four years. Graduate and professional students must take 12 credit hours per semester or 24 per year to complete most degrees on schedule. • In 2006-07, public and private institutions had 256,573 students and 151,314 FTEs. • Total public institutional headcount consisted of 142,949 (61.5 percent) lower division student s, 64,724 (27.8 percent) upper division students, 21,364 (9.2
percent) graduate students, and 3,466(1.5 percent) professional students. • Total public institutional FTE consisted of 75,631 (56.6 percent) lower division FTEs, 45,573 (34.1 percent) upper division FTEs, 8,501 (6.4 percent)
graduate FTEs, and 3,969 (3.0 percent) professional FTEs.
ANNUAL PUBLIC AND PRIVATE HEADCOUNT AND FTE ENROLLMENT BY DIVISION 2006-07
300,000
4,768
250,000
200,000
150,000
100,000
50,000
0
149,439
81,061
77,250
54,861
25,116
10,309
5,083
Headcount FTE
Professional
Graduate
Upper
Lower
Oklahoma State Regents fo r Higher Education, Stude nt Data Report 2006-07 36
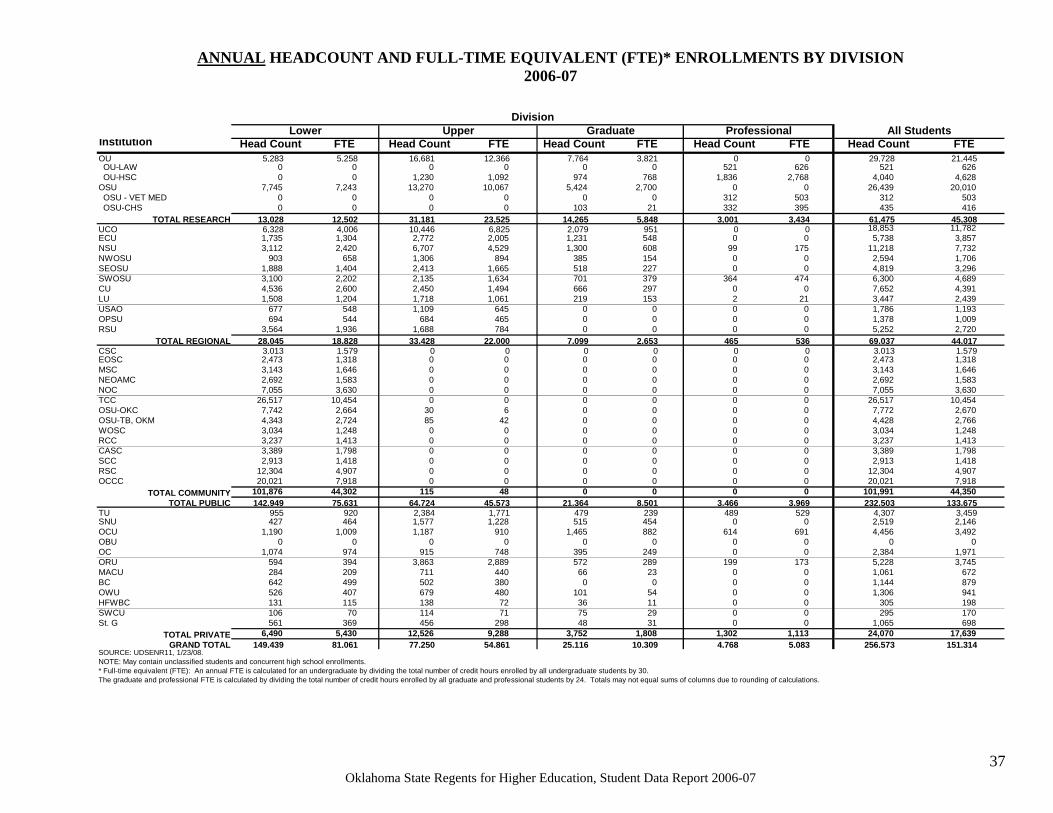
ANNUAL HEADCOUNT AND FULL-TIME EQUIVALENT (FTE)* ENROLLMENTS BY DIVISION
2006-07
Division Lower Upper Graduate Professional All Students
Institution Head Count FTE Head Count FTE Head Count FTE Head Count FTE Head Count FTE OU 5,283 5,258 16,681 12,366 7,764 3,821 0 0 29,728 21,445 OU-LAW 0 0 0 0 0 0 521 626 521 626 OU-HSC 0 0 1,230 1,092 974 768 1,836 2,768 4,040 4,628
OSU 7,745 7,243 13,270 10,067 5,424 2,700 0 0 26,439 20,010 OSU - VET MED 0 0 0 0 0 0 312 503 312 503 OSU-CHS 0 0 0 0 103 21 332 395 435 416
TOTAL RESEARCH 13,028 12,502 31,181 23,525 14,265 5,848 3,001 3,434 61,475 45,308 UCO 6,328 4,006 10,446 6,825 2,079 951 0 0 18,853 11,782 ECU 1,735 1,304 2,772 2,005 1,231 548 0 0 5,738 3,857 NSU 3,112 2,420 6,707 4,529 1,300 608 99 175 11,218 7,732 NWOSU 903 658 1,306 894 385 154 0 0 2,594 1,706 SEOSU 1,888 1,404 2,413 1,665 518 227 0 0 4,819 3,296 SWOSU 3,100 2,202 2,135 1,634 701 379 364 474 6,300 4,689 CU 4,536 2,600 2,450 1,494 666 297 0 0 7,652 4,391 LU 1,508 1,204 1,718 1,061 219 153 2 21 3,447 2,439 USAO 677 548 1,109 645 0 0 0 0 1,786 1,193 OPSU 694 544 684 465 0 0 0 0 1,378 1,009 RSU 3,564 1,936 1,688 784 0 0 0 0 5,252 2,720
TOTAL REGIONAL 28,045 18,828 33,428 22,000 7,099 2,653 465 536 69,037 44,017 CSC 3,013 1,579 0 0 0 0 0 0 3,013 1,579 EOSC 2,473 1,318 0 0 0 0 0 0 2,473 1,318 MSC 3,143 1,646 0 0 0 0 0 0 3,143 1,646 NEOAMC 2,692 1,583 0 0 0 0 0 0 2,692 1,583 NOC 7,055 3,630 0 0 0 0 0 0 7,055 3,630 TCC 26,517 10,454 0 0 0 0 0 0 26,517 10,454 OSU-OKC 7,742 2,664 30 6 0 0 0 0 7,772 2,670 OSU-TB, OKM 4,343 2,724 85 42 0 0 0 0 4,428 2,766 WOSC 3,034 1,248 0 0 0 0 0 0 3,034 1,248 RCC 3,237 1,413 0 0 0 0 0 0 3,237 1,413 CASC 3,389 1,798 0 0 0 0 0 0 3,389 1,798 SCC 2,913 1,418 0 0 0 0 0 0 2,913 1,418 RSC 12,304 4,907 0 0 0 0 0 0 12,304 4,907 OCCC 20,021 7,918 0 0 0 0 0 0 20,021 7,918
TOTAL COMMUNITY 101,876 44,302 115 48 0 0 0 0 101,991 44,350 TOTAL PUBLIC 142,949 75,631 64,724 45,573 21,364 8,501 3,466 3,969 232,503 133,675
TU 955 920 2,384 1,771 479 239 489 529 4,307 3,459 SNU 427 464 1,577 1,228 515 454 0 0 2,519 2,146 OCU 1,190 1,009 1,187 910 1,465 882 614 691 4,456 3,492 OBU 0 0 0 0 0 0 0 0 0 0 OC 1,074 974 915 748 395 249 0 0 2,384 1,971 ORU 594 394 3,863 2,889 572 289 199 173 5,228 3,745 MACU 284 209 711 440 66 23 0 0 1,061 672 BC 642 499 502 380 0 0 0 0 1,144 879 OWU 526 407 679 480 101 54 0 0 1,306 941 HFWBC 131 115 138 72 36 11 0 0 305 198 SWCU 106 70 114 71 75 29 0 0 295 170 St. G 561 369 456 298 48 31 0 0 1,065 698
TOTAL PRIVATE 6,490 5,430 12,526 9,288 3,752 1,808 1,302 1,113 24,070 17,639 GRAND TOTAL 149,439 81,061 77,250 54,861 25,116 10,309 4,768 5,083 256,573 151,314
SOURCE: UDSENR11, 1/23/08.
NOTE: May contain unclassified students and concurrent high school enrollments.
* Full-time equivalent (FTE): An annual FTE is calculated for an undergraduate by dividing the total number of credit hours enrolled by all undergraduate students by 30.
The graduate and professional FTE is calculated by dividing the total number of credit hours enrolled by all graduate and professional students by 24. Totals may not equal sums of columns due to rounding of calculations.
Oklahoma State Regents for Higher Education, Student Data Report 2006-07 37
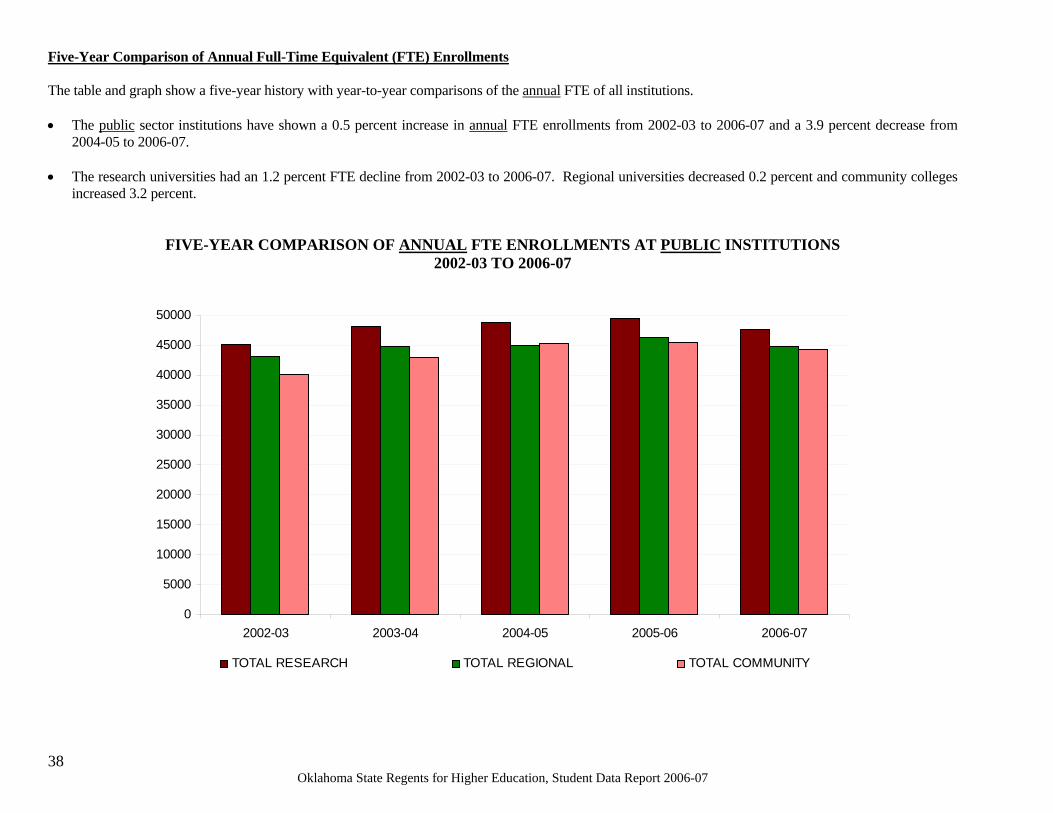
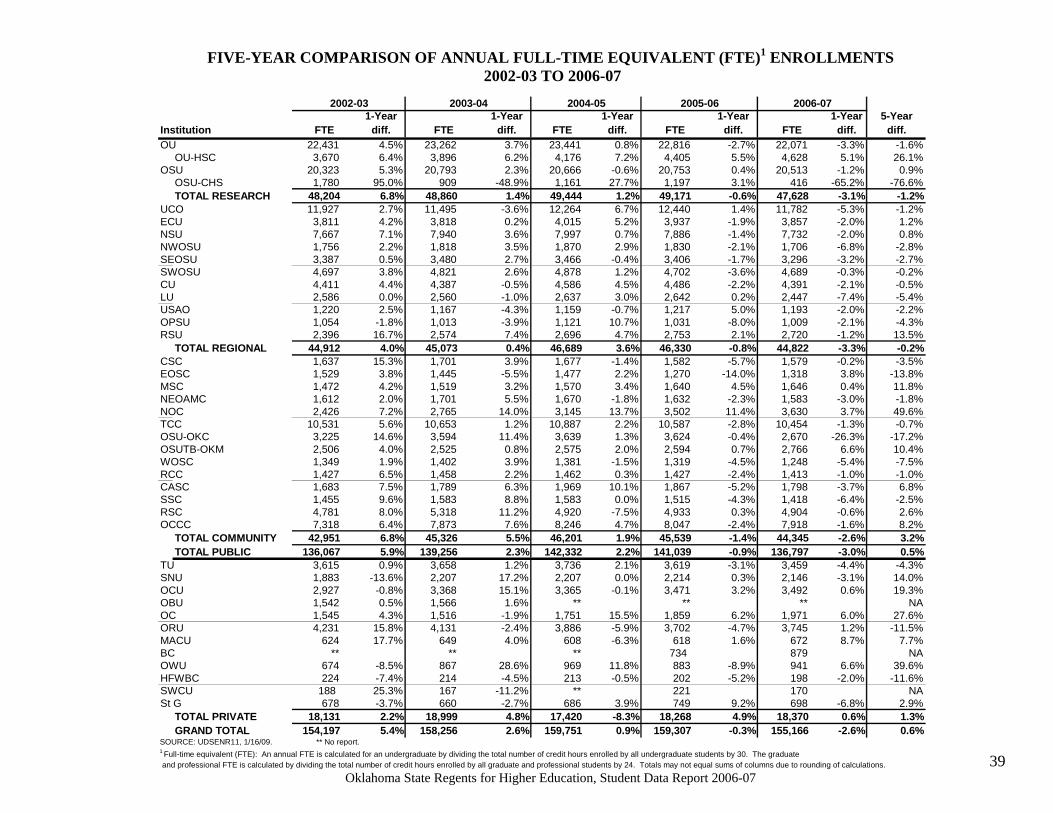
Five-Year Comparison of Annual Full-Time Equivalent (FTE) Enrollments The table and graph sho w a five-year history with year-to-year comparisons of the annual FTE of all institutions. • The pub lic sector institutions have shown a 0.5 percent increase in annual FTE enrollments from 2002-03 to 2006-07 and a 3.9 percent decrease fro m
2004-05 to 2006-07. • The research universities had an 1.2 percent FTE decline from 2002-03 to 2006-07. Regional universities decreased 0.2 percent and community colleges
increased 3.2 percent.
FIVE-YEAR COMPARISON OF ANNUAL FTE ENROLLMENTS AT PUBLIC INSTITUTIONS 2002-03 TO 2006-07
2002-03 2003-04 2004-05 2005-06 2006-07
TOTAL RESEARCH TOTAL REGIONAL TOTAL COMMUNITY
0
5000
10000
15000
20000
25000
30000
35000
40000
45000
50000
Oklahoma State Regents fo r Higher Education, Stude nt Data Report 2006-07 38
FIVE-YEAR COMPARISON OF ANNUAL FULL-TIME EQUIVALENT (FTE)1 ENROLLMENTS
2002-03 TO 2006-07
2002-03 2003-04 2004-05 2005-06 2006-07 1-Year 1-Year 1-Year 1-Year 1-Year 5-Year
Institution FTE diff. FTE diff. FTE diff. FTE diff. FTE diff. diff. OU 22,431 4.5% 23,262 3.7% 23,441 0.8% 22,816 -2.7% 22,071 -3.3% -1.6%
OU-HSC 3,670 6.4% 3,896 6.2% 4,176 7.2% 4,405 5.5% 4,628 5.1% 26.1% OSU 20,323 5.3% 20,793 2.3% 20,666 -0.6% 20,753 0.4% 20,513 -1.2% 0.9%
OSU-CHS 1,780 95.0% 909 -48.9% 1,161 27.7% 1,197 3.1% 416 -65.2% -76.6% TOTAL RESEARCH 48,204 6.8% 48,860 1.4% 49,444 1.2% 49,171 -0.6% 47,628 -3.1% -1.2%
UCO 11,927 2.7% 11,495 -3.6% 12,264 6.7% 12,440 1.4% 11,782 -5.3% -1.2% ECU 3,811 4.2% 3,818 0.2% 4,015 5.2% 3,937 -1.9% 3,857 -2.0% 1.2% NSU 7,667 7.1% 7,940 3.6% 7,997 0.7% 7,886 -1.4% 7,732 -2.0% 0.8% NWOSU 1,756 2.2% 1,818 3.5% 1,870 2.9% 1,830 -2.1% 1,706 -6.8% -2.8% SEOSU 3,387 0.5% 3,480 2.7% 3,466 -0.4% 3,406 -1.7% 3,296 -3.2% -2.7% SWOSU 4,697 3.8% 4,821 2.6% 4,878 1.2% 4,702 -3.6% 4,689 -0.3% -0.2% CU 4,411 4.4% 4,387 -0.5% 4,586 4.5% 4,486 -2.2% 4,391 -2.1% -0.5% LU 2,586 0.0% 2,560 -1.0% 2,637 3.0% 2,642 0.2% 2,447 -7.4% -5.4% USAO 1,220 2.5% 1,167 -4.3% 1,159 -0.7% 1,217 5.0% 1,193 -2.0% -2.2% OPSU 1,054 -1.8% 1,013 -3.9% 1,121 10.7% 1,031 -8.0% 1,009 -2.1% -4.3% RSU 2,396 16.7% 2,574 7.4% 2,696 4.7% 2,753 2.1% 2,720 -1.2% 13.5%
TOTAL REGIONAL 44,912 4.0% 45,073 0.4% 46,689 3.6% 46,330 -0.8% 44,822 -3.3% -0.2% CSC 1,637 15.3% 1,701 3.9% 1,677 -1.4% 1,582 -5.7% 1,579 -0.2% -3.5% EOSC 1,529 3.8% 1,445 -5.5% 1,477 2.2% 1,270 -14.0% 1,318 3.8% -13.8% MSC 1,472 4.2% 1,519 3.2% 1,570 3.4% 1,640 4.5% 1,646 0.4% 11.8% NEOAMC 1,612 2.0% 1,701 5.5% 1,670 -1.8% 1,632 -2.3% 1,583 -3.0% -1.8% NOC 2,426 7.2% 2,765 14.0% 3,145 13.7% 3,502 11.4% 3,630 3.7% 49.6% TCC 10,531 5.6% 10,653 1.2% 10,887 2.2% 10,587 -2.8% 10,454 -1.3% -0.7% OSU-OKC 3,225 14.6% 3,594 11.4% 3,639 1.3% 3,624 -0.4% 2,670 -26.3% -17.2% OSUTB-OKM 2,506 4.0% 2,525 0.8% 2,575 2.0% 2,594 0.7% 2,766 6.6% 10.4% WOSC 1,349 1.9% 1,402 3.9% 1,381 -1.5% 1,319 -4.5% 1,248 -5.4% -7.5% RCC 1,427 6.5% 1,458 2.2% 1,462 0.3% 1,427 -2.4% 1,413 -1.0% -1.0% CASC 1,683 7.5% 1,789 6.3% 1,969 10.1% 1,867 -5.2% 1,798 -3.7% 6.8% SSC 1,455 9.6% 1,583 8.8% 1,583 0.0% 1,515 -4.3% 1,418 -6.4% -2.5% RSC 4,781 8.0% 5,318 11.2% 4,920 -7.5% 4,933 0.3% 4,904 -0.6% 2.6% OCCC 7,318 6.4% 7,873 7.6% 8,246 4.7% 8,047 -2.4% 7,918 -1.6% 8.2%
TOTAL COMMUNITY 42,951 6.8% 45,326 5.5% 46,201 1.9% 45,539 -1.4% 44,345 -2.6% 3.2% TOTAL PUBLIC 136,067 5.9% 139,256 2.3% 142,332 2.2% 141,039 -0.9% 136,797 -3.0% 0.5%
TU 3,615 0.9% 3,658 1.2% 3,736 2.1% 3,619 -3.1% 3,459 -4.4% -4.3% SNU 1,883 -13.6% 2,207 17.2% 2,207 0.0% 2,214 0.3% 2,146 -3.1% 14.0% OCU 2,927 -0.8% 3,368 15.1% 3,365 -0.1% 3,471 3.2% 3,492 0.6% 19.3% OBU 1,542 0.5% 1,566 1.6% ** ** ** NA OC 1,545 4.3% 1,516 -1.9% 1,751 15.5% 1,859 6.2% 1,971 6.0% 27.6% ORU 4,231 15.8% 4,131 -2.4% 3,886 -5.9% 3,702 -4.7% 3,745 1.2% -11.5% MACU 624 17.7% 649 4.0% 608 -6.3% 618 1.6% 672 8.7% 7.7% BC ** ** ** 734 879 NA OWU 674 -8.5% 867 28.6% 969 11.8% 883 -8.9% 941 6.6% 39.6% HFWBC 224 -7.4% 214 -4.5% 213 -0.5% 202 -5.2% 198 -2.0% -11.6% SWCU 188 25.3% 167 -11.2% ** 221 170 NA St G 678 -3.7% 660 -2.7% 686 3.9% 749 9.2% 698 -6.8% 2.9%
TOTAL PRIVATE 18,131 2.2% 18,999 4.8% 17,420 -8.3% 18,268 4.9% 18,370 0.6% 1.3% GRAND TOTAL 154,197 5.4% 158,256 2.6% 159,751 0.9% 159,307 -0.3% 155,166 -2.6% 0.6%
SOURCE: UDSENR11, 1/16/09. ** No report. 1 Full-time equivalent (FTE): An annual FTE is calculated for an undergraduate by dividing the total number of credit hours enrolled by all undergraduate students by 30. The graduate and professional FTE is calculated by dividing the total number of credit hours enrolled by all graduate and professional students by 24. Totals may not equal sums of columns due to rounding of calculations.
Oklahoma State Regents for Higher Education, Student Data Report 2006-07
39
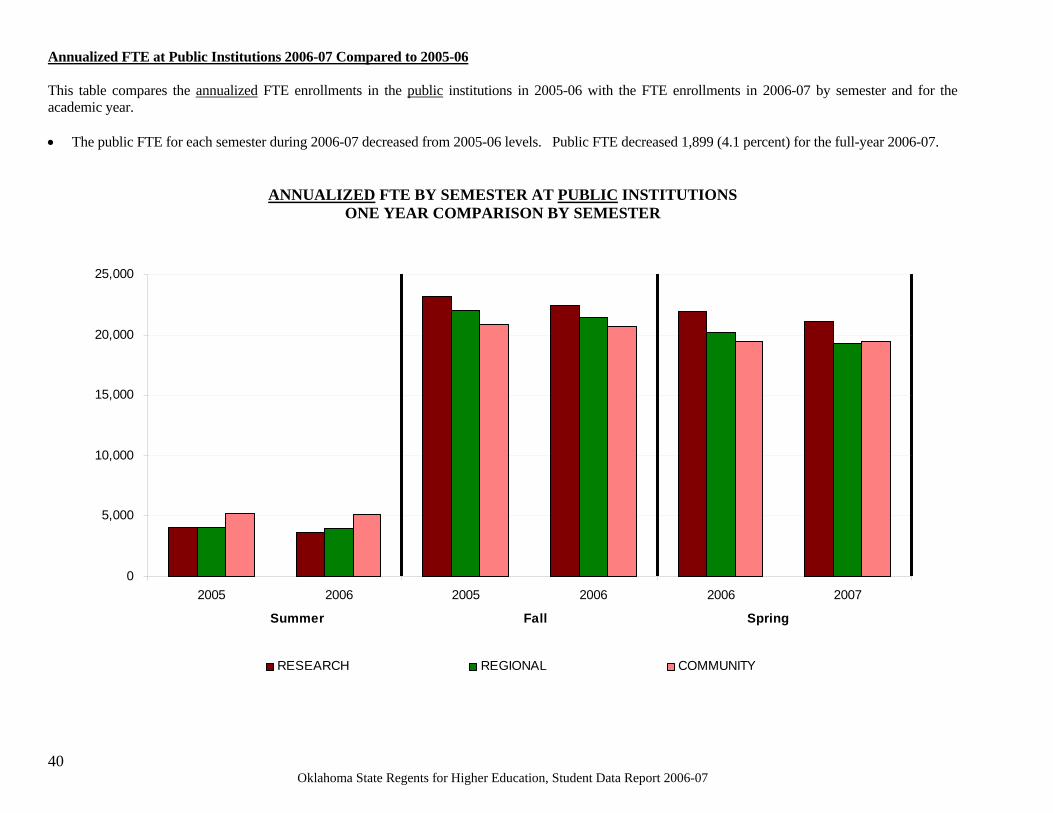
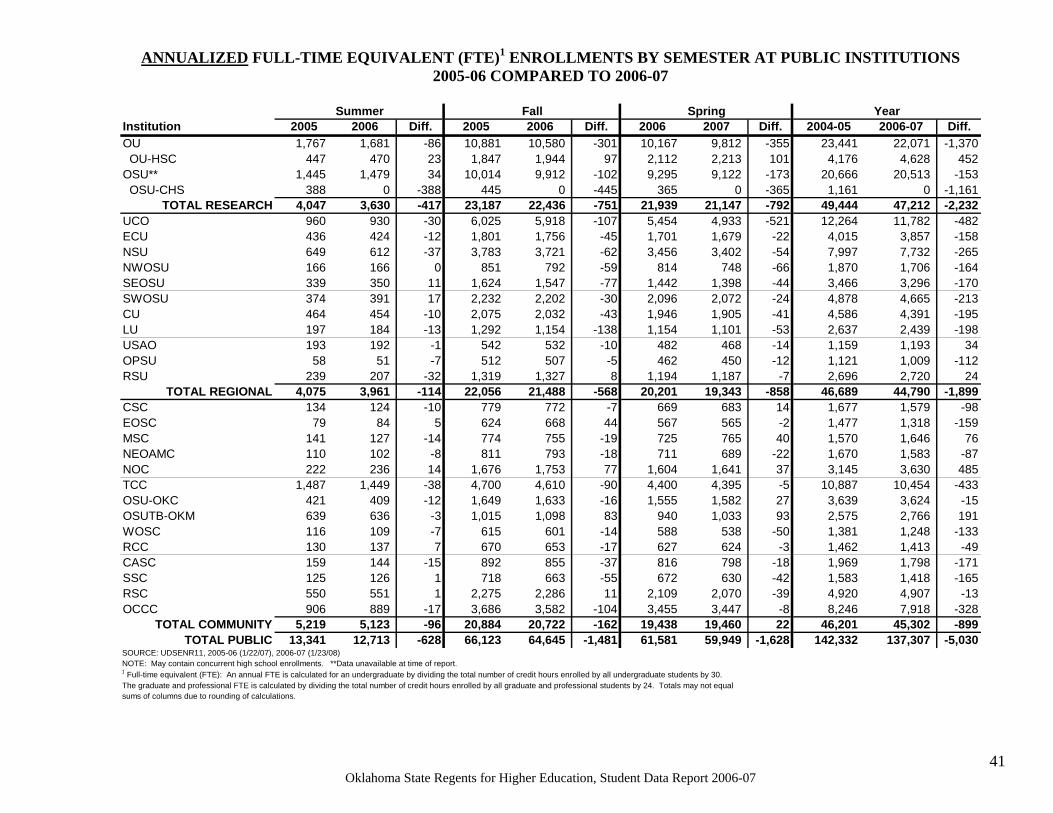
Annualized FTE at Public Institutions 2006-07 Compared to 2005-06 This table compares the annualized FTE enrollments in the public institution s in 2005-06 with the FTE enrollments in 2006-07 by semester and for the academic year. • The public FTE for each semester during 2006-07 decreased fro m 2005-06 levels. Public FTE decreased 1,899 (4.1 percent) for the full-year 2006-07.
ANNUALIZED FTE BY SEMESTER AT PUBLIC INSTITUTIONS
ONE YEAR COMPARISON BY SEMESTER
25,000
20,000
15,000
10,000
5,000
0 2005 2006 2005 2006 2006 2007
Summer Fall Spring
RESEARCH REGIONAL COMMUNITY
Oklahoma State Regents fo r Higher Education, Stude nt Data Report 2006-07 40
ANNUALIZED FULL-TIME EQUIVALENT (FTE)1 ENROLLMENTS BY SEMESTER AT PUBLIC INSTITUTIONS 2005-06 COMPARED TO 2006-07
Summer Fall Spring Year Institution 2005 2006 Diff. 2005 2006 Diff. 2006 2007 Diff. 2004-05 2006-07 Diff. OU 1,767 1,681 -86 10,881 10,580 -301 10,167 9,812 -355 23,441 22,071 -1,370 OU-HSC 447 470 23 1,847 1,944 97 2,112 2,213 101 4,176 4,628 452 OSU** 1,445 1,479 34 10,014 9,912 -102 9,295 9,122 -173 20,666 20,513 -153 OSU-CHS 388 0 -388 445 0 -445 365 0 -365 1,161 0 -1,161
TOTAL RESEARCH 4,047 3,630 -417 23,187 22,436 -751 21,939 21,147 -792 49,444 47,212 -2,232 UCO 960 930 -30 6,025 5,918 -107 5,454 4,933 -521 12,264 11,782 -482 ECU 436 424 -12 1,801 1,756 -45 1,701 1,679 -22 4,015 3,857 -158 NSU 649 612 -37 3,783 3,721 -62 3,456 3,402 -54 7,997 7,732 -265 NWOSU 166 166 0 851 792 -59 814 748 -66 1,870 1,706 -164 SEOSU 339 350 11 1,624 1,547 -77 1,442 1,398 -44 3,466 3,296 -170 SWOSU 374 391 17 2,232 2,202 -30 2,096 2,072 -24 4,878 4,665 -213 CU 464 454 -10 2,075 2,032 -43 1,946 1,905 -41 4,586 4,391 -195 LU 197 184 -13 1,292 1,154 -138 1,154 1,101 -53 2,637 2,439 -198 USAO 193 192 -1 542 532 -10 482 468 -14 1,159 1,193 34 OPSU 58 51 -7 512 507 -5 462 450 -12 1,121 1,009 -112 RSU 239 207 -32 1,319 1,327 8 1,194 1,187 -7 2,696 2,720 24
TOTAL REGIONAL 4,075 3,961 -114 22,056 21,488 -568 20,201 19,343 -858 46,689 44,790 -1,899 CSC 134 124 -10 779 772 -7 669 683 14 1,677 1,579 -98 EOSC 79 84 5 624 668 44 567 565 -2 1,477 1,318 -159 MSC 141 127 -14 774 755 -19 725 765 40 1,570 1,646 76 NEOAMC 110 102 -8 811 793 -18 711 689 -22 1,670 1,583 -87 NOC 222 236 14 1,676 1,753 77 1,604 1,641 37 3,145 3,630 485 TCC 1,487 1,449 -38 4,700 4,610 -90 4,400 4,395 -5 10,887 10,454 -433 OSU-OKC 421 409 -12 1,649 1,633 -16 1,555 1,582 27 3,639 3,624 -15 OSUTB-OKM 639 636 -3 1,015 1,098 83 940 1,033 93 2,575 2,766 191 WOSC 116 109 -7 615 601 -14 588 538 -50 1,381 1,248 -133 RCC 130 137 7 670 653 -17 627 624 -3 1,462 1,413 -49 CASC 159 144 -15 892 855 -37 816 798 -18 1,969 1,798 -171 SSC 125 126 1 718 663 -55 672 630 -42 1,583 1,418 -165 RSC 550 551 1 2,275 2,286 11 2,109 2,070 -39 4,920 4,907 -13 OCCC 906 889 -17 3,686 3,582 -104 3,455 3,447 -8 8,246 7,918 -328
TOTAL COMMUNITY 5,219 5,123 -96 20,884 20,722 -162 19,438 19,460 22 46,201 45,302 -899 TOTAL PUBLIC 13,341 12,713 -628 66,123 64,645 -1,481 61,581 59,949 -1,628 142,332 137,307 -5,030
SOURCE: UDSENR11, 2005-06 (1/22/07), 2006-07 (1/23/08)
NOTE: May contain concurrent high school enrollments. **Data unavailable at time of report.
1 Full-time equivalent (FTE): An annual FTE is calculated for an undergraduate by dividing the total number of credit hours enrolled by all undergraduate students by 30.
The graduate and professional FTE is calculated by dividing the total number of credit hours enrolled by all graduate and professional students by 24. Totals may not equal
sums of columns due to rounding of calculations.
Oklahoma State Regents for Higher Education, Student Data Report 2006-07 41
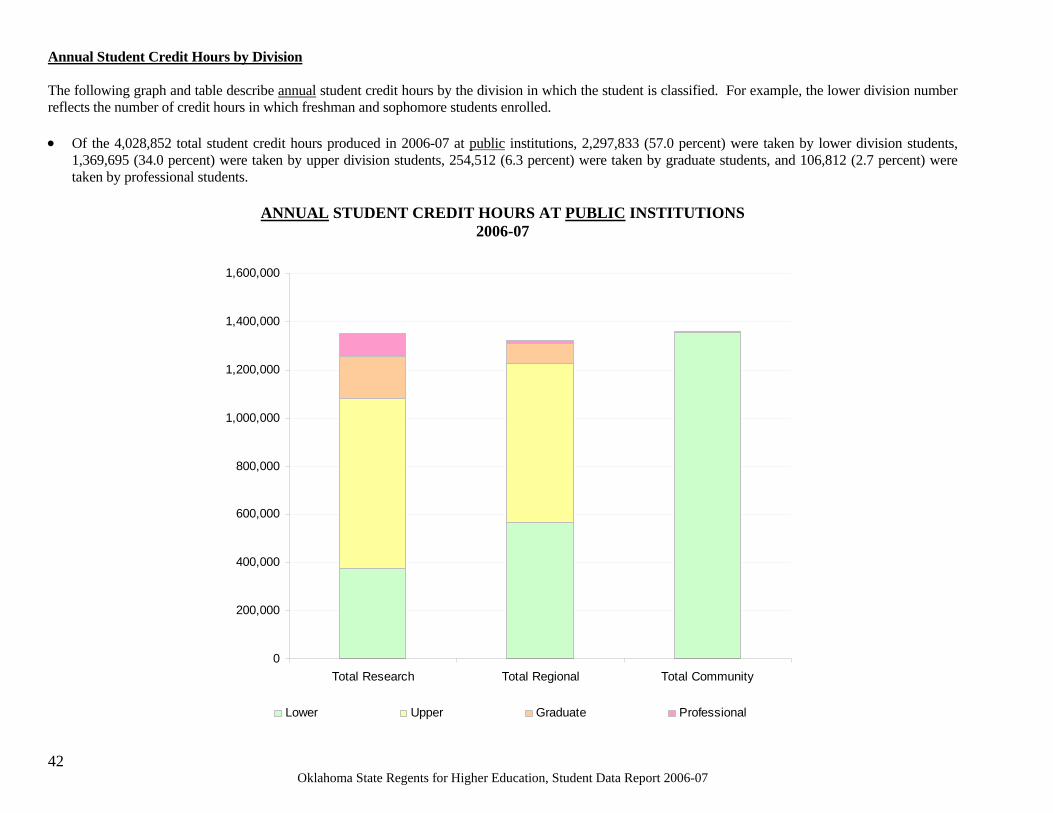
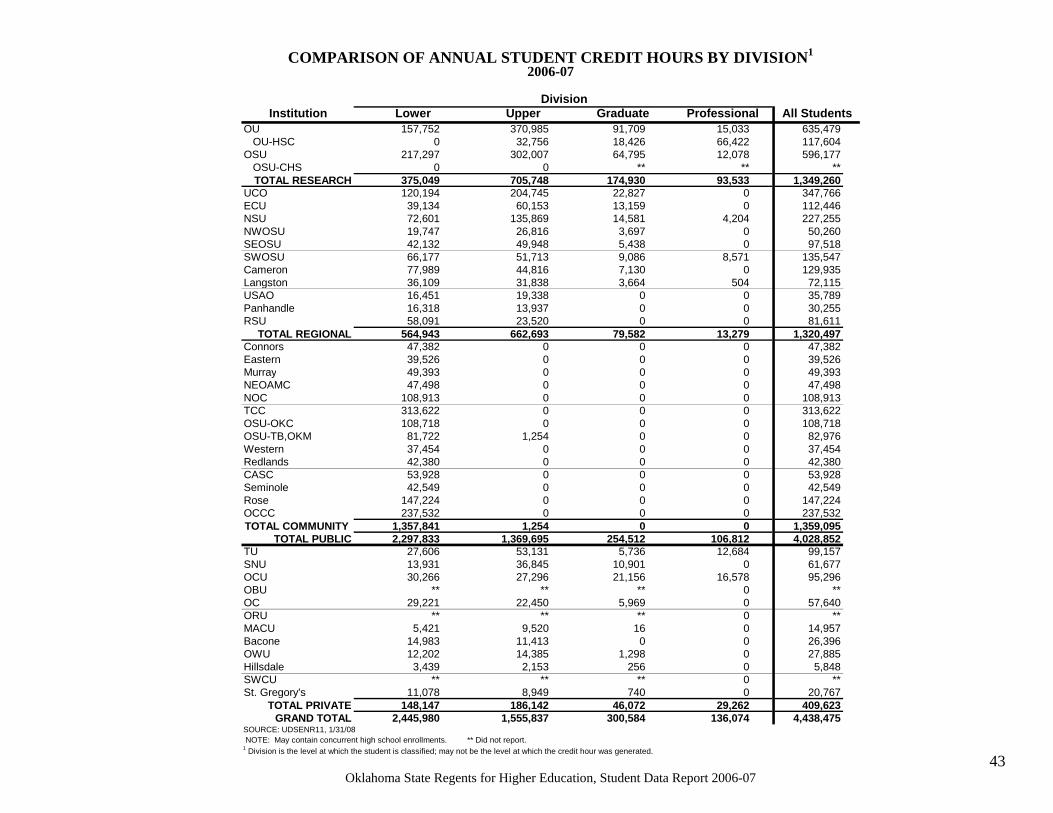
Annual Student Credi t Hours by Division The following graph and table describe annual student credit hours by the division in which the student is classified. For example, the lower division number reflects the number of credit hours in which freshman and sophomore students enrolled. • Of the 4,028,852 total student credit hours produced in 2006-07 at public institutions, 2,297,833 (57.0 percent) were taken by lower division students,
1,369,695 (34.0 percent) were taken by upper division students, 254,512 (6.3 percent) were taken by graduate students, and 106,812 (2.7 percent) were taken by professional students.
ANNUAL STUDENT CREDIT HOURS AT PUBLIC INSTITUTIONS 2006-07
1,600,000
1,400,000
1,200,000
1,000,000
800,000
600,000
400,000
200,000
0 Total Research Total Regional Total Community
Lower Upper Graduate Professional
Oklahoma State Regents fo r Higher Education, Stude nt Data Report 2006-07 42
COMPARISON OF ANNUAL STUDENT CREDIT HOURS BY DIVISION1
2006-07
Division Institution Lower Upper Graduate Professional All Students
OU OU-HSC OSU OSU-CHS
TOTAL RESEARCH
157,752 0
217,297 0
370,985 32,756
302,007 0
91,709 18,426 64,795
**
15,033 66,422 12,078
**
635,479117,604 596,177
** 375,049 705,748 174,930 93,533 1,349,260
UCO 120,194 204,745 22,827 0 347,766 ECU 39,134 60,153 13,159 0 112,446 NSU 72,601 135,869 14,581 4,204 227,255 NWOSU 19,747 26,816 3,697 0 50,260 SEOSU 42,132 49,948 5,438 0 97,518 SWOSU Cameron Langston
66,177 77,989 36,109
51,713 44,816 31,838
9,086 7,130 3,664
8,571 0
504
135,547 129,935 72,115
USAO Panhandle RSU
TOTAL REGIONAL
16,451 16,318 58,091
19,338 13,937 23,520
0 0 0
0 0 0
35,789 30,255 81,611
564,943 662,693 79,582 13,279 1,320,497 Connors 47,382 0 0 0 47,382 Eastern 39,526 0 0 0 39,526 Murray 49,393 0 0 0 49,393 NEOAMC 47,498 0 0 0 47,498 NOC 108,913 0 0 0 108,913 TCC 313,622 0 0 0 313,622 OSU-OKC 108,718 0 0 0 108,718 OSU-TB,OKM 81,722 1,254 0 0 82,976 Western 37,454 0 0 0 37,454 Redlands 42,380 0 0 0 42,380 CASC Seminole Rose OCCC
TOTAL COMMUNITY TOTAL PUBLIC
53,928 42,549
147,224 237,532
0 0 0 0
0 0 0 0
0 0 0
0
53,928 42,549
147,224237,532
1,357,841 1,254 0 0 1,359,095 2,297,833 1,369,695 254,512 106,812 4,028,852
TU SNU OCU OBU OC
27,606 13,931 30,266
** 29,221
53,131 36,845 27,296
** 22,450
5,736 10,901 21,156
** 5,969
12,684 0
16,578 0 0
99,157 61,677 95,296
** 57,640
ORU MACU Bacone OWU Hillsdale
** 5,421
14,983 12,202 3,439
** 9,520
11,413 14,385 2,153
** 16 0
1,298 256
0 0 0 0 0
** 14,957 26,396 27,885 5,848
SWCU St. Gregory's
TOTAL PRIVATE GRAND TOTAL
** 11,078
** 8,949
** 740
0 0
** 20,767
148,147 186,142 46,072 29,262 409,623 2,445,980 1,555,837 300,584 136,074 4,438,475
SOURCE: UDSENR11, 1/31/08 NOTE: May contain concurrent high school enrollments. ** Did not report. 1 Division is the level at which the student is classified; may not be the level at which the credit hour was generated.
43 Oklahoma State Regents fo r Higher Education, Stude nt Data Report 2006-07
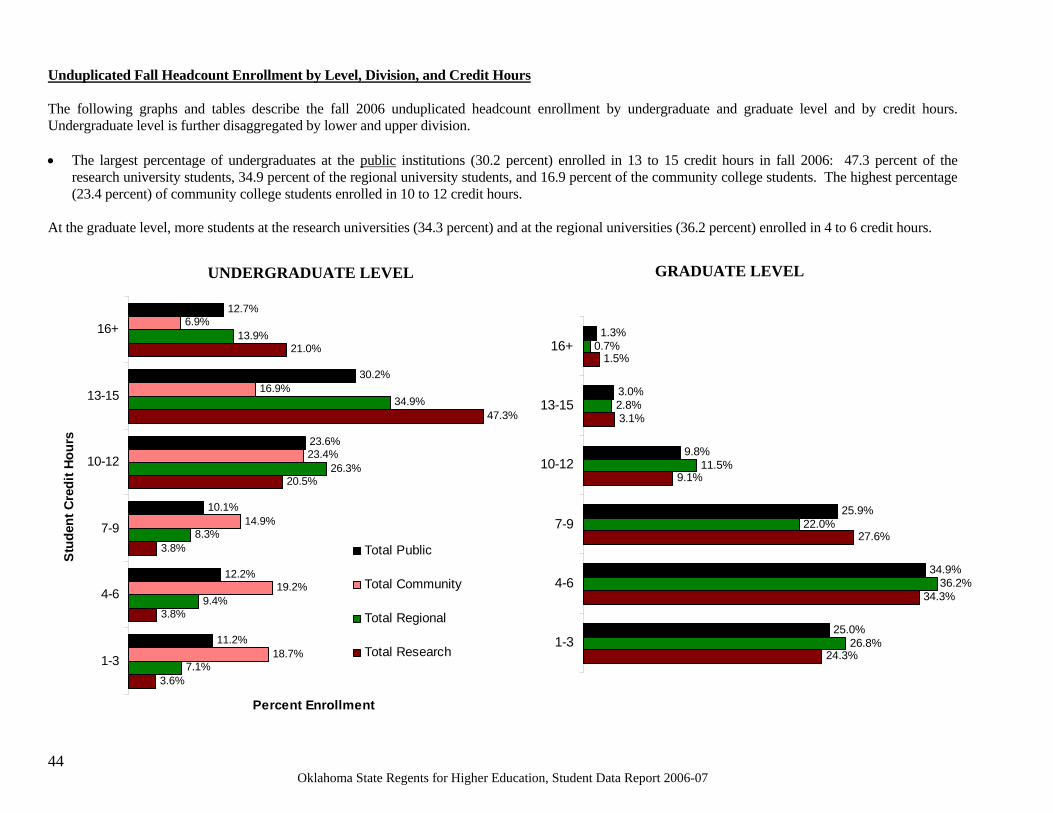
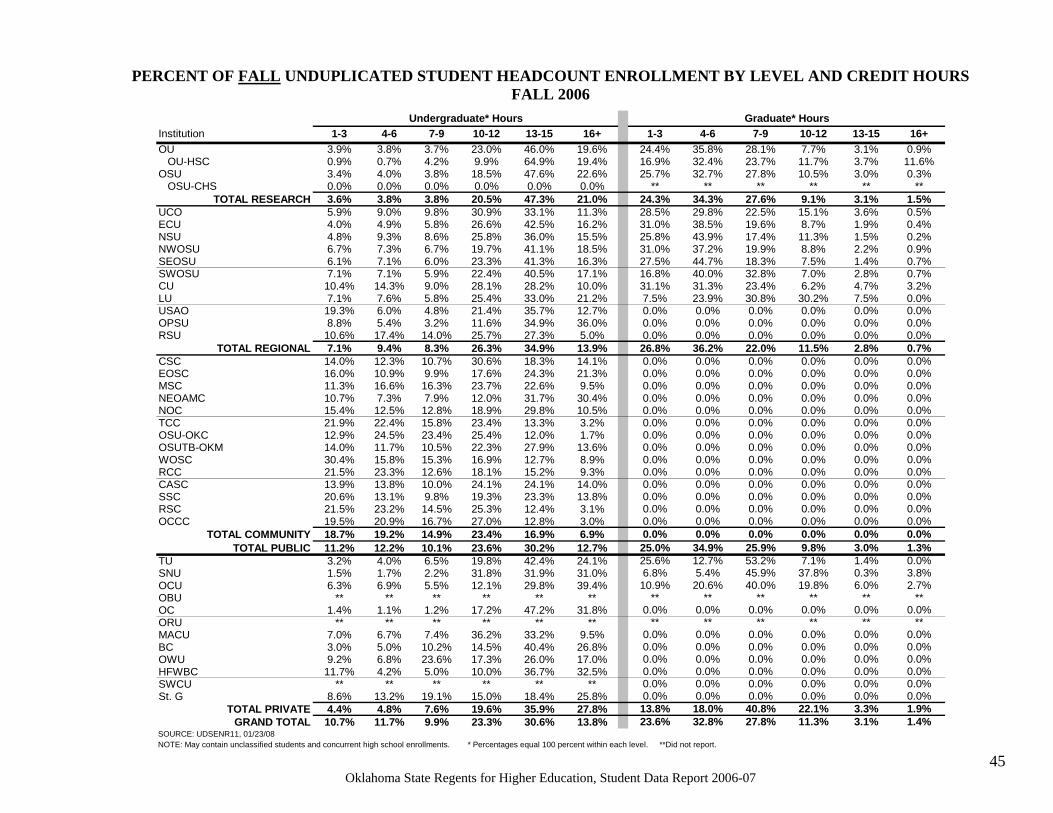
Unduplicated Fall Headcount Enrollment by Level, Division, and Credit Hours The following graph s and tables describe the fall 2006 unduplicated headcount enrollment by undergraduate and graduate level and by credit hours. Undergraduate level is further disaggregated by lower and upper division. • The largest percentage of undergraduates at the public institutions (30.2 percent) enrolled in 13 to 15 credit hours in fall 2006: 47.3 percent of the
research university students, 34.9 percent of the regional university students, and 16.9 percent of the community college students. The highest percentage (23.4 percent) of community colleg e students enrolled in 10 to 12 credit hours.
At the graduate level, more students at the research universities (34.3 percent) and at the regional universities (36.2 percent) enrolled in 4 to 6 credit hours.
UNDERGRADUATE LEVEL
12.7%
6.9%16+ 13.9% 21.0%
30.2% 16.9% 13-15 34.9%
47.3%
Stu
dent
Cre
dit H
ours
23.6% 23.4% 10-12 26.3%
20.5%
10.1% 14.9% 7-9 8.3%
3.8% Total Public
12.2% Total Community 19.2%4-6 9.4%
3.8% Total Regional 11.2%
Total Research 18.7% 1-3 7.1% 3.6%
Percent Enrollment
GRADUATE LEVEL
1.3%16+
3.0%
11.5%
36.2%
26.8%
0.7% 1.5%
2.8% 13-15 3.1%
9.8% 10-12
9.1%
25.9% 22.0%7-9
27.6%
34.9%4-6
34.3%
25.0% 1-3
24.3%
Oklahoma State Regents fo r Higher Education, Stude nt Data Report 2006-07 44
PERCENT OF FALL UNDUPLICATED STUDENT HEADCOUNT ENROLLMENT BY LEVEL AND CREDIT HOURS FALL 2006
Undergraduate* Hours Institution 1-3 4-6 7-9 10-12 13-15 16+ OU 3.9% 3.8% 3.7% 23.0% 46.0% 19.6% OU-HSC 0.9% 0.7% 4.2% 9.9% 64.9% 19.4% OSU 3.4% 4.0% 3.8% 18.5% 47.6% 22.6% OSU-CHS 0.0% 0.0% 0.0% 0.0% 0.0% 0.0%
TOTAL RESEARCH 3.6% 3.8% 3.8% 20.5% 47.3% 21.0% UCO 5.9% 9.0% 9.8% 30.9% 33.1% 11.3% 28.5% 29.8% 22.5% 15.1% 3.6% 0.5% ECU 4.0% 4.9% 5.8% 26.6% 42.5% 16.2% 31.0% 38.5% 19.6% 8.7% 1.9% 0.4% NSU 4.8% 9.3% 8.6% 25.8% 36.0% 15.5% 25.8% 43.9% 17.4% 11.3% 1.5% 0.2% NWOSU 6.7% 7.3% 6.7% 19.7% 41.1% 18.5% 31.0% 37.2% 19.9% 8.8% 2.2% 0.9% SEOSU 6.1% 7.1% 6.0% 23.3% 41.3% 16.3% 27.5% 44.7% 18.3% 7.5% 1.4% 0.7% SWOSU 7.1% 7.1% 5.9% 22.4% 40.5% 17.1% 16.8% 40.0% 32.8% 7.0% 2.8% 0.7% CU 10.4% 14.3% 9.0% 28.1% 28.2% 10.0% 31.1% 31.3% 23.4% 6.2% 4.7% 3.2% LU 7.1% 7.6% 5.8% 25.4% 33.0% 21.2% 7.5% 23.9% 30.8% 30.2% 7.5% 0.0% USAO 19.3% 6.0% 4.8% 21.4% 35.7% 12.7% OPSU 8.8% 5.4% 3.2% 11.6% 34.9% 36.0% RSU 10.6% 17.4% 14.0% 25.7% 27.3% 5.0%
TOTAL REGIONAL 7.1% 9.4% 8.3% 26.3% 34.9% 13.9% CSC 14.0% 12.3% 10.7% 30.6% 18.3% 14.1% EOSC 16.0% 10.9% 9.9% 17.6% 24.3% 21.3% MSC 11.3% 16.6% 16.3% 23.7% 22.6% 9.5% NEOAMC 10.7% 7.3% 7.9% 12.0% 31.7% 30.4% NOC 15.4% 12.5% 12.8% 18.9% 29.8% 10.5% TCC 21.9% 22.4% 15.8% 23.4% 13.3% 3.2% OSU-OKC 12.9% 24.5% 23.4% 25.4% 12.0% 1.7% OSUTB-OKM 14.0% 11.7% 10.5% 22.3% 27.9% 13.6% WOSC 30.4% 15.8% 15.3% 16.9% 12.7% 8.9% RCC 21.5% 23.3% 12.6% 18.1% 15.2% 9.3% CASC 13.9% 13.8% 10.0% 24.1% 24.1% 14.0% SSC 20.6% 13.1% 9.8% 19.3% 23.3% 13.8% RSC 21.5% 23.2% 14.5% 25.3% 12.4% 3.1% OCCC 19.5% 20.9% 16.7% 27.0% 12.8% 3.0%
TOTAL COMMUNITY 18.7% 19.2% 14.9% 23.4% 16.9% 6.9% TOTAL PUBLIC 11.2% 12.2% 10.1% 23.6% 30.2% 12.7%
TU 3.2% 4.0% 6.5% 19.8% 42.4% 24.1% SNU 1.5% 1.7% 2.2% 31.8% 31.9% 31.0% OCU 6.3% 6.9% 5.5% 12.1% 29.8% 39.4% OBU ** ** ** ** ** ** OC 1.4% 1.1% 1.2% 17.2% 47.2% 31.8% ORU ** ** ** ** ** ** MACU 7.0% 6.7% 7.4% 36.2% 33.2% 9.5% BC 3.0% 5.0% 10.2% 14.5% 40.4% 26.8% OWU 9.2% 6.8% 23.6% 17.3% 26.0% 17.0% HFWBC 11.7% 4.2% 5.0% 10.0% 36.7% 32.5% SWCU ** ** ** ** ** ** St. G 8.6% 13.2% 19.1% 15.0% 18.4% 25.8%
TOTAL PRIVATE 4.4% 4.8% 7.6% 19.6% 35.9% 27.8% GRAND TOTAL 10.7% 11.7% 9.9% 23.3% 30.6% 13.8%
SOURCE: UDSENR11, 01/23/08
Graduate* Hours 1-3 4-6 7-9 10-12 13-15 16+
24.4% 35.8% 28.1% 7.7% 3.1% 0.9%16.9% 32.4% 23.7% 11.7% 3.7% 11.6% 25.7% 32.7% 27.8% 10.5% 3.0% 0.3%
** ** ** ** ** ** 24.3% 34.3% 27.6% 9.1% 3.1% 1.5%
0.0% 0.0% 0.0% 26.8%
0.0% 0.0% 0.0% 36.2%
0.0% 0.0% 0.0% 22.0%
0.0% 0.0% 0.0% 11.5%
0.0% 0.0% 0.0% 2.8%
0.0% 0.0% 0.0% 0.7%
0.0% 0.0% 0.0% 0.0% 0.0%
0.0% 0.0% 0.0% 0.0% 0.0%
0.0% 0.0% 0.0% 0.0% 0.0%
0.0% 0.0% 0.0% 0.0% 0.0%
0.0% 0.0% 0.0% 0.0% 0.0%
0.0% 0.0% 0.0% 0.0% 0.0%
0.0% 0.0% 0.0% 0.0% 0.0%
0.0% 0.0% 0.0% 0.0% 0.0%
0.0% 0.0% 0.0% 0.0% 0.0%
0.0% 0.0% 0.0% 0.0% 0.0%
0.0% 0.0% 0.0% 0.0% 0.0%
0.0% 0.0% 0.0% 0.0% 0.0%
0.0% 0.0% 0.0% 0.0% 0.0% 25.0%
0.0% 0.0% 0.0% 0.0% 0.0% 34.9%
0.0% 0.0% 0.0% 0.0% 0.0% 25.9%
0.0% 0.0% 0.0% 0.0% 0.0% 9.8%
0.0% 0.0% 0.0% 0.0% 0.0% 3.0%
0.0% 0.0% 0.0% 0.0% 0.0% 1.3%
25.6% 6.8%
10.9% **
0.0%
12.7% 5.4%
20.6% **
0.0%
53.2% 45.9% 40.0%
** 0.0%
7.1% 37.8% 19.8%
** 0.0%
1.4% 0.3% 6.0%
** 0.0%
0.0% 3.8% 2.7%
** 0.0%
** 0.0% 0.0% 0.0% 0.0%
** 0.0% 0.0% 0.0% 0.0%
** 0.0% 0.0% 0.0% 0.0%
** 0.0% 0.0% 0.0% 0.0%
** 0.0% 0.0% 0.0% 0.0%
** 0.0% 0.0% 0.0% 0.0%
0.0% 0.0%
0.0% 0.0%
0.0% 0.0%
0.0% 0.0%
0.0% 0.0%
0.0% 0.0%
13.8% 18.0% 40.8% 22.1% 3.3% 1.9% 23.6% 32.8% 27.8% 11.3% 3.1% 1.4%
NOTE: May contain unclassified students and concurrent high school enrollments. * Percentages equal 100 percent within each level. **Did not report.
Oklahoma State Regents for Higher Education, Student Data Report 2006-07 45
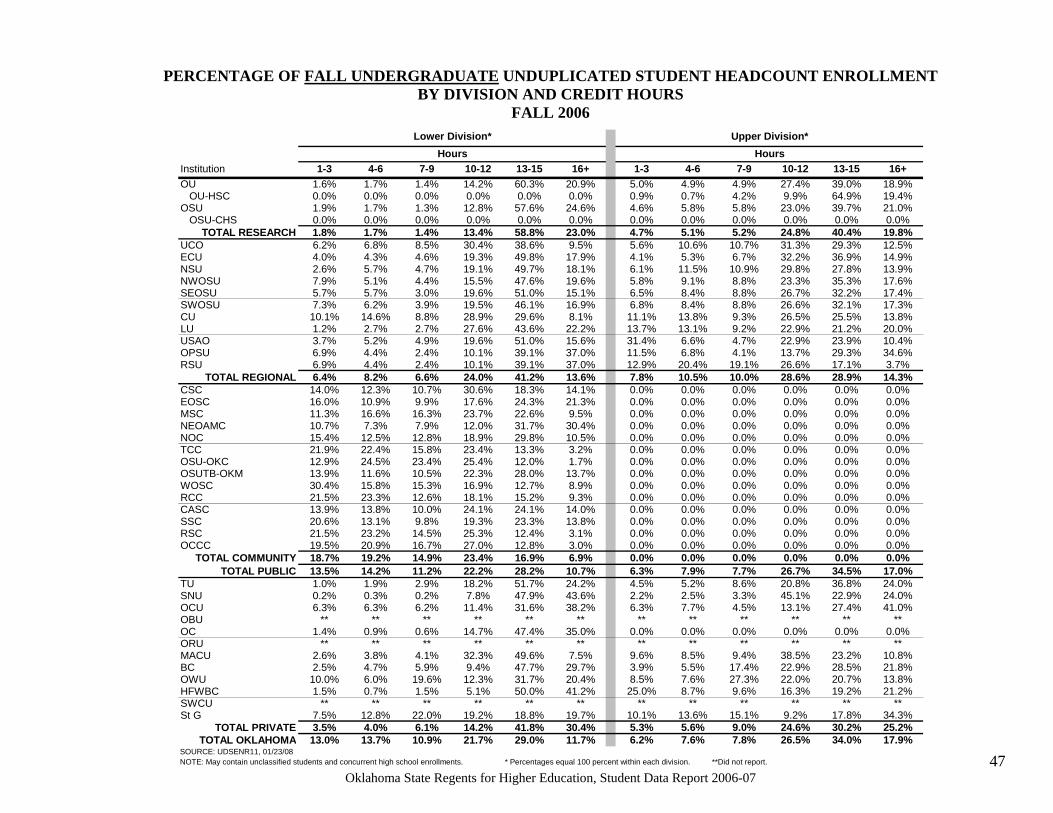
PERCENTAGE OF FALL UNDERGRADUATE UNDUPLICATED STUDENT HEADCOUNT ENROLLMENT BY DIVISION AND CREDIT HOURS
FALL 2006 Lower Division*
Hours Institution 1-3 4-6 7-9 10-12 13-15 16+ OU 1.6% 1.7% 1.4% 14.2% 60.3% 20.9% OU-HSC 0.0% 0.0% 0.0% 0.0% 0.0% 0.0% OSU 1.9% 1.7% 1.3% 12.8% 57.6% 24.6% OSU-CHS 0.0% 0.0% 0.0% 0.0% 0.0% 0.0%
TOTAL RESEARCH 1.8% 1.7% 1.4% 13.4% 58.8% 23.0% UCO 6.2% 6.8% 8.5% 30.4% 38.6% 9.5% 5.6% 10.6% 10.7% 31.3% 29.3% 12.5% ECU 4.0% 4.3% 4.6% 19.3% 49.8% 17.9% 4.1% 5.3% 6.7% 32.2% 36.9% 14.9% NSU 2.6% 5.7% 4.7% 19.1% 49.7% 18.1% 6.1% 11.5% 10.9% 29.8% 27.8% 13.9% NWOSU 7.9% 5.1% 4.4% 15.5% 47.6% 19.6% 5.8% 9.1% 8.8% 23.3% 35.3% 17.6% SEOSU 5.7% 5.7% 3.0% 19.6% 51.0% 15.1% 6.5% 8.4% 8.8% 26.7% 32.2% 17.4% SWOSU 7.3% 6.2% 3.9% 19.5% 46.1% 16.9% 6.8% 8.4% 8.8% 26.6% 32.1% 17.3% CU 10.1% 14.6% 8.8% 28.9% 29.6% 8.1% 11.1% 13.8% 9.3% 26.5% 25.5% 13.8% LU 1.2% 2.7% 2.7% 27.6% 43.6% 22.2% 13.7% 13.1% 9.2% 22.9% 21.2% 20.0% USAO 3.7% 5.2% 4.9% 19.6% 51.0% 15.6% OPSU 6.9% 4.4% 2.4% 10.1% 39.1% 37.0% RSU 6.9% 4.4% 2.4% 10.1% 39.1% 37.0%
TOTAL REGIONAL 6.4% 8.2% 6.6% 24.0% 41.2% 13.6% CSC 14.0% 12.3% 10.7% 30.6% 18.3% 14.1% EOSC 16.0% 10.9% 9.9% 17.6% 24.3% 21.3% MSC 11.3% 16.6% 16.3% 23.7% 22.6% 9.5% NEOAMC 10.7% 7.3% 7.9% 12.0% 31.7% 30.4% NOC 15.4% 12.5% 12.8% 18.9% 29.8% 10.5% TCC 21.9% 22.4% 15.8% 23.4% 13.3% 3.2% OSU-OKC 12.9% 24.5% 23.4% 25.4% 12.0% 1.7% OSUTB-OKM 13.9% 11.6% 10.5% 22.3% 28.0% 13.7% WOSC 30.4% 15.8% 15.3% 16.9% 12.7% 8.9% RCC 21.5% 23.3% 12.6% 18.1% 15.2% 9.3% CASC 13.9% 13.8% 10.0% 24.1% 24.1% 14.0% SSC 20.6% 13.1% 9.8% 19.3% 23.3% 13.8% RSC 21.5% 23.2% 14.5% 25.3% 12.4% 3.1% OCCC 19.5% 20.9% 16.7% 27.0% 12.8% 3.0%
TOTAL COMMUNITY 18.7% 19.2% 14.9% 23.4% 16.9% 6.9% TOTAL PUBLIC 13.5% 14.2% 11.2% 22.2% 28.2% 10.7%
TU 1.0% 1.9% 2.9% 18.2% 51.7% 24.2% SNU 0.2% 0.3% 0.2% 7.8% 47.9% 43.6% OCU 6.3% 6.3% 6.2% 11.4% 31.6% 38.2% OBU ** ** ** ** ** ** OC 1.4% 0.9% 0.6% 14.7% 47.4% 35.0% ORU ** ** ** ** ** ** MACU 2.6% 3.8% 4.1% 32.3% 49.6% 7.5% BC 2.5% 4.7% 5.9% 9.4% 47.7% 29.7% OWU 10.0% 6.0% 19.6% 12.3% 31.7% 20.4% HFWBC 1.5% 0.7% 1.5% 5.1% 50.0% 41.2% SWCU ** ** ** ** ** ** St G 7.5% 12.8% 22.0% 19.2% 18.8% 19.7%
TOTAL PRIVATE 3.5% 4.0% 6.1% 14.2% 41.8% 30.4% TOTAL OKLAHOMA 13.0% 13.7% 10.9% 21.7% 29.0% 11.7%
Upper Division* Hours
1-3 4-6 7-9 10-12 13-15 16+ 5.0% 0.9% 4.6% 0.0%
4.9% 0.7% 5.8% 0.0%
4.9% 4.2% 5.8% 0.0%
27.4% 9.9%
23.0% 0.0%
39.0% 64.9% 39.7% 0.0%
18.9%19.4% 21.0%0.0%
4.7% 5.1% 5.2% 24.8% 40.4% 19.8%
31.4% 11.5% 12.9% 7.8%
6.6% 6.8%
20.4% 10.5%
4.7% 4.1%
19.1% 10.0%
22.9% 13.7% 26.6% 28.6%
23.9% 29.3% 17.1% 28.9%
10.4% 34.6% 3.7% 14.3%
0.0% 0.0% 0.0% 0.0% 0.0% 0.0% 0.0% 0.0% 0.0% 0.0% 0.0% 0.0% 0.0% 0.0% 0.0% 0.0% 0.0% 0.0% 0.0% 0.0% 0.0% 0.0% 0.0% 0.0% 0.0% 0.0% 0.0% 0.0% 0.0% 0.0% 0.0% 0.0% 0.0% 0.0% 0.0% 0.0% 0.0% 0.0% 0.0% 0.0% 0.0% 0.0% 0.0% 0.0% 0.0% 0.0% 0.0% 0.0% 0.0% 0.0% 0.0% 0.0% 0.0% 0.0% 0.0% 0.0% 0.0% 0.0% 0.0% 0.0% 0.0% 0.0% 0.0% 0.0% 0.0% 6.3%
0.0% 0.0% 0.0% 0.0% 0.0% 7.9%
0.0% 0.0% 0.0% 0.0% 0.0% 7.7%
0.0% 0.0% 0.0% 0.0% 0.0% 26.7%
0.0% 0.0% 0.0% 0.0% 0.0% 34.5%
0.0% 0.0% 0.0% 0.0% 0.0% 17.0%
4.5% 2.2% 6.3%
** 0.0%
5.2% 2.5% 7.7%
** 0.0%
8.6% 3.3% 4.5%
** 0.0%
20.8% 45.1% 13.1%
** 0.0%
36.8% 22.9% 27.4%
** 0.0%
24.0% 24.0% 41.0%
** 0.0%
** 9.6% 3.9% 8.5%
25.0%
** 8.5% 5.5% 7.6% 8.7%
** 9.4%
17.4% 27.3% 9.6%
** 38.5% 22.9% 22.0% 16.3%
** 23.2% 28.5% 20.7% 19.2%
** 10.8% 21.8% 13.8% 21.2%
** 10.1%
** 13.6%
** 15.1%
** 9.2%
** 17.8%
** 34.3%
5.3% 5.6% 9.0% 24.6% 30.2% 25.2% 6.2% 7.6% 7.8% 26.5% 34.0% 17.9%
SOURCE: UDSENR11, 01/23/08 NOTE: May contain unclassified students and concurrent high school enrollments. * Percentages equal 100 percent within each division. **Did not report.
Oklahoma State Regents for Higher Education, Student Data Report 2006-07 47
Annual Unduplicated Enrollment by Field of Study and Class Level
The following tables describe the number of unduplicated headcount enrollments in higher education institutions in 2005-06 by field of study and by class level.
• At the public institutions, Education was the most popular field of study in 2006-07 with 23,642 (10.1 percent) students enrolled. Business Management was second with 21,726 (9.3 percent) students enrolled. It was the same in 2005-06 and 2004-05. Business Management and Education have been the top two fields since the first Student Data Report was published in 1982-83.
• At the private institutions, Business Management was the most popular field of study in 2006-07 with 4,037 (22.5 percent) students enrolled. Education was second with 1,558 (8.7 percent) students enrolled. It was the same in 2005-06, 2004-05 and 2003-04, and these have been the top two fields since the first Student Data Report was published in 1982-83.
Oklahoma State Regents for Higher Education, Student Data Report 2006-07 48
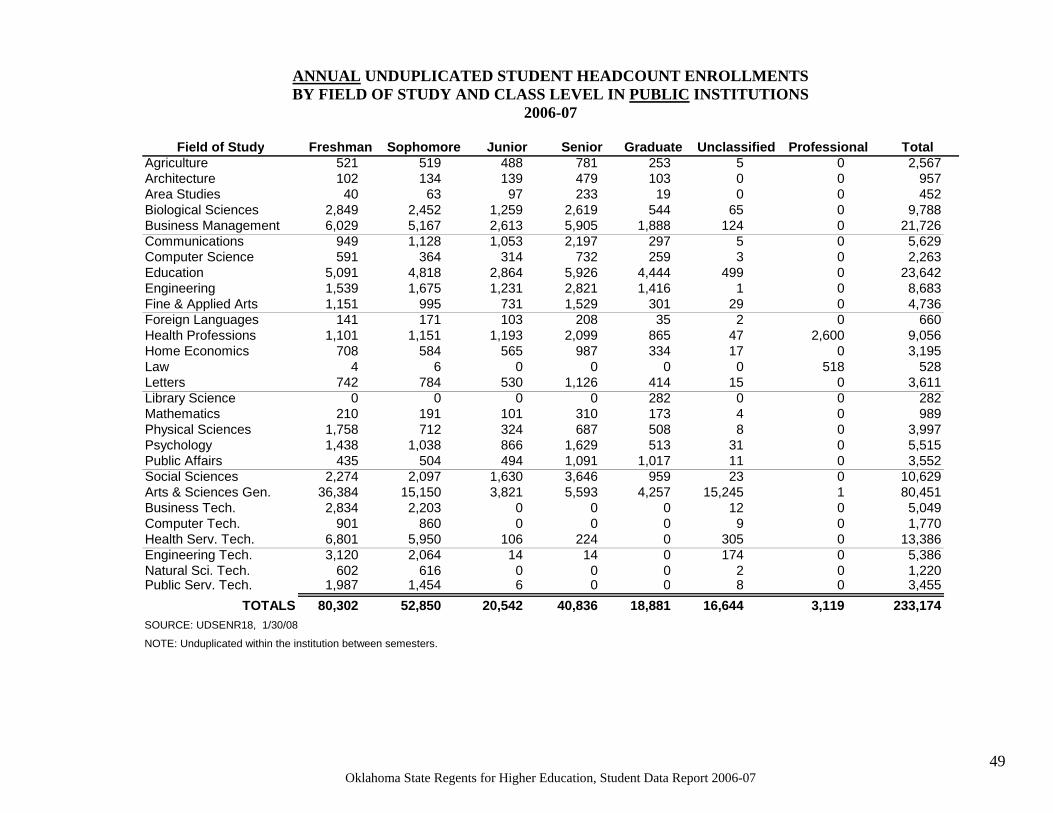
ANNUAL UNDUPLICATED STUDENT HEADCOUNT ENROLLMENTS
BY FIELD OF STUDY AND CLASS LEVEL IN PUBLIC INSTITUTIONS
2006-07
Field of Study Freshman Sophomore Junior Senior Graduate Unclassified Professional Total Agriculture 521 519 488 781 253 5 0 2,567 Architecture 102 134 139 479 103 0 0 957 Area Studies 40 63 97 233 19 0 0 452 Biological Sciences 2,849 2,452 1,259 2,619 544 65 0 9,788 Business Management 6,029 5,167 2,613 5,905 1,888 124 0 21,726 Communications 949 1,128 1,053 2,197 297 5 0 5,629 Computer Science 591 364 314 732 259 3 0 2,263 Education 5,091 4,818 2,864 5,926 4,444 499 0 23,642 Engineering 1,539 1,675 1,231 2,821 1,416 1 0 8,683 Fine & Applied Arts 1,151 995 731 1,529 301 29 0 4,736 Foreign Languages 141 171 103 208 35 2 0 660 Health Professions 1,101 1,151 1,193 2,099 865 47 2,600 9,056 Home Economics 708 584 565 987 334 17 0 3,195 Law 4 6 0 0 0 0 518 528 Letters 742 784 530 1,126 414 15 0 3,611 Library Science 0 0 0 0 282 0 0 282 Mathematics 210 191 101 310 173 4 0 989 Physical Sciences 1,758 712 324 687 508 8 0 3,997 Psychology 1,438 1,038 866 1,629 513 31 0 5,515 Public Affairs 435 504 494 1,091 1,017 11 0 3,552 Social Sciences 2,274 2,097 1,630 3,646 959 23 0 10,629 Arts & Sciences Gen. 36,384 15,150 3,821 5,593 4,257 15,245 1 80,451 Business Tech. 2,834 2,203 0 0 0 12 0 5,049 Computer Tech. 901 860 0 0 0 9 0 1,770 Health Serv. Tech. 6,801 5,950 106 224 0 305 0 13,386 Engineering Tech. 3,120 2,064 14 14 0 174 0 5,386 Natural Sci. Tech. 602 616 0 0 0 2 0 1,220 Public Serv. Tech. 1,987 1,454 6 0 0 8 0 3,455
TOTALS 80,302 52,850 20,542 40,836 18,881 16,644 3,119 233,174 SOURCE: UDSENR18, 1/30/08
NOTE: Unduplicated within the institution between semesters.
Oklahoma State Regents for Higher Education, Student Data Report 2006-07 49
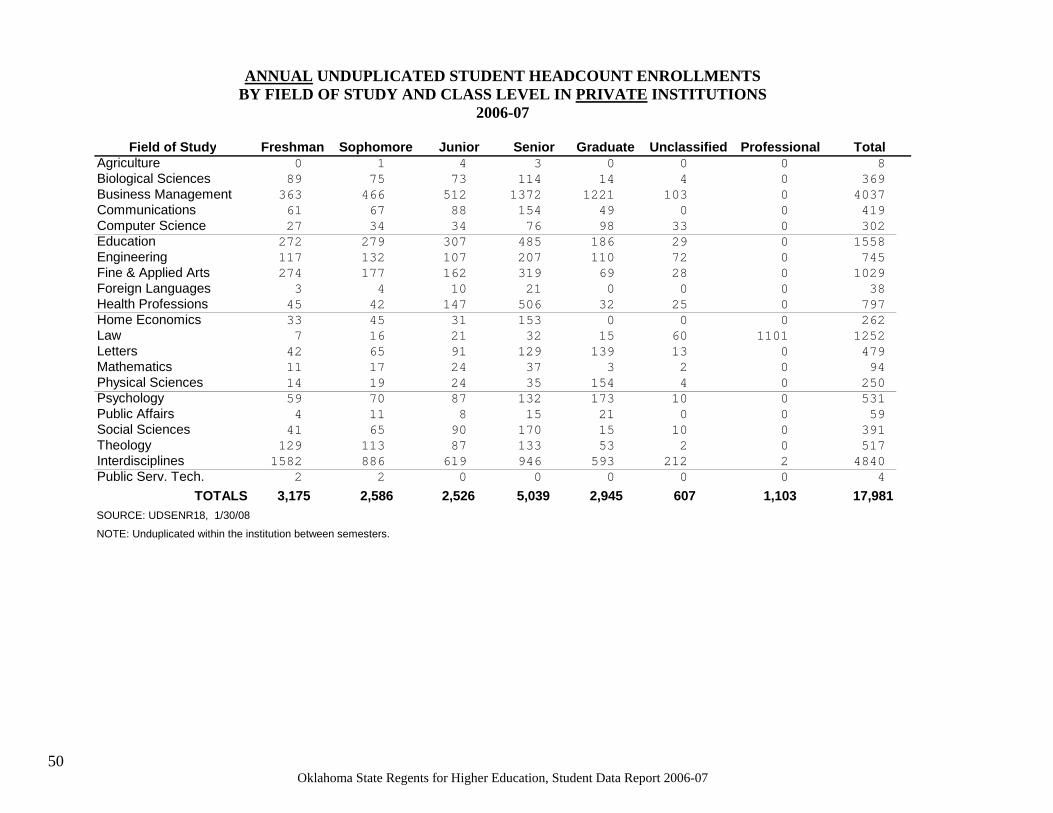
ANNUAL UNDUPLICATED STUDENT HEADCOUNT ENROLLMENTS
BY FIELD OF STUDY AND CLASS LEVEL IN PRIVATE INSTITUTIONS
2006-07
Field of Study Freshman Sophomore Junior Senior Graduate Unclassified Professional Total Agriculture 0 1 4 3 0 0 0 8 Biological Sciences 89 75 73 114 14 4 0 369
Business Management 363 466 512 1372 1221 103 0 4037
Communications 61 67 88 154 49 0 0 419
Computer Science 27 34 34 76 98 33 0 302
Education 272 279 307 485 186 29 0 1558
Engineering 117 132 107 207 110 72 0 745
Fine & Applied Arts 274 177 162 319 69 28 0 1029
Foreign Languages 3 4 10 21 0 0 0 38
Health Professions 45 42 147 506 32 25 0 797
Home Economics 33 45 31 153 0 0 0 262
Law 7 16 21 32 15 60 1101 1252
Letters 42 65 91 129 139 13 0 479
Mathematics 11 17 24 37 3 2 0 94
Physical Sciences 14 19 24 35 154 4 0 250
Psychology 59 70 87 132 173 10 0 531
Public Affairs 4 11 8 15 21 0 0 59
Social Sciences 41 65 90 170 15 10 0 391
Theology 129 113 87 133 53 2 0 517
Interdisciplines 1582 886 619 946 593 212 2 4840
Public Serv. Tech. 2 2 0 0 0 0 0 4
TOTALS 3,175 2,586 2,526 5,039 2,945 607 1,103 17,981 SOURCE: UDSENR18, 1/30/08
NOTE: Unduplicated within the institution between semesters.
Oklahoma State Regents for Higher Education, Student Data Report 2006-07 50
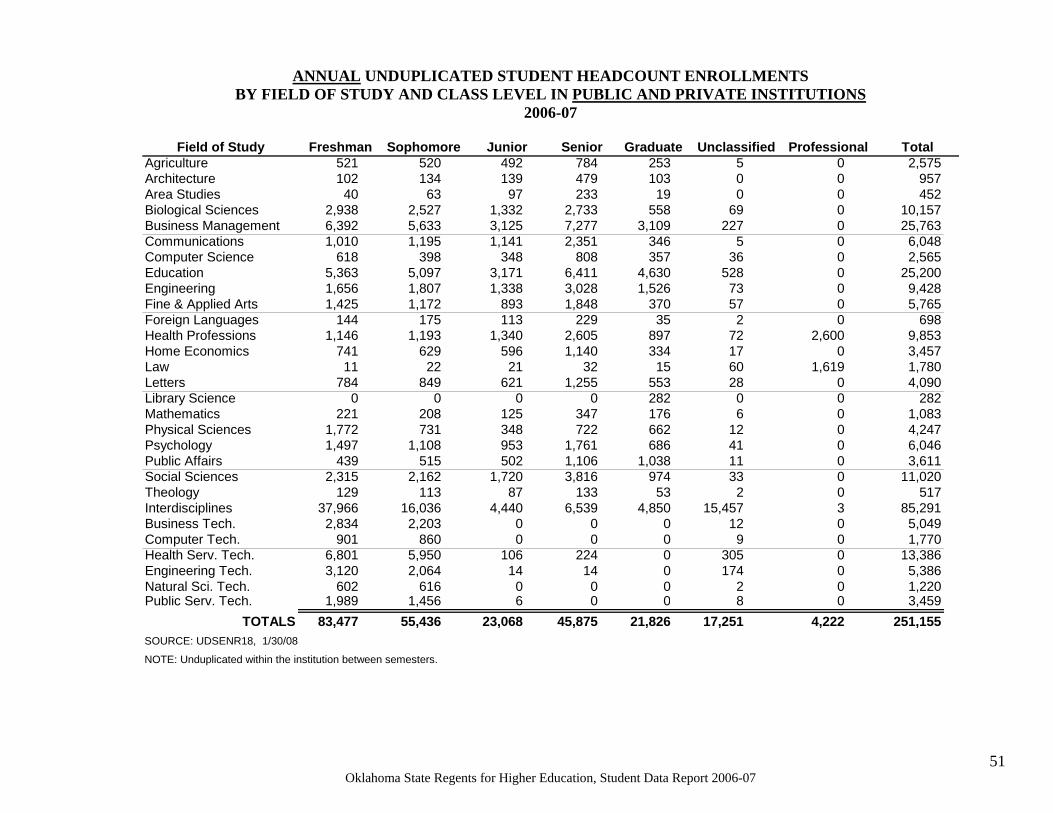
ANNUAL UNDUPLICATED STUDENT HEADCOUNT ENROLLMENTS
BY FIELD OF STUDY AND CLASS LEVEL IN PUBLIC AND PRIVATE INSTITUTIONS
2006-07
Field of Study Freshman Sophomore Junior Senior Graduate Unclassified Professional Total Agriculture 521 520 492 784 253 5 0 2,575 Architecture 102 134 139 479 103 0 0 957 Area Studies 40 63 97 233 19 0 0 452 Biological Sciences 2,938 2,527 1,332 2,733 558 69 0 10,157 Business Management 6,392 5,633 3,125 7,277 3,109 227 0 25,763 Communications 1,010 1,195 1,141 2,351 346 5 0 6,048 Computer Science 618 398 348 808 357 36 0 2,565 Education 5,363 5,097 3,171 6,411 4,630 528 0 25,200 Engineering 1,656 1,807 1,338 3,028 1,526 73 0 9,428 Fine & Applied Arts 1,425 1,172 893 1,848 370 57 0 5,765 Foreign Languages 144 175 113 229 35 2 0 698 Health Professions 1,146 1,193 1,340 2,605 897 72 2,600 9,853 Home Economics 741 629 596 1,140 334 17 0 3,457 Law 11 22 21 32 15 60 1,619 1,780 Letters 784 849 621 1,255 553 28 0 4,090 Library Science 0 0 0 0 282 0 0 282 Mathematics 221 208 125 347 176 6 0 1,083 Physical Sciences 1,772 731 348 722 662 12 0 4,247 Psychology 1,497 1,108 953 1,761 686 41 0 6,046 Public Affairs 439 515 502 1,106 1,038 11 0 3,611 Social Sciences 2,315 2,162 1,720 3,816 974 33 0 11,020 Theology 129 113 87 133 53 2 0 517 Interdisciplines 37,966 16,036 4,440 6,539 4,850 15,457 3 85,291 Business Tech. 2,834 2,203 0 0 0 12 0 5,049 Computer Tech. 901 860 0 0 0 9 0 1,770 Health Serv. Tech. 6,801 5,950 106 224 0 305 0 13,386 Engineering Tech. 3,120 2,064 14 14 0 174 0 5,386 Natural Sci. Tech. 602 616 0 0 0 2 0 1,220 Public Serv. Tech. 1,989 1,456 6 0 0 8 0 3,459
TOTALS 83,477 55,436 23,068 45,875 21,826 17,251 4,222 251,155 SOURCE: UDSENR18, 1/30/08
NOTE: Unduplicated within the institution between semesters.
Oklahoma State Regents for Higher Education, Student Data Report 2006-07 51
Unduplicated Headcount Enrollments at Public Institutions 2006-07 Compared to 2005-06
This table compares 2006-07 and 2005-06 unduplicated headcount enrollments at the public institutions by semester.
• In 2006-07, the summer, fall and spring semester all experienced a decrease from the previous year, resulting in a State System decrease of 4,766 students (2.0 percent) for the year. Over the past five years, public enrollment has increased 5.3 percent with declines totaling 2.4 percent in the last two years.
• Three public institutions with the largest increases were the Oklahoma State University-Okmulgee (496 students 12.6 percent), Northern Oklahoma College (429 students, 6.5 percent), and Oklahoma City Community College (311 students, 1.6 percent).
• The Rogers State University of had the largest decrease in enrollment, with 2,219 fewer students than the previous year.
• From 2004-05 to 2005-06, research universities’ enrollment decreased by a total of 1,913 students (3.0 percent); regional universities’ enrollment decreased by a total of 3,965 students (5.6 percent); and community colleges increased by a total of 1,112 (1.1 percent).
Oklahoma State Regents for Higher Education, Student Data Report 2006-07 52
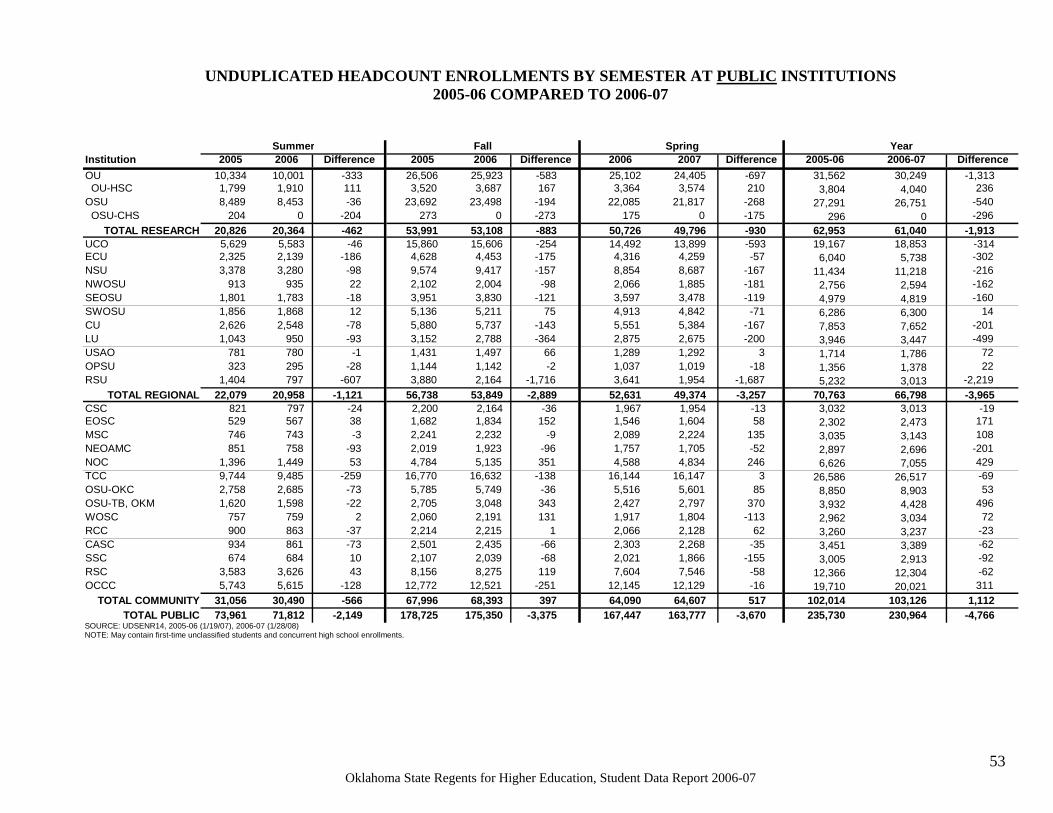
UNDUPLICATED HEADCOUNT ENROLLMENTS BY SEMESTER AT PUBLIC INSTITUTIONS
2005-06 COMPARED TO 2006-07
Summer Fall Spring Year Institution 2005 2006 Difference 2005 2006 Difference 2006 2007 Difference 2005-06 2006-07 Difference OU 10,334 10,001 -333 26,506 25,923 -583 25,102 24,405 -697 31,562 30,249 -1,313
OU-HSC 1,799 1,910 111 3,520 3,687 167 3,364 3,574 210 3,804 4,040 236 OSU 8,489 8,453 -36 23,692 23,498 -194 22,085 21,817 -268 27,291 26,751 -540
OSU-CHS 204 0 -204 273 0 -273 175 0 -175 296 0 -296 TOTAL RESEARCH 20,826 20,364 -462 53,991 53,108 -883 50,726 49,796 -930 62,953 61,040 -1,913
UCO 5,629 5,583 -46 15,860 15,606 -254 14,492 13,899 -593 19,167 18,853 -314 ECU 2,325 2,139 -186 4,628 4,453 -175 4,316 4,259 -57 6,040 5,738 -302 NSU 3,378 3,280 -98 9,574 9,417 -157 8,854 8,687 -167 11,434 11,218 -216 NWOSU 913 935 22 2,102 2,004 -98 2,066 1,885 -181 2,756 2,594 -162 SEOSU 1,801 1,783 -18 3,951 3,830 -121 3,597 3,478 -119 4,979 4,819 -160 SWOSU 1,856 1,868 12 5,136 5,211 75 4,913 4,842 -71 6,286 6,300 14 CU 2,626 2,548 -78 5,880 5,737 -143 5,551 5,384 -167 7,853 7,652 -201 LU 1,043 950 -93 3,152 2,788 -364 2,875 2,675 -200 3,946 3,447 -499 USAO 781 780 -1 1,431 1,497 66 1,289 1,292 3 1,714 1,786 72 OPSU 323 295 -28 1,144 1,142 -2 1,037 1,019 -18 1,356 1,378 22 RSU 1,404 797 -607 3,880 2,164 -1,716 3,641 1,954 -1,687 5,232 3,013 -2,219
TOTAL REGIONAL 22,079 20,958 -1,121 56,738 53,849 -2,889 52,631 49,374 -3,257 70,763 66,798 -3,965 CSC 821 797 -24 2,200 2,164 -36 1,967 1,954 -13 3,032 3,013 -19 EOSC 529 567 38 1,682 1,834 152 1,546 1,604 58 2,302 2,473 171 MSC 746 743 -3 2,241 2,232 -9 2,089 2,224 135 3,035 3,143 108 NEOAMC 851 758 -93 2,019 1,923 -96 1,757 1,705 -52 2,897 2,696 -201 NOC 1,396 1,449 53 4,784 5,135 351 4,588 4,834 246 6,626 7,055 429 TCC 9,744 9,485 -259 16,770 16,632 -138 16,144 16,147 3 26,586 26,517 -69 OSU-OKC 2,758 2,685 -73 5,785 5,749 -36 5,516 5,601 85 8,850 8,903 53 OSU-TB, OKM 1,620 1,598 -22 2,705 3,048 343 2,427 2,797 370 3,932 4,428 496 WOSC 757 759 2 2,060 2,191 131 1,917 1,804 -113 2,962 3,034 72 RCC 900 863 -37 2,214 2,215 1 2,066 2,128 62 3,260 3,237 -23 CASC 934 861 -73 2,501 2,435 -66 2,303 2,268 -35 3,451 3,389 -62 SSC 674 684 10 2,107 2,039 -68 2,021 1,866 -155 3,005 2,913 -92 RSC 3,583 3,626 43 8,156 8,275 119 7,604 7,546 -58 12,366 12,304 -62 OCCC 5,743 5,615 -128 12,772 12,521 -251 12,145 12,129 -16 19,710 20,021 311
TOTAL COMMUNITY 31,056 30,490 -566 67,996 68,393 397 64,090 64,607 517 102,014 103,126 1,112 TOTAL PUBLIC 73,961 71,812 -2,149 178,725 175,350 -3,375 167,447 163,777 -3,670 235,730 230,964 -4,766
SOURCE: UDSENR14, 2005-06 (1/19/07), 2006-07 (1/28/08) NOTE: May contain first-time unclassified students and concurrent high school enrollments.
Oklahoma State Regents for Higher Education, Student Data Report 2006-07 53
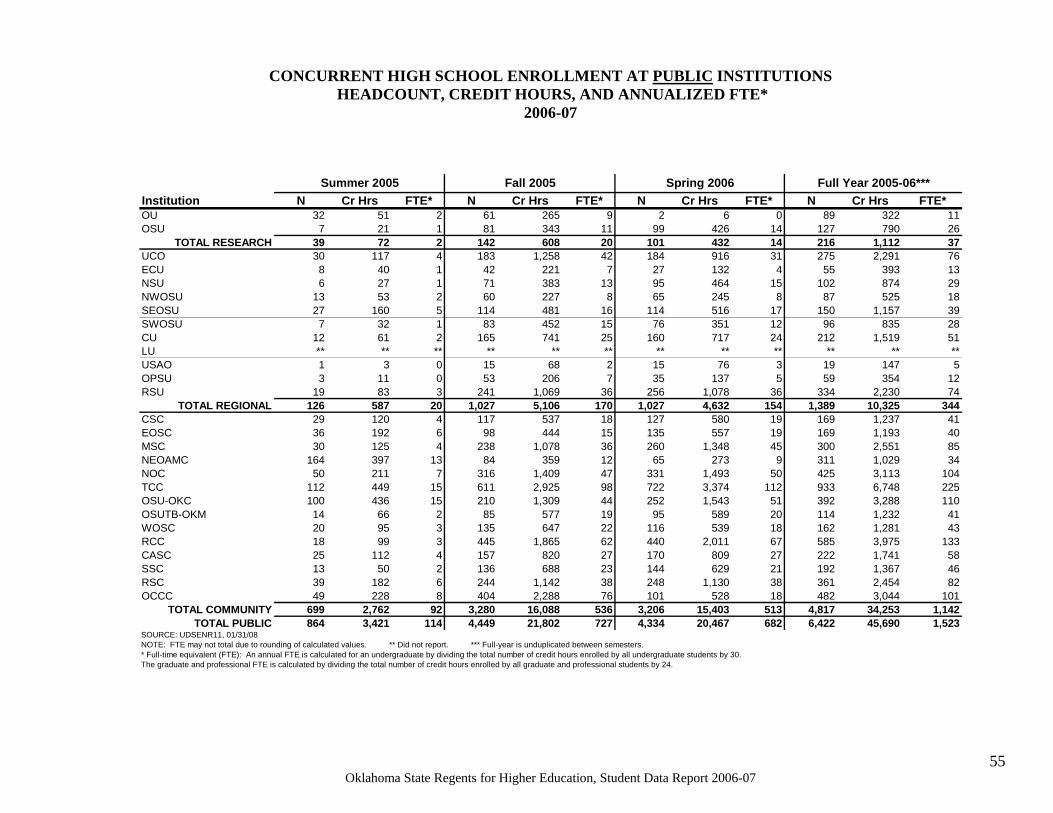
Concurrent High School Enrollment at Public Institutions
This table contains data from public higher education institutions authorized to concurrently enroll high school students in higher education. These students also are included in the other enrollment tables.
• In 2006-07, 6,422 high school students were reported as concurrently enrolled in at least one college course. These students enrolled for a total of 45,690 credit hours or 1,523 FTEs.
• In 2005-06, 5,803 high school students were concurrently enrolled for a total of 39,758 credit hours or 1,325 FTEs.
Oklahoma State Regents for Higher Education, Student Data Report 2006-07 54
CONCURRENT HIGH SCHOOL ENROLLMENT AT PUBLIC INSTITUTIONS
HEADCOUNT, CREDIT HOURS, AND ANNUALIZED FTE*
2006-07
Summer 2005 Fall 2005 Spring 2006 Full Year 2005-06*** Institution N Cr Hrs FTE* N Cr Hrs FTE* N Cr Hrs FTE* N Cr Hrs FTE* OU 32 51 2 61 265 9 2 6 0 89 322 11 OSU 7 21 1 81 343 11 99 426 14 127 790 26
TOTAL RESEARCH 39 72 2 142 608 20 101 432 14 216 1,112 37 UCO 30 117 4 183 1,258 42 184 916 31 275 2,291 76 ECU 8 40 1 42 221 7 27 132 4 55 393 13 NSU 6 27 1 71 383 13 95 464 15 102 874 29 NWOSU 13 53 2 60 227 8 65 245 8 87 525 18 SEOSU 27 160 5 114 481 16 114 516 17 150 1,157 39 SWOSU 7 32 1 83 452 15 76 351 12 96 835 28 CU 12 61 2 165 741 25 160 717 24 212 1,519 51 LU ** ** ** ** ** ** ** ** ** ** ** ** USAO 1 3 0 15 68 2 15 76 3 19 147 5 OPSU 3 11 0 53 206 7 35 137 5 59 354 12 RSU 19 83 3 241 1,069 36 256 1,078 36 334 2,230 74
TOTAL REGIONAL 126 587 20 1,027 5,106 170 1,027 4,632 154 1,389 10,325 344 CSC 29 120 4 117 537 18 127 580 19 169 1,237 41 EOSC 36 192 6 98 444 15 135 557 19 169 1,193 40 MSC 30 125 4 238 1,078 36 260 1,348 45 300 2,551 85 NEOAMC 164 397 13 84 359 12 65 273 9 311 1,029 34 NOC 50 211 7 316 1,409 47 331 1,493 50 425 3,113 104 TCC 112 449 15 611 2,925 98 722 3,374 112 933 6,748 225 OSU-OKC 100 436 15 210 1,309 44 252 1,543 51 392 3,288 110 OSUTB-OKM 14 66 2 85 577 19 95 589 20 114 1,232 41 WOSC 20 95 3 135 647 22 116 539 18 162 1,281 43 RCC 18 99 3 445 1,865 62 440 2,011 67 585 3,975 133 CASC 25 112 4 157 820 27 170 809 27 222 1,741 58 SSC 13 50 2 136 688 23 144 629 21 192 1,367 46 RSC 39 182 6 244 1,142 38 248 1,130 38 361 2,454 82 OCCC 49 228 8 404 2,288 76 101 528 18 482 3,044 101
TOTAL COMMUNITY 699 2,762 92 3,280 16,088 536 3,206 15,403 513 4,817 34,253 1,142 TOTAL PUBLIC 864 3,421 114 4,449 21,802 727 4,334 20,467 682 6,422 45,690 1,523
SOURCE: UDSENR11, 01/31/08 NOTE: FTE may not total due to rounding of calculated values. ** Did not report. *** Full-year is unduplicated between semesters. * Full-time equivalent (FTE): An annual FTE is calculated for an undergraduate by dividing the total number of credit hours enrolled by all undergraduate students by 30. The graduate and professional FTE is calculated by dividing the total number of credit hours enrolled by all graduate and professional students by 24.
Oklahoma State Regents for Higher Education, Student Data Report 2006-07 55
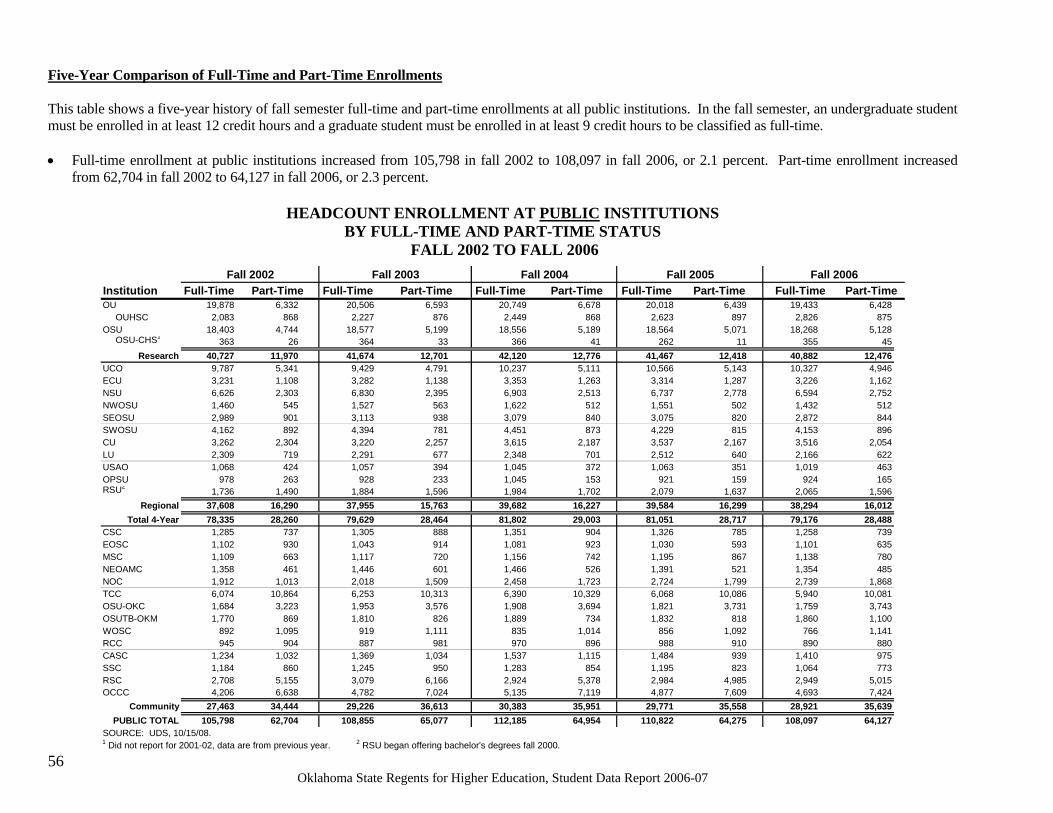
Five-Year Comparison of Full-Time and Part-Time Enrollments
This table shows a five-year history of fall semester full-time and part-time enrollments at all public institutions. In the fall semester, an undergraduate student must be enrolled in at least 12 credit hours and a graduate student must be enrolled in at least 9 credit hours to be classified as full-time.
• Full-time enrollment at public institutions increased from 105,798 in fall 2002 to 108,097 in fall 2006, or 2.1 percent. Part-time enrollment increased from 62,704 in fall 2002 to 64,127 in fall 2006, or 2.3 percent.
HEADCOUNT ENROLLMENT AT PUBLIC INSTITUTIONS
BY FULL-TIME AND PART-TIME STATUS
FALL 2002 TO FALL 2006
Fall 2002 Fall 2003 Fall 2004 Fall 2005 Fall 2006
Institution Full-Time Part-Time Full-Time Part-Time Full-Time Part-Time Full-Time Part-Time Full-Time Part-Time OU 19,878 6,332 20,506 6,593 20,749 6,678 20,018 6,439 19,433 6,428
OUHSC 2,083 868 2,227 876 2,449 868 2,623 897 2,826 875
OSU 18,403 4,744 18,577 5,199 18,556 5,189 18,564 5,071 18,268 5,128 OSU-CHS1
363 26 364 33 366 41 262 11 355 45
Research 40,727 11,970 41,674 12,701 42,120 12,776 41,467 12,418 40,882 12,476 UCO 9,787 5,341 9,429 4,791 10,237 5,111 10,566 5,143 10,327 4,946 ECU 3,231 1,108 3,282 1,138 3,353 1,263 3,314 1,287 3,226 1,162 NSU 6,626 2,303 6,830 2,395 6,903 2,513 6,737 2,778 6,594 2,752
NWOSU 1,460 545 1,527 563 1,622 512 1,551 502 1,432 512
SEOSU 2,989 901 3,113 938 3,079 840 3,075 820 2,872 844
SWOSU 4,162 892 4,394 781 4,451 873 4,229 815 4,153 896
CU 3,262 2,304 3,220 2,257 3,615 2,187 3,537 2,167 3,516 2,054
LU 2,309 719 2,291 677 2,348 701 2,512 640 2,166 622
USAO 1,068 424 1,057 394 1,045 372 1,063 351 1,019 463
OPSU 978 263 928 233 1,045 153 921 159 924 165
RSU2 1,736 1,490 1,884 1,596 1,984 1,702 2,079 1,637 2,065 1,596
Regional 37,608 16,290 37,955 15,763 39,682 16,227 39,584 16,299 38,294 16,012 Total 4-Year 78,335 28,260 79,629 28,464 81,802 29,003 81,051 28,717 79,176 28,488
CSC 1,285 737 1,305 888 1,351 904 1,326 785 1,258 739
EOSC 1,102 930 1,043 914 1,081 923 1,030 593 1,101 635
MSC 1,109 663 1,117 720 1,156 742 1,195 867 1,138 780
NEOAMC 1,358 461 1,446 601 1,466 526 1,391 521 1,354 485
NOC 1,912 1,013 2,018 1,509 2,458 1,723 2,724 1,799 2,739 1,868 TCC 6,074 10,864 6,253 10,313 6,390 10,329 6,068 10,086 5,940 10,081 OSU-OKC 1,684 3,223 1,953 3,576 1,908 3,694 1,821 3,731 1,759 3,743
OSUTB-OKM 1,770 869 1,810 826 1,889 734 1,832 818 1,860 1,100 WOSC 892 1,095 919 1,111 835 1,014 856 1,092 766 1,141
RCC 945 904 887 981 970 896 988 910 890 880
CASC 1,234 1,032 1,369 1,034 1,537 1,115 1,484 939 1,410 975
SSC 1,184 860 1,245 950 1,283 854 1,195 823 1,064 773
RSC 2,708 5,155 3,079 6,166 2,924 5,378 2,984 4,985 2,949 5,015 OCCC 4,206 6,638 4,782 7,024 5,135 7,119 4,877 7,609 4,693 7,424
Community 27,463 34,444 29,226 36,613 30,383 35,951 29,771 35,558 28,921 35,639 PUBLIC TOTAL 105,798 62,704 108,855 65,077 112,185 64,954 110,822 64,275 108,097 64,127
SOURCE: UDS, 10/15/08. 1 Did not report for 2001-02, data are from previous year. 2 RSU began offering bachelor's degrees fall 2000.
Oklahoma State Regents for Higher Education, Student Data Report 2006-07
56
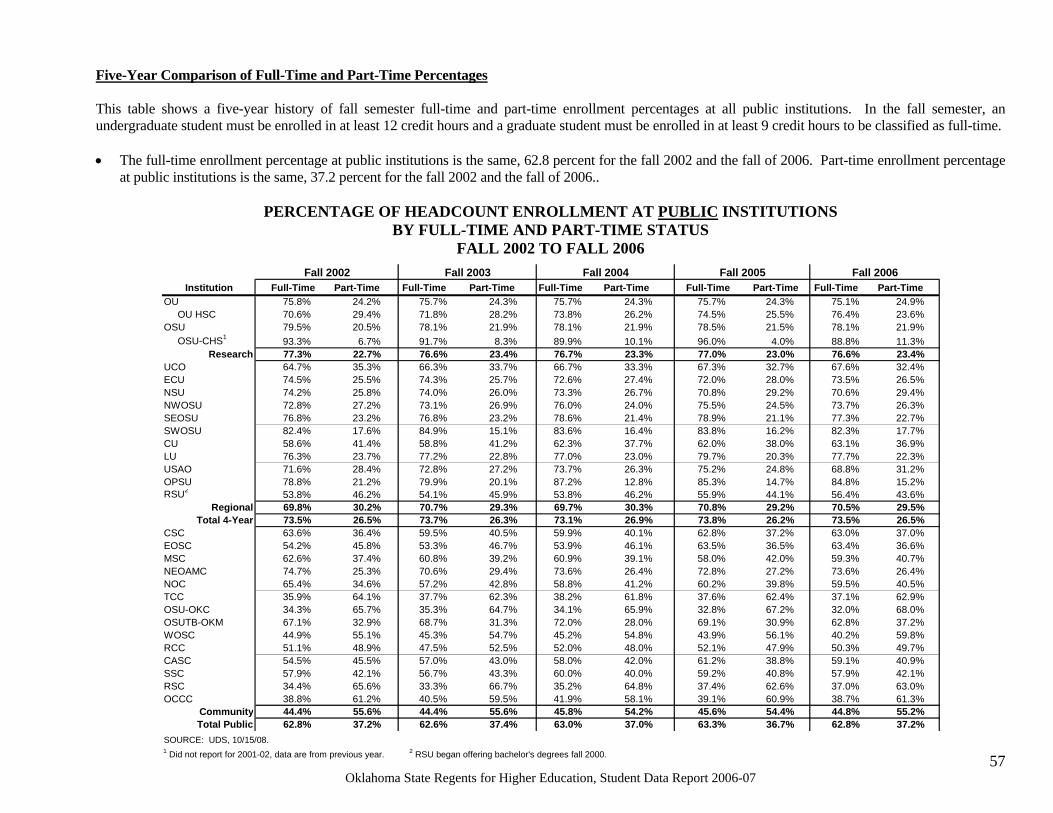
Five-Year Comparison of Full-Time and Part-Time Percentages This table shows a five-year history of fall semester full-time and part-time enrollment percentages at all public institutions. In the fall semester, an undergraduate student must be enrolled in at least 12 credit hours and a graduate student must b e enrolled in at least 9 credit hours to be classified as full-time. • The full-time enrollment percentage at public institutions is the same, 62.8 percent for the fall 2002 and the fall of 2006. Part-time enroll ment percentage
at public institutions is the same, 37.2 percent for the fall 2002 and the fall of 2006..
PERCENTAGE OF HEADCOUNT ENROLLMENT AT PUBLIC INSTITUTIONS BY FULL-TIME AND PART-TIME STATUS
FALL 2002 TO FALL 2006
Fall 2002 Fall 2003 Fall 2004 Fall 2005 Fall 2006 Institution Full-Time Part-Time Full-Time Part-Time Full-Time Part-Time Full-Time Part-Time Full-Time Part-Time
OU OU HSC OSU OSU-CHS1
Research UCO ECU NSU NWOSU SEOSU SWOSU CU LU USAO OPSU RSU2
Regional Total 4-Year
CSC EOSC MSC NEOAMC NOC TCC OSU-OKC OSUTB-OKM WOSC RCC CASC SSC RSC OCCC
Community Total Public
75.8% 70.6% 79.5% 93.3%
24.2% 29.4% 20.5%
6.7%
75.7% 71.8% 78.1% 91.7%
24.3% 28.2% 21.9%
8.3%
75.7% 73.8% 78.1% 89.9%
24.3% 26.2% 21.9% 10.1%
75.7% 74.5% 78.5% 96.0%
24.3% 25.5% 21.5%
4.0%
75.1% 76.4% 78.1% 88.8%
24.9%23.6% 21.9%11.3%
77.3% 22.7% 76.6% 23.4% 76.7% 23.3% 77.0% 23.0% 76.6% 23.4% 64.7% 74.5% 74.2% 72.8% 76.8%
35.3% 25.5% 25.8% 27.2% 23.2%
66.3% 74.3% 74.0% 73.1% 76.8%
33.7% 25.7% 26.0% 26.9% 23.2%
66.7% 72.6% 73.3% 76.0% 78.6%
33.3% 27.4% 26.7% 24.0% 21.4%
67.3% 72.0% 70.8% 75.5% 78.9%
32.7% 28.0% 29.2% 24.5% 21.1%
67.6% 73.5% 70.6% 73.7% 77.3%
32.4% 26.5% 29.4% 26.3% 22.7%
82.4% 58.6% 76.3%
17.6% 41.4% 23.7%
84.9% 58.8% 77.2%
15.1% 41.2% 22.8%
83.6% 62.3% 77.0%
16.4% 37.7% 23.0%
83.8% 62.0% 79.7%
16.2% 38.0% 20.3%
82.3% 63.1% 77.7%
17.7% 36.9% 22.3%
71.6% 78.8% 53.8%
28.4% 21.2% 46.2%
72.8% 79.9% 54.1%
27.2% 20.1% 45.9%
73.7% 87.2% 53.8%
26.3% 12.8% 46.2%
75.2% 85.3% 55.9%
24.8% 14.7% 44.1%
68.8% 84.8% 56.4%
31.2% 15.2% 43.6%
69.8% 30.2% 70.7% 29.3% 69.7% 30.3% 70.8% 29.2% 70.5% 29.5% 73.5% 26.5% 73.7% 26.3% 73.1% 26.9% 73.8% 26.2% 73.5% 26.5% 63.6% 54.2% 62.6% 74.7% 65.4%
36.4% 45.8% 37.4% 25.3% 34.6%
59.5% 53.3% 60.8% 70.6% 57.2%
40.5% 46.7% 39.2% 29.4% 42.8%
59.9% 53.9% 60.9% 73.6% 58.8%
40.1% 46.1% 39.1% 26.4% 41.2%
62.8% 63.5% 58.0% 72.8% 60.2%
37.2% 36.5% 42.0% 27.2% 39.8%
63.0% 63.4% 59.3% 73.6% 59.5%
37.0% 36.6% 40.7% 26.4% 40.5%
35.9% 34.3% 67.1% 44.9% 51.1%
64.1% 65.7% 32.9% 55.1% 48.9%
37.7% 35.3% 68.7% 45.3% 47.5%
62.3% 64.7% 31.3% 54.7% 52.5%
38.2% 34.1% 72.0% 45.2% 52.0%
61.8% 65.9% 28.0% 54.8% 48.0%
37.6% 32.8% 69.1% 43.9% 52.1%
62.4% 67.2% 30.9% 56.1% 47.9%
37.1% 32.0% 62.8% 40.2% 50.3%
62.9% 68.0% 37.2% 59.8% 49.7%
54.5% 57.9% 34.4% 38.8%
45.5% 42.1% 65.6% 61.2%
57.0% 56.7% 33.3% 40.5%
43.0% 43.3% 66.7% 59.5%
58.0% 60.0% 35.2% 41.9%
42.0% 40.0% 64.8% 58.1%
61.2% 59.2% 37.4% 39.1%
38.8% 40.8% 62.6% 60.9%
59.1% 57.9% 37.0% 38.7%
40.9% 42.1% 63.0% 61.3%
44.4% 55.6% 44.4% 55.6% 45.8% 54.2% 45.6% 54.4% 44.8% 55.2% 62.8% 37.2% 62.6% 37.4% 63.0% 37.0% 63.3% 36.7% 62.8% 37.2%
SOURCE: UDS, 10/15/08. 1 Did not report for 2001-02, data are from previous year. 2 RSU began offering bachelor's degrees fall 2000.
Oklahoma State Regents fo r Higher Education, Stude nt Data Report 2006-07 57

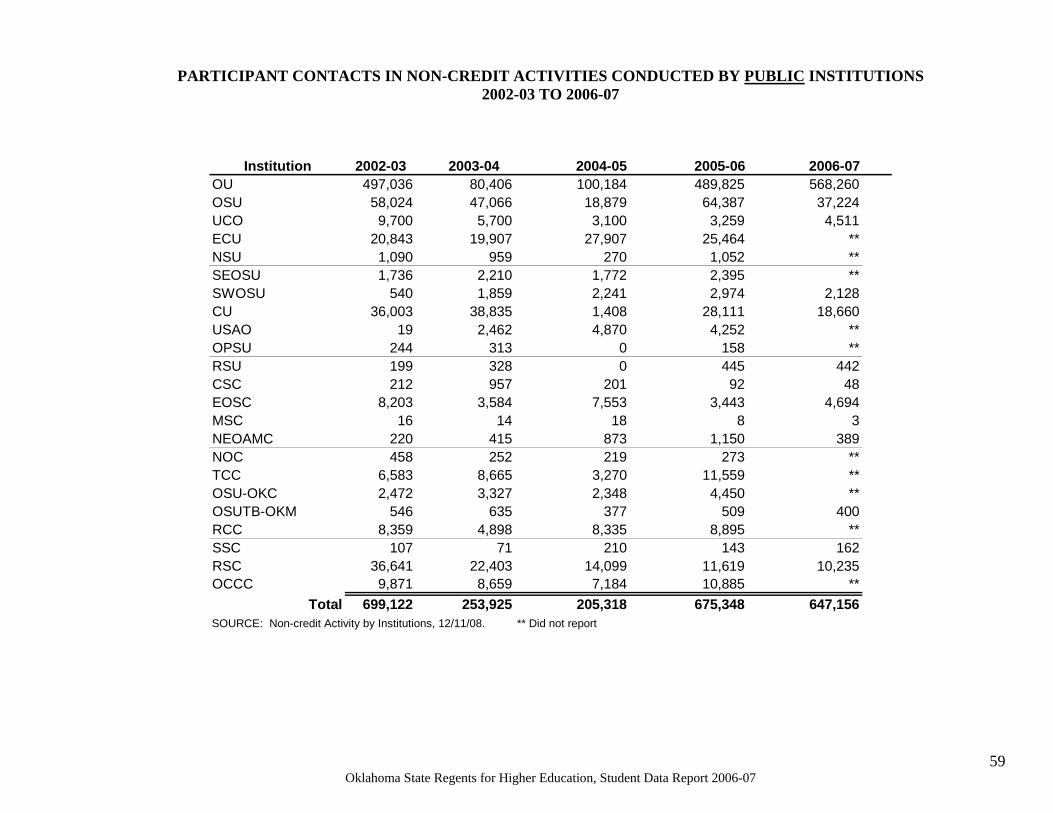
Non-Credit Activity
The following tables describe the nature and level of non-credit activity provided by Oklahoma public colleges and universities. The information provided indicates a range of activities and groups served. Participant contacts indicate the number of participants recorded as attending and participating in non-credit activities; therefore, an individual citizen may be counted in more than one activity. In some activities, participant contacts may be estimated, as in large lectures. Non-credit courses and activities are provided on a self-supporting basis and are not reported for state funding.
• During 2006-07, 23 public institutions reported participant contacts totaling 647,156 in non-credit activities at two research universities, nine regional universities, and 12 community colleges. This compares to 699,122 participant contacts for 2002-03.
• Between 2002-03 and 2006-07, non-credit activity participants averaged 496,173 for the state system. At the research universities non-credit activity averaged 392,258 participants; the regional universities, 55,673; and the community colleges, 48,242. Non-credit activity fluctuates widely from year to year.
• The Group Served table reflects the reporting institution's determination of the group to which an activity was primarily directed. According to the table, the major groups served were education, life, physical, and social science, and protective services.
• The Format table shows that special training programs and workshops are the most common formats for non-credit activities.
• The four counties where the most participation took place were Cleveland, Oklahoma, Tulsa and Comanche counties.
• The Major Focus of Activity table reflects the reporting institution’s determination of the primary focus of the activity. According to the table, most non-credit activity was focused toward education; healthcare; and public administration.
• The Method of Delivery table indicates that 93.6 percent of non-credit activity participants were traditionally enrolled, while 0.4 percent participated in courses online.
Oklahoma State Regents for Higher Education, Student Data Report 2006-07 58
PARTICIPANT CONTACTS IN NON-CREDIT ACTIVITIES CONDUCTED BY PUBLIC INSTITUTIONS 2002-03 TO 2006-07
Institution 2002-03 2003-04 2004-05 2005-06 2006-07 OU 497,036 80,406 100,184 489,825 568,260 OSU 58,024 47,066 18,879 64,387 37,224 UCO 9,700 5,700 3,100 3,259 4,511 ECU 20,843 19,907 27,907 25,464 ** NSU 1,090 959 270 1,052 ** SEOSU 1,736 2,210 1,772 2,395 ** SWOSU 540 1,859 2,241 2,974 2,128 CU 36,003 38,835 1,408 28,111 18,660 USAO 19 2,462 4,870 4,252 ** OPSU 244 313 0 158 ** RSU 199 328 0 445 442 CSC 212 957 201 92 48 EOSC 8,203 3,584 7,553 3,443 4,694 MSC 16 14 18 8 3 NEOAMC 220 415 873 1,150 389 NOC 458 252 219 273 ** TCC 6,583 8,665 3,270 11,559 ** OSU-OKC 2,472 3,327 2,348 4,450 ** OSUTB-OKM 546 635 377 509 400 RCC 8,359 4,898 8,335 8,895 ** SSC 107 71 210 143 162 RSC 36,641 22,403 14,099 11,619 10,235 OCCC 9,871 8,659 7,184 10,885 **
Total 699,122 253,925 205,318 675,348 647,156 SOURCE: Non-credit Activity by Institutions, 12/11/08. ** Did not report
Oklahoma State Regents for Higher Education, Student Data Report 2006-07 59
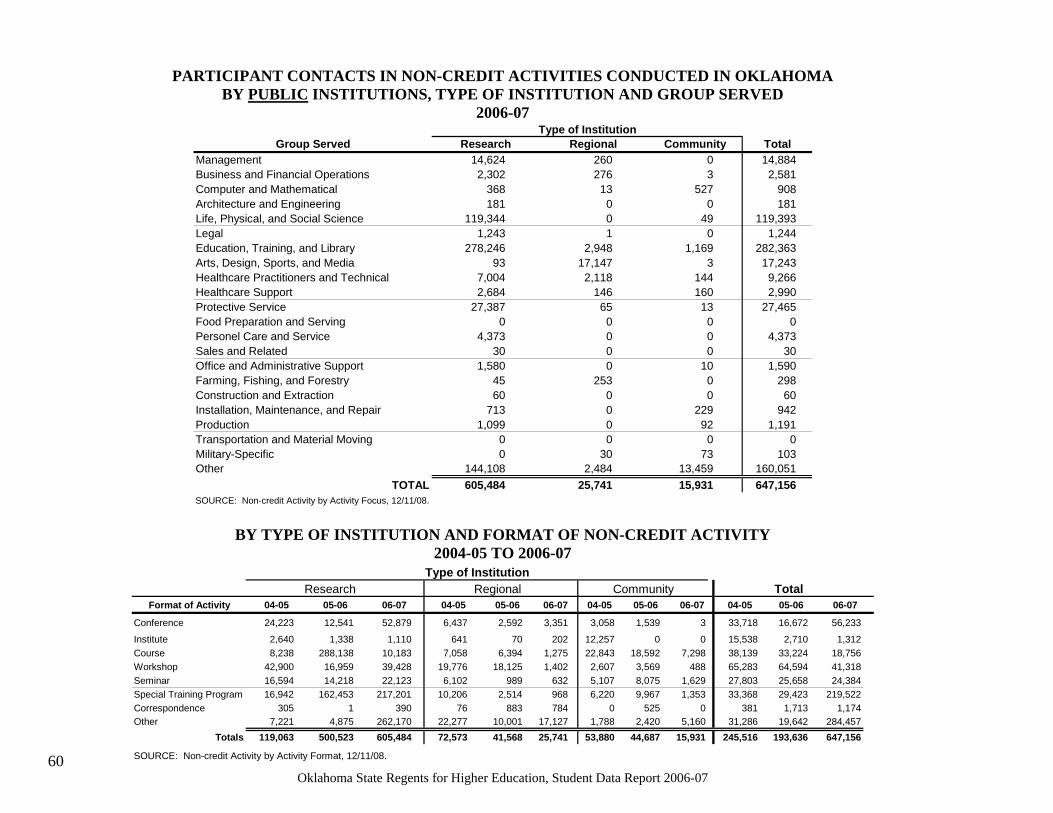
PARTICIPANT CONTACTS IN NON-CREDIT ACTIVITIES CONDUCTED IN OKLAHOMA
BY PUBLIC INSTITUTIONS, TYPE OF INSTITUTION AND GROUP SERVED
2006-07
Type of Institution Group Served Research Regional Community Total
Management 14,624 260 0 14,884 Business and Financial Operations 2,302 276 3 2,581 Computer and Mathematical 368 13 527 908 Architecture and Engineering 181 0 0 181 Life, Physical, and Social Science 119,344 0 49 119,393 Legal 1,243 1 0 1,244 Education, Training, and Library 278,246 2,948 1,169 282,363 Arts, Design, Sports, and Media 93 17,147 3 17,243 Healthcare Practitioners and Technical 7,004 2,118 144 9,266 Healthcare Support 2,684 146 160 2,990 Protective Service 27,387 65 13 27,465 Food Preparation and Serving 0 0 0 0 Personel Care and Service 4,373 0 0 4,373 Sales and Related 30 0 0 30 Office and Administrative Support 1,580 0 10 1,590 Farming, Fishing, and Forestry 45 253 0 298 Construction and Extraction 60 0 0 60 Installation, Maintenance, and Repair 713 0 229 942 Production 1,099 0 92 1,191 Transportation and Material Moving Military-Specific Other
TOTAL
0 0
144,108 605,484
0 30
2,484 25,741
0 73
13,459 15,931
0 103
160,051 647,156
SOURCE: Non-credit Activity by Activity Focus, 12/11/08.
BY TYPE OF INSTITUTION AND FORMAT OF NON-CREDIT ACTIVITY 2004-05 TO 2006-07
Type of Institution Research Regional Community Total
Format of Activity 04-05 05-06 06-07 04-05 05-06 06-07 06-07 05-0604-05 04-05 05-06 06-07
Conference 24,223 12,541 52,879 6,437 2,592 3,351 3,058 1,539 3 33,718 16,672 56,233
Institute 2,640 1,338 1,110 641 70 202 12,257 0 0 15,538 2,710 1,312 Course 8,238 288,138 10,183 7,058 6,394 1,275 22,843 18,592 7,298 38,139 33,224 18,756 Workshop 42,900 16,959 39,428 19,776 18,125 1,402 2,607 3,569 488 65,283 64,594 41,318 Seminar Special Training Program
16,594 16,942
14,218 162,453
22,123 217,201
6,102 10,206
989 2,514
632 968
5,107 8,075 1,629 6,220 9,967 1,353
27,803 33,368
25,658 29,423
24,384 219,522
Correspondence 305 1 390 76 883 784 0 525 0 381 1,713 1,174 Other
Totals 7,221
119,063 4,875
500,523 262,170 605,484
22,277 72,573
10,001 41,568
17,127 25,741
1,788 2,420 5,160 53,880 44,687 15,931
31,286 245,516
19,642 193,636
284,457 647,156
SOURCE: Non-credit Activity by Activity Format, 12/11/08.
Oklahoma State Regents for Higher Education, Student Data Report 2006-07 60
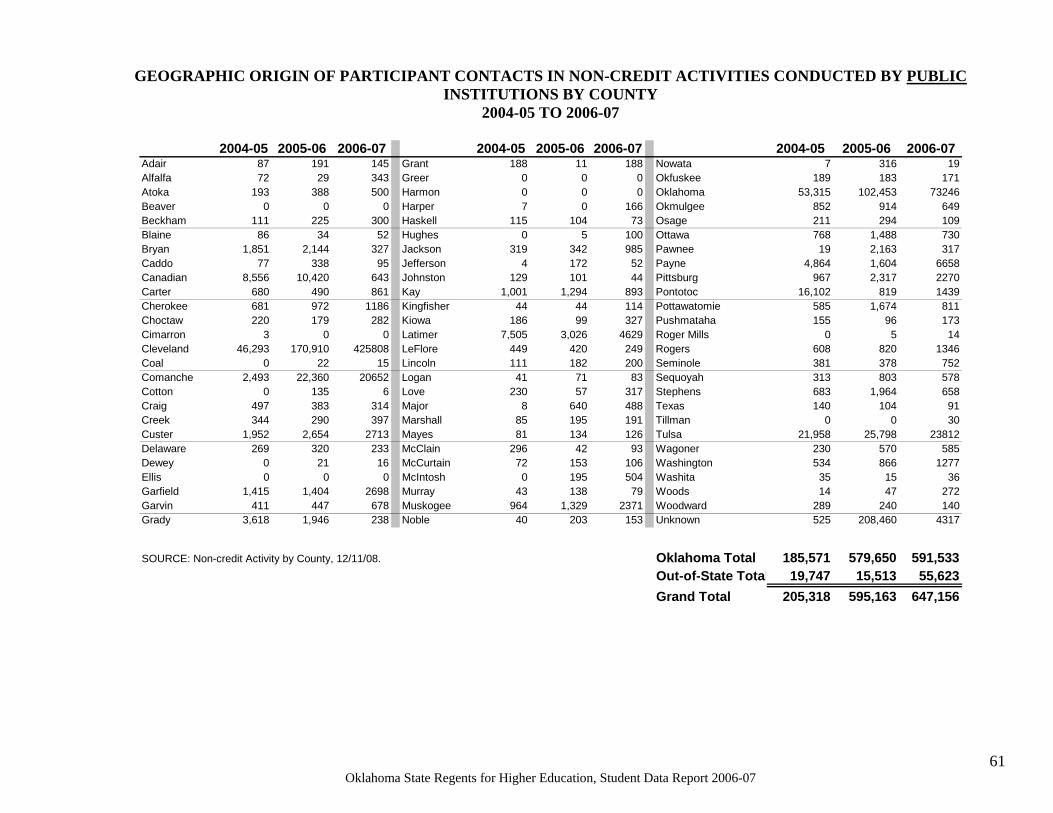
GEOGRAPHIC ORIGIN OF PARTICIPANT CONTACTS IN NON-CREDIT ACTIVITIES CONDUCTED BY PUBLIC INSTITUTIONS BY COUNTY
2004-05 TO 2006-07
2004-05 2005-06 2006-07 2004-05 2005-06 2006-07 2004-05 2005-06 2006-07 Adair 87 191 145 Grant 188 11 188 Nowata 7 316 19 Alfalfa 72 29 343 Greer 0 0 0 Okfuskee 189 183 171 Atoka 193 388 500 Harmon 0 0 0 Oklahoma 53,315 102,453 73246 Beaver 0 0 0 Harper 7 0 166 Okmulgee 852 914 649 Beckham 111 225 300 Haskell 115 104 73 Osage 211 294 109 Blaine 86 34 52 Hughes 0 5 100 Ottawa 768 1,488 730 Bryan 1,851 2,144 327 Jackson 319 342 985 Pawnee 19 2,163 317 Caddo 77 338 95 Jefferson 4 172 52 Payne 4,864 1,604 6658 Canadian 8,556 10,420 643 Johnston 129 101 44 Pittsburg 967 2,317 2270 Carter 680 490 861 Kay 1,001 1,294 893 Pontotoc 16,102 819 1439 Cherokee 681 972 1186 Kingfisher 44 44 114 Pottawatomie 585 1,674 811 Choctaw 220 179 282 Kiowa 186 99 327 Pushmataha 155 96 173 Cimarron 3 0 0 Latimer 7,505 3,026 4629 Roger Mills 0 5 14 Cleveland 46,293 170,910 425808 LeFlore 449 420 249 Rogers 608 820 1346 Coal 0 22 15 Lincoln 111 182 200 Seminole 381 378 752 Comanche 2,493 22,360 20652 Logan 41 71 83 Sequoyah 313 803 578 Cotton 0 135 6 Love 230 57 317 Stephens 683 1,964 658 Craig 497 383 314 Major 8 640 488 Texas 140 104 91 Creek 344 290 397 Marshall 85 195 191 Tillman 0 0 30 Custer 1,952 2,654 2713 Mayes 81 134 126 Tulsa 21,958 25,798 23812 Delaware 269 320 233 McClain 296 42 93 Wagoner 230 570 585 Dewey 0 21 16 McCurtain 72 153 106 Washington 534 866 1277 Ellis 0 0 0 McIntosh 0 195 504 Washita 35 15 36 Garfield 1,415 1,404 2698 Murray 43 138 79 Woods 14 47 272 Garvin 411 447 678 Muskogee 964 1,329 2371 Woodward 289 240 140 Grady 3,618 1,946 238 Noble 40 203 153 Unknown 525 208,460 4317
SOURCE: Non-credit Activity by County, 12/11/08. Oklahoma Total 185,571 579,650 591,533 Out-of-State Total 19,747 15,513 55,623 Grand Total 205,318 595,163 647,156
Oklahoma State Regents for Higher Education, Student Data Report 2006-07 61
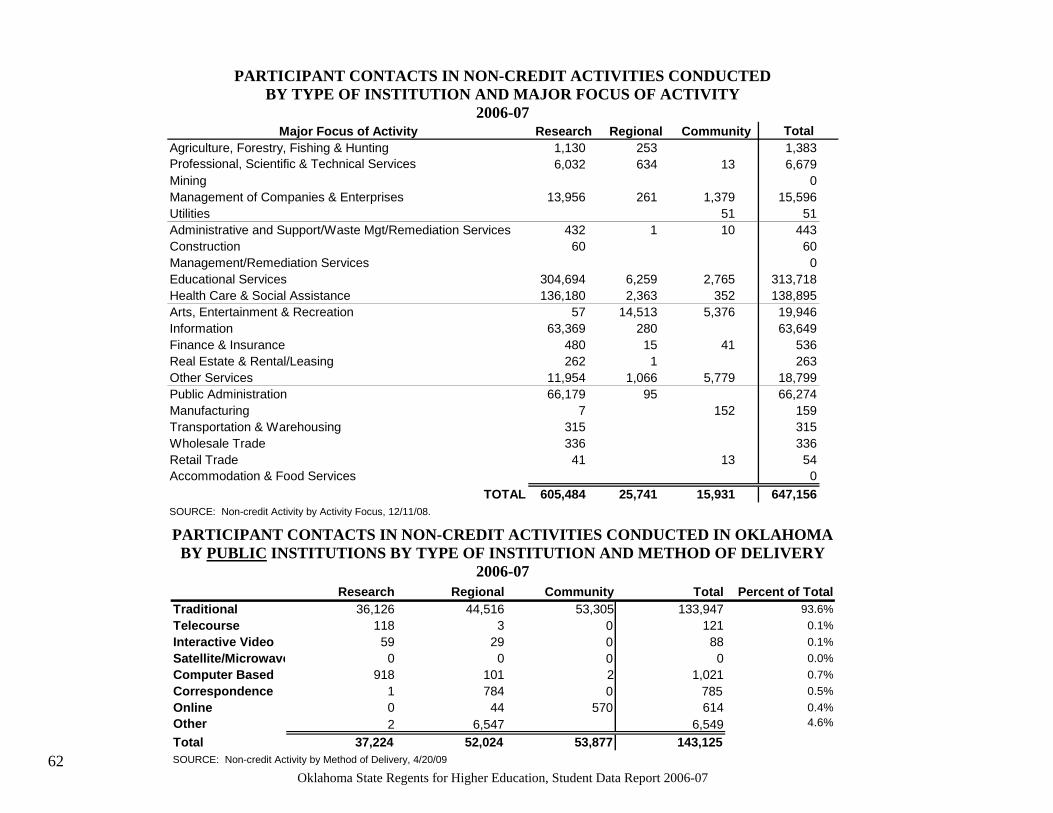
PARTICIPANT CONTACTS IN NON-CREDIT ACTIVITIES CONDUCTED
BY TYPE OF INSTITUTION AND MAJOR FOCUS OF ACTIVITY
2006-07
Major Focus of Activity Research Regional Community Total Agriculture, Forestry, Fishing & Hunting 1,130 253 1,383 Professional, Scientific & Technical Services 6,032 634 13 6,679 Mining 0 Management of Companies & Enterprises 13,956 261 1,379 15,596 Utilities Administrative and Support/Waste Mgt/Remediation Services 432 1
51 10
51 443
Construction 60 60 Management/Remediation Services 0 Educational Services 304,694 6,259 2,765 313,718 Health Care & Social Assistance Arts, Entertainment & Recreation
136,180 57
2,363 14,513
352 5,376
138,895 19,946
Information 63,369 280 63,649 Finance & Insurance 480 15 41 536 Real Estate & Rental/Leasing 262 1 263 Other Services Public Administration Manufacturing Transportation & Warehousing Wholesale Trade Retail Trade Accommodation & Food Services
TOTAL
11,954 66,179
7 315 336 41
605,484
1,066 95
25,741
5,779
152
13
15,931
18,799 66,274
159 315 336 54
0 647,156
SOURCE: Non-credit Activity by Activity Focus, 12/11/08.
PARTICIPANT CONTACTS IN NON-CREDIT ACTIVITIES CONDUCTED IN OKLAHOMA BY PUBLIC INSTITUTIONS BY TYPE OF INSTITUTION AND METHOD OF DELIVERY
2006-07 Research Regional Community Total Percent of Total
Traditional 36,126 44,516 53,305 Telecourse 118 3 0 Interactive Video 59 29 0 Satellite/Microwave 0 0 0 Computer Based 918 101 2 Correspondence 1 784 0 Online 0 44 570 Other 2 6,547 Total 37,224 52,024 53,877 SOURCE: Non-credit Activity by Method of Delivery, 4/20/09
133,947 93.6% 121 0.1%
88 0.1% 0 0.0%
1,021 0.7% 785 0.5% 614 0.4%
6,549 4.6%
143,125
Oklahoma State Regents for Higher Education, Student Data Report 2006-07 62
Related Documents