Section 6.3 Areas Under Any Normal Curve

Welcome message from author
This document is posted to help you gain knowledge. Please leave a comment to let me know what you think about it! Share it to your friends and learn new things together.
Transcript

Section 6.3
Areas Under Any Normal Curve

2
Focus Points
• Compute the probability of “standardized events.”
• Find a z score from a given normal probability (inverse normal).
• Use the inverse normal to solve guarantee problems.
• Checking for Normality
3
1. Normal Distribution Areas

4
1. Normal Distribution Areas
Procedure:

5
Example 7 – Normal distribution probability
Let x have a normal distribution with = 10 and = 2.Find the probability that an x value selected at random from this distribution is between 11 and 14. In symbols, find P(11 x 14).
Solution:
Since probabilities correspond to areas under the distribution curve, we want to find the area under the x curve above the interval from x = 11 to x = 14.
To do so, we will convert the x values to standard z values and then use Table 5 of Appendix II to find the corresponding area under the standard curve.

6
Example 7 – Solution
We use the formula
to convert the given x interval to a z interval.
(Use x = 11, = 10, = 2.)
(Use x = 14, = 10, = 2.)
cont’d

7
Example 7 – Solution
The corresponding areas under the x and z curves are shown in Figure 6-23.
Corresponding Areas Under the x Curve and z Curve
Figure 6-23
cont’d

8
Example 7 – Solution
From Figure 6-23 we see that
P(11 x 14) = P(0.50 z 2.00)
= P(z 2.00) – P(z 0.50)
= 0.9772 – 0.6915
= 0.2857
Interpretation The probability is 0.2857 that an x value selected at random from a normal distribution with mean 10 and standard deviation 2 lies between 11 and 14.
cont’d
9
Guided Exercise 7
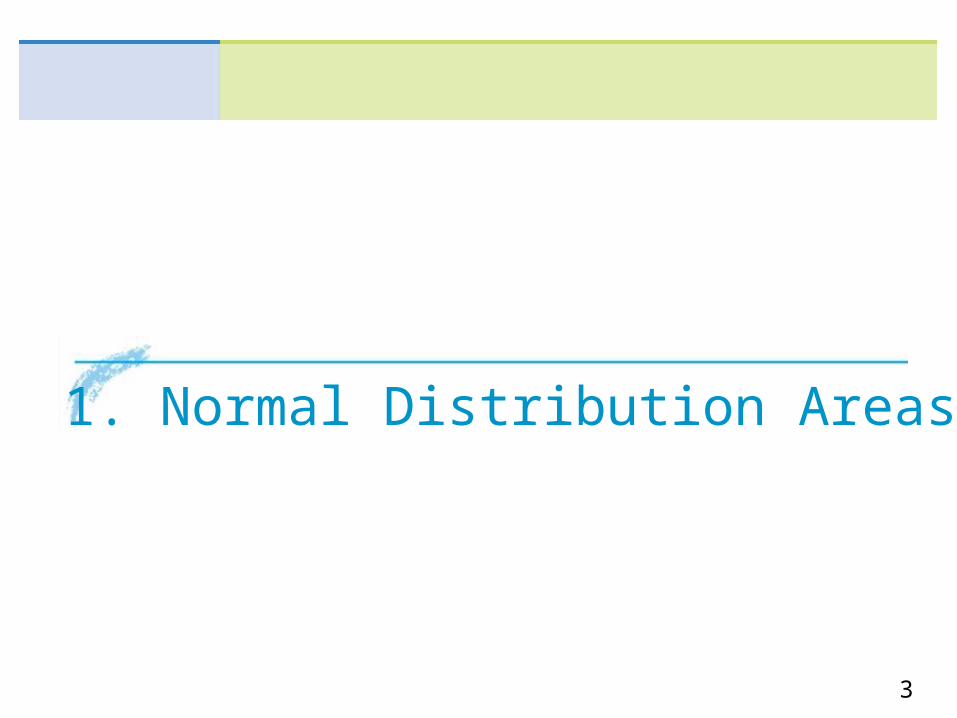
Sunshine Stereo cassette decks have a deck life that is normally distributed with a mean of 2.3 years and a standard deviation of 0.4 year. What is the probability that a cassette deck will break down during the guarantee period of 2 years?
(a)Let x represent the life of a cassette deck. The statement that the cassette deck breaks during the 2-year guarantee period means the life is less than 2 years, or x ≤ 2. Convert this to a statement about z. z ≤ −0.75
10
Guided Exercise 7
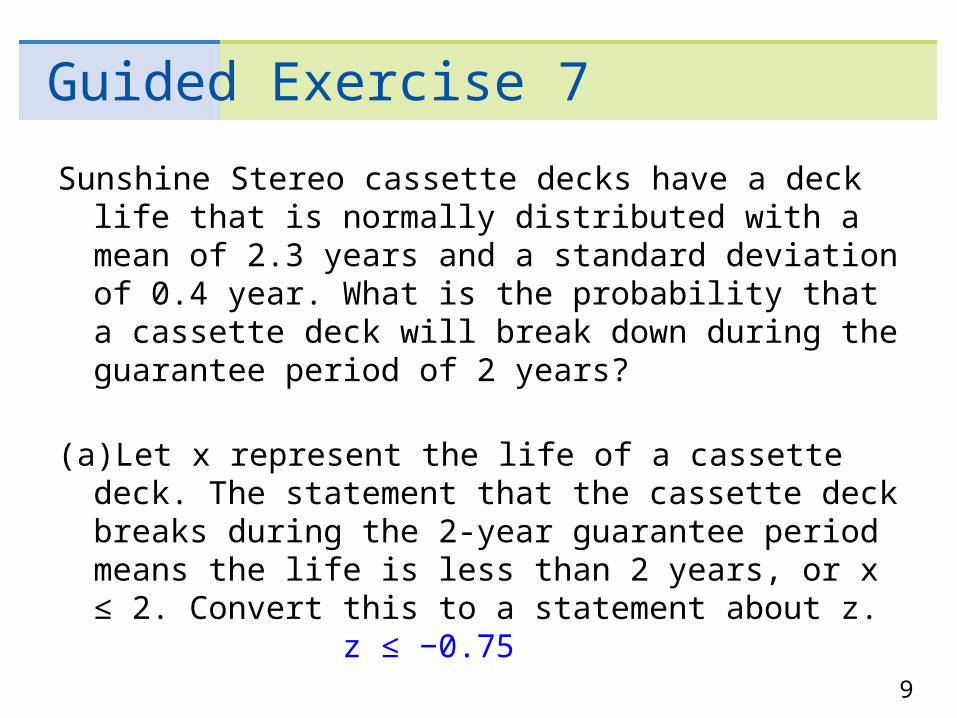
(b) Indicate the area to be found in the normal curve. Does this area correspond to the probability that z ≤ −0.75?
(d) What is the probability that the cassette deck will break before the end of the guarantee period?
P(x ≤ 2) = P(z ≤ −0.75) = 0.2266
or: normalcdf(−5, −0.75, 0, 1)
or: normalcdf(−5, 2, 2.3, 0.4)

11
2. Inverse Normal Distribution

12
2. Inverse Normal Distribution
Sometimes we need to find z or x values that correspond toa given area under the normal curve.
This situation arises when we want to specify a guaranteeperiod such that a given percentage of the total productsproduced by a company last at least as long as the duration of the guarantee period. In such cases, we use the standard normal distribution table “in reverse.”
When we look up an area and find the corresponding zvalue, we are using the inverse normal probability distribution.
13
Example 8 – Find x, given probability
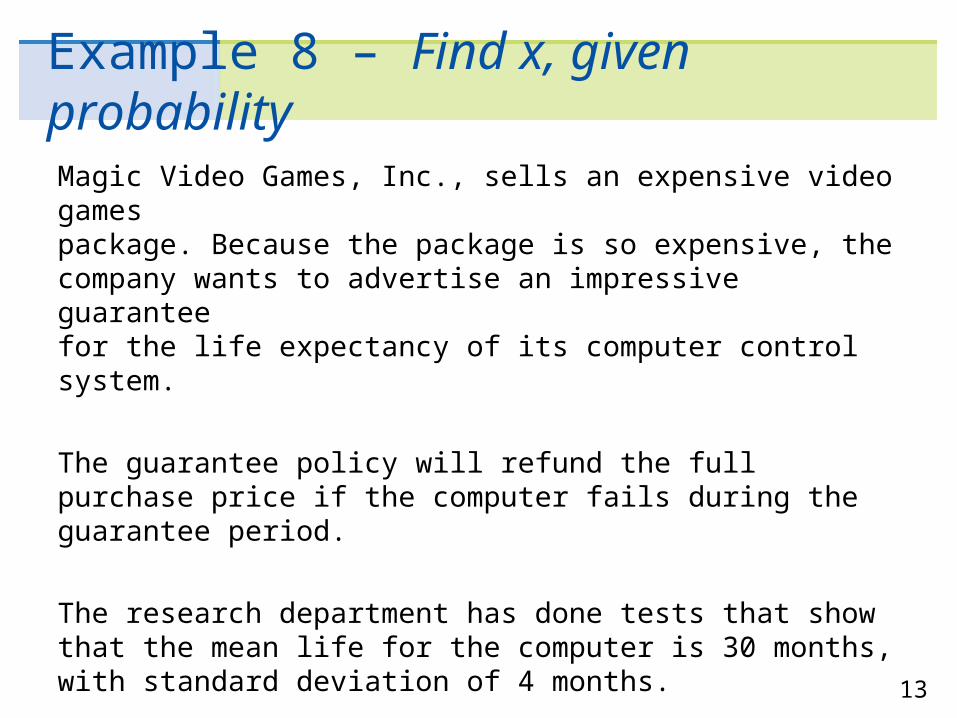
Magic Video Games, Inc., sells an expensive video gamespackage. Because the package is so expensive, the company wants to advertise an impressive guarantee for the life expectancy of its computer control system.
The guarantee policy will refund the full purchase price if the computer fails during the guarantee period.
The research department has done tests that show that the mean life for the computer is 30 months, with standard deviation of 4 months.
14
Example 8 – Find x, given probability
The computer life is normally distributed. How long can the guarantee period be if management does not want to refund the purchase price on more than 7% of the Magic Video packages?
cont’d
15
Example 8 – Solution
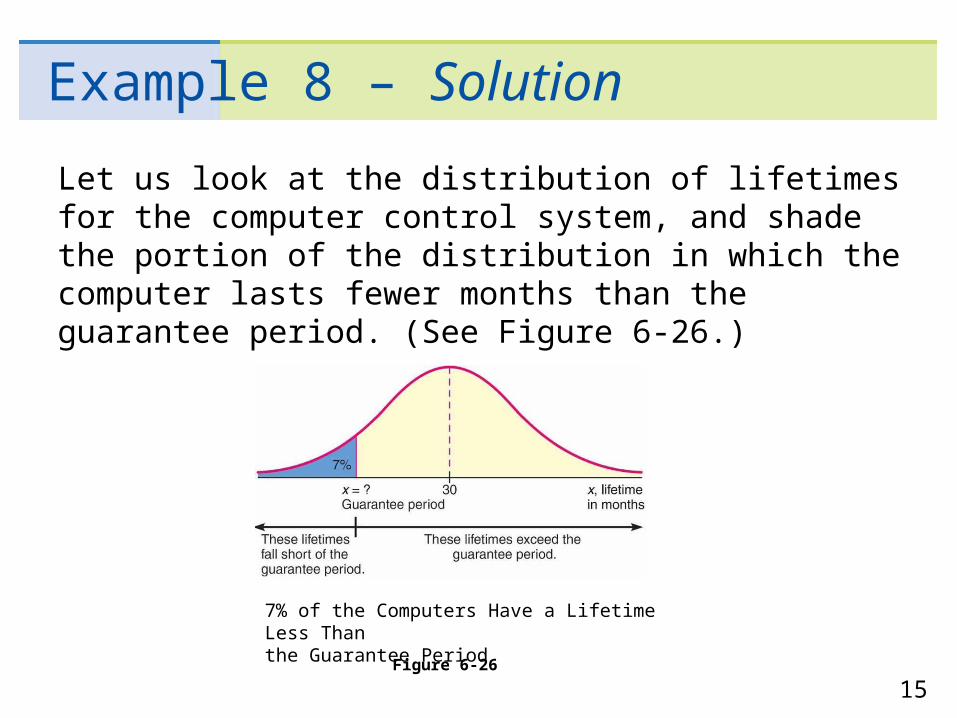
Let us look at the distribution of lifetimes for the computer control system, and shade the portion of the distribution in which the computer lasts fewer months than the guarantee period. (See Figure 6-26.)
7% of the Computers Have a Lifetime Less Than
the Guarantee PeriodFigure 6-26

16
Example 8 – Solution
If a computer system lasts fewer months than the guarantee period, a full-price refund will have to be made.
The lifetimes requiring a refund are in the shaded region in Figure 6-26. This region represents 7% of the total area under the curve.
We can use Table 5 of Appendix II to find the z value such that 7% of the total area under the standard normal curve lies to the left of the z value.
cont’d

17
Example 8 – Solution
Then we convert the z value to its corresponding x value to find the guarantee period. We want to find the z value with 7% of the area under the standard normal curve to the left of z.
Since we are given the area in a left tail, we can use Table 5 of Appendix II directly to find z. The area value is 0.0700.
cont’d

18
Example 8 – Solution
However, this area is not in our table, so we use the closest area, which is 0.0694, and the corresponding z value of z = –1.48(see Table 6-5).
Excerpt from Table 5 of Appendix IITable 6-5
cont’d

19
Example 8 – Solution
To translate this value back to an x value (in months), we use the formula
x = z +
= –1.48(4) + 30 (Use = 4 months and = 30 months.)
= 24.08 months
Interpretation The company can guarantee the Magic Video Games package for x = 24 months. For this guarantee period, they expect to refund the purchase price of no more than 7% of the video games packages.
cont’d

20
Example 9: Find z
Find the z value such that 90% of the area under the standard normal curve lies between −z and z.
Solution:
P(x ≤ ?) = 0.05
invNorm(%, μ, σ)invNorm(0.05, 0, 1) = −1.6449
21
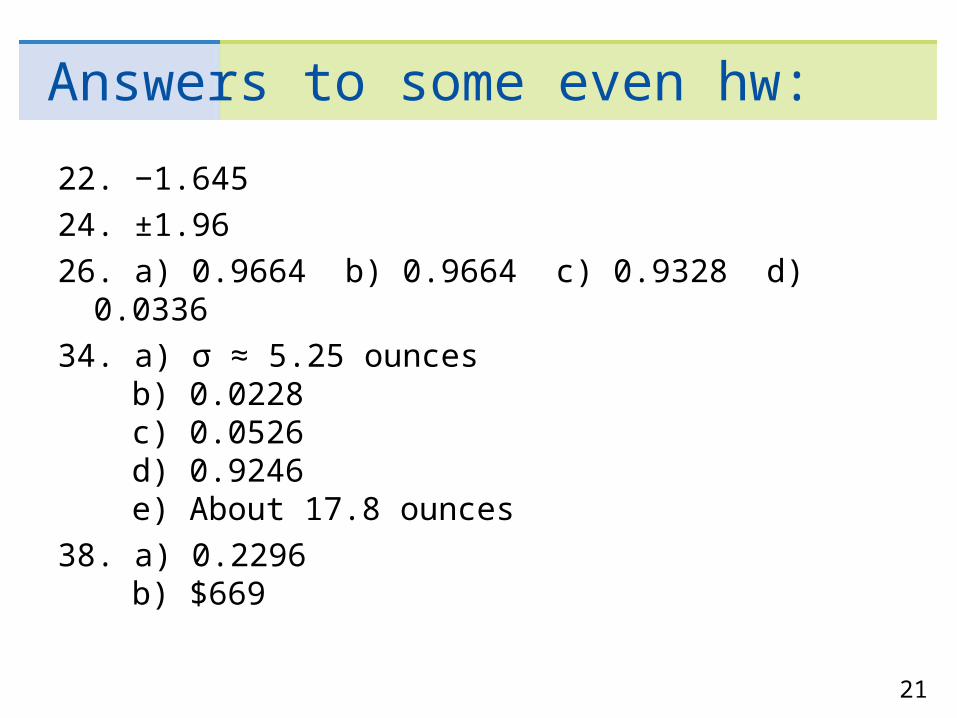
Answers to some even hw:
22. −1.645
24. ±1.96
26. a) 0.9664 b) 0.9664 c) 0.9328 d) 0.0336
34. a) σ ≈ 5.25 ounces b) 0.0228 c) 0.0526 d) 0.9246 e) About 17.8 ounces
38. a) 0.2296 b) $669
Related Documents