Transform Milwaukee 6-1 Metal Product Manufacturing Section 6 – Metal Manufacturing Potential in Milwaukee’s Industrial Corridor The following analysis of metal product manufacturing potential in Milwaukee’s Industrial Corridor considers industry trends, affiliated industries, occupational structures, competing regions and growth projections. For purposes of this analysis, metal product manufacturing is comprised of two sub-sectors: primary metal products (NAICS 331) and fabricated metal products (NAICS 332). The profile draws on industry information compiled by UW-Extension’s Center for Community and Economic Development from IBISWorld Inc., IMPLAN, the U.S. Census Bureau, the U.S. Bureau of Labor Statistics (BLS) and other sources. Note that some of the information included in this analysis is based on national industry trends that may be less applicable to the retention, recruitment or expansion of local metal manufacturing firms. While some caution should be used when interpreting this information, these broader trends coupled with Milwaukee-specific data provide valuable insight into the potential direction of the industry. To provide local and regional perspectives, figures are included for both Milwaukee County and the six counties in the Balance of the M7 Region. Industry Overview In 2011, the domestic primary metal manufacturing industry accounted for 5,700 establishments with total revenues of approximately $275 billion. Industries in primary metal manufacturing smelt and/or refine ferrous and nonferrous metals from ore, pig or scrap, using electrometallurgical and other process metallurgical techniques. Establishments also manufacture metal alloys and superalloys by introducing other chemical elements to pure metals. The output of smelting and refining, usually in ingot form, is used in rolling, drawing, and extruding operations to make sheet, strip, bar, rod, or wire, and in molten form to make castings and other basic metal products. 1 According to IBISWorld Inc., the domestic industry has low to moderate levels of concentration. Specific categories within the primary metal manufacturing industry include: Iron and Steel Mills and Ferroalloy Manufacturing (NAICS 3311) – Involves processes such as direct reduction of iron ore; manufacturing pig iron, converting pig iron into steel; making steel and manufacturing shapes; and manufacturing electrometallurgical ferroalloys; Steel Product Manufacturing from Purchased Steel (NAICS 3312) – Includes manufacturing iron and steel tube and pipe, drawing steel wire, and rolling or drawing shapes from purchased iron or steel; Alumina and Aluminum Production and Processing (NAICS 3313) - These establishments are engaged in processes such as refining alumina; making aluminum from alumina; recovering aluminum from scrap; alloying purchased aluminum; and producing aluminum primary forms (e.g. bar, foil, pipe, plate, rods, etc.); Nonferrous Metal (except Aluminum) Production and Processing (NAICS 3314) – Involves smelting ores into nonferrous metals; primary refining of nonferrous metals; producing alloys; and rolling, drawing, or extruding shapes, (e.g., bar, plate, sheet, strip, tube, wire); Foundries (NAICS 3315) – Foundries make castings from purchased metals or in integrated secondary smelting and casting facilities. Processes (e.g. tapping, threading, milling, or machining to tight tolerances) that transform castings into finished products are classified elsewhere based on the product being made. 1 Sources: Bureau of Labor Statistics and IMPLAN. Industry descriptions are from the U.S. Census Bureau.

Welcome message from author
This document is posted to help you gain knowledge. Please leave a comment to let me know what you think about it! Share it to your friends and learn new things together.
Transcript

Transform Milwaukee 6-1 Metal Product Manufacturing
Section 6 – Metal Manufacturing Potential in Milwaukee’s
Industrial Corridor The following analysis of metal product manufacturing potential in Milwaukee’s Industrial Corridor considers
industry trends, affiliated industries, occupational structures, competing regions and growth projections. For
purposes of this analysis, metal product manufacturing is comprised of two sub-sectors: primary metal
products (NAICS 331) and fabricated metal products (NAICS 332). The profile draws on industry information
compiled by UW-Extension’s Center for Community and Economic Development from IBISWorld Inc., IMPLAN,
the U.S. Census Bureau, the U.S. Bureau of Labor Statistics (BLS) and other sources. Note that some of the
information included in this analysis is based on national industry trends that may be less applicable to the
retention, recruitment or expansion of local metal manufacturing firms. While some caution should be used
when interpreting this information, these broader trends coupled with Milwaukee-specific data provide
valuable insight into the potential direction of the industry. To provide local and regional perspectives, figures
are included for both Milwaukee County and the six counties in the Balance of the M7 Region.
Industry Overview
In 2011, the domestic primary metal manufacturing industry accounted for 5,700 establishments with total
revenues of approximately $275 billion. Industries in primary metal manufacturing smelt and/or refine ferrous
and nonferrous metals from ore, pig or scrap, using electrometallurgical and other process metallurgical
techniques. Establishments also manufacture metal alloys and superalloys by introducing other chemical
elements to pure metals. The output of smelting and refining, usually in ingot form, is used in rolling, drawing,
and extruding operations to make sheet, strip, bar, rod, or wire, and in molten form to make castings and
other basic metal products. 1 According to IBISWorld Inc., the domestic industry has low to moderate levels of
concentration. Specific categories within the primary metal manufacturing industry include:
Iron and Steel Mills and Ferroalloy Manufacturing (NAICS 3311) – Involves processes such as direct
reduction of iron ore; manufacturing pig iron, converting pig iron into steel; making steel and
manufacturing shapes; and manufacturing electrometallurgical ferroalloys;
Steel Product Manufacturing from Purchased Steel (NAICS 3312) – Includes manufacturing iron and steel
tube and pipe, drawing steel wire, and rolling or drawing shapes from purchased iron or steel;
Alumina and Aluminum Production and Processing (NAICS 3313) - These establishments are engaged in
processes such as refining alumina; making aluminum from alumina; recovering aluminum from scrap;
alloying purchased aluminum; and producing aluminum primary forms (e.g. bar, foil, pipe, plate, rods, etc.);
Nonferrous Metal (except Aluminum) Production and Processing (NAICS 3314) – Involves smelting ores into
nonferrous metals; primary refining of nonferrous metals; producing alloys; and rolling, drawing, or
extruding shapes, (e.g., bar, plate, sheet, strip, tube, wire);
Foundries (NAICS 3315) – Foundries make castings from purchased metals or in integrated secondary
smelting and casting facilities. Processes (e.g. tapping, threading, milling, or machining to tight tolerances)
that transform castings into finished products are classified elsewhere based on the product being made.
1 Sources: Bureau of Labor Statistics and IMPLAN. Industry descriptions are from the U.S. Census Bureau.
Transform Milwaukee 6-2 Metal Product Manufacturing
The domestic fabricated metal product manufacturing industry included about 58,000 establishments in 2011,
with $358 billion in combined annual revenue.2 With this large number of establishments, it is not surprising
that IBISWorld Inc. reports a low level of industry concentration in fabricated metal product manufacturing.
Important fabricated metal processes include forging, stamping, bending, forming, and machining used to
shape individual pieces of metal. Other processes involve the joining of separate parts through welding and
assembly. Establishments in this sub-sector may use one or a combination of these processes. However, the
special manufacturing processes involved require most companies to make a limited range of products.
Categories of fabricated metal product manufacturing include:
Forging and Stamping (NAICS 3321) – Includes manufacturing of forgings from purchased metals; custom
roll forming products; metal stamped and spun products; and powder metallurgy products. Establishments
further manufacturing (e.g., machining, assembling) a specific product are classified in the industry of the
finished product;
Cutlery and Handtool Manufacturing (NAICS 3322) – Production of metal kitchen cookware, utensils, metal
cutlery and flatware, saw blades, and non-powered hand or edge tools;
Architectural and Structural Metals Manufacturing (NAICS 3323) – These establishments manufacture
prefabricated metal buildings; panels and sections; structural metal products; metal plate work products;
metal framed windows and metal doors; sheet metal work; and ornamental/architectural metal products;
Boiler, Tank, and Shipping Container Manufacturing (NAICS 3324) – Involves the production of power
boilers and heat exchangers; tanks, vessels, and other containers; and light gauge metal containers;
Hardware Manufacturing (NAICS 3325) - Manufacturing of metal hardware, such as metal hinges, metal
handles, keys, and locks (except coin-operated, time locks);
Spring and Wire Product Manufacturing (NAICS 3326) – Production of steel springs and fabricated wire
products from metal stock or wire drawn elsewhere;
Machine Shops; Turned Product; and Screw, Nut, and Bolt Manufacturing (NAICS 3327) – Machine shops
are engaged in machining metal and plastic parts and parts of other composite materials on a job or order
basis. They are typically low volume and use tools such as lathes/CNC machines; automatic screw
machines; and machines for boring, grinding, and milling. In comparison, turned product and screw, nut
and bolt manufacturing includes machining precision turned products or manufacturing metal bolts, nuts,
screws, rivets, and other industrial fasteners;
Coating, Engraving, Heat Treating, and Allied Activities (NAICS 3328) - Includes metal and metal product
heat treating; enameling, lacquering, and varnishing; hot dip galvanizing; engraving, chasing, or etching;
powder coating metals; and electroplating, plating, anodizing and coloring;
Other Fabricated Metal Product Manufacturing (NAICS 3329) – Involves manufacturing of metal valves,
plumbing fixtures, ball bearings, ammunition, small arms and various products not elsewhere classified.
2 Ibid

Transform Milwaukee 6-3 Metal Product Manufacturing
Largely driven by the needs of the construction industry and other manufacturing sub-sectors, demand for
both primary metals and fabricated metal products are tied to macro-economic growth trends. As noted by
IBISWorld Inc., primary metal product manufacturers largely compete on the basis of price and quality of the
products. Operational flexibility and the ability to integrate design services also help some firms to
differentiate themselves in a competitive industry. Within the fabricated metal products industry, success
often depends on reputation, quality, technical expertise, access to markets and the availability of a skilled
labor force.
In Milwaukee County, including the Industrial Corridor, the primary metal product manufacturing industry
employs almost 1,700 workers and is largely comprised of foundries, with several smaller establishments
engaged in steel product manufacturing and non-ferrous metal product production (Table 6.1). In contrast,
the fabricated metal products industry consists of a diversity of categories employing 4,200 workers (Table
6.2). In terms of total establishments, machine shops and coating, engraving, heat treating and allied products
comprise a large share of firms. A majority of firms in the county are small employers, classified as either
Stage 1 (1 to 9 employees) or Stage 2 companies (10 to 99 employees). These firms might provide one
opportunity for identifying appropriate candidates to participate in the pilot Economic Gardening® program
discussed in Section 4 of this report.
Table 6.1 – Milwaukee County Primary Metal Manufacturing Establishments (NAICS 331) by Type and Size
NAICS Description Total
Establishments
Establishments by Number of Employees
0 to 9 10 to 99 100 to
499
500 or
More
3311 Iron and Steel Mills and Ferroalloy Manufacturing 0 0 0 0 0
3312 Steel Product Manufacturing from Purchased Steel 4 1 1 2 0
3313 Alumina and Aluminum Production and Processing 0 0 0 0 0
3314 Nonferrous Metal (except Alum.) Production & Processing 3 1 2 0 0
3315 Foundries 15 3 5 7 0
331 Total for all Primary Metal Manufacturing 22 5 8 9 0
Source: Wisconsin Department of Workforce Development – Q4 2011 figures
Table 6.2 – Milwaukee County Fabricated Metal Product Manufacturing Establishments (NAICS 332) by Type and Size
NAICS Description Total
Establishments
Establishments by Number of Employees
0 to 9 10 to 99 100 to
499
500 or
More
3321 Forging and Stamping 16 1 12 2 1
3322 Cutlery and Handtool Manufacturing 3 1 1 1 0
3323 Architectural and Structural Metals Manufacturing 32 12 18 2 0
3324 Boiler, Tank and Shipping Container Manufacturing 8 2 3 3 0
3325 Hardware Manufacturing 3 1 0 1 1
3326 Spring and Wire Product Manufacturing 4 2 2 0 0
3327 Machine Shops, Turned Products; Screws, etc. Mfg. 81 41 35 5 0
3328 Coating, Engraving, Heat Treating & Allied Activities 50 21 28 1 0
3329 Other Fabricated Metal Product Manufacturing 45 15 27 3 0
332 Total for All Fabricated Metal Products 242 96 126 18 2
Source: Wisconsin Department of Workforce Development – Q4 2011 figures

Transform Milwaukee 6-4 Metal Product Manufacturing
Establishments in Milwaukee County are also part of a larger concentration of firms extending from the M7
Region to the Chicago metro area. Specifically, 6.4% of all primary metal manufacturing establishments are
located within a 100-mile radius of Milwaukee County (Map 6.1). An even greater share of fabricated metal
product manufacturing establishments (7.2%) is found within this radius (Map 6.2). The concentration of these
firms contributes to both Wisconsin and Illinois ranking among the top seven states for employment in both
primary and fabricated metal product manufacturing. Maps in Appendix 6A further depict the distribution of
metal manufacturing firms for each of the categories listed in Table 6.1 and Table 6.2.
Map 6.1 – Distribution of Primary Metal Manufacturing Establishments (2010)

Transform Milwaukee 6-5 Metal Product Manufacturing
Map 6.2 – Distribution of Fabricated Metal Product Manufacturing Establishments (2010)
As suggested by the maps of establishment concentrations, metal manufacturing firms are concentrated in
certain regions throughout the nation. These distributions largely reflect the historical origins of the industries,
proximity to key customer concentrations (such as the automotive industry), and access to international ports
on the East Coast, West Coast and Gulf of Mexico. Many firms are found in specific metropolitan statistical
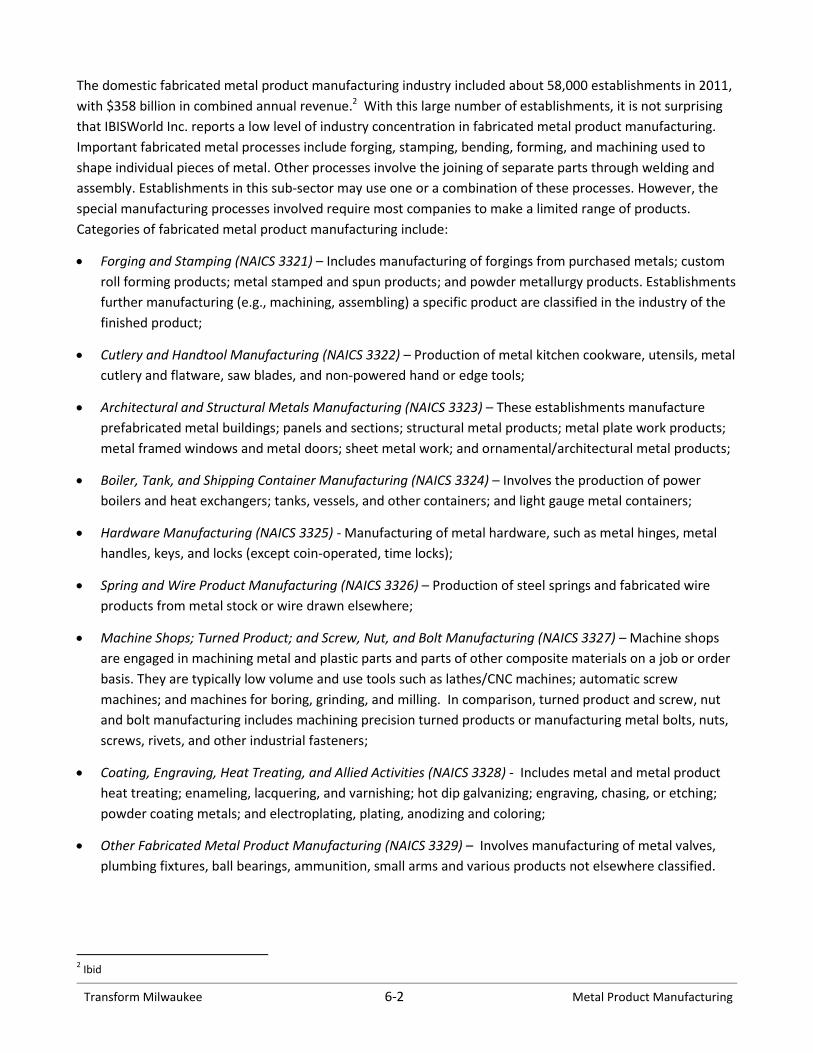
areas (MSAs), with Table 6.3 listing those 25 metro areas reporting the greatest number of establishments in
primary and fabricated metal manufacturing.3 Not surprisingly, the nation’s three most populous metro areas
(including Chicago) account for the greatest number of firms in both primary and fabricated metal product
manufacturing.
The remaining metropolitan areas in Table 6.3 do not necessarily have direct correlations between population
and establishments. In particular, the Milwaukee-Waukesha-West Allis MSA ranks 39th in total population, but
18th in primary metal manufacturing establishments and 11th in fabricated metal manufacturing
establishments. While employment figures are suppressed for some metro areas, the Milwaukee metro area
would likely place even higher if benchmarked according to total employment in the industries. Ultimately,
firms in the Milwaukee metro area compete with establishments in these other MSAs at various intensities.
Understanding Milwaukee’s sources of competitive advantage relative to these areas will help identify
strategies for growing local firms in these two industries.
3 MSA distributions are also available for more detailed industry categories.
Transform Milwaukee 6-6 Metal Product Manufacturing
Table 6.3 – Metro Area Rankings by Total Metal Manufacturing Establishments (Top 25 in 2011)
Rank Name Establishments Employment Average
Annual Wage
Primary Metal Manufacturing (NAICS 331) 1. Los Angeles-Long Beach-Santa Ana, CA MSA 257 8,240 $53,856 2. Chicago-Naperville-Joliet, IL-IN-WI MSA 255 27,143 $77,869 3. New York-Northern New Jersey-Long Island, NY-NJ-PA MSA 179 4,237 $61,488 4. Houston-Baytown-Sugar Land, TX MSA 139 4,041 $55,011 5. Detroit-Warren-Livonia, MI MSA 135 S S 6. Cleveland-Elyria-Mentor, OH MSA 118 8,169 $68,373 7. Pittsburgh, PA MSA 115 S S 8. Dallas-Fort Worth-Arlington, TX MSA 98 5,713 $51,116 9. Riverside-San Bernardino-Ontario, CA MSA 86 4,196 $56,888
10. Philadelphia-Camden-Wilmington, PA-NJ-DE-MD MSA 83 4,800 $72,160 11. Providence-New Bedford-Fall River, RI-MA MSA 80 S S 12. Phoenix-Mesa-Scottsdale, AZ MSA 65 2,117 $50,800 13. Youngstown-Warren-Boardman, OH-PA MSA 65 7,342 $66,325 14. Boston-Cambridge-Quincy, MA-NH MSA 61 1,844 $61,319 15. Miami-Fort Lauderdale-Miami Beach, FL MSA 61 722 $60,281 16. Atlanta-Sandy Springs-Marietta, GA MSA 60 3,593 $51,353 17. San Francisco-Oakland-Fremont, CA MSA 55 3,841 $67,239 18. Milwaukee-Waukesha-West Allis, WI MSA 54 5,059 $52,905 19. Minneapolis-St. Paul-Bloomington, MN-WI MSA 51 3,888 $56,193 20. Cincinnati-Middletown, OH-KY-IN MSA 50 6,329 $67,356 21. St. Louis, MO-IL MSA 50 7,963 $62,537 22. Tulsa, OK MSA 44 1,931 $50,492 23. Portland-Vancouver-Beaverton, OR-WA MSA 42 5,697 $71,825 24. Birmingham-Hoover, AL MSA 39 6,682 $69,008 25. Tampa-St. Petersburg-Clearwater, FL MSA 38 S S
Fabricated Metal Product Manufacturing (NAICS 332)
1. Los Angeles-Long Beach-Santa Ana, CA MSA 2,808 62,397 $52,454 2. Chicago-Naperville-Joliet, IL-IN-WI MSA 2,628 65,530 $53,701 3. New York-Northern New Jersey-Long Island, NY-NJ-PA MSA 2,012 34,055 $53,132 4. Houston-Baytown-Sugar Land, TX MSA 1,643 50,010 $59,430 5. Detroit-Warren-Livonia, MI MSA 1,433 30,670 $54,145 6. Cleveland-Elyria-Mentor, OH MSA 1,100 27,414 $51,814 7. Minneapolis-St. Paul-Bloomington, MN-WI MSA 1,094 26,339 $56,579 8. Dallas-Fort Worth-Arlington, TX MSA 1,066 27,218 $47,248 9. Philadelphia-Camden-Wilmington, PA-NJ-DE-MD MSA 962 19,130 $57,930
10. Boston-Cambridge-Quincy, MA-NH MSA 945 19,186 $68,975 11. Milwaukee-Waukesha-West Allis, WI MSA 646 21,933 $50,820 12. Miami-Fort Lauderdale-Miami Beach, FL MSA 622 7,221 $42,016 13. Pittsburgh, PA MSA 618 14,619 $48,969 14. Phoenix-Mesa-Scottsdale, AZ MSA 603 12,494 $48,915 15. Riverside-San Bernardino-Ontario, CA MSA 600 12,087 $49,100 16. Seattle-Tacoma-Bellevue, WA MSA 590 10,367 $48,545 17. Atlanta-Sandy Springs-Marietta, GA MSA 581 10,654 $44,803 18. Hartford-West Hartford-East Hartford, CT MSA 579 14,791 $66,435 19. San Francisco-Oakland-Fremont, CA MSA 578 8,487 $54,498 20. Portland-Vancouver-Beaverton, OR-WA MSA 575 S S 21. San Jose-Sunnyvale-Santa Clara, CA MSA 552 9,403 $53,362 22. Cincinnati-Middletown, OH-KY-IN MSA 501 12,796 $54,617 23. St. Louis, MO-IL MSA 481 10,614 $49,889 24. Tulsa, OK MSA 481 10,973 $52,658 25. Providence-New Bedford-Fall River, RI-MA MSA 430 S S
Source: Bureau of Labor Statistics and UW-Extension Center for Community and Economic Development S = suppressed
Transform Milwaukee 6-7 Metal Product Manufacturing
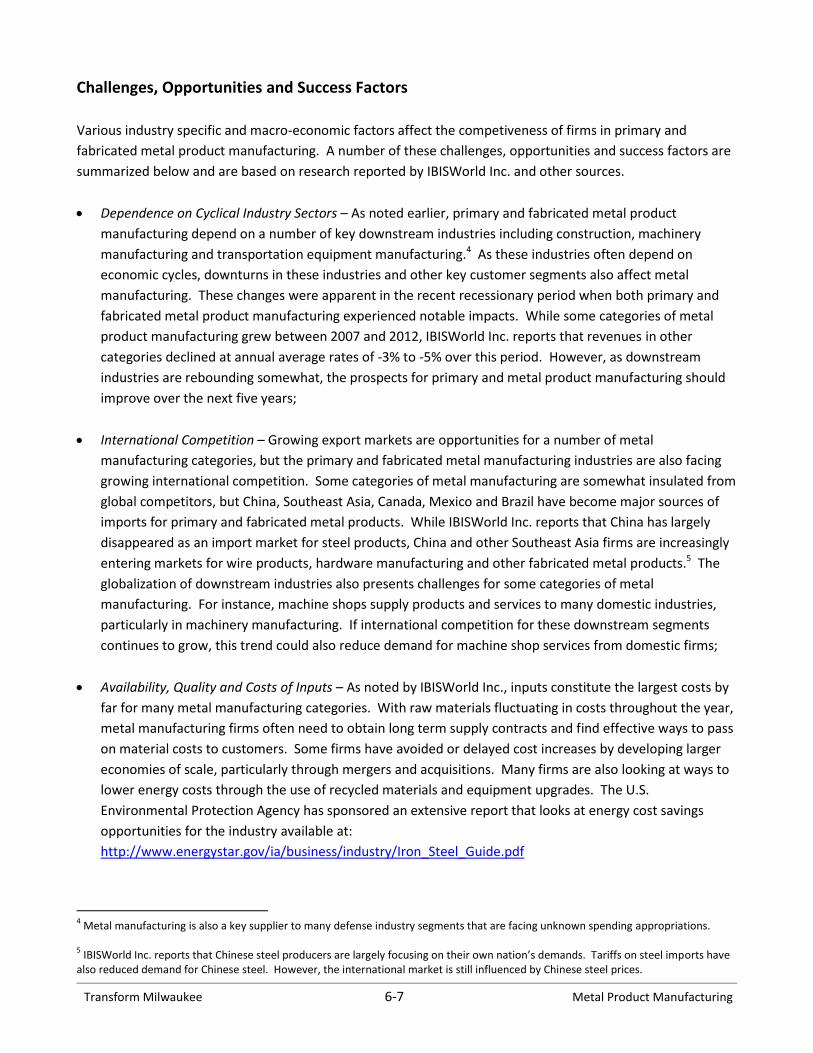
Challenges, Opportunities and Success Factors
Various industry specific and macro-economic factors affect the competiveness of firms in primary and
fabricated metal product manufacturing. A number of these challenges, opportunities and success factors are
summarized below and are based on research reported by IBISWorld Inc. and other sources.
Dependence on Cyclical Industry Sectors – As noted earlier, primary and fabricated metal product
manufacturing depend on a number of key downstream industries including construction, machinery
manufacturing and transportation equipment manufacturing.4 As these industries often depend on
economic cycles, downturns in these industries and other key customer segments also affect metal
manufacturing. These changes were apparent in the recent recessionary period when both primary and
fabricated metal product manufacturing experienced notable impacts. While some categories of metal
product manufacturing grew between 2007 and 2012, IBISWorld Inc. reports that revenues in other
categories declined at annual average rates of -3% to -5% over this period. However, as downstream
industries are rebounding somewhat, the prospects for primary and metal product manufacturing should
improve over the next five years;
International Competition – Growing export markets are opportunities for a number of metal
manufacturing categories, but the primary and fabricated metal manufacturing industries are also facing
growing international competition. Some categories of metal manufacturing are somewhat insulated from
global competitors, but China, Southeast Asia, Canada, Mexico and Brazil have become major sources of
imports for primary and fabricated metal products. While IBISWorld Inc. reports that China has largely
disappeared as an import market for steel products, China and other Southeast Asia firms are increasingly
entering markets for wire products, hardware manufacturing and other fabricated metal products.5 The
globalization of downstream industries also presents challenges for some categories of metal
manufacturing. For instance, machine shops supply products and services to many domestic industries,
particularly in machinery manufacturing. If international competition for these downstream segments
continues to grow, this trend could also reduce demand for machine shop services from domestic firms;
Availability, Quality and Costs of Inputs – As noted by IBISWorld Inc., inputs constitute the largest costs by
far for many metal manufacturing categories. With raw materials fluctuating in costs throughout the year,
metal manufacturing firms often need to obtain long term supply contracts and find effective ways to pass
on material costs to customers. Some firms have avoided or delayed cost increases by developing larger
economies of scale, particularly through mergers and acquisitions. Many firms are also looking at ways to
lower energy costs through the use of recycled materials and equipment upgrades. The U.S.
Environmental Protection Agency has sponsored an extensive report that looks at energy cost savings
opportunities for the industry available at:
http://www.energystar.gov/ia/business/industry/Iron_Steel_Guide.pdf
4 Metal manufacturing is also a key supplier to many defense industry segments that are facing unknown spending appropriations.
5 IBISWorld Inc. reports that Chinese steel producers are largely focusing on their own nation’s demands. Tariffs on steel imports have
also reduced demand for Chinese steel. However, the international market is still influenced by Chinese steel prices.

Transform Milwaukee 6-8 Metal Product Manufacturing
Competition from Other Materials – Materials such as plastics, fiber optics and ceramics are being used in
place of metals in many applications. For instance, automobiles are increasingly using plastics in place of
metals, while food manufacturing firms have also replaced steel cans with glass and plastic containers.
Consequently, some companies are responding by expanding their product lines to include non-metal
items;
Specialization, Diversification and Quality Control — Some firms are finding success in developing a diverse
product mix that lessens their dependence on demand from a limited number of downstream industries.
Other establishments are producing higher-value products that do not face the same level of competition
from lower-cost imports. Quality control is also important across all categories as it improves customer
relationships, lowers costs and increases the firm’s reputation (IBISWorld Inc.);
Adoption of New Production Methods and Access to Skilled Labor — IBISWorld Inc. notes that many
categories of metal manufacturing have become increasing complex and sophisticated. Technologies and
production methods such as laser cutters, laser-assisted arc welding and new metal casting production
allow firms to become more efficient and meet manufacturing specifications requiring tight tolerances.
Additive manufacturing, also known as 3D printing, also provides opportunities and challenges for metal
manufacturing firms. While 3D printing is not yet well-suited for mass production of components, 3D
printing allows firms to perform quick customization and rapid prototyping. These technologies also allow
firms to vertically integrate design and engineering services into their operations allowing for faster
delivery and additional profit centers. Consequently, these new technologies also require a workforce
with increasing skill levels.
Transform Milwaukee 6-9 Metal Product Manufacturing
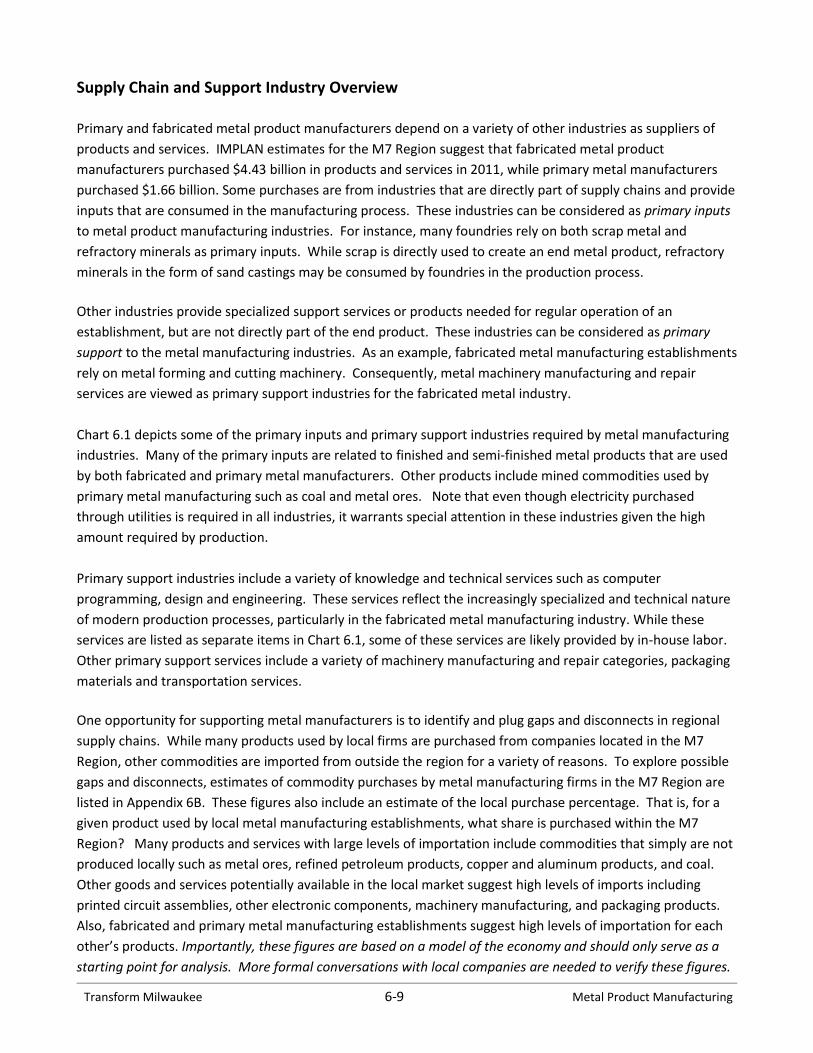
Supply Chain and Support Industry Overview
Primary and fabricated metal product manufacturers depend on a variety of other industries as suppliers of
products and services. IMPLAN estimates for the M7 Region suggest that fabricated metal product
manufacturers purchased $4.43 billion in products and services in 2011, while primary metal manufacturers
purchased $1.66 billion. Some purchases are from industries that are directly part of supply chains and provide
inputs that are consumed in the manufacturing process. These industries can be considered as primary inputs
to metal product manufacturing industries. For instance, many foundries rely on both scrap metal and
refractory minerals as primary inputs. While scrap is directly used to create an end metal product, refractory
minerals in the form of sand castings may be consumed by foundries in the production process.
Other industries provide specialized support services or products needed for regular operation of an
establishment, but are not directly part of the end product. These industries can be considered as primary
support to the metal manufacturing industries. As an example, fabricated metal manufacturing establishments
rely on metal forming and cutting machinery. Consequently, metal machinery manufacturing and repair
services are viewed as primary support industries for the fabricated metal industry.
Chart 6.1 depicts some of the primary inputs and primary support industries required by metal manufacturing
industries. Many of the primary inputs are related to finished and semi-finished metal products that are used
by both fabricated and primary metal manufacturers. Other products include mined commodities used by
primary metal manufacturing such as coal and metal ores. Note that even though electricity purchased
through utilities is required in all industries, it warrants special attention in these industries given the high
amount required by production.
Primary support industries include a variety of knowledge and technical services such as computer
programming, design and engineering. These services reflect the increasingly specialized and technical nature
of modern production processes, particularly in the fabricated metal manufacturing industry. While these
services are listed as separate items in Chart 6.1, some of these services are likely provided by in-house labor.
Other primary support services include a variety of machinery manufacturing and repair categories, packaging
materials and transportation services.
One opportunity for supporting metal manufacturers is to identify and plug gaps and disconnects in regional
supply chains. While many products used by local firms are purchased from companies located in the M7
Region, other commodities are imported from outside the region for a variety of reasons. To explore possible
gaps and disconnects, estimates of commodity purchases by metal manufacturing firms in the M7 Region are
listed in Appendix 6B. These figures also include an estimate of the local purchase percentage. That is, for a
given product used by local metal manufacturing establishments, what share is purchased within the M7
Region? Many products and services with large levels of importation include commodities that simply are not
produced locally such as metal ores, refined petroleum products, copper and aluminum products, and coal.
Other goods and services potentially available in the local market suggest high levels of imports including
printed circuit assemblies, other electronic components, machinery manufacturing, and packaging products.
Also, fabricated and primary metal manufacturing establishments suggest high levels of importation for each
other’s products. Importantly, these figures are based on a model of the economy and should only serve as a
starting point for analysis. More formal conversations with local companies are needed to verify these figures.

Transform Milwaukee 6-10 Metal Product Manufacturing
Oth
er F
abri
cate
d M
etal
Pro
du
cts
Mac
hin
e Sh
op
s In
du
stri
al P
atte
rns
Orn
amen
tal a
nd
Arc
hit
ectu
ral M
etal
s
Elec
tro
pla
tin
g, a
no
diz
ing
& c
olo
rin
g m
etal
Met
al
Stam
pin
g Ir
on
an
d s
tee
l fo
rgin
g
Met
al H
eat
Trea
tin
g M
etal
co
atin
g an
d n
on
-
pre
cio
us
engr
avin
g
Pre
cisi
on
Tu
rned
Pro
du
cts
Pla
te w
ork
Ferr
ou
s an
d N
on
-
Ferr
ou
s M
etal
Sh
apin
g
Oth
er P
rim
ary
Met
al
Man
ufa
ctu
rin
g
Stee
l an
d Ir
on
Fo
un
dri
es
No
n-F
erro
us
Fou
nd
ries
Pri
ma
ry M
eta
l Pro
du
ct M
an
ufa
ctu
rin
g
Fab
rica
ted
Met
al P
rod
uct
Ma
nu
fact
uri
ng
Sem
i-fi
nis
hed
an
d
Fin
ish
ed M
etal
Pro
du
cts
- Ir
on
an
d S
tee
l
Sem
i-fi
nis
hed
an
d
Fin
ish
ed P
rod
uct
s -
Alu
min
um
Ab
rasi
ves
and
Pla
stic
s
Wh
ole
sale
Ch
emic
al P
rod
uct
s an
d
Pre
par
atio
ns
Sem
i-fi
nis
hed
an
d
Fin
ish
ed O
ther
Met
als
(tit
aniu
m, b
rass
, co
pp
er
and
var
iou
s al
loys
)
Scra
p, C
oal
, Ore
Cla
y an
d N
on
-Cla
y
Ref
ract
ory
Pro
du
cts
Uti
litie
s (E
ner
gy)
Pri
ma
ry In
pu
ts
Pri
nte
d C
ircu
it
Ass
emb
lies
and
Oth
er
Elec
tro
nic
Co
mp
on
ents
Lega
l, A
cco
un
tin
g an
d
Fin
anci
al S
ervi
ces
Engi
nee
rin
g an
d D
esig
n
Serv
ices
Ind
ust
rial
Mac
hin
ery
Leas
ing
and
Rep
air
Ind
ust
rial
Pro
cess
In
stru
men
ts
Spec
ializ
ed T
oo
ls, D
ies,
Jigs
an
d F
ixtu
res
Pla
stic
an
d P
aper
bo
ard
Pac
kin
g
Co
mp
ute
r D
esig
n a
nd
Pro
gram
min
g Se
rvic
es
Tran
spo
rtat
ion
Met
al C
utt
ing
and
Form
atio
n T
oo
ls
Pri
ma
ry S
up
po
rt
Ch
art
6.1
– M
etal
Pro
du
ct M
anu
fact
uri
ng
Ind
ust
ry In
pu
ts a
nd
Aff
iliat
ed
Ind
ust
rie
s
Sou
rce:
UW
-Ext
ensi
on
Cen
ter
for
Co
mm
un
ity
and
Eco
no
mic
Dev
elo
pm
ent

Transform Milwaukee 6-11 Metal Product Manufacturing
Growth Outlook and Site Considerations for Metal Product Manufacturing
Both past employment trends and industry forecasts provide some insights to the future potential of metal product
manufacturing in Milwaukee’s Industrial Corridor. As previously noted, the primary and fabricated metals
industries have faced growing challenges from international competition and recent recessionary periods. The
impacts of these macro-economic factors, and perhaps other local conditions, are apparent in the employment
trends for these two industries over the last 20 years (Chart 6.2 and Chart 6.3). While U.S. employment in primary
metal manufacturing was mostly flat in the 1990’s, employment grew somewhat during the previous decade in
Milwaukee County, the Balance of the M7 Region and the State of Wisconsin. However, employment in these three
geographic regions declined dramatically with the onset of the 2001 recession. Despite employment leveling in the
mid 2000’s, the 2007 recession created another reduction in employment, with losses particularly notable in
Milwaukee County. Employment in primary metal manufacturing has rebounded somewhat since 2009, but the
number of jobs in Milwaukee County remains well-below its recent peak in 1998.
Chart 6.2 – Primary Metal Manufacturing Employment Index of Growth - 1990 to 2011
Sources: Bureau of Labor Statistics and UW-Extension Center for Community and Economic Development
Employment changes in the fabricated metal product manufacturing industry show somewhat parallel trends in the
U.S., State of Wisconsin and the Balance of the M7 Region. Specifically, employment in each area grew throughout
most of the 1990’s and declined with the onset of the 2001 recession. A similar pattern occurred in the most recent
decade, with employment growing somewhat between 2002 and 2008, before dropping sharply during the latest
recessionary period. In contrast, employment in Milwaukee County’s fabricated metal product industry remained
mostly flat through the 1990’s, before the large decline starting in 2001. While employment levels remained
somewhat consistent in the mid-2000’s, the 2007 recession also impacted Milwaukee County firms. However,
employment in the industry has rebounded somewhat, with each area in Chart 6.3 showing job growth between
2010 and 2011. In fact, over this period, jobs grew by almost 11 percent and 12 percent in Milwaukee County and
the Balance of the M7 Region respectively.
-
20.0
40.0
60.0
80.0
100.0
120.0
140.0
160.0
19
90
19
91
19
92
19
93
19
94
19
95
19
96
19
97
19
98
19
99
20
00
20
01
20
02
20
03
20
04
20
05
20
06
20
07
20
08
20
09
20
10
20
11
Ind
ex
of
Gro
wth
(1
99
0 =
10
0)
Primary Metal Manufacturing Employment Index of Growth - 1990 to 2011
United States
State of Wisconsin
Milwaukee County
Balance of M7 Region

Transform Milwaukee 6-12 Metal Product Manufacturing
Chart 6.3 – Fabricated Metal Product Manufacturing Employment Index of Growth - 1990 to 2011
Sources: Bureau of Labor Statistics and UW-Extension Center for Community and Economic Development
Industry forecasts from IBISWorld Inc. suggest that metal product manufacturing growth rates will vary somewhat
between 2012 and 2017. Specific annual average growth rates range from 4.2% for iron and steel product
manufacturing; 2.1% for aluminum products; 3.3% for metal stamping; and 4.1% for structural metals. Lower
growth rates are projected for metal plating and machine shop services (1.8% for each category).
Factors encouraging growth in metal products include rebounding sales of automobiles, anticipated replacement
orders for aircraft and other transportation equipment, and projected increases in demand for industrial
machinery. While commercial real estate construction should increase somewhat over the next five years, lingering
weakness in the residential sector could dampen this growth somewhat. Furthermore, potential declines in future
defense contracting will likely impact the sector as primary and fabricated metal products are primary components
in many defense industry supply chains.
Nonetheless, if productivity levels remain constant, a 4.0% growth rate could translate into national annual
increases of 15,000 jobs in the primary metal product industry and 52,000 jobs in fabricated metal product
manufacturing. While increasing productivity levels will likely depress these estimates, annual job growth levels of
this magnitude have occurred several times in the United States over the past two decades. Currently, Milwaukee
County accounts for an estimated 0.6% of the Nation’s total industrial output in fabricated metal products and 0.3%
of output in primary metals. If Milwaukee County can maintain its market share, and productivity rates remain
similar to current levels, a 4.0% projected increase would equate to an additional $96 million of output in fabricated
metal products and $21.5 million in primary metal manufacturing. However, recent employment increases could
suggest that this growth rate has been larger; signifying that Milwaukee County and the region’s growth could
outpace national forecasts.
-
20.0
40.0
60.0
80.0
100.0
120.0
140.0
160.0
19
90
19
91
19
92
19
93
19
94
19
95
19
96
19
97
19
98
19
99
20
00
20
01
20
02
20
03
20
04
20
05
20
06
20
07
20
08
20
09
20
10
20
11
Ind
ex
of
Gro
wth
- (
19
90
= 1
00
) Fabricated Metal Product Manufacturing
Employment Index of Growth - 1990 to 2011
United States
State of Wisconsin
Milwaukee County
Balance of M7 Region

Transform Milwaukee 6-13 Metal Product Manufacturing
Targeting industries for development should not be based on anticipated employment and income multipliers
produced by growth in an industry. However, for planning and investment purposes, it is useful to provide some
perspective on how anticipated growth in metal product manufacturing employment might influence the broader
local economy and employment prospects in Milwaukee’s Industrial Corridor. Consequently, an input-output
model similar to the one constructed in Section 2 is used to estimate economic impacts as described by their direct,
indirect and induced effects:
Direct effects – Effects that occur directly to the industry that caused an initial change in the economy (i.e.
change in employment);
Indirect effects – Effects from business-to-business transactions. Note that these effects only include
backwards linkages in the supply-chain;
Induced effects – Effects resulting from wages and salaries paid to employees which are in turn spent in the
local economy.
Table 6.4 and Table 6.5 examine a hypothetical scenario of adding 250 jobs to primary metal manufacturing and
500 jobs to the fabricated metal product manufacturing industry. While overall industry average growth rates
suggest that 250 and 500 jobs could be optimistic estimates, the figure for fabricated metal products is not
unrealistic considering this industry added 861 jobs in Milwaukee County between 2010 and 2011. Table 6.4
reports potential impacts on employment, labor income and output, while Table 6.5 shows estimated increases in
state and local taxes. Note that the figures in Table 6.4 and Table 6.5 are not a broader impact analysis of
constructing a new manufacturing facility, but rather how increased employment in these categories might
influence the local economy.
In addition to the 250 jobs directly added in primary metal manufacturing, an additional 355 jobs could be created
through indirect and induced impacts. Two hundred and fifty new jobs in primary metal manufacturing could also
directly add $17.4 million in labor income, while adding an additional $19.2 million through induced and indirect
impacts. Similar, but somewhat smaller multiplier effects are estimated through adding 500 jobs in fabricated
metal product manufacturing. An additional 250 jobs in primary metals could also generate an estimated $3.03
million in local and state tax impact, while 500 jobs in fabricated metal products could produce $4.94 million (Table
6.4). However, it is unlikely that the additional jobs, taxes, and labor income will remain in entirely in Milwaukee
County due to the commuting patterns mentioned in Section 3 of this study.
Table 6.4 – Potential Impacts of Employment Growth in Metal Product Manufacturing
Impact Type Employment Labor Income Output
Primary Metal Products
Direct 250 $17,400,000 $73,900,000
Indirect 167 $10,800,000 $21,000,000
Induced 188 $8,400,000 $20,700,000
Total 605 $36,600,000 $115,600,000
Fabricated Metal Products
Direct 500 $33,100,000 $117,600,000
Indirect 206 $12,400,000 $28,900,000
Induced 298 $13,300,000 $32,800,000
Total 1,004 $58,700,000 $179,300,000
Source: IMPLAN

Transform Milwaukee 6-14 Metal Product Manufacturing
Table 6.5 - Potential State and Local Tax Revenue Impacts of 100 Jobs in Metal Product Manufacturing
Industry Total
Employee
Compensation
Indirect
Business Tax Households Corporations
Primary Metal Products $3,032,000 $60,000 $1,869,000 $956,000 $147,000
Fabricated Metal Products $4,942,000 $94,000 $2,994,000 $1,545,000 $309,000 Source: IMPLAN
Site Considerations
When considering Milwaukee’s Industrial Corridor as a potential site for the retention, expansion and recruitment
of metal manufacturing firms, it is important to understand typical industry requirements in terms of transportation
needs, access to customers and land availability. Other commonly cited factors, such as regulatory environment
and costs of doing business (e.g. taxes) are not examined in this analysis as they are not necessarily specific to the
metal manufacturing industry. Site selection factors related to labor needs and wages are assessed later in this
analysis.
While the overall manufacturing sector averages 500 square feet per employee, the primary and fabricated metal
product industries typically require ratios closer to 700-800 square feet. Space needs for any anticipated growth in
these industries will depend partially upon any existing underused capacities, but if new construction is needed,
every 100 employees in a new facility might require 70,000 to 80,000 square feet of industrial space. However,
many establishments employ fewer than 100 employees and likely have significantly smaller space requirements.
As noted earlier, primary and fabricated metal product manufacturing firms largely make components that are used
in final products produced by other industries. Many of these products are produced using just-in-time and just-in-
order practices that lower costs, minimize delivery time, and allow for greater quality assurance and quality control.
Consequently, proximity to major customers and efficient transportation networks are principal site-selection
considerations for many metal product manufacturing firms. Specific transportation needs vary somewhat among
firms in primary and fabricated metal product industries. In terms of shipping final products, the fabricated metal
product manufacturing industry relies on single-mode truck transportation for 93% of its tonnage shipped (See
Appendix 6C). Fabricated metal product manufacturing firms also send smaller, higher value shipments via courier
or US Postal Service. While couriers are responsible for less than 1.0% of the tonnage shipped by fabricated metal
manufacturers, this transportation mode accounts for almost 13% of all shipment values. Rail and water are also
used to some degree by fabricated metal product manufacturers for both the transportation of inputs and finished
products.
Primary metal manufacturers also rely on truck transportation, but tend to be more dependent on rail and water
transport than fabricated metal product firms (Appendix 6C). Specifically, more than 30 percent of the final
product tonnage shipped by primary metal producers is moved by rail as a single mode (21.7%) or through multi-
modal truck and rail (8.7%). While not shown in Appendix 6C, many of the inputs used by primary metal
manufacturing (e.g. sand, metal ores, coal and scrap) are largely transported by rail and water. Consequently,
access to rail, water and truck transportation could suggest a locational advantage of the Industrial Corridor for
some firms operating in these industries. More on freight transportation is available in Section 8 of this report.

Transform Milwaukee 6-15 Metal Product Manufacturing
Primary markets for primary and fabricated metal products include construction, food product manufacturing,
beverage products, chemical manufacturing, machinery manufacturing, transportation equipment, and other
manufacturing categories. Furthermore, the primary and fabricated metal product manufacturing industries are
commonly customers of each other. To provide some perspective on the local presence of this potential customer
base, Table 6.6 examines total industrial output in the M7 Region and the Chicago metro area for those industries
that tend to be the largest markets for primary metal products or fabricated metal products (or both). The
numbers of firms in these sectors within a 100-mile radius of Milwaukee’s Industrial Corridor are also considered to
provide perspective on the broader concentration of these industries. While the presence of these industries does
not necessarily translate into direct market potential, the Milwaukee-Chicago corridor has strengths in several
traditional customer segments for metal products. In particular, electrical equipment manufacturing, food
manufacturing, and machinery manufacturing have a significance presence in the region, accounting for large
shares of national output and establishments.
Table 6.6 – Presence of Potential Demand Industries in the M7 Region and Chicago Metropolitan Area
NAICS and Industry Regional Industry
Output (Millions $)
Regional Industry Output – % of
National Output
Establishments in 100-Mile Radius -
Number
Establishments in 100-Mile Radius –
Percent of U.S.
23 Construction 37,409.5 3.1% 35,685 4.5%
311 Food Product Manufacturing 26,601.8 3.6% 1,703 6.0%
312 Beverage & Tobacco Product Manufacturing
3,887.4 2.2% 116 2.2%
325 Chemical Manufacturing 10,785.3 1.2% 901 5.6%
331 Primary Metal Manufacturing 5,039.9 2.7% 374 6.4%
332 Fabricated Metal Product Mfg. 19,127.7 6.4% 4,252 7.2%
333 Machinery Manufacturing 18,719.6 5.4% 2,690 9.1%
334 Computer & Other Electronic Component Manufacturing
13,892.1 2.3% 1,073 5.7%
335 Electrical Equipment and Appliance Manufacturing
10,754.8 8.4% 541 7.4%
336 Transportation Equipment Manufacturing
10,887.5 1.6% 488 3.4%
337 Furniture & Related Product Manufacturing
1,939.5 3.0% 934 4.6%
339 Miscellaneous Manufacturing 9,108.3 5.9% 1,655 5.3%
Source: IMPLAN, Bureau of Labor Statistics and UW-Extension Center for Community and Economic Development

Transform Milwaukee 6-16 Metal Product Manufacturing
Occupations, Wages and Age Structure
An industry’s occupational structure provides important insights to the skill levels, and perhaps educational
attainment, necessary for employment within the industry. Similar to the analysis in Section 3, occupations within
sub-categories of metal manufacturing industries can be summarized by their respective job zones. Again, job
zones provide information on the usual types of preparation needed for given occupations within an industry, as
well as the typical length of time workers need to acquire information, learn techniques and develop the capacity
needed for average performance in these occupations. Occupations in job zone 1 have lower preparation
requirements while occupations in job zone 5 require the largest amount of preparation (See Section 3 for more on
job zones). Note that training may be acquired in a variety of environments (vocational education, apprenticeship
training, on-the-job, etc.) and does not include the orientation time required to become a fully-qualified worker or
accustomed to special conditions of a job.
The shares of occupations by job zones are summarized in Chart 6.4. Note that these shares are based on national
distributions reported by the Bureau of Labor Statistics and the local occupational structure likely varies within the
industries and by individual firm. While these industries include a variety of occupations, most of these positions
are located in either job zone 2 or job zone 3 and would be considered so-called middle-skill occupations. These
occupations commonly require at least a high-school degree in addition to some formal vocational training with a
minimum time investment of three to six months, and up to two years in some instances. Coating, engraving, heat
treating, and allied activities; spring and wire product manufacturing; and foundries tend to have the highest share
of occupations in job zone 2. Machine shops; iron and steel mills; aluminum production and processing; and
architectural and structural metal manufacturing have the largest share of occupations found in job zone 3.
Chart 6.4 – Share of Metal Manufacturing Occupations by Job Zone
Sources: Bureau of Labor Statistics, O*NET and UW-Extension Center for Community and Economic Development
0% 20% 40% 60% 80% 100%
3311 Iron and Steel Mills and Ferroalloy Mfg
3312 Steel Product Mfg from Purchased Steel
3313 Alumina and Aluminum Production and Processing
3314 Nonferrous Metal (except Alum.) Production and…
3315 Foundries
331 Primary Metal Mfg
3321 Forging and Stamping
3322 Cutlery and Handtool Mfg
3323 Architectural and Structural Metals Mfg
3324 Boiler, Tank, and Shipping Container Mfg
3325 Hardware Mfg
3326 Spring and Wire Product Mfg
3327 Machine Shops; Turned Product; and Screw, Nut,…
3328 Coating, Engraving, Heat Treating, and Allied…
3329 Other Fabricated Metal Product Mfg
332 Fabricated Metal Product Mfg
ZONE 1 ZONE 2 ZONE 3 ZONE 4 ZONE 5 N/A

Transform Milwaukee 6-17 Metal Product Manufacturing
An overview of the 50 most prevalent occupations within primary and fabricated metal product manufacturing are
also listed in Appendix 6D. The fabricated and primary metal product manufacturing industries are a mix of diverse
occupations. Many of these occupations are involved with the operation of specific machinery such as presses,
screw machines and rotary transfer machines. The influence of modern production processes is also apparent with
computer-controlled operation of single- and multiple-spindle lathes, and turning and machining centers. Other
common occupations are involved with general assembly and production or supervising of workers.
Average Annual Wages
While primary and fabricated metal product manufacturing industries are not the highest paying manufacturing
sub-sectors, annual wages in the industries are above average. In 2011, the annual average wage for primary metal
manufacturing was $48,568 in Milwaukee County and $52,905 in the Milwaukee-Waukesha-West Allis MSA. In
comparison, annual wages in the fabricated metal product manufacturing industry were somewhat higher in
Milwaukee County ($54,336) and lower in the overall Milwaukee metro area ($50,820).
When comparing local wages to wages in metro areas with significant metal manufacturing industry
concentrations, the Milwaukee metro area tends to have lower wages in both primary and fabricated metal
product manufacturing (Chart 6.5 and Chart 6.6). Some of these wage differences are likely driven by the specific
types of products made in each of these metro areas (e.g. high value added versus lower value added). Other
differences may reflect cost of living differences. Nonetheless, lower average wages in the Milwaukee area may
provide one potential source of cost advantage relative to some competing metro areas (particularly those in the
Great Lakes Region).
Chart 6.5 - Average Annual Wage for Primary Metal Manufacturing – Selected Metropolitan Statistical Areas in 2011
Sources: Bureau of Labor Statistics and UW-Extension Center for Community and Economic Development
$52,905
$- $15,000 $30,000 $45,000 $60,000 $75,000 $90,000
Tulsa, OK MSA
Phoenix-Mesa-Scottsdale, AZ MSA
Dallas-Fort Worth-Arlington, TX MSA
Atlanta-Sandy Springs-Marietta, GA MSA
Milwaukee-Waukesha-West Allis, WI MSA
Los Angeles-Long Beach-Santa Ana, CA MSA
Houston-Baytown-Sugar Land, TX MSA
Minneapolis-St. Paul-Bloomington, MN-WI MSA
Riverside-San Bernardino-Ontario, CA MSA
Miami-Fort Lauderdale-Miami Beach, FL MSA
Boston-Cambridge-Quincy, MA-NH MSA
New York-Northern New Jersey-Long Island,NY-NJ-PA MSA
St. Louis, MO-IL MSA
Youngstown-Warren-Boardman, OH-PA MSA
San Francisco-Oakland-Fremont, CA MSA
Cincinnati-Middletown, OH-KY-IN MSA
Cleveland-Elyria-Mentor, OH MSA
Birmingham-Hoover, AL MSA
Portland-Vancouver-Beaverton, OR-WA MSA
Philadelphia-Camden-Wilmington, PA-NJ-DE-MD MSA
Chicago-Naperville-Joliet, IL-IN-WI MSA

Transform Milwaukee 6-18 Metal Product Manufacturing
Chart 6.6 - Average Annual Wage for Fabricated Metal Manufacturing – Selected Metropolitan Statistical Areas in 2011
Sources: Bureau of Labor Statistics and UW-Extension Center for Community and Economic Development
Age Structure
If metal manufacturing industries grow in Milwaukee’s Industrial Corridor and the greater M7 Region, additional
workers will likely be needed. However, the future growth of the industry does not provide any perspective on the
number of replacement workers that may be needed due to retirements (or other types of worker turnover).
Examining the current age structure of workers in primary and fabricated metal product manufacturing provides
some perspectives into the number of workers who may be approaching retirement age over the coming years. As
local companies draw employees from a regional labor market (see Section 3), it is important to examine ages both
within Milwaukee County and in the Balance of the M7 Region.
While retirement ages will vary, both primary metal manufacturing and fabricated metal product manufacturing are
facing a potentially large share of workers exiting the industry over the next decade. In Milwaukee County, 24.5%
of the workers in primary metal products are age 55 or over, while 27.5% of employees in fabricated metal
products are within this age cohort (Chart 6.7 and Chart 6.8). Within the Balance of the M7 Region, 22.6% and
22.7% of workers in primary metal manufacturing and fabricated metal products respectively are perhaps
approaching retirement age in the next ten years. Interestingly, a greater share of workers age 55 and over is found
in Milwaukee County despite its younger age distribution relative to the M7 Region. Eventually, the large number
of younger residents in the Transform Milwaukee Study Area may provide a primary opportunity for filling future
positions in these industries.
$50,820
$- $15,000 $30,000 $45,000 $60,000 $75,000
Atlanta-Sandy Springs-Marietta, GA MSA
Dallas-Fort Worth-Arlington, TX MSA
Seattle-Tacoma-Bellevue, WA MSA
Phoenix-Mesa-Scottsdale, AZ MSA
Pittsburgh, PA MSA
Riverside-San Bernardino-Ontario, CA MSA
St. Louis, MO-IL MSA
Milwaukee-Waukesha-West Allis, WI MSA
Cleveland-Elyria-Mentor, OH MSA
Los Angeles-Long Beach-Santa Ana, CA MSA
Tulsa, OK MSA
New York-Northern New Jersey-Long Island,NY-NJ-PA MSA
San Jose-Sunnyvale-Santa Clara, CA MSA
Chicago-Naperville-Joliet, IL-IN-WI MSA
Detroit-Warren-Livonia, MI MSA
San Francisco-Oakland-Fremont, CA MSA
Cincinnati-Middletown, OH-KY-IN MSA
Minneapolis-St. Paul-Bloomington, MN-WI MSA
Philadelphia-Camden-Wilmington, PA-NJ-DE-MD MSA
Houston-Baytown-Sugar Land, TX MSA
Hartford-West Hartford-East Hartford, CT MSA
Boston-Cambridge-Quincy, MA-NH MSA

Transform Milwaukee 6-19 Metal Product Manufacturing
Chart 6.7 – Primary Metal Manufacturing Age Structure (2010)
Source: U.S. Census Bureau LEHD and UW-Extension Center for Community and Economic Development
Chart 6.8 – Fabricated Metal Product Manufacturing Age Structure (2010)
Source: U.S. Census Bureau LEHD and UW-Extension Center for Community and Economic Development
5.1%
17.6%
22.7%
30.0%
21.1%
3.4%
5.0%
17.6%
23.0%
31.8%
19.5%
3.1%
5.4%
17.9%
24.5%
30.2%
19.7%
2.4%
0.0%
5.0%
10.0%
15.0%
20.0%
25.0%
30.0%
35.0%
Age 24 andUnder
Age 25 to 34 Age 35 to 44 Age 45 to 54 Age 55 to 64 Age 65 and Over
Pe
rce
nt
of
Wo
rke
rs
Milwaukee County
Balance of M7 Region
State of Wisconsin
5.0%
15.3%
21.6%
30.7%
23.5%
4.0%
6.8%
16.9%
22.5%
31.1%
19.0%
3.7%
7.7%
18.5%
22.8%
29.7%
18.4%
2.9%
0.0%
5.0%
10.0%
15.0%
20.0%
25.0%
30.0%
35.0%
Age 24 andUnder
Age 25 to 34 Age 35 to 44 Age 45 to 54 Age 55 to 64 Age 65 and Over
Pe
rce
nt
of
Wo
rke
rs
Milwaukee County
Balance of M7 Region
State of Wisconsin

Transform Milwaukee 6-20 Metal Product Manufacturing
Summary
Despite employment declines over the past few decades, the primary and fabricated metal manufacturing
industries remain highly concentrated in Milwaukee’s Industrial Corridor and the M7 Region. Employment has
rebounded somewhat over the last year and national forecasts suggest some levels of future growth over the next
five years, particularly within categories of fabricated metal manufacturing. Some of this growth will depend on
factors uncontrollable by local firms, including the direction of the national economy and international competition.
Other conditions present both opportunities and challenges that potentially could be influenced by local initiatives.
Specific examples include:
Workforce Development – Both primary and fabricated metal product manufacturing are dominated by middle-
skill occupations. As the industries have become more technical and knowledge-intensive, training
requirements for many occupations appear to be somewhat more rigorous and time-intensive than a number
of other manufacturing industries. Consequently, potential workers without experience living in the Transform
Milwaukee Study Area (and in other areas) will need formal training programs that require partnerships among
local firms and workforce intermediaries. Those workers without basic levels of educational attainment will
likely need this training in concert with adult basic education;
Tapping Youth in the Transform Milwaukee Study Area – Primary and fabricated metal product manufacturing
establishments in the region face a notable share of workers approaching retirement age. Depending on
factors such as productivity levels and technological advancements, local firms may need to replace as much as
25% of their labor force in the coming decade. The Transform Milwaukee Study Area is one of the few areas in
the region with an overly youthful population that could meet these potential needs;
Expanding Local Markets for Primary and Fabricated Metal Products – Primary and fabricated metal
manufacturing firms in the Industrial Corridor have the potential to access large and diverse markets in the
Milwaukee-Chicago region. In particular, the Corridor is located within 100 miles of a nationally significant
share of potential customers in sectors such as construction, machinery manufacturing, food manufacturing
and transportation equipment manufacturing. The industry will also be a key stakeholder in any conversations
related to the defense cluster detailed in Section 5;
Working to Identify and Address Potential Gaps and Disconnects in Local Supply Chains – A variety of potential
gaps and disconnects exist in local supply chains for primary and fabricated metal products. Ultimately, the
industry will need to identify its own needs, but information available in this profile (as well as other data that
could be compiled), provides a starting point for understanding products and services needed by local firms;
Providing Access to Capital and Technical Assistance - Access to capital for upgrading in new technologies or
facilities might be one area of need, particularly related to those opportunities for improving energy efficiency.
Providing business intelligence and market analysis services for second-stage firms in the industry may also
provide prospects for supporting the local industry;
Leveraging Other Potential Assets - The Industrial Corridor provides multi-modal transportation opportunities
that may be advantageous to those establishments needing rail, truck and/or water transportation. Local
average wages may also provide some level of comparative advantage.

Transform Milwaukee 6-21 Metal Product Manufacturing
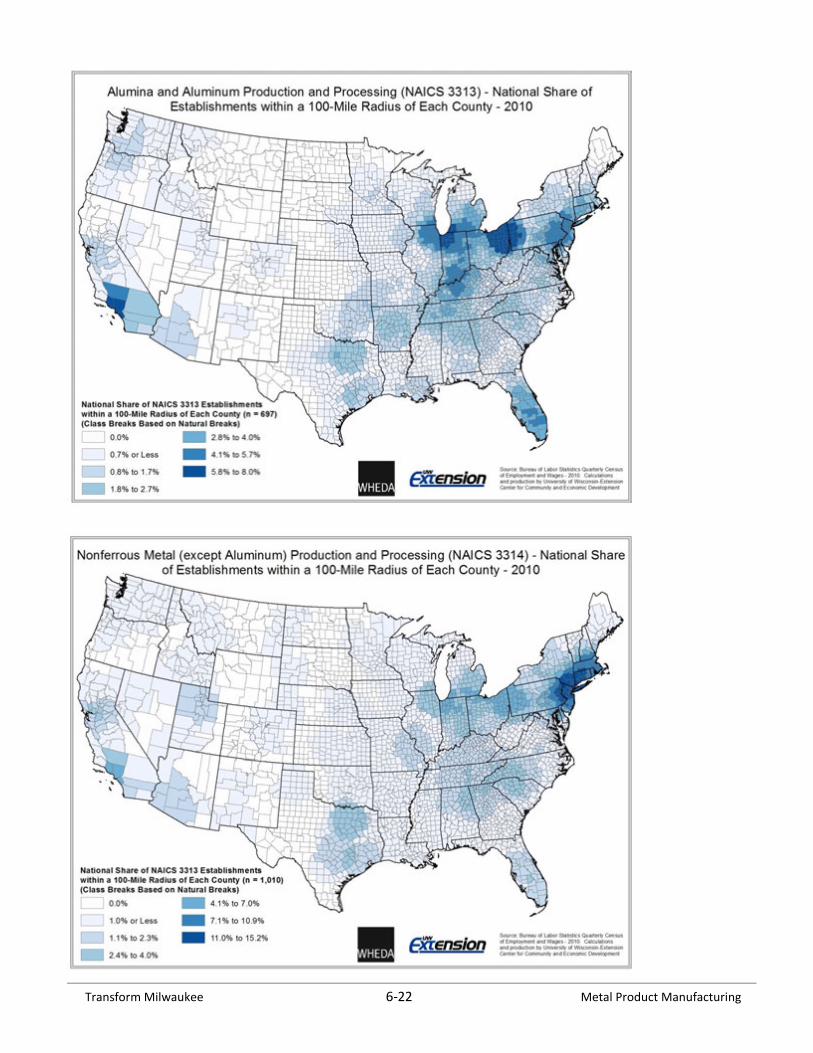
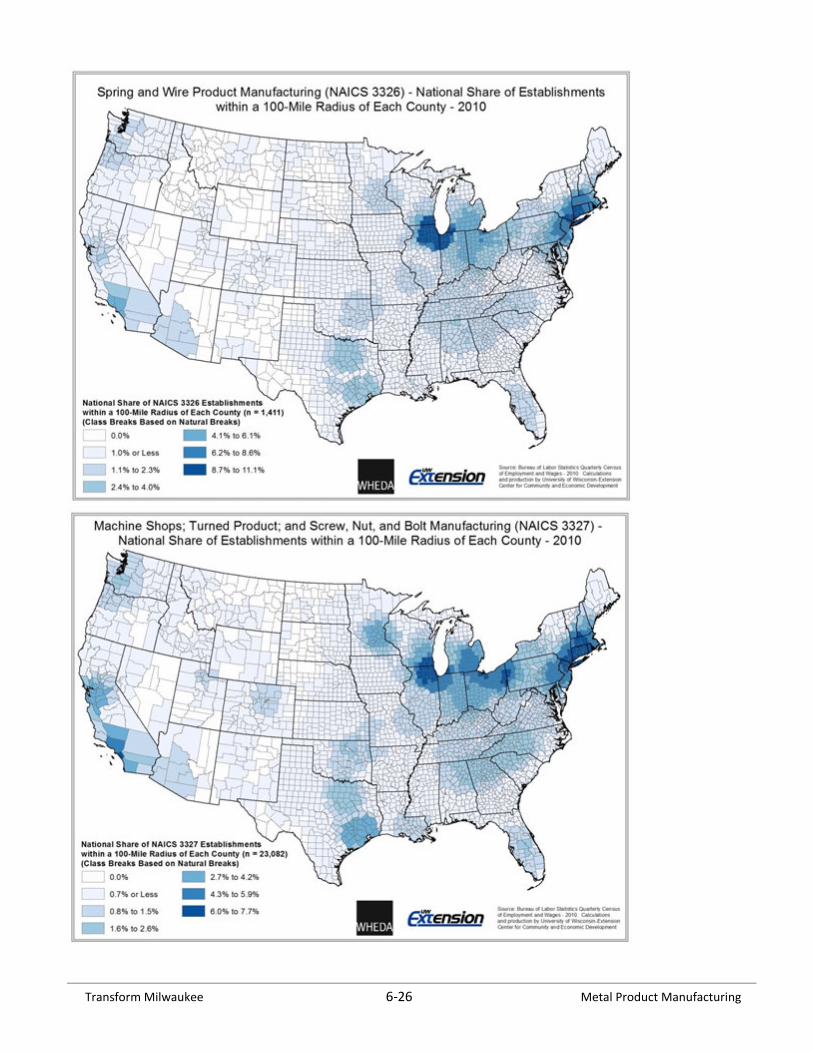
Appendix 6A – Establishment Concentrations for Primary and Fabricated Metal Manufacturing
Transform Milwaukee 6-22 Metal Product Manufacturing

Transform Milwaukee 6-23 Metal Product Manufacturing

Transform Milwaukee 6-24 Metal Product Manufacturing

Transform Milwaukee 6-25 Metal Product Manufacturing
Transform Milwaukee 6-26 Metal Product Manufacturing

Transform Milwaukee 6-27 Metal Product Manufacturing

Transform Milwaukee 6-28 Metal Product Manufacturing
Appendix 6B – Estimated Demand for Commodities Used by Metal Manufacturing in the M7 Region
Commodity Purchased by Primary Metal Manufacturing in the M7 Region
Total Demand (2011 Estimates)
Percent Purchased in the M7 Region
Total Product and Service Demand $1,663,200,000 34.9% Primary metal products $613,400,000 13.7% Scrap $142,100,000 10.8% Wholesale trade businesses $94,400,000 93.5% Electric power generation, transmission, and distribution $72,900,000 96.9% Mining gold, silver, and other metal ore $56,500,000 0.0% Transport by truck $44,900,000 82.5% Mining iron ore $43,000,000 0.0% Management of companies and enterprises $36,200,000 100.0% Transport by rail $36,000,000 28.4% Semiconductor and related device manufacturing $33,400,000 0.5% Natural gas distribution $31,900,000 69.0% Mining copper, nickel, lead, and zinc $25,200,000 0.0% Securities, commodity contracts, investments, and related activities $24,700,000 94.5% Maintenance and repair construction of nonresidential structures $22,800,000 87.2% Mining coal $19,500,000 0.0% Machine shops $17,100,000 20.9% Petroleum refineries $16,500,000 0.0% Services to buildings and dwellings $12,900,000 99.2% Material handling equipment manufacturing $12,000,000 15.9% Monetary authorities and depository credit intermediation activities $11,000,000 99.8% Coating, engraving, heat treating and allied activities $10,500,000 20.6% Printed circuit assembly (electronic assembly) manufacturing $10,000,000 5.4% Architectural, engineering, and related services $9,700,000 95.8% Industrial gas manufacturing $9,500,000 16.4% All other miscellaneous professional, scientific, and technical services $9,300,000 69.8% Carbon and graphite product manufacturing $8,600,000 30.5% Paperboard container manufacturing $8,500,000 61.9% Legal services $7,700,000 96.5% Special tool, die, jig, and fixture manufacturing $7,700,000 9.3% Commercial and industrial machinery and equipment repair and maintenance $7,500,000 94.4% Telecommunications $7,100,000 62.0% Communication and energy wire and cable manufacturing $6,900,000 12.7% Business support services $6,700,000 71.0% Other basic organic chemical manufacturing $6,700,000 11.5% Employment services $6,400,000 100.0% Specialized design services $6,200,000 81.9% Lime and gypsum product manufacturing $5,900,000 13.7% Waste management and remediation services $5,600,000 79.5% Automotive repair and maintenance, except car washes $5,300,000 93.7% Management, scientific, and technical consulting services $5,200,000 71.8% Real estate establishments $5,200,000 62.1% Advertising and related services $5,200,000 89.0% Food services and drinking places $5,100,000 93.7% Other fabricated metal manufacturing $5,000,000 26.3% Accounting, tax preparation, bookkeeping, and payroll services $4,800,000 81.0% Clay and nonclay refractory manufacturing $4,400,000 5.9% Facilities support services $4,300,000 21.4% Warehousing and storage $4,100,000 82.0% Source: IMPLAN

Transform Milwaukee 6-29 Metal Product Manufacturing
Commodity Purchased by Fabricated Metal Product Manufacturing in the M7 Region
Total Demand (2011 Estimates)
Percent Purchased in the M7 Region
Total Commodity Demand $4,427,700,000 40.6% Iron and steel mills and ferroalloy manufacturing $830,000,000 12.6% Fabricated metal products $769,100,000 26.2% Wholesale trade businesses $184,600,000 93.4% Aluminum product manufacturing from purchased aluminum $131,600,000 0.3% Securities, commodity contracts, investments, and related activities $121,000,000 94.3% Management of companies and enterprises $117,300,000 99.6% Electric power generation, transmission, and distribution $84,600,000 97.1% Semiconductor and related device manufacturing $84,100,000 0.5% Copper rolling, drawing, extruding and alloying $80,600,000 0.1% Steel product manufacturing from purchased steel $79,400,000 15.3% Nonferrous metal (except copper and alum.) rolling, drawing, extruding & alloying $74,900,000 8.7% Paint and coating manufacturing $73,300,000 44.2% Transport by truck $72,500,000 83.2% All other chemical product and preparation manufacturing $68,900,000 8.3% Real estate establishments $68,100,000 62.1% Monetary authorities and depository credit intermediation activities $65,200,000 99.7% Ferrous metal foundries $62,300,000 46.0% All other miscellaneous professional, scientific, and technical services $61,100,000 69.5% Telecommunications $57,900,000 61.9% Nonferrous metal foundries $55,300,000 43.3% Advertising and related services $51,700,000 88.7% Alumina refining and primary aluminum production $49,700,000 7.3% Accounting, tax preparation, bookkeeping, and payroll services $47,000,000 80.3% Maintenance and repair construction of nonresidential structures $46,200,000 86.6% Plastics material and resin manufacturing $45,100,000 2.8% Architectural, engineering, and related services $37,500,000 95.3% Petroleum refineries $37,200,000 0.0% Legal services $36,600,000 96.2% Lessors of nonfinancial intangible assets $35,200,000 62.9% Natural gas distribution $34,300,000 70.0% Food services and drinking places $33,700,000 93.7% Printed circuit assembly (electronic assembly) manufacturing $32,600,000 5.3% Paperboard container manufacturing $30,600,000 61.7% Business support services $29,500,000 70.2% Services to buildings and dwellings $28,700,000 98.7% Employment services $26,300,000 99.9% Warehousing and storage $24,500,000 81.4% Specialized design services $23,900,000 78.7% Hotels and motels, including casino hotels $22,100,000 0.8% Scientific research and development services $20,400,000 16.3% Transport by air $20,300,000 37.9% Management, scientific, and technical consulting services $19,600,000 71.5% Transport by rail $18,400,000 29.0% Automotive equipment rental and leasing $17,300,000 81.0% Other support services $16,700,000 99.6% Special tool, die, jig, and fixture manufacturing $16,600,000 8.9% Facilities support services $16,500,000 20.9% Cutting tool and machine tool accessory manufacturing $16,300,000 9.6% Motor vehicle parts manufacturing $15,800,000 6.3% Source: IMPLAN

Transform Milwaukee 6-30 Metal Product Manufacturing
Appendix 6C – Transportation Modes Used by Metal Manufacturing Industries
National Shipment Characteristics for NAICS 331 – Primary Metal Manufacturing (2007)
Mode 2007 Value
(million $)
2007 Tons
(thousands)
2007 Ton-miles
(millions)2
2007 Average miles
per shipment
All modes 251,412 201,339 98,318 545 Single modes 88.9% 87.7% 76.5% 440 Truck 74.8% 64.7% 48.1% 423 For-hire truck 63.1% 53.0% 43.8% 524 Private truck 11.8% 11.7% 4.4% 130 Rail 13.0% 21.7% 26.4% 578 Water 0.6% 1.2% 2.0% 844 Shallow draft 0.6% 1.2% 1.9% 774 Deep draft S S S S Air (incl. truck and air) 0.5% 0.0% 0.0% 1,248 Multiple modes 10.0% 11.3% 22.9% 865 Parcel, USPS or courier 2.5% 0.0% 0.1% 867 Truck and rail 6.3% 8.7% 15.7% 787 Truck and water 0.9% S S 1,194 Rail and water 0.1% 0.6% 1.3% 1,157 Other multiple modes 0.2% 0.4% 0.8% 1,111 Other and unknown modes 1.1% 1.0% 0.6% 364 S= suppressed 2 Ton-miles estimates are based on estimated distances traveled along a modeled transportation network.
Sources: U.S. Department of Transportation, Research and Innovative Technology Administration, Bureau of Transportation Statistics and U.S. Department of
Commerce, U.S. Census Bureau, 2007 Economic Census: Transportation Commodity Flow Survey, December 2009.
National Shipment Characteristics for NAICS 332 – Fabricated Metal Product Manufacturing (2007)
Mode 2007 Value
(million $)
2007 Tons
(thousands)
2007 Ton-miles
(millions)2
2007 Average miles
per shipment
All modes 338,290 118,350 44,620 596 Single modes 85.2% 96.7% 93.7% 394 Truck 83.0% 93.4% 86.2% 376 For-hire truck 58.8% 62.0% 76.1% 704 Private truck 24.2% 31.4% 10.1% 72 Rail 0.9% 3.2% 7.2% 843 Water S S S S Shallow draft S S S 1,731 Deep draft S S S S Air (incl. truck and air) 1.2% S 0.3% 1,283 Multiple modes 13.2% 1.6% 4.5% 910 Parcel, USPS or courier 12.5% 0.7% 1.5% 907 Truck and rail 0.4% 0.8% 1.9% 1,248 Truck and water 0.2% 0.1% 0.8% 2,917 Rail and water S 0.0% 0.1% S Other multiple modes S S S 4,274 Other and unknown modes 1.7% 1.7% 1.8% 185 S= suppressed 2 Ton-miles estimates are based on estimated distances traveled along a modeled transportation network.
Sources: U.S. Department of Transportation, Research and Innovative Technology Administration, Bureau of Transportation Statistics and U.S. Department of
Commerce, U.S. Census Bureau, 2007 Economic Census: Transportation Commodity Flow Survey, December 2009.

Transform Milwaukee 6-31 Metal Product Manufacturing
National Shipment Characteristics for Base Metal in Primary or Semi-Finished Forms and in Finished Basic Shapes (2007)
Mode 2007 Value
(million $)
2007 Tons
(thousands)
2007 Ton-miles
(millions)2
2007 Average miles
per shipment
All modes 488,410 364,940 129,224 360 Single modes 91.4% 92.3% 82.9% 191 Truck 81.5% 78.5% 59.2% 180 For-hire truck 54.8% 51.7% 50.9% 449 Private truck 26.7% 26.8% 8.3% 65 Rail 9.3% 13.1% 22.1% 562 Water 0.3% 0.7% 1.5% 833 Shallow draft 0.3% 0.7% 1.5% 735 Deep draft - S S 1,166 Air (incl. truck and air) 0.3% S S 1,200 Multiple modes 7.1% 6.5% 16.2% 880 Parcel, USPS or courier 3.0% 0.2% 0.3% 880 Truck and rail 3.4% 4.9% 10.9% 686 Truck and water 0.6% 1.2% S 1,666 Rail and water S S S S Other multiple modes 0.1% 0.2% 0.5% 1,026 Other and unknown modes 1.5% 1.2% 0.9% 100
S= suppressed 2 Ton-miles estimates are based on estimated distances traveled along a modeled transportation network. Sources: U.S. Department of Transportation, Research and Innovative Technology Administration, Bureau of Transportation Statistics and U.S. Department of
Commerce, U.S. Census Bureau, 2007 Economic Census: Transportation Commodity Flow Survey, December 2009.
National Shipment Characteristics for Articles of Base Metal (2007)
Mode 2007 Value
(million $)
2007 Tons
(thousands)
2007 Ton-miles
(millions)2
2007 Average miles
per shipment
All modes 388,292 131,924 52,343 561 Single modes 82.8% 94.5% 88% 278 Truck 80.9% 90.1% 79.2% 264 For-hire truck 52.9% 56.2% 68.8% 673 Private truck 28.1% 33.9% 10.4% 54 Rail 1.2% 4.3% 8.5% 627 Water S S S 1,318 Shallow draft S - S S Deep draft S S S 1,350 Air (incl. truck and air) 0.6% 0.1% 0.3% 1,267 Multiple modes 14.8% 3.9% 10.8% 851 Parcel, USPS or courier 13.6% 1.3% 2.4% 850 Truck and rail 0.8% 1.8% 6.5% 871 Truck and water 0.3% 0.8% 1.7% 2,215 Rail and water - S S 704 Other multiple modes S S S S Other and unknown modes 2.4% 1.6% 1.1% 65
S= suppressed 2 Ton-miles estimates are based on estimated distances traveled along a modeled transportation network. Sources: U.S. Department of Transportation, Research and Innovative Technology Administration, Bureau of Transportation Statistics and U.S. Department of
Commerce, U.S. Census Bureau, 2007 Economic Census: Transportation Commodity Flow Survey, December 2009.

Transform Milwaukee 6-32 Metal Product Manufacturing
Appendix 6D – Top 50 Occupations in Primary and Fabricated Metal Product Manufacturing
Top 50 Occupations by Share and Job Zone in Primary Metal Manufacturing (National Distribution) SOC Code
Occupation Percent of
Employment Job
Zone
51-1011 First-Line Supervisors of Production and Operating Workers 4.7% 2
51-4023 Rolling Machine Setters, Operators, and Tenders, Metal and Plastic 4.6% 2
49-9071 Maintenance and Repair Workers, General 4.2% 3
51-4051 Metal-Refining Furnace Operators and Tenders 3.6% 2
51-9061 Inspectors, Testers, Sorters, Samplers, and Weighers 3.5% 2
49-9041 Industrial Machinery Mechanics 3.4% 3
51-4021 Extruding and Drawing Machine Setters, Operators, and Tenders, Metal and Plastic 3.4% 2
51-9198 Helpers-Production Workers 3.3% 1
51-4072 Molding, Coremaking, and Casting Machine Setters, Operators, and Tenders, Metal and Plastic 3.3% 2
51-4031 Cutting, Punching, and Press Machine Setters, Operators, and Tenders, Metal and Plastic 3.3% 2
51-4052 Pourers and Casters, Metal 2.9% 2
53-7062 Laborers and Freight, Stock, and Material Movers, Hand 2.4% 2
51-4033 Grinding, Lapping, Polishing, and Buffing Machine Tool Setters, Operators, and Tenders 2.4% 2
51-4071 Foundry Mold and Coremakers 2.2% 2
53-7051 Industrial Truck and Tractor Operators 2.2% 2
51-4121 Welders, Cutters, Solderers, and Brazers 2.0% 2
51-2092 Team Assemblers 1.8% 2
51-4041 Machinists 1.6% 3
53-7021 Crane and Tower Operators 1.6% 3
47-2111 Electricians 1.5% 3
41-4012 Sales Representatives, Wholesale and Manufacturing, Except Technical and Scientific Products 1.4% 3
51-9399 Production Workers, All Other* 1.3% N/A
43-5071 Shipping, Receiving, and Traffic Clerks 1.3% 2
51-4011 Computer-Controlled Machine Tool Operators, Metal and Plastic 1.2% 2
51-4191 Heat Treating Equipment Setters, Operators, and Tenders, Metal and Plastic 1.2% 2
11-1021 General and Operations Managers 1.2% 3
51-9022 Grinding and Polishing Workers, Hand 1.2% 1
11-3051 Industrial Production Managers 1.2% 3
51-4081 Multiple Machine Tool Setters, Operators, and Tenders, Metal and Plastic 1.1% 2
49-1011 First-Line Supervisors of Mechanics, Installers, and Repairers 1.0% 3
43-5061 Production, Planning, and Expediting Clerks 1.0% 2
17-2112 Industrial Engineers 1.0% 4
51-4111 Tool and Die Makers 0.8% 3
43-9061 Office Clerks, General 0.8% 2
53-7064 Packers and Packagers, Hand 0.8% 2
51-4199 Metal Workers and Plastic Workers, All Other 0.7% N/A
53-7063 Machine Feeders and Offbearers 0.7% 2
49-9044 Millwrights 0.7% 3
43-3031 Bookkeeping, Accounting, and Auditing Clerks 0.6% 3
43-4051 Customer Service Representatives 0.6% 4
51-9111 Packaging and Filling Machine Operators and Tenders 0.6% 2
13-2011 Accountants and Auditors 0.6% 4
51-4035 Milling and Planing Machine Setters, Operators, and Tenders, Metal and Plastic 0.6% 3
51-4022 Forging Machine Setters, Operators, and Tenders, Metal and Plastic 0.6% 2
43-5081 Stock Clerks and Order Fillers 0.6% 2
17-2131 Materials Engineers 0.5% 4
17-2141 Mechanical Engineers 0.5% 4
51-9051 Furnace, Kiln, Oven, Drier, and Kettle Operators and Tenders 0.5% 2
49-9043 Maintenance Workers, Machinery 0.5% 2
53-3032 Heavy and Tractor-Trailer Truck Drivers 0.5% 2
Sources: Bureau of Labor Statistics, O*NET and UW-Extension Center for Community and Economic Development

Transform Milwaukee 6-33 Metal Product Manufacturing
Top 50 Occupations by Share and Job Zone in Fabricated Metal Product Manufacturing (National Distribution) SOC Code
Occupation Percent of
Employment Job
Zone
51-4041 Machinists 8.8% 3
51-4121 Welders, Cutters, Solderers, and Brazers 6.2% 2
51-2092 Team Assemblers 5.4% 2
51-1011 First-Line Supervisors of Production and Operating Workers 4.4% 2
51-4031 Cutting, Punching, and Press Machine Setters, Operators, and Tenders 4.2% 2
51-4011 Computer-Controlled Machine Tool Operators, Metal and Plastic 3.4% 2
51-2041 Structural Metal Fabricators and Fitters 3.0% 3
51-9061 Inspectors, Testers, Sorters, Samplers, and Weighers 2.7% 2
51-9198 Helpers-Production Workers 2.6% 1
51-4033 Grinding, Lapping, Polishing, and Buffing Machine Tool Setters, Operators, and Tenders 2.1% 2
11-1021 General and Operations Managers 2.1% 3
41-4012 Sales Representatives, Wholesale and Manufacturing, Except Technical & Scientific Products 2.1% 3
43-5071 Shipping, Receiving, and Traffic Clerks 1.9% 2
53-7062 Laborers and Freight, Stock, and Material Movers, Hand 1.9% 2
51-9121 Coating, Painting, and Spraying Machine Setters, Operators, and Tenders 1.8% 2
43-9061 Office Clerks, General 1.7% 2
51-4193 Plating and Coating Machine Setters, Operators, and Tenders, Metal and Plastic 1.6% 2
47-2211 Sheet Metal Workers 1.5% 2
51-4034 Lathe and Turning Machine Tool Setters, Operators, and Tenders, Metal and Plastic 1.5% 2
49-9071 Maintenance and Repair Workers, General 1.4% 3
51-4081 Multiple Machine Tool Setters, Operators, and Tenders, Metal and Plastic 1.4% 2
43-3031 Bookkeeping, Accounting, and Auditing Clerks 1.3% 3
11-3051 Industrial Production Managers 1.2% 3
17-2141 Mechanical Engineers 1.1% 4
51-2099 Assemblers and Fabricators, All Other 1.1% 3
51-4111 Tool and Die Makers 1.0% 3
53-7051 Industrial Truck and Tractor Operators 1.0% 2
43-4051 Customer Service Representatives 0.9% 4
49-9041 Industrial Machinery Mechanics 0.9% 3
51-4122 Welding, Soldering, and Brazing Machine Setters, Operators, and Tenders 0.9% 2
53-7064 Packers and Packagers, Hand 0.9% 2
43-6014 Secretaries and Administrative Assistants, Except Legal, Medical, and Executive 0.9% 2
17-2112 Industrial Engineers 0.8% 4
51-9399 Production Workers, All Other* 0.8% N/A
43-5061 Production, Planning, and Expediting Clerks 0.8% 2
13-1023 Purchasing Agents, Except Wholesale, Retail, and Farm Products 0.8% 4
51-4022 Forging Machine Setters, Operators, and Tenders, Metal and Plastic 0.8% 2
13-1051 Cost Estimators 0.7% 4
17-3013 Mechanical Drafters 0.7% 3
51-4191 Heat Treating Equipment Setters, Operators, and Tenders, Metal and Plastic 0.7% 2
51-4023 Rolling Machine Setters, Operators, and Tenders, Metal and Plastic 0.7% 2
51-4032 Drilling and Boring Machine Tool Setters, Operators, and Tenders, Metal and Plastic 0.6% 3
13-2011 Accountants and Auditors 0.6% 4
51-4035 Milling and Planing Machine Setters, Operators, and Tenders, Metal and Plastic 0.6% 3
43-5081 Stock Clerks and Order Fillers 0.6% 2
37-2011 Janitors and Cleaners, Except Maids and Housekeeping Cleaners 0.6% 1
51-4021 Extruding and Drawing Machine Setters, Operators, and Tenders, Metal and Plastic 0.6% 2
53-3033 Light Truck or Delivery Services Drivers 0.5% 2
43-1011 First-Line Supervisors of Office and Administrative Support Workers 0.5% 3
51-4012 Computer Numerically Controlled Machine Tool Programmers, Metal and Plastic 0.5% 3
Sources: Bureau of Labor Statistics, O*NET and UW-Extension Center for Community and Economic Development
Related Documents