Rural Industries 221 SECTION - 5: RURAL INDUSTRIES This section summarises the progress made in the Village and the Small Industry (VSI) sector. The data on Handloom Sector and production and exports of sericulture and coir products are also included in this section. 5.1 : The data on performance of Units, Employment, Investment and Gross Output for Micro, Small and Medium Enterprises (MSME) for the years 2001-02 to 2013-14 are presented. 5.2: Summary Results of Fourth MSME census are shown. 5.3: This Table contains data on Plan allocation and Expenditure on MSME Sector for the years 2012-13 to 2014-15. 5.4 & 5.5: These Tables contain data on KVI sector Allocation, Releases, Production and Employment generated during 2009-10 to 2014-15. 5.6: Production of Spun Yarn for the years 2004-05 to 2015-16 is given. 5.7: Data on production of cloth in different sectors during 2004-05 to 2015-16 are presented. 5.8 & 5.9 : These Tables contain data on Production and Employment in Sericulture and Silk Textiles Industry for the years 2012-13 and 2015-16. Details of exports of silk products during 2009-10 to 2014-15 are presented. 5.10 & 5.11: Production of raw silk in India during the last three decades and Production of mulberry silk during 1980-81 to 2013-14 are given in these Tables. 5.12 , 5.13 5.14 & 5.15: The quantity of Coir products and Production and Export and Imports of Jute are given in these Tables. 5.16 to 5.23 Sixth Economic Census Tables - number of establishments and number of persons employed in rural areas.

Welcome message from author
This document is posted to help you gain knowledge. Please leave a comment to let me know what you think about it! Share it to your friends and learn new things together.
Transcript
Rural Industries 221
SECTION - 5: RURAL INDUSTRIES
This section summarises the progress made in the Village and the Small Industry (VSI) sector. The data on Handloom Sector and production and exports of sericulture and coir products are also included in this section.
5.1 : The data on performance of Units, Employment, Investment and Gross Output for Micro, Small and Medium Enterprises (MSME) for the years 2001-02 to 2013-14 are presented.
5.2: Summary Results of Fourth MSME census are shown.
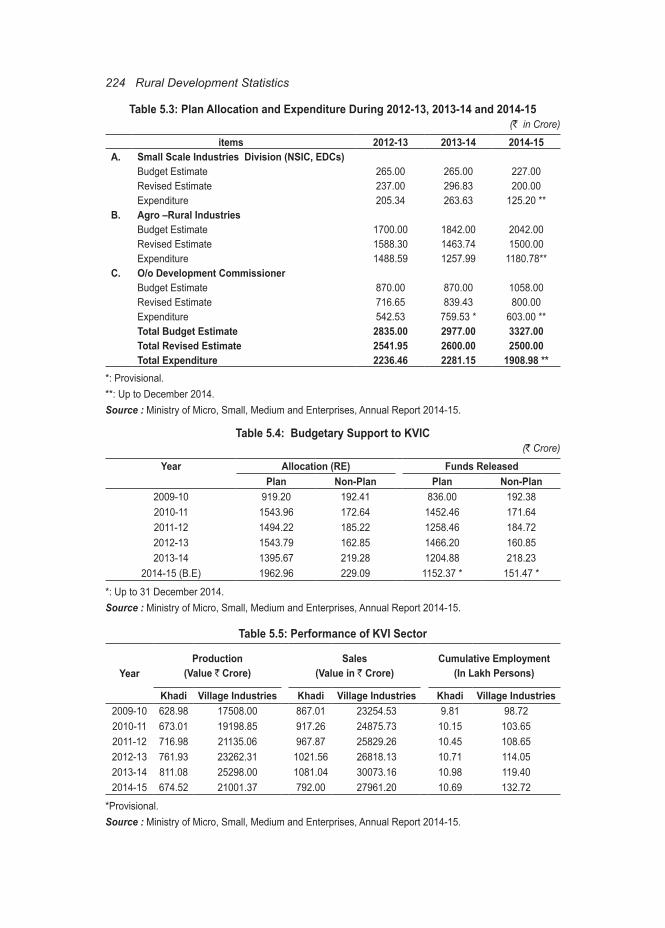
5.3: This Table contains data on Plan allocation and Expenditure on MSME Sector for the years 2012-13 to 2014-15.
5.4 & 5.5: These Tables contain data on KVI sector Allocation, Releases, Production and Employment generated during 2009-10 to 2014-15.
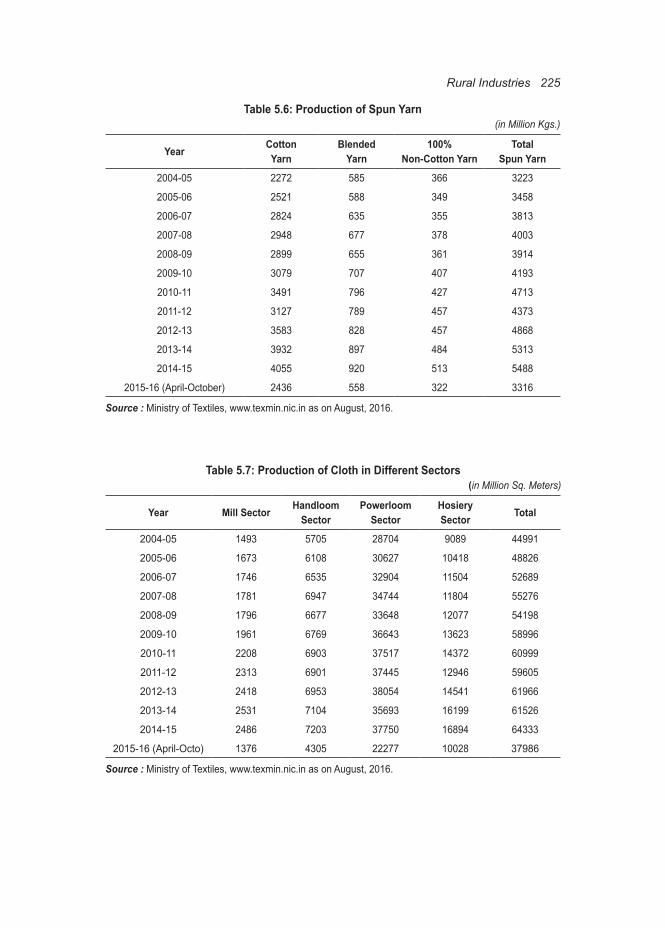
5.6: Production of Spun Yarn for the years 2004-05 to 2015-16 is given.
5.7: Data on production of cloth in different sectors during 2004-05 to 2015-16 are presented.
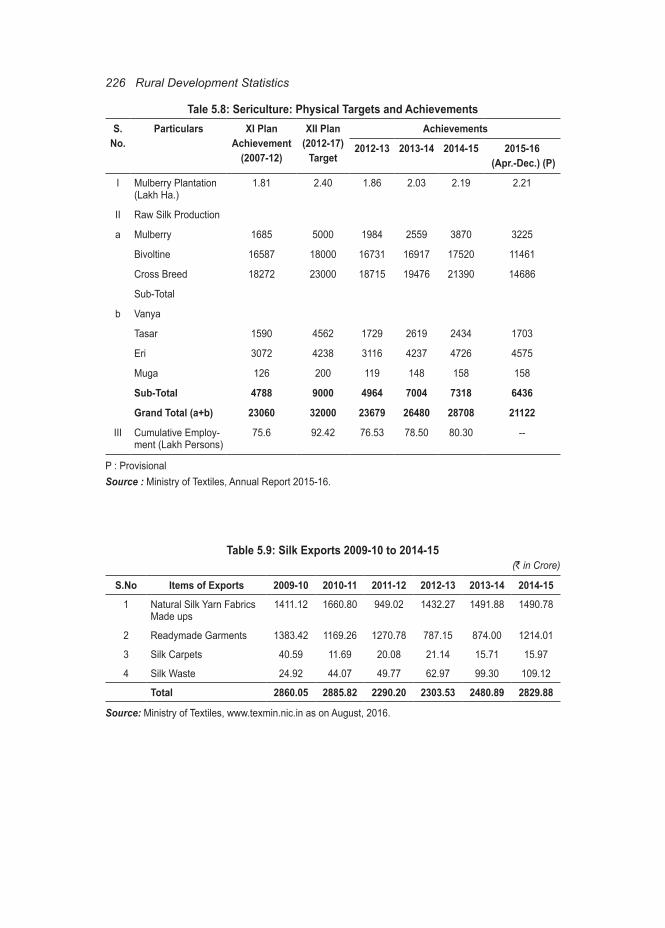
5.8 & 5.9 : These Tables contain data on Production and Employment in Sericulture and Silk Textiles Industry for the years 2012-13 and 2015-16. Details of exports of silk products during 2009-10 to 2014-15 are presented.
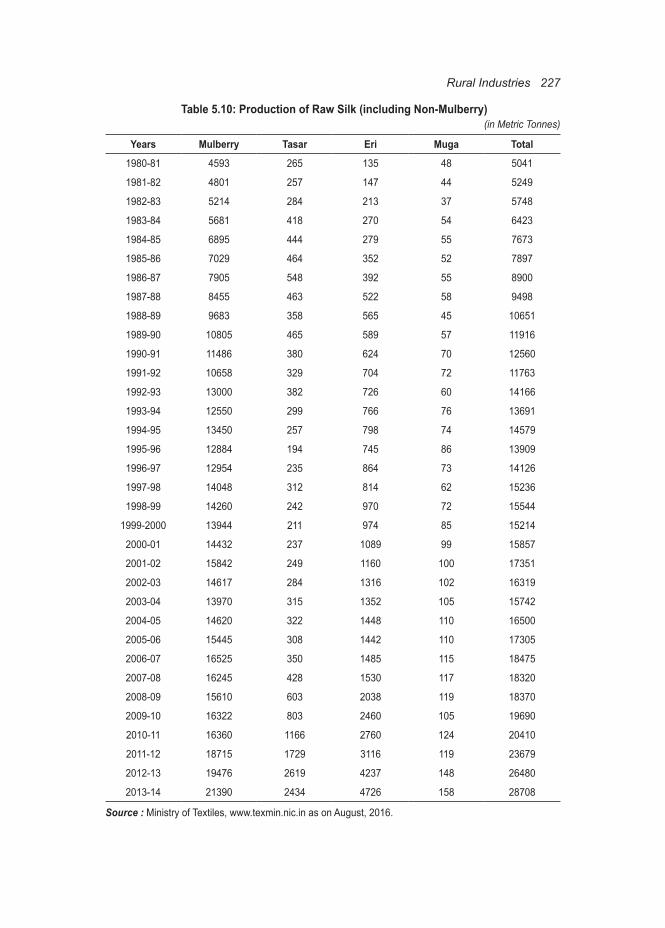
5.10 & 5.11: Production of raw silk in India during the last three decades and Production of mulberry silk during 1980-81 to 2013-14 are given in these Tables.
5.12 , 5.13 5.14 & 5.15:
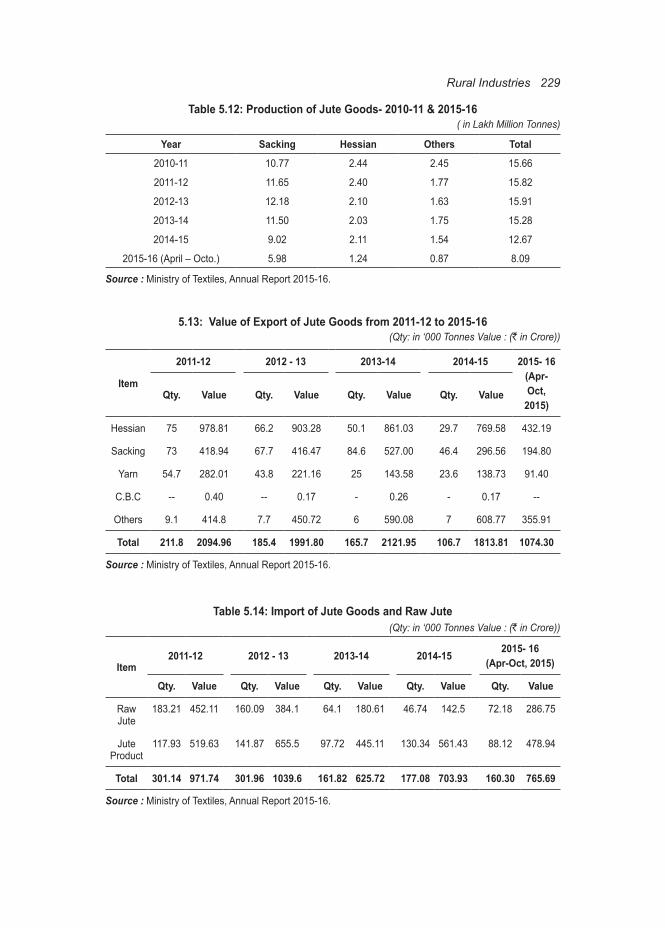
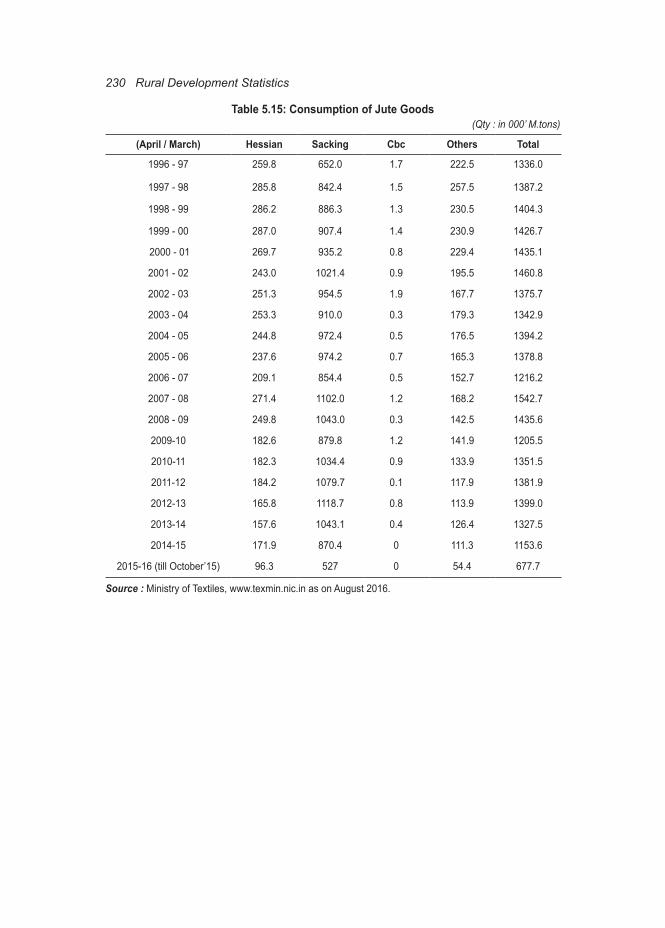
The quantity of Coir products and Production and Export and Imports of Jute are given in these Tables.
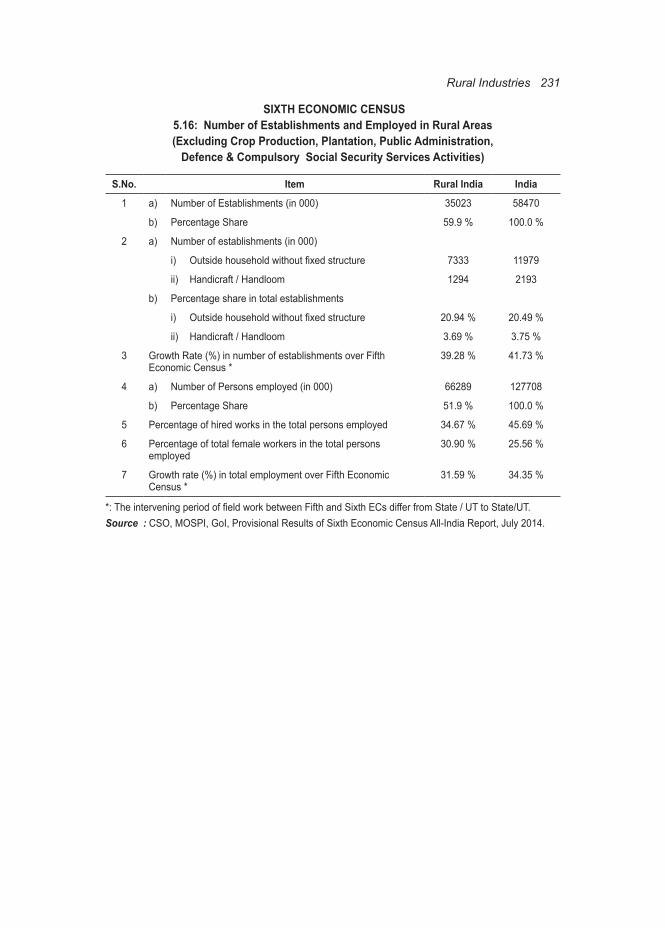
5.16 to 5.23 Sixth Economic Census Tables - number of establishments and number of persons employed in rural areas.
222 Rural Development Statistics
Highlights
l Rural industrialisation has been given prominence in the current decade under Khadi and Village Industries Commission (KVIC) and Prime Minister’s Rozgar Yojana (PMRY).
l The high economic growth perhaps has caused spurt in the demand for cloth. The production of cloth under Mill, Handloom, and Powerloom and hosiery sectors has registered an increase of 43 per cent from 44991 million sq. meters during the period 2004-05 to 2014-15.

Rural Industries 223
SECTION 5: RURAL INDUSTRIESTable 5.1: Performance of SSI/ MSME Units, Employment,
Investments and Gross Output
S.No. Year Total Working
Enterprise (In Lakh)Employment
(In Lakh)Market Value of Fixed
Assets (` in Crore)
1 2001-02 105.21 249.33 154349.00
2 2002-03 109.49 260.21 162317.00
3 2003-04 113.95 271.42 170219.00
4 2004-05 118.59 282.57 178699.00
5 2005-06 123.42 294.91 188113.00
6 2006-07 361.76 805.23 868543.79
7 2007-08 377.37 842.00 920459.84
8 2008-09 393.70 880.84 977114.72
9 2009-10 410.82 922.19 1038546.08
10 2010-11 # 428.73 965.15 1105934.09
11 2011-12 # 447.64 1011.69 1182757.64
12 2012-13 # 447.54 1061.40 1268763.67
13 2013-14 # 488.46 1114.29 1363700.54
# Projected.Source : Ministry of Micro, Small, Medium and Enterprises, Annual Report 2014-15.
Table 5.2: Summary Results : Fourth All India Census of MSME - 2014
S.No. Characteristics Registered
SectorUnregistered
SectorEconomic
Census 2005 Total
1 Size of Sector (Lakh) 15.64 198.74 147.38 361.762 No. of Rural Units (Lakh) 7.07
(45.20 %)119.68
(60.22 %)73.43
(49.82 %)200.18
(55.34 %)3 No. of Women Enterprises
(Lakh)2.15
(13.72 %)18.06
(9.09 %)6.40
(4.34 %)26.61
(7.36 %)4 Total Employment (Lakh) 93.09 408.84 303.31 805.245 Per Unit Employment 5.95 2.06 2.06 2.236 Total Original Value of Plant &
Machinery (` in Lakh)10502461 9463960 -- 19966421
7 Per Unit Original Value of Plant & Machinery (` in Lakh)
6.72 0.48 -- --
8 Total Fixed Investment (` in Lakh)
44913840 24081646 -- 68995486
9 Per Unit Fixed Investment (` in Lakh)
28.72 1.21 -- --
10 Total Gross Output (` in Lakh) 70751027 36970259 -- 107721286
Source : Ministry of Micro, Small, Medium and Enterprises, Annual Report 2014-15.
224 Rural Development Statistics
Table 5.3: Plan Allocation and Expenditure During 2012-13, 2013-14 and 2014-15(` in Crore)
items 2012-13 2013-14 2014-15A. Small Scale Industries Division (NSIC, EDCs)
Budget Estimate 265.00 265.00 227.00Revised Estimate 237.00 296.83 200.00Expenditure 205.34 263.63 125.20 **
B. Agro –Rural IndustriesBudget Estimate 1700.00 1842.00 2042.00Revised Estimate 1588.30 1463.74 1500.00Expenditure 1488.59 1257.99 1180.78**
C. O/o Development CommissionerBudget Estimate 870.00 870.00 1058.00Revised Estimate 716.65 839.43 800.00Expenditure 542.53 759.53 * 603.00 **Total Budget Estimate 2835.00 2977.00 3327.00Total Revised Estimate 2541.95 2600.00 2500.00Total Expenditure 2236.46 2281.15 1908.98 **
*: Provisional.**: Up to December 2014.Source : Ministry of Micro, Small, Medium and Enterprises, Annual Report 2014-15.
Table 5.4: Budgetary Support to KVIC(` Crore)
Year Allocation (RE) Funds Released Plan Non-Plan Plan Non-Plan
2009-10 919.20 192.41 836.00 192.382010-11 1543.96 172.64 1452.46 171.642011-12 1494.22 185.22 1258.46 184.722012-13 1543.79 162.85 1466.20 160.852013-14 1395.67 219.28 1204.88 218.23
2014-15 (B.E) 1962.96 229.09 1152.37 * 151.47 *
*: Up to 31 December 2014.Source : Ministry of Micro, Small, Medium and Enterprises, Annual Report 2014-15.
Table 5.5: Performance of KVI Sector
YearProduction
(Value ` Crore)Sales
(Value in ` Crore)Cumulative Employment
(In Lakh Persons)
Khadi Village Industries Khadi Village Industries Khadi Village Industries2009-10 628.98 17508.00 867.01 23254.53 9.81 98.722010-11 673.01 19198.85 917.26 24875.73 10.15 103.652011-12 716.98 21135.06 967.87 25829.26 10.45 108.652012-13 761.93 23262.31 1021.56 26818.13 10.71 114.052013-14 811.08 25298.00 1081.04 30073.16 10.98 119.402014-15 674.52 21001.37 792.00 27961.20 10.69 132.72
*Provisional.Source : Ministry of Micro, Small, Medium and Enterprises, Annual Report 2014-15.
Rural Industries 225
Table 5.6: Production of Spun Yarn (in Million Kgs.)
Year Cotton Yarn
Blended Yarn
100% Non-Cotton Yarn
Total Spun Yarn
2004-05 2272 585 366 3223
2005-06 2521 588 349 3458
2006-07 2824 635 355 3813
2007-08 2948 677 378 4003
2008-09 2899 655 361 3914
2009-10 3079 707 407 4193
2010-11 3491 796 427 4713
2011-12 3127 789 457 4373
2012-13 3583 828 457 4868
2013-14 3932 897 484 5313
2014-15 4055 920 513 5488
2015-16 (April-October) 2436 558 322 3316
Source : Ministry of Textiles, www.texmin.nic.in as on August, 2016.
Table 5.7: Production of Cloth in Different Sectors(in Million Sq. Meters)
Year Mill Sector Handloom Sector
Powerloom Sector
Hosiery Sector Total
2004-05 1493 5705 28704 9089 44991
2005-06 1673 6108 30627 10418 48826
2006-07 1746 6535 32904 11504 52689
2007-08 1781 6947 34744 11804 55276
2008-09 1796 6677 33648 12077 54198
2009-10 1961 6769 36643 13623 58996
2010-11 2208 6903 37517 14372 60999
2011-12 2313 6901 37445 12946 59605
2012-13 2418 6953 38054 14541 61966
2013-14 2531 7104 35693 16199 61526
2014-15 2486 7203 37750 16894 64333
2015-16 (April-Octo) 1376 4305 22277 10028 37986
Source : Ministry of Textiles, www.texmin.nic.in as on August, 2016.
226 Rural Development Statistics
Table 5.9: Silk Exports 2009-10 to 2014-15(` in Crore)
S.No Items of Exports 2009-10 2010-11 2011-12 2012-13 2013-14 2014-15
1 Natural Silk Yarn Fabrics Made ups
1411.12 1660.80 949.02 1432.27 1491.88 1490.78
2 Readymade Garments 1383.42 1169.26 1270.78 787.15 874.00 1214.01
3 Silk Carpets 40.59 11.69 20.08 21.14 15.71 15.97
4 Silk Waste 24.92 44.07 49.77 62.97 99.30 109.12
Total 2860.05 2885.82 2290.20 2303.53 2480.89 2829.88
Source: Ministry of Textiles, www.texmin.nic.in as on August, 2016.
Tale 5.8: Sericulture: Physical Targets and AchievementsS.
No.Particulars XI Plan
Achievement (2007-12)
XII Plan (2012-17)
Target
Achievements
2012-13 2013-14 2014-15 2015-16 (Apr.-Dec.) (P)
I Mulberry Plantation (Lakh Ha.)
1.81 2.40 1.86 2.03 2.19 2.21
II Raw Silk Production
a Mulberry 1685 5000 1984 2559 3870 3225
Bivoltine 16587 18000 16731 16917 17520 11461
Cross Breed 18272 23000 18715 19476 21390 14686
Sub-Total
b Vanya
Tasar 1590 4562 1729 2619 2434 1703
Eri 3072 4238 3116 4237 4726 4575
Muga 126 200 119 148 158 158
Sub-Total 4788 9000 4964 7004 7318 6436
Grand Total (a+b) 23060 32000 23679 26480 28708 21122
III Cumulative Employ-ment (Lakh Persons)
75.6 92.42 76.53 78.50 80.30 --
P : ProvisionalSource : Ministry of Textiles, Annual Report 2015-16.
Rural Industries 227
Table 5.10: Production of Raw Silk (including Non-Mulberry)(in Metric Tonnes)
Years Mulberry Tasar Eri Muga Total
1980-81 4593 265 135 48 5041
1981-82 4801 257 147 44 5249
1982-83 5214 284 213 37 5748
1983-84 5681 418 270 54 6423
1984-85 6895 444 279 55 7673
1985-86 7029 464 352 52 7897
1986-87 7905 548 392 55 8900
1987-88 8455 463 522 58 9498
1988-89 9683 358 565 45 10651
1989-90 10805 465 589 57 11916
1990-91 11486 380 624 70 12560
1991-92 10658 329 704 72 11763
1992-93 13000 382 726 60 14166
1993-94 12550 299 766 76 13691
1994-95 13450 257 798 74 14579
1995-96 12884 194 745 86 13909
1996-97 12954 235 864 73 14126
1997-98 14048 312 814 62 15236
1998-99 14260 242 970 72 15544
1999-2000 13944 211 974 85 15214
2000-01 14432 237 1089 99 15857
2001-02 15842 249 1160 100 17351
2002-03 14617 284 1316 102 16319
2003-04 13970 315 1352 105 15742
2004-05 14620 322 1448 110 16500
2005-06 15445 308 1442 110 17305
2006-07 16525 350 1485 115 18475
2007-08 16245 428 1530 117 18320
2008-09 15610 603 2038 119 18370
2009-10 16322 803 2460 105 19690
2010-11 16360 1166 2760 124 20410
2011-12 18715 1729 3116 119 23679
2012-13 19476 2619 4237 148 26480
2013-14 21390 2434 4726 158 28708
Source : Ministry of Textiles, www.texmin.nic.in as on August, 2016.

228 Rural Development Statistics
Table 5.11: Mulberry Silk Production in IndiaYear Mulberry Plantation
(‘000 Hectare)Reeling Cocoon (‘000
Tonne)Raw Silk(Tonne)
Silk Waste(Tonne)
2002-03 194 128 14617 4514
2003-04 185 117 13970 3764
2004-05 172 120 14620 3587
2005-06 179 126 15445 3749
2006-07 192 135 16525 4055
2007-08 185 135 16245 3416
2008-09 178 125 15610 3746
2009-10 184 132 16322 4080
2010-11 170 131 16360 4090
2011-12 181 140 18272 4568
2012-13 186 144 18715 5935
2013-14 203 143 19476 6620
2014-15 220 159 21390 5071
Source : Ministry of Textiles, www.texmin.nic.in as on August 2016.
Rural Industries 229
Table 5.12: Production of Jute Goods- 2010-11 & 2015-16 ( in Lakh Million Tonnes)
Year Sacking Hessian Others Total
2010-11 10.77 2.44 2.45 15.66
2011-12 11.65 2.40 1.77 15.82
2012-13 12.18 2.10 1.63 15.91
2013-14 11.50 2.03 1.75 15.28
2014-15 9.02 2.11 1.54 12.67
2015-16 (April – Octo.) 5.98 1.24 0.87 8.09
Source : Ministry of Textiles, Annual Report 2015-16.
5.13: Value of Export of Jute Goods from 2011-12 to 2015-16(Qty: in ‘000 Tonnes Value : (` in Crore))
Item
2011-12 2012 - 13 2013-14 2014-15 2015- 16 (Apr-Oct,
2015)Qty. Value Qty. Value Qty. Value Qty. Value
Hessian 75 978.81 66.2 903.28 50.1 861.03 29.7 769.58 432.19
Sacking 73 418.94 67.7 416.47 84.6 527.00 46.4 296.56 194.80
Yarn 54.7 282.01 43.8 221.16 25 143.58 23.6 138.73 91.40
C.B.C -- 0.40 -- 0.17 - 0.26 - 0.17 --
Others 9.1 414.8 7.7 450.72 6 590.08 7 608.77 355.91
Total 211.8 2094.96 185.4 1991.80 165.7 2121.95 106.7 1813.81 1074.30
Source : Ministry of Textiles, Annual Report 2015-16.
Table 5.14: Import of Jute Goods and Raw Jute (Qty: in ‘000 Tonnes Value : (` in Crore))
Item2011-12 2012 - 13 2013-14 2014-15 2015- 16
(Apr-Oct, 2015)
Qty. Value Qty. Value Qty. Value Qty. Value Qty. Value
Raw Jute
183.21 452.11 160.09 384.1 64.1 180.61 46.74 142.5 72.18 286.75
Jute Product
117.93 519.63 141.87 655.5 97.72 445.11 130.34 561.43 88.12 478.94
Total 301.14 971.74 301.96 1039.6 161.82 625.72 177.08 703.93 160.30 765.69
Source : Ministry of Textiles, Annual Report 2015-16.
230 Rural Development Statistics
Table 5.15: Consumption of Jute Goods (Qty : in 000’ M.tons)
(April / March) Hessian Sacking Cbc Others Total
1996 - 97 259.8 652.0 1.7 222.5 1336.0
1997 - 98 285.8 842.4 1.5 257.5 1387.2
1998 - 99 286.2 886.3 1.3 230.5 1404.3
1999 - 00 287.0 907.4 1.4 230.9 1426.7
2000 - 01 269.7 935.2 0.8 229.4 1435.1
2001 - 02 243.0 1021.4 0.9 195.5 1460.8
2002 - 03 251.3 954.5 1.9 167.7 1375.7
2003 - 04 253.3 910.0 0.3 179.3 1342.9
2004 - 05 244.8 972.4 0.5 176.5 1394.2
2005 - 06 237.6 974.2 0.7 165.3 1378.8
2006 - 07 209.1 854.4 0.5 152.7 1216.2
2007 - 08 271.4 1102.0 1.2 168.2 1542.7
2008 - 09 249.8 1043.0 0.3 142.5 1435.6
2009-10 182.6 879.8 1.2 141.9 1205.5
2010-11 182.3 1034.4 0.9 133.9 1351.5
2011-12 184.2 1079.7 0.1 117.9 1381.9
2012-13 165.8 1118.7 0.8 113.9 1399.0
2013-14 157.6 1043.1 0.4 126.4 1327.5
2014-15 171.9 870.4 0 111.3 1153.6
2015-16 (till October’15) 96.3 527 0 54.4 677.7
Source : Ministry of Textiles, www.texmin.nic.in as on August 2016.
Rural Industries 231
SIXTH ECONOMIC CENSUS5.16: Number of Establishments and Employed in Rural Areas (Excluding Crop Production, Plantation, Public Administration,
Defence & Compulsory Social Security Services Activities)
S.No. Item Rural India India
1 a) Number of Establishments (in 000) 35023 58470
b) Percentage Share 59.9 % 100.0 %
2 a) Number of establishments (in 000)
i) Outsidehouseholdwithoutfixedstructure 7333 11979
ii) Handicraft / Handloom 1294 2193
b) Percentage share in total establishments
i) Outsidehouseholdwithoutfixedstructure 20.94 % 20.49 %
ii) Handicraft / Handloom 3.69 % 3.75 %
3 Growth Rate (%) in number of establishments over Fifth Economic Census *
39.28 % 41.73 %
4 a) Number of Persons employed (in 000) 66289 127708
b) Percentage Share 51.9 % 100.0 %
5 Percentage of hired works in the total persons employed 34.67 % 45.69 %
6 Percentage of total female workers in the total persons employed
30.90 % 25.56 %
7 Growth rate (%) in total employment over Fifth Economic Census *
31.59 % 34.35 %
*:TheinterveningperiodoffieldworkbetweenFifthandSixthECsdifferfromState/UTtoState/UT.Source : CSO, MOSPI, GoI, Provisional Results of Sixth Economic Census All-India Report, July 2014.
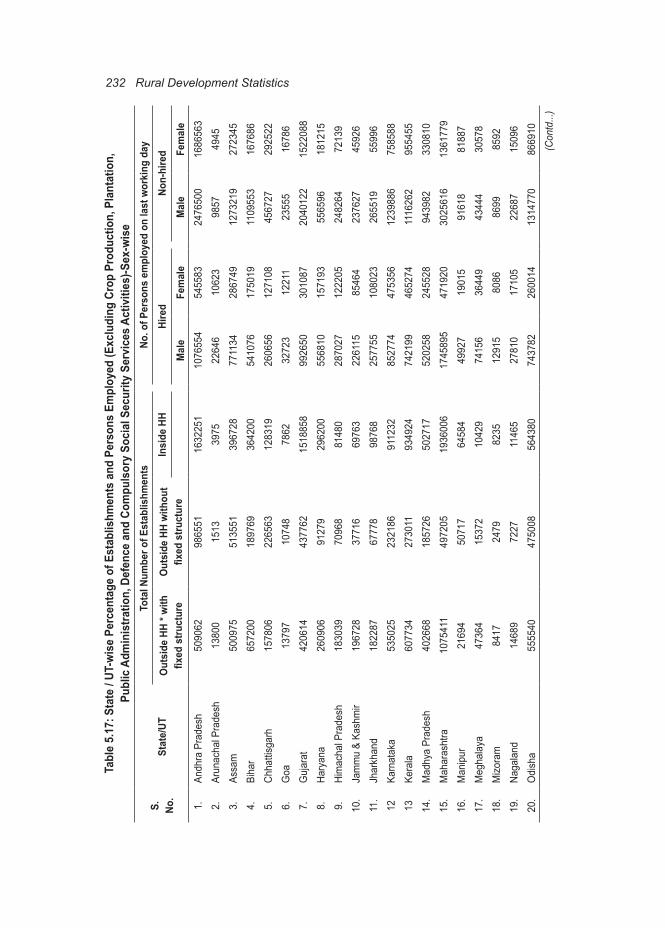
232 Rural Development Statistics
Tabl
e 5.
17: S
tate
/ UT
-wis
e Pe
rcen
tage
of E
stab
lishm
ents
and
Per
sons
Em
ploy
ed (E
xclu
ding
Cro
p Pr
oduc
tion,
Pla
ntat
ion,
Pu
blic
Adm
inis
tratio
n, D
efen
ce a
nd C
ompu
lsor
y So
cial
Sec
urity
Ser
vice
s Ac
tiviti
es)-S
ex-w
ise
S. No.
Stat
e/UT
Tota
l Num
ber o
f Est
ablis
hmen
tsNo
. of P
erso
ns e
mpl
oyed
on
last
wor
king
day
Out
side
HH
* with
fix
ed s
truct
ure
Out
side
HH
with
out
fixed
stru
ctur
eIn
side
HH
Hire
dNo
n-hi
red
Mal
e Fe
mal
eM
ale
Fem
ale
1.An
dhra
Pra
desh
5090
6298
6551
1632
251
1076
554
5455
8324
7650
016
8656
32.
Arun
acha
l Pra
desh
1380
015
1339
7522
646
1062
398
5749
453.
Assa
m50
0975
5135
5139
6728
7711
3428
6749
1273
219
2723
454.
Biha
r65
7200
1897
6936
4200
5410
7617
5019
1109
553
1676
865.
Chha
ttisg
arh
1578
0622
6563
1283
1926
0656
1271
0845
6727
2925
226.
Goa
1379
710
748
7862
3272
312
211
2355
516
786
7.G
ujar
at42
0614
4377
6215
1885
899
2650
3010
8720
4012
215
2208
88.
Hary
ana
2609
0691
279
2962
0055
6810
1571
9355
6596
1812
159.
Him
acha
l Pra
desh
1830
3970
968
8148
028
7027
1222
0524
8264
7213
910
.Ja
mm
u &
Kash
mir
1967
2837
716
6976
322
6115
8546
423
7627
4592
611
.Jh
arkh
and
1822
8767
778
9876
825
7755
1080
2326
5519
5599
612
Karn
atak
a53
5025
2321
8691
1232
8527
7447
5356
1239
886
7585
8813
Kera
la60
7734
2730
1193
4924
7421
9946
5274
1116
262
9554
5514
.M
adhy
a Pr
ades
h40
2668
1857
2650
2717
5202
5824
5528
9439
8233
0810
15.
Mah
aras
htra
1075
411
4972
0519
3600
617
4589
547
1920
3025
616
1361
779
16.
Man
ipur
2169
450
717
6458
449
927
1901
591
618
8188
717
.M
egha
laya
4736
415
372
1042
974
156
3644
943
444
3057
818
.M
izora
m84
1724
7982
3512
915
8086
8699
8592
19.
Naga
land
1468
972
2711
465
2781
017
105
2268
715
096
20.
Odi
sha
5555
4047
5008
5643
8074
3782
2600
1413
1477
086
6910
(Con
td...
)
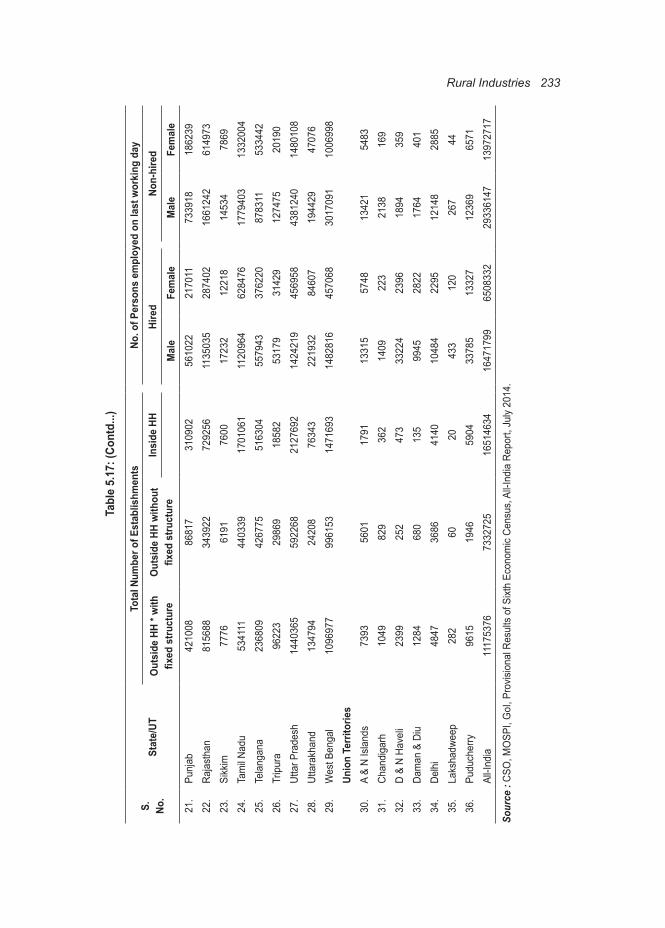
Rural Industries 233
S. No.
Stat
e/UT
Tota
l Num
ber o
f Est
ablis
hmen
tsNo
. of P
erso
ns e
mpl
oyed
on
last
wor
king
day
Out
side
HH
* with
fix
ed s
truct
ure
Out
side
HH
with
out
fixed
stru
ctur
eIn
side
HH
Hire
dNo
n-hi
red
Mal
e Fe
mal
eM
ale
Fem
ale
21.
Punj
ab42
1008
8681
731
0902
5610
2221
7011
7339
1818
6239
22.
Raja
stha
n81
5688
3439
2272
9256
1135
035
2874
0216
6124
261
4973
23.
Sikk
im77
7661
9176
0017
232
1221
814
534
7869
24.
Tam
il Nad
u53
4111
4403
3917
0106
111
2096
462
8476
1779
403
1332
004
25.
Tela
ngan
a23
6809
4267
7551
6304
5579
4337
6220
8783
1153
3442
26.
Trip
ura
9622
329
869
1858
253
179
3142
912
7475
2019
027
.Ut
tar P
rade
sh14
4036
559
2268
2127
692
1424
219
4569
5843
8124
014
8010
828
.Ut
tara
khan
d13
4794
2420
876
343
2219
3284
607
1944
2947
076
29.
Wes
t Ben
gal
1096
977
9961
5314
7169
314
8281
645
7068
3017
091
1006
998
Unio
n Te
rrito
ries
30.
A &
N Is
land
s 73
9356
0117
9113
315
5748
1342
154
8331
.Ch
andi
garh
10
4982
936
214
0922
321
3816
932
.D
& N
Have
li 23
9925
247
333
224
2396
1894
359
33.
Dam
an &
Diu
12
8468
013
599
4528
2217
6440
134
.De
lhi
4847
3686
4140
1048
422
9512
148
2885
35.
Laks
hadw
eep
282
6020
433
120
267
4436
.Pu
duch
erry
9615
1946
5904
3378
513
327
1236
965
71Al
l-Ind
ia11
1753
7673
3272
516
5146
3416
4717
9965
0833
229
3361
4713
9727
17
Sour
ce :
CSO
, MO
SPI,
GoI
, Pro
visio
nal R
esul
ts o
f Sixt
h Ec
onom
ic Ce
nsus
, All-
Indi
a Re
port,
Jul
y 20
14.
Tabl
e 5.
17: (
Cont
d...)
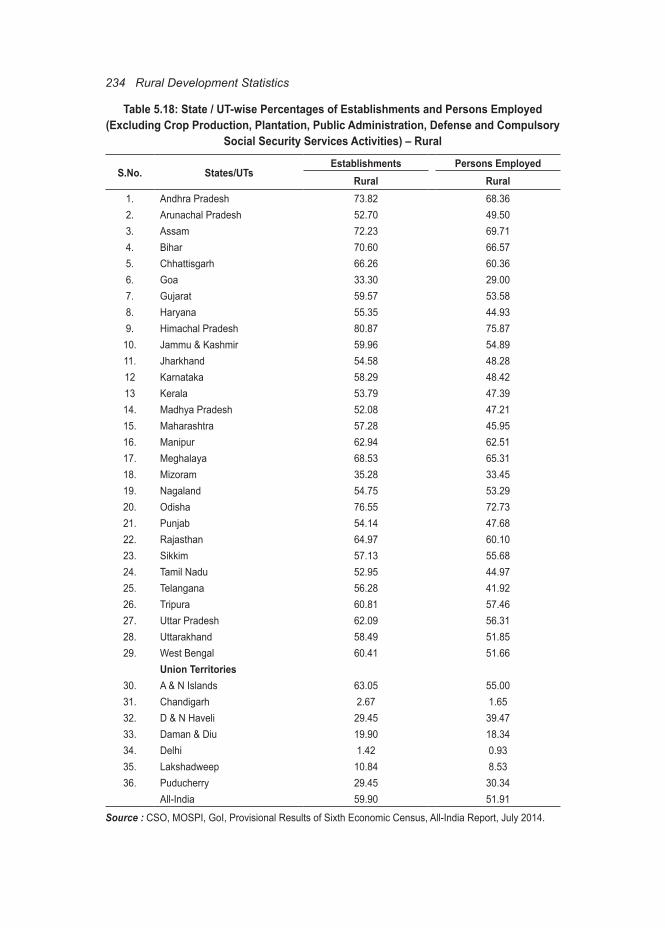
234 Rural Development Statistics
Table 5.18: State / UT-wise Percentages of Establishments and Persons Employed (Excluding Crop Production, Plantation, Public Administration, Defense and Compulsory
Social Security Services Activities) – Rural
S.No. States/UTsEstablishments Persons Employed
Rural Rural1. Andhra Pradesh 73.82 68.362. Arunachal Pradesh 52.70 49.503. Assam 72.23 69.714. Bihar 70.60 66.575. Chhattisgarh 66.26 60.366. Goa 33.30 29.007. Gujarat 59.57 53.588. Haryana 55.35 44.939. Himachal Pradesh 80.87 75.87
10. Jammu & Kashmir 59.96 54.8911. Jharkhand 54.58 48.2812 Karnataka 58.29 48.4213 Kerala 53.79 47.3914. Madhya Pradesh 52.08 47.2115. Maharashtra 57.28 45.9516. Manipur 62.94 62.5117. Meghalaya 68.53 65.3118. Mizoram 35.28 33.4519. Nagaland 54.75 53.2920. Odisha 76.55 72.7321. Punjab 54.14 47.6822. Rajasthan 64.97 60.1023. Sikkim 57.13 55.6824. Tamil Nadu 52.95 44.9725. Telangana 56.28 41.9226. Tripura 60.81 57.4627. Uttar Pradesh 62.09 56.3128. Uttarakhand 58.49 51.8529. West Bengal 60.41 51.66
Union Territories30. A & N Islands 63.05 55.0031. Chandigarh 2.67 1.6532. D & N Haveli 29.45 39.4733. Daman & Diu 19.90 18.3434. Delhi 1.42 0.9335. Lakshadweep 10.84 8.5336. Puducherry 29.45 30.34
All-India 59.90 51.91
Source : CSO, MOSPI, GoI, Provisional Results of Sixth Economic Census, All-India Report, July 2014.

Rural Industries 235
Table 5.19: Number of Handicraft & Handloom Establishments and Their Percentage Distribution (Exclusive Crop Production, Plantation, Public Administration, Defense &
Compulsory Social Security Services Activities)
S.No. States/UTsRural
Number % Distribution1. Andhra Pradesh 100403 7.762. Arunachal Pradesh 168 0.013. Assam 73132 5.654. Bihar 44106 3.415. Chhattisgarh 17572 1.366. Goa 667 0.057. Gujarat 25520 1.978. Haryana 15350 1.199. Himachal Pradesh 11742 0.91
10. Jammu & Kashmir 46054 3.5611. Jharkhand 15043 1.1612 Karnataka 39371 3.0413 Kerala 16074 1.2414. Madhya Pradesh 30543 2.3615. Maharashtra 58984 4.5616. Manipur 38915 3.0117. Meghalaya 3255 0.2518. Mizoram 667 0.0519. Nagaland 4495 0.3520. Odisha 136791 10.5721. Punjab 9074 0.7022. Rajasthan 95519 7.3823. Sikkim 711 0.0524. Tamil Nadu 63349 4.9025. Telangana 28941 2.2426. Tripura 6443 0.5027. Uttar Pradesh 173622 13.4228. Uttarakhand 6625 0.5129. West Bengal 230098 17.79
Union Territories30. A & N Islands 105 0.0131. Chandigarh 26 0.0032. D & N Haveli 16 0.0033. Daman & Diu 13 0.0034. Delhi 266 0.0235. Lakshadweep 1 0.0036. Puducherry 95 0.01
All-India 1293756 100.00
Source : CSO, MOSPI, GoI, Provisional Results of Sixth Economic Census, All-India Report, July 2014.
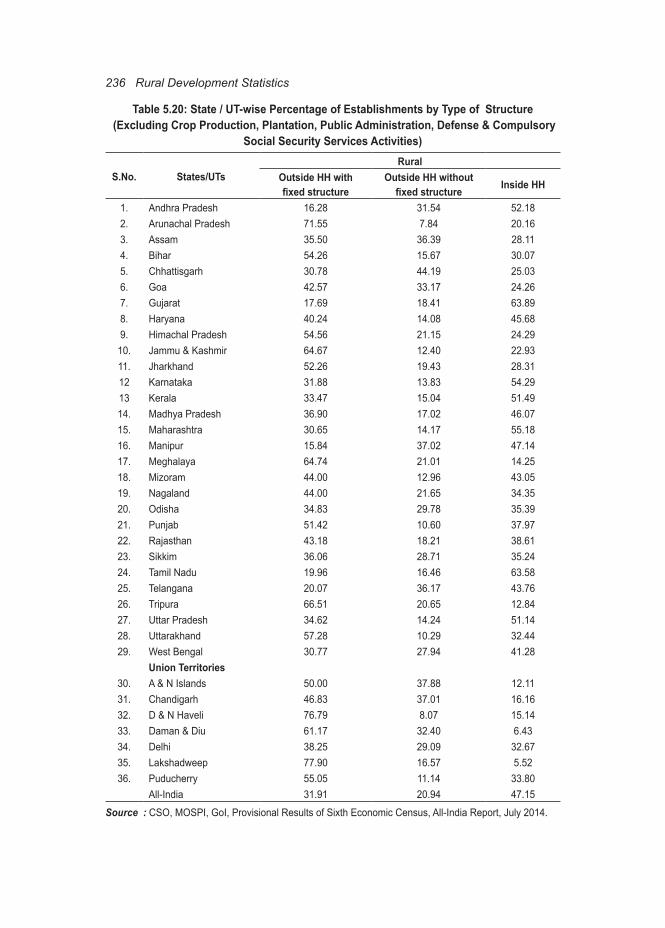
236 Rural Development Statistics
Table 5.20: State / UT-wise Percentage of Establishments by Type of Structure (Excluding Crop Production, Plantation, Public Administration, Defense & Compulsory
Social Security Services Activities)
S.No. States/UTsRural
Outside HH with fixed structure
Outside HH without fixed structure Inside HH
1. Andhra Pradesh 16.28 31.54 52.182. Arunachal Pradesh 71.55 7.84 20.163. Assam 35.50 36.39 28.114. Bihar 54.26 15.67 30.075. Chhattisgarh 30.78 44.19 25.036. Goa 42.57 33.17 24.267. Gujarat 17.69 18.41 63.898. Haryana 40.24 14.08 45.689. Himachal Pradesh 54.56 21.15 24.29
10. Jammu & Kashmir 64.67 12.40 22.9311. Jharkhand 52.26 19.43 28.3112 Karnataka 31.88 13.83 54.2913 Kerala 33.47 15.04 51.4914. Madhya Pradesh 36.90 17.02 46.0715. Maharashtra 30.65 14.17 55.1816. Manipur 15.84 37.02 47.1417. Meghalaya 64.74 21.01 14.2518. Mizoram 44.00 12.96 43.0519. Nagaland 44.00 21.65 34.3520. Odisha 34.83 29.78 35.3921. Punjab 51.42 10.60 37.9722. Rajasthan 43.18 18.21 38.6123. Sikkim 36.06 28.71 35.2424. Tamil Nadu 19.96 16.46 63.5825. Telangana 20.07 36.17 43.7626. Tripura 66.51 20.65 12.8427. Uttar Pradesh 34.62 14.24 51.1428. Uttarakhand 57.28 10.29 32.4429. West Bengal 30.77 27.94 41.28
Union Territories30. A & N Islands 50.00 37.88 12.1131. Chandigarh 46.83 37.01 16.1632. D & N Haveli 76.79 8.07 15.1433. Daman & Diu 61.17 32.40 6.4334. Delhi 38.25 29.09 32.6735. Lakshadweep 77.90 16.57 5.5236. Puducherry 55.05 11.14 33.80
All-India 31.91 20.94 47.15
Source : CSO, MOSPI, GoI, Provisional Results of Sixth Economic Census, All-India Report, July 2014.
Rural Industries 237
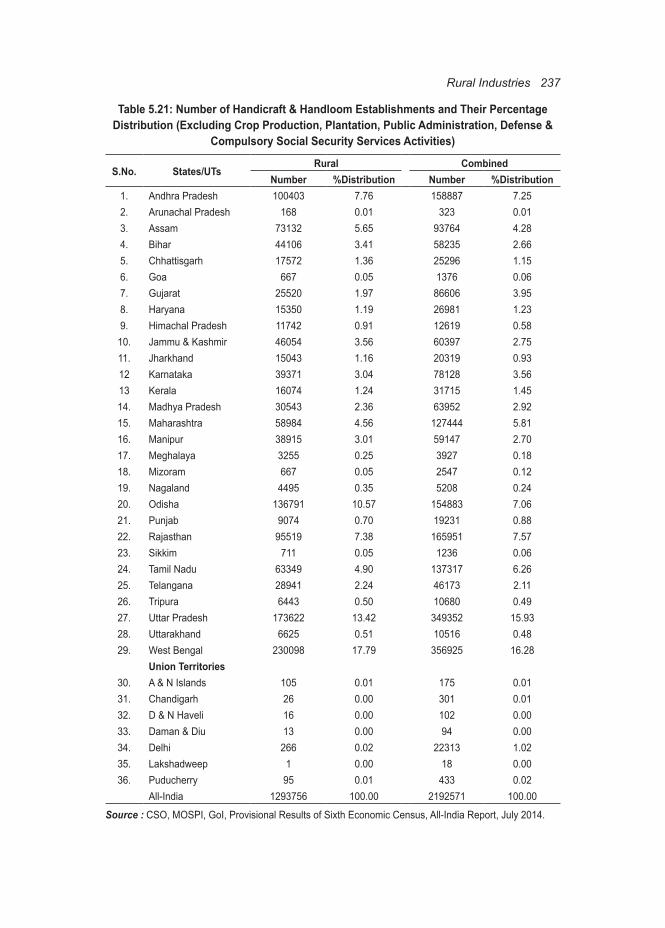
Table 5.21: Number of Handicraft & Handloom Establishments and Their Percentage Distribution (Excluding Crop Production, Plantation, Public Administration, Defense &
Compulsory Social Security Services Activities)
S.No. States/UTsRural Combined
Number %Distribution Number %Distribution1. Andhra Pradesh 100403 7.76 158887 7.252. Arunachal Pradesh 168 0.01 323 0.013. Assam 73132 5.65 93764 4.284. Bihar 44106 3.41 58235 2.665. Chhattisgarh 17572 1.36 25296 1.156. Goa 667 0.05 1376 0.067. Gujarat 25520 1.97 86606 3.958. Haryana 15350 1.19 26981 1.239. Himachal Pradesh 11742 0.91 12619 0.58
10. Jammu & Kashmir 46054 3.56 60397 2.7511. Jharkhand 15043 1.16 20319 0.9312 Karnataka 39371 3.04 78128 3.5613 Kerala 16074 1.24 31715 1.4514. Madhya Pradesh 30543 2.36 63952 2.9215. Maharashtra 58984 4.56 127444 5.8116. Manipur 38915 3.01 59147 2.7017. Meghalaya 3255 0.25 3927 0.1818. Mizoram 667 0.05 2547 0.1219. Nagaland 4495 0.35 5208 0.2420. Odisha 136791 10.57 154883 7.0621. Punjab 9074 0.70 19231 0.8822. Rajasthan 95519 7.38 165951 7.5723. Sikkim 711 0.05 1236 0.0624. Tamil Nadu 63349 4.90 137317 6.2625. Telangana 28941 2.24 46173 2.1126. Tripura 6443 0.50 10680 0.4927. Uttar Pradesh 173622 13.42 349352 15.9328. Uttarakhand 6625 0.51 10516 0.4829. West Bengal 230098 17.79 356925 16.28
Union Territories30. A & N Islands 105 0.01 175 0.0131. Chandigarh 26 0.00 301 0.0132. D & N Haveli 16 0.00 102 0.0033. Daman & Diu 13 0.00 94 0.0034. Delhi 266 0.02 22313 1.0235. Lakshadweep 1 0.00 18 0.0036. Puducherry 95 0.01 433 0.02
All-India 1293756 100.00 2192571 100.00
Source : CSO, MOSPI, GoI, Provisional Results of Sixth Economic Census, All-India Report, July 2014.

238 Rural Development Statistics
Table 5.22: Percentage Growth in Total Number of Establishments (Excluding Crop Production, Plantation, Public Administration, Defense & Compulsory Social Security
Services Activities) and Employment in 2013 (Sixth EC) as Compared to 2005 (Fifth EC)
S.No. States/UTsGrowth in Establishments (%) Growth in Employment (%)
Rural Combined Rural Combined1. Andhra Pradesh 52.12 53.27 24.46 27.462. Arunachal Pradesh 8.08 34.09 -9.65 17.733. Assam 108.36 100.17 85.55 78.844. Bihar 46.48 41.66 44.89 39.155. Chhattisgarh 20.13 24.19 25.02 33.426. Goa -11.06 34.05 -16.90 38.957. Gujarat 77.58 67.07 73.54 56.478. Haryana 43.67 42.34 34.11 53.449. Himachal Pradesh 61.74 60.98 75.51 68.81
10. Jammu & Kashmir 70.25 59.87 73.31 66.4011. Jharkhand 20.12 32.38 19.27 35.0612 Karnataka 6.90 14.97 0.95 15.2413 Kerala -13.02 21.33 -13.25 26.4914. Madhya Pradesh 22.53 23.63 18.89 17.9215. Maharashtra 70.34 47.52 55.95 36.5416. Manipur 139.54 109.37 107.93 83.2917. Meghalaya 35.07 31.34 48.46 41.1118. Mizoram 8.72 16.58 27.89 37.1119. Nagaland 75.56 78.74 28.08 30.3420. Odisha 11.63 15.43 22.53 26.3921. Punjab 65.46 42.47 64.32 40.6922. Rajasthan 59.23 51.20 64.31 53.5523. Sikkim 63.65 102.92 43.36 77.1424. Tamil Nadu 0.32 16.11 -4.83 13.2225. Telangana 58.12 78.70 19.68 37.3726. Tripura 6.48 28.28 -2.07 21.6727. Uttar Pradesh 90.06 67.80 92.46 75.2628. Uttarakhand 20.67 26.08 47.20 57.1029. West Bengal 29.44 41.26 10.11 20.35
Union Territories30. A & N Islands 73.57 84.89 69.48 75.0831. Chandigarh -70.77 31.14 -68.67 26.9732. D & N Haveli -40.72 28.11 -19.30 47.7933. Daman & Diu -65.95 5.26 -70.56 35.8134. Delhi -51.90 18.35 -59.57 -12.2235. Lakshadweep -80.16 14.03 -83.57 16.2736. Puducherry 6.44 22.36 11.15 28.08
All-India 39.28 41.73 31.59 34.35
Source : CSO, MOSPI, GoI, Provisional Results of Sixth Economic Census, All-India Report, July 2014.
Related Documents