Section 13.2-1 Copyright © 2014, 2012, 2010 Pearson Education, Inc. Lecture Slides Elementary Statistics Twelfth Edition and the Triola Statistics Series by Mario F. Triola

Welcome message from author
This document is posted to help you gain knowledge. Please leave a comment to let me know what you think about it! Share it to your friends and learn new things together.
Transcript

Section 13.2-1Copyright © 2014, 2012, 2010 Pearson Education, Inc.
Lecture Slides
Elementary Statistics Twelfth Edition
and the Triola Statistics Series
by Mario F. Triola

Section 13.2-2Copyright © 2014, 2012, 2010 Pearson Education, Inc.
Chapter 13Nonparametric Statistics
13-1 Review and Preview
13-2 Sign Test
13-3 Wilcoxon Signed-Ranks Test for Matched Pairs
13-4 Wilcoxon Rank-Sum Test for Two Independent Samples
13-5 Kruskal-Wallis Test
13-6 Rank Correction
13-7 Runs Test for Randomness

Section 13.2-3Copyright © 2014, 2012, 2010 Pearson Education, Inc.
Key Concept
The main objective of this section is to understand the sign test procedure, which involves converting data values to plus and minus signs, then testing for disproportionately more of either sign.

Section 13.2-4Copyright © 2014, 2012, 2010 Pearson Education, Inc.
Definition
The sign test is a nonparametric (distribution-free) test that uses plus and minus signs to test different claims, including:
1. Claims involving matched pairs of sample data
2. Claims involving nominal data
3. Claims about the median of a single population

Section 13.2-5Copyright © 2014, 2012, 2010 Pearson Education, Inc.
Basic Concept of the Sign Test
The basic idea underlying the sign test is to analyze the frequencies of the plus and minus signs to determine whether they are significantly different.
For consistency, we will use a test statistic based on the number of time the less frequent sign occurs.

Section 13.2-6Copyright © 2014, 2012, 2010 Pearson Education, Inc.
Requirements
The sample data have been randomly selected.
Note: There is no requirement that the sample data come from a population with a particular distribution, such as a normal distribution.

Section 13.2-7Copyright © 2014, 2012, 2010 Pearson Education, Inc.
Notation for Sign Test
x = the number of times the less frequent sign occurs
n = the total number of positive and negative signs combined

Section 13.2-8Copyright © 2014, 2012, 2010 Pearson Education, Inc.
Test Statistic
For n ≤ 25: Test statistic is x = the number of times the less frequent sign occurs
For n > 25: Test statistic is
( 0.5)2
2
nx
zn
+ −=

Section 13.2-9Copyright © 2014, 2012, 2010 Pearson Education, Inc.
P-Values and Critical Values
P-Values: P-values are often provided by technology, or can be often found using the z test statistic.
Critical Values:
For n ≤ 25, critical x values are in Table A-7.
For n > 25, critical z values are in Table A-2.

Section 13.2-10Copyright © 2014, 2012, 2010 Pearson Education, Inc.
Caution
When applying the sign test in a one-tailed test, we need to be very careful to avoid making the wrong conclusion when one sign occurs significantly more often than the other, but the sample data contradict the alternative hypothesis. See the following example.
Section 13.2-11Copyright © 2014, 2012, 2010 Pearson Education, Inc.
Example
Among 945 couples who used the XSORT method of gender selection, 66 had boys, so the sample proportion of boys is 66 / 945 or 0.0698.
Consider the claim that the XSORT method increases the likelihood of baby boys so that the probability of a boy is p > 0.5. This claim becomes the alternative hypothesis.
Using common sense, we see that with a sample proportion of boys of 0.0698, we can never support a claim that p > 0.5.
The sample proportion contradicts the alternative hypothesis because it is not greater than 0.5.

Section 13.2-12Copyright © 2014, 2012, 2010 Pearson Education, Inc.
Example - Continued
We must be careful to avoid making the fundamental mistake of thinking that a claim is supported because the sample results are significant.
The sample results must be significant in the same direction as the alternative hypothesis.

Section 13.2-13Copyright © 2014, 2012, 2010 Pearson Education, Inc.
Sign Test Procedure

Section 13.2-14Copyright © 2014, 2012, 2010 Pearson Education, Inc.
Sign Test Procedure

Section 13.2-15Copyright © 2014, 2012, 2010 Pearson Education, Inc.
Sign Test Procedure

Section 13.2-16Copyright © 2014, 2012, 2010 Pearson Education, Inc.
Claims Involving Matched Pairs
When using the sign test with data that are matched pairs, we convert the raw data to plus and minus signs as follows:
1.Subtract each value of the second variable from the corresponding value of the first variable.
2.Record only the sign of the difference found in step 1.
Exclude ties: that is, any matched pairs in which both values are equal.

Section 13.2-17Copyright © 2014, 2012, 2010 Pearson Education, Inc.
Key Concept Underlying This Use of the Sign Test
If the two sets of data have equal medians, the number of positive signs should be approximately equal to the number of negative signs.

Section 13.2-18Copyright © 2014, 2012, 2010 Pearson Education, Inc.
ExampleTable 13-3 includes taxi-out times and taxi-in times for a sample of American Airlines Flight 21.
Use the sign test to test the claim that there is no difference between taxi-out and taxi-in times. Use a 0.05 significance level.

Section 13.2-19Copyright © 2014, 2012, 2010 Pearson Education, Inc.
Example - ContinuedRequirement Check: We only need the sample data to be a simple random sample, and that requirement is satisfied.
We have 8 positive signs, 3 negative signs, and 1 difference of 0.
The sign test tells us whether or not the numbers of positive and negative signs are approximately equal.
Section 13.2-20Copyright © 2014, 2012, 2010 Pearson Education, Inc.
Example - Continued
The hypotheses are:
We let n = 11 and x = 3. We should proceed to find the critical value from Table A-7.
In Table A-7, the critical value of 1 is found for n = 11 and α = 0.05 in two tails.
0
1
: There is no difference. (The median of the differences is equal to 0.)
: There is a difference. (The median of the differences is not equal to 0.)
H
H
Section 13.2-21Copyright © 2014, 2012, 2010 Pearson Education, Inc.
Example - Continued
Since n ≤ 25, the test statistic is x = 3, and with a critical value of 1, we fail to reject the null hypothesis of no difference.
We conclude that there is not sufficient evidence to warrant rejection of the claim of no difference between taxi-out times and taxi-in times.
There does not appear to be a difference.

Section 13.2-22Copyright © 2014, 2012, 2010 Pearson Education, Inc.
Claims Involving Nominal Data
The nature of nominal data limits the calculations that are possible, but we can identify the proportion of the sample data that belong to a particular category.
Then we can test claims about the corresponding population proportion p.

Section 13.2-23Copyright © 2014, 2012, 2010 Pearson Education, Inc.
Example
As of this writing, 879 of 945 babies born to parents using the XSORT method of gender selection were girls.
Use the sign test and a 0.05 level of significance to test the claim that this method of gender selection is effective in increasing the likelihood of a baby girl.

Section 13.2-24Copyright © 2014, 2012, 2010 Pearson Education, Inc.
Example - Continued
Requirement Check: The only requirement is that the sample be a simple random sample, and based on the design of the experiment, we can assume so.
Let p denote the population proportion of baby girls.
The claim is that the XSORT method increases the likelihood of having a girl, so the hypotheses are:
0
1
: 0.5
: 0.5
H p
H p
=>

Section 13.2-25Copyright © 2014, 2012, 2010 Pearson Education, Inc.
Example - Continued
Denoting girls by (+) and boys by (), we have 879 positive signs and 66 negative signs.
The test statistic is
( 0.5)2
2945
(66 0.5)2 26.41
9452
nx
zn
⎛ ⎞+ −⎜ ⎟⎝ ⎠=
⎛ ⎞+ −⎜ ⎟⎝ ⎠= =−
Section 13.2-26Copyright © 2014, 2012, 2010 Pearson Education, Inc.
Example - Continued
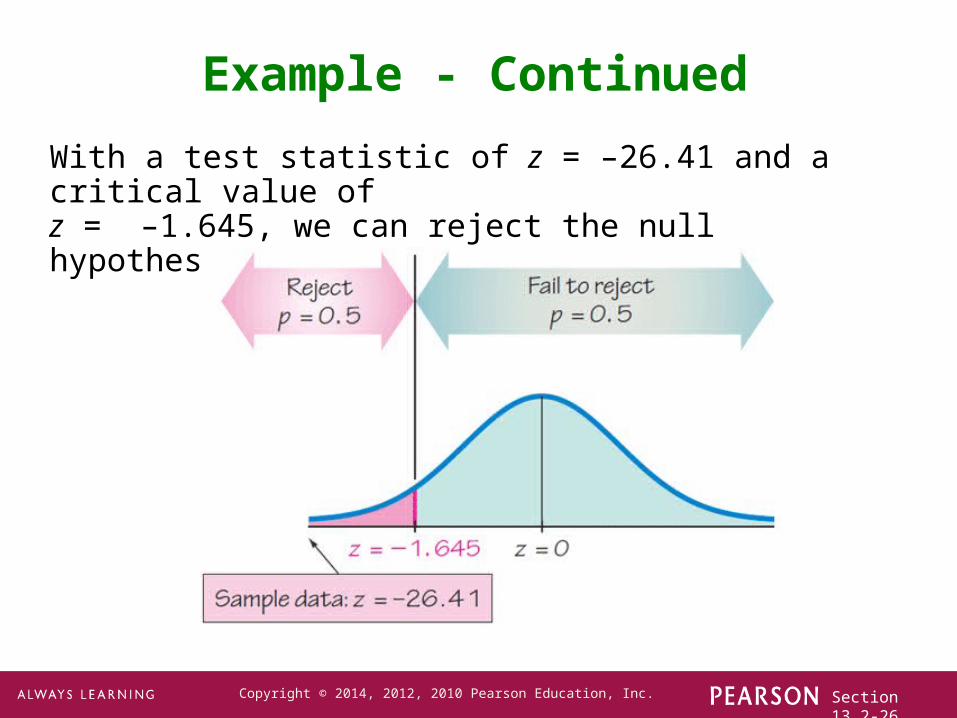
With a test statistic of z = –26.41 and a critical value of z = –1.645, we can reject the null hypothesis.

Section 13.2-27Copyright © 2014, 2012, 2010 Pearson Education, Inc.
Example - Continued
The XSORT method of gender selection does appear to be associated with an increase in the likelihood of a girl.

Section 13.2-28Copyright © 2014, 2012, 2010 Pearson Education, Inc.
Claims About the Median of a Single Population
The negative and positive signs are based on the claimed value of the median. See the next example.

Section 13.2-29Copyright © 2014, 2012, 2010 Pearson Education, Inc.
Example
Data Set 3 in Appendix B includes measured body temperatures of adults.
Use the 106 temperatures listed for 12 A.M. on Day 2 with the sign test to test the claim that the median is less than 98.6ºF.
Of the 106 subjects, 68 had temperatures below 98.6ºF, 23 had temperatures above 98.6ºF, and 15 had temperatures equal to 98.6ºF.
Section 13.2-30Copyright © 2014, 2012, 2010 Pearson Education, Inc.
Example - Continued
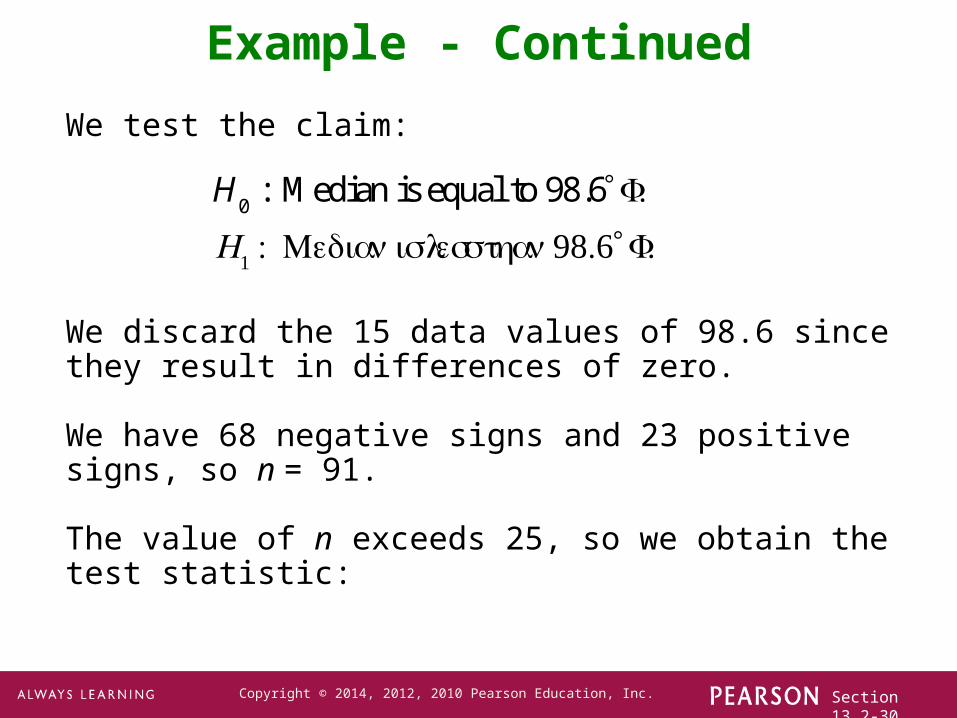
We test the claim:
We discard the 15 data values of 98.6 since they result in differences of zero.
We have 68 negative signs and 23 positive signs, so n = 91.
The value of n exceeds 25, so we obtain the test statistic:
H0
: Median is equal to 98.6°F.
H1 : Median is less than 98.6°F.

Section 13.2-31Copyright © 2014, 2012, 2010 Pearson Education, Inc.
Example - Continued
( 0.5)2
291
(23 0.5)2 4.61
912
nx
zn
⎛ ⎞+ −⎜ ⎟⎝ ⎠=
⎛ ⎞+ −⎜ ⎟⎝ ⎠= =−

Section 13.2-32Copyright © 2014, 2012, 2010 Pearson Education, Inc.
Example - Continued
In this one-tailed test with α = 0.05, we can reject the null hypothesis:
There is sufficient evidence to support the claim that the median body temperature of healthy adults is less than 98.6ºF.
Related Documents