Section 10: Nutrients and their functions • Major nutrients: protein, carbohydrate and fat 01/13/06

Section 10: Nutrients and their functions Major nutrients: protein, carbohydrate and fat 01/13/06.
Dec 24, 2015
Welcome message from author
This document is posted to help you gain knowledge. Please leave a comment to let me know what you think about it! Share it to your friends and learn new things together.
Transcript

Section 10: Nutrients and their functions
Section 10: Nutrients and their functions
• Major nutrients: protein, carbohydrate and fat
• Major nutrients: protein, carbohydrate and fat
01/13/06

Major Nutrients - Overview
• The major nutrients (boxed) provide energy and precursors for the synthesis and maintenance of cell constituents and function.
PROTEINS
CARBOHYDRATES
FATS
amino acids
proteins
monosaccharides glucose glycogen
Krebs cycleintermediates
acetyl CoA
ATP
ATP
fatty acids
fats
acetyl CoA
1

Energy from Oxidation
carbohydrate fat proteinmetabolic value (kcal/gm) 4 9 4bomb calorimeter value 4.1 9.4 5.6
Respiratory Quotient 1.0 0.7 (0.8)
RQ = (volume CO2 given off)/(volume O2 taken up)
Carbohydrate: CHOH + O2 = CO2 + H2O, so RQ = 1.0
Fat: CH2 + 3/2 O2 = CO2 + H2O, so RQ ~ 0.7
Protein: Carbon oxidation level varies, and nitrogen end-products not all volatile.
2
Protein Metabolism
• Review Section 8 for more details.
FOOD
tissue proteinother nitrogenouscompounds
amino acid pool
biosynthesis excretion
ATPoxidation
3
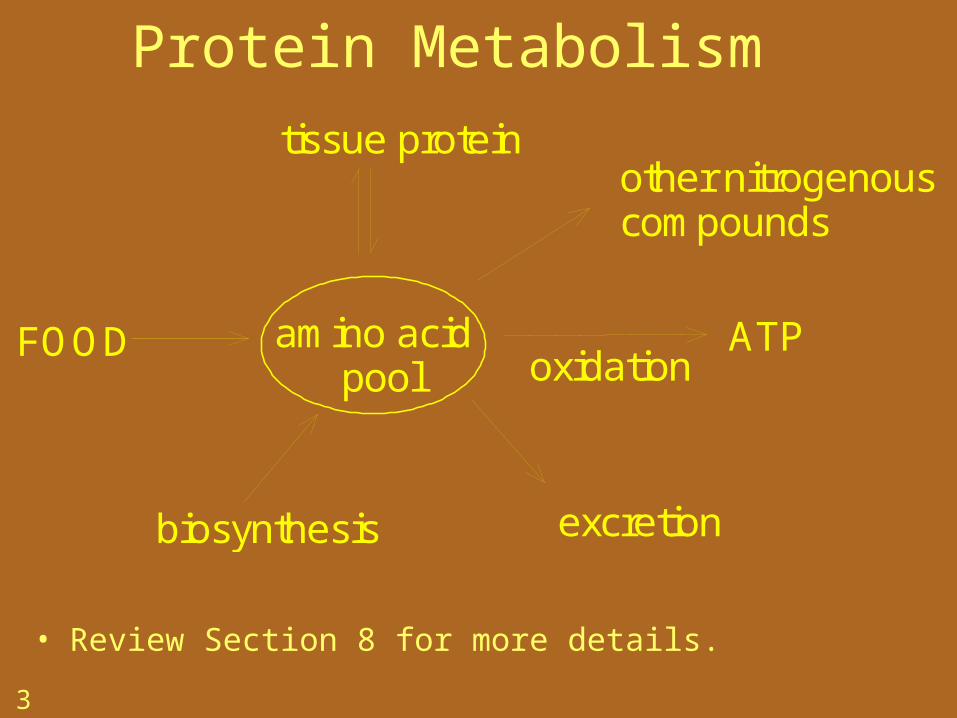
Protein Synthesis / Amino Acid Pool• When dietary protein lacks
an essential amino acid, tissue protein is degraded to provide it for the amino acid pool used for protein synthesis.
• When an amino acid is missing from the amino acid pool, its aa-t-RNA cannot synthesized, and the ribosome cannot continue past its codon on a m-RNA.
• The protein fragment eventually is freed and degraded.
mRNA
codon for missing aminoacid
ribosome
partially synthesizedprotein attached tot-RNA bound toribosome
4
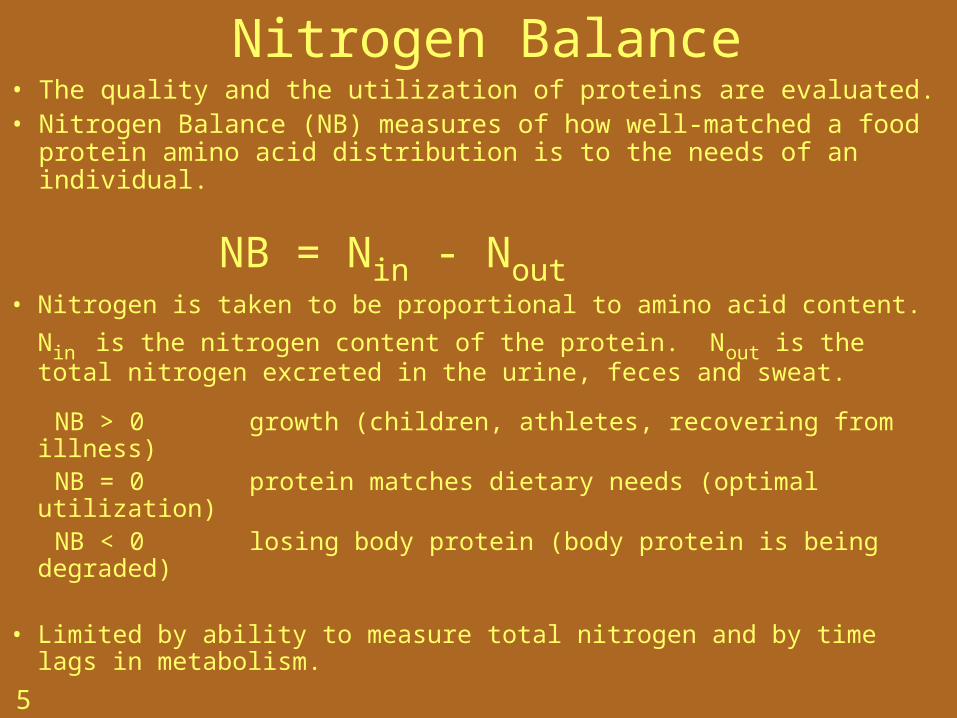
Nitrogen Balance• The quality and the utilization of proteins are evaluated.• Nitrogen Balance (NB) measures of how well-matched a food
protein amino acid distribution is to the needs of an individual.
• Nitrogen is taken to be proportional to amino acid content. Nin is the nitrogen content of the protein. Nout is the total nitrogen excreted in the urine, feces and sweat.
NB > 0 growth (children, athletes, recovering from illness) NB = 0 protein matches dietary needs (optimal utilization) NB < 0 losing body protein (body protein is being degraded)
• Limited by ability to measure total nitrogen and by time lags in metabolism.
NB = Nin - Nout
5
Biological Value
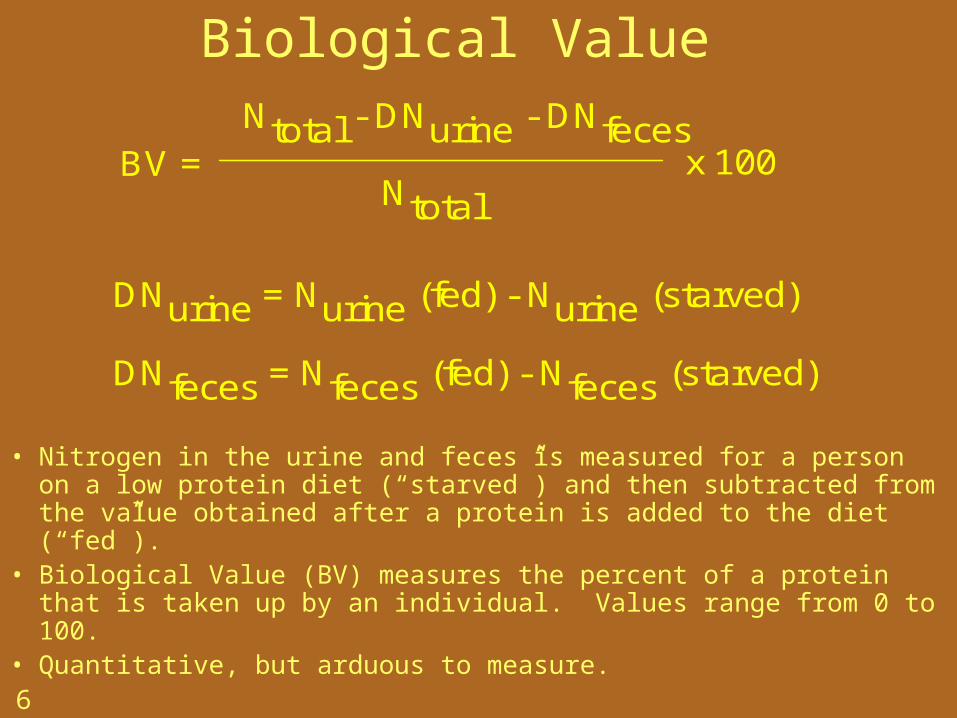
• Nitrogen in the urine and feces is measured for a person on a low protein diet (“starved”) and then subtracted from the value obtained after a protein is added to the diet (“fed”).
• Biological Value (BV) measures the percent of a protein that is taken up by an individual. Values range from 0 to 100.
• Quantitative, but arduous to measure.
BV = Ntotal - DNurine - DNfeces
Ntotal
DNurine = Nurine (fed) - Nurine (starved)
DNfeces = Nfeces (fed) - Nfeces (starved)
x 100
6
Chemical Score
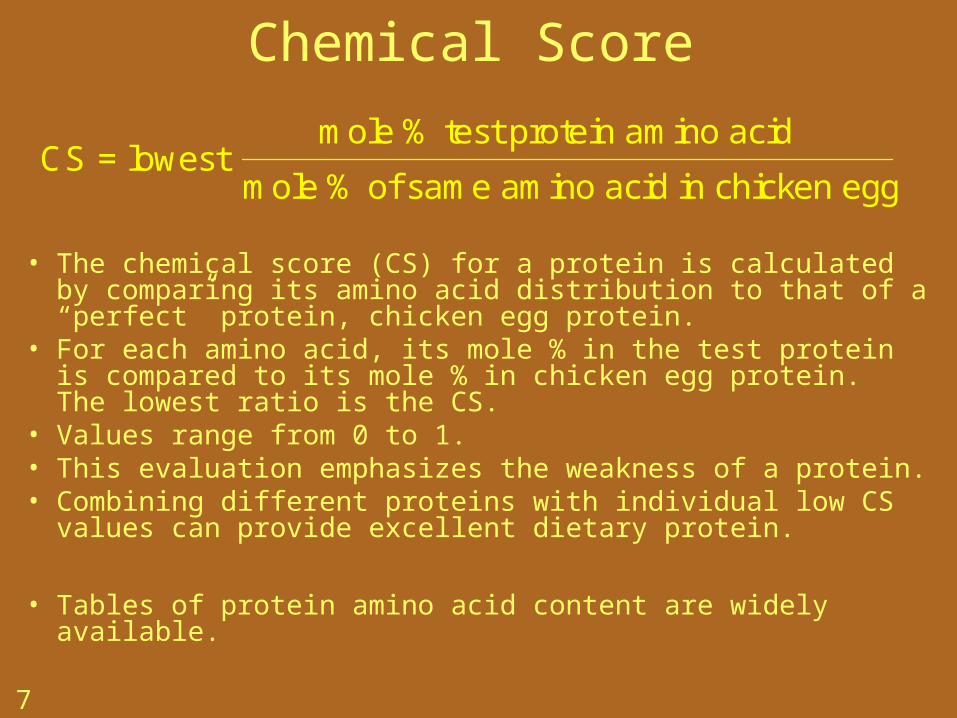
• The chemical score (CS) for a protein is calculated by comparing its amino acid distribution to that of a “perfect” protein, chicken egg protein.
• For each amino acid, its mole % in the test protein is compared to its mole % in chicken egg protein. The lowest ratio is the CS.
• Values range from 0 to 1.• This evaluation emphasizes the weakness of a protein.• Combining different proteins with individual low CS values
can provide excellent dietary protein.
• Tables of protein amino acid content are widely available.
CS = lowest mole % test protein amino acid
mole % of same amino acid in chicken egg
7

Protein Evaluations
• Food Chemical Score Biological Value• Human milk 1.0 93• Hen egg 1.0 100• Animal protein - 80-100• Soy bean 0.74 -• Beans - 60-80• Corn 0.49 72• Rice 0.67 86• Cereals 0.50 50-70
8

Monosaccharides
• These are the most common monosaccharides.
• They are in many vegetables, and especially in fruits.
• Fructose is the primary sugar in honey.
• Most monosaccharides can be converted to glucose by humans.
• High-fructose corn syrup is about 50% fructose and 50% glucose.
D-glucose-D-glucopyranose -D-glucopyranose
(open chain)
O
CH2
OH
OHOH
OH
OH
H
H
H H
H O
CH2
OH
OHOH
OH
OH
H
H
H H
H
HO
OH
OH
OH
OH
CH2 OH
H
H
H
H
O
CH2
OH
OH
OH
OH
OH
H
HH
H
H
D-galactose
O
CH2
OH
OH
OH
OH
OH
H
HH
H
H
HO
OH
OH
OH
OH
CH2 OH
H
H
H
H
(open chain)
D-galactoseD-galactose
D-fructofuranoseD-fructose
O H
H
HCH2
OH
CH2
OH
OH
OHOH
CH2
O
OH
OH
OH
CH2 OH
H
H
H
OH
9

Disaccharides
• Sucrose is found in many plants, and is present at high concentrations in some (beets, sugar cane).
• Lactose is the major carbohydrate found in milk. Many adults lack the enzyme lactase and are lactose intolerant.
• Maltose is a product of the breakdown of glycogen, amylose and amylopectin.
lactose(galactose-(1-4)-glucose)
sucrose(glucose-(1, 2)-fructose)
OH
O
CH2
O
OH
OH
OH
H
H
H H
H O
CH2
OH
OH
OH
OH
H
H
H H
H
O
CH2
O
OH
OH
OH
OH
H
HH
H
H
O
CH2
OH
OH
OH
OH
H
H
H H
H
maltose(glucose-(1-4)-glucose)
O
CH2
O
OHOH
OH
OH
H
H
H H
H O H
H
HCH2
OH
CH2
OH
OH
OH
10

Polysaccharides
• Polymers of glucose are used by plants and animals to store energy.• Starch contains amylose, only (1-4) linkages, and amylopectin,
which also has (1-6) linkages (~equivalent to glycogen in animals).
amylose(unbranched (1-4) linked polymer of glucose)
O
CH2
O
OH
OH
OH
H
H
H H
H O
CH2
O
OH
OH
OH
H
H
H H
H
O
O
CH2
O
OH
OH
OH
H
H
H H
H O
CH2
O
OH
OH
OH
H
H
H H
H
etc. (-
-) etc.
11
amylopectin((1-4) linked polymer of glucose with (1-6)
etc. (-
-) etc.
etc. (- O
O
CH2
O
OH
OH
OH
H
H
H H
H O
CH2
OOH
OH
OH
H
H
H H
H
O
CH2
O
OH
OH H
H
H H
H O
CH2
O
OH
OH
OH
H
H
H H
H
O
O
CH2
O
OH
OH
OH
H
H
H H
H O
CH2
O
OH
OH
OH
H
H
H H
H
(1-6)
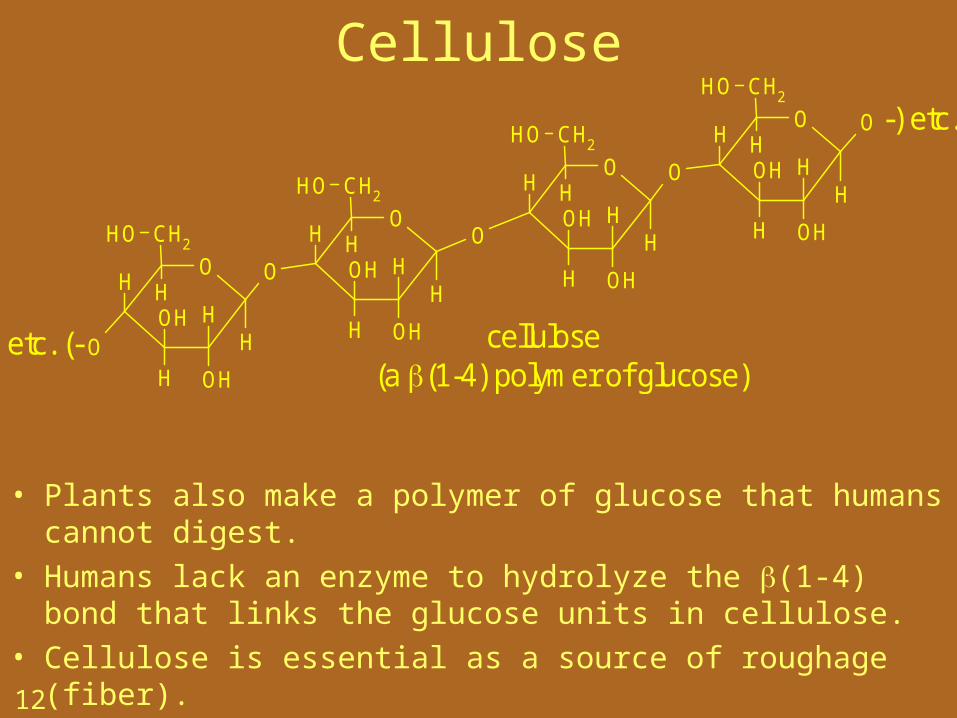
Cellulose
• Plants also make a polymer of glucose that humans cannot digest.
• Humans lack an enzyme to hydrolyze the (1-4) bond that links the glucose units in cellulose.
• Cellulose is essential as a source of roughage (fiber).
etc. (-
-) etc.
cellulose(a (1-4) polymer of glucose)
O
CH2
O
OH
OOH
OH
H
H
H H
H
O
CH2
O
OH
OH
OH
H
H
H H
H
O
CH2
O
OH
OH
OH
H
H
H H
H
O
CH2
O
OH
OH
OH
H
H
H H
H
12
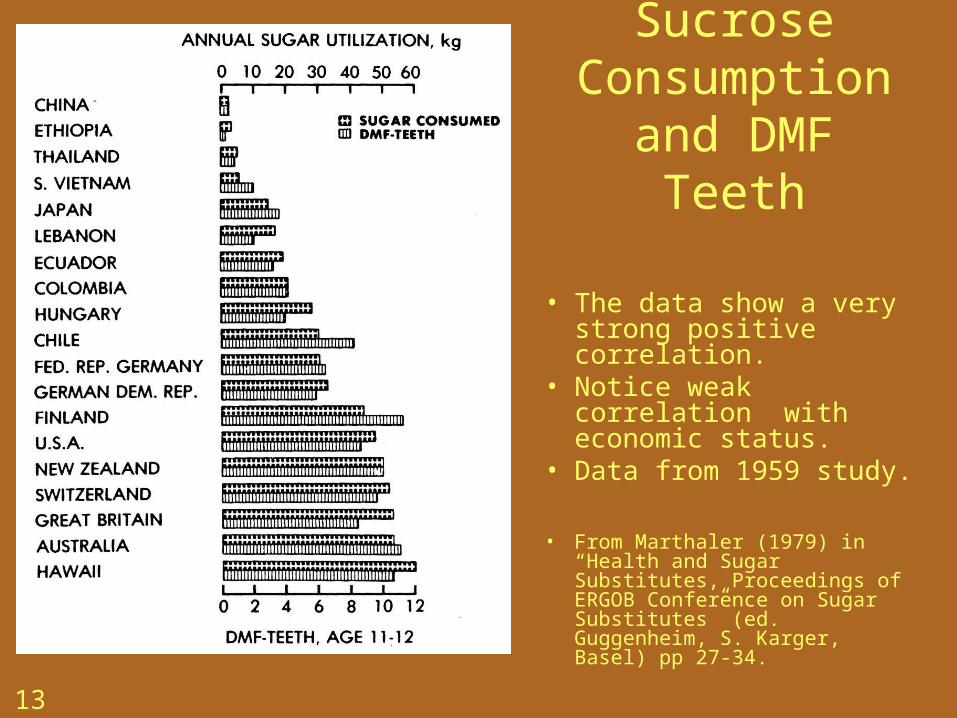
Sucrose Consumption
and DMF Teeth
• The data show a very strong positive correlation.
• Notice weak correlation with economic status.
• Data from 1959 study.
• From Marthaler (1979) in “Health and Sugar Substitutes, Proceedings of ERGOB Conference on Sugar Substitutes” (ed. Guggenheim, S. Karger, Basel) pp 27-34.
13

Glycemic Index (GI) and Glycemic Load (GL)Glycemic Index (GI) and Glycemic Load (GL)
• GI values rank the blood glucose effects of foods. Larger and/or faster increases in blood glucose, indicated by higher GI values, stress the ability of the pancreas to supply adequate insulin and induce subsequent sharp declines in blood glucose.
• A test food containing 50 g of carbohydrate is administered and the increase in blood glucose is measured over several hours time. The area under the curve is determined.
• GI is the area under the curve for the test food divided by the area for 50 g of pure glucose and multiplied by 100. Potato and brown rice have GI’s of 85 and 55. respectively. GI values vary with individual.
• Bread may be used as the standard, which changes the GI value (now potato has a GI of 121).
• GL (glycemic load) is GI x grams of carbohydrate in a serving of the food (which is not precisely defined), divided by 100.
• Here is a calculator web site (be skeptical, there are GI >100)• Also see Foster-Powell K, Holt SH, Brand-Miller JC. International table
of glycemic index and glycemic load values. (2002) Am J Clin Nutr. 76:5-56.
14

Triacylglycerols
• Fats are a rich source of calories.• They currently make up too high a fraction of the total calories
in the typical diet in the United States.
• Fatty acids with double bond at or beyond the 9-position are required in the diet for the synthesis of eicosanoid hormones.
O
O
O C CH2 CH2 CH2 CH2 CH2 CH2CH2 CH2 CH2 CH2
CH2 CH2 CH2 CH3
O
C CH2 CH2 CH2 CH2 CH2 CH2CH2 CH CH CH2
CH2 CH2 CH2 CH3
O
C CH2 CH2 CH2 CH2 CH2 CH2CH2 CH2 CH2 CH2
CH2 CH2 CH2 CH3
O
15

Fats and Oils Cholesterol Saturated
Unsaturated
(mg per tbs) Fat Fat
Canola 0 6% 94%
Safflower 0 9 91
Sunflower 0 11 89
Corn 0 13 87
Olive 0 14 86
Soybean 0 15 85
Peanut 0 18 82
Cottonseed 0 27 73
Lard 12 41 59
Beef Tallow 14 52 48
Palm Kernel 0 81 19
Coconut 0 92 816

Trans fatsTrans fats
• “Trans fats” are created during industrial hydrogenation of fats to increase their melting point (eg. vegetable oil to margarine).
• The [intermediate] is not completely hydrogenated; some returns to cis-isomer, but some converts to trans configuration before double bond reforms.
• “Trans fats” are created during industrial hydrogenation of fats to increase their melting point (eg. vegetable oil to margarine).
• The [intermediate] is not completely hydrogenated; some returns to cis-isomer, but some converts to trans configuration before double bond reforms.17
[ ]
[ ]
cis
trans
saturated
H2H H
H
H
H
H H
H
H H
H
H

Interesterification of fatsInteresterification of fats
TAG has a fatty acid replaced to produce a more beneficial or valuable fat or oil.
TAG has a fatty acid replaced to produce a more beneficial or valuable fat or oil.
+
+
lipase
O
O
O C CH2 CH2 CH2 CH CH CH CH CH CH CH CH CH2 CH2 CH3
O
C CH2 CH2 CH2 CH2 CH2 CH2CH2 CH CH CH2
CH2 CH2 CH2 CH3
O
C CH2 CH2 CH2 CH2 CH2 CH2CH2 CH2 CH2 CH2
CH2 CH2 CH2 CH3
O
O
O
O C CH2 CH2 CH2 CH2 CH2 CH2CH2 CH2 CH2 CH2
CH2 CH2 CH2 CH3
O
C CH2 CH2 CH2 CH2 CH2 CH2CH2 CH CH CH2
CH2 CH2 CH2 CH3
O
C CH2 CH2 CH2 CH2 CH2 CH2CH2 CH2 CH2 CH2
CH2 CH2 CH2 CH3
O
O
C CH2 CH2 CH2CH CH CH CH CH CH CH CH CH2 CH2 CH3O
O
C CH2 CH2 CH2 CH2 CH2 CH2CH2 CH2 CH2 CH2
CH2 CH2 CH2 CH3O in excess
18

Upper points are total energy = activity + REE.
Lower points are REE.
• Typical values for a physically inactive person.• Resting energy expenditure, REE, decreases with age.• Activity also decreases.• These decreases contribute to weight gain with increasing age.• REE is proportional to surface area.
19
Age-dependent energy expenditure
0
500
1000
1500
2000
2500
0 20 40 60 80 100
Age, years
Kc
al/d
ay

Energy Expenditure: Age, Weight, Sex & Activity
• REE = resting energy expenditure (~ basal metabolic rate)• Energy expenditure = REE x activity factor
• Activity factor Activity• 1.0 none (sleeping)• 1.5 very light (cooking)• 2.5 light (walking)• 5.0 moderate (tennis)• 7.0 heavy (basketball)
• AGE REE(80 kg male) REE(55 kg female)• 10-18 2051 1417• 18-30 1903 1305• 30-60 1807 1308• >60 1567 1174
• REE’s calculated (WHO 1985 Technical Report Series 724)
20

Energy Balance
• Energy expenditure – Resting metabolic
rate (RMR), or basal metabolic rate.
– Thermogenic effect of food (TEF), or Postprandial heat.
– Physical activity.
• Energy storage – none, if intake equals
expenditure.
• Energy intake– fat– carbohydrate– protein
21
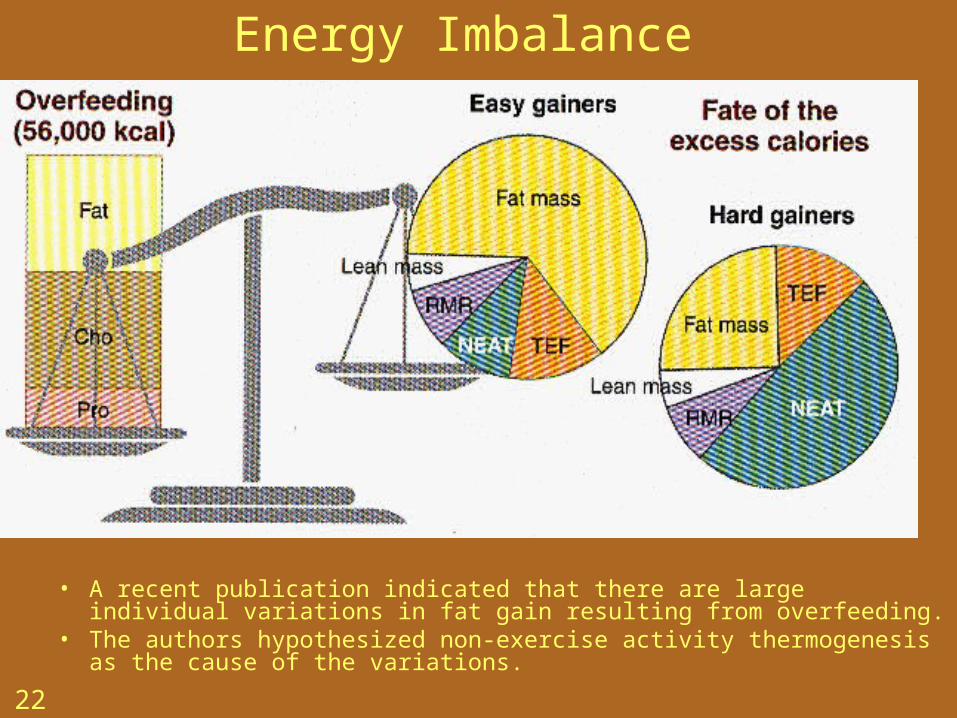
Energy Imbalance
• A recent publication indicated that there are large individual variations in fat gain resulting from overfeeding.
• The authors hypothesized non-exercise activity thermogenesis as the cause of the variations.
22

Nonexercise Activity Thermogenesis (NEAT)
• Energy use = BMR + postprandial heat + activity (in kcal/day).
• Exercise was kept constant. • NEAT (fidgeting, muscle tone, posture) is involuntary.• NEAT correlates inversely with fat gain (C).• Interpretation is high NEAT means “hard gainer.”• from Levine, Eberhardt & Jensen (1999) Science 283:212-214.23
Next topic: Inorganic nutrients
Related Documents