UNITED STATES SECURITIES AND EXCHANGE COMMISSION Washington, D.C. 20549 FORM 10-K ANNUAL REPORT PURSUANT TO SECTION 13 OR 15(d) OF THE SECURITIES EXCHANGE ACT OF 1934 For the fiscal year ended December 31, 2018 Commission file number 1-12672 AVALONBAY COMMUNITIES, INC. (Exact name of registrant as specified in its charter) Ballston Tower 671 N. Glebe Rd, Suite 800 Arlington, Virginia 22203 (Address of principal executive offices, including zip code) (703) 329-6300 (Registrant’s telephone number, including area code) __________________________________________________________________________ Securities registered pursuant to Section 12(b) of the Act: Securities registered pursuant to Section 12(g) of the Act: None Indicate by check mark if the registrant is a well-known seasoned issuer, as defined in Rule 405 of the Securities Act. Yes ý No o Indicate by check mark if the registrant is not required to file reports pursuant to Section 13 or Section 15(d) of the Act. Yes o No ý Indicate by check mark whether the registrant (1) has filed all reports required to be filed by Section 13 or 15(d) of the Securities Exchange Act of 1934 during the preceding twelve (12) months (or for such shorter period that the registrant was required to file such reports), and (2) has been subject to such filing requirements for the past 90 days. Yes ý No o Indicate by check mark whether the registrant has submitted electronically every Interactive Data File required to be submitted pursuant to Rule 405 of Regulation S-T during the preceding 12 months (or for such shorter period that the registrant was required to submit such files). Yes ý No o Indicate by check mark if disclosure of delinquent filers pursuant to Item 405 of Regulation S-K is not contained herein, and will not be contained, to the best of registrant's knowledge, in definitive proxy or information statements incorporated by reference in Part III of this Form 10-K or any amendment to this Form 10-K. ý Indicate by check mark whether the registrant is a large accelerated filer, an accelerated filer, a non-accelerated filer, smaller reporting company, or an emerging growth company. See the definitions of "large accelerated filer," "accelerated filer," "smaller reporting company," and "emerging growth company" in Rule 12b-2 of the Exchange Act. (Check one) Large accelerated filer ý Accelerated filer o Non-accelerated filer o Smaller reporting company o Emerging growth company o If an emerging growth company, indicate by check mark if the registrant has elected not to use the extended transition period for complying with any new or revised financial accounting standards provided pursuant to Section 13(a) of the Exchange Act. o Indicate by check mark whether the registrant is a shell company (as defined in Rule 12b-2 of the Act). Yes o No ý The aggregate market value of the registrant's Common Stock, par value $.01 per share, held by nonaffiliates of the registrant, as of June 30, 2018 was $23,656,288,475. The number of shares of the registrant's Common Stock, par value $.01 per share, outstanding as of January 31, 2019 was 138,508,567. Documents Incorporated by Reference Portions of AvalonBay Communities, Inc.'s Proxy Statement for the 2019 annual meeting of stockholders, a definitive copy of which will be filed with the SEC within 120 days after the year end of the year covered by this Form 10-K, are incorporated by reference herein as portions of Part III of this Form 10-K. Section 1: 10-K (10-K) Maryland 77-0404318 (State or other jurisdiction of (I.R.S. Employer incorporation or organization) Identification No.) (Title of each class) (Name of each exchange on which registered) Common Stock, par value $.01 per share New York Stock Exchange

Welcome message from author
This document is posted to help you gain knowledge. Please leave a comment to let me know what you think about it! Share it to your friends and learn new things together.
Transcript
UNITED STATES SECURITIES AND EXCHANGE COMMISSION
Washington, D.C. 20549
FORM 10-K
ANNUAL REPORT PURSUANT TO SECTION 13 OR 15(d) OF THE SECURITIES EXCHANGE ACT OF 1934
For the fiscal year ended December 31, 2018
Commission file number 1-12672
AVALONBAY COMMUNITIES, INC.
(Exact name of registrant as specified in its charter)
Ballston Tower 671 N. Glebe Rd, Suite 800 Arlington, Virginia 22203
(Address of principal executive offices, including zip code) (703) 329-6300
(Registrant’s telephone number, including area code) __________________________________________________________________________
Securities registered pursuant to Section 12(b) of the Act:
Securities registered pursuant to Section 12(g) of the Act: None
Indicate by check mark if the registrant is a well-known seasoned issuer, as defined in Rule 405 of the Securities Act.
Yes ý No o
Indicate by check mark if the registrant is not required to file reports pursuant to Section 13 or Section 15(d) of the Act.
Yes o No ý
Indicate by check mark whether the registrant (1) has filed all reports required to be filed by Section 13 or 15(d) of the Securities Exchange Act of 1934 during the preceding twelve (12) months (or for such shorter period that the registrant was required to file such reports), and (2) has been subject to such filing requirements for the past 90 days.
Yes ý No o
Indicate by check mark whether the registrant has submitted electronically every Interactive Data File required to be submitted pursuant to Rule 405 of Regulation S-T during the preceding 12 months (or for such shorter period that the registrant was required to submit such files).
Yes ý No o
Indicate by check mark if disclosure of delinquent filers pursuant to Item 405 of Regulation S-K is not contained herein, and will not be contained, to the best of registrant's knowledge, in definitive proxy or information statements incorporated by reference in Part III of this Form 10-K or any amendment to this Form 10-K. ý
Indicate by check mark whether the registrant is a large accelerated filer, an accelerated filer, a non-accelerated filer, smaller reporting company, or an emerging growth company. See the definitions of "large accelerated filer," "accelerated filer," "smaller reporting company," and "emerging growth company" in Rule 12b-2 of the Exchange Act. (Check one)
Large accelerated filer ý Accelerated filer o Non-accelerated filer o Smaller reporting company o Emerging growth company o
If an emerging growth company, indicate by check mark if the registrant has elected not to use the extended transition period for complying with any new or revised financial accounting standards provided pursuant to Section 13(a) of the Exchange Act. o
Indicate by check mark whether the registrant is a shell company (as defined in Rule 12b-2 of the Act).
Yes o No ý
The aggregate market value of the registrant's Common Stock, par value $.01 per share, held by nonaffiliates of the registrant, as of June 30, 2018 was $23,656,288,475.
The number of shares of the registrant's Common Stock, par value $.01 per share, outstanding as of January 31, 2019 was 138,508,567.
Documents Incorporated by Reference
Portions of AvalonBay Communities, Inc.'s Proxy Statement for the 2019 annual meeting of stockholders, a definitive copy of which will be filed with the SEC within 120 days after the year end of the year covered by this Form 10-K, are incorporated by reference herein as portions of Part III of this Form 10-K.
Section 1: 10-K (10-K)
Maryland 77-0404318
(State or other jurisdiction of (I.R.S. Employer
incorporation or organization) Identification No.)
(Title of each class) (Name of each exchange on which registered)
Common Stock, par value $.01 per share New York Stock Exchange

Table of Contents
TABLE OF CONTENTS
PAGE
PART I
ITEM 1. BUSINESS 1
ITEM 1A. RISK FACTORS 7
ITEM 1B. UNRESOLVED STAFF COMMENTS 17
ITEM 2. COMMUNITIES 18
ITEM 3. LEGAL PROCEEDINGS 30
ITEM 4. MINE SAFETY DISCLOSURES 30
PART II
ITEM 5. MARKET FOR REGISTRANT'S COMMON EQUITY, RELATED STOCKHOLDER MATTERS AND ISSUER PURCHASES OF
EQUITY SECURITIES 31
ITEM 6. SELECTED FINANCIAL DATA 32
ITEM 7. MANAGEMENT'S DISCUSSION AND ANALYSIS OF FINANCIAL CONDITION AND RESULTS OF OPERATIONS 36
ITEM 7A. QUANTITATIVE AND QUALITATIVE DISCLOSURES ABOUT MARKET RISK 58
ITEM 8. FINANCIAL STATEMENTS AND SUPPLEMENTARY DATA 58
ITEM 9. CHANGES IN AND DISAGREEMENTS WITH ACCOUNTANTS ON ACCOUNTING AND FINANCIAL DISCLOSURE 58
ITEM 9A. CONTROLS AND PROCEDURES 58
ITEM 9B. OTHER INFORMATION 59
PART III
ITEM 10. DIRECTORS, EXECUTIVE OFFICERS AND CORPORATE GOVERNANCE 60
ITEM 11. EXECUTIVE COMPENSATION 60
ITEM 12. SECURITY OWNERSHIP OF CERTAIN BENEFICIAL OWNERS AND MANAGEMENT AND RELATED STOCKHOLDER
MATTERS 60
ITEM 13. CERTAIN RELATIONSHIPS AND RELATED TRANSACTIONS, AND DIRECTOR INDEPENDENCE 61
ITEM 14. PRINCIPAL ACCOUNTING FEES AND SERVICES 61
PART IV
ITEM 15. EXHIBITS, FINANCIAL STATEMENT SCHEDULE 62
ITEM 16. FORM 10-K SUMMARY 62
SIGNATURES 66

Table of Contents
PART I
This Form 10-K contains forward-looking statements within the meaning of Section 27A of the Securities Act of 1933 and Section 21E of the Securities Exchange Act of 1934. Our actual results could differ materially from those set forth in each forward-looking statement. Certain factors that might cause such a difference are discussed in this report, including in the section entitled “Forward-Looking Statements” included in this Form 10-K. You should also review Item 1A. “Risk Factors” for a discussion of various risks that could adversely affect us. ITEM 1. BUSINESS General AvalonBay Communities, Inc. (the “Company,” which term, unless the context otherwise requires, refers to AvalonBay Communities, Inc. together with its subsidiaries), is a Maryland corporation that has elected to be treated as a real estate investment trust (“REIT”) for federal income tax purposes. We develop, redevelop, acquire, own and operate multifamily communities primarily in New England, the New York/New Jersey metro area, the Mid-Atlantic, the Pacific Northwest, and Northern and Southern California. We focus on leading metropolitan areas in these regions that we believe are characterized by growing employment in high wage sectors of the economy, higher cost of home ownership and a diverse and vibrant quality of life. We believe these market characteristics offer the opportunity for superior risk-adjusted returns over the long-term on apartment community investments relative to other markets that do not have these characteristics. We believe that Denver, Colorado, and Southeast Florida share these characteristics and we began investing in these markets in 2017. At January 31, 2019, we owned or held a direct or indirect ownership interest in:
We generally obtain ownership in an apartment community by developing a new community on either vacant land or land with improvements that we raze, or by acquiring an existing community. In selecting sites for development or acquisition, we favor locations that are near expanding employment centers and convenient to transportation, recreation areas, entertainment, shopping and dining. Our principal financial goal is to increase long-term shareholder value through the development, redevelopment, acquisition, ownership and, when appropriate, disposition of apartment communities in our markets. To help meet this goal, we regularly (i) monitor our investment allocation by geographic market and product type, (ii) develop, redevelop and acquire interests in apartment communities in our selected markets, (iii) selectively sell apartment communities that no longer meet our long-term strategy or when opportunities are presented to realize a portion of the value created through our investment and redeploy the proceeds from those sales and (iv) endeavor to maintain a capital structure that is aligned with our business risks with a view to maintaining continuous access to cost-effective capital. We pursue our development, redevelopment, investment and operating activities with the purpose of Creating a Better Way to Live. Our strategic vision is to be the leading apartment company in select US markets, providing a range of distinctive living experiences that customers value. We pursue this vision by targeting what we believe are among the best markets and submarkets, leveraging our strategic capabilities in market research and consumer insight and being disciplined in our capital allocation and balance sheet management. We operate our apartment communities under three core brands Avalon, AVA and Eaves by Avalon, described in Item 2. "Communities." We pursue our development and redevelopment activities primarily through in-house development and in-house redevelopment teams, which are complemented by our in-house acquisition platform. We believe that our organizational structure, which includes dedicated development and operational teams in each of our regions, and strong culture are key differentiators, providing us with highly talented, dedicated and capable associates.
1
• 269 operating apartment communities containing 78,365 apartment homes in 12 states and the District of Columbia, of which 254 communities containing 74,706apartment homes were consolidated for financial reporting purposes and 15 communities containing 3,659 apartment homes were held by unconsolidated entities in which we hold an ownership interest. Nine of the consolidated communities containing 3,648 apartment homes were under redevelopment, as discussed below;
• 21 communities under development that are expected to contain an aggregate of 6,609 apartment homes when completed and one mixed-use project being developed in which we are currently pursuing a potential for-sale strategy of individual condominium units; and
• rights to develop an additional 28 communities that, if developed as expected, will contain 9,769 apartment homes.

Table of Contents During the three years ended December 31, 2018, we acquired 12 apartment communities and disposed of 21 apartment communities, excluding unconsolidated investments and the five wholly-owned communities we contributed to the NYC Joint Venture (as defined below) during 2018. During the three years ended December 31, 2018, we completed the development of 29 apartment communities and the redevelopment of 25 apartment communities. We have investments in unconsolidated real estate entities with ownership interest percentages ranging from 20.0% to 55.0%, excluding joint ventures formed with Equity Residential as part of the Archstone Acquisition. During the three years ended December 31, 2018, excluding the NYC Joint Venture, we realized our pro rata share of the gain from the sale of 11 communities owned by unconsolidated real estate entities. During 2018, we contributed five wholly-owned operating communities located in New York, NY, to a newly formed joint venture (the "NYC Joint Venture"). We retained a 20.0% interest in the venture and are acting as the managing member of the venture as well as the property manager for the communities. The five communities contain an aggregate of 1,301 apartment homes and 58,000 square feet of retail space. On February 27, 2013, pursuant to an asset purchase agreement dated November 26, 2012, the Company, together with Equity Residential, acquired, directly or indirectly, all of the assets owned by Archstone Enterprise LP (“Archstone,” which has since changed its name to Jupiter Enterprise LP), including all of the ownership interests in joint ventures and other entities owned by Archstone, and assumed Archstone’s liabilities, both known and unknown, with certain limited exceptions. Under the terms of the purchase agreement, the Company acquired approximately 40.0% of Archstone's assets and liabilities and Equity Residential acquired approximately 60.0% of Archstone’s assets and liabilities (the “Archstone Acquisition”). A more detailed description of our unconsolidated real estate entities and the related investment activity can be found in the discussion in Note 5, “Investments in Real Estate Entities,” of the Consolidated Financial Statements in Item 8 of this report and in Item 7. “Management's Discussion and Analysis of Financial Condition and Results of Operations.” During 2018, excluding the five wholly-owned operating communities contributed to the NYC Joint Venture, we sold 10 operating communities, including sales by unconsolidated entities, and recognized a gain in accordance with U.S. generally accepted accounting principles (“GAAP”) of $205,770,000. A further discussion of our development, redevelopment, disposition, acquisition, property management and related strategies follows. Development Strategy. We select land for development and follow established procedures that we believe minimize both the cost and the risks of development. As one of the largest developers of multifamily rental apartment communities in our selected markets, we identify development opportunities through local market presence and access to local market information achieved through our regional offices. In addition to our principal executive office in Arlington, Virginia, we also maintain regional offices, administrative offices or specialty offices, including offices that are in or near the following cities:
2
• Bellevue, Washington; • Boston, Massachusetts; • Denver, Colorado; • Fairfield, Connecticut; • Irvine, California; • Iselin, New Jersey; • Melville, New York; • Los Angeles, California; • New York, New York; • San Diego, California; • San Francisco, California; • San Jose, California; and • Virginia Beach, Virginia.

Table of Contents After selecting a target site, we usually negotiate for the right to acquire the site either through an option or a long-term conditional contract. Options and long-term conditional contracts generally allow us to acquire the target site after the completion of entitlements and shortly before the start of construction, which reduces development-related risks and preserves capital. However, as a result of competitive market conditions for land suitable for development, we have sometimes acquired and held land prior to construction for extended periods while entitlements are obtained, or acquired land zoned for uses other than residential with the potential for rezoning. For further discussion of our Development Rights, refer to Item 2. “Communities” in this report. We generally act as our own general contractor and construction manager, except for certain mid-rise and high-rise apartment communities, where we may elect to use third-party general contractors as construction managers. We generally perform these functions directly (although we may use a wholly-owned subsidiary) both for ourselves and for the joint ventures and partnerships of which we are a member or a partner. We believe direct involvement in construction enables us to achieve higher construction quality, greater control over construction schedules and cost savings. Our development, property management and construction teams monitor construction progress to ensure quality workmanship and a smooth and timely transition into the leasing and operating phase. During periods where competition for development land is more intense, we may acquire improved land with existing commercial uses and rezone the site for multifamily residential use. During the period that we hold these buildings for future development, any rent received in excess of expenses from these operations, which we consider to be incidental, is accounted for as a reduction in our investment in the development pursuit and not as net income. Any expenses relating to these operations, in excess of any rents received, are accounted for as a reduction in net income. We have also participated, and may in the future participate, in master planned or other large multi-use developments where we commit to build infrastructure (such as roads) to be used by other participants or commit to act as construction manager or general contractor in building structures or spaces for third parties (such as unimproved ground floor retail space, municipal garages or parks). Costs we incur in connection with these activities may be accounted for as additional invested capital in the community or we may earn fee income for providing these services. Particularly with large scale, urban in-fill developments, we may engage in significant environmental remediation efforts to prepare a site for construction. Throughout this report, the term “development” is used to refer to the entire property development cycle, including pursuit of zoning approvals, procurement of architectural and engineering designs and the construction process. References to “construction” refer to the actual construction of the property, which is only one element of the development cycle. Redevelopment Strategy. When we undertake the redevelopment of a community, our goal is to renovate and/or rebuild an existing community so that our total investment is generally below replacement cost and the community is well positioned in the market to achieve attractive returns on our capital. We have dedicated redevelopment teams and procedures that are intended to control both the cost and risks of redevelopment. Our redevelopment teams, which include redevelopment, construction and property management personnel, monitor redevelopment progress. We believe we achieve significant cost savings by undertaking the redevelopment primarily through an occupied turn strategy, in which we continue to operate the community as we install improvements in occupied apartment homes, working to minimize any impact on our current residents. Throughout this report, the term “redevelopment” is used to refer to the entire redevelopment cycle, including planning and procurement of architectural and engineering designs, budgeting and actual renovation work. The actual renovation work is referred to as “reconstruction,” which is only one element of the redevelopment cycle. Disposition Strategy. We sell assets that no longer meet our long-term strategy or when real estate market conditions are favorable, and we redeploy the proceeds from those sales to develop, redevelop and acquire communities and to rebalance our portfolio across or within geographic regions. This also allows us to realize a portion of the value created through our investments and provides additional liquidity. We are then able to redeploy the net proceeds from our dispositions in lieu of raising that amount of capital externally. When we decide to sell a community, we generally solicit competing bids from unrelated parties for these individual assets and consider the sales price and other terms of each proposal.
3
Table of Contents As part of the Archstone Acquisition in 2013, we acquired, and still own, 14 assets that had previously been contributed by third parties on a tax-deferred basis to an Archstone partnership in which the third parties received ownership interests. To protect the tax-deferred nature of the contribution, the third parties are entitled to cash payments if we trigger tax obligations to the third parties by selling, or failing to maintain sufficient levels of secured financing on, the contributed assets. Our tax protection payment obligations with respect to these assets expire at different times and in some cases don’t expire until the death of a third party who contributed ownership interests to the Archstone partnership. After review and investigation of Archstone’s tax and accounting records, we estimate that, had we sold or taken other triggering actions in 2018 with respect to all 14 assets, the aggregate amount of the tax protection payments that would have been triggered would have been approximately $48,300,000. At the present time, we do not intend to take actions that would cause us to be required to make tax protection payments with respect to any of these assets. Acquisition Strategy. Our core competencies in development and redevelopment discussed above allow us to be selective in the acquisitions we target. Acquisitions allow us to achieve rapid penetration into markets in which we desire an increased presence. Acquisitions (and dispositions) also help us achieve our desired product mix or rebalance our portfolio. Portfolio growth also allows for fixed general and administrative costs to be a smaller percentage of overall community Net Operating Income (“NOI”). While we have achieved growth in the past through the establishment of discretionary real estate investments funds, which placed certain limitations on our ability to acquire new communities during their investments periods, we are not presently pursuing the formation of a new discretionary real estate investment fund, preferring at this time to maintain flexibility in shaping our portfolio of wholly-owned assets through acquisitions and dispositions. Property Management Strategy. We seek to increase operating income through innovative, proactive property management that will result in higher revenue from communities while constraining operating expenses. Our principal strategies to maximize revenue include:
Constraining growth in operating expenses is another way in which we seek to increase earnings growth. Growth in our portfolio and the resulting increase in revenue allows for fixed operating costs to be spread over a larger volume of revenue, thereby increasing operating margins. We constrain growth in operating expenses in a variety of ways, which include, but are not limited to, the following:
On-site property management teams receive bonuses based largely upon the revenue, expense, NOI and customer service metrics produced at their respective communities. We use and continuously seek ways to improve technology applications to help manage our communities, believing that the accurate collection of financial and resident data will enable us to maximize revenue and control costs through careful leasing decisions, maintenance decisions and financial management.
4
• focusing on resident satisfaction; • staggering lease terms such that lease expirations are better matched to traffic patterns;• balancing high occupancy with premium pricing and increasing rents as market conditions permit; and• employing revenue management software to optimize the pricing and term of leases.
• we use purchase order controls, acquiring goods and services from pre-approved vendors;• we use national negotiated contracts and also purchase supplies in bulk where possible;• we bid third-party contracts on a volume basis; • we strive to retain residents through high levels of service in order to eliminate the cost of preparing an apartment home for a new resident and to reduce marketing
and vacant apartment utility costs; • we perform turnover work in-house or hire third parties, generally considering the most cost effective approach as well as expertise needed to perform the work;• we undertake preventive maintenance regularly to maximize resident safety and satisfaction, as well as to maximize property and equipment life; • we have a customer care center, centralizing and improving the efficiency and consistency in the application of our policies for many of the administrative tasks
associated with owning and operating apartment communities; • we aggressively pursue real estate tax appeals; and • we install high efficiency lighting and water fixtures, cogeneration systems and implement sustainability initiatives in our operating platform.

Table of Contents We generally manage the operation and leasing activity of our communities directly (although we may use a wholly-owned subsidiary) both for ourselves and the joint ventures and partnerships of which we are a member or a partner. From time to time we may engage a third party to manage leasing and/or maintenance activity at one or more of our communities. From time to time we also pursue or arrange ancillary services for our residents to provide additional revenue sources or increase resident satisfaction. As a REIT, we generally cannot provide direct services to our residents that are not customarily provided by a landlord, nor can we directly share in the income of a third party that provides such services. However, we can provide such non-customary services to residents or share in the revenue or income from such services if we do so through a “taxable REIT subsidiary,” which is a subsidiary that is treated as a “C corporation” subject to federal income taxes. See “Tax Matters” below. Financing Strategy. Our financing strategy is to endeavor to maintain a capital structure that provides financial flexibility to help ensure we can select cost effective capital market options that are well matched to our business risks. We estimate that our short-term liquidity needs will be met from cash on hand, borrowings under our $1,500,000,000 revolving variable rate unsecured credit facility (the “Credit Facility”), sales of current operating communities and/or issuance of additional debt or equity securities. A determination to engage in an equity or debt offering depends on a variety of factors such as general market and economic conditions, our short and long-term liquidity needs, the relative costs of debt and equity capital and growth opportunities. A summary of debt and equity activity for the last three years is reflected on our Consolidated Statement of Cash Flows of the Consolidated Financial Statements set forth in Item 8 of this report. We have entered into, and may continue in the future to enter into, joint ventures (including limited liability companies or partnerships) through which we would own an indirect economic interest of less than 100% of the community or communities owned directly by such joint ventures. Our decision to either hold an apartment community in fee simple or to have an indirect interest in the community through a joint venture is based on a variety of factors and considerations, including: (i) the economic and tax terms required by a seller of land or of a community; (ii) our desire to diversify our portfolio of communities by market, submarket and product type; (iii) our desire at times to preserve our capital resources to maintain liquidity or balance sheet strength; and (iv) our projection, in some circumstances, that we will achieve higher returns on our invested capital or reduce our risk if a joint venture vehicle is used. Investments in joint ventures are not limited to a specified percentage of our assets. Each joint venture agreement is individually negotiated, and our ability to operate and/or dispose of a community in our sole discretion may be limited to varying degrees depending on the terms of the joint venture agreement. In addition, from time to time, we may offer shares of our equity securities, debt securities or options to purchase stock in exchange for property. We may also acquire properties in exchange for properties we currently own. Other Strategies and Activities. While we emphasize equity real estate investments in rental apartment communities, we have the ability to invest in other types of real estate, mortgages (including participating or convertible mortgages), securities of other REITs or real estate operating companies, or securities of technology companies that relate to our real estate operations or of companies that provide services to us or our residents, in each case consistent with our qualification as a REIT. In addition, we own and lease retail space at our communities when either (i) the highest and best use of the space is for retail (e.g., street level in an urban area); (ii) we believe the retail space will enhance the attractiveness of the community to residents or; (iii) some component of retail space is required to obtain entitlements to build apartment homes. As of December 31, 2018, we had a total of approximately 681,000 square feet of rentable retail space, excluding retail space within communities currently under development. Gross rental revenue provided by leased retail space in 2018 was $26,071,000 (1.1% of total revenue). We may also develop a property in conjunction with another real estate company that will own and operate the retail or for-sale residential components of a mixed-use building or project that we help develop. If we secure a development right and believe that its best use, in whole or in part, is to develop the real estate with the intent to sell rather than hold the asset, we may, through a taxable REIT subsidiary, develop real estate for sale. Any investment in securities of other entities, and any development of real estate for sale, is subject to the percentage of ownership limitations, gross income tests, and other limitations that must be observed for REIT qualification. We have not engaged in trading, underwriting or agency distribution or sale of securities of other issuers and do not intend to do so. At all times we intend to make investments in a manner so as to qualify as a REIT unless, because of circumstances or changes to the Internal Revenue Code of 1986, as amended (the “Code”) (or the Treasury Regulations thereunder), our Board of Directors determines that it is no longer in our best interest to qualify as a REIT. Tax Matters We filed an election with our 1994 federal income tax return to be taxed as a REIT under the Code and intend to maintain our qualification as a REIT in the future. As a REIT, with limited exceptions, such as those described under “Property Management Strategy” above, we will not be taxed under federal and certain state income tax laws at the corporate level on our taxable net
5

Table of Contents income to the extent taxable net income is distributed to our stockholders. We expect to make sufficient distributions to avoid income tax at the corporate level. While we believe that we are organized and qualified as a REIT and we intend to operate in a manner that will allow us to continue to qualify as a REIT, there can be no assurance that we will be successful in this regard. Qualification as a REIT involves the application of highly technical and complex provisions of the Code for which there are limited judicial and administrative interpretations and involves the determination of a variety of factual matters and circumstances not entirely within our control. Competition We face competition from other real estate investors, including insurance companies, pension and investment funds, other REITs, and other well capitalized investors, to acquire and develop apartment communities and acquire land for future development. As an owner and operator of apartment communities, we also face competition for prospective residents from other operators whose communities may be perceived to offer a better location or better amenities or whose rent may be perceived as a better value given the quality, location and amenities that the resident seeks. We also compete against condominiums and single-family homes that are for sale or rent. Although we often compete against large, sophisticated developers and operators for development opportunities and for prospective residents, real estate developers and operators of any size can provide effective competition for both real estate assets and potential residents. Environmental and Related Matters As a current or prior owner, operator and developer of real estate, we are subject to various federal, state and local environmental laws, regulations and ordinances and also could be liable to third parties resulting from environmental contamination or noncompliance at our communities. For some Development Communities we undertake extensive environmental remediation to prepare the site for construction, which could be a significant portion of our total construction cost. Environmental remediation efforts could expose us to possible liabilities for accidents or improper handling of contaminated materials during construction. These and other risks related to environmental matters are described in more detail in Item 1A. “Risk Factors.” We believe that more government regulation of energy use, along with a greater focus on environmental protection, may, over time, have a significant impact on urban growth patterns. If changes in zoning to encourage greater density and proximity to mass transit do occur, such changes could benefit multifamily housing and those companies with a competency in high-density development. However, there can be no assurance as to whether or when such changes in regulations or zoning will occur or, if they do occur, whether the multifamily industry or the Company will benefit from such changes. Other Information We file annual, quarterly and current reports, proxy statements and other information with the SEC. You may obtain copies of our SEC filings, free of charge, from the SEC's website at www.sec.gov. We maintain a website at www.avalonbay.com. Our annual reports on Form 10-K, quarterly reports on Form 10-Q, current reports on Form 8-K, and amendments to those reports, filed or furnished pursuant to the Securities Exchange Act of 1934 are available free of charge in the “Investor Relations” section of our website as soon as reasonably practicable after the reports are filed with or furnished to the SEC. In addition, the charters of our Board's Nominating and Corporate Governance Committee, Audit Committee and Compensation Committee, as well as our Director Independence Standards, Corporate Governance Guidelines, Code of Business Conduct and Ethics, Policy Regarding Shareholder Rights Agreements, Policy Regarding Shareholder Approval of Future Severance Agreements, Executive Stock Ownership Guidelines, Policy on Political Contributions and Government Relations, Policy for Recoupment of Incentive Compensation, and Sustainability Reports, are available free of charge in that section of our website or by writing to AvalonBay Communities, Inc., Ballston Tower, Suite 800, 671 N. Glebe Rd., Arlington, Virginia 22203, Attention: Chief Financial Officer. To the extent required by the rules of the SEC and the NYSE, we will disclose amendments and waivers relating to these documents in the same place on our website. The information posted on our website is not incorporated into this Annual Report on Form 10-K. We were incorporated under the laws of the State of California in 1978. In 1995, we reincorporated in the State of Maryland and have been focused on the ownership and operation of apartment communities since that time. As of January 31, 2019, we had 3,087 employees.
6

Table of Contents ITEM 1A. RISK FACTORS Our operations involve various risks that could have adverse consequences, including those described below. This Item 1A. includes forward-looking statements. You should refer to our discussion of the qualifications and limitations on forward-looking statements in this Form 10-K. Development, redevelopment, construction and operating risks could affect our profitability. We intend to continue to develop and redevelop apartment home communities. These activities can include long planning and entitlement timelines and can involve complex and costly activities, including significant environmental remediation or construction work in high-density urban areas. These activities may be exposed to the following risks:
We estimate construction costs based on market conditions at the time we prepare our budgets, and our projections include changes that we anticipate but cannot predict with certainty. Construction costs may increase, particularly for labor and certain materials and, for some of our Development Communities and Development Rights (as defined below), the total construction costs may be higher than the original budget. Total capitalized cost includes all capitalized costs incurred and projected to be incurred to develop or redevelop a community, determined in accordance with GAAP, including:
Costs to redevelop communities that have been acquired have, in some cases, exceeded our original estimates and similar increases in costs may be experienced in the future. We cannot assure you that market rents in effect at the time new Development or Redevelopment Communities complete lease-up will be sufficient to fully offset the effects of any increased construction or reconstruction costs.
7
• we may abandon opportunities that we have already begun to explore for a number of reasons, including changes in local market conditions or increases in construction or financing costs, and, as a result, we may fail to recover expenses already incurred in exploring those opportunities;
• occupancy rates and rents at a community may fail to meet our original expectations for a number of reasons, including changes in market and economic conditions beyond our control and the development by competitors of competing communities;
• we may be unable to obtain, or experience delays in obtaining, necessary zoning, occupancy or other required governmental or third party permits and authorizations, which could result in increased costs or the delay or abandonment of opportunities;
• we may incur costs that exceed our original estimates due to increased material, labor or other costs;• we may be unable to complete construction and lease-up of a community on schedule, resulting in increased construction and financing costs and a decrease in
expected rental revenues; • we may be unable to obtain financing with favorable terms, or at all, for the proposed development of a community, which may cause us to delay or abandon an
opportunity; • we may incur liabilities to third parties during the development process, for example, in connection with managing existing improvements on the site prior to tenant
terminations and demolition (such as commercial space) or in connection with providing services to third parties (such as the construction of shared infrastructure or other improvements); and
• we may incur liability if our communities are not constructed and operated in compliance with the accessibility provisions of the Americans with Disabilities Acts, the Fair Housing Act or other federal, state or local requirements. Noncompliance could result in imposition of fines, an award of damages to private litigants and a requirement that we undertake structural modifications to remedy the noncompliance.
• land and/or property acquisition costs; • fees paid to secure air rights and/or tax abatements; • construction or reconstruction costs; • costs of environmental remediation; • real estate taxes; • capitalized interest and insurance; • loan fees; • permits; • professional fees; • allocated development or redevelopment overhead; and • other regulatory fees.
Table of Contents The construction and maintenance of our communities include a risk of major casualty events that could materially damage our property and the property of others and pose the risk of personal injury. While we carry insurance for such risks in amounts we deem reasonable, we cannot assure that such insurance will be adequate, and when we have incurred and in the future may incur such casualties, we are subject to losses on account of deductibles and self-insured amounts in any event. Such casualties may also expose us in the future to higher insurance premiums, greater construction or operating costs (either voluntarily assumed by us or as a result of new local regulations) and risks to our reputation among prospective residents or municipalities from which we may seek approvals in the future, all of which could have a material adverse effect on our business and our financial condition and results of operations. Unfavorable changes in market and economic conditions could adversely affect occupancy, rental rates, operating expenses and the overall market value of our real estate assets. Local conditions in our markets significantly affect occupancy, rental rates and the operating performance of our communities. The risks that may adversely affect conditions in those markets include the following:
Rent control and other changes in applicable laws, or noncompliance with applicable laws, could adversely affect our operations or expose us to liability. We must develop, construct and operate our communities in compliance with numerous federal, state and local laws and regulations, some of which may conflict with one another or be subject to limited judicial or regulatory interpretations. These laws and regulations may include zoning laws, building codes, landlord/tenant laws and other laws generally applicable to business operations. Noncompliance with laws could expose us to liability. Lower revenue growth or significant unanticipated expenditures may result from our need to comply with changes in (i) laws imposing remediation requirements and the potential liability for environmental conditions existing on properties or the restrictions on discharges or other conditions, (ii) rent control or rent stabilization laws or other residential landlord/tenant laws or (iii) other governmental rules and regulations or enforcement policies affecting the development, use and operation of our communities, including changes to building codes and fire and life-safety codes. We have seen a recent increase in municipalities implementing, considering or being urged by advocacy groups to consider rent control or rent stabilization laws and regulations or take other actions that could limit our ability to raise rents based solely on market conditions. For example, in 2016 in Mountain View, California, the voters passed a referendum that limits rent increases on existing tenants (but not on new move-ins) in communities built before 1995. These initiatives and any other future enactments of rent control or rent stabilization laws or other laws regulating multi-family housing, as well as any lawsuits against the Company arising from such rent control or other laws, may reduce rental revenues or increase operating costs. Such laws and regulations may limit our ability to charge market rents, increase rents, evict tenants or recover increases in our operating expenses and could make it more difficult for us to dispose of properties in certain circumstances. Expenses associated with our investment in these communities, such as debt service, real estate taxes, insurance and maintenance costs, are generally not reduced when circumstances cause a reduction in rental income from the community. Short-term leases expose us to the effects of declining market rents. Substantially all of our apartment leases are for a term of one year or less. Because these leases generally permit the residents to leave at the end of the lease term without penalty, our rental revenues are impacted by declines in market rents more quickly than if our leases were for longer terms.
8
• corporate restructurings and/or layoffs, industry slowdowns and other factors that adversely affect the local economy;• an oversupply of, or a reduced demand for, apartment homes; • a decline in household formation or employment or lack of employment growth;• the inability or unwillingness of residents to pay rent increases;• rent control or rent stabilization laws, or other laws regulating housing, that could prevent us from raising rents sufficiently to offset increases in operating costs; and• economic conditions that could cause an increase in our operating expenses, such as increases in property taxes, utilities, compensation of on-site associates and
routine maintenance.

Table of Contents Competition could limit our ability to lease apartment homes or increase or maintain rents. Our apartment communities compete with other housing alternatives to attract residents, including other rental apartments, condominiums and single-family homes that are available for rent, as well as new and existing condominiums and single-family homes for sale. Competitive residential housing in a particular area could adversely affect our ability to lease apartment homes and to increase or maintain rental rates. Attractive investment opportunities may not be available, which could adversely affect our profitability. We expect that other real estate investors, including insurance companies, pension and investment funds, other REITs and other well-capitalized investors, will compete with us to acquire existing properties and to develop new properties. This competition could increase prices for properties of the type we would likely pursue and adversely affect our profitability for new investments. Capital and credit market conditions may adversely affect our access to various sources of capital and/or the cost of capital, which could impact our business activities, dividends, earnings and common stock price, among other things. In periods when the capital and credit markets experience significant volatility, the amounts, sources and cost of capital available to us may be adversely affected. We primarily use external financing to fund construction and to refinance indebtedness as it matures. If sufficient sources of external financing are not available to us on cost effective terms, we could be forced to limit our development and redevelopment activity and/or take other actions to fund our business activities and repayment of debt, such as selling assets, reducing our cash dividend or paying out less than 100% of our taxable income. To the extent that we are able and/or choose to access capital at a higher cost than we have experienced in recent years (reflected in higher interest rates for debt financing or a lower stock price for equity financing), absent changes in other factors, our earnings per share and cash flows could be adversely affected. In addition, the price of our common stock may fluctuate significantly and/or decline in a high interest rate or volatile economic environment. We believe that the lenders under our Credit Facility will fulfill their lending obligations thereunder, but if economic conditions deteriorate, there can be no assurance that the ability of those lenders to fulfill their obligations would not be adversely impacted. Insufficient cash flow could affect our debt financing and create refinancing risk. We are subject to the risks associated with debt financing, including the risk that our available cash will be insufficient to meet required payments of principal and interest on our debt. In this regard, in order for us to continue to qualify as a REIT, we are required to annually distribute dividends generally equal to at least 90% of our REIT taxable income, computed without regard to the dividends paid deduction and excluding any net capital gain. This requirement limits the amount of our cash flow available to meet required principal and interest payments. The principal outstanding balance on a portion of our debt will not be fully amortized prior to its maturity. Although we may be able to repay our debt by using our cash flows, we cannot assure you that we will have sufficient cash flows available to make all required principal payments. Therefore, we may need to refinance at least a portion of our outstanding debt as it matures. There is a risk that we may not be able to refinance existing debt or that a refinancing will not be done on as favorable terms; either of these outcomes could have a material adverse effect on our financial condition and results of operations. Rising interest rates could increase interest costs and could affect the market price of our common stock, and efforts to hedge such risk could be ineffective and cause us to incur costs. We currently have, and may in the future incur, contractual variable interest rate debt. In addition, we regularly seek access to both fixed and variable rate debt financing to repay maturing debt and to finance our development and redevelopment activity. Accordingly, if interest rates increase, our interest costs will also rise, unless we have made arrangements that hedge the risk of rising interest rates. In addition, an increase in market interest rates may lead purchasers of our common stock to demand a greater annual dividend yield, which could adversely affect the market price of our common stock. From time to time we use interest rate derivatives to hedge and manage our exposure to certain interest rate risks. For example, from time to time, when we anticipate issuing debt securities, we may seek to limit our exposure to fluctuations in interest rates during the period prior to issuance of the securities by entering into interest rate hedging contracts. Although these agreements may partially protect against rising interest rates, they also may reduce the benefits to the Company if interest rates decline. The settlement of interest rate hedging contracts has involved and may in the future involve material charges to our earnings. In addition, our use of interest rate hedging arrangements may expose us to additional risks, including a risk that a counterparty to a hedging arrangement may fail to honor its obligations. Developing and implementing an effective interest rate risk strategy is complex and no strategy can completely insulate us from risks associated with interest rate fluctuations. There can be no assurance that our
9

Table of Contents hedging activities will be effective. Termination of these hedging agreements may involve net costs, such as transaction fees, settlement costs and/or breakage costs. Bond financing and zoning and other compliance requirements could limit our income, restrict the use of communities and cause favorable financing to become unavailable. We have financed some of our apartment communities with obligations issued by local government agencies because the interest paid to the holders of this debt is generally exempt from federal income taxes and, therefore, the interest rate is generally more favorable to us. These obligations are commonly referred to as “tax-exempt bonds” and generally must be secured by mortgages on our communities. As a condition to obtaining tax-exempt financing, or on occasion as a condition to obtaining favorable zoning or an agreement relating to property taxes in some jurisdictions, we will commit to make some of the apartments in a community available to households whose income does not exceed certain thresholds (e.g., 50% or 80% of area median income), or who meet other qualifying tests. As of December 31, 2018, 5.2% of our apartment homes at current operating communities were under income limitations such as these. These commitments, which may run without expiration or may expire after a period of time (such as 15 or 20 years), may limit our ability to raise rents and, as a consequence, may also adversely affect the value of the communities subject to these restrictions. In addition, if we fail to observe these commitments, we could lose benefits (such as reduced property taxes) or face liabilities including liability for the benefits we received under tax exempt bonds or agreements related to property taxes. In addition, some of our tax-exempt bond financing documents require us to obtain a guarantee from a financial institution of payment of the principal of, and interest on, the bonds. The guarantee may take the form of a letter of credit, surety bond, guarantee agreement or other additional collateral. If the financial institution defaults in its guarantee obligations, or if we are unable to renew the applicable guarantee or otherwise post satisfactory collateral, a default will occur under the applicable tax-exempt bonds and the community could be foreclosed upon if we do not redeem the bonds. Risks related to indebtedness. We have a Credit Facility with a syndicate of commercial banks. Our organizational documents do not limit the amount or percentage of indebtedness that may be incurred. Accordingly, subject to compliance with outstanding debt covenants, we could incur more debt, resulting in an increased risk of default on our obligations and an increase in debt service requirements that could adversely affect our financial condition and results of operations. The mortgages on properties that are subject to secured debt, our Credit Facility and the indenture under which a substantial portion of our debt was issued contain customary restrictions, requirements and other limitations, as well as certain financial and operating covenants including maintenance of certain financial ratios. Maintaining compliance with these restrictions could limit our flexibility. A default in these requirements, if uncured, could result in a requirement that we repay indebtedness, which could materially adversely affect our liquidity and increase our financing costs. Refer to Item 7. “Management's Discussion and Analysis of Financial Condition and Results of Operations” for further discussion. The mortgages on properties that are subject to secured debt generally include provisions which stipulate a prepayment penalty or payment that we will be obligated to pay in the event that we elect to repay the mortgage note prior to the earlier of (i) the stated maturity of the note or (ii) the date at which the mortgage note is prepayable without such penalty or payment. If we elect to repay some or all of the outstanding principal balance for our mortgage notes, we may incur prepayment penalties or payments under these provisions which could materially adversely affect our results of operations. Failure to maintain our current credit ratings could adversely affect our cost of funds, related margins, liquidity and access to capital markets. There are two major debt rating agencies that routinely evaluate and rate our debt. Their ratings are based on a number of factors, which include their assessment of our financial strength, liquidity, capital structure, asset quality, amount of real estate under development, and sustainability of cash flow and earnings, among other factors. If market conditions change, we may not be able to maintain our current credit ratings, which could adversely affect our cost of funds and related margins, liquidity and access to capital markets. Debt financing may not be available and equity issuances could be dilutive to our stockholders. Our ability to execute our business strategy depends on our access to cost effective debt and equity financing. Debt financing may not be available in sufficient amounts or on favorable terms. If we issue additional equity securities, the interests of existing stockholders could be diluted.
10

Table of Contents Failure to generate sufficient revenue or other liquidity needs could limit cash flow available for distributions to stockholders. A decrease in rental revenue, or liquidity needs such as the repayment of indebtedness or funding of our development activities, could have an adverse effect on our ability to pay distributions to our stockholders. Significant expenditures associated with each community such as debt service payments, if any, real estate taxes, insurance and maintenance costs are generally not reduced when circumstances cause a reduction in income from a community. The form, timing and/or amount of dividend distributions in future periods may vary and be impacted by economic and other considerations. The form, timing and/or amount of dividend distributions will be declared at the discretion of the Board of Directors and will depend on actual cash from operations, our financial condition, capital requirements, the annual distribution requirements under the REIT provisions of the Code and other factors as the Board of Directors may consider relevant. The Board of Directors may modify our dividend policy from time to time. We may choose to pay dividends in our own stock, in which case stockholders may be required to pay tax in excess of the cash they receive. We may distribute taxable dividends that are payable in part in our stock. Taxable stockholders receiving such dividends will be required to include the full amount of the dividend as income to the extent of our current and accumulated earnings and profits for federal income tax purposes. As a result, a U.S. stockholder may be required to pay tax with respect to such dividends in excess of the cash dividend received. If a U.S. stockholder sells the stock it receives as a dividend in order to pay this tax, the sales proceeds may be less than the amount included in income with respect to the dividend, depending on the market price of our stock at the time of the sale. Furthermore, with respect to non-U.S. stockholders, we may be required to withhold U.S. tax with respect to such dividends, including in respect of all or a portion of such dividend that is payable in stock. In addition, the trading price of our stock would experience downward pressure if a significant number of our stockholders sell shares of our stock in order to pay taxes owed on dividends. We may experience regulatory or economic barriers to selling apartment communities that could limit liquidity and financial flexibility. Potential difficulties in selling real estate in our markets may limit our ability to change or reduce the apartment communities in our portfolio promptly in response to changes in economic or other conditions. Federal tax laws may limit our ability to earn a gain on the sale of a community (unless we own it through a subsidiary which will incur a taxable gain upon sale) if we are found to have held, acquired or developed the community primarily with the intent to resell the community, and this limitation may affect our ability to sell communities without adversely affecting returns to our stockholders. In addition, real estate in our markets can at times be difficult to sell quickly at prices we find acceptable. From time to time we dispose of properties in transactions intended to qualify as “like-kind exchanges” under Section 1031 of the Code. If a transaction intended to qualify as a Section 1031 exchange is later determined to be taxable, we may face adverse tax consequences, and if the laws applicable to such transactions are amended or repealed, we may not be able to dispose of properties on a tax deferred basis. Acquisitions may not yield anticipated results. Our business strategy includes acquiring as well as developing communities. Our acquisition activities may be exposed to the following risks:
11
• an acquired property may fail to perform as we expected in analyzing our investment; and• our estimate of the costs of operating, repositioning or redeveloping an acquired property may prove inaccurate.

Table of Contents Failure to succeed in new markets, or with new brands and community formats, or in activities other than the development, ownership and operation of residential rental communities may have adverse consequences. We may from time to time commence development activity or make acquisitions outside of our existing market areas if appropriate opportunities arise. For example, in 2017 we entered the Denver, Colorado, and Southeast Florida markets, where we have now engaged, and continue to pursue, development and acquisition opportunities. Our historical experience in our existing markets in developing, owning and operating rental communities does not ensure that we will be able to operate successfully in new markets, should we choose to enter them. We may be exposed to a variety of risks if we choose to enter new markets, including an inability to accurately evaluate local apartment market conditions; an inability to obtain land for development or to identify appropriate acquisition opportunities; an inability to hire and retain key personnel; and a lack of familiarity with local governmental and permitting procedures. Although we are primarily in the multifamily rental business, we also own and lease ancillary retail and commercial space, in particular when such tenants represent the best use of the space, as is often the case with large urban in-fill developments. Gross rental revenue provided by leased retail/commercial space in our portfolio represented 1.1% of our total revenue in 2018. The long term nature of our retail/commercial leases and characteristics of many of our tenants (small, local businesses) may subject us to certain risks. We may not be able to lease new space for rents that are consistent with our projections or at market rates. Also, when leases for our existing retail/commercial space expire, the space may not be relet or the terms of reletting, including the cost of allowances and concessions to tenants, may be less favorable than the current lease terms. Our properties compete with other properties with retail/commercial space. The presence of competitive alternatives may affect our ability to lease space and the level of rents we can obtain. If our retail/commercial tenants experience financial distress or bankruptcy, they may fail to comply with their contractual obligations, seek concessions in order to continue operations or cease their operations, which could adversely impact our results of operations and financial condition. We also may engage or have an interest in for-sale activity. For example, we have indicated that we may pursue the sale of residential condominium units as a disposition strategy from the residential component of our development at 15 West 61st Street, New York, New York. We may be unsuccessful at developing real estate with the intent to sell or in selling condominiums as a disposition strategy for an asset, which could have an adverse effect on our results of operations. Land we hold with no current intent to develop may be subject to future impairment charges. We own parcels of land that we do not currently intend to develop. As discussed in Item 2. “Communities—Other Land and Real Estate Assets,” in the event that the fair market value of a parcel changes such that we determine that the carrying basis of the parcel reflected in our financial statements is greater than the parcel's then current fair value, less costs to dispose, we would be subject to an impairment charge, which would reduce our net income. We are exposed to various risks from our real estate activity through joint ventures. Instead of acquiring, developing or maintaining ownership of apartment communities as a wholly-owned investment, at times we invest in real estate as a partner or a co-venturer with other investors. Joint venture investments (including investments through partnerships or limited liability companies) involve risks, including the possibility that our partner might become insolvent or otherwise refuse to make capital contributions when due; that we may be responsible to our partner for indemnifiable losses; that our partner might at any time have business goals that are inconsistent with ours; and that our partner may be in a position to take action or withhold consent contrary to our instructions or requests. Frequently, we and our partner may each have the right to trigger a buy-sell arrangement that could cause us to sell our interest, or acquire our partner's interest, at a time when we otherwise would not have initiated such a transaction. We are exposed to risks associated with investment in and management of discretionary real estate investment funds and joint ventures. We have investment interests in unconsolidated real estate entities (collectively, "ventures") ranging from 20.0% to 55.0%. The ventures present risks, including the following:
12
• our subsidiaries that are the general partner or managing member of the ventures are generally liable, under applicable law or the governing agreement of a venture, for the debts and obligations of the respective venture, subject to certain exculpation and indemnification rights pursuant to the terms of the governing agreement;
• investors in the ventures holding a majority of the equity interests may remove us as the general partner or managing member in certain cases involving cause;

Table of Contents
The governance provisions of our joint ventures with Equity Residential could adversely affect our flexibility in dealing with such joint venture assets and liabilities. In connection with the Archstone Acquisition, we created joint ventures with Equity Residential that manage or have an interest in certain of the acquired assets and liabilities. These structures involve participation in the ventures by Equity Residential whose interests and rights may not be the same as ours. Joint ownership of an investment in real estate involves risks not associated with direct ownership of real estate, including the risk that Equity Residential may at any time have economic or other business interests or goals which become inconsistent with our business interests or goals, including inconsistent goals relating to the sale of properties held in the joint ventures or the timing of the termination and liquidation of the joint ventures. Under the form for the joint venture arrangements, neither we nor Equity Residential expect to individually have the sole power to control the ventures, and an impasse could occur, which could adversely affect the applicable joint venture and decrease potential returns to us and our investors. We rely on information technology in our operations, and any breach, interruption or security failure of that technology, or any non-compliance with applicable laws with respect to the use of that technology, could have a negative impact on our business, results of operations, financial condition and/or reputation. Information security risks have generally increased in recent years due to the rise in new technologies and the increased sophistication and activities of perpetrators of cyber attacks. We collect and hold personally identifiable information of our residents and prospective residents in connection with our leasing and property management activities, and we collect and hold personally identifiable information of our associates in connection with their employment. In addition, we engage third party service providers that may have access to such personally identifiable information in connection with providing necessary information technology and security and other business services to us. We address potential breaches or disclosure of this confidential personally identifiable information by implementing a variety of security measures intended to protect the confidentiality and security of this information including (among others) engaging reputable, recognized firms to help us design and maintain our information technology and data security systems, including testing and verification of their proper and secure operations on a periodic basis. We also maintain cyber risk insurance to provide some coverage for certain risks arising out of data and network breaches. However, there can be no assurance that we will be able to prevent unauthorized access to this information. Any failure in or breach of our operational or information security systems, or those of our third party service providers, as a result of cyber attacks or information security breaches, could result in a wide range of potentially serious harm to our business operations and financial prospects, including (among others) disruption of our business and operations, disclosure or misuse of confidential or proprietary information (including personal information of our residents and/or associates), damage to our reputation, and/or potentially significant legal and/or financial liabilities and penalties. Various laws and regulations and interpretations thereof, as well as agreements with payment processors, require, or may require, us to comply with rules related to our websites for use by residents and prospective residents, including requirements related to accessibility of our websites to persons with disabilities and our handling of data collection. We could face liabilities for failure to comply with these requirements. We could incur costs to comply with stricter and more complex data privacy, data collection and information security laws and standards. We are exposed to risks that are either uninsurable, not economically insurable or in excess of our insurance coverage, including risks discussed below. Earthquake risk. As further described in Item 2. “Communities—Insurance and Risk of Uninsured Losses,” many of our West Coast communities are located in the general vicinity of active earthquake faults. We cannot assure you that an earthquake would not cause damage or losses greater than insured levels. In the event of a loss in excess of insured limits, we could lose our capital invested in the affected community, as well as anticipated future revenue from that community. We would also continue to be obligated to repay any mortgage indebtedness or other obligations related to the community. Any such loss could materially and adversely affect our business and our financial condition and results of operations.
13
• while we have broad discretion to manage the ventures, the investors or an advisory committee comprised of representatives of the investors must approve certain matters, and as a result we may be unable to cause the ventures to implement certain decisions that we consider beneficial; and
• we may be liable and/or our status as a REIT may be jeopardized if either the ventures, or the REIT entities associated with the ventures, fail to comply with various tax or other regulatory matters.

Table of Contents Insurance coverage for earthquakes can be costly and in limited supply. As a result, we may experience shortages in desired coverage levels if market conditions are such that insurance is not available or the cost of insurance makes it, in the Company's view, economically impractical. Severe or inclement weather risk. We are exposed to risks associated with inclement or severe weather, including hurricanes, severe winter storms and coastal flooding. Severe or inclement weather may result in increased costs resulting from increased maintenance, repair of water and wind damage, removal of snow and ice, and, in the case of our Development Communities, delays in construction that result in increased construction costs and delays in realizing rental revenues from a community. A single catastrophe that affects one of our regions, such as an earthquake that affects the West Coast or a hurricane or severe winter storm that affects the Mid-Atlantic, Metro New York/New Jersey or New England regions, may have a significant negative effect on our financial condition and results of operations. Climate change risk. To the extent that significant changes in the climate occur in areas where our communities are located, we may experience extreme weather and changes in precipitation and temperature, all of which may result in physical damage to or a decrease in demand for properties located in these areas or affected by these conditions. Should the impact of climate change be material in nature, including significant property damage to or destruction of our communities, or occur for lengthy periods of time, our financial condition or results of operations may be adversely affected. In addition, changes in federal, state and local legislation and regulation based on concerns about climate change could result in increased capital expenditures on our existing properties and our new development properties (for example, to improve their energy efficiency and/or resistance to inclement weather) without a corresponding increase in revenue, resulting in adverse impacts to our net income. Terrorism risk. We have significant investments in large metropolitan markets, such as Metro New York/New Jersey and Washington, D.C., which have in the past been or may in the future be the target of actual or threatened terrorist attacks. Future terrorist attacks in these markets could directly or indirectly damage our communities, both physically and financially, or cause losses that exceed our insurance coverage and that could have a material adverse effect on our business, financial condition and results of operations. A significant uninsured property or liability loss could have a material adverse effect on our financial condition and results of operations. In addition to the earthquake insurance discussed above, we carry commercial general liability insurance, property insurance and terrorism insurance with respect to our communities on terms and in amounts we consider commercially reasonable. There are, however, certain types of losses (such as losses arising from acts of war) that are not insured, in full or in part, because they are either uninsurable or the cost of insurance makes it, in the Company's view, economically impractical. If an uninsured property loss or a property loss in excess of insured limits were to occur, we could lose our capital invested in a community, as well as the anticipated future revenues from such community. We would also continue to be obligated to repay any mortgage indebtedness or other obligations related to the community. If an uninsured liability to a third party were to occur, we would incur the cost of defense and settlement with, or court ordered damages to, that third party. A significant uninsured property or liability loss could have a material adverse effect on our business and our financial condition and results of operations. We may incur costs due to environmental contamination or non-compliance. Under various federal, state and local environmental and public health laws, regulations and ordinances, we may be required, regardless of knowledge or responsibility, to investigate and remediate the effects of hazardous or toxic substances or petroleum product releases at our properties (including in some cases natural substances such as methane and radon gas) and may be held liable under these laws or common law to a governmental entity or to third parties for property, personal injury or natural resources damages and for investigation and remediation costs incurred as a result of the contamination. These damages and costs may be substantial and may exceed any insurance coverage we have for such events. The presence of these substances, or the failure to properly remediate the contamination, may adversely affect our ability to borrow against, develop, sell or rent the affected property. In addition, some environmental laws create or allow a government agency to impose a lien on the contaminated site in favor of the government for damages and costs it incurs as a result of the contamination. The development, construction and operation of our communities are subject to regulations and permitting under various federal, state and local laws, regulations and ordinances, which regulate matters including wetlands protection, storm water runoff and wastewater discharge. These laws and regulations may impose restrictions on the manner in which our communities may be developed, and noncompliance with these laws and regulations may subject us to fines and penalties.
14

Table of Contents Certain federal, state and local laws, regulations and ordinances govern the removal, encapsulation or disturbance of asbestos containing materials (“ACMs”) when such materials are in poor condition or in the event of renovation or demolition of a building. These laws and the common law may impose liability for release of ACMs and may allow third parties to seek recovery from owners or operators of real properties for personal injury associated with exposure to ACMs. We are not aware that any ACMs were used in the construction of the communities we developed. ACMs were, however, used in the construction of a number of the communities that we have acquired. Although we implement an operations and maintenance program at each of the communities at which ACMs are detected, we may fail to adequately observe such program or a disturbance of ACMs may occur nevertheless, exposing us to liability. We are aware that some of our communities have lead paint and have implemented an operations and maintenance program at each of those communities. Environmental agencies and third parties may assert claims for remediation or personal injury based on the alleged actual or potential intrusion into buildings of chemical vapors from soils or groundwater underlying or in the vicinity of those buildings or on nearby properties. All of our stabilized operating communities, and all of the communities that we are currently developing, have been subjected to at least a Phase I or similar environmental assessment, which generally does not involve invasive techniques such as soil or groundwater sampling. These assessments, together with subsurface assessments conducted on some properties, have not revealed, and we are not otherwise aware of, any environmental conditions that we believe would have a material adverse effect on our business, assets, financial condition or results of operations. In connection with our ownership, operation and development of communities, from time to time we undertake substantial remedial action in response to the presence of subsurface or other contaminants, including contaminants in soil, groundwater and soil vapor beneath or affecting our buildings. In some cases, an indemnity exists upon which we may be able to rely if environmental liability arises from the contamination or remediation costs exceed estimates. There can be no assurance, however, that all necessary remediation actions have been or will be undertaken at our properties or that we will be indemnified, in full or at all, in the event that environmental liability arises. Mold growth may occur when excessive moisture accumulates in buildings or on building materials, particularly if the moisture problem remains undiscovered or is not addressed over a period of time. Certain molds may in some instances lead to adverse health effects, including allergic or other reactions. To help limit mold growth, we educate residents about the importance of adequate ventilation and request or require that they notify us when they see mold or excessive moisture. We have established procedures for promptly addressing and remediating mold or excessive moisture from apartment homes when we become aware of its presence regardless of whether we or the resident believe a health risk is presented. However, we cannot provide assurance that mold or excessive moisture will be detected and remediated in a timely manner. If a significant mold problem arises at one of our communities, we could be required to undertake a costly remediation program to contain or remove the mold from the affected community and could be exposed to other liabilities that may exceed any applicable insurance coverage. Additionally, we have occasionally been involved in developing, managing, leasing and operating various properties for third parties. Consequently, we may be considered to have been an operator of such properties and, therefore, potentially liable for removal or remediation costs or other potential costs which relate to the release or presence of hazardous or toxic substances or petroleum products at such properties. We cannot assure you that:
15
• the environmental assessments described above have identified all potential environmental liabilities;• no prior owner created any material environmental condition not known to us or the consultants who prepared the assessments;• no environmental liabilities have developed since the environmental assessments were prepared;• the condition of land or operations in the vicinity of our communities, such as the presence of underground storage tanks, will not affect the environmental condition
of our communities; • future uses or conditions, including, without limitation, changes in applicable environmental laws and regulations, will not result in the imposition of environmental
liability; and • no environmental liabilities will arise at communities that we have sold for which we may have liability.

Table of Contents Our success depends on key personnel whose continued service is not guaranteed. Our success depends in part on our ability to attract and retain the services of executive officers and other personnel. Our executive officers make important capital allocation decisions or recommendations to our Board of Directors from among the opportunities identified by our regional offices. There is substantial competition for qualified personnel in the real estate industry, and the loss of our key personnel could adversely affect the Company. Failure to qualify as a REIT would cause us to be taxed as a corporation, which would significantly reduce funds available for distribution to stockholders. If we fail to qualify as a REIT for federal income tax purposes, we will be subject to regular U.S. federal corporate income tax on our taxable income. In addition, unless we are entitled to relief under applicable statutory provisions, we would be ineligible to make an election for treatment as a REIT for the four taxable years following the year in which we lose our qualification. The additional tax liability resulting from the failure to qualify as a REIT would significantly reduce or eliminate the amount of funds available for distribution to our stockholders. Furthermore, we would no longer be required to make distributions to our stockholders. Thus, our failure to qualify as a REIT could also impair our ability to expand our business and raise capital, and would adversely affect the value of our common stock. We believe that we are organized and qualified as a REIT, and we intend to operate in a manner that will allow us to continue to qualify as a REIT. However, we cannot assure you that we are qualified as a REIT, or that we will remain qualified in the future. This is because qualification as a REIT involves the application of highly technical and complex provisions of the Code for which there are only limited judicial and administrative interpretations and involves the determination of a variety of factual matters and circumstances not entirely within our control. Our qualification as a REIT will depend on our satisfaction of certain asset, income, organizational, distribution, shareholder ownership and other requirements on a continuing basis. In addition, future legislation, new regulations, administrative interpretations or court decisions may significantly change the tax laws or the application of the tax laws with respect to qualification as a REIT for federal income tax purposes or the federal income tax consequences of this qualification. Even if we qualify as a REIT, we will be subject to certain federal, state and local taxes on our income and property and on taxable income that we do not distribute to our stockholders. In addition, we hold through our taxable REIT subsidiaries certain assets and engage in certain activities that a REIT could not engage in directly. We also use taxable REIT subsidiaries to hold certain assets that we believe would be subject to the 100% prohibited transaction tax if sold at a gain outside of a taxable REIT subsidiary or to engage in activities that generate non-qualifying REIT income. Our taxable REIT subsidiaries are subject to U.S. tax as regular corporations. The Archstone Acquisition increased the amount of assets held through our taxable REIT subsidiaries. Prospective investors are urged to consult with their tax advisors regarding the effects of recently enacted tax legislation and other legislative, regulatory and administrative developments. On December 22, 2017, H.R. 1, informally titled the Tax Cuts and Jobs Act (the “TCJA”), was enacted. The TCJA made major changes to the Code, including a number of provisions of the Code that affect the taxation of REITs and their stockholders. The long-term effect of the significant changes made by the TCJA remains uncertain, and additional administrative guidance will be required in order to fully evaluate the effect of many provisions. The effect of any technical corrections with respect to the TCJA could have an adverse effect on us or our stockholders or holders of our debt securities. The ability of our stockholders to control our policies and effect a change of control of our company is limited by certain provisions of our charter and bylaws and by Maryland law. There are provisions in our charter and bylaws that may discourage a third party from making a proposal to acquire us, even if some of our stockholders might consider the proposal to be in their best interests. These provisions include the following: Our charter authorizes our Board of Directors to issue up to 50,000,000 shares of preferred stock without stockholder approval and to establish the preferences and rights, including voting rights, of any series of preferred stock issued. The Board of Directors may issue preferred stock without stockholder approval, which could allow the Board to issue one or more classes or series of preferred stock that could discourage or delay a tender offer or a change in control.
16

Table of Contents To maintain our qualification as a REIT for federal income tax purposes, not more than 50% in value of our outstanding stock may be owned, directly or indirectly, by or for five or fewer individuals at any time during the last half of any taxable year. To maintain this qualification, and/or to address other concerns about concentrations of ownership of our stock, our charter generally prohibits ownership (directly, indirectly by virtue of the attribution provisions of the Code, or beneficially as defined in Section 13 of the Securities Exchange Act) by any single stockholder of more than 9.8% of the issued and outstanding shares of any class or series of our stock. In general, under our charter, pension plans and mutual funds may directly and beneficially own up to 15% of the outstanding shares of any class or series of stock. Under our charter, our Board of Directors may in its sole discretion waive or modify the ownership limit for one or more persons, but it is not required to do so even if such waiver would not affect our qualification as a REIT. These ownership limits may prevent or delay a change in control and, as a result, could adversely affect our stockholders' ability to realize a premium for their shares of common stock. As a Maryland corporation, we are subject to the provisions of the Maryland General Corporation Law. Maryland law imposes restrictions on some business combinations and requires compliance with statutory procedures before some mergers and acquisitions may occur, which may delay or prevent offers to acquire us or increase the difficulty of completing any offers, even if they are in our stockholders' best interests. In addition, other provisions of the Maryland General Corporation Law permit the Board of Directors to make elections and to take actions without stockholder approval (such as classifying our Board such that the entire Board is not up for re-election annually) that, if made or taken, could have the effect of discouraging or delaying a change in control. ITEM 1B. UNRESOLVED STAFF COMMENTS None.
17

Table of Contents ITEM 2. COMMUNITIES Our real estate investments consist primarily of current operating apartment communities, communities in various stages of development (“Development Communities”) and Development Rights (as defined below). Our current operating communities are further distinguished as Established Communities, Other Stabilized Communities, Lease-Up Communities, Redevelopment Communities and Unconsolidated Communities. While we generally establish the classification of communities on an annual basis, we intend to update the classification of communities during the calendar year to the extent that our plans with regard to the disposition or redevelopment of a community change during the year. The following is a description of each category:
Current Communities are categorized as Established, Other Stabilized, Lease-Up, Redevelopment or Unconsolidated according to the following attributes:
Development Communities are communities that are either currently under construction, or were under construction and completed during the fiscal year. These communities may be partially complete and operating. Development Rights are development opportunities in the early phase of the development process where we either have an option to acquire land or enter into a leasehold interest, where we are the buyer under a long-term conditional contract to purchase land, where we control the land through a ground lease or own land to develop a new community, or where we are the designated developer in a public-private partnership. We capitalize related pre-development costs incurred in pursuit of new developments for which we currently believe future development is probable.
We currently lease our corporate headquarters located in Arlington, Virginia, as well as our other regional and administrative offices under operating leases.
18
• Established Communities (also known as Same Store Communities) are consolidated communities in the markets where we have a significant presence (New England, New York/New Jersey, Mid-Atlantic, Pacific Northwest, and Northern and Southern California) and where a comparison of operating results from the prior year to the current year is meaningful, as these communities were owned and had stabilized occupancy as of the beginning of the respective prior year. The Established Communities for the year ended December 31, 2018 are communities that are consolidated for financial reporting purposes, had stabilized occupancy as of January 1, 2017, are not conducting or planning to conduct substantial redevelopment activities, and are not held for sale or planned for disposition within the fiscal year. A community is considered to have stabilized occupancy at the earlier of (i) attainment of 95% physical occupancy or (ii) the one-year anniversary of completion of development or redevelopment.
• Other Stabilized Communities are all other completed consolidated communities that have stabilized occupancy, as defined above, as January 1, 2018, or which were acquired during the year ended December 31, 2018. Other Stabilized Communities includes stabilized operating communities in our expansion markets of Denver, Colorado, and Southeast Florida, but excludes communities that are conducting or planning to conduct substantial redevelopment activities within the fiscal year.
• Lease-Up Communities are consolidated communities where construction has been complete for less than one year and where physical occupancy has not reached 95%.
• Redevelopment Communities are consolidated communities where substantial redevelopment is in progress or is planned to begin during the fiscal year. Redevelopment is considered substantial when capital invested during the reconstruction effort is expected to exceed the lesser of $5,000,000 or 10% of the community's pre-redevelopment basis and is expected to have a material impact on the operations of the community, including occupancy levels and future rental rates.
• Unconsolidated Communities are communities that we have an indirect ownership interest in through our investment interest in an unconsolidated entity.

Table of Contents As of December 31, 2018, communities that we owned or held a direct or indirect interest in were classified as follows:
_________________________________
Our holdings under each of the above categories are discussed on the following pages.
19
Number of
communities Number of
apartment homes
Current Communities
Established Communities: New England 35 8,301 Metro NY/NJ 35 10,389 Mid-Atlantic 28 9,274 Pacific Northwest 14 3,256 Northern California 36 10,798 Southern California 46 12,883
Total Established 194 54,901
Other Stabilized Communities: New England 4 1,164 Metro NY/NJ 9 2,363 Mid-Atlantic 7 2,593 Pacific Northwest 2 860 Northern California 4 1,111 Southern California 9 3,220 Expansion Markets 5 1,408 Non-Core 3 1,014
Total Other Stabilized 43 13,733
Lease-Up Communities 9 2,608
Redevelopment Communities 9 3,648
Unconsolidated Communities 15 3,659
Total Current Communities 270 78,549
Development Communities (1) 21 6,609
Total Communities 291 85,158
Development Rights 28 9,769
(1) Development Communities excludes the development of 15 West 61st Street, expected to contain 172 residential units and 67,000 square feet of retail space. We are pursuing a potential for-sale strategy of individual condominium units for the residential portion, while we would maintain ownership of the retail portion.

Table of Contents We generally establish the composition of our Established Communities portfolio annually. Changes in the Established Communities portfolios for the years ended December 31, 2018, 2017 and 2016 were as follows:
_________________________________
Current Communities Our Current Communities include garden-style apartment communities consisting of multi-story buildings of stacked flats and/or townhome apartments in landscaped settings, as well as mid and high rise apartment communities consisting of larger elevator-served buildings of four or more stories, frequently with structured parking. As of January 31, 2019, our Current Communities consisted of the following:
20
Number of
communities
Established Communities as of December 31, 2015 177 Communities added 25 Communities removed (1):
Redevelopment Communities (3 )
Disposed Communities (6 )
Communities with multiple phases combined (2 )
Established Communities as of December 31, 2016 191 Communities added 17 Communities removed (1):
Redevelopment Communities (10 )
Disposed Communities (6 )
Other Stabilized (2) (1 )
Communities with multiple phases combined (1 )
Established Communities as of December 31, 2017 190 Communities added 25 Communities removed (1):
Redevelopment Communities (9 )
Disposed Communities (3) (13 )
Other Stabilized (2) (1 )
Communities with multiple phases separated 2
Established Communities as of December 31, 2018 194
(1) We remove a community from our Established Communities portfolio if we believe that planned activity for a community for the upcoming year will result in that community's expected operations not being comparable to the prior year period. We believe that a community's expected operations will not be comparable to the prior year period when we intend either (i) to undertake a significant capital renovation of the community, such that we would consider the community to be classified as a Redevelopment Community; (ii) to dispose of a community through a sale or other disposition transaction; or (iii) when a significant casualty loss occurs.
(2) Community was moved from the Established Communities portfolio to the Other Stabilized portfolio as a result of a casualty loss that occurred during the year and impacted operations.
(3) Includes the five wholly-owned communities contributed to the NYC Joint Venture.
Number of
communities Number of
apartment homes
Garden-style 131 39,699 Mid-rise 110 30,296 High-rise 28 8,370
Total Current Communities 269 78,365

Table of Contents As discussed in Item 1. “Business,” we operate under three core brands Avalon, AVA and Eaves by Avalon. We believe that this branding differentiation allows us to target our product offerings to multiple customer groups and submarkets within our existing geographic footprint. Our core “Avalon” brand focuses on upscale apartment living and high end amenities and services. “AVA” targets customers in high energy, transit-served urban neighborhoods and generally feature smaller apartments, many of which are designed for roommate living with an emphasis on modern design and a technology focus. “Eaves by Avalon” is targeted to the cost conscious, “value” segment in suburban areas. We believe that these brands allow us to further penetrate our existing markets by targeting our market by consumer preference and attitude as well as by location and price. We also have an extensive and ongoing maintenance program to continually maintain and enhance our communities and apartment homes. The aesthetic appeal of our communities and a service-oriented property management team, focused on the specific needs of residents, enhances market appeal to discriminating residents. We believe our mission of Creating a Better Way To Live helps us achieve higher rental rates and occupancy levels while minimizing resident turnover and operating expenses. Our Current Communities are located in the following geographic markets:
21
Number of
communities at Number of
apartment homes at Percentage of total
apartment homes at
1/31/2018 1/31/2019 1/31/2018 1/31/2019 1/31/2018 1/31/2019
New England 50 47 12,392 11,846 15.9 % 15.1 %
Boston, MA 40 37 10,422 9,876 13.4 % 12.6 %
Fairfield, CT 10 10 1,970 1,970 2.5 % 2.5 %
Metro NY/NJ 51 54 14,470 15,279 18.6 % 19.5 %
New York City, NY 13 14 4,909 5,089 6.3 % 6.5 %
New York Suburban 18 19 4,419 4,573 5.7 % 5.8 %
New Jersey 20 21 5,142 5,617 6.6 % 7.2 %
Mid-Atlantic 40 41 14,461 14,380 18.6 % 18.4 %
Washington Metro/Baltimore, MD 40 41 14,461 14,380 18.6 % 18.4 %
Pacific Northwest 18 17 4,669 4,538 6.0 % 5.8 %
Seattle, WA 18 17 4,669 4,538 6.0 % 5.8 %
Northern California 41 42 12,222 12,548 15.8 % 16.0 %
San Jose, CA 12 12 4,713 4,713 6.1 % 6.0 %
Oakland-East Bay, CA 13 13 3,847 3,847 5.0 % 4.9 %
San Francisco, CA 16 17 3,662 3,988 4.7 % 5.1 %
Southern California 62 60 17,764 17,352 23.0 % 22.1 %
Los Angeles, CA 40 40 11,916 11,916 15.4 % 15.2 %
Orange County, CA 13 12 3,621 3,370 4.7 % 4.3 %
San Diego, CA 9 8 2,227 2,066 2.9 % 2.6 %
Expansion markets 2 5 622 1,408 0.8 % 1.8 %
Denver, CO 1 3 252 748 0.3 % 1.0 %
Southeast Florida 1 2 370 660 0.5 % 0.8 %
Non-Core 3 3 1,014 1,014 1.3 % 1.3 %
267 269 77,614 78,365 100.0 % 100.0 %
Table of Contents We manage and operate substantially all of our Current Communities. During the year ended December 31, 2018, we completed construction of seven communities containing 1,915 apartment homes, one of which was developed through an unconsolidated joint venture, and sold 10 operating communities containing an aggregate of 2,321 apartment homes, as well as the five communities contributed to the NYC Joint Venture. The average age of our Current Communities, on a weighted average basis according to number of apartment homes, is 19.2 years. When adjusted to reflect redevelopment activity, as if redevelopment were a new construction completion date, the weighted average age of our Current Communities is 9.9 years. Of the Current Communities, as of January 31, 2019, we owned (directly or through wholly-owned subsidiaries):
We also hold, directly or through wholly-owned subsidiaries, the full fee simple ownership interest in our Development Communities, as well as a mixed-use project currently being developed in which we are pursuing a potential for-sale strategy of individual condominium units. In our partnership structured as a DownREIT, one of our wholly-owned subsidiaries is the general partner, and there are limited partners whose interest in the partnership is represented by units of limited partnership interest. Limited partners are entitled to receive an initial distribution before any distribution is made to the general partner. Under the partnership agreement for the DownREIT, the distributions per unit paid to the holders of units of limited partnership interests are equal to our current common stock dividend amount. The holders of units of limited partnership interest have the right to present all or some of their units for redemption for a cash amount as determined by the partnership agreement and based on the fair value of our common stock. In lieu of a cash redemption by the partnership, we may elect to acquire any unit presented for redemption for one share of our common stock or for such cash amount. As of January 31, 2019, there were 7,500 DownREIT partnership units outstanding. The DownREIT partnership is consolidated for financial reporting purposes. Development Communities As of December 31, 2018, we owned or held a direct or indirect interest in 21 Development Communities under construction. We expect these Development Communities, when completed, to add a total of 6,609 apartment homes and 87,000 square feet of retail space to our portfolio for a total capitalized cost, including land acquisition costs, of approximately $2,383,000,000. Additionally, we are pursuing a potential for-sale strategy of individual condominium units for the residential portion of the 15 West 61st Street development, which is currently under construction and when completed is expected to contain 172 residential units and 67,000 square feet of retail space for a total capitalized cost of $620,000,000. We currently intend to own and operate the retail portion of the development. We cannot assure you that we will meet our schedule for construction completion or that we will meet our budgeted costs, either individually, or in the aggregate. You should carefully review Item 1A. “Risk Factors” for a discussion of the risks associated with development activity and our discussion under Item 7. “Management's Discussion and Analysis of Financial Condition and Results of Operations” (including the factors identified under “Forward-Looking Statements”) for further discussion of development activity. The following table presents a summary of the Development Communities. We hold a fee simple ownership interest in these communities (directly or through a wholly-owned subsidiary) unless otherwise noted in the table.
22
• 252 operating communities, including 241 with a full fee simple, or absolute, ownership interest and 11 that are on land subject to a land lease. The land leases have various expiration dates from October 2026 to March 2142, and six of the land leases are used to support tax advantaged structures that ultimately allow us to purchase the land upon lease expiration.
• A general partnership interest and an indirect limited partnership interest in Archstone Multifamily Partners AC LP (the “U.S. Fund”), Multifamily Partners AC JV LP (the “AC JV”) and North Point II JV, LP, subsidiaries of which own five, two and one operating communities, respectively. One community owned by the U.S. Fund is subject to a land lease.
• A membership interest in four limited liability companies, one of which, the NYC Joint Venture, through subsidiaries owns a fee simple interest in three operating communities and a leasehold interest in two additional operating communities, and three ventures that each hold a fee simple interest in an operating community.
• A general partnership interest in one partnership structured as a “DownREIT,” as described more fully below, that owns one community.

Table of Contents
_________________________________
23
Number of apartment
homes
Projected total capitalized cost (1)
($ millions) Construction
start
Initial actual/ projected
occupancy (2) Estimated
completion Estimated
stabilization (3)
1.
Avalon Boonton Boonton, NJ
350
$ 91
Q3 2016
Q1 2019
Q1 2020
Q3 2020
2.
Avalon Belltown Towers (4) Seattle, WA
273
147
Q4 2016
Q2 2019
Q4 2019
Q2 2020
3.
Avalon Public Market Emeryville, CA
289
163
Q4 2016
Q2 2019
Q4 2019
Q2 2020
4.
Avalon Teaneck Teaneck, NJ
248
73
Q4 2016
Q3 2019
Q1 2020
Q3 2020
5.
AVA Hollywood (4) Hollywood, CA
695
365
Q4 2016
Q3 2019
Q3 2020
Q1 2021
6.
AVA Esterra Park Redmond, WA
323
91
Q2 2017
Q4 2018
Q3 2019
Q1 2020
7.
Avalon at the Hingham Shipyard II Hingham, MA
190
65
Q2 2017
Q3 2018
Q2 2019
Q4 2019
8.
Avalon Piscataway Piscataway, NJ
360
90
Q2 2017
Q3 2018
Q2 2019
Q4 2019
9.
Avalon Sudbury Sudbury, MA
250
85
Q3 2017
Q2 2018
Q2 2019
Q3 2019
10.
Avalon Towson Towson, MD
371
114
Q4 2017
Q1 2020
Q4 2020
Q2 2021
11.
Avalon Yonkers Yonkers, NY
590
188
Q4 2017
Q3 2019
Q2 2021
Q3 2021
12.
Avalon Walnut Creek II Walnut Creek, CA
200
109
Q4 2017
Q4 2019
Q2 2020
Q4 2020
13.
Avalon North Creek Bothell, WA
316
84
Q4 2017
Q2 2019
Q1 2020
Q3 2020
14.
Avalon Saugus (4) Saugus, MA
280
93
Q2 2018
Q2 2019
Q1 2020
Q3 2020
15.
Avalon Doral Doral, FL
350
111
Q2 2018
Q2 2020
Q1 2021
Q3 2021
16.
Avalon Norwood Norwood, MA
198
61
Q2 2018
Q3 2019
Q1 2020
Q3 2020
17.
Avalon Harbor East Baltimore, MD
400
139
Q3 2018
Q4 2020
Q3 2021
Q1 2022
18.
Avalon Old Bridge Old Bridge, NJ
252
66
Q3 2018
Q1 2020
Q3 2020
Q1 2021
19.
Avalon Newcastle Commons II Newcastle, WA
293
106
Q4 2018
Q3 2020
Q1 2021
Q3 2021
20.
Twinbrook Station Rockville, MD
238
66
Q4 2018
Q2 2020
Q4 2020
Q1 2021
21.
Avalon Harrison (4)(5) Harrison, NY
143
76
Q4 2018
Q3 2020
Q3 2021
Q4 2021
Total (6) 6,609 $ 2,383
(1) Projected total capitalized cost includes all capitalized costs projected to be or actually incurred to develop the respective Development Community, determined in accordance with GAAP, including land acquisition costs, construction costs, real estate taxes, capitalized interest and loan fees, permits, professional fees, allocated development overhead and other regulatory fees, as well as costs incurred for first generation retail tenants such as tenant improvements and leasing commissions. Projected total capitalized cost for communities identified as having joint venture ownership, either during construction or upon construction completion, represents the total projected joint venture contribution amount unless otherwise noted.
(2) Initial projected occupancy dates are estimates. There can be no assurance that we will pursue to completion any or all of these proposed developments.
(3) Stabilized operations is defined as the earlier of (i) attainment of 95% or greater physical occupancy or (ii) the one-year anniversary of completion of development.
(4) Developments containing at least 10,000 square feet of retail space include Avalon Belltown Towers (11,000 square feet), AVA Hollywood (19,000 square feet), Avalon Saugus (23,000 square feet), and Avalon Harrison (27,000 square feet).
(5) We signed a land disposition and development agreement with the transportation authorities controlling such property relating to the development of this community. During the fourth quarter of 2018, all internal Company approvals were given to authorize the commitment of funds for the construction of this community.

Table of Contents
During the year ended December 31, 2018, the Company completed the development of the following communities:
____________________________________
Redevelopment Communities As of December 31, 2018, we had nine communities under redevelopment. We expect the total capitalized cost to redevelop these communities to be $177,000,000, excluding costs incurred prior to redevelopment. We have found that the cost to redevelop an existing apartment community is more difficult to budget and estimate than the cost to develop a new community. Accordingly, we expect that actual costs may vary from our budget by a wider range than for a new Development Community. We cannot assure you that we will meet our schedule for reconstruction completion or for attaining restabilized operations, or that we will meet our budgeted costs, either individually or in the aggregate. We anticipate maintaining or increasing our current level of redevelopment activity related to communities in our current operating portfolio. In addition, during 2018, we completed the reconstruction of the building that was destroyed in the Edgewater casualty loss in 2015. The new Edgewater building contains 240 apartment homes and was reconstructed for a total capitalized cost of $61,000,000, excluding costs incurred prior to the start of reconstruction. You should carefully review Item 1A. “Risk Factors” for a discussion of the risks associated with redevelopment activity.
24
(6) Development Communities excludes 15 West 61st Street, which is currently under construction. 15 West 61st Street is expected to contain 172 residential units and 67,000 square feet of retail space when completed and is expected to be developed for an estimated total capitalized cost of $620 million. We are currently pursuing a potential for-sale strategy of individual condominium units for the residential portion and currently intend to own and operate the retail portion of the development, both of which are expected to complete construction during 2019.
Number of apartment
homes
Total capitalized cost (1)
($ millions)
Approximate rentable area
(sq. ft.)
Total capitalized cost per sq.
ft. Quarter of completion
1.
AVA NoMa Washington, D.C.
438
$ 144
373,828
$ 385
Q1 2018
2.
Avalon Brooklyn Bay (2) Brooklyn, NY
180
97
149,881
$ 647
Q1 2018
3.
Avalon Somers Somers, NY
152
46
179,401
$ 256
Q1 2018
4.
AVA Wheaton Wheaton, MD
319
76
268,953
$ 283
Q2 2018
5.
Avalon Maplewood (3) Maplewood, NJ
235
65
209,628
$ 310
Q2 2018
6.
Avalon Dogpatch San Francisco, CA
326
204
262,478
$ 777
Q3 2018
7.
AVA North Point (4) Cambridge, MA
265
110
226,912
$ 485
Q3 2018
Total 1,915 $ 742
(1) Total capitalized cost is as of December 31, 2018. We generally anticipate incurring additional costs associated with these communities that are customary for new developments.
(2) We developed this project with a private development partner. We own the rental portion of the development on floors 3 through 19 and the partner owns the for-sale condominium portion of the development on floors 20 through 30. The information above represents only our portion of the project. We provided a construction loan to the development partner, which is being repaid with proceeds the partner receives from the sale of the condominium portion of the project. The balance as of December 31, 2018 was $12.8 million, representing outstanding principal and interest, net of repayments, as discussed in Note 5, “Investments in Real Estate Entities,” of the Consolidated Financial Statements set forth in Item 8 of this report.
(3) In February 2017, a fire occurred at Avalon Maplewood. See "Insurance and Risk of Uninsured Losses" for further discussion.
(4) We developed this project within an unconsolidated joint venture that was formed in July 2016, in which we own a 55.0% interest. The information above represents the total cost for the venture.

Table of Contents The following presents a summary of these Redevelopment Communities:
____________________________________
Development Rights At December 31, 2018, we had $84,712,000 in acquisition and related capitalized costs for direct interests in land parcels we own, and $47,443,000 in capitalized costs (including legal fees, design fees and related overhead costs) related to Development Rights for which we control the land parcel, typically through a conditional agreement or option to purchase or lease the land. Collectively, the land held for development and associated costs for deferred development rights relate to 28 Development Rights for which we expect to develop new apartment communities in the future. The cumulative capitalized costs for land held for development as of December 31, 2018 includes $74,342,000 in original land acquisition costs, net of any impairment loss recognized. The Development Rights range from those beginning design and architectural planning to those that have completed site plans and drawings and can begin construction almost immediately. We estimate that the successful completion of all of these communities would ultimately add approximately 9,769 apartment homes to our portfolio. Substantially all of these apartment homes will offer features like those offered by the communities we currently own. For 21 Development Rights, we control the land through a conditional agreement or option to purchase or lease the parcel. While we generally prefer to hold Development Rights through conditional agreements or options to acquire land, for one Development Right we currently own the land on which a community would be built if we proceeded with development. In addition, six Development Rights are additional development phases of existing stabilized operating communities we own and will be constructed on land currently associated with, or adjacent to, those operating communities. During the next 12 months we expect to commence construction of an apartment community on the Development Right for which we currently own the land, with a carrying basis of $84,712,000.
25
Number of apartment
homes
Projected total capitalized cost
($ millions) (1)(2) Reconstruction
start
Estimated reconstruction completion (2)
Estimated restabilized
operations (3)
1.
Avalon Prudential Center II Boston, MA
266
$ 19
Q1 2017
Q4 2019
Q2 2020
2.
AVA Van Ness Washington, D.C.
269
20
Q3 2017
Q1 2019
Q3 2019
3.
Avalon Ballston Square Arlington, VA
714
25
Q4 2017
Q2 2019
Q4 2019
4.
Eaves Seal Beach Seal Beach, CA
549
32
Q1 2018
Q4 2019
Q2 2020
5.
Eaves Redmond Campus Redmond, WA
422
24
Q1 2018
Q2 2019
Q4 2019
6.
Eaves Fairfax Towers Falls Church, VA
415
14
Q1 2018
Q4 2019
Q2 2020
7.
Avalon Prudential Center I Boston, MA
243
18
Q1 2018
Q1 2020
Q3 2020
8.
Avalon Court Melville, NY
494
15
Q1 2018
Q3 2019
Q1 2020
9.
Avalon Studio City Studio City, CA
276
10
Q2 2018
Q1 2019
Q3 2019
Total 3,648 $ 177
(1) Projected total capitalized cost does not include capitalized costs incurred prior to redevelopment.
(2) Projected total capitalized costs represent the aggregate of any multiple phase redevelopments and the estimated reconstruction completion dates reflect all planned phases.
(3) Estimated restabilized operations is defined as the earlier of (i) attainment of 95% or greater physical occupancy or (ii) the one-year anniversary of completion of redevelopment.

Table of Contents The properties comprising the Development Rights are in different stages of the due diligence and regulatory approval process. The decisions as to which of the Development Rights to invest in, if any, or to continue to pursue once an investment in a Development Right is made, are business judgments that we make after we perform financial, demographic and other analyses. In the event that we do not proceed with a Development Right, we generally would not recover any of the capitalized costs incurred in the pursuit of those communities, unless we were to recover amounts in connection with the sale of land; however, we cannot guarantee a recovery. Pre-development costs incurred in the pursuit of Development Rights, for which future development is not yet considered probable, are expensed as incurred. In addition, if the status of a Development Right changes, making future development no longer probable, any capitalized pre-development costs are charged to expense. During 2018, we incurred a charge of $4,309,000 for development pursuits that were not yet probable of future development at the time incurred, or for pursuits that we determined were no longer probable of being developed. You should carefully review Item 1A. “Risk Factors,” for a discussion of the risks associated with Development Rights. The following presents a summary of the Development Rights:
____________________________________
Land Acquisitions We select land for development and follow established procedures that we believe minimize both the cost and the risks of development. During 2018, we acquired land parcels for seven Development Rights, as shown in the table below, for an aggregate investment of $140,563,000. For all of the parcels, construction has either started or is expected to start within the next six months.
26
Market Number of rights Estimated
number of homes
Projected total capitalized cost ($ millions) (1)
New England 6 1,233 $ 446 Metro NY/NJ 8 3,955 1,710 Mid-Atlantic 1 437 99 Pacific Northwest 2 552 169 Northern California 5 1,543 829 Southern California 4 1,444 677 Denver 2 605 194
Total 28 9,769 $ 4,124
(1) Projected total capitalized cost includes all capitalized costs incurred to date (if any) and projected to be incurred to develop the respective community, determined in accordance with GAAP, including land acquisition costs, construction costs, real estate taxes, capitalized interest and loan fees, permits, professional fees, allocated development overhead and other regulatory fees, as well as costs incurred for first generation retail tenants such as tenant improvements and leasing commissions.

Table of Contents
____________________________________
Disposition Activity We sell assets when they do not meet our long-term investment strategy or when real estate markets allow us to realize a portion of the value created over our periods of ownership, and we generally redeploy the proceeds from those sales to develop, redevelop and acquire communities. Pending such redeployment, we will generally use the proceeds from the sale of these communities to reduce amounts outstanding under our Credit Facility or retain the cash proceeds on our balance sheet until it is redeployed into acquisition, development or redevelopment activity. On occasion, we will set aside the proceeds from the sale of communities into a cash escrow account to facilitate a tax deferred, like-kind exchange transaction. From January 1, 2018 to January 31, 2019, we sold our interest in nine wholly-owned operating communities, containing 1,982 apartment homes, with an aggregate gross sales price of $688,750,000, excluding the five wholly-owned operating communities contributed to the NYC Joint Venture. Insurance and Risk of Uninsured Losses We maintain commercial general liability insurance and property insurance with respect to all of our communities. These policies, along with other insurance policies we maintain, have policy specifications, insured and self-insured limits, exclusions and deductibles that we consider commercially reasonable. There are, however, certain types of losses (including, but not limited to, losses arising from nuclear liability or acts of war) that are not insured, in full or in part, because they are either uninsurable or the cost of insurance makes it, in management’s view, economically impractical. You should carefully review the discussion under Item 1A. “Risk Factors” of this Form 10-K for a discussion of risks associated with an uninsured property or casualty loss. Many of our West Coast communities are located in the general vicinity of active earthquake faults. Many of our communities are near, and thus susceptible to, the major fault lines in California, including the San Andreas Fault, the Hayward Fault or other geological faults that are known or unknown. We cannot assure you that an earthquake would not cause damage or losses greater than our current insured levels. We procure property damage and resulting business interruption insurance coverage with a loss limit of $175,000,000 for any single occurrence and in the annual aggregate for losses resulting from earthquakes. However, for any losses resulting from earthquakes at communities located in California or Washington, the loss limit is $150,000,000 for any single occurrence and in the annual aggregate. The deductible applicable to losses resulting from earthquakes occurring in California is five percent of the insured value of each damaged building subject to a minimum of $100,000 and a maximum of $25,000,000 per loss. Limits, deductibles, self-insured retentions and coverages may increase or decrease annually during the insurance renewal process which occurs on different dates throughout the calendar year.
27
Estimated number of apartment
homes
Projected total capitalized
cost (1) ($ millions)
Date acquired
1.
Avalon Yonkers (2) Yonkers, NY
590
$ 188
January 2018
2.
Avalon Norwood Norwood, MA
198
61
January 2018
3.
Avalon Public Market (2) Emeryville, CA
289
163
February 2018
4.
Avalon Brea Place Brea. CA
653
284
February and May 2018
5.
Avalon Towson Towson, MD
371
114
March 2018
6.
Avalon Doral Doral, FL
350
111
May 2018
7.
Avalon Old Bridge Old Bridge, NJ
252
66
October 2018
Total 2,703 $ 987
(1) Projected total capitalized cost includes all capitalized costs incurred to date (if any) and projected to be incurred to develop the respective community, determined in accordance with GAAP, including land and related acquisition costs, construction costs, real estate taxes, capitalized interest and loan fees, permits, professional fees, allocated development overhead and other regulatory fees, as well as costs incurred for first generation retail tenants such as tenant improvements and leasing commissions, net of projected proceeds for any planned sales of associated outparcels and other real estate.
(2) Additional parcel of land acquired in 2018 for a current Development Community. The estimated number of apartment homes and projected total capitalized cost represent the amounts for the full Development Community.

Table of Contents Our communities are insured for certain property damage and business interruption losses through a combination of community specific insurance policies and/or a master property insurance program which covers the majority of our communities. This master property program provides a $400,000,000 limit for any single occurrence, subject to certain sublimits and exclusions. Under the master property program, we are subject to a $100,000 deductible per occurrence, as well as additional self-insured retention for the next $350,000 of loss, per occurrence, until the aggregate incurred self-insured retention exceeds $1,500,000 for the policy year. Our communities are insured for third-party liability losses through a combination of community specific insurance policies and/or coverage provided under a master commercial general liability and umbrella/excess insurance program. The master commercial general liability and umbrella/excess insurance policies cover the majority of our communities and are subject to certain coverage limitations and exclusions, and they require a self-insured retention of $500,000 per occurrence. We also maintain certain casualty policies (general liability, umbrella/excess and workers compensation) for construction related risks which have various exclusions and deductibles that, in management’s view, are commercially reasonable. Certain projects are insured through our master insurance policies while others are insured through project-specific insurance policies. The limits vary by project and may be subject to deductibles up to $1,500,000 per occurrence. We utilize a wholly-owned captive insurance company to insure certain types and amounts of risks, which includes property damage and resulting business interruption losses, general liability insurance and other construction related liability risks. In addition to our potential liability for the various policy self-insured retentions and deductibles, our captive insurance company is directly responsible for (i) 25% of the first $50,000,000 of losses (per occurrence) incurred by the master property insurance policy and (ii) covered liability claims arising out of our commercial general liability policy, subject to a $2,000,000 per occurrence loss limit. The captive is utilized to insure other limited levels of risk, which may be in part reinsured by third party insurance. Just as with office buildings, transportation systems and government buildings, there have been reports that apartment communities could become targets of terrorism. Our communities are insured for terrorism related losses through the Terrorism Risk Insurance Program Reauthorization Act (“TRIPRA”) program. This coverage extends to most of our casualty exposures (subject to deductibles and insured limits) and certain property insurance policies. We have also purchased private-market insurance for property damage due to terrorism with limits of $600,000,000 per occurrence and in the annual aggregate that includes certain coverages (not covered under TRIPRA) such as domestic-based terrorism. This insurance, often referred to as “non-certified” terrorism insurance, is subject to deductibles, limits and exclusions. An additional consideration for insurance coverage and potential uninsured losses is mold growth or other environmental contamination. Mold growth may occur when excessive moisture accumulates in buildings or on building materials, particularly if the moisture problem remains undiscovered or is not addressed over a period of time. If a significant mold problem arises at one of our communities, we could be required to undertake a costly remediation program to contain or remove the mold from the affected community and could be exposed to other liabilities. For further discussion of the risks and our related prevention and remediation activities, please refer to the discussion under Item 1A. “Risk Factors - We may incur costs due to environmental contamination or non-compliance” elsewhere in this report. We cannot provide assurance that we will have coverage under our existing policies for property damage or liability to third parties arising as a result of exposure to mold or a claim of exposure to mold at one of our communities. We also carry crime policies (also commonly referred to as a fidelity policy or employee dishonesty policy) and limited cyber liability insurance. The crime policies protect us, up to $30,000,000 per occurrence (subject to sublimits and exclusions), from employee theft of money, securities or property. The limited cyber liability insurance is part of our professional liability coverage and has limits of $15,000,000 per occurrence and in the annual aggregate. The cyber liability coverage protects us from certain claims arising out of data breach, wrongful acts, data privacy issues and media liability. The amount or types of insurance we maintain may not be sufficient to cover all losses. Maplewood Casualty Loss In February 2017, a fire occurred at Avalon Maplewood, located in Maplewood, NJ ("Maplewood"), which at the time was under construction and not yet occupied. The Company completed reconstruction of the damaged and destroyed portions of the community as well as the vertical construction of the community in 2018. In 2017, we reached a final insurance settlement for the property damage and lost income for the Maplewood casualty loss of $19,696,000, after self-insurance and deductibles, of which $3,495,000 was recognized as business interruption insurance proceeds.
28

Table of Contents Edgewater Casualty Loss In January 2015, a fire occurred at our Avalon at Edgewater apartment community located in Edgewater, NJ (“Edgewater”). Edgewater consisted of two residential buildings. One building, containing 240 apartment homes, was destroyed. The second building, containing 168 apartment homes, suffered minimal damage and has been repaired. In January 2016, we reached a final settlement with our property and casualty insurers regarding the property damage and lost income related to the Edgewater casualty loss, for which we received aggregate insurance proceeds of $73,150,000, after self-insurance and deductibles. We received $44,142,000 of these recoveries in 2015, and the remaining $29,008,000 in 2016, of which $8,702,000 was recognized as an additional net casualty gain and $20,306,000 as business interruption insurance proceeds. In 2017, we commenced the reconstruction of the destroyed building, which we completed in 2018. To date, a number of lawsuits on behalf of former residents have been filed against us, including four class actions, approximately 23 individual actions, and subrogation actions by insurers who provided renters insurance to our residents. While we can give no assurances, we believe that any remaining liability will be covered by third party insurance and/or will not have a material impact on our statement of financial position or operations.
29

Table of Contents ITEM 3. LEGAL PROCEEDINGS As discussed immediately above, in January 2015, a fire occurred at the Company's Avalon at Edgewater apartment community in Edgewater, NJ. The Company believes that the fire was caused by sparks from a torch used during repairs being performed by a Company employee who was not a licensed plumber. The Company has since revised its maintenance policies to require that non-flame tools be used for plumbing repairs where possible or, where not possible inside the building envelope, that a qualified third party vendor perform the work in accordance with the Company's policies.
The Company has established protocols for processing claims from third parties who suffered losses as a result of the fire, and many third parties have contacted the Company's insurance carrier and settled their claims. Through the date of this Form 10-K, of the 229 occupied apartments destroyed in the fire, the residents of approximately 95 units have settled claims with the Company's insurer through this claims process.
With regard to the building that was destroyed, three class action lawsuits have been filed against the Company on behalf of occupants and consolidated in the United States District Court for the District of New Jersey. The Company has agreed with class counsel to the terms of a settlement which provides a claims process (with agreed upon protocols for instructing the adjuster as to how to evaluate claims) and, if needed, an arbitration process to determine damage amounts to be paid to individual claimants covered by the class settlement. In July 2017, the District Court granted final approval of the class action settlement and all claims have been submitted to the independent claims adjuster. A total of 66 units (consisting of residents who did not previously settle their claims and who did not opt out of the class settlement) are included in the class action settlement and bound by its terms. However, only approximately 45 units submitted claims. The independent claims adjuster is currently reviewing the claims submitted; the submitted claims total approximately $6,900,000 but, based on the Company's review of initial determinations made by the adjuster on a number of claims, the Company believes that the total amount actually awarded will be significantly less. To date, the claims adjuster completed its evaluation of 37 of these claims and it is expected that the evaluation of the remaining claims should be completed within the next month. In addition to the class action lawsuits described above, the Company has resolved litigated claims with tenants of approximately 60 units. There is currently one remaining resident lawsuit with respect to the destroyed building filed in the Superior Court of New Jersey, Bergen County - Law Division; the Company believes it has meritorious defenses to the extent of damages claimed in that suit. A number of subrogation lawsuits had been filed against the Company by insurers of Edgewater residents who obtained renters insurance; these lawsuits have been resolved or are expected to be resolved during the first quarter of 2019. A fourth class action, being heard in the same federal court, was filed against the Company on behalf of a purported class of residents of the second Edgewater building that suffered minimal damage; in October 2018, the court certified the class and the case will continue as a class action.
Having settled many third party claims as described above, while the Company can give no assurances, the Company currently believes that any potential remaining liability to third parties (including any potential liability to third parties determined in accordance with the class settlement described above) will not be material to the Company and will in any event be substantially covered by the Company's insurance policies. The Company is involved in various other claims and/or administrative proceedings unrelated to the Edgewater casualty loss that arise in the ordinary course of its business. While no assurances can be given, the Company does not currently believe that any of these other outstanding litigation matters, individually or in the aggregate, will have a material adverse effect on its financial condition or results of operations. ITEM 4. MINE SAFETY DISCLOSURES Not Applicable.
30

Table of Contents
PART II ITEM 5. MARKET FOR REGISTRANT'S COMMON EQUITY, RELATED STOCKHOLDER MATTERS AND ISSUER PURCHASES OF EQUITY SECURITIES Our common stock is traded on the NYSE under the ticker symbol AVB. On January 31, 2019 there were 476 holders of record of an aggregate of 138,508,567 shares of our outstanding common stock. The number of holders does not include individuals or entities who beneficially own shares but whose shares are held of record by a broker or clearing agency, but does include each such broker or clearing agency as one record holder. At present, we expect to continue our policy of paying regular quarterly cash dividends. However, the form, timing and/or amount of dividend distributions will be declared at the discretion of the Board of Directors and will depend on actual cash from operations, our financial condition, capital requirements, the annual distribution requirements under the REIT provisions of the Code and other factors as the Board of Directors may consider relevant. The Board of Directors may modify our dividend policy from time to time. In February 2019, we announced that our Board of Directors declared a dividend on our common stock for the first quarter of 2019 of $1.52 per share, a 3.4% increase over the previous quarterly dividend per share of $1.47. The dividend will be payable on April 15, 2019 to all common stockholders of record as of March 29, 2019. Issuer Purchases of Equity Securities
_________________________________
Information regarding securities authorized for issuance under equity compensation plans is included in the section entitled Item 12. “Security Ownership of Certain Beneficial Owners and Management and Related Stockholder Matters” in this Form 10-K.
31
Period
(a) Total Number
of Shares Purchased (1)
(b) Average
Price Paid per Share
(c) Total Number of
Shares Purchased as Part of Publicly
Announced Plans or Programs
(d) Maximum Dollar
Amount that May Yet be Purchased Under
the Plans or Programs (in thousands) (2)
October 1 - October 31, 2018 77 $ 172.79 — $ 200,000 November 1 - November 30, 2018 — $ — — $ 200,000 December 1 - December 31, 2018 525 $ 190.71 — $ 200,000
(1) Reflects shares surrendered to the Company in connection with exercise of stock options as payment of exercise price, as well as for taxes associated with the vesting of restricted share grants.
(2) As disclosed in our Form 10-Q for the quarter ended March 31, 2008, represents amounts outstanding under the Company's $500,000,000 Stock Repurchase Program. There is no scheduled expiration date to this program.
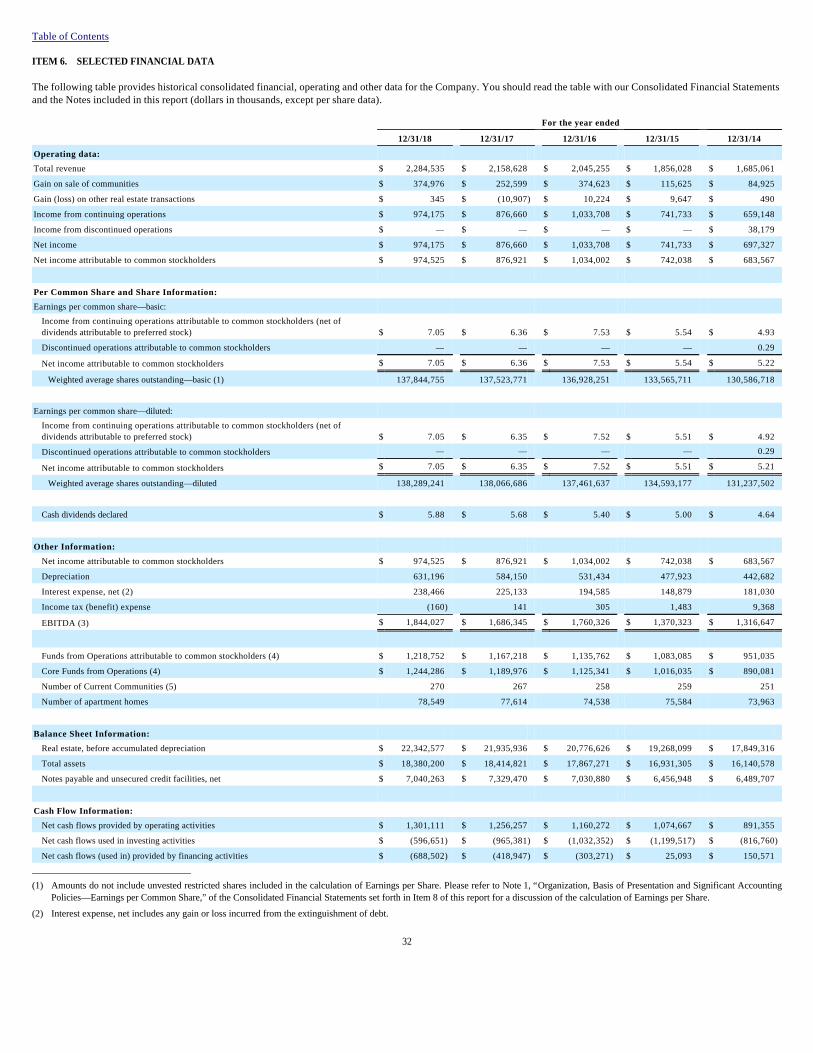
Table of Contents ITEM 6. SELECTED FINANCIAL DATA The following table provides historical consolidated financial, operating and other data for the Company. You should read the table with our Consolidated Financial Statements and the Notes included in this report (dollars in thousands, except per share data).
_________________________________
32
For the year ended
12/31/18 12/31/17 12/31/16 12/31/15 12/31/14
Operating data: Total revenue $ 2,284,535 $ 2,158,628 $ 2,045,255 $ 1,856,028 $ 1,685,061 Gain on sale of communities $ 374,976 $ 252,599 $ 374,623 $ 115,625 $ 84,925 Gain (loss) on other real estate transactions $ 345 $ (10,907) $ 10,224 $ 9,647 $ 490 Income from continuing operations $ 974,175 $ 876,660 $ 1,033,708 $ 741,733 $ 659,148 Income from discontinued operations $ — $ — $ — $ — $ 38,179 Net income $ 974,175 $ 876,660 $ 1,033,708 $ 741,733 $ 697,327 Net income attributable to common stockholders $ 974,525 $ 876,921 $ 1,034,002 $ 742,038 $ 683,567
Per Common Share and Share Information:
Earnings per common share—basic: Income from continuing operations attributable to common stockholders (net of dividends attributable to preferred stock) $ 7.05 $ 6.36 $ 7.53 $ 5.54 $ 4.93 Discontinued operations attributable to common stockholders — — — — 0.29 Net income attributable to common stockholders $ 7.05 $ 6.36 $ 7.53 $ 5.54 $ 5.22
Weighted average shares outstanding—basic (1) 137,844,755 137,523,771 136,928,251 133,565,711 130,586,718
Earnings per common share—diluted: Income from continuing operations attributable to common stockholders (net of dividends attributable to preferred stock) $ 7.05 $ 6.35 $ 7.52 $ 5.51 $ 4.92 Discontinued operations attributable to common stockholders — — — — 0.29
Net income attributable to common stockholders $ 7.05 $ 6.35 $ 7.52 $ 5.51 $ 5.21
Weighted average shares outstanding—diluted 138,289,241 138,066,686 137,461,637 134,593,177 131,237,502
Cash dividends declared $ 5.88 $ 5.68 $ 5.40 $ 5.00 $ 4.64
Other Information: Net income attributable to common stockholders $ 974,525 $ 876,921 $ 1,034,002 $ 742,038 $ 683,567 Depreciation 631,196 584,150 531,434 477,923 442,682 Interest expense, net (2) 238,466 225,133 194,585 148,879 181,030 Income tax (benefit) expense (160) 141 305 1,483 9,368 EBITDA (3) $ 1,844,027 $ 1,686,345 $ 1,760,326 $ 1,370,323 $ 1,316,647
Funds from Operations attributable to common stockholders (4) $ 1,218,752 $ 1,167,218 $ 1,135,762 $ 1,083,085 $ 951,035 Core Funds from Operations (4) $ 1,244,286 $ 1,189,976 $ 1,125,341 $ 1,016,035 $ 890,081 Number of Current Communities (5) 270 267 258 259 251 Number of apartment homes 78,549 77,614 74,538 75,584 73,963
Balance Sheet Information: Real estate, before accumulated depreciation $ 22,342,577 $ 21,935,936 $ 20,776,626 $ 19,268,099 $ 17,849,316 Total assets $ 18,380,200 $ 18,414,821 $ 17,867,271 $ 16,931,305 $ 16,140,578 Notes payable and unsecured credit facilities, net $ 7,040,263 $ 7,329,470 $ 7,030,880 $ 6,456,948 $ 6,489,707
Cash Flow Information: Net cash flows provided by operating activities $ 1,301,111 $ 1,256,257 $ 1,160,272 $ 1,074,667 $ 891,355 Net cash flows used in investing activities $ (596,651) $ (965,381) $ (1,032,352) $ (1,199,517) $ (816,760)
Net cash flows (used in) provided by financing activities $ (688,502) $ (418,947) $ (303,271) $ 25,093 $ 150,571
(1) Amounts do not include unvested restricted shares included in the calculation of Earnings per Share. Please refer to Note 1, “Organization, Basis of Presentation and Significant Accounting Policies—Earnings per Common Share,” of the Consolidated Financial Statements set forth in Item 8 of this report for a discussion of the calculation of Earnings per Share.
(2) Interest expense, net includes any gain or loss incurred from the extinguishment of debt.

Table of Contents
Reconciliation of Non-GAAP Financial Measures Funds from Operations attributable to common stockholders, or “FFO,” and FFO adjusted for non-core items, or “Core FFO,” as defined below, are generally considered by management to be appropriate supplemental measures of our operating and financial performance. In calculating FFO, we exclude gains or losses related to dispositions of previously depreciated property and exclude real estate depreciation, which can vary among owners of identical assets in similar condition based on historical cost accounting and useful life estimates. FFO can help one compare the operating performance of a real estate company between periods or as compared to different companies. By further adjusting for items that are not considered part of our core business operations, Core FFO allows one to compare the core operating performance of the Company year over year. We believe that in order to understand our operating results, FFO and Core FFO should be examined with net income as presented in the Consolidated Statements of Comprehensive Income included elsewhere in this report. Consistent with the definition adopted by the Board of Governors of the National Association of Real Estate Investment Trusts® (“NAREIT”), we calculate FFO as net income or loss attributable to common stockholders computed in accordance with GAAP, adjusted for:
We calculate Core FFO as FFO, adjusted for:
FFO and Core FFO do not represent net income in accordance with GAAP, and therefore should not be considered an alternative to net income, which remains the primary measure, as an indication of our performance. In addition, FFO and Core FFO as calculated by other REITs may not be comparable to our calculations of FFO and Core FFO.
33
(3) EBITDA is defined as net income before interest income and expense, income taxes, depreciation and amortization from both continuing and discontinued operations. Under this definition, EBITDA includes gains on sale of assets and gain on sale of partnership interests. Management generally considers EBITDA to be an appropriate supplemental measure to net income of our operating performance because it helps investors to understand our ability to incur and service debt and to make capital expenditures. EBITDA should not be considered as an alternative to net income (as determined in accordance with GAAP), as an indicator of our operating performance, or to cash flows from operating activities (as determined in accordance with GAAP) as a measure of liquidity. Our calculation of EBITDA may not be comparable to EBITDA as calculated by other companies.
(4) Refer to “Reconciliation of Non-GAAP Financial Measures” below.
(5) Current Communities consist of all communities other than those which are still under construction and for which a certificate or certificates of occupancy for the entire community have not been received.
• gains or losses on sales of previously depreciated operating communities;• cumulative effect of change in accounting principle; • impairment write-downs of depreciable real estate assets; • write-downs of investments in affiliates due to a decrease in the value of depreciable real estate assets held by those affiliates;• depreciation of real estate assets; and • adjustments for unconsolidated partnerships and joint ventures, including those from a change in control.
• joint venture gains (if not adjusted through FFO), non-core costs, and promoted interests;• casualty and impairment losses or gains, net on non-depreciable real estate;• gains or losses from early extinguishment of consolidated borrowings;• abandoned pursuits; • business interruption insurance proceeds and the related lost NOI that is covered by the business interruption insurance proceeds;• property and casualty insurance proceeds and legal settlements;• gains or losses on sales of assets not subject to depreciation;• hedge ineffectiveness; • severance related costs; • advocacy contributions; • income taxes; • expensed acquisition costs related to business acquisitions that occurred prior to the adoption of ASU 2017-01 as of October 1, 2016, as discussed in Note 1,
“Organization, Basis of Presentation and Significant Accounting Policies,” of the Consolidated Financial Statements set forth in Item 8 of this report; and • other non-core items.

Table of Contents FFO and Core FFO also do not represent cash generated from operating activities in accordance with GAAP, and therefore should not be considered an alternative to net cash flows from operating activities, as determined by GAAP, as a measure of liquidity. Additionally, it is not necessarily indicative of cash available to fund cash needs. A presentation of GAAP based cash flow metrics is provided in “Cash Flow Information” in the table above. The following is a reconciliation of net income attributable to common stockholders to FFO attributable to common stockholders and to Core FFO attributable to common stockholders (dollars in thousands, except per share data).
_________________________________
34
For the year ended
12/31/18 12/31/17 12/31/16 12/31/15 12/31/14
Net income attributable to common stockholders $ 974,525 $ 876,921 $ 1,034,002 $ 742,038 $ 683,567 Depreciation—real estate assets, including discontinued operations and joint venture adjustments 629,814 582,907 538,606 486,019 449,769 Distributions to noncontrolling interests, including discontinued operations 44 42 41 38 35 Gain on sale of unconsolidated entities holding previously depreciated real estate assets (10,655 ) (40,053 ) (58,069 ) (33,580 ) (73,674 )
Gain on sale of previously depreciated real estate assets (1) (374,976 ) (252,599 ) (374,623 ) (115,625 ) (108,662 )
Casualty and impairment (recovery) loss, net on real estate (2) (7) — — (4,195 ) 4,195 —
FFO attributable to common stockholders $ 1,218,752 $ 1,167,218 $ 1,135,762 $ 1,083,085 $ 951,035
Adjusting items: Joint venture losses (gains) (3) 852 950 6,031 (9,059 ) (5,194 )
Joint venture promote (4) (925 ) (26,742 ) (7,985 ) (21,969 ) (58,128 )
Impairment loss on real estate (5) (7) 826 9,350 10,500 800 — Casualty (gain) loss, net on real estate (6) (7) (612 ) (3,100 ) (10,239 ) (15,538 ) — Business interruption insurance proceeds (8) (26 ) (3,495 ) (20,565 ) (1,509 ) (2,494 )
Lost NOI from casualty losses covered by business interruption insurance (9) 1,730 7,904 7,366 7,862 — Loss (gain) on extinguishment of consolidated debt 17,492 25,472 7,075 (26,736 ) 412 Advocacy contributions 3,489 — — — — Hedge ineffectiveness — (753 ) — — — Severance related costs 1,466 87 852 1,999 815 Development pursuit and other write-offs 1,324 1,406 3,662 1,838 2,564 (Gain) loss on sale of other real estate transactions (344 ) 10,907 (10,224 ) (9,647 ) (490 )
Acquisition costs (10) — 92 3,523 3,806 (7,682 )
Legal settlements 513 680 (417 ) — — Income tax (benefit) expense (11) (251 ) — — 1,103 9,243
Core FFO attributable to common stockholders $ 1,244,286 $ 1,189,976 $ 1,125,341 $ 1,016,035 $ 890,081
Weighted average common shares outstanding - diluted 138,289,241 138,066,686 137,461,637 134,593,177 131,237,502
EPS per common share - diluted $ 7.05 $ 6.35 $ 7.52 $ 5.51 $ 5.21
FFO per common share - diluted $ 8.81 $ 8.45 $ 8.26 $ 8.05 $ 7.25
Core FFO per common share - diluted $ 9.00 $ 8.62 $ 8.19 $ 7.55 $ 6.78
(1) Amount for 2014 excludes a gain of $14,132, representing our joint venture partners' portion of the gain on sale from a Fund I community which we consolidated for financial reporting purposes.
(2) During 2015, we recognized an impairment on depreciable real estate of $4,195 from the severe winter storms that occurred in our Northeast markets. During 2016, we received insurance proceeds, net of additional costs incurred, of $5,732 related to the winter storms, and recognized $4,195 of this recovery as an offset to the loss recognized in the prior year period. The balance of the net insurance proceeds received in 2016 of $1,537 is recognized as a casualty gain and is included in the reconciliation of FFO to Core FFO.
(3) Amounts for 2018, 2017 and 2016 are primarily composed of (i) the write-off of asset management fee intangibles primarily associated with the disposition of communities in the U.S. Fund in 2018, 2017 and 2016 and the AC JV in 2018, (ii) our proportionate share of yield maintenance charges incurred for the early repayment of debt associated with joint venture disposition activity, and (iii) our proportionate share of operating results for joint ventures formed with Equity Residential as part of the Archstone Acquisition. Amounts for 2014 and

Table of Contents
2015 are primarily composed of our proportionate share of gains and operating results for joint ventures formed with Equity Residential as part of the Archstone Acquisition.
35
(4) Amounts for 2018, 2017 and 2016 are composed of the recognition of our promoted interest in AvalonBay Value Added Fund II, L.P. (“Fund II”). Amount for 2015 is primarily composed of amounts received related to the modification of the joint venture agreement for the entity that owns Avalon at Mission Bay II to eliminate our promoted interest in future distributions. Amount for 2014 relates to our promoted interests from the sale of Avalon Chrystie Place.
(5) Amounts include impairment charges relating to ancillary land parcels.
(6) Amount for 2018 includes $554 in legal settlement proceeds relating to construction defects at a community acquired as part of the Archstone Acquisition. Amount for 2017 includes $19,481 for the Maplewood casualty loss, partially offset by $17,143 of property damage insurance proceeds, and $5,438 in legal settlement proceeds relating to construction defects at a community acquired as part of the Archstone Acquisition. Amount for 2016 includes $8,702 in property damage insurance proceeds for the Edgewater casualty loss, and $1,537 in insurance proceeds in excess of the total recognized loss related to severe winter storms in our Northeast markets that occurred in 2015. Amount for 2015 includes $44,142 of Edgewater insurance proceeds received partially offset by $28,604 for the write-off of real estate and related costs.
(7) The aggregate impact of (i) casualty and impairment (recovery) loss, net on real estate, (ii) impairment loss on real estate and (iii) casualty (gain) loss, net on real estate for 2018 and 2017 are losses of $215 and $6,250, respectively, and for 2016 and 2015 are gains of $3,935 and $10,542, respectively.
(8) Amount for 2017 is composed of business interruption insurance proceeds resulting from the final insurance settlement of the Maplewood casualty loss. Amount for 2016 is primarily composed of business interruption insurance proceeds resulting from the final insurance settlement of the Edgewater casualty loss.
(9) Amounts for 2017, 2016 and 2015 primarily relate to lost NOI resulting from the Edgewater casualty loss, for which we received $20,306 in business interruption insurance proceeds in the first quarter of 2016. Amount for 2018, as well as a portion of the amount for 2017, relates to the Maplewood casualty loss, for which we received $3,495 in business interruption insurance proceeds in the third quarter of 2017.
(10) Amount for 2014 is primarily composed of receipts related to communities acquired as part of the Archstone Acquisition for periods prior to our ownership, which are primarily comprised of property tax and mortgage insurance refunds.
(11) Amounts for 2015 and 2014 are composed of income taxes on income that was earned in taxable REIT subsidiaries and that is not considered to be a component of primary operations. Amount for 2018 represents a partial refund for payments in prior years.

Table of Contents ITEM 7. MANAGEMENT'S DISCUSSION AND ANALYSIS OF FINANCIAL CONDITION AND RESULTS OF OPERATIONS Management's Discussion and Analysis of Financial Condition and Results of Operations (“MD&A”) is intended to help provide an understanding of our business, financial condition and results of operations. This MD&A should be read in conjunction with our Consolidated Financial Statements and the accompanying Notes to Consolidated Financial Statements included elsewhere in this report. This report, including the following MD&A, contains forward-looking statements regarding future events or trends that should be read in conjunction with the factors described under “Forward-Looking Statements” included in this report. Actual results or developments could differ materially from those projected in such statements as a result of the factors described under “Forward-Looking Statements” as well as the risk factors described in Item 1A. “Risk Factors” of this report. Capitalized terms used without definition have the meanings provided elsewhere in this Form 10-K. Executive Overview Business Description Our strategic vision is to be the leading apartment company in select U.S. markets, providing a range of distinctive living experiences that customers value. We pursue this vision by targeting what we believe are among the best markets and submarkets, leveraging our strategic capabilities in market research and consumer insight and being disciplined in our capital allocation and balance sheet management. Our communities are predominately upscale and generally command among the highest rents in their markets. However, we also pursue the ownership and operation of apartment communities that target a variety of customer segments and price points, consistent with our goal of offering a broad range of products and services. We regularly evaluate the allocation of our investments by the amount of invested capital and by product type within our individual markets. We develop, redevelop, acquire, own and operate multifamily apartment communities primarily in New England, the New York/New Jersey metro area, the Mid-Atlantic, the Pacific Northwest, and Northern and Southern California. We focus on leading metropolitan areas that we believe are characterized by growing employment in high wage sectors of the economy, higher cost of home ownership and a diverse and vibrant quality of life. We believe these market characteristics offer the opportunity for superior risk-adjusted returns over the long-term on apartment community investments relative to other markets that do not have these characteristics. We believe that the Denver, Colorado, and Southeast Florida markets share these characteristics, and in 2017 we began to invest in these markets through acquisitions and developments. We seek to create long-term shareholder value by accessing capital on cost effective terms; deploying that capital to develop, redevelop and acquire apartment communities in our selected markets; operating apartment communities; and selling communities when they no longer meet our long-term investment strategy or when pricing is attractive. 2018 Financial Highlights Net income attributable to common stockholders for the year ended December 31, 2018 was $974,525,000, an increase of $97,604,000, or 11.1%, over the prior year. The increase is primarily attributable to increases in real estate sales and related gains and NOI from newly developed, acquired and existing operating communities, as well as decreases in loss on extinguishment of debt, net and casualty and impairment loss. These amounts were partially offset by a decrease in gains on the sale of unconsolidated communities in various joint ventures and related promote income, coupled with increases in depreciation and interest expense. Established Communities NOI for the year ended December 31, 2018 increased by $26,248,000, or 2.3%, over the prior year. The increase was driven by an increase in rental revenue of 2.5%, partially offset by an increase in operating expenses of 3.2% over 2017. During 2018, we raised approximately $1,572,833,000 of gross capital through the issuance of unsecured notes, sale of common shares under CEP IV and the sale of consolidated operating communities and other real estate. This amount does not include proceeds from joint venture dispositions. The funds raised from the sale of real estate consist of the proceeds from the sale of eight operating communities, as well as the five communities contributed to the NYC Joint Venture and one ancillary land parcel. We believe that our current capital structure will continue to provide financial flexibility to access capital on attractive terms.
36
Table of Contents We believe our development activity will continue to create long-term value. During 2018, we completed the construction of seven communities containing an aggregate of 1,915 apartment homes and 10,000 square feet of retail space, for an aggregate total capitalized cost of $742,000,000, or $693,000,000 when including only our 55.0% interest in one community developed through an unconsolidated joint venture. We also started the construction of eight communities containing an aggregate of 2,154 apartment homes, which are expected to be completed for an estimated total capitalized cost of $718,000,000. In addition, during 2018 we completed the redevelopment of eight communities containing an aggregate of 3,368 apartment homes for a total investment of $217,000,000, excluding costs incurred prior to the redevelopment. We also achieved portfolio growth through acquisitions, acquiring four communities containing an aggregate of 1,096 apartment homes for an aggregate purchase price of $334,450,000. We believe that our balance sheet strength, as measured by our current level of indebtedness, our current ability to service interest and other fixed charges, and our current moderate use of financial encumbrances (such as secured financing) provide us with adequate access to liquidity from the capital markets. We expect to be able to meet our reasonably foreseeable liquidity needs, as they arise, through a combination of one or more of the following sources: existing cash on hand; operating cash flows; borrowings under our Credit Facility; secured debt; the issuance of corporate securities (which could include unsecured debt, preferred equity and/or common equity); the sale of apartment communities; or through the formation of joint ventures. See the discussion under "Liquidity and Capital Resources." Communities Overview As of December 31, 2018 we owned or held a direct or indirect ownership interest in 291 apartment communities containing 85,158 apartment homes in 12 states and the District of Columbia, of which 21 communities were under development and nine communities were under redevelopment. Of these communities, 15 were owned by entities that were not consolidated for financial reporting purposes, including five owned by the U.S. Fund, five owned by the NYC Joint Venture and two owned by the AC JV. In addition, we held a direct or indirect ownership interest in Development Rights to develop an additional 28 wholly-owned communities that, if developed as expected, will contain an estimated 9,769 apartment homes. Our real estate investments consist primarily of Current Communities, Development Communities and Development Rights. Our Current Communities are further distinguished as Established Communities, Other Stabilized Communities, Lease-Up Communities, Redevelopment Communities and Unconsolidated Communities. Established Communities are generally consolidated communities in markets where we have a significant presence that were owned and had stabilized occupancy as of the beginning of the prior year, allowing for a meaningful comparison of operating results between years. Other Stabilized Communities are generally all other completed consolidated communities that have stabilized occupancy during the fiscal year. Lease-Up Communities are consolidated communities where construction has been complete for less than one year and stabilized occupancy has not been achieved. Redevelopment Communities are consolidated communities where substantial redevelopment is in progress or is planned to begin during the fiscal year. Unconsolidated Communities are communities that we have an indirect ownership interest in through our investment interest in an unconsolidated joint venture. A more detailed description of our reportable segments and other related operating information can be found in Note 8, “Segment Reporting,” of our Consolidated Financial Statements. Although each of these categories is important to our business, we generally evaluate overall operating, industry and market trends based on the operating results of Established Communities, for which a detailed discussion can be found in “Results of Operations” as part of our discussion of overall operating results. We evaluate our current and future cash needs and future operating potential based on acquisition, disposition, development, redevelopment and financing activities within Other Stabilized, Redevelopment and Development Communities. Discussions related to current and future cash needs and financing activities can be found under "Liquidity and Capital Resources." NOI of our current operating communities is one of the financial measures that we use to evaluate the performance of our communities. NOI is affected by the demand and supply dynamics within our markets, our rental rates and occupancy levels and our ability to control operating costs. Our overall financial performance is also impacted by the general availability and cost of capital and the performance of newly developed, redeveloped and acquired apartment communities.
37
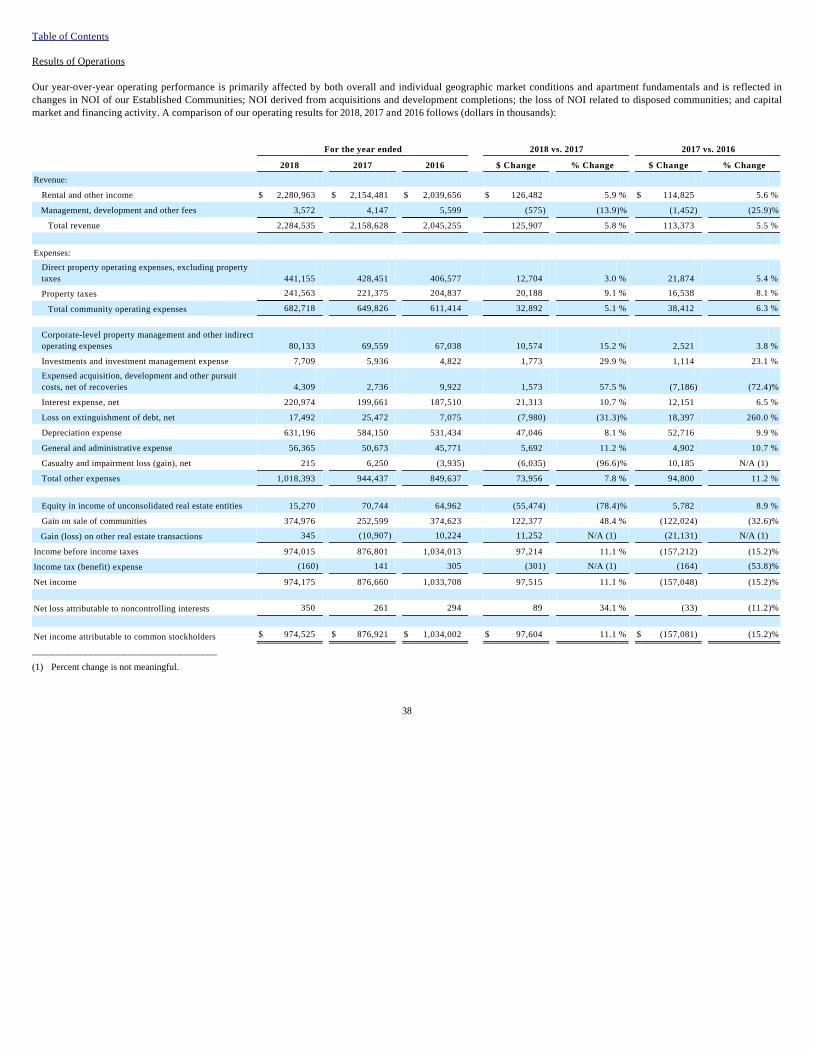
Table of Contents Results of Operations Our year-over-year operating performance is primarily affected by both overall and individual geographic market conditions and apartment fundamentals and is reflected in changes in NOI of our Established Communities; NOI derived from acquisitions and development completions; the loss of NOI related to disposed communities; and capital market and financing activity. A comparison of our operating results for 2018, 2017 and 2016 follows (dollars in thousands):
_________________________________
38
For the year ended 2018 vs. 2017 2017 vs. 2016
2018 2017 2016 $ Change % Change $ Change % Change
Revenue: Rental and other income $ 2,280,963 $ 2,154,481 $ 2,039,656 $ 126,482 5.9 % $ 114,825 5.6 %
Management, development and other fees 3,572 4,147 5,599 (575 ) (13.9 )% (1,452 ) (25.9 )%
Total revenue 2,284,535 2,158,628 2,045,255 125,907 5.8 % 113,373 5.5 %
Expenses:
Direct property operating expenses, excluding property taxes 441,155 428,451 406,577 12,704 3.0 % 21,874 5.4 %
Property taxes 241,563 221,375 204,837 20,188 9.1 % 16,538 8.1 %
Total community operating expenses 682,718 649,826 611,414 32,892 5.1 % 38,412 6.3 %
Corporate-level property management and other indirect operating expenses 80,133 69,559 67,038 10,574 15.2 % 2,521 3.8 %
Investments and investment management expense 7,709 5,936 4,822 1,773 29.9 % 1,114 23.1 %
Expensed acquisition, development and other pursuit costs, net of recoveries 4,309 2,736 9,922 1,573 57.5 % (7,186 ) (72.4 )%
Interest expense, net 220,974 199,661 187,510 21,313 10.7 % 12,151 6.5 %
Loss on extinguishment of debt, net 17,492 25,472 7,075 (7,980 ) (31.3 )% 18,397 260.0 %
Depreciation expense 631,196 584,150 531,434 47,046 8.1 % 52,716 9.9 %
General and administrative expense 56,365 50,673 45,771 5,692 11.2 % 4,902 10.7 %
Casualty and impairment loss (gain), net 215 6,250 (3,935 ) (6,035 ) (96.6 )% 10,185 N/A (1) Total other expenses 1,018,393 944,437 849,637 73,956 7.8 % 94,800 11.2 %
Equity in income of unconsolidated real estate entities 15,270 70,744 64,962 (55,474 ) (78.4 )% 5,782 8.9 %
Gain on sale of communities 374,976 252,599 374,623 122,377 48.4 % (122,024 ) (32.6 )%
Gain (loss) on other real estate transactions 345 (10,907 ) 10,224 11,252 N/A (1) (21,131 ) N/A (1) Income before income taxes 974,015 876,801 1,034,013 97,214 11.1 % (157,212 ) (15.2 )%
Income tax (benefit) expense (160 ) 141 305 (301 ) N/A (1) (164 ) (53.8 )%
Net income 974,175 876,660 1,033,708 97,515 11.1 % (157,048 ) (15.2 )%
Net loss attributable to noncontrolling interests 350 261 294 89 34.1 % (33 ) (11.2 )%
Net income attributable to common stockholders $ 974,525 $ 876,921 $ 1,034,002 $ 97,604 11.1 % $ (157,081 ) (15.2 )%
(1) Percent change is not meaningful.

Table of Contents Net income attributable to common stockholders increased $97,604,000, or 11.1%, to $974,525,000 in 2018 from 2017, primarily attributable to increases in real estate sales and related gains and NOI from newly developed, acquired and existing operating communities, as well as decreases in loss on extinguishment of debt, net and casualty and impairment loss. These amounts were partially offset by a decrease in gains on the sale of unconsolidated communities in various joint ventures and related promote income, coupled with increases in depreciation and interest expense. Net income attributable to common stockholders decreased $157,081,000, or 15.2%, to $876,921,000 in 2017 from 2016, primarily due to a decrease in real estate sales and related gains, coupled with increases in depreciation, loss on extinguishment of debt and interest expense, and a net casualty and impairment loss in the current year compared to a gain in the prior year. These amounts were partially offset by an increase in NOI from newly developed, acquired and existing operating communities. NOI is considered by management to be an important and appropriate supplemental performance measure to net income because it helps both investors and management to understand the core operations of a community or communities prior to the allocation of any corporate-level or financing-related costs. NOI reflects the operating performance of a community and allows for an easier comparison of the operating performance of individual assets or groups of assets. In addition, because prospective buyers of real estate have different financing and overhead structures, with varying marginal impact to overhead as a result of acquiring real estate, NOI is considered by many in the real estate industry to be a useful measure for determining the value of a real estate asset or group of assets. We define NOI as total property revenue less direct property operating expenses (including property taxes), and excluding corporate-level income (including management, development and other fees), corporate-level property management and other indirect operating expenses, investments and investment management expenses, expensed acquisition, development and other pursuit costs, net of recoveries, interest expense, net, loss (gain) on extinguishment of debt, net, general and administrative expense, equity in income of unconsolidated real estate entities, depreciation expense, corporate income tax (benefit) expense, casualty and impairment loss (gain), net, gain on sale of communities, loss (gain) on other real estate transactions and net operating income from real estate assets sold or held for sale. NOI does not represent cash generated from operating activities in accordance with GAAP, and NOI should not be considered an alternative to net income as an indication of our performance. NOI should also not be considered an alternative to net cash flow from operating activities, as determined by GAAP, as a measure of liquidity, nor is NOI indicative of cash available to fund cash needs. Reconciliations of NOI for the years ended December 31, 2018, 2017 and 2016 to net income for each year are as follows (dollars in thousands):
39
For the year ended
12/31/18 12/31/17 12/31/16
Net income $ 974,175 $ 876,660 $ 1,033,708 Indirect operating expenses, net of corporate income 76,522 65,398 61,403 Investments and investment management expense 7,709 5,936 4,822 Expensed transaction, development and other pursuit costs, net of recoveries 4,309 2,736 9,922 Interest expense, net 220,974 199,661 187,510 Loss on extinguishment of debt, net 17,492 25,472 7,075 General and administrative expense 56,365 50,673 45,771 Equity in income of unconsolidated real estate entities (15,270) (70,744) (64,962)
Depreciation expense 631,196 584,150 531,434 Income tax (benefit) expense (160) 141 305 Casualty and impairment (gain) loss, net 215 6,250 (3,935)
Gain on sale of real estate assets (374,976) (252,599) (374,623)
Gain on other real estate transactions, net (345) 10,907 (10,224)
Net operating income from real estate assets sold or held for sale (58,620) (84,650) (114,219)
Net operating income $ 1,539,586 $ 1,419,991 $ 1,313,987
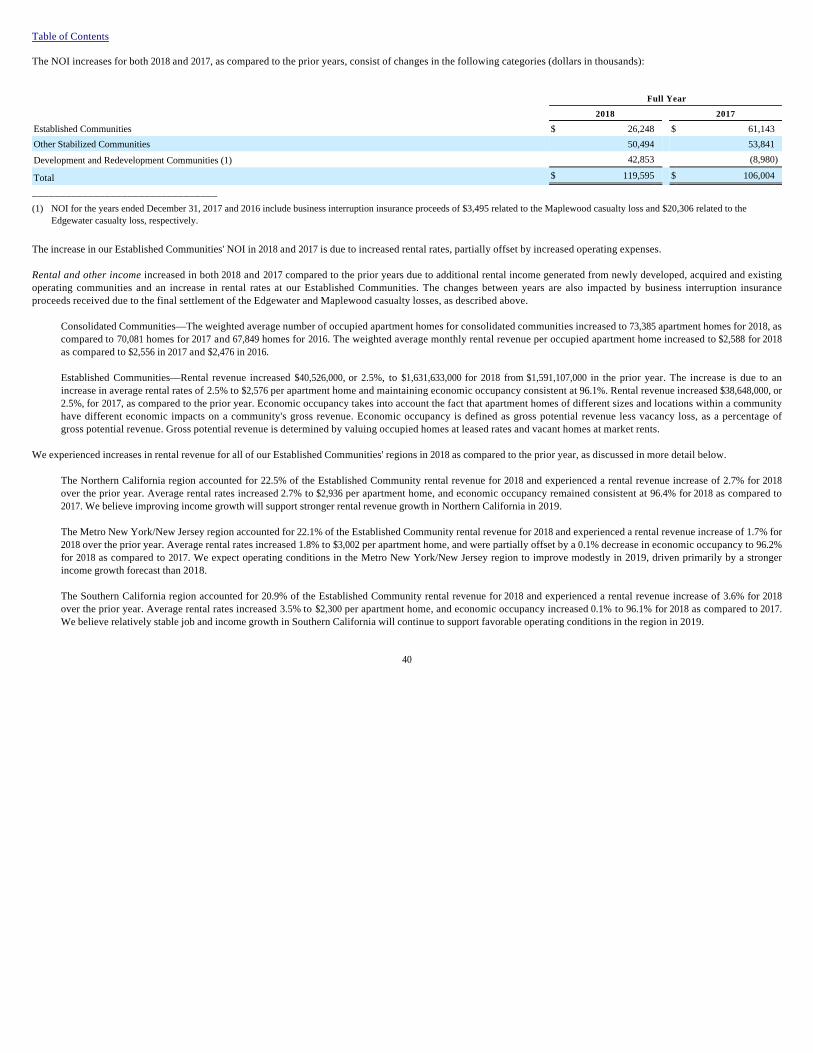
Table of Contents The NOI increases for both 2018 and 2017, as compared to the prior years, consist of changes in the following categories (dollars in thousands):
_________________________________
The increase in our Established Communities' NOI in 2018 and 2017 is due to increased rental rates, partially offset by increased operating expenses. Rental and other income increased in both 2018 and 2017 compared to the prior years due to additional rental income generated from newly developed, acquired and existing operating communities and an increase in rental rates at our Established Communities. The changes between years are also impacted by business interruption insurance proceeds received due to the final settlement of the Edgewater and Maplewood casualty losses, as described above.
Consolidated Communities—The weighted average number of occupied apartment homes for consolidated communities increased to 73,385 apartment homes for 2018, as compared to 70,081 homes for 2017 and 67,849 homes for 2016. The weighted average monthly rental revenue per occupied apartment home increased to $2,588 for 2018 as compared to $2,556 in 2017 and $2,476 in 2016. Established Communities—Rental revenue increased $40,526,000, or 2.5%, to $1,631,633,000 for 2018 from $1,591,107,000 in the prior year. The increase is due to an increase in average rental rates of 2.5% to $2,576 per apartment home and maintaining economic occupancy consistent at 96.1%. Rental revenue increased $38,648,000, or 2.5%, for 2017, as compared to the prior year. Economic occupancy takes into account the fact that apartment homes of different sizes and locations within a community have different economic impacts on a community's gross revenue. Economic occupancy is defined as gross potential revenue less vacancy loss, as a percentage of gross potential revenue. Gross potential revenue is determined by valuing occupied homes at leased rates and vacant homes at market rents.
We experienced increases in rental revenue for all of our Established Communities' regions in 2018 as compared to the prior year, as discussed in more detail below.
The Northern California region accounted for 22.5% of the Established Community rental revenue for 2018 and experienced a rental revenue increase of 2.7% for 2018 over the prior year. Average rental rates increased 2.7% to $2,936 per apartment home, and economic occupancy remained consistent at 96.4% for 2018 as compared to 2017. We believe improving income growth will support stronger rental revenue growth in Northern California in 2019. The Metro New York/New Jersey region accounted for 22.1% of the Established Community rental revenue for 2018 and experienced a rental revenue increase of 1.7% for 2018 over the prior year. Average rental rates increased 1.8% to $3,002 per apartment home, and were partially offset by a 0.1% decrease in economic occupancy to 96.2% for 2018 as compared to 2017. We expect operating conditions in the Metro New York/New Jersey region to improve modestly in 2019, driven primarily by a stronger income growth forecast than 2018. The Southern California region accounted for 20.9% of the Established Community rental revenue for 2018 and experienced a rental revenue increase of 3.6% for 2018 over the prior year. Average rental rates increased 3.5% to $2,300 per apartment home, and economic occupancy increased 0.1% to 96.1% for 2018 as compared to 2017. We believe relatively stable job and income growth in Southern California will continue to support favorable operating conditions in the region in 2019.
40
Full Year
2018 2017
Established Communities $ 26,248 $ 61,143 Other Stabilized Communities 50,494 53,841 Development and Redevelopment Communities (1) 42,853 (8,980)
Total $ 119,595 $ 106,004
(1) NOI for the years ended December 31, 2017 and 2016 include business interruption insurance proceeds of $3,495 related to the Maplewood casualty loss and $20,306 related to the Edgewater casualty loss, respectively.

Table of Contents
The New England region accounted for 14.7% of the Established Community rental revenue for 2018 and experienced a rental revenue increase of 3.0% for 2018 over the prior year. Average rental rates increased 2.9% to $2,510 per apartment home, and economic occupancy increased 0.1% to 96.0% for 2018 as compared to 2017. We expect the operating environment in New England to improve in 2019, driven by strengthening income growth and a decrease in the volume of new apartment deliveries relative to 2018. The Mid-Atlantic region accounted for 14.5% of the Established Community rental revenue for 2018 and experienced a rental revenue increase of 1.8% for 2018 over the prior year. Average rental rates increased 1.7% to $2,218 per apartment home, and economic occupancy increased 0.1% to 96.0% for 2018 as compared to 2017. We believe elevated levels of new apartment deliveries in the Mid-Atlantic region will continue to limit our ability to increase rental rates in 2019.
The Pacific Northwest region accounted for 5.3% of the Established Community rental revenue for 2018 and experienced a rental revenue increase of 2.5% for 2018 over the prior year. Average rental rates increased 2.5% to $2,301 per apartment home, and economic occupancy remained consistent at 96.0% for 2018 as compared to 2017. We expect operating conditions in the Pacific Northwest to remain relatively stable in 2019.
Management, development and other fees decreased $575,000 or 13.9%, and $1,452,000, or 25.9%, in 2018 and 2017, respectively, as compared to the prior years. The decreases in 2018 and 2017 were primarily due to lower property and asset management fees earned as a result of dispositions from Fund II, the U.S. Fund and the AC JV. Direct property operating expenses, excluding property taxes increased $12,704,000, or 3.0%, and $21,874,000, or 5.4%, in 2018 and 2017, respectively, as compared to the prior years. The increases in 2018 and 2017 were primarily due to the addition of newly developed and acquired apartment communities.
For Established Communities, direct property operating expenses, excluding property taxes, increased $5,993,000, or 2.0%, and $6,067,000, or 2.0%, in 2018 and 2017, respectively, as compared to the prior years. The increase in 2018 was primarily due to increased compensation expense as well as maintenance and utilities costs, partially offset by decreased marketing and property insurance costs. The increase in 2017 was primarily due to increased compensation expense, bad debt and turnover and maintenance costs, partially offset by decreased property insurance costs.
Property taxes increased $20,188,000, or 9.1%, and $16,538,000, or 8.1%, in 2018 and 2017, respectively, as compared to the prior years. The increases in 2018 and 2017 were primarily due to the addition of newly developed and acquired apartment communities, increased assessments across our portfolio, as well as successful appeals in the prior years in excess of those recognized in the then current year.
For Established Communities, property taxes increased $8,520,000, or 5.3%, and $5,300,000, or 3.5%, in 2018 and 2017, respectively, as compared to the prior years. The increases in 2018 and 2017 were primarily due to increased assessments and rates in the current year periods, as well as successful appeals in the prior year periods in the Company's West Coast markets. For communities in California, property tax changes are determined by the change in the California Consumer Price Index, with increases limited by law (Proposition 13). We evaluate property tax increases internally and also engage third-party consultants to assist in our evaluations. We appeal property tax increases when appropriate.
Corporate-level property management and other indirect operating expenses increased $10,574,000, or 15.2%, and $2,521,000, or 3.8%, in 2018 and 2017, respectively, as compared to the prior year. The increase in 2018 was primarily due to advocacy contributions not present in the prior year, increased compensation related costs and spending on corporate initiatives in the current year. The increase in 2017 was primarily due to increased compensation related costs, partially offset by severance costs in 2016 not present in 2017. Investments and investment management expense increased by $1,773,000, or 29.9%, and $1,114,000, or 23.1%, in 2018 and 2017, respectively, as compared to the prior years. The increase in 2018 was primarily due to severance costs, which were not present in the prior year, and an increase in compensation expense. The increase in 2017 was primarily due to an increase in compensation expense.
41
Table of Contents Expensed acquisition, development and other pursuit costs, net of recoveries primarily reflect abandoned pursuit costs as well as acquisition costs related to business acquisitions that occurred prior to the adoption of ASU 2017-01 as of October 1, 2016. Subsequent to the adoption of ASU 2017-01, we expect that acquisitions of individual operating communities will generally be viewed as asset acquisitions, and result in acquisition costs being capitalized instead of expensed. Abandoned pursuit costs include costs incurred for development pursuits not yet considered probable for development, as well as the abandonment of Development Rights and costs related to abandoned acquisition and disposition pursuits. These costs can be volatile, particularly in periods of increased acquisition pursuit activity, periods of economic downturn or when there is limited access to capital, and the costs may vary significantly from period to period. These aggregate costs increased $1,573,000, or 57.5%, in 2018, and decreased $7,186,000, or 72.4%, in 2017, as compared to the prior years. The increase in 2018 was primarily due to increased abandoned development pursuit costs and the non-cash write-off of asset management fee intangibles associated with the disposition of communities in the U.S. Fund and the AC JV. The decrease in 2017 was due to a decrease in acquisition costs related to communities acquired during the prior year periods that were expensed prior to the adoption of ASU 2017-01, decreased development pursuit costs, as well as the non-cash write-off of asset management fee intangibles associated with the disposition of communities in the U.S. Fund in the prior year period in excess of amounts recognized in the current year period. Interest expense, net increased $21,313,000, or 10.7%, and $12,151,000, or 6.5%, in 2018 and 2017, respectively, as compared to the prior years. This category includes interest costs offset by capitalized interest pertaining to development and redevelopment activity, amortization of premium/discount on debt, and interest income. The increase in 2018 was primarily due to a decrease in amounts of interest capitalized resulting from a decrease in development and redevelopment activity, as well as an increase in outstanding unsecured indebtedness, partially offset by a decrease in secured indebtedness. The increase in 2017 was primarily due to a decrease in amounts of interest capitalized resulting from a decrease in development activity, as well as an increase in outstanding unsecured indebtedness. Loss on the extinguishment of debt, net reflects prepayment penalties, the write-off of unamortized deferred financing costs and premiums from our debt repurchase and retirement activity, or payments to acquire our outstanding debt at amounts above or below the carrying basis of the debt acquired. The loss of $17,492,000 for 2018 was due to:
The loss of $25,472,000 for 2017 was primarily due to:
Depreciation expense increased $47,046,000, or 8.1%, and $52,716,000, or 9.9%, in 2018 and 2017, respectively, as compared to the prior years. The increases in 2018 and 2017 were primarily due to the addition of newly developed and acquired apartment communities. General and administrative expense (“G&A”) increased $5,692,000, or 11.2%, and $4,902,000, or 10.7%, in 2018 and 2017, respectively, as compared to the prior years. The increase in 2018 was primarily due to an increase in compensation related expenses and a decrease in legal recoveries. The increase in 2017 was primarily due to an increase in compensation related expenses, professional fees, and sales and use tax expense.
42
• a prepayment penalty of $8,579,000 and the non-cash write-off of deferred financing costs of $347,000 associated with the early repayment of $250,000,000 principal amount of 6.10% unsecured notes; and
• the aggregate prepayment penalty of $3,308,000 and the non-cash write-off of deferred financing costs of $5,258,000 on the repayment or refinancing of $244,546,000principal amount of mortgage notes secured by six wholly-owned operating communities.
• prepayment penalties of $33,515,000 and the non-cash write-off of deferred financing costs of $1,450,000 associated with the repayment of $556,313,000 aggregate principal amount of fixed rate mortgage notes secured by 12 wholly-owned operating communities in advance of their May 2019 maturity dates; partially offset by
• a gain of $10,839,000, primarily composed of the write-off of unamortized premium on the repayment of $670,590,000 principal amount of fixed rate mortgage notes secured by 11 wholly-owned operating communities in advance of their November 2017 maturity dates.
Table of Contents Casualty and impairment loss (gain), net of $215,000 for 2018 primarily consists of an impairment charge of $826,000 recognized for a land parcel we had acquired for development and no longer intend to develop, partially offset by $554,000 of legal settlement proceeds relating to construction defects at a community acquired as part of the Archstone Acquisition. The loss of $6,250,000 for 2017 consists of a $9,350,000 impairment charge recognized for a land parcel we had acquired for development in 2004 and sold in July 2017, and the net impact of the Maplewood casualty loss, net of associated insurance receivables, of $2,338,000, partially offset by $5,438,000 of legal settlement proceeds relating to construction defects at a community acquired as part of the Archstone Acquisition. Equity in income of unconsolidated real estate entities decreased $55,474,000, or 78.4%, and increased $5,782,000, or 8.9%, in 2018 and 2017, respectively, as compared to the prior years. The decrease in 2018 was primarily due to gains on the sale of communities in various ventures and the recognition of income for the Company's promoted interest from Fund II in the prior year period, coupled with the resulting decreased NOI from the ventures in the current year period, due to disposition activity in 2017 and 2018. The increase in 2017 was primarily due to the recognition of income for the Company's promoted interest, partially offset by decreased gains on the sale of communities in various ventures in the current year, and decreased NOI from the ventures due to disposition activity in 2016 and 2017. Gain on sale of communities increased in 2018 and decreased in 2017 as compared to the prior years. The amount of gain realized in a given period depends on many factors, including the number of communities sold, the size and carrying value of the communities sold and the market conditions in the local area. The gain of $374,976,000 in 2018 was primarily due to the sale of eight wholly-owned operating communities and the recognition of the gain associated with the contribution of five wholly-owned operating communities to the NYC Joint Venture, a venture in which we retained a 20.0% interest. The gain of $252,599,000 in 2017 was primarily due to the sale of six wholly-owned operating communities. Gain (loss) on other real estate transactions of $345,000 in 2018 was primarily composed of gains on ancillary real estate. The loss of $10,907,000 in 2017 was primarily composed of the non-cash write-off of prepaid rent associated with the purchase of land previously subject to a ground lease. Liquidity and Capital Resources We employ a disciplined approach to our liquidity and capital management. When we source capital, we take into account both our view of the most cost effective alternative then available and our desire to maintain a balance sheet that provides us with flexibility. Our principal short-term liquidity needs are to fund:
Factors affecting our liquidity and capital resources are our cash flows from operations, financing activities and investing activities (including dispositions) as well as general economic and market conditions. Operating cash flow has historically been determined by: (i) the number of apartment homes currently owned, (ii) rental rates, (iii) occupancy levels and (iv) operating expenses with respect to apartment homes. The timing and type of capital markets activity in which we engage, as well as our plans for development, redevelopment, acquisition and disposition activity, are affected by changes in the capital markets environment, such as changes in interest rates or the availability of cost-effective capital. We regularly review our liquidity needs, the adequacy of cash flows from operations and other expected liquidity sources to meet these needs. We had cash and cash equivalents and restricted cash of $217,864,000 at December 31, 2018, an increase of $15,958,000 from $201,906,000 at December 31, 2017. The following discussion relates to changes in cash and cash equivalents and restricted cash due to operating, investing and financing activities, which are presented in our Consolidated Statements of Cash Flows included elsewhere in this report.
Operating Activities—Net cash provided by operating activities increased to $1,301,111,000 in 2018 from $1,256,257,000 in 2017. The change was driven primarily by increased NOI from existing, acquired and newly developed communities. Investing Activities—Net cash used in investing activities totaled $596,651,000 in 2018. The net cash used was primarily due to:
43
• development and redevelopment activity in which we are currently engaged;• the minimum dividend payments on our common stock required to maintain our REIT qualification under the Code;• debt service and principal payments either at maturity or opportunistically before maturity; and• normal recurring operating expenses and corporate overhead expenses.
• investment of $1,139,954,000 in the development and redevelopment of communities; • acquisition of four operating communities for $338,620,000; and

Table of Contents
These amounts are partially offset by:
Financing Activities—Net cash used in financing activities totaled $688,502,000 in 2018. The net cash used was primarily due to:
These amounts are partially offset by:
Variable Rate Unsecured Credit Facility We have a $1,500,000,000 revolving variable rate unsecured credit facility with a syndicate of banks (the "Credit Facility") which matures in April 2020. We may extend the maturity for up to nine months, provided we are not in default and upon payment of a $1,500,000 extension fee. The Credit Facility bears interest at varying levels based on the London Interbank Offered Rate ("LIBOR"), rating levels achieved on our unsecured notes and on a maturity schedule selected by us. The current stated pricing is LIBOR plus 0.825% per annum (3.34% at January 31, 2019 assuming a one month borrowing rate). The annual facility fee is 0.125% (or approximately $1,875,000 annually based on the $1,500,000,000 facility size and based on our current credit rating). We had $106,000,000 outstanding under the Credit Facility and had $40,010,000 outstanding in letters of credit that reduced our borrowing capacity as of January 31, 2019. Financial Covenants We are subject to financial and other covenants contained in the Credit Facility, the Term Loan and the indenture under which our unsecured notes were issued. The principal financial covenants include the following:
We were in compliance with these covenants at December 31, 2018. In addition, our secured borrowings may include yield maintenance, defeasance, or prepayment penalty provisions, which would result in us incurring an additional charge in the event of a full or partial prepayment of outstanding principal before the scheduled maturity. These provisions in our secured borrowings are generally consistent with other similar types of debt instruments issued during the same time period in which our borrowings were secured.
44
• capital expenditures of $86,932,000 for our operating communities and non-real estate assets.
• proceeds from the sale of real estate, including the contribution of five communities to the NYC Joint Venture, of $883,313,000; and• net distributions from unconsolidated real estate entities of $24,499,000.
• payment of cash dividends in the amount of $805,239,000; • the repayment of unsecured notes in the amount of $258,579,000; and• the repayment of secured notes in the amount of $255,452,000.
• proceeds from the issuance of unsecured notes in the amount of $299,442,000, less deferred financing costs of $16,258,000;• the issuance of secured notes in the amount of $295,939,000; and• the issuance of common stock in the amount of $52,261,000, primarily through CEP IV.
• limitations on the amount of total and secured debt in relation to our overall capital structure;• limitations on the amount of our unsecured debt relative to the undepreciated basis of real estate assets that are not encumbered by property-specific financing; and• minimum levels of debt service coverage.

Table of Contents Continuous Equity Offering Program In December 2015, we commenced a fourth continuous equity program (“CEP IV”) under which we may sell up to $1,000,000,000 of our common stock from time to time. Actual sales will depend on a variety of factors to be determined, including market conditions, the trading price of our common stock and determinations of the appropriate sources of funding. In conjunction with CEP IV, we engaged sales agents who will receive compensation of up to 2.0% of the gross sales price for shares sold. CEP IV also allows us to enter into forward sale agreements up to $1,000,000,000 in aggregate sales price of our common stock. We expect that we will physically settle each forward sale agreement on one or more dates prior to the maturity date of that particular forward sale agreement, in which case we will expect to receive aggregate net cash proceeds at settlement equal to the number of shares underlying the particular forward agreement multiplied by the relevant forward sale price. However, we may also elect to cash settle or net share settle a forward sale agreement. In connection with each forward sale agreement, we will pay the relevant forward seller, in the form of a reduced initial forward sale price, commission of up to 2.0% of the sales prices of all borrowed shares of common stock sold. In 2018, we sold 244,924 shares at an average sales price of $189.14 per share, for net proceeds of $45,629,000. As of January 31, 2019, we had $846,591,000 of shares remaining authorized for issuance under this program and no forward sales agreements outstanding. Forward Interest Rate Swap Agreements In 2018, we entered into $250,000,000 of forward interest rate swap agreements executed to reduce the impact of variability in interest rates on a portion of our expected debt issuance activity in 2019, which are outstanding as of December 31, 2018. At maturity of the outstanding swap agreements, we expect to cash settle the contracts and either pay or receive cash for the then current fair value. Assuming that we issue the debt as expected, the hedging impact from these positions will then be recognized over the life of the issued debt as a yield adjustment. In conjunction with our March 2018 unsecured note issuance, we settled $300,000,000 of forward interest rate swap agreements entered into in 2017 and designated as cash flow hedges of interest variability on the forecasted issuance of the unsecured notes, receiving a payment of $12,598,000. Future Financing and Capital Needs—Debt Maturities One of our principal long-term liquidity needs is the repayment of long-term debt at maturity. For both our unsecured and secured notes, a portion of the principal of these notes may be repaid prior to maturity. Early retirement of our unsecured or secured notes could result in gains or losses on extinguishment. If we do not have funds on hand sufficient to repay our indebtedness as it becomes due, it will be necessary for us to refinance or otherwise provide liquidity to satisfy the debt at maturity. This refinancing may be accomplished by uncollateralized private or public debt offerings, equity issuances, additional debt financing that is secured by mortgages on individual communities or groups of communities or borrowings under our Credit Facility. Although we believe we will have the capacity to meet our currently anticipated liquidity needs, we cannot assure you that additional debt financing or debt or equity offerings will be available or, if available, that they will be on terms we consider satisfactory. The following debt activity occurred during 2018:
45
• In February 2018, we repaid $15,174,000 principal amount of 6.60% fixed rate debt secured by Avalon Oaks West in advance of its scheduled maturity date, incurring a charge of $426,000, consisting of a prepayment penalty of $152,000 and the non-cash write-off of unamortized deferred financing costs of $274,000.
• In February 2018, we repaid $11,038,000 principal amount of 4.61% fixed rate debt secured by AVA Pasadena at par in advance of its scheduled maturity date.
• In March 2018, we issued $300,000,000 principal amount of unsecured notes in a public offering under our existing shelf registration statement for net proceeds of approximately $296,210,000. The notes mature in April 2048 and were issued at a 4.35% interest rate. The effective interest rate of the notes for the first 10 years is 3.97%, including the impact of an interest rate hedge and offering costs, and for the remainder of the term the effective interest rate is 4.39%.
• In April 2018, we repaid $13,380,000 principal amount of 3.06% fixed rate debt secured by Avalon Andover at par at its scheduled maturity date.
• In June 2018, we repaid $15,295,000 principal amount of 6.90% fixed rate debt secured by Avalon Orchards in advance of its scheduled maturity date, incurring a charge of $635,000, consisting of a prepayment penalty of $282,000 and the non-cash write-off of unamortized deferred financing costs of $353,000.

Table of Contents
The following table details our consolidated debt maturities for the next five years, excluding our Credit Facility and amounts outstanding related to communities classified as held for sale, for debt outstanding at December 31, 2018 and 2017 (dollars in thousands). We are not directly or indirectly (as borrower or guarantor) obligated in any material respect to pay principal or interest on the indebtedness of any unconsolidated entities in which we have an equity or other interest.
46
• In August 2018, we repaid $95,859,000 aggregate principal amount of variable rate debt secured by Avalon Calabasas, of which $51,449,000 was repaid at par at its scheduled maturity date, and $44,410,000 was repaid at par in advance of its April 2028 maturity date. We recognized a non-cash charge of $1,690,000 for the write-off of unamortized debt discount.
• In December 2018, we repaid $250,000,000 principal amount of 6.10% unsecured notes in advance of its March 2020 scheduled maturity, recognizing a charge of $8,926,000, consisting of a prepayment penalty of $8,579,000 and a non-cash write-off of deferred financing costs of $347,000.
• In December 2018, in conjunction with the formation of the NYC Joint Venture as discussed in Note 5, "Investments in Real Estate Entities" of our Consolidated Financial Statements, the following financing activities took place:
◦ We repaid $93,800,000 of variable rate debt secured by Avalon Bowery Place I in advance of its November 2037 maturity date. In conjunction with the repayment, we recognized a charge of $5,837,000, consisting of a prepayment penalty of $2,874,000 and the non-cash write-off of unamortized deferred financing costs of $2,963,000.
◦ We entered into a $93,800,000 fixed rate note secured by Avalon Bowery Place I, with a contractual interest rate of 4.01%, maturing in January 2029.
◦ We entered into a $39,639,000 fixed rate note secured by Avalon Bowery Place II, with a contractual interest rate of 4.01%, maturing in January 2029.
◦ We entered into a $12,500,000 fixed rate note secured by Avalon Morningside Park, with a contractual interest rate of 3.95%, maturing in January 2029.
◦ We entered into a $150,000,000 fixed rate note secured by Avalon West Chelsea and AVA High Line, a dual-branded community, with contractual interest rate of 4.01%, maturing in January 2029.
◦ The NYC Joint Venture then assumed the aggregate $295,939,000 of new borrowings discussed above, as well as the previously outstanding $100,000,000fixed rate note secured by Avalon Morningside Park with a contractual interest rate of 3.50%.

Table of Contents
47
All-In interest rate (1)
Principal maturity
date
Balance Outstanding (2) Scheduled Maturities
Community 12/31/2017 12/31/2018 2019 2020 2021 2022 2023 Thereafter
Tax-exempt bonds
Fixed rate
Avalon Oaks West 7.55% Apr-2043 (3) $ 15,213 $ — $ — $ — $ — $ — $ — $ — Avalon at Chestnut Hill 6.16% Oct-2047 38,097 37,561 566 596 629 663 699 34,408 Avalon Westbury 3.86% Nov-2036 (4) 62,200 62,200 — — — — — 62,200
115,510 99,761 566 596 629 663 699 96,608
Variable rate Eaves Mission Viejo 2.58% Jun-2025 (5) 7,635 7,635 — — — — — 7,635 AVA Nob Hill 2.83% Jun-2025 (5) 20,800 20,800 — — — — — 20,800 Avalon Campbell 3.14% Jun-2025 (5) 38,800 38,800 — — — — — 38,800 Eaves Pacifica 3.18% Jun-2025 (5) 17,600 17,600 — — — — — 17,600 Avalon Bowery Place I 4.24% Nov-2037 (6) 93,800 — — — — — — — Avalon Acton 2.74% Jul-2040 (5) 45,000 45,000 — — — — — 45,000 Avalon Morningside Park 3.36% May-2046 (7) 100,000 — — — — — — — Avalon Clinton North 3.40% Nov-2038 (5) 147,000 147,000 — — — — — 147,000 Avalon Clinton South 3.40% Nov-2038 (5) 121,500 121,500 — — — — — 121,500 Avalon Midtown West 3.31% May-2029 (5) 100,500 100,500 — — — — — 100,500 Avalon San Bruno I 3.29% Dec-2037 (5) 64,450 64,450 — — — — — 64,450 Avalon Calabasas 2.68% Apr-2028 (3) 44,410 — — — — — — —
801,495 563,285 — — — — — 563,285 Conventional loans Fixed rate
$250 million unsecured notes 6.19% Mar-2020 (3) 250,000 — — — — — — — $250 million unsecured notes 4.04% Jan-2021 250,000 250,000 — — 250,000 — — — $450 million unsecured notes 4.30% Sep-2022 450,000 450,000 — — — 450,000 — — $250 million unsecured notes 3.00% Mar-2023 250,000 250,000 — — — — 250,000 — $400 million unsecured notes 3.78% Oct-2020 400,000 400,000 — 400,000 — — — — $350 million unsecured notes 4.30% Dec-2023 350,000 350,000 — — — — 350,000 — $300 million unsecured notes 3.66% Nov-2024 300,000 300,000 — — — — — 300,000 $525 million unsecured notes 3.55% Jun-2025 525,000 525,000 — — — — — 525,000 $300 million unsecured notes 3.62% Nov-2025 300,000 300,000 — — — — — 300,000 $475 million unsecured notes 3.35% May-2026 475,000 475,000 — — — — — 475,000 $300 million unsecured notes 3.01% Oct-2026 300,000 300,000 — — — — — 300,000 $350 million unsecured notes 3.95% Oct-2046 350,000 350,000 — — — — — 350,000 $400 million unsecured notes 3.50% May-2027 400,000 400,000 — — — — — 400,000 $300 million unsecured notes 4.09% Jul-2047 300,000 300,000 — — — — — 300,000 $450 million unsecured notes 3.32% Jan-2028 450,000 450,000 — — — — — 450,000 $300 million unsecured notes 3.97% Apr-2048 — 300,000 — — — — — 300,000 Avalon Orchards 7.80% Jul-2033 (3) 15,579 — — — — — — — Avalon Walnut Creek 4.00% Jul-2066 3,557 3,699 — — — — — 3,699 AVA Pasadena 4.06% Jun-2018 (3) 11,073 — — — — — — — Eaves Los Feliz 3.68% Jun-2027 41,400 41,400 — — — — — 41,400 Eaves Woodland Hills 3.67% Jun-2027 111,500 111,500 — — — — — 111,500 Avalon Russett 3.77% Jun-2027 32,200 32,200 — — — — — 32,200 Avalon San Bruno II 3.85% Apr-2021 29,533 28,999 564 591 27,844 — — — Avalon Westbury 4.88% Nov-2036 (4) 16,450 15,095 1,430 1,495 1,575 1,655 1,740 7,200 Avalon San Bruno III 3.18% Jun-2020 53,315 52,090 1,264 50,826 — — — — Avalon Andover 3.28% Apr-2018 13,498 — — — — — — — Avalon Natick 3.15% Apr-2019 13,831 13,482 13,482 — — — — — Avalon Hoboken 3.55% Dec-2020 67,904 67,904 — 67,904 — — — — Avalon Columbia Pike 3.24% Nov-2019 68,637 67,085 67,085 — — — — —
5,828,477 5,833,454 83,825 520,816 279,419 451,655 601,740 3,895,999

Table of Contents
_________________________________
Future Financing and Capital Needs—Portfolio and Capital Markets Activity In 2019, we expect to meet our liquidity needs from a variety of internal and external sources, including (i) real estate dispositions, (ii) cash balances on hand as well as cash generated from our operating activities, (iii) borrowing capacity under our Credit Facility and (iv) secured and unsecured debt financings. Additional sources of liquidity in 2019 may include the issuance of common and preferred equity. Our ability to obtain additional financing will depend on a variety of factors such as market conditions, the general availability of credit, the overall availability of credit to the real estate industry, our credit ratings and credit capacity, as well as the perception of lenders regarding our long or short-term financial prospects. Before beginning new construction or reconstruction activity, including activity related to communities owned by unconsolidated joint ventures, we intend to plan adequate financing to complete these undertakings, although we cannot assure you that we will be able to obtain such financing. In the event that financing cannot be obtained, we may have to abandon Development Rights, write off associated pre-development costs that were capitalized and/or forego reconstruction activity. In such instances, we will not realize the increased revenues and earnings that we expected from such Development Rights or reconstruction activity and significant losses could be incurred. From time to time we use joint ventures to hold or develop individual real estate assets. We generally employ joint ventures primarily to mitigate asset concentration or market risk and secondarily as a source of liquidity. We may also use joint ventures related to mixed-use land development opportunities where our partners bring development and operational expertise to the venture. Each joint venture or partnership agreement has been individually negotiated, and our ability to operate and/or dispose of a community in our sole discretion may be limited to varying degrees depending on the terms of the joint venture or partnership agreement. We cannot assure you that we will achieve our objectives through joint ventures. In evaluating our allocation of capital within our markets, we sell assets that do not meet our long-term investment criteria or when capital and real estate markets allow us to realize a portion of the value created over our ownership periods and redeploy the proceeds from those sales to develop and redevelop communities. Because the proceeds from the sale of communities may not be immediately redeployed into revenue generating assets that we develop, redevelop or acquire, the immediate effect of a sale of a community for a gain is to increase net income, but reduce future total revenues, total expenses and NOI until such time as the proceeds have been redeployed into revenue generating assets. We believe that the temporary absence of future cash flows from communities sold will not have a material impact on our ability to fund future liquidity and capital resource needs.
48
All-In interest rate (1)
Principal maturity
date
Balance Outstanding (2) Scheduled Maturities
Community 12/31/2017 12/31/2018 2019 2020 2021 2022 2023 Thereafter
Variable rate Avalon Calabasas 2.40% Aug-2018 52,092 — — — — — — — Avalon Natick 4.51% Apr-2019 (5) 35,039 34,155 34,155 — — — — — Archstone Lexington 4.18% Oct-2020 21,700 21,700 — 21,700 — — — — Term Loan - $100 million 3.44% Feb-2022 100,000 100,000 — — — 100,000 — — Term Loan - $150 million 3.98% Feb-2024 150,000 150,000 — — — — — 150,000 $300 million unsecured notes 3.05% Jan-2021 300,000 300,000 — — 300,000 — — —
658,831 605,855 34,155 21,700 300,000 100,000 — 150,000
Total indebtedness - excluding Credit Facility $ 7,404,313 $ 7,102,355 $ 118,546 $ 543,112 $ 580,048 $ 552,318 $ 602,439 $ 4,705,892
(1) Includes credit enhancement fees, facility fees, trustees’ fees, the impact of interest rate hedges, offering costs, mark to market amortization and other fees.
(2) Balances outstanding represent total amounts due at maturity, and exclude deferred financing costs and debt discount for the unsecured notes of $44,007 and $47,236 as of December 31, 2018 and 2017, respectively, deferred financing costs and debt discount associated with secured notes of $18,085 and $27,607 as of December 31, 2018 and 2017, respectively, as reflected on our Consolidated Balance Sheets included elsewhere in this report.
(3) During 2018, we repaid this borrowing in advance of its scheduled maturity date.
(4) Maturity date reflects the contractual maturity of the underlying bond. There is also an associated earlier credit enhancement maturity date.
(5) Financed by variable rate debt, but interest rate is capped through an interest rate protection agreement.
(6) During 2018, we refinanced this borrowing in advance of its scheduled maturity date and it was subsequently assumed by the NYC Joint Venture, in which we own a 20.0% interest, as discussed above.
(7) During 2018, this borrowing was assumed by the NYC Joint Venture, in which we own a 20.0% interest, as discussed above.

Table of Contents Unconsolidated Real Estate Investments and Off-Balance Sheet Arrangements Unconsolidated Investments During 2018, we contributed five wholly-owned operating communities located in New York, NY to a newly formed joint venture (the "NYC Joint Venture"), for net cash proceeds of $276,799,000 and the assumption of $395,939,000 of secured indebtedness by the venture, recognizing a gain on sale of $179,861,000. We retained a 20.0% interest in the venture and are acting as the managing member of the venture as well as the property manager for the communities. The five communities contain an aggregate of 1,301 apartment homes and 58,000 square feet of retail space. In conjunction with the formation of the venture, we entered into the refinancing and borrowing activities discussed in "Liquidity and Capital Resources, Future Financing and Capital Needs—Debt Maturities" and the venture assumed all outstanding indebtedness. The U.S. Fund has six institutional investors, including us. We are the general partner of the U.S. Fund and, excluding costs incurred in excess of our equity in the underlying net assets of the U.S. Fund, we have an equity investment of $31,194,000 (net of distributions), representing a 28.6% combined equity interest. The U.S. Fund was formed in July 2011 and is fully invested. The U.S. Fund has a term that expires in July 2023, assuming the exercise of two, one-year extension options. During 2018, the U.S. Fund sold one community containing 131 apartment homes for a sales price of $85,500,000. Our share of the gain was $8,636,000. In conjunction with the disposition of this community, the U.S. Fund repaid $27,928,000 of related secured indebtedness in advance of the scheduled maturity date. The AC JV has four institutional investors, including us. Excluding costs incurred in excess of our equity in the underlying net assets of the AC JV, we have an equity investment of $34,799,000 (net of distributions), representing a 20.0% equity interest. The AC JV was formed in 2011. During 2018, the AC JV sold one community containing 392 apartment homes for a sales price of $94,250,000. Our proportionate share of the gain in accordance with GAAP was $2,019,000. In conjunction with the disposition of this community, the AC JV repaid a $50,647,000 loan to the equity investors in the venture at par. During 2016, we entered into a joint venture to develop, own, and operate AVA North Point, an apartment community located in Cambridge, MA, which completed construction during 2018 and contains 265 apartment homes. We own a 55.0% interest in the venture, and the venture partner owns the remaining 45.0% interest. AVA North Point is the third phase of a master planned development, the other phases of which are owned through the AC JV. During 2016, we provided the partners of the AC JV the opportunity to acquire the AVA North Point land parcel we owned as required in the right of first offer (“ROFO”) provisions for the AC JV. After certain partners of the AC JV declined to participate, we entered into the new joint venture and sold the land parcel to the venture in exchange for a cash payment and a capital account credit, and managed the development of AVA North Point in exchange for a developer fee. Upon sale of the land parcel, we recognized a gain of $10,621,000. At December 31, 2018, excluding costs incurred in excess of our equity in the underlying net assets of AVA North Point, we have an equity investment of $45,162,000. During 2015, we entered into a joint venture agreement to purchase land and pursue entitlements and pre-development activity for a mixed-use development project in Sudbury, MA, including multifamily apartment homes, retail, senior housing and age-restricted housing. We have a 60.0% ownership interest in the venture. During 2017, we and our joint venture partner each acquired our respective portions of the real estate held by the venture, with our portion consisting of a parcel of land on which we are developing an apartment community, acquired for an investment of $19,200,000. Along with our joint venture partner, we retained continuing involvement with the venture to fund the completion of the planned infrastructure and site work which is substantially complete as of December 31, 2018. As part of the Archstone Acquisition we entered into a limited liability company agreement with Equity Residential, through which we assumed obligations of Archstone in the form of preferred interests, some of which are governed by tax protection arrangements (the “Legacy JV”). We have a 40.0% interest in the Legacy JV. During the years ended December 31, 2018, 2017 and 2016, the Legacy JV redeemed certain of the preferred interests and paid accrued dividends, of which our portion was $1,120,000, $2,000,000 and $1,960,000, respectively. At December 31, 2018, the remaining preferred interests had an aggregate liquidation value of $36,806,000, our 40.0% share of which was included in accrued expenses and other liabilities in the accompanying Consolidated Balance Sheets presented elsewhere in this report.
49

Table of Contents In conjunction with the Archstone Acquisition, through subsidiaries, we entered into three limited liability company agreements with Equity Residential (collectively, the “Residual JV”) through which we and Equity Residential acquired (i) certain assets of Archstone that we and Equity Residential have divested (the “Residual Assets”), and (ii) various liabilities of Archstone that we and Equity Residential agreed to assume (the “Residual Liabilities”). The Residual Assets included various licenses, insurance policies, contracts, office leases and other miscellaneous assets. The Residual Liabilities include most existing or future litigation and claims related to Archstone’s operations for periods before the close of the Archstone Acquisition, except for (i) claims that principally relate to the physical condition of the assets acquired directly by us or Equity Residential, which generally remain the sole responsibility of us or Equity Residential, as applicable, and (ii) certain tax and other litigation between Archstone and various equity holders in Archstone related to periods before the close of the Archstone Acquisition, and claims which may arise due to changes in the capital structure of Archstone that occurred prior to closing, for which the seller has agreed to indemnify us and Equity Residential. We jointly control the Residual JV with Equity Residential and we hold a 40.0% economic interest in the Residual JV. We believe our remaining potential obligations under the Residual JV will not have a material impact on our financial position or results of operations. In addition, during 2018, we held an investment in, and received the final distributions for Fund II. Fund II was established to engage in a real estate acquisition program through a discretionary investment fund. We believe this investment format provides the following attributes: (i) third-party joint venture equity as an additional source of financing to expand and diversify our portfolio; (ii) additional sources of income in the form of property management and asset management fees and, potentially, incentive distributions if the performance exceeds certain thresholds; and (iii) additional visibility into the transactions occurring in multifamily assets that helps us with other investment decisions related to our wholly-owned portfolio. Fund II had six institutional investors, including us. One of our wholly-owned subsidiaries was the general partner of Fund II and we had an equity interest of 31.3% combined general partner and limited partner equity interest. Upon achievement of a threshold return, we had a right to incentive distributions for our promoted interest which represented the first 40.0% of further Fund II distributions, which was in addition to our share of the remaining 60.0% of distributions. Fund II served as the exclusive vehicle for acquiring apartment communities from its formation in 2008 through the close of its investment period in August 2011. In 2017, Fund II sold its final apartment communities and we completed the dissolution of Fund II in 2018. As of December 31, 2018, we had investments in the following unconsolidated real estate entities accounted for under the equity method of accounting. Refer to Note 5, “Investments in Real Estate Entities,” of the Consolidated Financial Statements included elsewhere in this report, which includes information on the aggregate assets, liabilities and equity, as well as operating results, and our proportionate share of their operating results. For ventures holding operating apartment communities as of December 31, 2018, detail of the real estate and associated funding underlying our unconsolidated investments is presented in the following table (dollars in thousands).
50
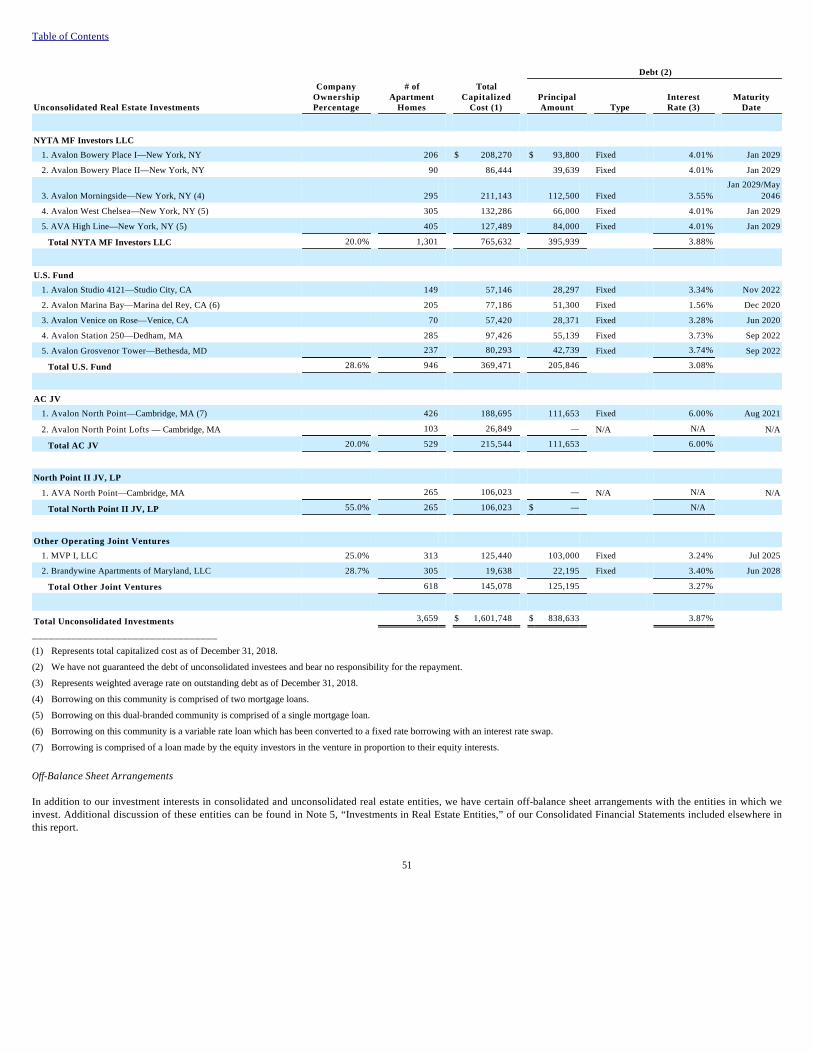
Table of Contents
_________________________________
Off-Balance Sheet Arrangements In addition to our investment interests in consolidated and unconsolidated real estate entities, we have certain off-balance sheet arrangements with the entities in which we invest. Additional discussion of these entities can be found in Note 5, “Investments in Real Estate Entities,” of our Consolidated Financial Statements included elsewhere in this report.
51
Debt (2)
Unconsolidated Real Estate Investments
Company Ownership Percentage
# of Apartment
Homes
Total Capitalized
Cost (1) Principal Amount Type
Interest Rate (3)
Maturity Date
NYTA MF Investors LLC
1. Avalon Bowery Place I—New York, NY 206 $ 208,270 $ 93,800 Fixed 4.01 % Jan 2029
2. Avalon Bowery Place II—New York, NY 90 86,444 39,639 Fixed 4.01 % Jan 2029
3. Avalon Morningside—New York, NY (4) 295 211,143 112,500 Fixed 3.55 % Jan 2029/May
2046
4. Avalon West Chelsea—New York, NY (5) 305 132,286 66,000 Fixed 4.01 % Jan 2029
5. AVA High Line—New York, NY (5) 405 127,489 84,000 Fixed 4.01 % Jan 2029
Total NYTA MF Investors LLC 20.0 % 1,301 765,632 395,939 3.88 %
U.S. Fund
1. Avalon Studio 4121—Studio City, CA 149 57,146 28,297 Fixed 3.34 % Nov 2022
2. Avalon Marina Bay—Marina del Rey, CA (6) 205 77,186 51,300 Fixed 1.56 % Dec 2020
3. Avalon Venice on Rose—Venice, CA 70 57,420 28,371 Fixed 3.28 % Jun 2020
4. Avalon Station 250—Dedham, MA 285 97,426 55,139 Fixed 3.73 % Sep 2022
5. Avalon Grosvenor Tower—Bethesda, MD 237 80,293 42,739 Fixed 3.74 % Sep 2022
Total U.S. Fund 28.6 % 946 369,471 205,846 3.08 %
AC JV
1. Avalon North Point—Cambridge, MA (7) 426 188,695 111,653 Fixed 6.00 % Aug 2021
2. Avalon North Point Lofts — Cambridge, MA 103 26,849 — N/A N/A N/A
Total AC JV 20.0 % 529 215,544 111,653 6.00 %
North Point II JV, LP
1. AVA North Point—Cambridge, MA 265 106,023 — N/A N/A N/A
Total North Point II JV, LP 55.0 % 265 106,023 $ — N/A
Other Operating Joint Ventures
1. MVP I, LLC 25.0 % 313 125,440 103,000 Fixed 3.24 % Jul 2025
2. Brandywine Apartments of Maryland, LLC 28.7 % 305 19,638 22,195 Fixed 3.40 % Jun 2028
Total Other Joint Ventures 618 145,078 125,195 3.27 %
Total Unconsolidated Investments 3,659 $ 1,601,748 $ 838,633 3.87 %
(1) Represents total capitalized cost as of December 31, 2018.
(2) We have not guaranteed the debt of unconsolidated investees and bear no responsibility for the repayment.
(3) Represents weighted average rate on outstanding debt as of December 31, 2018.
(4) Borrowing on this community is comprised of two mortgage loans.
(5) Borrowing on this dual-branded community is comprised of a single mortgage loan.
(6) Borrowing on this community is a variable rate loan which has been converted to a fixed rate borrowing with an interest rate swap.
(7) Borrowing is comprised of a loan made by the equity investors in the venture in proportion to their equity interests.

Table of Contents We have not guaranteed the debt of our unconsolidated real estate entities, as referenced in the table above, nor do we have any obligation to fund this debt should the unconsolidated real estate entities be unable to do so. In the future, in the event the unconsolidated real estate entities were unable to meet their obligations under a loan, we cannot predict at this time whether we would provide any voluntary support, or take any other action, as any such action would depend on a variety of factors, including the amount of support required and the possibility that such support could enhance the return of the unconsolidated real estate entities and/or our returns by providing time for performance to improve. There are no other material lines of credit, side agreements, financial guarantees or any other derivative financial instruments related to or between our unconsolidated real estate entities and us. In evaluating our capital structure and overall leverage, management takes into consideration our proportionate share of the indebtedness of unconsolidated entities in which we have an interest. Contractual Obligations Scheduled contractual obligations required for the next five years and thereafter are as follows as of December 31, 2018 (dollars in thousands):
_________________________________
Inflation and Deflation Substantially all of our apartment leases are for a term of one year or less. In an inflationary environment, this may allow us to realize increased rents upon renewal of existing leases or the beginning of new leases. Short-term leases generally minimize our risk from the adverse effect of inflation, although these leases generally permit residents to leave at the end of the lease term and therefore expose us to the effect of a decline in market rents. Similarly, in a deflationary rent environment, we may be exposed to declining rents more quickly under these shorter-term leases. Recent U.S. Federal Income Tax Updates This summary is for general information purposes only and is not tax advice. This discussion does not address all aspects of taxation that may be relevant to particular holders of our securities in light of their personal investment or tax circumstances. The following discussion supplements and updates the disclosures under “Federal Income Tax Considerations and Consequences of Your Investment” in the prospectus dated February 23, 2018 contained in our Registration Statement on Form S-3 filed with the SEC on February 23, 2018. Consolidated Appropriations Act Updates On March 23, 2018, the Consolidated Appropriations Act, 2018 (the “CAA”) was enacted. The CAA amended various provisions of the Code and implicate certain tax-related disclosures contained in the prospectus. As a result, the discussion under “Federal Income Tax Considerations and Consequences of Your Investment-U.S. Taxation of Non-U.S. Stockholders-Special FIRPTA Rules” of the prospectus is replaced with the following paragraphs:
52
Payments due by period
Total Less than 1
Year 1-3 Years 3-5 Years More than 5
Years
Debt Obligations $ 7,102,355 $ 118,546 $ 1,123,160 $ 1,154,757 $ 4,705,892 Interest on Debt Obligations (1) 2,578,835 257,366 465,374 386,854 1,469,241 Operating Lease Obligations (2) 504,865 14,166 25,062 25,656 439,981 Capital Lease Obligations (2)(3) 46,618 1,075 2,157 2,166 41,220
$ 10,232,673 $ 391,153 $ 1,615,753 $ 1,569,433 $ 6,656,334
(1) Interest payments on variable rate debt obligations are calculated based on the rate as of December 31, 2018.
(2) Includes land leases expiring between October 2026 and March 2142. Amounts do not include any adjustment for purchase options available under the land leases.
(3) Aggregate capital lease payments include $26,375 in interest costs.
Table of Contents
Special FIRPTA Rules. To the extent our stock is held directly (or indirectly through one or more partnerships) by a “qualified shareholder,” it will not be treated as a U.S. real property interest for such qualified shareholder. Further, to the extent such treatment applies, any distribution to such shareholder will not be treated as gain recognized from the sale or exchange of a U.S. real property interest. For these purposes, a qualified shareholder is generally a non-U.S. stockholder that (i)(A) is eligible for treaty benefits under an income tax treaty with the United States that includes an exchange of information program, and the principal class of interests of which is listed and regularly traded on one or more stock exchanges as defined by the treaty, or (B) is a foreign limited partnership organized in a jurisdiction with an exchange of information agreement with the United States and that has a class of regularly traded limited partnership units (having a value greater than 50% of the value of all partnership units) on the New York Stock Exchange or Nasdaq, (ii) is a “qualified collective investment vehicle” (within the meaning of Section 897(k)(3)(B) of the Code) and (iii) maintains records of persons holding 5% or more of the class of interests described in clauses (i)(A) or (i)(B) above. However, in the case of a qualified shareholder having one or more “applicable investors,” the exception described in the first sentence of this paragraph will not apply to the applicable percentage of the qualified shareholder's stock (with “applicable percentage” generally meaning the percentage of the value of the interests in the qualified shareholder held by applicable investors after applying certain constructive ownership rules). The applicable percentage of the amount realized by a qualified shareholder on the disposition of our stock or with respect to a distribution from us attributable to gain from the sale or exchange of a U.S. real property interest will be treated as amounts realized from the disposition of U.S. real property interest. Such treatment shall also apply to applicable investors in respect of distributions treated as a sale or exchange of stock with respect to a qualified shareholder. For these purposes, an “applicable investor” is a person (other than a qualified shareholder) who generally holds an interest in the qualified shareholder and holds more than 10% of our stock applying certain constructive ownership rules. For FIRPTA purposes, a “qualified foreign pension fund” shall not be treated as a non-U.S. stockholder, and any entity all of the interests of which are held by an qualified foreign pension fund shall be treated as such a fund. A "qualified foreign pension fund" is an organization or arrangement (i) created or organized in a foreign country, (ii) established to provide retirement or pension benefits to current or former employees (including self-employed individuals) or their designees by either (A) a foreign country as a result of services rendered by such employees to their employers, or (B) one or more employers in consideration for services rendered by such employees to such employers, (iii) which does not have a single participant or beneficiary that has a right to more than 5% of its assets or income, (iv) which is subject to government regulation and with respect to which annual information about its beneficiaries is provided, or is otherwise available, to relevant local tax authorities and (v) with respect to which, under its local laws, (A) contributions that would otherwise be subject to tax are deductible or excluded from its gross income or taxed at a reduced rate, or (B) taxation of its investment income is deferred, or such income is excluded from its gross income or taxed at a reduced rate.
In addition, the CAA clarified that for purposes of determining if a REIT is a “domestically controlled qualified investment entity” under FIRPTA, the presumption that generally a person holding less than 5% of a REIT’s class of stock that is regularly traded on an established securities market in the United States for five years has been, and will be, treated as a U.S. person applies for testing periods ending on or after December 18, 2015 (e.g., if a testing period ends on June 1, 2018, then the presumption applies for the entire five-year period starting on June 1, 2013). The CAA also amended numerous Code provisions relating to the new rules applicable to federal income tax audits of partnerships effective for taxable years beginning after December 31, 2017 to provide that a broader range of partnership-related items may be adjusted on audit or in other tax proceedings. Recent FATCA Regulations On December 18, 2018, the Internal Revenue Service promulgated proposed Treasury Regulations under Sections 1471-1474 of the Code (commonly referred to as FATCA), which proposed regulations eliminate FATCA withholding on gross proceeds of a disposition of property that can produce U.S. source interest or dividends and thus implicate certain tax-related disclosures contained in the prospectus. While these proposed Treasury Regulations have not yet been finalized, taxpayers are generally entitled to rely on the proposed Treasury Regulations (subject to certain limited exceptions). As a result, the following revisions are made to the prospectus:
53
• In the first sentence of the fourth paragraph under “Federal Income Tax Considerations and Consequences of Your Investment - Taxation of Non-U.S. Holders of Debt Securities - Disposition of the Debt Securities,” of the prospectus, the phrase “subject to the discussion below regarding FATCA withholding” is deleted; and

Table of Contents
Other U.S. Federal Income Tax Withholding and Reporting Requirements; FATCA. The FATCA provisions of the Code, subject to administrative guidance and certain intergovernmental agreements entered into thereunder, impose a 30% withholding tax on certain types of payments made to “foreign financial institutions” and certain other non-U.S. entities unless (i) the foreign financial institution undertakes certain diligence and reporting obligations or (ii) the foreign non-financial entity either certifies it does not have any substantial United States owners or furnishes identifying information regarding each substantial United States owner. If the payee is a foreign financial institution that is not subject to special treatment under certain intergovernmental agreements, it must enter into an agreement with the United States Treasury Department requiring, among other things, that it undertakes to identify accounts held by certain United States persons or United States-owned foreign entities, annually report certain information about such accounts, and withhold 30% on payments to account holders whose actions prevent them from complying with these reporting and other requirements. Investors in jurisdictions that have entered into “intergovernmental agreements” may, in lieu of the foregoing requirements, be required to report such information to their home jurisdictions. The compliance requirements under FATCA are complex and special requirements may apply to certain categories of payees.
Clarification Finally, the discussion under “Federal Income Tax Considerations and Consequences of Your Investment-U.S. Taxation of Non-U.S. Stockholders-Distributions by AvalonBay” of the prospectus is clarified to explain that the exception to FIPRTA for 10% or smaller holders may apply only if our common stock is regularly traded an established securities market located in the United States. Forward-Looking Statements This Form 10-K contains “forward-looking statements” as that term is defined under the Private Securities Litigation Reform Act of 1995. You can identify forward-looking statements by our use of the words “believe,” “expect,” “anticipate,” “intend,” “estimate,” “assume,” “project,” “plan,” “may,” “shall,” “will” and other similar expressions in this Form 10-K, that predict or indicate future events and trends and that do not report historical matters. These statements include, among other things, statements regarding our intent, belief or expectations with respect to:
We cannot assure the future results or outcome of the matters described in these statements; rather, these statements merely reflect our current expectations of the approximate outcomes of the matters discussed. We do not undertake a duty to update these forward-looking statements, and therefore they may not represent our estimates and assumptions after the date of this report. You should not rely on forward-looking statements because they involve known and unknown risks, uncertainties and other factors, some of which are beyond our control. These risks, uncertainties and other factors may cause our actual results, performance or achievements
54
• The paragraph under “Federal Income Tax Considerations and Consequences of Your Investment - Other Tax Consequences for Avalon Bay, its Stockholders, and Holders of its Debt Securities - Other U.S. Federal Income Tax Withholding and Reporting Requirements; FATCA” of the prospectus is replaced with the following:
• our potential development, redevelopment, acquisition or disposition of communities;• the timing and cost of completion of apartment communities under construction, reconstruction, development or redevelopment;• the timing of lease-up, occupancy and stabilization of apartment communities;• the pursuit of land on which we are considering future development;• the anticipated operating performance of our communities;• cost, yield, revenue, NOI and earnings estimates;• our declaration or payment of dividends;• our joint venture and discretionary fund activities;• our policies regarding investments, indebtedness, acquisitions, dispositions, financings and other matters;• our qualification as a REIT under the Internal Revenue Code;• the real estate markets in Northern and Southern California, Denver, Colorado, and Southeast Florida, and markets in selected states in the Mid-Atlantic, New England,
Metro New York/New Jersey and Pacific Northwest regions of the United States and in general; • the availability of debt and equity financing;• interest rates;• general economic conditions including the potential impacts from current economic conditions; • trends affecting our financial condition or results of operations; and• the impact of outstanding legal proceedings.
Table of Contents to differ materially from the anticipated future results, performance or achievements expressed or implied by these forward-looking statements. You should carefully review the discussion under Item 1A. “Risk Factors” in this report for further discussion of risks associated with forward-looking statements. Some of the factors that could cause our actual results, performance or achievements to differ materially from those expressed or implied by these forward-looking statements include, but are not limited to, the following:
Critical Accounting Policies The preparation of financial statements in conformity with GAAP requires management to use judgment in the application of accounting policies, including making estimates and assumptions. If our judgment or interpretation of the facts and circumstances relating to various transactions had been different, or different assumptions were made, it is possible that different accounting policies would have been applied, resulting in different financial results or a different presentation of our financial statements. Below is a discussion of the accounting policies that we consider critical to an understanding of our financial condition and operating results that may require complex or significant judgment in their application or require estimates about matters which are inherently uncertain. A discussion of our significant accounting policies, including further discussion of the accounting policies described below, can be found in Note 1, “Organization, Basis of Presentation and Significant Accounting Policies,” of our Consolidated Financial Statements. Principles of Consolidation We may enter into various joint venture agreements with unrelated third parties to hold or develop real estate assets. We must determine for each of these ventures whether to consolidate the entity or account for our investment under the equity or cost basis of accounting. We determine whether to consolidate certain entities based on our rights and obligations under the joint venture agreements, applying the applicable accounting guidance. For investment interests that we do not consolidate, we evaluate the guidance to determine the accounting framework to apply. The application of the rules in evaluating the accounting treatment for each joint venture is complex and requires substantial management judgment. Therefore, we believe the decision to choose an appropriate accounting framework is a critical accounting estimate. If we were to consolidate the joint ventures that we accounted for using the equity method at December 31, 2018, our assets would have increased by $1,247,749,000 and our liabilities would have increased by $741,282,000. We would be required to consolidate those joint ventures currently not consolidated for financial reporting purposes if the facts and circumstances changed, including but not limited to the following reasons, none of which are currently expected to occur:
55
• we may fail to secure development opportunities due to an inability to reach agreements with third parties to obtain land at attractive prices or to obtain desired zoning and other local approvals;
• we may abandon or defer development opportunities for a number of reasons, including changes in local market conditions which make development less desirable, increases in costs of development, increases in the cost of capital or lack of capital availability, resulting in losses;
• construction costs of a community may exceed our original estimates;• we may not complete construction and lease-up of communities under development or redevelopment on schedule, resulting in increased interest costs and
construction costs and a decrease in our expected rental revenues; • occupancy rates and market rents may be adversely affected by competition and local economic and market conditions which are beyond our control;• financing may not be available on favorable terms or at all, and our cash flows from operations and access to cost effective capital may be insufficient for the
development of our pipeline which could limit our pursuit of opportunities; • our cash flows may be insufficient to meet required payments of principal and interest, and we may be unable to refinance existing indebtedness or the terms of such
refinancing may not be as favorable as the terms of existing indebtedness; • we may be unsuccessful in our management of the U.S. Fund, the AC JV or the REIT vehicles that are used with each respective joint venture; • we may be unsuccessful in managing changes in our portfolio composition; and• our expectations, estimates and assumptions regarding outstanding legal proceedings are subject to change.
• For entities not considered to be variable interest entities, the nature of the entity changed such that it would be considered a variable interest entity and we were considered the primary beneficiary.

Table of Contents
We evaluate our accounting for investments on a regular basis including when a significant change in the design of an entity occurs. Cost Capitalization We capitalize costs during the development of assets. Capitalization begins when we determine that development of a future asset is probable and continues until the asset, or a portion of the asset, is delivered and is ready for its intended use. For redevelopment efforts, we capitalize costs either (i) in advance of taking apartment homes out of service when significant renovation of the common area has begun and continue until the redevelopment is completed, or (ii) when an apartment home is taken out of service for redevelopment and continue until the redevelopment is completed and the apartment home is available for a new resident. Rental income and operating expenses incurred during the initial lease-up or post-redevelopment lease-up period are fully recognized in earnings as they accrue. During the development and redevelopment efforts we capitalize all direct costs and indirect costs which have been incurred as a result of the development and redevelopment activities. These costs include interest and related loan fees, property taxes as well as other direct and indirect costs. Interest is capitalized for any project-specific financing, as well as for general corporate financing to the extent of our aggregate investment in the projects. Indirect project costs, which include personnel and office and administrative costs that are clearly associated with our development and redevelopment efforts, are also capitalized. Capitalized indirect costs associated with our development and redevelopment activities are comprised primarily of compensation related costs for associates dedicated to our development and redevelopment efforts and total $46,857,000, $47,063,000 and $45,201,000 for 2018, 2017 and 2016, respectively. The estimation of the direct and indirect costs to capitalize as part of our development and redevelopment activities requires judgment and, as such, we believe cost capitalization to be a critical accounting estimate. There may be a change in our operating expenses in the event that there are changes in accounting guidance governing capitalization or changes to our levels of development or redevelopment activity. If changes in the accounting guidance limit our ability to capitalize costs or if we reduce our development and redevelopment activities without a corresponding decrease in indirect project costs, there may be an increase in our operating expenses. We capitalize pre-development costs incurred in pursuit of Development Rights. These costs include legal fees, design fees and related overhead costs. Future development of these pursuits is dependent upon various factors, including zoning and regulatory approval, rental market conditions, construction costs and availability of capital. Pre-development costs incurred for pursuits for which future development is not yet considered probable are expensed as incurred. In addition, if the status of a Development Right changes, making future development no longer probable, any capitalized pre-development costs are written off with a charge to expense. Due to the subjectivity in determining whether a pursuit will result in the development of an apartment community, and therefore should be capitalized, the accounting for pursuit costs is a critical accounting estimate. As of December 31, 2018, capitalized pursuit costs associated with Development Rights totaled $47,443,000. Abandoned Pursuit Costs & Asset Impairment We evaluate our real estate and other long-lived assets for impairment when potential indicators of impairment exist. If events or circumstances indicate that the carrying amount of a property may not be recoverable, we assess its recoverability by comparing the carrying amount of the property to its estimated undiscounted future cash flows. If the carrying amount exceeds the aggregate undiscounted future cash flows, we recognize an impairment loss to the extent the carrying amount exceeds the estimated fair value of the property. We assess land held for development for impairment if our intent changes with respect to the development of the land. We evaluate our unconsolidated investments for impairment, considering both the carrying value of the investment, estimated to be the expected proceeds that it would receive if the entity were dissolved and the net assets were liquidated, as well as our proportionate share of any impairment of assets held by unconsolidated investments. We expense costs related to abandoned pursuits, which include the abandonment of Development Rights and disposition pursuits. These costs can vary greatly, and the costs incurred in any given period may be significantly different in future years. Our focus on value creation through real estate development presents an impairment risk in the event of a future deterioration of the real estate and/or capital markets or a decision by us to reduce or cease development. We cannot predict the occurrence of future events that may cause an impairment assessment to be performed, or the likelihood of any future impairment charges, if any. You should also review Item 1A. “Risk Factors” in this Form 10-K.
56
• For entities in which we do not hold a controlling voting and/or variable interest, the contractual arrangement changed resulting in our investment interest being either a controlling voting and/or variable interest.

Table of Contents REIT Status We are a Maryland corporation that has elected to be treated, for U.S. federal income tax purposes, as a REIT. We elected to be taxed as a REIT under the Code for the year ended December 31, 1994 and have not revoked such election. A REIT is a corporate entity which holds real estate interests and must meet a number of organizational and operational requirements, including a requirement that it currently distribute at least 90% of its adjusted taxable income to stockholders. As a REIT, we generally will not be subject to corporate level federal income tax on our taxable income if we annually distribute 100% of our taxable income to our stockholders. If we fail to qualify as a REIT in any taxable year, we will be subject to regular federal and state corporate income taxes and may not be able to elect to qualify as a REIT for four subsequent taxable years. For example, if we failed to qualify as a REIT in 2018, our net income would have decreased by approximately $266,240,000. Our qualification as a REIT requires management to exercise significant judgment and consideration with respect to operational matters and accounting treatment. Therefore, we believe our REIT status is a critical accounting estimate. Acquisition of Investments in Real Estate We assess each acquisition of an operating community to determine if it meets the definition of a business or if it qualifies as an asset acquisition. We expect that acquisitions of individual operating communities will generally be viewed as asset acquisitions, and result in the capitalization of acquisition costs, and the allocation of purchase price to the assets acquired and liabilities assumed based on the relative fair value of the respective assets and liabilities.
57
Table of Contents ITEM 7A. QUANTITATIVE AND QUALITATIVE DISCLOSURES ABOUT MARKET RISK We are exposed to market risks from our financial instruments primarily from changes in market interest rates. We do not have exposure to any other significant market risk. We monitor interest rate risk as an integral part of our overall risk management, which recognizes the unpredictability of financial markets and seeks to reduce the potentially adverse effect on our results of operations. Our operating results are affected by changes in interest rates, primarily in short-term LIBOR and the SIFMA index as a result of borrowings under our Credit Facility and outstanding bonds and unsecured notes with variable interest rates. In addition, the fair value of our fixed rate unsecured and secured notes are impacted by changes in market interest rates. The effect of interest rate fluctuations on our results of operations historically has been small relative to other factors affecting operating results, such as rental rates and occupancy. We currently use interest rate protection agreements (consisting of interest rate swap and interest rate cap agreements) for our risk management objectives, as well as for compliance with the requirements of certain lenders, and not for trading or speculative purposes. During 2018, we entered into $250,000,000 of forward interest rate swap agreements to reduce the impact of variability in interest rates on a portion of our expected debt issuance activity in 2019. During 2018, we settled an aggregate of $300,000,000 of forward interest rate swap agreements entered into in 2017 in conjunction with the March 2018 unsecured note issuance. In addition, we have interest rate caps that serve to effectively limit the amount of interest rate expense we would incur on a floating rate borrowing. Further discussion of the financial instruments impacted and our exposure is presented below. As of December 31, 2018 and 2017, we had $1,169,140,000 and $1,460,326,000, respectively, in variable rate debt outstanding, with no amounts outstanding under our Credit Facility. If interest rates on the variable rate debt had been 100 basis points higher throughout 2018 and 2017, our annual interest incurred would have increased by approximately $14,963,000 and $14,867,000, respectively, based on balances outstanding during the applicable years. Because the counterparties providing the interest rate cap and swap agreements are major financial institutions which have an A or better credit rating by the Standard & Poor's Ratings Group, we do not believe there is exposure at this time to a default by a counterparty provider. In addition, changes in interest rates affect the fair value of our fixed rate debt, computed using quoted market prices for our unsecured notes or a discounted cash flow model for our secured notes, considering our current market yields, which impacts the fair value of our aggregate indebtedness. Debt securities and notes payable (including amounts outstanding under our Credit Facility) with an aggregate principal amount outstanding of $7,102,355,000 at December 31, 2018 had an estimated aggregate fair value of $6,774,153,000 at December 31, 2018. Contractual fixed rate debt represented $5,779,167,000 of the fair value at December 31, 2018. If interest rates had been 100 basis points higher as of December 31, 2018, the fair value of this fixed rate debt would have decreased by approximately $240,633,000. ITEM 8. FINANCIAL STATEMENTS AND SUPPLEMENTARY DATA The response to this Item 8 is included as a separate section of this Annual Report on Form 10-K. ITEM 9. CHANGES IN AND DISAGREEMENTS WITH ACCOUNTANTS ON ACCOUNTING AND FINANCIAL DISCLOSURE None. ITEM 9A. CONTROLS AND PROCEDURES
58
(a) Evaluation of Disclosure Controls and Procedures. As required by Rule 13a-15 under the Securities Exchange Act of 1934, as of the end of the period covered by this report, the Company carried out an evaluation under the supervision and with the participation of the Company's management, including the Company's Chief Executive Officer and Chief Financial Officer, of the effectiveness of the design and operation of the Company's disclosure controls and procedures. Based upon that evaluation, the Chief Executive Officer and Chief Financial Officer concluded that the Company's disclosure controls and procedures are effective to ensure that information required to be disclosed by the Company in the reports it files or submits under the Exchange Act is recorded, processed, summarized and reported within the time periods specified in the Securities and Exchange Commission's rules and forms. We continue to review and document our disclosure controls and procedures, including our internal controls and procedures for financial reporting, and may from time to time make changes aimed at enhancing their effectiveness and to ensure that our systems evolve with our business.

Table of Contents
Our internal control over financial reporting as of December 31, 2018 has been audited by Ernst & Young LLP, an independent registered public accounting firm, as stated in their report which is included elsewhere herein.
ITEM 9B. OTHER INFORMATION None.
59
(b) Management's Report on Internal Control Over Financial Reporting. Our management is responsible for establishing and maintaining adequate internal control over financial reporting, as such term is defined in Exchange Act Rules 13a-15(f) and 15d-15(f). Under the supervision and with the participation of our management, including our Chief Executive Officer and Chief Financial Officer, we conducted an evaluation of the effectiveness of our internal control over financial reporting as of December 31, 2018 based on the framework in Internal Control-Integrated Framework issued by the Committee of Sponsoring Organizations of the Treadway Commission (COSO). Based on that evaluation, our management concluded that our internal control over financial reporting was effective as of December 31, 2018.
(c) Changes in Internal Control Over Financial Reporting. As of January 1, 2018, the Company adopted ASU 2014-09, Revenue from Contracts with Customers. The Company implemented internal controls related to the revenue recognition process, but there were no significant changes to the internal control over financial reporting due to the adoption of this new standard.

Table of Contents
PART III ITEM 10. DIRECTORS, EXECUTIVE OFFICERS AND CORPORATE GOVERNANCE The information required by Item 10 pertaining to directors and executive officers of the Company and the Company's Code of Conduct is incorporated herein by reference to the Company's Proxy Statement to be filed with the Securities and Exchange Commission within 120 days after the end of the year covered by this Form 10-K with respect to the Annual Meeting of Stockholders scheduled to be held on May 16, 2019. ITEM 11. EXECUTIVE COMPENSATION The information required by Item 11 pertaining to executive compensation is incorporated herein by reference to the Company's Proxy Statement to be filed with the Securities and Exchange Commission within 120 days after the end of the year covered by this Form 10-K with respect to the Annual Meeting of Stockholders scheduled to be held on May 16, 2019. ITEM 12. SECURITY OWNERSHIP OF CERTAIN BENEFICIAL OWNERS AND MANAGEMENT AND RELATED STOCKHOLDER MATTERS The information required by Item 12 pertaining to security ownership of management and certain beneficial owners of the Company's common stock is incorporated herein by reference to the Company's Proxy Statement to be filed with the Securities and Exchange Commission within 120 days after the end of the year covered by this Form 10-K with respect to the Annual Meeting of Stockholders scheduled to be held on May 16, 2019, to the extent not set forth below. The Company maintains the Second Amended and Restated 2009 Equity Incentive Plan (the “2009 Plan”) and the 1996 Non-Qualified Employee Stock Purchase Plan (the “ESPP”), pursuant to which common stock or other equity awards may be issued or granted to eligible persons. The following table gives information about equity awards under the 2009 Plan, the Company's prior 1994 Stock Option and Incentive Plan (the “1994 Plan”) under which awards were previously made, and the ESPP as of December 31, 2018:
_________________________________
The ESPP, which was adopted by the Board of Directors on October 29, 1996, has not been approved by our shareholders. A further description of the ESPP appears in Note 9, “Stock-Based Compensation Plans,” of the Consolidated Financial Statements set forth in Item 8 of this report.
60
(a) (b) (c)
Plan category
Number of securities to be issued upon exercise of outstanding options,
warrants and rights
Weighted-average exercise price of
outstanding options, warrants and rights
Number of securities remaining available for future issuance under
equity compensation plans (excluding securities
reflected in column (a))
Equity compensation plans approved by security holders (1) 686,676 (2) $ 128.84 (3) 7,509,205 Equity compensation plans not approved by security holders (4) — N/A 668,329
Total 686,676 $ 128.84 (3) 8,177,534
(1) Consists of the 2009 Plan and the 1994 Plan.
(2) Includes 28,206 deferred restricted stock units granted under the 2009 Plan and the 1994 Plan, which, subject to vesting requirements, will convert in the future to common stock on a one-for-one basis. Also includes the maximum number of shares that may be issued upon settlement of outstanding Performance Awards awarded to officers and maturing on December 31, 2018, 2019 and 2020. Does not include 369,649 shares of restricted stock that are outstanding and that are already reflected in the Company's outstanding shares.
(3) Excludes performance awards and deferred units granted under the 2009 Plan and the 1994 Plan, which, subject to vesting requirements, will convert in the future to common stock on a one-for-one basis.
(4) Consists of the ESPP.

Table of Contents ITEM 13. CERTAIN RELATIONSHIPS AND RELATED TRANSACTIONS, AND DIRECTOR INDEPENDENCE The information required by Item 13 pertaining to certain relationships and related transactions is incorporated herein by reference to the Company's Proxy Statement to be filed with the Securities and Exchange Commission within 120 days after the end of the year covered by this Form 10-K with respect to the Annual Meeting of Stockholders to be held on May 16, 2019. ITEM 14. PRINCIPAL ACCOUNTANT FEES AND SERVICES The information required by Item 14 pertaining to the fees paid to and services provided by the Company's principal accountant is incorporated herein by reference to the Company's Proxy Statement to be filed with the Securities and Exchange Commission within 120 days after the end of the year covered by this Form 10-K with respect to the Annual Meeting of Stockholders to be held on May 16, 2019.
61
Table of Contents
PART IV ITEM 15. EXHIBITS, FINANCIAL STATEMENT SCHEDULE
ITEM 16. FORM 10-K SUMMARY Not Applicable.
62
15(a)(1) Financial Statements
Index to Financial Statements
Consolidated Financial Statements and Financial Statement Schedule:
Reports of Independent Registered Public Accounting Firm F-1
Consolidated Balance Sheets as of December 31, 2018 and 2017 F-3
Consolidated Statements of Comprehensive Income for the years ended December 31, 2018, 2017 and 2016 F-4
Consolidated Statements of Equity for the years ended December 31, 2018, 2017 and 2016 F-5
Consolidated Statements of Cash Flows for the years ended December 31, 2018, 2017 and 2016 F-6
Notes to Consolidated Financial Statements F-9
15(a)(2) Financial Statement Schedule
Schedule III—Real Estate and Accumulated Depreciation F-40
All other schedules for which provision is made in the applicable accounting regulation of the Securities and Exchange Commission are not required under the related instructions or are inapplicable and therefore have been omitted.
15(a)(3) Exhibits
The exhibits listed on the accompanying Index to Exhibits are filed as a part of this report.

Table of Contents
INDEX TO EXHIBITS
63
Exhibit No. Description
3(i).1 — Articles of Amendment and Restatement of Articles of Incorporation of the Company, dated as of June 4, 1998. (Incorporated by reference to
Exhibit 3(i).1 to Form 10-K of the Company filed March 1, 2007.)
3(i).2 — Articles of Amendment, dated as of October 2, 1998. (Incorporated by reference to Exhibit 3(i).2 to Form 10-K of the Company filed March 1, 2007.)
3(i).3 — Articles of Amendment, dated as of May 22, 2013. (Incorporated by reference to Exhibit 3(i).3 to Form 8-K of the Company filed May 22, 2013.)
3(ii).1 — Amended and Restated Bylaws of the Company, as adopted by the Board of Directors on November 12, 2015. (Incorporated by reference to Exhibit 3(ii).1 to Form 10-K of the Company filed February 26, 2016.)
3(ii).2
—
Amendment to Amended and Restated Bylaws of the Company, as adopted by the Board of Directors on February 16, 2017. (Incorporated by reference to Exhibit 3.2 to Form 8-K of the Company filed February 21, 2017.)
3(ii).3
—
Second Amendment to Amended and Restated Bylaws of AvalonBay Communities, Inc., dated November 9, 2017. (Incorporated by reference to Exhibit 3.2 to Form 8-K of the Company filed November 13, 2017.)
4.1 — Indenture for Senior Debt Securities, dated as of January 16, 1998, between the Company and State Street Bank and Trust Company, as Trustee. (Incorporated by reference to Exhibit 4.1 to Registration Statement on Form S-3 of the Company (File No. 333-139839), filed January 8, 2007.)
4.2 — Amended and Restated Third Supplemental Indenture, dated as of July 10, 2000 between the Company and State Street Bank and Trust Company, as Trustee. (Incorporated by reference to Exhibit 4.4 to Registration Statement on Form S-3 of the Company (File No. 333-139839), filed January 8, 2007.)
4.3 — Fourth Supplemental Indenture, dated as of September 18, 2006, between the Company and U.S. Bank National Association as Trustee. (Incorporated by reference to Exhibit 4.5 to Registration Statement on Form S-3 of the Company (File No. 333-139839), filed January 8, 2007.)
4.4
__
Fifth Supplemental Indenture, dated as of November 21, 2014, between the Company and the Bank of New York Mellon, as Trustee. (Incorporated by reference to Exhibit 4.1 to Form 8-K of the Company filed November 21, 2014.)
4.5
—
Indenture for Debt Securities, dated as of February 23, 2018, between the Company and the Bank of New York, as Trustee (Incorporated by reference to Exhibit 4.1 to Registration Statement on Form S-3 of the Company (File No. 333-223183), filed February 23, 2018.)
4.6
—
First Supplemental Indenture, dated as March 26, 2018, between the Company and the Bank of New York Mellon, as Trustee, (Incorporated by reference to Exhibit 4.8 to Form 10-Q of the Company filed May 4, 2018.)
4.7
—
Second Supplemental Indenture, dated as of May 29, 2018, between the Company and the Bank of New York Mellon, as Trustee, (Incorporated by reference to Exhibit 4.3 to Form 8-K of the Company, filed May 29, 2018.)
4.8 — Dividend Reinvestment and Stock Purchase Plan of the Company. (Incorporated by reference to the prospectus contained in the Registration Statement on Form S-3DOPS of the Company (File No. 333-87063), filed February 23, 2018.)
10.1+ — Endorsement Split Dollar Agreements and Amendments thereto with Messrs. Naughton and Horey. (Incorporated by reference to Exhibit 10.8 to Form 10-K of the Company filed February 23, 2011.)
10.2+ — Form of Amendment to Endorsement Split Dollar Agreement with Messrs. Naughton and Horey. (Incorporated by reference to Exhibit 10.5 to Form 10-K of the Company filed March 2, 2009.)

Table of Contents
64
10.3+ — AvalonBay Communities, Inc. Second Amended and Restated 2009 Equity Incentive Plan. (Incorporated by reference to Exhibit 10.1 to Form 10-Q of the Company filed August 4, 2017.)
10.4+ —
First Amendment to AvalonBay Communities, Inc. Second Amended and Restated 2009 Equity Incentive Plan, dated February 14, 2019. (Filed herewith.)
10.5+ — Form of Stock Grant and Restricted Stock Agreement for use with officers and associates. (Incorporated by reference to Exhibit 10.1 to Form 8-K of the Company filed February 22, 2018.)
10.6+ — Form of Incentive Stock Option/Non-Qualified Stock Option Agreement for use with officers and associates. (Incorporated by reference to Exhibit 10.2 to Form 8-K of the Company filed February 22, 2018.)
10.7+ — 2018 Amended and Restated Directors Deferred Compensation Program. (Incorporated by reference to Exhibit 10.4 to Form 8-K of the Company filed February 22, 2018.)
10.8+ — Form of Director Restricted Stock Agreement. (Incorporated by reference to Exhibit 10.5 to Form 8-K of the Company filed February 22, 2018.)
10.9+ — Form of Director Restricted Unit Agreement (deferred stock award). (Incorporated by reference to Exhibit 10.6 of Form 8-K of the Company filed February 22, 2018.)
10.10+ —
Form of Agreement for Grant of Performance-Based Restricted Stock Units with attached Award Terms (subject to changes in weightings, target levels of achievement and metrics used in the award agreement.) (Filed herewith.)
10.11 — Fourth Amended and Restated Revolving Loan Agreement, dated as of January 14, 2016, among the Company, as Borrower, Bank of America, N.A., as administrative agent, an issuing bank and a bank, JPMorgan Chase Bank, N.A., as an issuing bank, a bank and a syndication agent, Wells Fargo Bank, N.A., as an issuing bank, a bank and a syndication agent, J.P. Morgan Securities LLC, Merrill Lynch, Pierce, Fenner & Smith Incorporated, and Wells Fargo Securities, LLC, as joint bookrunners and joint lead arrangers, and a syndicate of other financial institutions, serving as banks. (Incorporated by reference to Exhibit 1.1 to Form 8-K/A of the Company filed January 15, 2016.)
10.12+ — Amended and Restated AvalonBay Communities, Inc. Deferred Compensation Plan, effective as of January 1, 2011. (Incorporated by reference to Exhibit 10.1 to Form 10-Q of the Company filed August 6, 2010.)
10.13+ —
First Amendment to Amended and Restated AvalonBay Communities, Inc. Deferred Compensation Plan, effective as of November 7, 2011. (Incorporated by reference to Exhibit 10.28 to Form 10-K of the Company filed February 24, 2017.)
10.14+ —
Second Amendment to Amended and Restated AvalonBay Communities, Inc. Deferred Compensation Plan, effective as of November 15, 2012. (Incorporated by reference to Exhibit 10.29 to Form 10-K of the Company filed February 24, 2017.)
10.15 — Archstone Residual JV, LLC Limited Liability Company Agreement. (Incorporated by reference to Exhibit 10.3 to Form 8-K of the Company filed March 5, 2013.)
10.16 — Archstone Parallel Residual JV, LLC Limited Liability Company Agreement. (Incorporated by reference to Exhibit 10.4 to Form 8-K of the Company filed March 5, 2013.)
10.17 — Archstone Parallel Residual JV 2, LLC Limited Liability Company Agreement. (Incorporated by reference to Exhibit 10.5 to Form 8-K of the Company filed March 5, 2013.)
10.18 — Legacy Holdings JV, LLC Limited Liability Company Agreement. (Incorporated by reference to Exhibit 10.6 to Form 8-K of the Company filed March 5, 2013.)
10.19
—
Term Loan Agreement, dated February 28, 2017, among the Company, as Borrower, PNC Bank, National Association, as Administrative Agent and a bank, The Bank of New York Mellon and Sun Trust Bank, each as Syndication Agent and a bank, and a syndicate of other financial institutions serving as banks. (Incorporated by reference to Exhibit 10.1 to Form 8-K of the Company filed February 28, 2017.)
Table of Contents
_______________________________________________________________________________
65
21.1 — Schedule of Subsidiaries of the Company. (Filed herewith.)
23.1 — Consent of Ernst & Young LLP. (Filed herewith.)
31.1 — Certification pursuant to Section 302 of the Sarbanes-Oxley Act of 2002 (Chief Executive Officer). (Filed herewith.)
31.2 — Certification pursuant to Section 302 of the Sarbanes-Oxley Act of 2002 (Chief Financial Officer). (Filed herewith.)
32 — Certification pursuant to Section 906 of the Sarbanes-Oxley Act of 2002 (Chief Executive Officer and Chief Financial Officer). (Furnished herewith.)
101 — XBRL (Extensible Business Reporting Language). The following materials from AvalonBay Communities, Inc.'s Annual Report on Form 10-K for the year ended December 31, 2018, formatted in XBRL: (i) consolidated balance sheets, (ii) consolidated statements of comprehensive income, (iii) consolidated statements of equity, (iv) consolidated statements of cash flows and (v) notes to consolidated financial statements.
+ Management contract or compensatory plan or arrangement required to be filed or incorporated by reference as an exhibit to this Form 10-K pursuant to Item 15(a)(3) of Form 10-K.

Table of Contents
SIGNATURES Pursuant to the requirements of Section 13 or 15(d) of the Securities Exchange Act of 1934, the registrant has duly caused this report to be signed on its behalf by the undersigned, thereunto duly authorized.
Pursuant to the requirements of the Securities Exchange Act of 1934, this report has been signed below by the following persons on behalf of the registrant and in the capacities and on the dates indicated.
66
AvalonBay Communities, Inc.
Date: February 22, 2019 By: /s/ TIMOTHY J. NAUGHTON
Timothy J. Naughton, Director, Chairman, Chief Executive Officer and President (Principal Executive
Officer)
Date: February 22, 2019 By: /s/ TIMOTHY J. NAUGHTON
Timothy J. Naughton, Director, Chairman, Chief Executive Officer and President (Principal Executive Officer)
Date: February 22, 2019 By: /s/ KEVIN P. O’SHEA
Kevin P. O’Shea, Chief Financial Officer (Principal Financial Officer)
Date: February 22, 2019 By: /s/ KERI A. SHEA
Keri A. Shea, Senior Vice President—Finance & Treasurer (Principal Accounting Officer)
Date: February 22, 2019 By: /s/ GLYN F. AEPPEL
Glyn F. Aeppel, Director
Date: February 22, 2019 By: /s/ TERRY S. BROWN
Terry S. Brown, Director
Date: February 22, 2019 By: /s/ ALAN B. BUCKELEW
Alan B. Buckelew, Director
Date: February 22, 2019 By: /s/ RONALD L. HAVNER, JR.
Ronald L. Havner, Jr., Director
Date: February 22, 2019 By: /s/ STEPHEN P. HILLS
Stephen P. Hills, Director
Date: February 22, 2019 By: /s/ RICHARD J. LIEB
Richard J. Lieb, Director
Date: February 22, 2019 By: /s/ PETER S. RUMMELL
Peter S. Rummell, Director
Date: February 22, 2019 By: /s/ H. JAY SARLES
H. Jay Sarles, Director
Date: February 22, 2019 By: /s/ SUSAN SWANEZY
Susan Swanezy, Director
Date: February 22, 2019 By: /s/ W. EDWARD WALTER
W. Edward Walter, Director
Table of Contents
Report of Independent Registered Public Accounting Firm
To the Stockholders and the Board of Directors of AvalonBay Communities, Inc.
Opinion on the Financial Statements
We have audited the accompanying consolidated balance sheets of AvalonBay Communities, Inc. (the Company) as of December 31, 2018 and 2017, the related consolidated statements of comprehensive income, equity and cash flows for each of the three years in the period ended December 31, 2018, and the related notes and financial statement schedule listed in the Index at Item 15(a)(2) (collectively referred to as the “consolidated financial statements”). In our opinion, the consolidated financial statements present fairly, in all material respects, the financial position of the Company at December 31, 2018 and 2017, and the results of its operations and its cash flows for each of the three years in the period ended December 31, 2018, in conformity with U.S. generally accepted accounting principles.
We also have audited, in accordance with the standards of the Public Company Accounting Oversight Board (United States) (PCAOB), the Company's internal control over financial reporting as of December 31, 2018, based on criteria established in Internal Control-Integrated Framework issued by the Committee of Sponsoring Organizations of the Treadway Commission (2013 framework), and our report dated February 22, 2019 expressed an unqualified opinion thereon.
Basis for Opinion
These financial statements are the responsibility of the Company's management. Our responsibility is to express an opinion on the Company’s financial statements based on our audits. We are a public accounting firm registered with the PCAOB and are required to be independent with respect to the Company in accordance with the U.S. federal securities laws and the applicable rules and regulations of the Securities and Exchange Commission and the PCAOB.
We conducted our audits in accordance with the standards of the PCAOB. Those standards require that we plan and perform the audit to obtain reasonable assurance about whether the financial statements are free of material misstatement, whether due to error or fraud. Our audits included performing procedures to assess the risks of material misstatement of the financial statements, whether due to error or fraud, and performing procedures that respond to those risks. Such procedures included examining, on a test basis, evidence regarding the amounts and disclosures in the financial statements. Our audits also included evaluating the accounting principles used and significant estimates made by management, as well as evaluating the overall presentation of the financial statements. We believe that our audits provide a reasonable basis for our opinion.
/s/ Ernst & Young LLP
We have served as the Company’s auditor since 2002.
Tysons, Virginia February 22, 2019
F-1

Table of Contents
Report of Independent Registered Public Accounting Firm
To the Stockholders and the Board of Directors of AvalonBay Communities, Inc.
Opinion on Internal Control over Financial Reporting
We have audited AvalonBay Communities, Inc.’s internal control over financial reporting as of December 31, 2018, based on criteria established in Internal Control-Integrated Framework issued by the Committee of Sponsoring Organizations of the Treadway Commission (2013 framework) (the COSO criteria). In our opinion, AvalonBay Communities, Inc. (the Company) maintained, in all material respects, effective internal control over financial reporting as of December 31, 2018, based on the COSO criteria.
We also have audited, in accordance with the standards of the Public Company Accounting Oversight Board (United States) (PCAOB), the consolidated balance sheets of the Company as of December 31, 2018 and 2017, the related consolidated statements of comprehensive income, equity and cash flows for each of the three years in the period ended December 31, 2018, and the related notes and financial statement schedule listed in the Index at Item 15(a)(2) and our report dated February 22, 2019 expressed an unqualified opinion thereon.
Basis for Opinion
The Company’s management is responsible for maintaining effective internal control over financial reporting and for its assessment of the effectiveness of internal control over financial reporting included in the accompanying Management’s Report on Internal Control over Financial Reporting in Item 9A. Our responsibility is to express an opinion on the Company’s internal control over financial reporting based on our audit. We are a public accounting firm registered with the PCAOB and are required to be independent with respect to the Company in accordance with the U.S. federal securities laws and the applicable rules and regulations of the Securities and Exchange Commission and the PCAOB.
We conducted our audit in accordance with the standards of the PCAOB. Those standards require that we plan and perform the audit to obtain reasonable assurance about whether effective internal control over financial reporting was maintained in all material respects.
Our audit included obtaining an understanding of internal control over financial reporting, assessing the risk that a material weakness exists, testing and evaluating the design and operating effectiveness of internal control based on the assessed risk, and performing such other procedures as we considered necessary in the circumstances. We believe that our audit provides a reasonable basis for our opinion.
Definition and Limitations of Internal Control Over Financial Reporting
A company’s internal control over financial reporting is a process designed to provide reasonable assurance regarding the reliability of financial reporting and the preparation of financial statements for external purposes in accordance with generally accepted accounting principles. A company’s internal control over financial reporting includes those policies and procedures that (1) pertain to the maintenance of records that, in reasonable detail, accurately and fairly reflect the transactions and dispositions of the assets of the company; (2) provide reasonable assurance that transactions are recorded as necessary to permit preparation of financial statements in accordance with generally accepted accounting principles, and that receipts and expenditures of the company are being made only in accordance with authorizations of management and directors of the company; and (3) provide reasonable assurance regarding prevention or timely detection of unauthorized acquisition, use, or disposition of the company’s assets that could have a material effect on the financial statements.
Because of its inherent limitations, internal control over financial reporting may not prevent or detect misstatements. Also, projections of any evaluation of effectiveness to future periods are subject to the risk that controls may become inadequate because of changes in conditions, or that the degree of compliance with the policies or procedures may deteriorate.
/s/ Ernst & Young LLP Tysons, Virginia February 22, 2019
F-2

Table of Contents
AVALONBAY COMMUNITIES, INC. CONSOLIDATED BALANCE SHEETS
(Dollars in thousands, except per share data)
See accompanying notes to Consolidated Financial Statements.
F-3
12/31/18 12/31/17
ASSETS Real estate:
Land and improvements $ 4,077,090 $ 4,237,318 Buildings and improvements 15,651,035 15,708,666 Furniture, fixtures and equipment 696,200 615,288
20,424,325 20,561,272 Less accumulated depreciation (4,601,447) (4,218,379)
Net operating real estate 15,822,878 16,342,893 Construction in progress, including land 1,768,132 1,306,300 Land held for development 84,712 68,364 Real estate assets held for sale, net 55,208 —
Total real estate, net 17,730,930 17,717,557
Cash and cash equivalents 91,659 67,088 Cash in escrow 126,205 134,818 Resident security deposits 31,816 32,686 Investments in unconsolidated real estate entities 217,432 163,475 Deferred development costs 47,443 45,819 Prepaid expenses and other assets 134,715 253,378
Total assets $ 18,380,200 $ 18,414,821
LIABILITIES AND EQUITY Unsecured notes, net $ 5,905,993 $ 5,852,764 Variable rate unsecured credit facility — — Mortgage notes payable, net 1,134,270 1,476,706 Dividends payable 204,191 196,094 Payables for construction 96,983 85,377 Accrued expenses and other liabilities 297,700 308,189 Accrued interest payable 46,648 43,116 Resident security deposits 58,415 58,473 Liabilities related to real estate assets held for sale 150 —
Total liabilities 7,744,350 8,020,719
Commitments and contingencies
Redeemable noncontrolling interests 3,244 6,056
Equity: Preferred stock, $0.01 par value; $25 liquidation preference; 50,000,000 shares authorized at December 31, 2018 and December 31, 2017; zero shares issued and outstanding at December 31, 2018 and December 31, 2017 — — Common stock, $0.01 par value; 280,000,000 shares authorized at December 31, 2018 and December 31, 2017; 138,508,424 and 138,094,154 shares issued and outstanding at December 31, 2018 and December 31, 2017, respectively 1,385 1,381 Additional paid-in capital 10,306,588 10,235,475 Accumulated earnings less dividends 350,777 188,609 Accumulated other comprehensive loss (26,144) (37,419)
Total equity 10,632,606 10,388,046
Total liabilities and equity $ 18,380,200 $ 18,414,821
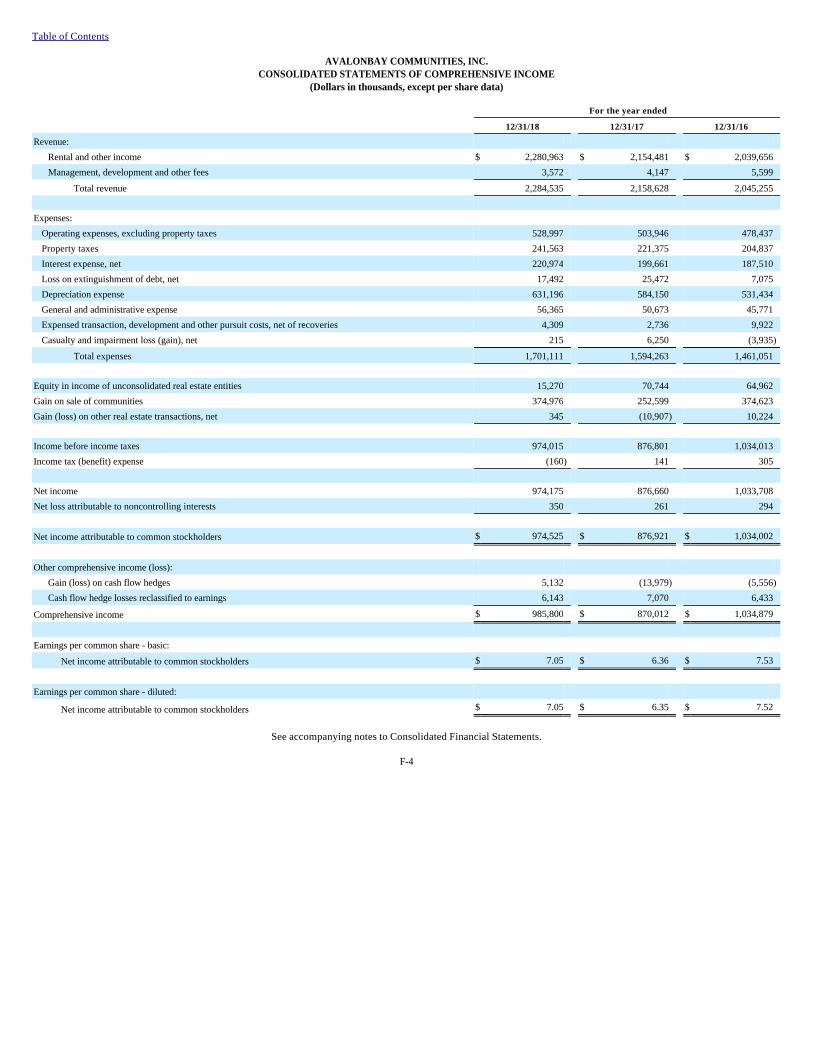
Table of Contents
AVALONBAY COMMUNITIES, INC. CONSOLIDATED STATEMENTS OF COMPREHENSIVE INCOME
(Dollars in thousands, except per share data)
See accompanying notes to Consolidated Financial Statements.
F-4
For the year ended
12/31/18 12/31/17 12/31/16
Revenue: Rental and other income $ 2,280,963 $ 2,154,481 $ 2,039,656 Management, development and other fees 3,572 4,147 5,599
Total revenue 2,284,535 2,158,628 2,045,255 Expenses:
Operating expenses, excluding property taxes 528,997 503,946 478,437 Property taxes 241,563 221,375 204,837 Interest expense, net 220,974 199,661 187,510 Loss on extinguishment of debt, net 17,492 25,472 7,075 Depreciation expense 631,196 584,150 531,434 General and administrative expense 56,365 50,673 45,771 Expensed transaction, development and other pursuit costs, net of recoveries 4,309 2,736 9,922 Casualty and impairment loss (gain), net 215 6,250 (3,935 )
Total expenses 1,701,111 1,594,263 1,461,051 Equity in income of unconsolidated real estate entities 15,270 70,744 64,962 Gain on sale of communities 374,976 252,599 374,623 Gain (loss) on other real estate transactions, net 345 (10,907 ) 10,224 Income before income taxes 974,015 876,801 1,034,013 Income tax (benefit) expense (160 ) 141 305 Net income 974,175 876,660 1,033,708 Net loss attributable to noncontrolling interests 350 261 294 Net income attributable to common stockholders $ 974,525 $ 876,921 $ 1,034,002
Other comprehensive income (loss):
Gain (loss) on cash flow hedges 5,132 (13,979 ) (5,556 )
Cash flow hedge losses reclassified to earnings 6,143 7,070 6,433
Comprehensive income $ 985,800 $ 870,012 $ 1,034,879
Earnings per common share - basic:
Net income attributable to common stockholders $ 7.05 $ 6.36 $ 7.53
Earnings per common share - diluted:
Net income attributable to common stockholders $ 7.05 $ 6.35 $ 7.52

Table of Contents
AVALONBAY COMMUNITIES, INC. CONSOLIDATED STATEMENTS OF EQUITY
(Dollars in thousands)
See accompanying notes to Consolidated Financial Statements.
F-5
Shares issued Additional
paid-in capital
Accumulated earnings
less dividends
Accumulated other
comprehensive loss
Total equity
Preferred stock
Common stock
Preferred stock
Common stock
Balance at December 31, 2015 — 137,002,031 $ — $ 1,370 $ 10,068,532 $ (197,989 ) $ (31,387 ) $ 9,840,526 Net income attributable to common stockholders — — — — — 1,034,002 — 1,034,002 Loss on cash flow hedges — — — — — — (5,556 ) (5,556 )
Cash flow hedge losses reclassified to earnings — — — — — — 6,433 6,433 Change in redemption value and acquisition of noncontrolling interest — — — — — 1,489 — 1,489 Dividends declared to common stockholders — — — — — (741,313 ) — (741,313 )
Issuance of common stock, net of withholdings — 328,873 — 3 11,982 (1,290 ) — 10,695 Amortization of deferred compensation — — — — 25,140 — — 25,140 Balance at December 31, 2016 — 137,330,904 — 1,373 10,105,654 94,899 (30,510 ) 10,171,416 Net income attributable to common stockholders — — — — — 876,921 — 876,921 Loss on cash flow hedges — — — — — — (13,979 ) (13,979 )
Cash flow hedge losses reclassified to earnings — — — — — — 7,070 7,070 Change in redemption value and acquisition of noncontrolling interest — — — — — 2,026 — 2,026 Dividends declared to common stockholders — — — — — (783,912 ) — (783,912 )
Issuance of common stock, net of withholdings — 763,250 — 8 101,621 (1,325 ) — 100,304 Amortization of deferred compensation — — — — 28,200 — — 28,200 Balance at December 31, 2017 — 138,094,154 — 1,381 10,235,475 188,609 (37,419 ) 10,388,046 Net income attributable to common stockholders — — — — — 974,525 — 974,525 Gain on cash flow hedges — — — — — — 5,132 5,132 Cash flow hedge losses reclassified to earnings — — — — — — 6,143 6,143 Change in redemption value of noncontrolling interest — — — — — 223 — 223 Dividends declared to common stockholders — — — — — (813,722 ) — (813,722 )
Issuance of common stock, net of withholdings — 414,270 — 4 39,408 1,142 — 40,554 Amortization of deferred compensation — — — — 31,705 — — 31,705
Balance at December 31, 2018 — 138,508,424 $ — $ 1,385 $ 10,306,588 $ 350,777 $ (26,144 ) $ 10,632,606

Table of Contents
AVALONBAY COMMUNITIES, INC CONSOLIDATED STATEMENTS OF CASH FLOWS
(Dollars in thousands)
See accompanying notes to Consolidated Financial Statements.
F-6
For the year ended
12/31/18 12/31/17 12/31/16
Cash flows from operating activities: Net income $ 974,175 $ 876,660 $ 1,033,708 Adjustments to reconcile net income to cash provided by operating activities:
Depreciation expense 631,196 584,150 531,434 Amortization of deferred financing costs 7,939 7,657 7,661 Amortization of debt discount (premium) 1,701 (5,915 ) (18,866 )
Loss on extinguishment of debt, net 17,492 25,472 7,075 Amortization of stock-based compensation 20,280 17,920 15,082 Equity in loss (income) of, and return on, unconsolidated real estate entities and noncontrolling interests, net of eliminations 6,583 (19,798 ) 8,870 Casualty and impairment loss (gain), net 826 8,568 (3,935 )
Abandonment of development pursuits 501 388 1,743 Cash flow hedge losses reclassified to earnings 6,143 7,070 6,433 Gain on sale of real estate assets (385,976 ) (281,745 ) (442,916 )
Decrease (increase) in resident security deposits, prepaid expenses and other assets 17,428 3,076 (5,403 )
Increase in accrued expenses, other liabilities and accrued interest payable 2,823 32,754 19,386 Net cash provided by operating activities 1,301,111 1,256,257 1,160,272
Cash flows from investing activities:
Development/redevelopment of real estate assets including land acquisitions and deferred development costs (1,139,954 ) (979,947 ) (1,201,026 )
Acquisition of real estate assets, including partnership interest (338,620 ) (462,317 ) (393,316 )
Capital expenditures - existing real estate assets (83,607 ) (65,181 ) (66,971 )
Capital expenditures - non-real estate assets (3,325 ) (8,809 ) (5,881 )
Increase (decrease) in payables for construction 11,606 (15,621 ) 2,196 Proceeds from sale of real estate, net of selling costs 883,313 503,039 532,717 Insurance proceeds for property damage claims — 16,233 17,196 Mortgage note receivable lending (3,699 ) (17,590 ) (19,115 )
Mortgage note receivable payments 53,136 — — Distributions from unconsolidated real estate entities 35,516 89,305 111,598 Investments in unconsolidated real estate entities (11,017 ) (24,493 ) (9,750 )
Net cash used in investing activities (596,651 ) (965,381 ) (1,032,352 )
Cash flows from financing activities:
Issuance of common stock, net 52,261 111,093 15,526 Dividends paid (805,239 ) (772,657 ) (726,749 )
Issuance of mortgage notes payable 295,939 206,800 — Repayments of mortgage notes payable, including prepayment penalties (255,452 ) (1,313,025 ) (168,076 )
Issuance of unsecured notes 299,442 1,696,826 1,122,488 Repayment of unsecured notes, including prepayment penalties (258,579 ) (300,000 ) (504,403 )
Payment of deferred financing costs (16,258 ) (17,552 ) (16,240 )
Payment of capital lease obligation (1,070 ) (18,951 ) — Receipts (payments) for termination of forward interest rate swaps 12,598 391 (14,847 )
Payments related to tax withholding for share-based compensation (10,556 ) (10,450 ) (8,562 )
Distributions to DownREIT partnership unitholders (44 ) (42 ) (41 )
Contributions from joint venture and profit-sharing partners — 1,038 — Distributions to joint venture and profit-sharing partners (424 ) (418 ) (407 )
Preferred interest obligation redemption and dividends (1,120 ) (2,000 ) (1,960 )
Net cash used in financing activities (688,502 ) (418,947 ) (303,271 )
Net increase (decrease) in cash and cash equivalents 15,958 (128,071 ) (175,351 )
Cash and cash equivalents and restricted cash, beginning of year 201,906 329,977 505,328 Cash and cash equivalents and restricted cash, end of year $ 217,864 $ 201,906 $ 329,977
Cash paid during the year for interest, net of amount capitalized $ 201,659 $ 207,842 $ 194,059

Table of Contents The following table provides a reconciliation of cash, cash equivalents and restricted cash reported with the Consolidated Statements of Cash Flows (dollars in thousands):
Supplemental disclosures of non-cash investing and financing activities: During the year ended December 31, 2018:
During the year ended December 31, 2017:
F-7
For the year ended
12/31/18 12/31/17 12/31/16
Cash and cash equivalents $ 91,659 $ 67,088 $ 214,994 Cash in escrow 126,205 134,818 114,983
Cash, cash equivalents and restricted cash shown in the Consolidated Statements of Cash Flows $ 217,864 $ 201,906 $ 329,977
• As described in Note 4, “Equity,” 187,010 shares of common stock were issued as part of the Company's stock based compensation plans, of which 88,297 shares related to the conversion of performance awards to restricted shares, and the remaining 98,713 shares valued at $15,950,000 were issued in connection with new stock grants; 2,272 shares valued at $387,000 were issued through the Company’s dividend reinvestment plan; 68,565 shares valued at $10,556,000 were withheld to satisfy employees’ tax withholding and other liabilities; and 4,860 restricted shares with an aggregate value of $717,000 previously issued in connection with employee compensation were canceled upon forfeiture.
• Common stock dividends declared but not paid totaled $204,191,000.
• The Company recorded a decrease of $223,000 in redeemable noncontrolling interest with a corresponding increase to accumulated earnings less dividends to adjust the redemption value associated with the put options held by joint venture partners and DownREIT partnership units. For further discussion of the nature and valuation of these items, see Note 11, “Fair Value.”
• The Company recorded an increase in other liabilities of $6,366,000, and a corresponding adjustment to other comprehensive income, and reclassified $6,143,000 of cash flow hedge losses from other comprehensive income to interest expense, net, to record the impact of the Company’s derivative and hedge accounting activity.
• In conjunction with the formation of NYTA MF Investors LLC (the "NYC Joint Venture”), the venture assumed $395,939,000 of secured indebtedness as partial consideration for the purchase of the associated operating communities and the Company recorded an investment of $74,159,000 in unconsolidated real estate entities, representing its 20.0% retained interest in the venture. See Note 5, "Investments in Real Estate Entities," for additional discussion of the venture.
• The Company issued 201,824 shares of common stock as part of the Company's stock based compensation plans, of which 128,482 shares related to the conversion of performance awards to restricted shares, and the remaining 73,342 shares valued at $13,171,000 were issued in connection with new stock grants; 3,058 shares valued at $558,000 were issued through the Company’s dividend reinvestment plan; 60,319 shares valued at $10,542,000 were withheld to satisfy employees’ tax withholding and other liabilities; and 3,388 restricted shares with an aggregate value of $588,000 previously issued in connection with employee compensation were canceled upon forfeiture.
• Common stock dividends declared but not paid totaled $196,094,000.
• The Company recorded a decrease of $65,000 in redeemable noncontrolling interest with a corresponding increase to accumulated earnings less dividends to adjust the redemption value associated with the put options held by joint venture partners and DownREIT partnership units.
• The Company recorded a decrease in prepaid expenses and other assets of $12,114,000 and an increase in other liabilities of $1,171,000, and a corresponding adjustment to other comprehensive income, and reclassified $7,070,000 of cash flow hedge losses from other comprehensive income to interest expense, net, to record the impact of the Company’s derivative and hedge accounting activity.

Table of Contents
During the year ended December 31, 2016:
See accompanying notes to Consolidated Financial Statements.
F-8
• As discussed in Note 1, "Organization, Basis of Presentation and Significant Accounting Policies," the Company recognized a non-cash charge of $16,361,000 to write-off the net book value of the fixed assets destroyed by the fire that occurred in February 2017 at the Company's Avalon Maplewood ("Maplewood") which at the time was under construction and not yet occupied.
• The Company issued 197,018 shares of common stock as part of the Company's stock based compensation plan, of which 115,618 shares related to the conversion of performance awards to restricted shares, and the remaining 81,400 shares valued at $13,217,000 were issued in connection with new stock grants; 44,327 shares valued at $3,894,000 were issued in conjunction with the conversion of deferred stock awards; 2,396 shares valued at $424,000 were issued through the Company’s dividend reinvestment plan; 53,453 shares valued at $8,356,000 were withheld to satisfy employees’ tax withholding and other liabilities; and 4,262 restricted shares with an aggregate value of $694,000 previously issued in connection with employee compensation were canceled upon forfeiture.
• Common stock dividends declared but not paid totaled $185,397,000.
• The Company recorded a decrease of $1,489,000 in redeemable noncontrolling interest with a corresponding increase to accumulated earnings less dividends to adjust the redemption value associated with the put options held by joint venture partners and DownREIT partnership units.
• The Company recorded an increase in prepaid expenses and other assets and a corresponding gain to other comprehensive income of $12,085,000 and reclassified $6,433,000 of cash flow hedge losses from other comprehensive income to interest expense, net, to record the impact of the Company’s derivative and hedge accounting activity.
• The Company assumed fixed rate indebtedness with a principal amount of $67,904,000 in conjunction with the acquisition of Avalon Hoboken.
• The Company assumed fixed rate indebtedness with a principal amount of $70,507,000 in conjunction with the acquisition of Avalon Columbia Pike.
• The Company completed the construction of and sold an affordable restricted apartment building, containing 77 apartment homes, which is adjacent to a completed Development Community. The Company received a mortgage note in the amount of $18,643,000 as consideration for the sale, which is secured by the underlying real estate.

Table of Contents
AVALONBAY COMMUNITIES, INC. NOTES TO CONSOLIDATED FINANCIAL STATEMENTS
1. Organization, Basis of Presentation and Significant Accounting Policies Organization and Basis of Presentation AvalonBay Communities, Inc. (the “Company,” which term, unless the context otherwise requires, refers to AvalonBay Communities, Inc. together with its subsidiaries), is a Maryland corporation that has elected to be treated as a real estate investment trust (“REIT”) for federal income tax purposes under the Internal Revenue Code of 1986 (the “Code”). The Company focuses on the development, redevelopment, acquisition, ownership and operation of multifamily communities primarily in New England, the New York/New Jersey metro area, the Mid-Atlantic, the Pacific Northwest, and Northern and Southern California. At December 31, 2018, the Company owned or held a direct or indirect ownership interest in 270 operating apartment communities containing 78,549 apartment homes in 12 states and the District of Columbia, of which nine communities containing 3,648 apartment homes were under redevelopment. In addition, the Company owned or held a direct or indirect ownership interest in 21 communities under development that are expected to contain an aggregate of 6,609 apartment homes (unaudited) when completed, and a mixed-use project being developed in which the Company is currently pursuing a potential for-sale strategy of individual condominium units. The Company also owned or held a direct or indirect ownership interest in land or rights to land in which the Company expects to develop an additional 28 communities that, if developed as expected, will contain an estimated 9,769 apartment homes (unaudited). Capitalized terms used without definition have meanings provided elsewhere in this Form 10-K. Principles of Consolidation The accompanying Consolidated Financial Statements include the accounts of the Company and its wholly-owned subsidiaries, certain joint venture partnerships, subsidiary partnerships structured as DownREITs and any variable interest entities that qualify for consolidation. All significant intercompany balances and transactions have been eliminated in consolidation. The Company accounts for joint venture entities and subsidiary partnerships in accordance with the consolidation guidance. The Company evaluates the partnership of each joint venture entity and determines first whether to follow the variable interest entity (“VIE”) or the voting interest entity (“VOE”) model. Once the appropriate consolidation model is identified, the Company then evaluates whether it should consolidate the venture. Under the VIE model, the Company consolidates an investment when it has control to direct the activities of the venture and the obligation to absorb losses or the right to receive benefits that could potentially be significant to the VIE. Under the VOE model, the Company consolidates an investment when 1) it controls the investment through ownership of a majority voting interest if the investment is not a limited partnership or 2) it controls the investment through its ability to remove the other partners in the investment, at its discretion, when the investment is a limited partnership. The Company generally uses the equity method of accounting for its investment in joint ventures, including when the Company holds a noncontrolling limited partner interest in a joint venture. Any investment in excess of the Company's cost basis at acquisition or formation of an equity method venture, will be recorded as a component of the Company's investment in the joint venture and recognized over the life of the underlying fixed assets of the venture as a reduction to its equity in income from the venture. Investments in which the Company has little or no influence are accounted for using the cost method. Revenue and Gain Recognition The Company accounts for its leases with its residents and retail tenants as operating leases. For lease agreements that provide for rent concessions and/or scheduled fixed and determinable rent increases, rental income is recognized on a straight-line basis over the noncancellable term of the lease. The Company’s residential lease term is generally one year. The Company records a charge to income for uncollectible outstanding receivables past due as a component of operating expenses, excluding property taxes on the accompanying Consolidated Statements of Comprehensive Income.
F-9

Table of Contents
As of January 1, 2018, the Company adopted ASU 2014-09, Revenue from Contracts with Customers, using the modified retrospective approach, which applies the new standard to contracts that are not completed as of the date of adoption. Under the new standard, revenue is recognized in accordance with the transfer of goods and services to customers at an amount that reflects the consideration that the Company expects to be entitled to for those goods and services. The majority of the Company’s revenue is derived from residential and retail rental income and other lease income, which are scoped out from this standard and included in the current lease accounting framework, and will be accounted for under ASU 2016-02, Leases, discussed under "Recently Issued and Adopted Accounting Standards" below. Revenue streams that are scoped into ASU 2014-09 include:
The Company concluded that the adoption of the new standard did not require an adjustment to the opening balance of retained earnings. The following table provides details of the Company’s revenue streams disaggregated by the Company’s reportable operating segments, further discussed in Note 8, “Segment Reporting,” for the years ended December 31, 2018, 2017 and 2016. The segments are classified based on the individual community's status at January 1, 2018 for the years ended December 31, 2018 and 2017, and at January 1, 2017 for the year ended December 31, 2016. Segment information for total revenue has been adjusted to exclude the real estate assets that were sold from January 1, 2016 through December 31, 2018, or otherwise qualify as held for sale as of December 31, 2018, as described in Note 6, "Real Estate Disposition Activities," (dollars in thousands):
F-10
• Management fees - The Company has investment interests in real estate joint ventures, for which the Company may manage (i) the venture, (ii) the associated operating communities owned by the ventures and/or (iii) the development or redevelopment of those operating communities. For these activities, the Company receives asset management, property management, development and/or redevelopment fee revenue. The performance obligation is the management of the venture, community or other defined task such as the development or redevelopment of the community. While the individual activities that comprise the performance obligation of the management fees can vary day to day, the nature of the overall performance obligation to provide management service is the same and considered by the Company to be a series of services that have the same pattern of transfer to the customer and the same method to measure progress toward satisfaction of the performance obligation. The Company recognizes revenue for fees as earned on a monthly basis and has concluded this is appropriate under the new standard.
• Rental and non-rental related income - The Company recognizes revenue for new rental related income not included as components of a lease, such as reservation and application fees, as well as for non-rental related income, as earned, and has concluded this is appropriate under the new standard.
• Gains or losses on sales of real estate - The Company accounts for the sale of real estate assets and any related gain recognition in accordance with the accounting guidance applicable to sales of real estate, which establishes standards for recognition of profit on all real estate sales transactions, other than retail land sales. The Company recognizes the sale, and associated gain or loss from the disposition, provided that the earnings process is complete and the Company does not have significant continuing involvement. Subsequent to the adoption of the new standard, a gain or loss is recognized when the criteria for an asset to be derecognized are met, which include when (i) a contract exists and (ii) the buyer obtained control of the nonfinancial asset that was sold. As a result, the Company may recognize a gain on a real estate disposition transaction that previously did not qualify as a sale or for full profit recognition due to the timing of the transfer of control or certain forms of continuing involvement. In addition, as discussed under ASU 2017-05, included in "Recently Issued and Adopted Accounting Standards" below, subsequent to the adoption of the new standard, a gain or loss recognized on the sale of a nonfinancial asset to an unconsolidated entity will be recognized at 100%, and not the Company’s proportionate ownership percentage.

Table of Contents
__________________________________
Due to the nature and timing of the Company’s identified revenue streams, there are no material amounts of outstanding or unsatisfied performance obligations as of December 31, 2018.
F-11
Established
Communities
Other Stabilized
Communities
Development/ Redevelopment Communities
Non- allocated (1) Total
For the year ended December 31, 2018
Management, development and other fees $ — $ — $ — $ 3,572 $ 3,572 Rental and non-rental related income (2) 9,563 2,417 1,913 — 13,893
Total non-lease revenue (3) 9,563 2,417 1,913 3,572 17,465
Lease income (4) 1,622,837 259,636 295,706 — 2,178,179 Business interruption insurance proceeds 26 — — — 26
Total revenue $ 1,632,426 $ 262,053 $ 297,619 $ 3,572 $ 2,195,670
For the year ended December 31, 2017
Management, development and other fees $ — $ — $ — $ 4,147 $ 4,147 Rental and non-rental related income (2) 9,453 2,083 1,478 — 13,014
Total non-lease revenue (3) 9,453 2,083 1,478 4,147 17,161
Lease income (4) 1,582,209 191,511 230,293 — 2,004,013 Business interruption insurance proceeds (5) 3 — 3,495 — 3,498
Total revenue $ 1,591,665 $ 193,594 $ 235,266 $ 4,147 $ 2,024,672
For the year ended December 31, 2016
Management, development and other fees $ — $ — $ — $ 5,599 $ 5,599 Rental and non-rental related income (2) 8,299 2,172 1,394 — 11,865
Total non-lease revenue (3) 8,299 2,172 1,394 5,599 17,464
Lease income (4) 1,423,658 219,035 185,343 — 1,828,036 Business interruption insurance proceeds (6) 152 65 20,312 — 20,529
Total revenue $ 1,432,109 $ 221,272 $ 207,049 $ 5,599 $ 1,866,029
(1) Revenue represents third-party management, asset management and developer fees and miscellaneous income which are not allocated to a reportable segment.
(2) Amounts include revenue streams related to leasing activities that are not considered components of a lease, including but not limited to, apartment hold fees and application fees, as well as revenue streams not related to leasing activities, including but not limited to, vendor revenue sharing, building advertising, vending and dry cleaning revenue.
(3) Represents all revenue accounted for under ASC 2014-09.
(4) Amounts include all revenue streams derived from residential and retail rental income and other lease income, which are excluded from ASC 2014-09 and accounted for under the lease accounting framework.
(5) Amount for 2017 is primarily business interruption insurance proceeds related to the Maplewood casualty loss as discussed below in "Casualty Gains and Losses."
(6) Amount for 2016 is primarily business interruption insurance proceeds related to the Edgewater casualty loss as discussed below in "Casualty Gains and Losses."

Table of Contents
Real Estate Operating real estate assets are stated at cost and consist of land and improvements, buildings and improvements, furniture, fixtures and equipment, and other costs incurred during their development, redevelopment and acquisition. Significant expenditures which improve or extend the life of an existing asset and that will benefit the Company for periods greater than a year, are capitalized. Expenditures for maintenance and repairs are charged to expense as incurred. Project costs related to the development, construction and redevelopment of real estate projects (including interest and related loan fees, property taxes and other direct costs) are capitalized as a cost of the project. Indirect project costs that relate to several projects are capitalized and allocated to the projects to which they relate. Indirect costs not clearly related to development, construction and redevelopment activity are expensed as incurred. For development, capitalization (i) begins when the Company has determined that development of the future asset is probable, (ii) can be suspended if there is no current development activity underway, but future development is still probable and (iii) ends when the asset, or a portion of an asset, is delivered and is ready for its intended use, or the Company's intended use changes such that capitalization is no longer appropriate. For land parcels improved with operating real estate, for which the Company intends to pursue development, the Company generally manages the current improvements until such time as all tenant obligations have been satisfied or eliminated through negotiation, and construction of new apartment communities is ready to begin. Revenue from incidental operations received from the current improvements on land parcels in excess of any incremental costs are recorded as a reduction of total capitalized costs of the respective Development Right and not as part of net income. Incidental operating costs in excess of incidental operating income are expensed in the period incurred. For redevelopment efforts, the Company capitalizes costs either (i) in advance of taking homes out of service when significant renovation of the common area has begun until the redevelopment is completed, or (ii) when an apartment home is taken out of service for redevelopment until the redevelopment is completed and the apartment home is available for a new resident. Rental income and operating costs incurred during the initial lease-up or post-redevelopment lease-up period are recognized in earnings as incurred. The adoption of ASU 2017-01 on October 1, 2016, impacted the Company's accounting framework for the acquisition of operating communities. Prior to adoption, the acquisition of an operating community was viewed as an acquisition of a business, and the Company identified and recorded each asset acquired and liability assumed in such transaction at its estimated fair value at the date of acquisition, and expensed all costs incurred related to acquisitions of operating communities. Subsequent to adoption of ASU 2017-01 on October 1, 2016, the Company assesses each acquisition of an operating community to determine if it meets the definition of a business or if it qualifies as an asset acquisition. The Company generally views acquisitions of individual operating communities as asset acquisitions, and results in the capitalization of acquisition costs, and the allocation of purchase price to the assets acquired and liabilities assumed, based on the relative fair value of the respective assets and liabilities. The purchase price allocation to tangible assets, such as land and improvements, buildings and improvements, and furniture, fixtures and equipment, and the in-place lease intangible assets, is reflected in real estate assets and depreciated over their estimated useful lives. Any purchase price allocation to intangible assets, other than in-place lease intangibles, is included in prepaid expenses and other assets on the accompanying Consolidated Balance Sheets and amortized over the term of the acquired intangible asset. The Company values land based on a market approach, looking to recent sales of similar properties, adjusting for differences due to location, the state of entitlement as well as the shape and size of the parcel. Improvements to land are valued using a replacement cost approach and consider the structures and amenities included for the communities. The approach for improvements applies industry standard replacement costs adjusted for geographic specific considerations and reduced by estimated depreciation. The value for furniture, fixtures and equipment is also determined based on a replacement cost approach, considering costs for both items in the apartment homes as well as common areas and was adjusted for estimated depreciation. The fair value of buildings acquired is estimated using the replacement cost approach, assuming the buildings were vacant at acquisition. The replacement cost approach considers the composition of structures acquired, adjusted for an estimate of depreciation. The estimate of depreciation is made considering industry standard information, depreciation curves for the identified asset classes and estimated useful life of the acquired property. The value of the acquired lease-related intangibles considers the estimated cost of leasing the apartment homes as if the acquired building(s) were vacant, as well as the value of the current leases relative to market-rate leases. The in-place lease value is determined using an average total lease-up time, the number of apartment homes and net revenues generated during the lease-up time. The lease-up period for an apartment community is assumed to be 12 months to achieve stabilized occupancy. Net revenues use market rent considering actual leasing and industry rental rate data. The value of current leases relative to a market-rate lease is based on market rents obtained for market comparables, and considered a market derived discount rate. Given the heterogeneous nature of multifamily real estate, the fair values for the land, debt, real estate assets and in-place leases
F-12

Table of Contents
incorporated significant unobservable inputs and therefore are considered to be Level 3 prices within the fair value hierarchy. Consideration for acquisitions is typically in the form of cash unless otherwise disclosed. Depreciation is calculated on buildings and related improvements using the straight-line method over their estimated useful lives, which range from seven to 30 years. Furniture, fixtures and equipment are generally depreciated using the straight-line method over their estimated useful lives, which range from three years (primarily computer-related equipment) to seven years. Income Taxes The Company elected to be treated as a REIT for U.S. federal income tax purposes for its tax year ended December 31, 1994 and has not revoked such election. A REIT is a corporate entity which holds real estate interests and can deduct from its federally taxable income qualifying dividends it pays if it meets a number of organizational and operational requirements, including a requirement that it currently distribute at least 90% of its adjusted taxable income to stockholders. Therefore, as a REIT, the Company generally will not be subject to corporate level federal income tax on its taxable income if it annually distributes 100% of its taxable income to its stockholders. The states in which the Company operates have similar tax provisions which recognize the Company as a REIT for state income tax purposes. Management believes that all such conditions for the exemption from income taxes on ordinary income have been or will be met for the periods presented. Accordingly, no provision for federal and state income taxes has been made. If the Company fails to qualify as a REIT in any taxable year, it will be subject to federal corporate income taxes at regular corporate rates and may not be able to qualify as a corporate REIT for four subsequent taxable years. Even if the Company qualifies for taxation as a REIT, the Company may be subject to certain state and local taxes on its income and property, and to federal income and excise taxes on its undistributed taxable income and in certain other instances. The Company did not incur any charges or receive refunds of excise taxes related to the years ended December 31, 2018, 2017 and 2016. In addition, taxable income from non-REIT activities performed through taxable REIT subsidiaries (“TRS”) is subject to federal, state and local income taxes. The Company recorded an income tax benefit of $160,000 in 2018 and incurred income tax expense of $141,000 and $305,000 in 2017 and 2016, respectively, associated primarily with activities transacted through a TRS. As of December 31, 2018 and 2017, the Company did not have any unrecognized tax benefits. The Company does not believe that there will be any material changes in its unrecognized tax positions over the next 12 months. The Company is subject to examination by the respective taxing authorities for the tax years 2015 through 2017. On December 22, 2017, H.R. 1, the Tax Cuts and Jobs Act (the “TCJA”), was enacted. The TCJA makes major changes to the Code, including lowering the statutory U.S. federal income tax rate from 35% to 21% effective January 1, 2018. The Company does not believe the TCJA had a material impact on its financial position or results of operations. The following reconciles net income attributable to common stockholders to taxable net income for the years ended December 31, 2018, 2017 and 2016 (unaudited, dollars in thousands):
The following summarizes the tax components of the Company's common dividends declared for the years ended December 31, 2018, 2017 and 2016 (unaudited):
F-13
2018 Estimate 2017 Actual 2016 Actual
Net income attributable to common stockholders $ 974,525 $ 876,921 $ 1,034,002 GAAP gain on sale of communities in excess of tax gain (194,596) (86,661) (195,029)
Depreciation/amortization timing differences on real estate 5,431 (3,642) (947)
Amortization of debt/mark to market interest 2,276 (18,096) (18,985)
Tax compensation expense (in excess of) less than GAAP (612) 3,912 9,821 Casualty and impairment loss (gain), net 19,153 20,243 (657)
Other adjustments (4,905) (4,304) 11,533
Taxable net income $ 801,272 $ 788,373 $ 839,738

Table of Contents
Deferred Financing Costs Deferred financing costs include fees and other expenditures necessary to obtain debt financing and are amortized on a straight-line basis, which approximates the effective interest method, over the shorter of the term of the loan or the related credit enhancement facility, if applicable. Unamortized financing costs are charged to earnings when debt is retired before the maturity date. Accumulated amortization of deferred financing costs related to unsecured notes was $20,564,000 and $16,984,000 as of December 31, 2018 and 2017, respectively, and related to mortgage notes payable was $2,044,000 and $4,991,000 as of December 31, 2018 and 2017, respectively. Deferred financing costs, except for costs associated with line-of-credit arrangements, are presented as a direct deduction from the related debt liability. Accumulated amortization of deferred financing costs related to the Company's Credit Facility was $10,108,000 and $8,299,000 as of December 31, 2018 and 2017, respectively, and was included in prepaid expenses and other assets on the accompanying Consolidated Balance Sheets. Cash, Cash Equivalents and Cash in Escrow Cash and cash equivalents include all cash and liquid investments with an original maturity of three months or less from the date acquired. Cash in escrow includes principal reserve funds that are restricted for the repayment of specified secured financing. The majority of the Company's cash, cash equivalents and cash in escrow are held at major commercial banks. Comprehensive Income Comprehensive income, as reflected on the Consolidated Statements of Comprehensive Income, is defined as all changes in equity during each period except for those resulting from investments by or distributions to shareholders. Accumulated other comprehensive loss, as reflected on the Consolidated Statements of Equity, reflects the effective portion of the cumulative changes in the fair value of derivatives in qualifying cash flow hedge relationships. Earnings per Common Share Basic earnings per share is computed by dividing net income attributable to common stockholders by the weighted average number of shares outstanding during the period. All outstanding unvested restricted share awards contain rights to non-forfeitable dividends and participate in undistributed earnings with common shareholders and, accordingly, are considered participating securities that are included in the two-class method of computing basic earnings per share (“EPS”). Both the unvested restricted shares and other potentially dilutive common shares, and the related impact to earnings, are considered when calculating earnings per share on a diluted basis. The Company's earnings per common share are determined as follows (dollars in thousands, except per share data):
F-14
2018 2017 2016
Ordinary income 76 % 75 % 68 %
20% capital gain 11 % 18 % 26 %
Unrecaptured §1250 gain 13 % 7 % 6 %

Table of Contents
All options to purchase shares of common stock outstanding as of December 31, 2018, 2017 and 2016 are included in the computation of diluted earnings per share. Abandoned Pursuit Costs and Impairment of Long-Lived Assets The Company capitalizes pre-development costs incurred in pursuit of new development opportunities for which the Company currently believes future development is probable (“Development Rights”). Future development of these Development Rights is dependent upon various factors, including zoning and regulatory approval, rental market conditions, construction costs and the availability of capital. Initial pre-development costs incurred for pursuits for which future development is not yet considered probable are expensed as incurred. In addition, if the status of a Development Right changes, making future development by the Company no longer probable, any non-recoverable capitalized pre-development costs are expensed. The Company expensed costs related to the abandonment of Development Rights, as well as costs incurred in pursuing the acquisition or disposition of assets for which such acquisition and disposition activity did not occur, in the amounts of $4,388,000, $2,370,000 and $4,183,000 during the years ended December 31, 2018, 2017 and 2016, respectively. These costs are included in expensed acquisition, development and other pursuit costs, net of recoveries on the accompanying Consolidated Statements of Comprehensive Income. Abandoned pursuit costs can vary greatly, and the costs incurred in any given period may be significantly different in future periods.
F-15
For the year ended
12/31/18 12/31/17 12/31/16
Basic and diluted shares outstanding Weighted average common shares—basic 137,844,755 137,523,771 136,928,251 Weighted average DownREIT units outstanding 7,500 7,500 7,500 Effect of dilutive securities 436,986 535,415 525,886
Weighted average common shares—diluted 138,289,241 138,066,686 137,461,637
Calculation of Earnings per Share—basic Net income attributable to common stockholders $ 974,525 $ 876,921 $ 1,034,002 Net income allocated to unvested restricted shares (2,839) (2,463) (2,610)
Net income attributable to common stockholders, adjusted $ 971,686 $ 874,458 $ 1,031,392
Weighted average common shares—basic 137,844,755 137,523,771 136,928,251
Earnings per common share—basic $ 7.05 $ 6.36 $ 7.53
Calculation of Earnings per Share—diluted Net income attributable to common stockholders $ 974,525 $ 876,921 $ 1,034,002 Add: noncontrolling interests of DownREIT unitholders in consolidated partnerships, including discontinued operations 44 42 41
Adjusted net income attributable to common stockholders $ 974,569 $ 876,963 $ 1,034,043
Weighted average common shares—diluted 138,289,241 138,066,686 137,461,637
Earnings per common share—diluted $ 7.05 $ 6.35 $ 7.52
Dividends per common share $ 5.88 $ 5.68 $ 5.40

Table of Contents
The Company evaluates its real estate and other long-lived assets for impairment when potential indicators of impairment exist. Such assets are stated at cost, less accumulated depreciation and amortization, unless the carrying amount of the asset is not recoverable. If events or circumstances indicate that the carrying amount of a property or long-lived asset may not be recoverable, the Company assesses its recoverability by comparing the carrying amount of the property or long-lived asset to its estimated undiscounted future cash flows. If the carrying amount exceeds the aggregate undiscounted future cash flows, the Company recognizes an impairment loss to the extent the carrying amount exceeds the estimated fair value of the property or long-lived asset. Based on periodic tests of recoverability of long-lived assets, for the years ended December 31, 2018, 2017 and 2016, the Company did not recognize any impairment losses for wholly-owned operating real estate assets, and did not record any impairment losses other than those related to the impairment on land held for investment and casualty gains and losses from property damage as discussed below. The Company assesses its portfolio of land held for both development and investment for impairment if the intent of the Company changes with respect to either the development of, or the expected holding period for, the land. During the year ended December 31, 2018, the Company recognized an impairment charge of $826,000 related to a land parcel the Company had previously acquired for development and no longer intends to develop. During the year ended December 31, 2017, the Company recognized an impairment charge of $9,350,000 related to a land parcel the Company had acquired for development in 2004 and sold during 2017. During the year ended December 31, 2016, the Company recognized $10,500,000 of aggregate impairment charges related to three ancillary land parcels for which the Company has either sold or intended to sell. These charges were determined as the excess of the Company's carrying basis over the expected sales price for each parcel, and is included in casualty and impairment loss (gain), net on the accompanying Consolidated Statements of Comprehensive Income. The Company evaluates its unconsolidated investments for other than temporary impairment, considering both the extent and amount by which the carrying value of the investment exceeds the fair value, and the Company’s intent and ability to hold the investment to recover its carrying value. The Company also evaluates its proportionate share of any impairment of assets held by unconsolidated investments. There were no other than temporary impairment losses recognized by any of the Company's investments in unconsolidated real estate entities during the years ended December 31, 2018, 2017 or 2016. Casualty Gains and Losses In February 2017, a fire occurred at the Company's Avalon Maplewood, located in Maplewood, NJ, which at the time was under construction and not yet occupied. The Company completed reconstruction of the damaged and destroyed portions of the community as well as the vertical construction of the community in 2018. During the year ended December 31, 2017, the Company recorded a net casualty loss of $2,338,000 for the fire at Maplewood, included in casualty and impairment loss (gain), net on the accompanying Consolidated Statements of Comprehensive Income. During the year ended December 31, 2017, the Company reached a final insurance settlement for the property damage and lost income for the Maplewood casualty loss of $19,696,000, after self-insurance and deductibles, of which the Company recognized $3,495,000 as business interruption insurance proceeds. See Note 7, “Commitments and Contingencies,” for additional discussion of the related casualty loss. In January 2015, a fire occurred at the Company's Avalon at Edgewater apartment community located in Edgewater, NJ. Edgewater consisted of two residential buildings. One building, containing 240 apartment homes, was destroyed. The second building, containing 168 apartment homes, suffered minimal damage and has been repaired. See Note 7, “Commitments and Contingencies,” for discussion of the related legal matters. During the year ended December 31, 2016, the Company reached a final insurance settlement for the Company's property damage and lost income for the Edgewater casualty loss, for which it received aggregate insurance proceeds for Edgewater of $73,150,000, after self-insurance and deductibles, of which $29,008,000 was received in 2016. Of this amount, $8,702,000 was recognized as casualty gain, reported as casualty and impairment loss (gain), net on the accompanying Consolidated Statements of Comprehensive Income, and $20,306,000 as business interruption insurance proceeds reported as a component of rental and other income on the accompanying Consolidated Statements of Comprehensive Income.
F-16
Table of Contents
During the year ended December 31, 2016, the Company recorded a net casualty gain related to 2015 severe winter storms of $5,732,000, which is comprised of $8,493,000 in third-party insurance proceeds received, partially offset by incremental costs of $2,761,000. These amounts are included in casualty and impairment loss (gain), net on the accompanying Consolidated Statements of Comprehensive Income. A casualty loss may also result in lost operating income from one or more communities that is covered by the Company’s business interruption insurance policies. The Company recognizes income for amounts received under its business interruption insurance policies as a component of rental and other income in the Consolidated Statements of Comprehensive Income. Revenue is recognized upon resolution of all contingencies related to the receipt, typically upon written confirmation by the insurer or receipt of the actual proceeds. The Company recognized $26,000, $3,498,000 and $20,564,000 in income related business interruption insurance proceeds for the years ended December 31, 2018, 2017 and 2016, respectively. Assets Held for Sale and Discontinued Operations The Company presents the assets and liabilities of any communities which have been sold, or otherwise qualify as held for sale, separately in the Consolidated Balance Sheets. In addition, the results of operations for those assets that meet the definition of discontinued operations are presented as such in the accompanying Consolidated Statements of Comprehensive Income. Real estate assets held for sale are measured at the lower of the carrying amount or the fair value less the cost to sell. Both the real estate assets and corresponding liabilities are presented separately in the accompanying Consolidated Balance Sheets. Upon the classification of an asset as held for sale, no further depreciation is recorded. Disposals representing a strategic shift in operations (e.g., a disposal of a major geographic area, a major line of business or a major equity method investment) will be presented as discontinued operations, and for those assets qualifying for classification as discontinued operations, the specific components of net income presented as discontinued operations include net operating income, depreciation expense and interest expense, net. For periods prior to the asset qualifying for discontinued operations, the Company reclassifies the results of operations to discontinued operations. In addition, the net gain or loss (including any impairment loss) on the eventual disposal of assets held for sale will be presented as discontinued operations when recognized. A change in presentation for held for sale or discontinued operations has no impact on the Company's financial condition or results of operations. The Company combines the operating, investing and financing portions of cash flows attributable to discontinued operations with the respective cash flows from continuing operations on the accompanying Consolidated Statements of Cash Flows. The Company had one wholly-owned operating community and two ancillary land parcels that qualified as held for sale presentation at December 31, 2018. Redeemable Noncontrolling Interests Redeemable noncontrolling interests are comprised of potential future obligations of the Company, which allow the investors holding the noncontrolling interest to require the Company to purchase their interest. The Company classifies obligations under the redeemable noncontrolling interests at fair value, with a corresponding offset for changes in the fair value recorded in accumulated earnings less dividends. Reductions in fair value are recorded only to the extent that the Company has previously recorded increases in fair value above the redeemable noncontrolling interest's initial basis. The redeemable noncontrolling interests are presented outside of permanent equity as settlement in shares of the Company's common stock, where permitted, may not be within the Company's control. The nature and valuation of the Company's redeemable noncontrolling interests are discussed further in Note 11, “Fair Value.” Derivative Instruments and Hedging Activities The Company enters into interest rate swap and interest rate cap agreements (collectively, "Hedging Derivatives") for interest rate risk management purposes and in conjunction with certain variable rate secured debt to satisfy lender requirements. The Company does not enter into Hedging Derivative transactions for trading or other speculative purposes. The Company assesses the effectiveness of qualifying cash flow and fair value hedges, both at inception and on an on-going basis. Hedge ineffectiveness is reported as a component of interest expense, net. The fair values of Hedging Derivatives that are in an asset position are recorded in prepaid expenses and other assets. The fair value of Hedging Derivatives that are in a liability position are included in accrued expenses and other liabilities. The Company does not present or disclose the fair value of Hedging Derivatives on a net basis. Fair value changes for derivatives that are not in qualifying hedge relationships are reported as a component of interest expense, net. For the Hedging Derivative positions that the Company has determined qualify as effective cash flow hedges, the Company has recorded the cumulative changes in the fair value of Hedging Derivatives in other comprehensive loss. Amounts recorded in accumulated other comprehensive loss will be reclassified into earnings in the periods in which earnings are affected by the hedged cash flow. The effective portion of the change in fair value of the Hedging Derivatives that the Company has determined qualified
F-17

Table of Contents
as effective fair value hedges is reported as an adjustment to the carrying amount of the corresponding debt being hedged. See Note 11, “Fair Value,” for further discussion of derivative financial instruments. Use of Estimates The preparation of financial statements in conformity with GAAP requires management to make certain estimates and assumptions. These estimates and assumptions affect the reported amounts of assets and liabilities and disclosure of contingent assets and liabilities at the dates of the financial statements and the reported amounts of revenue and expenses during the reporting periods. Actual results could differ from those estimates. Reclassifications Certain reclassifications have been made to amounts in prior years' notes to financial statements to conform to current year presentations as a result of changes in held for sale classification, disposition activity and segment classification. Recently Issued and Adopted Accounting Standards In August 2017, the FASB issued ASU 2017-12, Derivatives and Hedging (Topic 815): Targeted Improvements to Accounting for Hedging Activities. This ASU expands hedge accounting for both nonfinancial and financial risk components and aligns the recognition and presentation of the effects of the hedging instrument and the hedged item in the financial statements. This update also simplifies the application of hedge accounting guidance and eases the administrative burden of hedge documentation requirements and assessing hedge effectiveness. The Company adopted the guidance as of January 1, 2018 and it did not have a material effect on the Company’s financial position or results of operations. In February 2017, the FASB issued ASU 2017-05, Other Income-Gains and Losses from the Derecognition of Nonfinancial Assets (Subtopic 610-20): Clarifying the Scope of Asset Derecognition Guidance and Accounting for Partial Sales of Nonfinancial Assets. This ASU (i) clarifies the scope of the nonfinancial asset guidance and the derecognition of certain businesses and nonprofit activities, (ii) eliminates the exception in the financial asset guidance for transfers of investments (including equity method investments) in real estate entities and supersedes the guidance in the Exchanges of a Nonfinancial Asset for a Noncontrolling Ownership Interest and (iii) provides guidance on the accounting of partial sales of nonfinancial assets and contributions of nonfinancial assets to a joint venture or other noncontrolled investee. The Company adopted the new standard as of January 1, 2018 using the modified retrospective approach, applying the provisions to open contracts as of the date of adoption. See "Revenue and Gain Recognition" above for additional discussion of the impact of adopting the guidance. In February 2016, the FASB issued ASU 2016-02, Leases, amending the existing accounting standards for lease accounting, including requiring lessees to recognize most leases on their balance sheets and making targeted changes to lessor accounting. The guidance will be effective in the first quarter of 2019 and allows for early adoption. The new standard requires a modified retrospective transition approach for all leases existing at the date of initial application, with an option to use certain transition relief. ASU 2016-02 provides for transition relief, which includes electing to not (i) reassess whether any expired or existing contract is a lease or contains a lease, (ii) reassess the lease classification of any expired or existing leases and (iii) expense any capitalized initial direct costs for any existing leases. Subsequently, the FASB issued ASU 2018-01, ASU 2018-11 and ASU 2018-20 which provides further transition relief by providing (i) an option to not evaluate land easements that exist or have expired prior to the date of adoption under ASC 842, (ii) prospective adoption as a transition method, (iii) a practical expedient for lessors to not separate lease and non-lease components by class of underlying asset when certain conditions are met and (iv) technical improvements for lessor accounting for sales taxes collected from lessees and certain lessor costs. The Company adopted ASC 842 as of January 1, 2019 using the prospective adoption method, and plans to apply certain practical expedients allowed under the standard including:
F-18
• not reassessing (i) whether any expired or existing contracts are or contain leases, (ii) the lease classification for any expired or existing leases, and (iii) the accounting for initial direct costs for any existing leases;
• not evaluating short term leases; • not assessing whether existing land easements are, or contain leases; and • making an accounting policy election by class of underlying asset, to not separate non-lease components from lease components and instead to account for each
separate lease and non- lease component as a single lease component.

Table of Contents
The Company anticipates adoption of the standard will result in the recognition of incremental right of use assets and corresponding lease liabilities to its balance sheet upon adoption of the new standard in the range from $100,000,000 to $150,000,000 resulting from the recognition of its long-term ground and administrative office leases, currently accounted for as operating leases. The Company is finalizing its adoption of the new standard and will report finalized impacts in the Company's first quarter 2019 Form 10-Q filing. In May 2014, the FASB issued ASU 2014-09, Revenue from Contracts with Customers and in August 2015, the FASB issued ASU 2015-14, Revenue from Contracts with Customers-Deferral of the Effective Date, which defers the effective date of the new revenue recognition standard until the first quarter of 2018. Subsequently, the FASB has issued multiple ASUs clarifying ASU 2014-09 and ASU 2015-14. Under the new standard, revenue is recognized when persuasive evidence of an arrangement exists, delivery has occurred, the fee is fixed or determinable, and collectability is probable. Revenue is generally recognized net of allowances and any taxes collected from customers and subsequently remitted to governmental authorities. The majority of the Company's revenue is derived from rental income, which is scoped out from this standard and will be accounted for under ASU 2016-02, Leases, discussed above. The Company's other revenue streams, which are being evaluated under this ASU, include but are not limited to management fees, non-recurring rental and non-rental related income, and gains and losses from real estate dispositions. The Company adopted the new standard as of January 1, 2018 using the modified retrospective approach, applying the provisions to open contracts as of the date of adoption. See "Revenue and Gain Recognition" above for additional discussion of the impact of adopting the guidance. 2. Interest Capitalized The Company capitalizes interest during the development and redevelopment of real estate assets. Capitalized interest associated with the Company's development or redevelopment activities totaled $60,331,000, $64,420,000 and $78,872,000 for years ended December 31, 2018, 2017 and 2016, respectively. 3. Mortgage Notes Payable, Unsecured Notes and Credit Facility The Company's mortgage notes payable, unsecured notes, variable rate unsecured term loans (the “Term Loans”) and Credit Facility, as defined below, as of December 31, 2018 and 2017 are summarized below. The following amounts and discussion do not include the mortgage notes related to the communities classified as held for sale, if any, as of December 31, 2018 and 2017, as shown on the Consolidated Balance Sheets (dollars in thousands) (see Note 6, “Real Estate Disposition Activities”).
_________________________________
The following debt activity occurred during the year ended December 31, 2018:
F-19
12/31/18 12/31/17
Fixed rate unsecured notes (1) $ 5,400,000 $ 5,350,000 Variable rate unsecured notes (1) 300,000 300,000 Term Loans (1) 250,000 250,000 Fixed rate mortgage notes payable—conventional and tax-exempt (2) 533,215 593,987 Variable rate mortgage notes payable—conventional and tax-exempt (2) 619,140 910,326
Total mortgage notes payable and unsecured notes and Term Loans 7,102,355 7,404,313 Credit Facility — —
Total mortgage notes payable, unsecured notes, Term Loans and Credit Facility $ 7,102,355 $ 7,404,313
(1) Balances at December 31, 2018 and 2017 exclude $9,879 and $10,850, respectively, of debt discount, and $34,128 and $36,386, respectively, of deferred financing costs, as reflected in unsecured notes, net on the accompanying Consolidated Balance Sheets.
(2) Balances at December 31, 2018 and 2017 exclude $14,590 and $16,351 of debt discount, respectively, and $3,495 and $11,256, respectively, of deferred financing costs, as reflected in mortgage notes payable, net on the accompanying Consolidated Balance Sheets.
• In February 2018, the Company repaid $15,174,000 principal amount of 6.60% fixed rate debt secured by Avalon Oaks West in advance of its scheduled maturity date, incurring a charge of $426,000, consisting of a prepayment penalty of $152,000 and the non-cash write-off of unamortized deferred financing costs of $274,000.
• In February 2018, the Company repaid $11,038,000 principal amount of 4.61% fixed rate debt secured by AVA Pasadena at par in advance of its scheduled maturity date.

Table of Contents
At December 31, 2018, the Company has a $1,500,000,000 revolving variable rate unsecured credit facility with a syndicate of banks (the "Credit Facility") which matures in April 2020. The Company may extend the maturity for up to nine months, provided the Company is not in default and upon payment of a $1,500,000 extension fee. The Credit Facility bears interest at varying levels based on the London Interbank Offered Rate (“LIBOR”), rating levels achieved on the Company's unsecured notes and on a maturity schedule selected by the Company. The current stated pricing is LIBOR plus 0.825% per annum (3.33% at December 31, 2018), assuming a one month borrowing rate. The annual facility fee is 0.125% (or approximately $1,875,000 annually based on the $1,500,000,000 facility size and based on the Company's current credit rating). The Company had no borrowings outstanding under the Credit Facility and had $39,810,000 and $47,315,000 outstanding in letters of credit that reduced the borrowing capacity as of December 31, 2018 and 2017, respectively.
F-20
• In March 2018, the Company issued $300,000,000 principal amount of unsecured notes in a public offering under its existing shelf registration statement for net proceeds of approximately $296,210,000. The notes mature in April 2048 and were issued at a 4.35% interest rate. The effective interest rate of the notes for the first 10years is 3.97%, including the impact of an interest rate hedge and offering costs, and for the remainder of the term the effective interest rate is 4.39%.
• In April 2018, the Company repaid $13,380,000 principal amount of 3.06% fixed rate debt secured by Avalon Andover at par at its scheduled maturity date.
• In June 2018, the Company repaid $15,295,000 principal amount of 6.90% fixed rate debt secured by Avalon Orchards in advance of its scheduled maturity date, incurring a charge of $635,000, consisting of a prepayment penalty of $282,000 and the non-cash write-off of unamortized deferred financing costs of $353,000.
• In August 2018, the Company repaid $95,859,000 aggregate principal amount of variable rate debt secured by Avalon Calabasas, of which $51,449,000 was repaid at par at its scheduled maturity date, and $44,410,000 was repaid at par in advance of its April 2028 maturity date. The Company recognized a non-cash charge of $1,690,000for the write-off of unamortized debt discount.
• In December 2018, the Company repaid $250,000,000 principal amount of its 6.10% unsecured notes in advance of its March 2020 scheduled maturity, recognizing a charge of $8,926,000, consisting of a prepayment penalty of $8,579,000 and a non-cash write-off of deferred financing costs of $347,000.
• In December 2018, in conjunction with the formation of the NYC Joint Venture as discussed in Note 5, "Investments in Real Estate Entities," the following financing activities took place:
◦ The Company repaid $93,800,000 of variable rate debt secured by Avalon Bowery Place I in advance of its November 2037 maturity date. In conjunction with the repayment, the Company recognized a charge of $5,837,000, consisting of a prepayment penalty of $2,874,000 and the non-cash write-off of unamortized deferred financing costs of $2,963,000.
◦ The Company entered into a $93,800,000 fixed rate note secured by Avalon Bowery Place I, with a contractual interest rate of 4.01%, maturing in January 2029.
◦ The Company entered into a $39,639,000 fixed rate note secured by Avalon Bowery Place II, with a contractual interest rate of 4.01%, maturing in January 2029.
◦ The Company entered into a $12,500,000 fixed rate note secured by Avalon Morningside Park, with a contractual interest rate of 3.95%, maturing in January 2029.
◦ The Company entered into a $150,000,000 fixed rate note secured by Avalon West Chelsea and AVA High Line, a dual-branded community, with a contractual interest rate of 4.01%, maturing in January 2029.
◦ The NYC Joint Venture then assumed the aggregate $295,939,000 of new borrowings discussed above, as well as the previously outstanding $100,000,000fixed rate note secured by Avalon Morningside Park with a contractual interest rate of 3.50%.

Table of Contents In the aggregate, secured notes payable mature at various dates from April 2019 through July 2066, and are secured by certain apartment communities (with a net carrying value of $1,827,953,000, excluding communities classified as held for sale, as of December 31, 2018). The weighted average interest rate of the Company's fixed rate secured notes payable (conventional and tax-exempt) was 3.8% and 4.0% at December 31, 2018 and 2017, respectively. The weighted average interest rate of the Company's variable rate secured notes payable (conventional and tax exempt), the Term Loans and its Credit Facility, including the effect of certain financing related fees, was 3.4% and 3.2% at December 31, 2018 and 2017, respectively. Scheduled payments and maturities of secured notes payable and unsecured notes outstanding at December 31, 2018 are as follows (dollars in thousands):
The Company's unsecured notes are redeemable at the Company's option, in whole or in part, generally at a redemption price equal to the greater of (i) 100% of their principal amount or (ii) the sum of the present value of the remaining scheduled payments of principal and interest discounted at a rate equal to the yield on U.S. Treasury securities with a comparable maturity plus a spread between 20 and 45 basis points depending on the specific series of unsecured notes, plus accrued and unpaid interest to the redemption date. The indenture under which the Company's unsecured notes were issued, the Company's Credit Facility agreement and the Company's Term Loan agreement contain limitations on the amount of debt the Company can incur or the amount of assets that can be used to secure other financing transactions, and other customary financial and other covenants, with which the Company was in compliance at December 31, 2018. 4. Equity As of December 31, 2018 and 2017, the Company's charter had authorized for issuance a total of 280,000,000 shares of common stock and 50,000,000 shares of preferred stock. During the year ended December 31, 2018, the Company:
Any deferred compensation related to the Company’s stock option, restricted stock and performance award grants during the year ended December 31, 2018 is not reflected on the accompanying Consolidated Balance Sheet as of December 31, 2018, and will not be reflected until recognized as compensation cost. In December 2015, the Company commenced a fourth continuous equity program (“CEP IV”) under which the Company may sell (and/or enter into forward agreements for) up to $1,000,000,000 of its common stock from time to time. Actual sales will depend on a variety of factors to be determined by the Company, including market conditions, the trading price of the Company's common stock and determinations by the Company of the appropriate sources of funding for the Company. In conjunction with CEP IV, the Company engaged sales agents who will receive compensation of up to 2.0% of the gross sales price for shares sold. The Company expects that, if entered into, it will physically settle each forward sale agreement on one or more dates specified by the Company on or prior to the maturity date of that particular forward sale agreement, in which case the Company will expect to receive aggregate net cash proceeds at settlement equal to the number of shares underlying the particular forward agreement multiplied by the relevant forward sale price. However, the Company may also elect to cash settle or net share settle a forward sale agreement. In connection with each forward sale agreement, the Company will pay the relevant forward seller, in the form of a reduced initial forward sale price, commission of up to 2.0% of the sales prices of all borrowed shares of common stock sold. As of December 31, 2018, there are no outstanding forward sales agreements. In 2018, the Company sold 244,924 shares at an average sales price of $189.14 per share, for net proceeds of $45,629,000. As of December 31, 2018, the Company had $846,591,000 of shares remaining authorized for issuance under this program. 5. Investments in Real Estate Entities Investments in Unconsolidated Real Estate Entities
Year
Secured notes
payments
Secured notes
maturities
Unsecured notes
maturities
Stated interest rate of
unsecured notes
2019 3,824 114,722 — N/A 2020 2,682 140,430 400,000 3.625%
2021 2,204 27,844 250,000 3.950%
300,000 LIBOR + 0.43% 2022 2,318 — 450,000 2.950%
100,000 LIBOR + .90% 2023 2,439 — 350,000 4.200%
250,000 2.850%
2024 2,577 — 300,000 3.500%
150,000 LIBOR + 1.50% 2025 2,708 84,835 525,000 3.450%
300,000 3.500%
2026 2,845 — 475,000 2.950%
300,000 2.900%
2027 2,270 185,100 400,000 3.350%
2028 912 — 450,000 3.200%
Thereafter 30,296 544,349 350,000 3.900%
300,000 4.150%
300,000 4.350%
$ 55,075 $ 1,097,280 $ 5,950,000
i. issued 40,534 shares of common stock in connection with stock options exercised;ii. issued 2,272 common shares through the Company's dividend reinvestment plan;iii. issued 187,010 common shares in connection with restricted stock grants and the conversion of performance awards to restricted shares;iv. issued 244,924 shares under CEP IV, as discussed below;v. withheld 68,565 common shares to satisfy employees' tax withholding and other liabilities;vi. issued 12,955 shares through the Employee Stock Purchase Plan; andvii. canceled 4,860 shares of restricted stock upon forfeiture.

The Company accounts for its investments in unconsolidated real estate entities under the equity method of accounting, as discussed in Note 1, “Organization, Basis of Presentation and Significant Accounting Policies,” under Principles of Consolidation. The significant accounting policies of the Company's unconsolidated real estate entities are consistent with those of the Company in all material respects. As of December 31, 2018, the Company had investments in the following real estate entities:
During 2018, the U.S. Fund sold Avalon Kirkland at Carillon, located in Kirkland, WA, containing 131 apartment homes for $85,500,000. The Company's proportionate share of the gain in accordance with GAAP was $8,636,000. In conjunction with the disposition of this community, the U.S. Fund repaid $27,928,000 of related secured indebtedness in advance of its scheduled maturity date.
F-21
• Archstone Multifamily Partners AC LP (the “U.S. Fund”)—The U.S. Fund was formed in July 2011 and is fully invested. The U.S. Fund has a term that expires in July 2023, assuming the exercise of two, one-year extension options. The U.S. Fund had six institutional investors, including the Company. The Company is the general partner of the U.S. Fund and, at December 31, 2018 excluding costs incurred in excess of equity in the underlying net assets of the U.S. Fund, the Company had an equity investment of $31,194,000 (net of distributions), representing a 28.6% combined general partner and limited partner equity interest. The Company acquired its interest in the U.S. Fund as part of the Archstone Acquisition.

Table of Contents
Subsidiaries of the U.S. Fund have five loans secured by individual assets with aggregate amounts outstanding of $205,846,000, with maturity dates that vary from June 2020 to November 2022. The mortgage loans are payable by the subsidiaries of the U.S. Fund with operating cash flow or disposition proceeds from the underlying real estate. The Company has not guaranteed the debt of the U.S. Fund, nor does the Company have any obligation to fund this debt should the U.S. Fund be unable to do so.
The AC JV partnership agreement contains provisions that require the Company to provide a right of first offer (“ROFO”) to the AC JV in connection with additional opportunities to acquire or develop additional interests in multifamily real estate assets within a specified geographic radius of the existing assets, generally one mile or less. The ROFO restriction expires in 2019. During 2018, the AC JV sold Avalon Woodland Park, located in Herndon, VA, containing 392 apartment homes for $94,250,000. The Company's proportionate share of the gain in accordance with GAAP was $2,019,000. In conjunction with the disposition of this community, the AC JV repaid a $50,647,000 loan at par to the equity investors in the venture in advance of its scheduled maturity date. As of December 31, 2018, subsidiaries of the AC JV had one unsecured loan outstanding in the amount of $111,653,000 which matures in August 2021, and which was made by the equity investors in the venture, including the Company, in proportion to the investors' respective equity ownership interest. The unsecured loan is payable by the subsidiaries of the AC JV with operating cash flow from the venture. The Company has not guaranteed the debt of the AC JV, nor does the Company have any obligation to fund this debt should the AC JV be unable to do so.
Brandywine had an outstanding $22,195,000 fixed rate mortgage loan that is payable by the venture. The Company has not guaranteed the debt of Brandywine, nor does the Company have any obligation to fund this debt should Brandywine be unable to do so.
The Residual Liabilities include most existing or future litigation and claims related to Archstone’s operations for periods before the close of the Archstone
Acquisition, except for (i) claims that principally relate to the physical condition of the assets acquired directly by the Company or Equity Residential, which generally remain the sole responsibility of the Company or Equity Residential, as applicable, and (ii) certain tax and other litigation between Archstone and various equity holders in Archstone related to periods before the close of the Archstone Acquisition, and claims which may arise due to changes in the capital structure of Archstone that occurred prior to closing, for which the seller has agreed to indemnify the Company and Equity Residential. The Company and Equity Residential jointly control the Residual JV and the Company holds a 40.0% economic interest in the Residual JV. The Company believes its remaining potential obligations under the Residual JV will not have a material impact on its financial position or results of operations.
F-22
• Multifamily Partners AC JV LP (the “AC JV”)—The AC JV is a joint venture that was formed in 2011 and has four institutional investors, including the Company. Excluding costs incurred in excess of equity in the underlying net assets of the AC JV, at December 31, 2018 the Company had an equity investment of $34,799,000 (net of distributions), representing a 20.0% equity interest. The Company acquired its interest in the AC JV as part of the Archstone Acquisition.
• MVP I, LLC—In December 2004, the Company entered into a joint venture agreement with an unrelated third-party for the development of Avalon at Mission Bay II. Construction of Avalon at Mission Bay II, a 313 apartment-home community located in San Francisco, California, was completed in December 2006. The Company holds a 25.0% equity interest in the venture. The Company is responsible for the day-to-day operations of the community and is the management agent subject to the terms of a management agreement. The Company has not guaranteed the debt of MVP I, LLC, nor does the Company have any obligation to fund this debt should MVP I, LLC be unable to do so.
• Brandywine Apartments of Maryland, LLC (“Brandywine”)—Brandywine owns a 305 apartment home community located in Washington, D.C. The community is managed by a third party. Brandywine is comprised of five members who hold various interests in the joint venture. The Company holds a 28.7% equity interest in Brandywine.
• Residual JV—Through subsidiaries, the Company and Equity Residential entered into three limited liability company agreements (collectively, the “Residual JV”) through which the Company and Equity Residential acquired (i) certain assets of Archstone that the Company and Equity Residential have divested (the “Residual Assets”), and (ii) various liabilities of Archstone that the Company and Equity Residential agreed to assume in conjunction with the Archstone Acquisition (the “Residual Liabilities”).

Table of Contents
F-23
• Legacy JV—As part of the Archstone Acquisition the Company entered into a limited liability company agreement with Equity Residential, through which it assumed obligations of Archstone in the form of preferred interests, some of which are governed by tax protection arrangements (the “Legacy JV”). The Company has a 40.0%interest in the Legacy JV. During the years ended December 31, 2018, 2017 and 2016, the Legacy JV redeemed certain of the preferred interests and paid accrued dividends, of which the Company's portion was $1,120,000, $2,000,000 and $1,960,000, respectively. At December 31, 2018, the remaining preferred interests had an aggregate liquidation value of $36,806,000, the Company's 40.0% share of which was included in accrued expenses and other liabilities in the accompanying Consolidated Balance Sheets.
• Sudbury Development, LLC—During 2015, the Company entered into a joint venture agreement to purchase land and pursue entitlements and pre-development activity for a mixed-use development project in Sudbury, MA, including multifamily apartment homes, retail, senior housing and age-restricted housing. The Company has a 60.0% ownership interest in the venture. The venture is considered a VIE, though the Company is not considered to be the primary beneficiary because the Company and its third party partner share control of the joint venture as approval from both parties is required for all significant aspects of the venture's activities including, but not limited to, changes in the ownership or capital structure of the partnership, acquisitions or dispositions by the venture and decisions about the pre-development and related activities to be performed by the venture. During the year ended December 31, 2017, the Company and its venture partner each acquired their respective portion of the real estate held by the venture, with the Company's portion consisting of a parcel of land for the development of an apartment community, acquired for an investment of $19,200,000. The Company and its venture partner retained continuing involvement with the venture to fund the completion of the planned infrastructure and site work, which was substantially complete at December 31, 2018.
• North Point II JV, LP—During 2016, the Company entered into a joint venture to develop, own, and operate AVA North Point, an apartment community located in Cambridge, MA, which completed construction during 2018 and contains 265 apartment homes. The Company owns a 55.0% interest in the venture, and the venture partner owns the remaining 45.0% interest. The venture is considered to be a VIE, though the Company is not considered to be the primary beneficiary because the Company and its third party partner share control of the venture. The Company and its venture partner share decision making authority for all significant aspects of the venture's activities including, but not limited to, changes in the ownership or capital structure, the original capital budget to construct AVA North Point and the operating budget for the community since completion. AVA North Point is the third phase of a master planned development, the other phases of which are owned through the AC JV. During 2016, the Company provided the partners of the AC JV the opportunity to acquire the AVA North Point land parcel owned by the Company as required in the ROFO provisions for the AC JV. After certain partners of the AC JV declined to participate, the Company entered into the new joint venture and sold the land parcel to the venture in exchange for a cash payment and a capital account credit, and is overseeing the development in exchange for a developer fee. Upon sale of the land parcel, the Company recognized a gain of $10,621,000 during the year ended December 31, 2016, included in gain (loss) on other real estate transactions, net on the accompanying Consolidated Statements of Comprehensive Income. At December 31, 2018, the Company had an equity investment of $45,162,000.

Table of Contents
In conjunction with the formation of the venture, the Company sold the five communities, containing an aggregate of 1,301 apartment homes and 58,000 square feet of retail space, to the venture for a sales price of $758,900,000. The Company received net cash proceeds of $276,799,000 and the venture assumed $395,939,000 of secured indebtedness from the Company. The Company recognized a gain on sale of $179,861,000, including the recognition of the Company's 20.0% retained interest at fair value. In conjunction with the formation of the venture, the Company entered into the refinancing and borrowing activities discussed in Note 3, “Mortgage Notes Payable, Unsecured Notes and Credit Facility.” At December 31, 2018, the Company had an equity investment of $75,000,000, representing a 20.0% equity interest in the venture.
In addition, during 2018 the Company held an investment in and received the final distributions for the AvalonBay Value Added Fund II, L.P. (“Fund II”). In September 2008, the Company formed Fund II, a private, discretionary real estate investment vehicle which acquired and operated communities in the Company's markets. During 2017, Fund II sold its final three communities, and the Company completed the dissolution of Fund II in 2018. Fund II had six institutional investors, including the Company. One of the Company's wholly owned subsidiaries was the general partner of Fund II. The Company had an equity interest of 31.3% in Fund II, and upon achievement of a threshold return the Company had a right to incentive distributions for its promoted interest based on current returns earned by Fund II which represented 40.0% of further Fund II distributions, which was in addition to its proportionate share of the remaining 60.0% of distributions. During the year ended December 31, 2018, the Company recognized income of $925,000 for its promoted interest, which was reported as a component of equity in income of unconsolidated real estate entities on the accompanying Consolidated Statements of Comprehensive Income.
The following is a combined summary of the financial position of the entities accounted for using the equity method as of the dates presented, excluding amounts associated with development joint ventures, the Residual JV and Legacy JV (dollars in thousands):
The following is a combined summary of the operating results of the entities accounted for using the equity method, for the years presented, excluding amounts associated with development joint ventures, Avalon Clarendon, the Residual JV and Legacy JV (dollars in thousands):
F-24
• NYTA MF Investors LLC (“NYC Joint Venture”)—During 2018, the Company contributed five wholly-owned operating communities located in New York, NY to a newly formed joint venture with the intent to own and operate the communities. The Company retained a 20.0% interest in the venture, with the venture partner owning the remaining 80.0% interest, and the partners sharing in returns in accordance with their ownership interests. The venture is not considered a VIE and is accounted for as an equity method investment, as the venture can finance its activities through the on-going operations of the communities and the Company and its third party partner share a controlling financial interest in the joint venture. While the Company is the managing member and the venture partner has a controlling financial interest, approval from both parties is required for all significant aspects of the venture's activities including, but not limited to, changes in the ownership or capital structure of the partnership, acquisitions or dispositions by the venture and decisions about the annual operating budget and redevelopment related activities to be performed by the venture.
12/31/18 12/31/17
Assets: Real estate, net $ 1,420,039 $ 695,077 Other assets 45,142 39,976
Total assets $ 1,465,181 $ 735,053
Liabilities and partners' capital: Mortgage notes payable, net and credit facility $ 837,311 $ 523,815 Other liabilities 15,624 10,540 Partners' capital 612,246 200,698
Total liabilities and partners' capital $ 1,465,181 $ 735,053
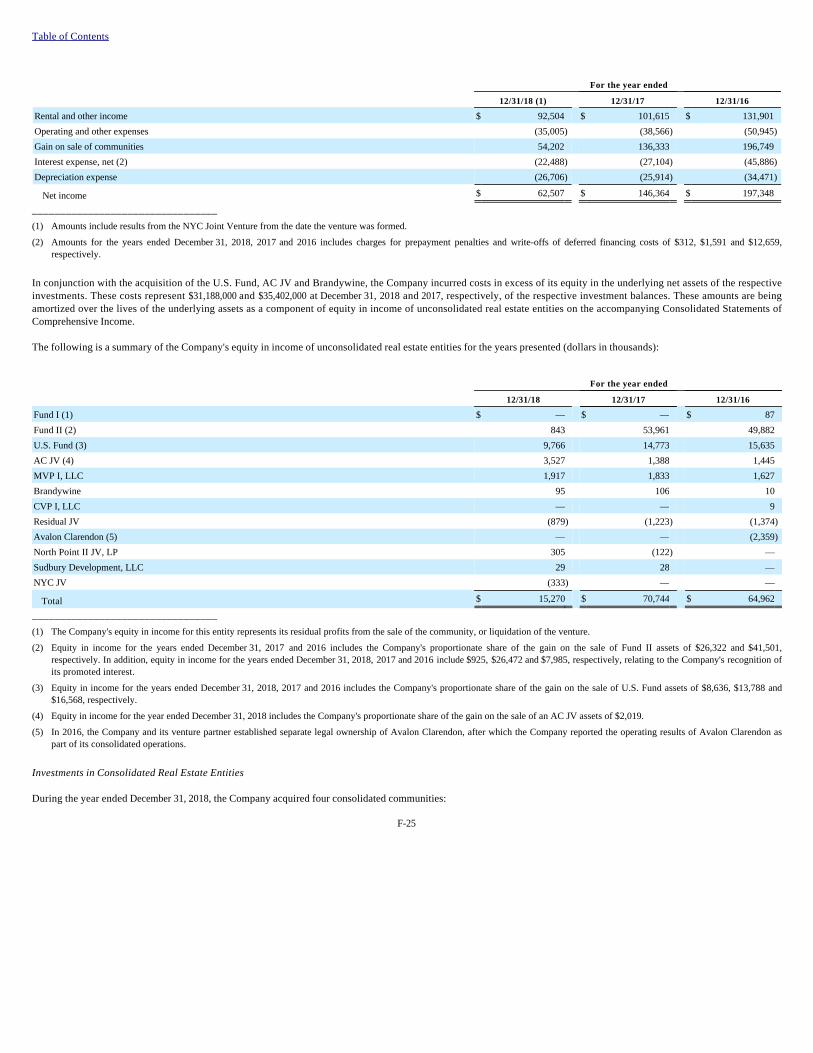
Table of Contents
_________________________________
In conjunction with the acquisition of the U.S. Fund, AC JV and Brandywine, the Company incurred costs in excess of its equity in the underlying net assets of the respective investments. These costs represent $31,188,000 and $35,402,000 at December 31, 2018 and 2017, respectively, of the respective investment balances. These amounts are being amortized over the lives of the underlying assets as a component of equity in income of unconsolidated real estate entities on the accompanying Consolidated Statements of Comprehensive Income. The following is a summary of the Company's equity in income of unconsolidated real estate entities for the years presented (dollars in thousands):
_________________________________
Investments in Consolidated Real Estate Entities During the year ended December 31, 2018, the Company acquired four consolidated communities:
F-25
For the year ended
12/31/18 (1) 12/31/17 12/31/16
Rental and other income $ 92,504 $ 101,615 $ 131,901 Operating and other expenses (35,005 ) (38,566 ) (50,945 )
Gain on sale of communities 54,202 136,333 196,749 Interest expense, net (2) (22,488 ) (27,104 ) (45,886 )
Depreciation expense (26,706 ) (25,914 ) (34,471 )
Net income $ 62,507 $ 146,364 $ 197,348
(1) Amounts include results from the NYC Joint Venture from the date the venture was formed.
(2) Amounts for the years ended December 31, 2018, 2017 and 2016 includes charges for prepayment penalties and write-offs of deferred financing costs of $312, $1,591 and $12,659, respectively.
For the year ended
12/31/18 12/31/17 12/31/16
Fund I (1) $ — $ — $ 87 Fund II (2) 843 53,961 49,882 U.S. Fund (3) 9,766 14,773 15,635 AC JV (4) 3,527 1,388 1,445 MVP I, LLC 1,917 1,833 1,627 Brandywine 95 106 10 CVP I, LLC — — 9 Residual JV (879 ) (1,223 ) (1,374 )
Avalon Clarendon (5) — — (2,359 )
North Point II JV, LP 305 (122 ) — Sudbury Development, LLC 29 28 — NYC JV (333 ) — —
Total $ 15,270 $ 70,744 $ 64,962
(1) The Company's equity in income for this entity represents its residual profits from the sale of the community, or liquidation of the venture.
(2) Equity in income for the years ended December 31, 2017 and 2016 includes the Company's proportionate share of the gain on the sale of Fund II assets of $26,322 and $41,501, respectively. In addition, equity in income for the years ended December 31, 2018, 2017 and 2016 include $925, $26,472 and $7,985, respectively, relating to the Company's recognition of its promoted interest.
(3) Equity in income for the years ended December 31, 2018, 2017 and 2016 includes the Company's proportionate share of the gain on the sale of U.S. Fund assets of $8,636, $13,788 and $16,568, respectively.
(4) Equity in income for the year ended December 31, 2018 includes the Company's proportionate share of the gain on the sale of an AC JV assets of $2,019.
(5) In 2016, the Company and its venture partner established separate legal ownership of Avalon Clarendon, after which the Company reported the operating results of Avalon Clarendon as part of its consolidated operations.

Table of Contents
The Company accounted for these as asset acquisitions and recorded the acquired assets and assumed liabilities, including identifiable intangibles, at their relative fair values based on the purchase price and acquisition costs incurred. The Company used third party pricing or internal models for the values of the land, a valuation model for the values of the buildings, and an internal model to determine the fair values of the remaining real estate assets and in-place leases. Given the heterogeneous nature of multifamily real estate, the fair values for the land, debt, real estate assets and in-place leases incorporated significant unobservable inputs and therefore are considered to be Level 3 prices within the fair value hierarchy. Expensed transaction costs associated with the acquisitions made by the Company in 2016, all of which were accounted for as business combinations prior to the adoption of ASU 2017-01 on October 1, 2016, totaled $5,139,000. This amount was reported as a component of expensed acquisition, development and other pursuit costs, net of recoveries on the accompanying Consolidated Statements of Comprehensive Income. To the extent the Company received amounts related to acquired communities for periods prior to their acquisition, the Company reported the receipts, net with expensed acquisition costs. On February 27, 2013, pursuant to an asset purchase agreement dated November 26, 2012, the Company, together with Equity Residential, acquired, directly or indirectly, all of the assets owned by Archstone Enterprise LP (“Archstone,” which has since changed its name to Jupiter Enterprise LP), including all of the ownership interests in joint ventures and other entities owned by Archstone, and assumed Archstone’s liabilities, both known and unknown, with certain limited exceptions. Under the terms of the purchase agreement, the Company acquired approximately 40.0% of Archstone's assets and liabilities and Equity Residential acquired approximately 60.0% of Archstone’s assets and liabilities (the “Archstone Acquisition”). In conjunction with the development of Avalon Brooklyn Bay, the Company entered into a joint venture agreement to construct a mixed-use building that contains rental apartments, for-sale residential condominium units and related common elements. The Company owns a 70.0% interest in the venture, which represents a 100% interest in the rental apartments, and the venture partner owns the remaining 30.0% interest, which represents a 100% interest in the for-sale residential condominium units. The Company was responsible for the development and construction of the structure, and provided a loan to the venture partner for the venture partner's share of costs. The venture is considered a VIE, and the Company consolidates its interest in the rental apartments and common areas, which are included in total real estate, net on the accompanying Consolidated Balance Sheets. The development of Avalon Brooklyn Bay was completed during the year ended December 31, 2018. As of December 31, 2018, the Company has a receivable from the venture partner in the form of a variable rate mortgage note, secured by the remaining for-sale residential condominium units. The balance as of December 31, 2018 was $12,819,000, representing outstanding principal and interest, net of repayments, and as of December 31, 2017, was $44,831,000, representing outstanding principal and interest. These amounts are reported as a component of prepaid expenses and other assets on the accompanying Consolidated Balance Sheets. The Company recognizes interest income on the accrual basis.
F-26
• Avalon Arundel Crossing, located in Linthicum Heights, MD, contains 310 apartment homes and was acquired for a purchase price of $83,000,000.
• Alexander Apartments & Lofts, located in West Palm Beach, FL, contains 290 apartment homes and 2,000 square feet of retail space and was acquired for a purchase price of $103,000,000.
• Ironwood at Red Rocks, located in Littleton, CO, contains 256 apartment homes and was acquired for a purchase price of $75,400,000.
• The Meadows, located in Castle Rock, CO, contains 240 apartment homes and was acquired for a purchase price of $73,050,000.

Table of Contents 6. Real Estate Disposition Activities The following activity took place during the year ended December 31, 2018:
Details regarding the real estate sales are summarized in the following table (dollars in thousands):
_________________________________
As of December 31, 2018, the Company had one community and two ancillary land parcels that qualified as held for sale. 7. Commitments and Contingencies Employment Agreements and Arrangements At December 31, 2018, the Company does not have any employment agreements with executive officers. The standard restricted stock and option agreements used by the Company in its compensation program provide that upon an employee's termination without cause or the employee's Retirement (as defined in the agreement), all outstanding stock options and restricted shares of stock held by the employee will vest, and the employee will have up to 12 months or until the fifth anniversary of the grant date, if later, or until the option expiration date, if earlier, to exercise any options then held. Under the agreements, Retirement generally means a termination of employment and other business relationships, other than for cause, after attainment of age 50, provided that (i) the employee has worked for the Company for at least 10 years, (ii) the employee's age at Retirement plus years of employment with the Company equals at least 70, (iii) the employee provides at least six months written notice of intent to retire, and (iv) the employee enters into a one year non-compete and employee non-solicitation agreement.
F-27
• The Company sold eight wholly-owned operating communities, containing an aggregate of 1,798 apartment homes for an aggregate sales price of $618,750,000 and an aggregate gain of $195,115,000.
• The Company contributed five wholly-owned operating communities to the NYC Joint Venture for a sales price of $758,900,000, recognizing a gain on sale of $179,861,000. See Note 5, “Investments in Real Estate Entities,” for additional discussion of the venture.
• The Company sold other real estate for an aggregate sales price of $639,000, resulting in an aggregate gain of $345,000.
Community Name Location Period of sale
Apartment homes Debt
Gross sales price
Net cash proceeds
Avalon Blue Hills/Avalon Canton at Blue Hills Randolph/Canton, MA Q218 472 $ — $ 131,250 $ 129,466 Eaves North Quincy Quincy, MA Q218 224 — 64,250 63,302 Avalon Anaheim Stadium Anaheim, CA Q218 251 — 111,600 105,495 Avalon Ballston Place Arlington, VA Q318 383 — 169,000 166,921 Avalon at Fairway Hills - Fields Columbia, MD Q418 192 — 39,500 38,744 Avalon Fashion Valley San Diego, CA Q418 161 — 70,750 69,781 Avalon Andover Andover, MA Q418 115 — 32,400 31,765 NYC Joint Venture (1) New York, NY Q418 1,301 395,939 758,900 276,799 Other real estate dispositions (2) multiple 2018 N/A — 639 1,040
Total of 2018 asset sales 3,099 $ 395,939 $ 1,378,289 $ 883,313
Total of 2017 asset sales 1,624 $ — $ 514,654 $ 503,039
Total of 2016 asset sales 2,051 $ — $ 564,028 $ 532,717
(1) The Company contributed five communities located in New York, NY, to the NYC Joint Venture, in which the Company retained a 20.0% ownership interest, as discussed in Note 5, "Investments in Real Estate Entities."
(2) Primarily composed of the sale of one undeveloped land parcel, located in Fairfax City, VA.

Table of Contents The Company also has an Officer Severance Program (the “Program”). Under the Program, in the event an officer who is not otherwise covered by a severance arrangement is terminated (other than for cause), or chooses to terminate his or her employment for good reason (as defined), in either case within 18 months following a sale event (as defined) of the Company, such officer will generally receive a cash lump sum payment equal to a multiple of the officer's covered compensation (base salary plus annual cash bonus). The multiple is one time for vice presidents and senior vice presidents, two times for executive vice presidents and three times for the chief executive officer. The officer's restricted stock and options would also vest. Costs related to the Program are deferred and recognized over the requisite service period when considered by management to be probable and estimable. Maplewood Casualty Loss In February 2017, a fire occurred at the Company's Avalon Maplewood, located in Maplewood, NJ, which at the time was under construction and not yet occupied. The Company completed reconstruction of the damaged and destroyed portions of the community as well as the vertical construction of the community in 2018. See Note 1, "Organization, Basis of Presentation and Significant Accounting Policies," for further discussion of the casualty gains and losses associated with the Maplewood casualty loss. Edgewater Casualty Loss In conjunction with legal matters associated with the Edgewater casualty loss, the Company has established protocols for processing claims from third parties who suffered losses as a result of the fire, and many third parties have contacted the Company's insurance carrier and settled their claims. See Note 1, "Organization, Basis of Presentation and Significant Accounting Policies," for further discussion of the casualty gains and losses associated with the Edgewater casualty loss. With regard to the building that was destroyed, three class action lawsuits have been filed against the Company and consolidated in the United States District Court for the District of New Jersey. The Company has agreed with class counsel to the terms of a settlement which provides a claims process (with agreed upon protocols for instructing the adjuster as to how to evaluate claims) and, if needed, an arbitration process to determine damage amounts to be paid to individual claimants covered by the class settlement. In July 2017, the District Court granted final approval of the settlement and all claims have been submitted to the independent claims adjuster. A total of 66 units (consisting of residents who did not previously settle their claims and who did not opt out of the class settlement) are included in the class action settlement and bound by its terms. However, only approximately 45 units submitted claims. The independent claims adjuster is currently reviewing the claims submitted; the submitted claims total approximately $6,900,000 but, based on the Company's review of the initial determinations made by the adjuster on a number of claims, the Company believes that the total amount actually awarded will be significantly less. To date, the claims adjuster has completed its evaluation of 37 of these claims and it is expected that the evaluation of the remaining claims should be completed within the next month. In addition to the class action lawsuits described above, the Company has resolved litigated claims with tenants of approximately 60 units. There is currently one remaining resident lawsuit with respect to the destroyed building filed in the Superior Court of New Jersey, Bergen County - Law Division; the Company believes it has meritorious defenses to the extent of damages claimed in that suit. A number of subrogation lawsuits had been filed against the Company by insurers of Edgewater residents who obtained renters insurance; these lawsuits have been resolved or are expected to be resolved during the first quarter of 2019. A fourth class action, being heard in the same federal court, was filed against the Company on behalf of a purported class of residents of the second Edgewater building that suffered minimal damage. Having settled many third party claims through the insurance claims process, while no assurances can be given, the Company currently believes that any potential remaining liability to third parties (including any potential liability to third parties determined in accordance with the class settlement described above) will not be material to the Company and will in any event be substantially covered by the Company's insurance policies. The Company is involved in various other claims and/or administrative proceedings unrelated to the Edgewater casualty loss that arise in the ordinary course of its business. While no assurances can be given, the Company does not currently believe that any of these other outstanding litigation matters, individually or in the aggregate, will have a material adverse effect on its financial condition or results of operations.
F-28
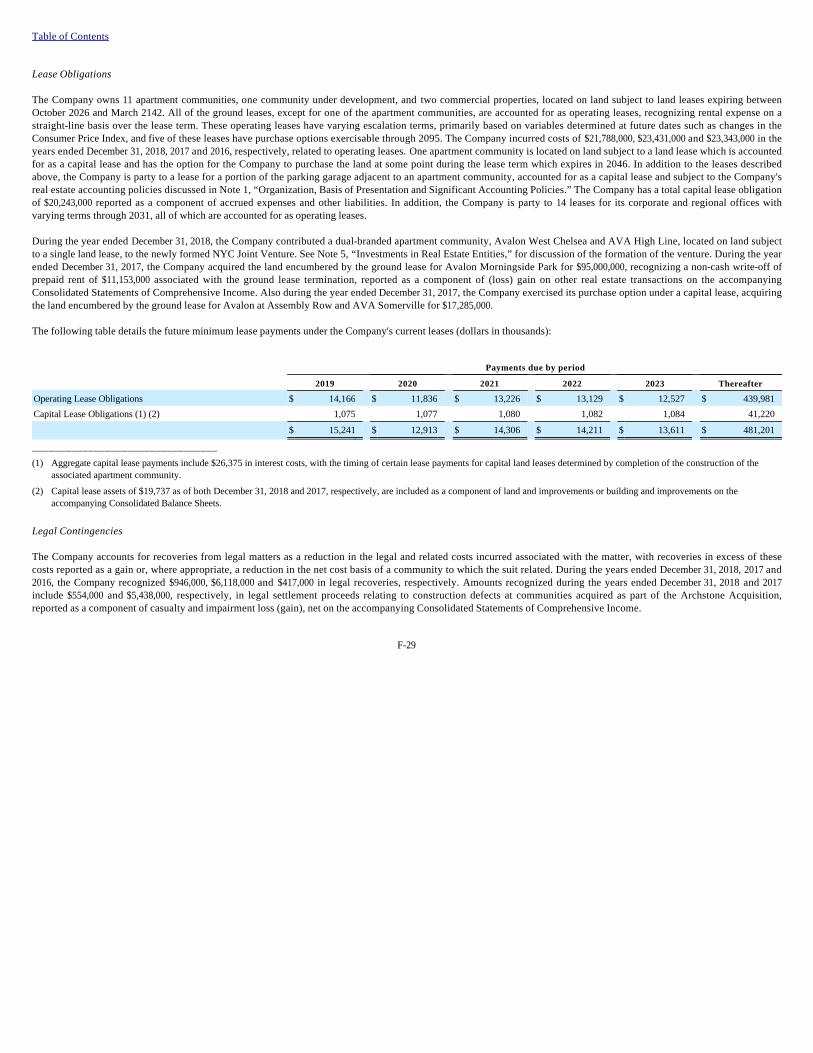
Table of Contents Lease Obligations The Company owns 11 apartment communities, one community under development, and two commercial properties, located on land subject to land leases expiring between October 2026 and March 2142. All of the ground leases, except for one of the apartment communities, are accounted for as operating leases, recognizing rental expense on a straight-line basis over the lease term. These operating leases have varying escalation terms, primarily based on variables determined at future dates such as changes in the Consumer Price Index, and five of these leases have purchase options exercisable through 2095. The Company incurred costs of $21,788,000, $23,431,000 and $23,343,000 in the years ended December 31, 2018, 2017 and 2016, respectively, related to operating leases. One apartment community is located on land subject to a land lease which is accounted for as a capital lease and has the option for the Company to purchase the land at some point during the lease term which expires in 2046. In addition to the leases described above, the Company is party to a lease for a portion of the parking garage adjacent to an apartment community, accounted for as a capital lease and subject to the Company's real estate accounting policies discussed in Note 1, “Organization, Basis of Presentation and Significant Accounting Policies.” The Company has a total capital lease obligation of $20,243,000 reported as a component of accrued expenses and other liabilities. In addition, the Company is party to 14 leases for its corporate and regional offices with varying terms through 2031, all of which are accounted for as operating leases. During the year ended December 31, 2018, the Company contributed a dual-branded apartment community, Avalon West Chelsea and AVA High Line, located on land subject to a single land lease, to the newly formed NYC Joint Venture. See Note 5, “Investments in Real Estate Entities,” for discussion of the formation of the venture. During the year ended December 31, 2017, the Company acquired the land encumbered by the ground lease for Avalon Morningside Park for $95,000,000, recognizing a non-cash write-off of prepaid rent of $11,153,000 associated with the ground lease termination, reported as a component of (loss) gain on other real estate transactions on the accompanying Consolidated Statements of Comprehensive Income. Also during the year ended December 31, 2017, the Company exercised its purchase option under a capital lease, acquiring the land encumbered by the ground lease for Avalon at Assembly Row and AVA Somerville for $17,285,000. The following table details the future minimum lease payments under the Company's current leases (dollars in thousands):
_________________________________
Legal Contingencies The Company accounts for recoveries from legal matters as a reduction in the legal and related costs incurred associated with the matter, with recoveries in excess of these costs reported as a gain or, where appropriate, a reduction in the net cost basis of a community to which the suit related. During the years ended December 31, 2018, 2017 and 2016, the Company recognized $946,000, $6,118,000 and $417,000 in legal recoveries, respectively. Amounts recognized during the years ended December 31, 2018 and 2017 include $554,000 and $5,438,000, respectively, in legal settlement proceeds relating to construction defects at communities acquired as part of the Archstone Acquisition, reported as a component of casualty and impairment loss (gain), net on the accompanying Consolidated Statements of Comprehensive Income.
F-29
Payments due by period
2019 2020 2021 2022 2023 Thereafter
Operating Lease Obligations $ 14,166 $ 11,836 $ 13,226 $ 13,129 $ 12,527 $ 439,981 Capital Lease Obligations (1) (2) 1,075 1,077 1,080 1,082 1,084 41,220
$ 15,241 $ 12,913 $ 14,306 $ 14,211 $ 13,611 $ 481,201
(1) Aggregate capital lease payments include $26,375 in interest costs, with the timing of certain lease payments for capital land leases determined by completion of the construction of the associated apartment community.
(2) Capital lease assets of $19,737 as of both December 31, 2018 and 2017, respectively, are included as a component of land and improvements or building and improvements on the accompanying Consolidated Balance Sheets.

Table of Contents 8. Segment Reporting The Company's reportable operating segments include Established Communities, Other Stabilized Communities and Development/Redevelopment Communities. Annually as of January 1, the Company determines which of its communities fall into each of these categories and generally maintains that classification throughout the year for the purpose of reporting segment operations, unless disposition or redevelopment plans regarding a community change.
In addition, the Company owns land for future development and has other corporate assets that are not allocated to an operating segment. The Company's segment disclosures present the measure(s) used by the chief operating decision maker for purposes of assessing each segment's performance. The Company's chief operating decision maker is comprised of several members of its executive management team who use net operating income (“NOI”) as the primary financial measure for Established Communities and Other Stabilized Communities. NOI is defined by the Company as total property revenue less direct property operating expenses (including property taxes), and excluding corporate-level income (including management, development and other fees), corporate-level property management and other indirect operating expenses, investments and investment management expenses, expensed transaction, development and other pursuit costs, net of recoveries, interest expense, net, loss (gain) on extinguishment of debt, net, general and administrative expense, equity in income of unconsolidated real estate entities, depreciation expense, corporate income tax (benefit) expense, casualty and impairment loss (gain), net, gain on sale of communities, loss (gain) on other real estate transactions, net and net operating income from real estate assets sold or held for sale. Although the Company considers NOI a useful measure of a community's or communities' operating performance, NOI should not be considered an alternative to net income or net cash flow from operating activities, as determined in accordance with GAAP. NOI excludes a number of income and expense categories as detailed in the reconciliation of NOI to net income.
F-30
• Established Communities (also known as Same Store Communities) are consolidated communities where the Company has a significant presence (New England, New York/New Jersey, Mid-Atlantic, Pacific Northwest, and Northern and Southern California) and where a comparison of operating results from the prior year to the current year is meaningful, as these communities were owned and had stabilized occupancy as of the beginning of the prior year. The Established Communities for the year ended December 31, 2018, are communities that are consolidated for financial reporting purposes, had stabilized occupancy as of January 1, 2017, are not conducting or planning to conduct substantial redevelopment activities and are not held for sale or planned for disposition within the fiscal year. A community is considered to have stabilized occupancy at the earlier of (i) attainment of 95% physical occupancy or (ii) the one-year anniversary of completion of development or redevelopment.
• Other Stabilized Communities includes all other completed consolidated communities that have stabilized occupancy, as defined above, as January 1, 2018, or which were acquired during the year ended December 31, 2018. Other Stabilized Communities includes stabilized operating communities in our expansion markets of Denver, Colorado, and Southeast Florida, but excludes communities that are conducting or planning to conduct substantial redevelopment activities within the fiscal year.
• Development/Redevelopment Communities consists of (i) consolidated communities that are either currently under construction, or were under construction during the fiscal year, which may be partially or fully complete and operating, (ii) consolidated communities where substantial redevelopment is in progress or is planned to begin during the fiscal year and (iii) communities under lease-up that have been complete for less than one year and have not reached stabilized occupancy, as defined above, as of January 1, 2018.

Table of Contents A reconciliation of NOI to net income for years ended December 31, 2018, 2017 and 2016 is as follows (dollars in thousands):
The following is a summary of NOI from real estate assets sold or held for sale for the periods presented (dollars in thousands):
The primary performance measure for communities under development or redevelopment depends on the stage of completion. While under development, management monitors actual construction costs against budgeted costs as well as lease-up pace and rent levels compared to budget. The following table provides details of the Company's segment information as of the dates specified (dollars in thousands). The segments are classified based on the individual community's status at January 1, 2018 for the years ended December 31, 2018 and 2017 and at January 1, 2017, for the year ended December 31, 2016. Segment information for the years ended December 31, 2018, 2017 and 2016 has been adjusted to exclude the real estate assets that were sold from January 1, 2016 through December 31, 2018, or otherwise qualify as held for sale as of December 31, 2018, as described in Note 6, “Real Estate Disposition Activities.”
F-31
For the year ended
12/31/18 12/31/17 12/31/16
Net income $ 974,175 $ 876,660 $ 1,033,708 Indirect operating expenses, net of corporate income 76,522 65,398 61,403 Investments and investment management expense 7,709 5,936 4,822 Expensed acquisition, development and other pursuit costs, net of recoveries 4,309 2,736 9,922 Interest expense, net 220,974 199,661 187,510 Loss on extinguishment of debt, net 17,492 25,472 7,075 General and administrative expense 56,365 50,673 45,771 Equity in income of unconsolidated real estate entities (15,270 ) (70,744 ) (64,962 )
Depreciation expense 631,196 584,150 531,434 Income tax (benefit) expense (160 ) 141 305 Casualty and impairment loss (gain), net 215 6,250 (3,935 )
Gain on sale of communities (374,976 ) (252,599 ) (374,623 )
(Gain) loss on other real estate transactions (345 ) 10,907 (10,224 )
Net operating income from real estate assets sold or held for sale (58,620 ) (84,650 ) (114,219 )
Net operating income $ 1,539,586 $ 1,419,991 $ 1,313,987
For the year ended
12/31/2018 12/31/2017 12/31/2016
Rental income from real estate assets sold or held for sale $ 88,865 $ 133,956 $ 179,226 Operating expenses from real estate assets sold or held for sale (30,245 ) (49,306 ) (65,007 )
Net operating income from real estate assets sold or held for sale $ 58,620 $ 84,650 $ 114,219

Table of Contents
_________________________________
F-32
Total
revenue NOI Gross
real estate (1)
For the year ended December 31, 2018 Established
New England $ 239,638 $ 157,109 $ 2,014,158 Metro NY/NJ 360,430 254,132 3,086,133 Mid-Atlantic 237,113 165,724 2,226,315 Pacific Northwest 86,571 62,194 727,652 Northern California 366,834 280,994 2,986,068 Southern California 341,840 245,356 2,921,616
Total Established (2) 1,632,426 1,165,509 13,961,942
Other Stabilized 262,053 178,172 2,934,711 Development / Redevelopment 297,619 195,905 5,201,454 Land Held for Future Development N/A N/A 84,712 Non-allocated (3) 3,572 N/A 94,350
Total $ 2,195,670 $ 1,539,586 $ 22,277,169
For the year ended December 31, 2017
Established New England $ 232,688 $ 152,514 $ 1,993,653 Metro NY/NJ 354,444 251,760 3,071,563 Mid-Atlantic 232,987 161,546 2,216,292 Pacific Northwest 84,313 61,705 724,751 Northern California 357,209 273,940 2,972,311 Southern California 330,024 237,796 2,905,512
Total Established (2) 1,591,665 1,139,261 13,884,082
Other Stabilized 193,594 127,678 2,571,356 Development / Redevelopment (4) 235,266 153,052 4,104,956 Land Held for Future Development N/A N/A 68,364 Non-allocated (3) 4,147 N/A 78,864 Real estate disposed or held for sale (5) 1,228,314
Total $ 2,024,672 $ 1,419,991 $ 21,935,936
For the year ended December 31, 2016
Established New England $ 209,935 $ 136,019 $ 1,667,171 Metro NY/NJ 294,199 204,882 2,412,742 Mid-Atlantic 203,003 141,624 1,862,091 Pacific Northwest 79,958 57,857 731,277 Northern California 331,610 253,582 2,812,859 Southern California 313,404 224,955 2,840,773
Total Established (2) 1,432,109 1,018,919 12,326,913
Other Stabilized 221,272 151,475 2,650,966 Development / Redevelopment (6) 207,049 143,593 4,154,778 Land Held for Future Development N/A N/A 84,293 Non-allocated (3) 5,599 N/A 80,700 Real estate disposed or held for sale (5) 1,458,130
Total $ 1,866,029 $ 1,313,987 $ 20,755,780
(1) Does not include gross real estate assets held for sale of $65,408 and $20,846 as of December 31, 2018 and 2016, respectively.
(2) Gross real estate for the Company's Established Communities includes capitalized additions of approximately $78,469, $78,241 and $85,676 in 2018, 2017 and 2016, respectively.
(3) Revenue represents third-party management, accounting, and developer fees and miscellaneous income which are not allocated to a reportable segment.
(4) Total revenue and NOI for the year ended December 31, 2017 includes $3,495 in business interruption insurance proceeds related to the Maplewood casualty loss.

Table of Contents
9. Stock-Based Compensation Plans The Company's Second Amended and Restated 2009 Equity Incentive Plan (the “2009 Plan”) includes an authorization to issue shares of the Company's common stock, par value $0.01 per share. At December 31, 2018, the Company had 7,509,205 shares remaining available to issue under the 2009 Plan, exclusive of shares that may be issued to satisfy currently outstanding awards such as stock options or performance awards. In addition, any awards that were outstanding under the Company's 1994 Stock Option and Incentive Plan (the “1994 Plan”) on May 21, 2009, the date the Company adopted the 2009 Plan, that are subsequently forfeited, canceled, surrendered or terminated (other than by exercise) will become available for awards under the 2009 Plan. The 2009 Plan provides for various types of equity awards to associates, officers, non-employee directors and other key personnel of the Company and its subsidiaries. The types of awards that may be granted under the 2009 Plan include restricted stock, restricted stock units, stock options that qualify as incentive stock options (“ISOs”) under Section 422 of the Code, non-qualified stock options, stock appreciation rights and performance awards, among others. No grants of stock options and other awards will be made after May 15, 2027, and no grants of incentive stock options will be made after February 16, 2027. Information with respect to stock options granted under the 2009 and 1994 Plans is as follows:
_________________________________
The following summarizes the exercise prices and contractual lives of options outstanding as of December 31, 2018:
F-33
(5) Represents real estate sold or held for sale between the reported year end date and December 31, 2018, which is not allocated to a reportable segment.
(6) Total revenue and NOI for the year ended December 31, 2016 includes $20,306 in business interruption insurance proceeds related to the Edgewater casualty loss.
2009 Plan
shares
Weighted average
exercise price per share
1994 Plan shares
Weighted average
exercise price per share
Options Outstanding, December 31, 2015 249,178 $ 122.17 82,195 $ 103.27 Exercised (71,845) 117.04 (59,654) 112.85 Granted — — — — Forfeited — — — —
Options Outstanding, December 31, 2016 177,333 $ 124.25 22,541 $ 77.91 Exercised (27,360) 110.47 (14,763) 93.35 Granted — — — — Forfeited — — — —
Options Outstanding, December 31, 2017 149,973 $ 126.77 7,778 $ 48.60 Exercised (32,756) 126.24 (7,778) 48.60 Granted (1) 6,995 161.10 — — Forfeited — — — —
Options Outstanding, December 31, 2018 124,212 $ 128.84 — $ —
Options Exercisable:
December 31, 2016 177,333 $ 124.25 22,541 $ 77.91
December 31, 2017 149,973 $ 126.77 7,778 $ 48.60
December 31, 2018 117,217 $ 126.91 — $ —
(1) Options granted during the year ended December 31, 2018 are a result of recipient elections to receive a portion of earned performance awards and time-vesting restricted stock in the form of stock options.
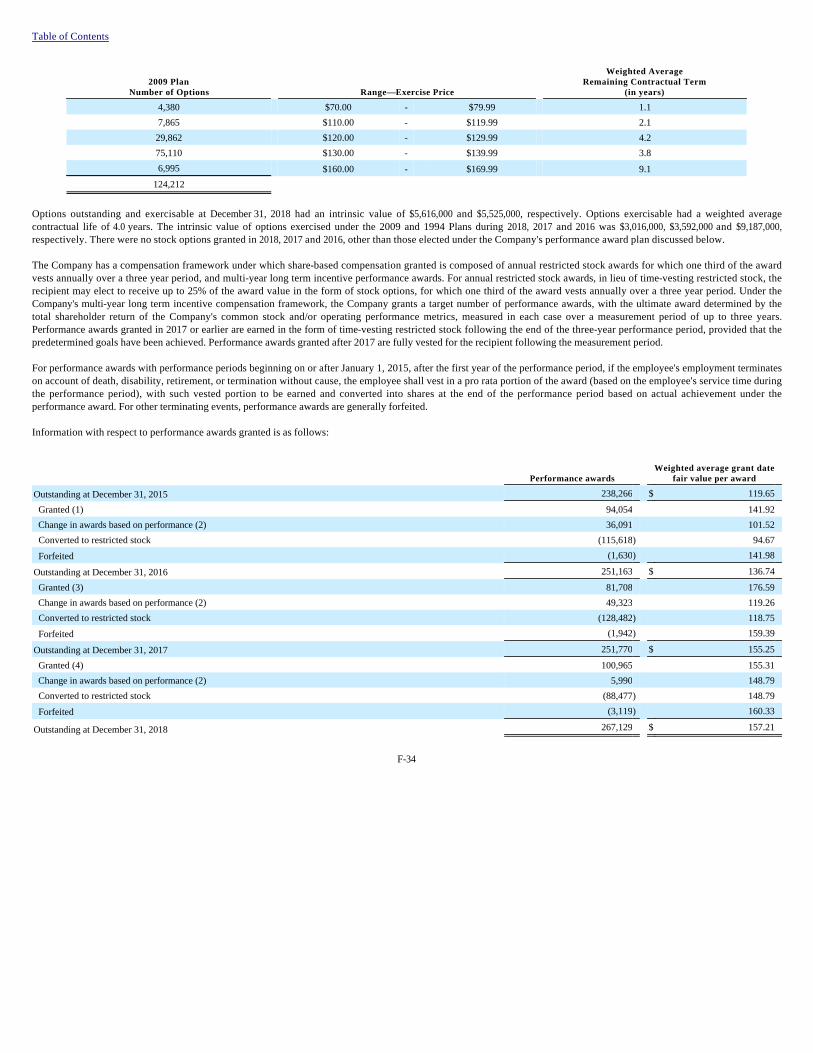
Table of Contents
Options outstanding and exercisable at December 31, 2018 had an intrinsic value of $5,616,000 and $5,525,000, respectively. Options exercisable had a weighted average contractual life of 4.0 years. The intrinsic value of options exercised under the 2009 and 1994 Plans during 2018, 2017 and 2016 was $3,016,000, $3,592,000 and $9,187,000, respectively. There were no stock options granted in 2018, 2017 and 2016, other than those elected under the Company's performance award plan discussed below. The Company has a compensation framework under which share-based compensation granted is composed of annual restricted stock awards for which one third of the award vests annually over a three year period, and multi-year long term incentive performance awards. For annual restricted stock awards, in lieu of time-vesting restricted stock, the recipient may elect to receive up to 25% of the award value in the form of stock options, for which one third of the award vests annually over a three year period. Under the Company's multi-year long term incentive compensation framework, the Company grants a target number of performance awards, with the ultimate award determined by the total shareholder return of the Company's common stock and/or operating performance metrics, measured in each case over a measurement period of up to three years. Performance awards granted in 2017 or earlier are earned in the form of time-vesting restricted stock following the end of the three-year performance period, provided that the predetermined goals have been achieved. Performance awards granted after 2017 are fully vested for the recipient following the measurement period. For performance awards with performance periods beginning on or after January 1, 2015, after the first year of the performance period, if the employee's employment terminates on account of death, disability, retirement, or termination without cause, the employee shall vest in a pro rata portion of the award (based on the employee's service time during the performance period), with such vested portion to be earned and converted into shares at the end of the performance period based on actual achievement under the performance award. For other terminating events, performance awards are generally forfeited. Information with respect to performance awards granted is as follows:
F-34
2009 Plan Number of Options Range—Exercise Price
Weighted Average Remaining Contractual Term
(in years)
4,380 $70.00 - $79.99 1.1
7,865 $110.00 - $119.99 2.1
29,862 $120.00 - $129.99 4.2
75,110 $130.00 - $139.99 3.8
6,995 $160.00 - $169.99 9.1
124,212
Performance awards Weighted average grant date
fair value per award
Outstanding at December 31, 2015 238,266 $ 119.65 Granted (1) 94,054 141.92 Change in awards based on performance (2) 36,091 101.52 Converted to restricted stock (115,618) 94.67 Forfeited (1,630) 141.98
Outstanding at December 31, 2016 251,163 $ 136.74 Granted (3) 81,708 176.59 Change in awards based on performance (2) 49,323 119.26 Converted to restricted stock (128,482) 118.75 Forfeited (1,942) 159.39
Outstanding at December 31, 2017 251,770 $ 155.25 Granted (4) 100,965 155.31 Change in awards based on performance (2) 5,990 148.79 Converted to restricted stock (88,477) 148.79 Forfeited (3,119) 160.33
Outstanding at December 31, 2018 267,129 $ 157.21
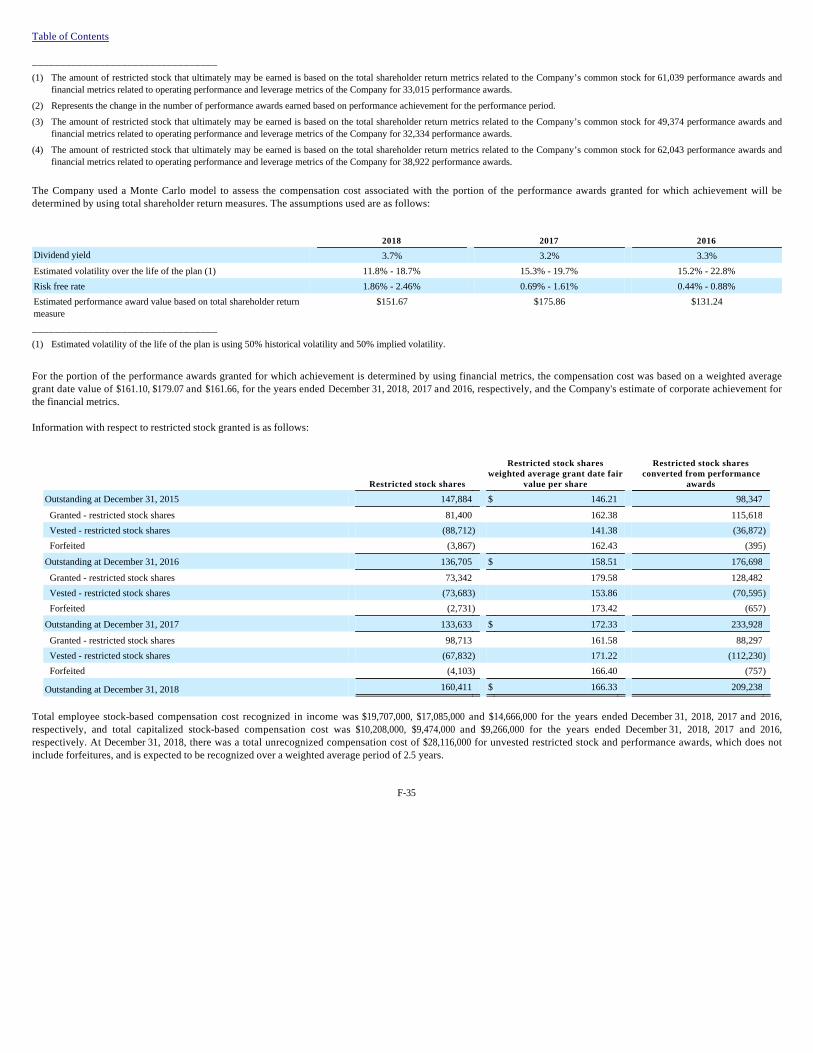
Table of Contents _________________________________
The Company used a Monte Carlo model to assess the compensation cost associated with the portion of the performance awards granted for which achievement will be determined by using total shareholder return measures. The assumptions used are as follows:
_________________________________
For the portion of the performance awards granted for which achievement is determined by using financial metrics, the compensation cost was based on a weighted average grant date value of $161.10, $179.07 and $161.66, for the years ended December 31, 2018, 2017 and 2016, respectively, and the Company's estimate of corporate achievement for the financial metrics. Information with respect to restricted stock granted is as follows:
Total employee stock-based compensation cost recognized in income was $19,707,000, $17,085,000 and $14,666,000 for the years ended December 31, 2018, 2017 and 2016, respectively, and total capitalized stock-based compensation cost was $10,208,000, $9,474,000 and $9,266,000 for the years ended December 31, 2018, 2017 and 2016, respectively. At December 31, 2018, there was a total unrecognized compensation cost of $28,116,000 for unvested restricted stock and performance awards, which does not include forfeitures, and is expected to be recognized over a weighted average period of 2.5 years.
F-35
(1) The amount of restricted stock that ultimately may be earned is based on the total shareholder return metrics related to the Company’s common stock for 61,039 performance awards and financial metrics related to operating performance and leverage metrics of the Company for 33,015 performance awards.
(2) Represents the change in the number of performance awards earned based on performance achievement for the performance period.
(3) The amount of restricted stock that ultimately may be earned is based on the total shareholder return metrics related to the Company’s common stock for 49,374 performance awards and financial metrics related to operating performance and leverage metrics of the Company for 32,334 performance awards.
(4) The amount of restricted stock that ultimately may be earned is based on the total shareholder return metrics related to the Company’s common stock for 62,043 performance awards and financial metrics related to operating performance and leverage metrics of the Company for 38,922 performance awards.
2018 2017 2016
Dividend yield 3.7% 3.2% 3.3%
Estimated volatility over the life of the plan (1) 11.8% - 18.7% 15.3% - 19.7% 15.2% - 22.8%
Risk free rate 1.86% - 2.46% 0.69% - 1.61% 0.44% - 0.88%
Estimated performance award value based on total shareholder return measure
$151.67
$175.86
$131.24
(1) Estimated volatility of the life of the plan is using 50% historical volatility and 50% implied volatility.
Restricted stock shares
Restricted stock shares weighted average grant date fair
value per share
Restricted stock shares converted from performance
awards
Outstanding at December 31, 2015 147,884 $ 146.21 98,347 Granted - restricted stock shares 81,400 162.38 115,618 Vested - restricted stock shares (88,712) 141.38 (36,872)
Forfeited (3,867) 162.43 (395)
Outstanding at December 31, 2016 136,705 $ 158.51 176,698 Granted - restricted stock shares 73,342 179.58 128,482 Vested - restricted stock shares (73,683) 153.86 (70,595)
Forfeited (2,731) 173.42 (657)
Outstanding at December 31, 2017 133,633 $ 172.33 233,928 Granted - restricted stock shares 98,713 161.58 88,297 Vested - restricted stock shares (67,832) 171.22 (112,230)
Forfeited (4,103) 166.40 (757)
Outstanding at December 31, 2018 160,411 $ 166.33 209,238

Table of Contents As of January 1, 2017, the Company adopted the provisions of ASU 2016-09, electing to account for forfeitures as they occur. Prior to the adoption of ASU 2016-09, the Company was required to estimate the forfeiture of stock options and recognized compensation cost net of the estimated forfeitures. The estimated forfeitures included in compensation cost were adjusted to reflect actual forfeitures at the end of the vesting period. The actual forfeiture rate for the years ended December 31, 2018 and 2017 were 0.6% and 0.7%, respectively. The application of estimated forfeitures did not materially impact compensation expense for the year ended December 31, 2016. Employee Stock Purchase Plan In October 1996, the Company adopted the 1996 Non-Qualified Employee Stock Purchase Plan (as amended, the “ESPP”). Initially 1,000,000 shares of common stock were reserved for issuance under this plan. There are currently 668,329 shares remaining available for issuance under the ESPP. Employees of the Company generally are eligible to participate in the ESPP if, as of the last day of the applicable purchase period, they have been employed by the Company for at least one month. Under the ESPP, eligible employees are permitted to acquire shares of the Company's common stock through payroll deductions, subject to maximum purchase limitations, during two purchase periods. The first purchase period begins January 1 and ends June 10, and the second purchase period begins July 1 and ends December 10. The purchase price for common stock purchased under the plan is 85% of the lesser of the fair market value of the Company's common stock on the first day of the applicable purchase period or the last day of the applicable purchase period. The offering dates, purchase dates and duration of purchase periods may be changed if the change is announced prior to the beginning of the affected date or purchase period. The Company issued 12,955, 11,528 and 11,348 shares and recognized compensation expense of $436,000, $418,000 and $289,000 under the ESPP for the years ended December 31, 2018, 2017 and 2016, respectively. The Company accounts for transactions under the ESPP using the fair value method prescribed by accounting guidance applicable to entities that use employee share purchase plans. 10. Related Party Arrangements Unconsolidated Entities The Company manages unconsolidated real estate entities for which it receives asset management, property management, development and redevelopment fee revenue. From these entities, the Company earned fees of $3,572,000, $4,147,000 and $5,599,000 in the years ended December 31, 2018, 2017 and 2016, respectively. In addition, the Company had outstanding receivables associated with its property and construction management role of $2,519,000 and $2,449,000 as of December 31, 2018 and 2017, respectively. Director Compensation Directors of the Company who are also employees receive no additional compensation for their services as a director. Following each annual meeting of stockholders, non-employee directors receive (i) a number of shares of restricted stock (or deferred stock units) having a value of $140,000 and (ii) a cash payment of $90,000, payable in equal quarterly installments of $22,500. The number of shares of restricted stock (or deferred stock units) is calculated based on the closing price on the day of the award. Non-employee directors may elect to receive all or a portion of cash payments in the form of deferred stock units. Additionally, the Lead Independent Director receives in the aggregate an additional annual fee of $30,000 payable in equal quarterly installments of $7,500, non-employee directors serving as the chairperson of the Audit or Compensation Committees receive additional cash compensation of $20,000 per year payable in equal quarterly installments of $5,000, and the Nominating and Corporate Governance and Investment and Finance Committee chairpersons receive an additional annual fee of $15,000 payable in equal quarterly installments of $3,750. The Company recorded non-employee director compensation expense relating to restricted stock grants and deferred stock awards in the amount of $1,624,000, $1,524,000 and $1,216,000 for the years ended December 31, 2018, 2017 and 2016, respectively, as a component of general and administrative expense. Deferred compensation relating to these restricted stock grants and deferred stock awards to non-employee directors was $571,000, $525,000 and $531,000 on December 31, 2018, 2017 and 2016, respectively, reported as a component of prepaid expenses and other assets on the accompanying Consolidated Balance Sheets.
F-36

Table of Contents 11. Fair Value Financial Instruments Carried at Fair Value Derivative Financial Instruments Currently, the Company uses interest rate swap and interest rate cap agreements to manage its interest rate risk. These instruments are carried at fair value in the Company's financial statements. In adjusting the fair value of its derivative contracts for the effect of counterparty nonperformance risk, the Company has considered the impact of its net position with a given counterparty, as well as any applicable credit enhancements, such as collateral postings, thresholds, mutual puts and guarantees. The Company minimizes its credit risk on these transactions by dealing with major, creditworthy financial institutions which have an A or better credit rating by the Standard & Poor's Ratings Group. As part of its on-going control procedures, the Company monitors the credit ratings of counterparties and the exposure of the Company to any single entity, thus reducing credit risk concentration. The Company believes the likelihood of realizing losses from counterparty nonperformance is remote. Although the Company has determined that the majority of the inputs used to value its derivatives fall within Level 2 of the fair value hierarchy, such as interest rate, term to maturity and volatility, the credit valuation adjustments associated with its derivatives use Level 3 inputs, such as estimates of current credit spreads, to evaluate the likelihood of default by itself and its counterparties. As of December 31, 2018, the Company assessed the significance of the impact of the credit valuation adjustments on the overall valuation of its derivative positions and has determined it is not significant. As a result, the Company has determined that its derivative valuations are classified in Level 2 of the fair value hierarchy. The Company recognized a gain of $753,000 for hedge ineffectiveness for the year ended December 31, 2017, included as a component of interest expense, net on the accompanying Consolidated Statements of Comprehensive Income. Hedge ineffectiveness did not have a material impact on earnings of the Company for any prior period. The following table summarizes the consolidated derivative positions at December 31, 2018 (dollars in thousands):
_________________________________
In 2018, the Company entered into $250,000,000 of forward interest rate swap agreements executed to reduce the impact of variability in interest rates on a portion of the Company's expected debt issuance activity in 2019. During 2018, the Company settled $300,000,000 of forward interest rate swap agreements entered into in 2017, receiving a payment of $12,598,000. The Company has deferred the effective portion of the fair value change of these swaps, in accumulated other comprehensive loss on the accompanying Consolidated Balance Sheets, and will recognize the impact as a component of interest expense, net, over the 10 year period of interest payments hedged. As of December 31, 2018, the Company had $250,000,000 in aggregate outstanding forward interest rate swap agreements. At maturity of the remaining outstanding swap agreements, the Company expects to cash settle the contracts and either pay or receive cash for the then current fair value. Assuming that the Company issues the debt as expected, the hedging impact from these positions will then be recognized over the life of the issued debt as a yield adjustment. The Company had four derivatives designated as cash flow hedges and 10 derivatives not designated as hedges at December 31, 2018. Fair value changes for derivatives not in qualifying hedge relationships for the years ended December 31, 2018 and 2017, were not material. During 2018, the Company deferred $5,132,000 of gains for cash flow hedges reported as a component of other comprehensive income (loss).
F-37
Non-designated Hedges
Interest Rate Caps
Cash Flow Hedges
Interest Rate Caps
Cash Flow Hedges
Interest Rate Swaps
Notional balance $ 588,383 $ 34,155 $ 250,000 Weighted average interest rate (1) 3.3 % 4.5 % N/A Weighted average swapped/capped interest rate 6.6 % 5.9 % 3.0 %
Earliest maturity date April 2020 April 2019 September 2019 Latest maturity date September 2022 April 2019 September 2019
(1) For interest rate caps, represents the weighted average interest rate on the hedged debt.
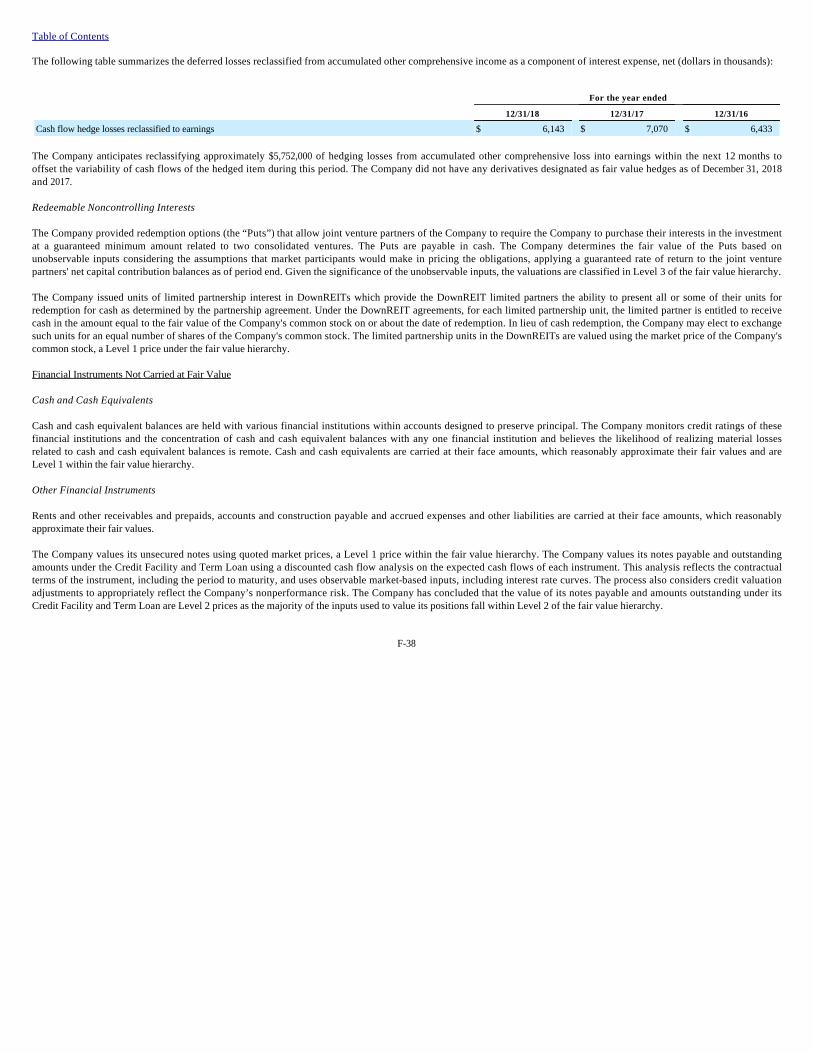
Table of Contents The following table summarizes the deferred losses reclassified from accumulated other comprehensive income as a component of interest expense, net (dollars in thousands):
The Company anticipates reclassifying approximately $5,752,000 of hedging losses from accumulated other comprehensive loss into earnings within the next 12 months to offset the variability of cash flows of the hedged item during this period. The Company did not have any derivatives designated as fair value hedges as of December 31, 2018 and 2017. Redeemable Noncontrolling Interests The Company provided redemption options (the “Puts”) that allow joint venture partners of the Company to require the Company to purchase their interests in the investment at a guaranteed minimum amount related to two consolidated ventures. The Puts are payable in cash. The Company determines the fair value of the Puts based on unobservable inputs considering the assumptions that market participants would make in pricing the obligations, applying a guaranteed rate of return to the joint venture partners' net capital contribution balances as of period end. Given the significance of the unobservable inputs, the valuations are classified in Level 3 of the fair value hierarchy. The Company issued units of limited partnership interest in DownREITs which provide the DownREIT limited partners the ability to present all or some of their units for redemption for cash as determined by the partnership agreement. Under the DownREIT agreements, for each limited partnership unit, the limited partner is entitled to receive cash in the amount equal to the fair value of the Company's common stock on or about the date of redemption. In lieu of cash redemption, the Company may elect to exchange such units for an equal number of shares of the Company's common stock. The limited partnership units in the DownREITs are valued using the market price of the Company's common stock, a Level 1 price under the fair value hierarchy. Financial Instruments Not Carried at Fair Value Cash and Cash Equivalents Cash and cash equivalent balances are held with various financial institutions within accounts designed to preserve principal. The Company monitors credit ratings of these financial institutions and the concentration of cash and cash equivalent balances with any one financial institution and believes the likelihood of realizing material losses related to cash and cash equivalent balances is remote. Cash and cash equivalents are carried at their face amounts, which reasonably approximate their fair values and are Level 1 within the fair value hierarchy. Other Financial Instruments Rents and other receivables and prepaids, accounts and construction payable and accrued expenses and other liabilities are carried at their face amounts, which reasonably approximate their fair values. The Company values its unsecured notes using quoted market prices, a Level 1 price within the fair value hierarchy. The Company values its notes payable and outstanding amounts under the Credit Facility and Term Loan using a discounted cash flow analysis on the expected cash flows of each instrument. This analysis reflects the contractual terms of the instrument, including the period to maturity, and uses observable market-based inputs, including interest rate curves. The process also considers credit valuation adjustments to appropriately reflect the Company’s nonperformance risk. The Company has concluded that the value of its notes payable and amounts outstanding under its Credit Facility and Term Loan are Level 2 prices as the majority of the inputs used to value its positions fall within Level 2 of the fair value hierarchy.
F-38
For the year ended
12/31/18 12/31/17 12/31/16
Cash flow hedge losses reclassified to earnings $ 6,143 $ 7,070 $ 6,433
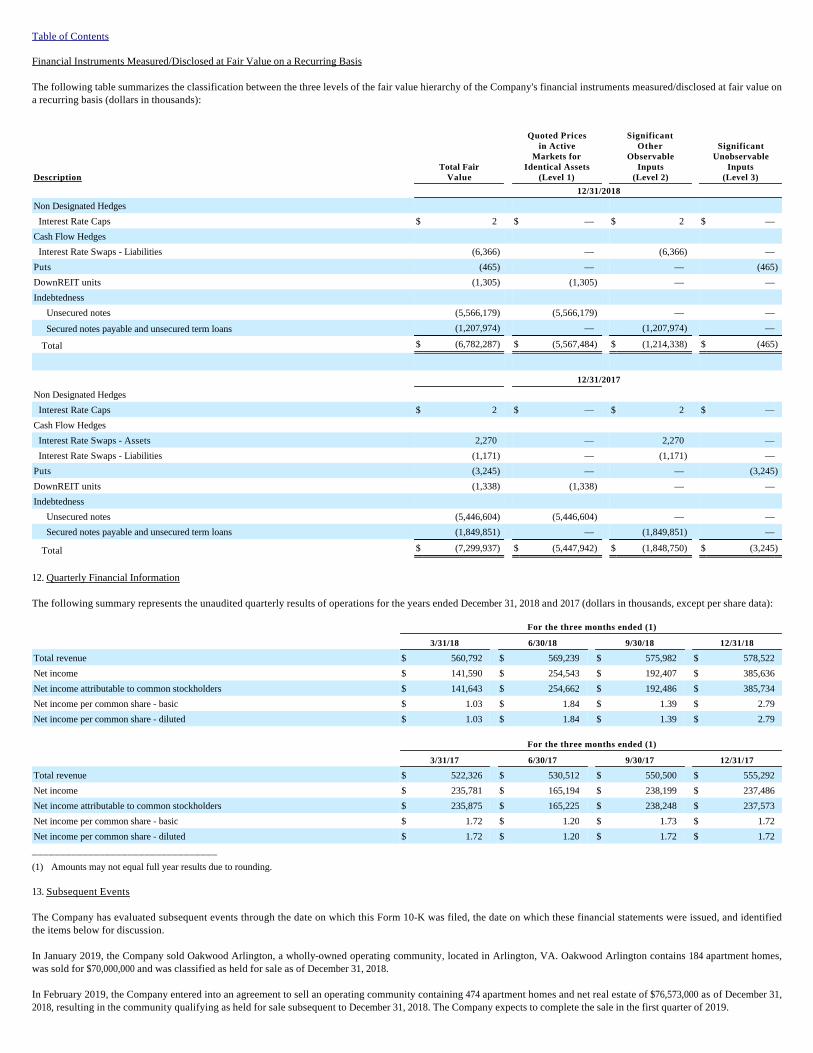
Table of Contents Financial Instruments Measured/Disclosed at Fair Value on a Recurring Basis The following table summarizes the classification between the three levels of the fair value hierarchy of the Company's financial instruments measured/disclosed at fair value on a recurring basis (dollars in thousands):
12. Quarterly Financial Information The following summary represents the unaudited quarterly results of operations for the years ended December 31, 2018 and 2017 (dollars in thousands, except per share data):
_________________________________
13. Subsequent Events The Company has evaluated subsequent events through the date on which this Form 10-K was filed, the date on which these financial statements were issued, and identified the items below for discussion. In January 2019, the Company sold Oakwood Arlington, a wholly-owned operating community, located in Arlington, VA. Oakwood Arlington contains 184 apartment homes, was sold for $70,000,000 and was classified as held for sale as of December 31, 2018. In February 2019, the Company entered into an agreement to sell an operating community containing 474 apartment homes and net real estate of $76,573,000 as of December 31, 2018, resulting in the community qualifying as held for sale subsequent to December 31, 2018. The Company expects to complete the sale in the first quarter of 2019.
Description Total Fair
Value
Quoted Prices in Active
Markets for Identical Assets
(Level 1)
Significant Other
Observable Inputs
(Level 2)
Significant Unobservable
Inputs (Level 3)
12/31/2018
Non Designated Hedges
Interest Rate Caps $ 2 $ — $ 2 $ — Cash Flow Hedges
Interest Rate Swaps - Liabilities (6,366 ) — (6,366 ) — Puts (465 ) — — (465 )
DownREIT units (1,305 ) (1,305 ) — — Indebtedness
Unsecured notes (5,566,179 ) (5,566,179 ) — — Secured notes payable and unsecured term loans (1,207,974 ) — (1,207,974 ) —
Total $ (6,782,287 ) $ (5,567,484 ) $ (1,214,338 ) $ (465 )
12/31/2017
Non Designated Hedges
Interest Rate Caps $ 2 $ — $ 2 $ — Cash Flow Hedges
Interest Rate Swaps - Assets 2,270 — 2,270 — Interest Rate Swaps - Liabilities (1,171 ) — (1,171 ) — Puts (3,245 ) — — (3,245 )
DownREIT units (1,338 ) (1,338 ) — — Indebtedness
Unsecured notes (5,446,604 ) (5,446,604 ) — — Secured notes payable and unsecured term loans (1,849,851 ) — (1,849,851 ) —
Total $ (7,299,937 ) $ (5,447,942 ) $ (1,848,750 ) $ (3,245 )
For the three months ended (1)
3/31/18 6/30/18 9/30/18 12/31/18
Total revenue $ 560,792 $ 569,239 $ 575,982 $ 578,522 Net income $ 141,590 $ 254,543 $ 192,407 $ 385,636 Net income attributable to common stockholders $ 141,643 $ 254,662 $ 192,486 $ 385,734 Net income per common share - basic $ 1.03 $ 1.84 $ 1.39 $ 2.79 Net income per common share - diluted $ 1.03 $ 1.84 $ 1.39 $ 2.79
For the three months ended (1)
3/31/17 6/30/17 9/30/17 12/31/17
Total revenue $ 522,326 $ 530,512 $ 550,500 $ 555,292 Net income $ 235,781 $ 165,194 $ 238,199 $ 237,486 Net income attributable to common stockholders $ 235,875 $ 165,225 $ 238,248 $ 237,573 Net income per common share - basic $ 1.72 $ 1.20 $ 1.73 $ 1.72 Net income per common share - diluted $ 1.72 $ 1.20 $ 1.72 $ 1.72
(1) Amounts may not equal full year results due to rounding.

As of February 22, 2019, the Company has $106,000,000 outstanding under the Credit Facility.
F-39

Table of Contents AVALONBAY COMMUNITIES, INC.
REAL ESTATE AND ACCUMULATED DEPRECIATION December 31, 2018
(Dollars in thousands)
F-40
2018 2017 2018
Initial Cost Total Cost
Community City and state # of
homes Land and
improvements
Building / Construction
in Progress &
Improvements
Costs Subsequent
to Acquisition / Construction
Land and improvements
Building / Construction
in Progress &
Improvements Total Accumulated Depreciation
Total Cost, Net of
Accumulated Depreciation
Total Cost, Net of
Accumulated Depreciation Encumbrances
Year of Completion/ Acquisition
ESTABLISHED COMMUNITIES NEW ENGLAND
Boston, MA Avalon at Lexington Lexington, MA 198 $ 2,124 $ 12,567 $ 10,758 $ 2,124 $ 23,325 $ 25,449 $ 14,980 $ 10,469 $ 10,704 $ — 1994
Avalon Oaks Wilmington, MA 204 2,129 17,567 6,197 2,129 23,764 25,893 14,742 11,151 11,429 — 1999
Eaves Quincy Quincy, MA 245 1,743 14,662 10,450 1,743 25,112 26,855 15,381 11,474 12,133 — 1986/1995
Avalon Oaks West Wilmington, MA 120 3,318 13,465 1,652 3,318 15,117 18,435 8,634 9,801 9,953 — 2002
Avalon Orchards Marlborough, MA 156 2,983 17,970 2,855 2,983 20,825 23,808 12,331 11,477 12,192 — 2002
Avalon at The Pinehills Plymouth, MA 192 6,876 30,401 1,375 6,876 31,776 38,652 12,327 26,325 26,843 — 2004
Eaves Peabody Peabody, MA 286 4,645 18,919 14,022 4,645 32,941 37,586 14,522 23,064 23,794 — 1962/2004
Avalon at Bedford Center (1) Bedford, MA 139 4,258 20,551 2,681 4,258 23,232 27,490 9,781 17,709 17,343 — 2006
Avalon at Lexington Hills (1) Lexington, MA 387 8,691 79,121 7,759 8,691 86,880 95,571 31,789 63,782 63,555 — 2008
Avalon Acton Acton, MA 380 13,124 48,695 4,416 13,124 53,111 66,235 19,390 46,845 47,864 45,000 2008
Avalon at the Hingham Shipyard Hingham, MA 235 12,218 41,656 3,887 12,218 45,543 57,761 15,678 42,083 42,404 — 2009
Avalon Sharon Sharon, MA 156 4,719 25,478 1,432 4,719 26,910 31,629 9,697 21,932 22,330 — 2008
Avalon Northborough Northborough, MA 382 8,144 52,184 2,590 8,144 54,774 62,918 16,932 45,986 47,120 — 2009
Avalon Cohasset Cohasset, MA 220 8,802 46,166 621 8,802 46,787 55,589 11,576 44,013 45,337 — 2012
Avalon Exeter (2) Boston, MA 187 16,313 110,028 291 16,313 110,319 126,632 17,615 109,017 112,883 — 2014
Avalon Natick Natick, MA 407 15,645 64,845 75 15,645 64,920 80,565 12,778 67,787 70,094 47,637 2013
Avalon at Assembly Row Somerville, MA 195 8,599 52,454 143 8,599 52,597 61,196 8,685 52,511 54,339 — 2015
AVA Somerville Somerville, MA 250 10,945 56,460 71 10,945 56,531 67,476 8,280 59,196 61,219 — 2015
Eaves Burlington Burlington, MA 203 7,714 32,499 6,879 7,714 39,378 47,092 8,096 38,996 40,187 — 1988/2012
AVA Theater District Boston, MA 398 17,072 163,633 131 17,072 163,764 180,836 19,204 161,632 167,191 — 2015
Avalon Burlington Burlington, MA 312 15,600 60,649 16,664 15,600 77,313 92,913 16,123 76,790 79,079 — 1989/2013
Avalon Marlborough Marlborough, MA 350 15,367 60,397 276 15,367 60,673 76,040 7,574 68,466 70,372 — 2015
Avalon Framingham Framingham, MA 180 9,315 34,631 13 9,315 34,644 43,959 3,993 39,966 41,216 — 2015
Avalon Bear Hill Waltham, MA 324 27,350 94,168 29,108 27,350 123,276 150,626 28,323 122,303 126,559 — 1999/2013
Avalon at Center Place (2) Providence, RI 225 — 26,816 15,562 — 42,378 42,378 26,239 16,139 15,745 — 1991/1997
Total Boston, MA 6,331 $ 227,694 $ 1,195,982 $ 139,908 $ 227,694 $ 1,335,890 $ 1,563,584 $ 364,670 $ 1,198,914 $ 1,231,885 $ 92,637
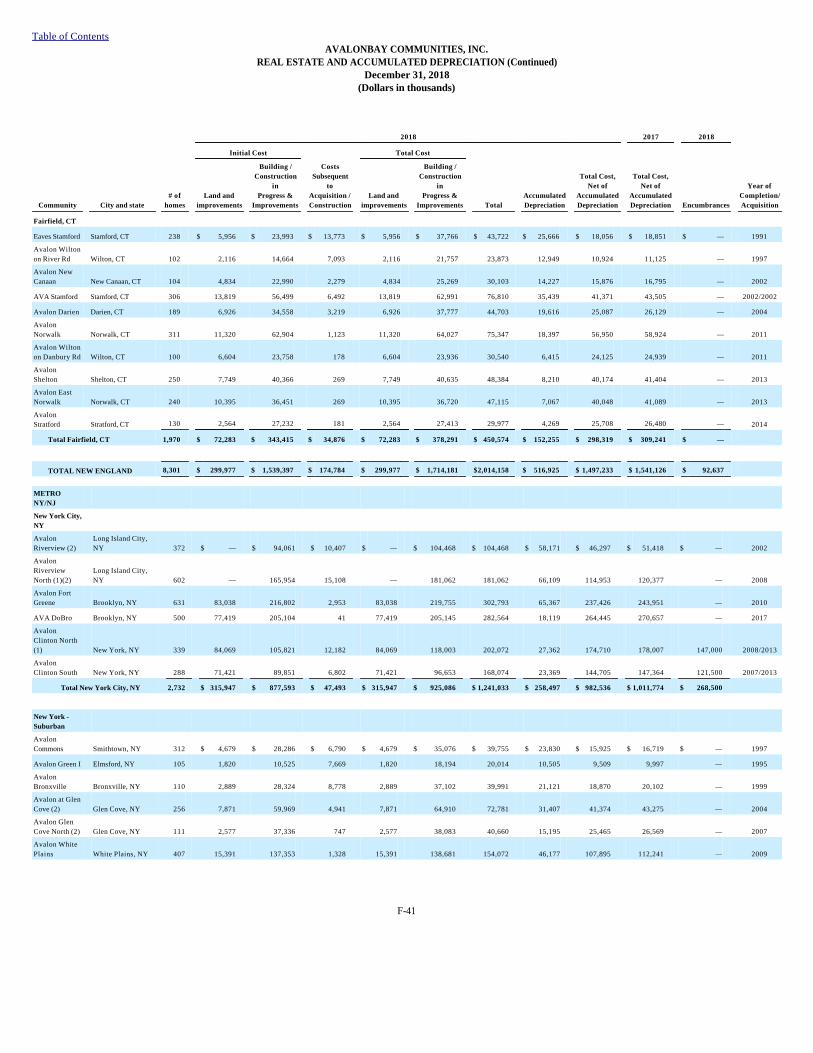
Table of Contents AVALONBAY COMMUNITIES, INC.
REAL ESTATE AND ACCUMULATED DEPRECIATION (Continued) December 31, 2018
(Dollars in thousands)
F-41
2018 2017 2018
Initial Cost Total Cost
Community City and state # of
homes Land and
improvements
Building / Construction
in Progress &
Improvements
Costs Subsequent
to Acquisition / Construction
Land and improvements
Building / Construction
in Progress &
Improvements Total Accumulated Depreciation
Total Cost, Net of
Accumulated Depreciation
Total Cost, Net of
Accumulated Depreciation Encumbrances
Year of Completion/ Acquisition
Fairfield, CT
Eaves Stamford Stamford, CT 238 $ 5,956 $ 23,993 $ 13,773 $ 5,956 $ 37,766 $ 43,722 $ 25,666 $ 18,056 $ 18,851 $ — 1991
Avalon Wilton on River Rd Wilton, CT 102 2,116 14,664 7,093 2,116 21,757 23,873 12,949 10,924 11,125 — 1997
Avalon New Canaan New Canaan, CT 104 4,834 22,990 2,279 4,834 25,269 30,103 14,227 15,876 16,795 — 2002
AVA Stamford Stamford, CT 306 13,819 56,499 6,492 13,819 62,991 76,810 35,439 41,371 43,505 — 2002/2002
Avalon Darien Darien, CT 189 6,926 34,558 3,219 6,926 37,777 44,703 19,616 25,087 26,129 — 2004
Avalon Norwalk Norwalk, CT 311 11,320 62,904 1,123 11,320 64,027 75,347 18,397 56,950 58,924 — 2011
Avalon Wilton on Danbury Rd Wilton, CT 100 6,604 23,758 178 6,604 23,936 30,540 6,415 24,125 24,939 — 2011
Avalon Shelton Shelton, CT 250 7,749 40,366 269 7,749 40,635 48,384 8,210 40,174 41,404 — 2013
Avalon East Norwalk Norwalk, CT 240 10,395 36,451 269 10,395 36,720 47,115 7,067 40,048 41,089 — 2013
Avalon Stratford Stratford, CT 130 2,564 27,232 181 2,564 27,413 29,977 4,269 25,708 26,480 — 2014
Total Fairfield, CT 1,970 $ 72,283 $ 343,415 $ 34,876 $ 72,283 $ 378,291 $ 450,574 $ 152,255 $ 298,319 $ 309,241 $ —
TOTAL NEW ENGLAND 8,301 $ 299,977 $ 1,539,397 $ 174,784 $ 299,977 $ 1,714,181 $ 2,014,158 $ 516,925 $ 1,497,233 $ 1,541,126 $ 92,637
METRO NY/NJ New York City, NY Avalon Riverview (2)
Long Island City, NY 372 $ — $ 94,061 $ 10,407 $ — $ 104,468 $ 104,468 $ 58,171 $ 46,297 $ 51,418 $ — 2002
Avalon Riverview North (1)(2)
Long Island City, NY 602 — 165,954 15,108 — 181,062 181,062 66,109 114,953 120,377 — 2008
Avalon Fort Greene Brooklyn, NY 631 83,038 216,802 2,953 83,038 219,755 302,793 65,367 237,426 243,951 — 2010
AVA DoBro Brooklyn, NY 500 77,419 205,104 41 77,419 205,145 282,564 18,119 264,445 270,657 — 2017
Avalon Clinton North (1) New York, NY 339 84,069 105,821 12,182 84,069 118,003 202,072 27,362 174,710 178,007 147,000 2008/2013
Avalon Clinton South New York, NY 288 71,421 89,851 6,802 71,421 96,653 168,074 23,369 144,705 147,364 121,500 2007/2013
Total New York City, NY 2,732 $ 315,947 $ 877,593 $ 47,493 $ 315,947 $ 925,086 $ 1,241,033 $ 258,497 $ 982,536 $ 1,011,774 $ 268,500
New York - Suburban Avalon Commons Smithtown, NY 312 $ 4,679 $ 28,286 $ 6,790 $ 4,679 $ 35,076 $ 39,755 $ 23,830 $ 15,925 $ 16,719 $ — 1997
Avalon Green I Elmsford, NY 105 1,820 10,525 7,669 1,820 18,194 20,014 10,505 9,509 9,997 — 1995
Avalon Bronxville Bronxville, NY 110 2,889 28,324 8,778 2,889 37,102 39,991 21,121 18,870 20,102 — 1999
Avalon at Glen Cove (2) Glen Cove, NY 256 7,871 59,969 4,941 7,871 64,910 72,781 31,407 41,374 43,275 — 2004
Avalon Glen Cove North (2) Glen Cove, NY 111 2,577 37,336 747 2,577 38,083 40,660 15,195 25,465 26,569 — 2007
Avalon White Plains White Plains, NY 407 15,391 137,353 1,328 15,391 138,681 154,072 46,177 107,895 112,241 — 2009

Table of Contents AVALONBAY COMMUNITIES, INC.
REAL ESTATE AND ACCUMULATED DEPRECIATION (Continued) December 31, 2018
(Dollars in thousands)
F-42
2018 2017 2018
Initial Cost Total Cost
Community City and state # of
homes Land and
improvements
Building / Construction
in Progress &
Improvements
Costs Subsequent
to Acquisition / Construction
Land and improvements
Building / Construction
in Progress &
Improvements Total Accumulated Depreciation
Total Cost, Net of
Accumulated Depreciation
Total Cost, Net of
Accumulated Depreciation Encumbrances
Year of Completion/ Acquisition
Avalon Rockville Centre I
Rockville Centre, NY 349 $ 32,212 $ 78,806 $ 2,804 $ 32,212 $ 81,610 $ 113,822 $ 21,224 $ 92,598 $ 94,747 $ — 2012
Avalon Green II Elmsford, NY 444 27,765 77,560 544 27,765 78,104 105,869 18,551 87,318 89,834 — 2012
Avalon Garden City Garden City, NY 204 18,205 49,326 640 18,205 49,966 68,171 11,302 56,869 58,511 — 2013
Avalon Ossining Ossining, NY 168 6,392 30,313 47 6,392 30,360 36,752 5,185 31,567 32,627 — 2014
Avalon Huntington Station
Huntington Station, NY 303 21,899 58,440 163 21,899 58,603 80,502 9,212 71,290 73,131 — 2014
Avalon Green III Elmsford, NY 68 4,985 17,300 7 4,985 17,307 22,292 1,860 20,432 21,037 — 2016
Avalon Westbury Westbury, NY 396 69,620 43,781 11,794 69,620 55,575 125,195 17,813 107,382 109,056 77,295 2006/2013
Total New York - Suburban 3,233 $ 216,305 $ 657,319 $ 46,252 $ 216,305 $ 703,571 $ 919,876 $ 233,382 $ 686,494 $ 707,846 $ 77,295
New Jersey
Avalon Cove Jersey City, NJ 504 $ 8,760 $ 82,422 $ 24,942 $ 8,760 $ 107,364 $ 116,124 $ 68,718 $ 47,406 $ 49,264 $ — 1997
Eaves Lawrenceville Lawrenceville, NJ 632 14,650 60,486 12,367 14,650 72,853 87,503 35,005 52,498 54,936 — 1994
Avalon Princeton Junction West Windsor, NJ 512 5,585 22,382 22,325 5,585 44,707 50,292 27,542 22,750 23,632 — 1988/1993
Avalon Tinton Falls Tinton Falls, NJ 216 7,939 33,170 621 7,939 33,791 41,730 12,389 29,341 30,404 — 2008
Avalon West Long Branch
West Long Branch, NJ 180 2,721 22,925 346 2,721 23,271 25,992 6,832 19,160 19,728 — 2011
Avalon North Bergen North Bergen, NJ 164 8,984 30,994 1,021 8,984 32,015 40,999 7,721 33,278 34,432 — 2012
Avalon at Wesmont Station I Wood-Ridge, NJ 266 14,682 41,635 1,474 14,682 43,109 57,791 10,010 47,781 49,053 — 2012
Avalon Hackensack at Riverside (2) Hackensack, NJ 226 — 44,619 168 — 44,787 44,787 8,781 36,006 37,607 — 2013
Avalon Somerset Somerset, NJ 384 18,241 58,338 282 18,241 58,620 76,861 11,998 64,863 66,988 — 2013
Avalon Bloomfield Station Bloomfield, NJ 224 10,701 39,936 10 10,701 39,946 50,647 4,969 45,678 47,034 — 2015
Avalon at Wesmont Station II Wood-Ridge, NJ 140 6,502 16,863 13 6,502 16,876 23,378 3,499 19,879 20,502 — 2013
Avalon Bloomingdale Bloomingdale, NJ 174 3,006 27,801 72 3,006 27,873 30,879 5,143 25,736 26,759 — 2014
Avalon Wharton Wharton, NJ 247 2,273 48,609 92 2,273 48,701 50,974 6,920 44,054 45,813 — 2015
Avalon Roseland Roseland, NJ 136 11,288 34,868 27 11,288 34,895 46,183 4,507 41,676 42,956 — 2015
Avalon Union Union, NJ 202 11,695 36,317 — 11,695 36,317 48,012 3,718 44,294 45,458 — 2016
Avalon Hoboken Hoboken, NJ 217 37,237 90,475 5,360 37,237 95,835 133,072 14,867 118,205 121,394 67,904 2008/2016
Total New Jersey 4,424 $ 164,264 $ 691,840 $ 69,120 $ 164,264 $ 760,960 $ 925,224 $ 232,619 $ 692,605 $ 715,960 $ 67,904
TOTAL METRO NY/NJ 10,389 $ 696,516 $ 2,226,752 $ 162,865 $ 696,516 $ 2,389,617 $3,086,133 $ 724,498 $ 2,361,635 $ 2,435,580 $ 413,699
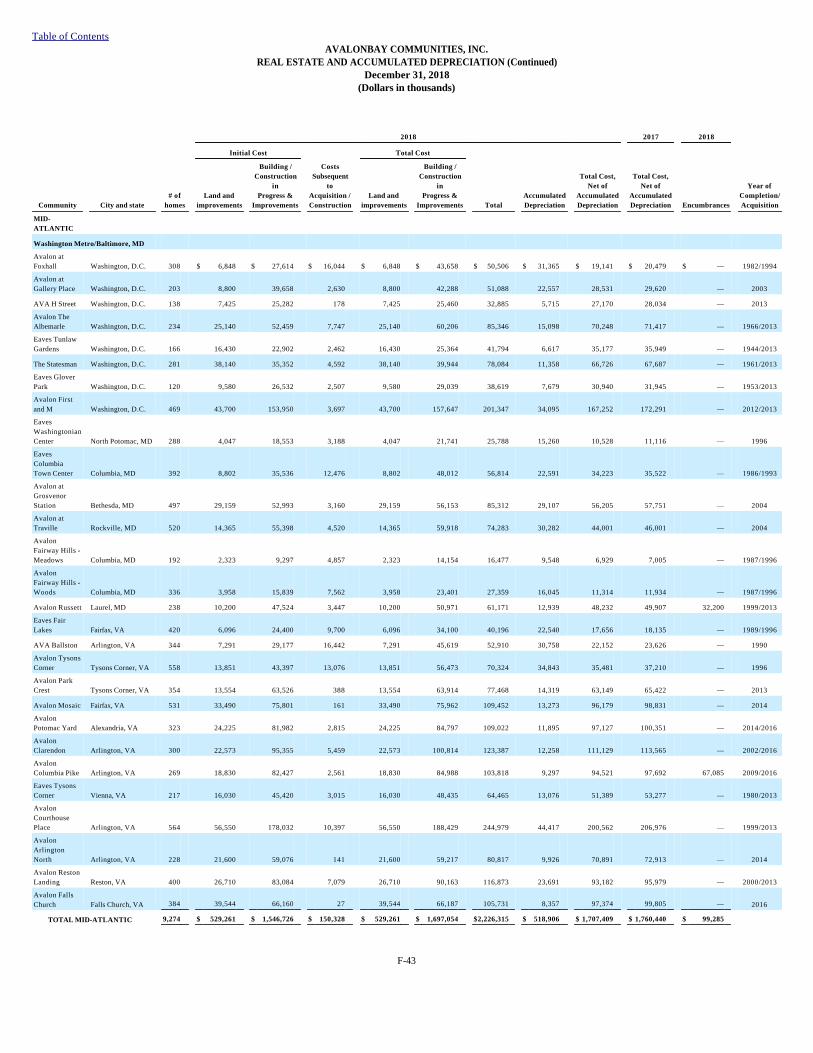
Table of Contents AVALONBAY COMMUNITIES, INC.
REAL ESTATE AND ACCUMULATED DEPRECIATION (Continued) December 31, 2018
(Dollars in thousands)
F-43
2018 2017 2018
Initial Cost Total Cost
Community City and state # of
homes Land and
improvements
Building / Construction
in Progress &
Improvements
Costs Subsequent
to Acquisition / Construction
Land and improvements
Building / Construction
in Progress &
Improvements Total Accumulated Depreciation
Total Cost, Net of
Accumulated Depreciation
Total Cost, Net of
Accumulated Depreciation Encumbrances
Year of Completion/ Acquisition
MID-ATLANTIC
Washington Metro/Baltimore, MD Avalon at Foxhall Washington, D.C. 308 $ 6,848 $ 27,614 $ 16,044 $ 6,848 $ 43,658 $ 50,506 $ 31,365 $ 19,141 $ 20,479 $ — 1982/1994
Avalon at Gallery Place Washington, D.C. 203 8,800 39,658 2,630 8,800 42,288 51,088 22,557 28,531 29,620 — 2003
AVA H Street Washington, D.C. 138 7,425 25,282 178 7,425 25,460 32,885 5,715 27,170 28,034 — 2013
Avalon The Albemarle Washington, D.C. 234 25,140 52,459 7,747 25,140 60,206 85,346 15,098 70,248 71,417 — 1966/2013
Eaves Tunlaw Gardens Washington, D.C. 166 16,430 22,902 2,462 16,430 25,364 41,794 6,617 35,177 35,949 — 1944/2013
The Statesman Washington, D.C. 281 38,140 35,352 4,592 38,140 39,944 78,084 11,358 66,726 67,687 — 1961/2013
Eaves Glover Park Washington, D.C. 120 9,580 26,532 2,507 9,580 29,039 38,619 7,679 30,940 31,945 — 1953/2013
Avalon First and M Washington, D.C. 469 43,700 153,950 3,697 43,700 157,647 201,347 34,095 167,252 172,291 — 2012/2013
Eaves Washingtonian Center North Potomac, MD 288 4,047 18,553 3,188 4,047 21,741 25,788 15,260 10,528 11,116 — 1996
Eaves Columbia Town Center Columbia, MD 392 8,802 35,536 12,476 8,802 48,012 56,814 22,591 34,223 35,522 — 1986/1993
Avalon at Grosvenor Station Bethesda, MD 497 29,159 52,993 3,160 29,159 56,153 85,312 29,107 56,205 57,751 — 2004
Avalon at Traville Rockville, MD 520 14,365 55,398 4,520 14,365 59,918 74,283 30,282 44,001 46,001 — 2004
Avalon Fairway Hills - Meadows Columbia, MD 192 2,323 9,297 4,857 2,323 14,154 16,477 9,548 6,929 7,005 — 1987/1996
Avalon Fairway Hills - Woods Columbia, MD 336 3,958 15,839 7,562 3,958 23,401 27,359 16,045 11,314 11,934 — 1987/1996
Avalon Russett Laurel, MD 238 10,200 47,524 3,447 10,200 50,971 61,171 12,939 48,232 49,907 32,200 1999/2013
Eaves Fair Lakes Fairfax, VA 420 6,096 24,400 9,700 6,096 34,100 40,196 22,540 17,656 18,135 — 1989/1996
AVA Ballston Arlington, VA 344 7,291 29,177 16,442 7,291 45,619 52,910 30,758 22,152 23,626 — 1990
Avalon Tysons Corner Tysons Corner, VA 558 13,851 43,397 13,076 13,851 56,473 70,324 34,843 35,481 37,210 — 1996
Avalon Park Crest Tysons Corner, VA 354 13,554 63,526 388 13,554 63,914 77,468 14,319 63,149 65,422 — 2013
Avalon Mosaic Fairfax, VA 531 33,490 75,801 161 33,490 75,962 109,452 13,273 96,179 98,831 — 2014
Avalon Potomac Yard Alexandria, VA 323 24,225 81,982 2,815 24,225 84,797 109,022 11,895 97,127 100,351 — 2014/2016
Avalon Clarendon Arlington, VA 300 22,573 95,355 5,459 22,573 100,814 123,387 12,258 111,129 113,565 — 2002/2016
Avalon Columbia Pike Arlington, VA 269 18,830 82,427 2,561 18,830 84,988 103,818 9,297 94,521 97,692 67,085 2009/2016
Eaves Tysons Corner Vienna, VA 217 16,030 45,420 3,015 16,030 48,435 64,465 13,076 51,389 53,277 — 1980/2013
Avalon Courthouse Place Arlington, VA 564 56,550 178,032 10,397 56,550 188,429 244,979 44,417 200,562 206,976 — 1999/2013
Avalon Arlington North Arlington, VA 228 21,600 59,076 141 21,600 59,217 80,817 9,926 70,891 72,913 — 2014
Avalon Reston Landing Reston, VA 400 26,710 83,084 7,079 26,710 90,163 116,873 23,691 93,182 95,979 — 2000/2013
Avalon Falls Church Falls Church, VA 384 39,544 66,160 27 39,544 66,187 105,731 8,357 97,374 99,805 — 2016
TOTAL MID-ATLANTIC 9,274 $ 529,261 $ 1,546,726 $ 150,328 $ 529,261 $ 1,697,054 $ 2,226,315 $ 518,906 $ 1,707,409 $ 1,760,440 $ 99,285

Table of Contents AVALONBAY COMMUNITIES, INC.
REAL ESTATE AND ACCUMULATED DEPRECIATION (Continued) December 31, 2018
(Dollars in thousands)
F-44
2018 2017 2018
Initial Cost Total Cost
Community City and state # of
homes Land and
improvements
Building / Construction
in Progress &
Improvements
Costs Subsequent
to Acquisition / Construction
Land and improvements
Building / Construction
in Progress &
Improvements Total Accumulated Depreciation
Total Cost, Net of
Accumulated Depreciation
Total Cost, Net of
Accumulated Depreciation Encumbrances
Year of Completion/ Acquisition
PACIFIC NORTHWEST
Seattle, WA Avalon Redmond Place Redmond, WA 222 $ 4,558 $ 18,368 $ 10,603 $ 4,558 $ 28,971 $ 33,529 $ 18,625 $ 14,904 $ 15,860 $ — 1991/1997
Avalon at Bear Creek Redmond, WA 264 6,786 27,641 5,194 6,786 32,835 39,621 22,464 17,157 18,123 — 1998/1998
Avalon Bellevue Bellevue, WA 201 6,664 24,119 2,268 6,664 26,387 33,051 16,340 16,711 17,601 — 2001
Avalon RockMeadow Bothell, WA 206 4,777 19,765 3,246 4,777 23,011 27,788 14,446 13,342 14,049 — 2000/2000
Avalon ParcSquare Redmond, WA 124 3,789 15,139 3,479 3,789 18,618 22,407 11,441 10,966 11,496 — 2000/2000
AVA Belltown Seattle, WA 100 5,644 12,733 1,276 5,644 14,009 19,653 8,502 11,151 11,690 — 2001
Avalon Meydenbauer Bellevue, WA 368 12,697 77,450 1,751 12,697 79,201 91,898 29,264 62,634 65,026 — 2008
Avalon Towers Bellevue (2) Bellevue, WA 397 — 123,029 1,545 — 124,574 124,574 36,511 88,063 92,031 — 2011
AVA Queen Anne Seattle, WA 203 12,081 41,618 459 12,081 42,077 54,158 10,633 43,525 45,070 — 2012
AVA Ballard Seattle, WA 265 16,460 46,926 1,040 16,460 47,966 64,426 10,195 54,231 56,053 — 2013
Avalon Alderwood I Lynnwood, WA 367 12,294 55,627 14 12,294 55,641 67,935 8,595 59,340 61,367 — 2015
AVA Capitol Hill Seattle, WA 249 20,613 60,005 685 20,613 60,690 81,303 6,513 74,790 76,433 — 2016
Avalon Alderwood II Redmond, WA 124 5,072 21,363 13 5,072 21,376 26,448 1,859 24,589 25,337 — 2016
Archstone Redmond Lakeview Redmond, WA 166 10,250 26,842 3,769 10,250 30,611 40,861 8,333 32,528 33,555 — 1987/2013
TOTAL PACIFIC NORTHWEST 3,256 $ 121,685 $ 570,625 $ 35,342 $ 121,685 $ 605,967 $ 727,652 $ 203,721 $ 523,931 $ 543,691 $ —
NORTHERN CALIFORNIA
San Jose, CA Avalon Campbell Campbell, CA 348 $ 11,830 $ 47,828 $ 13,895 $ 11,830 $ 61,723 $ 73,553 $ 37,549 $ 36,004 $ 37,851 $ 38,800 1995
Eaves San Jose San Jose, CA 440 12,920 53,047 19,019 12,920 72,066 84,986 38,598 46,388 48,753 — 1985/1996
Avalon Silicon Valley (1) Sunnyvale, CA 710 20,713 99,573 35,004 20,713 134,577 155,290 76,386 78,904 83,672 — 1998
Avalon Mountain View Mountain View, CA 248 9,755 39,393 10,543 9,755 49,936 59,691 32,132 27,559 29,011 — 1986
Eaves Creekside Mountain View, CA 296 6,546 26,263 21,325 6,546 47,588 54,134 27,454 26,680 28,327 — 1962/1997
Avalon at Cahill Park San Jose, CA 218 4,765 47,600 2,335 4,765 49,935 54,700 27,889 26,811 28,301 — 2002
Avalon Morrison Park San Jose, CA 250 13,837 64,534 152 13,837 64,686 78,523 11,143 67,380 69,664 — 2014
Avalon Willow Glen San Jose, CA 412 46,060 81,957 5,002 46,060 86,959 133,019 23,357 109,662 112,837 — 2002/2013
Eaves West Valley San Jose, CA 873 90,890 132,040 11,344 90,890 143,384 234,274 36,797 197,477 202,028 — 1970/2013
Eaves Mountain View at Middlefield Mountain View, CA 402 64,070 69,018 5,922 64,070 74,940 139,010 20,711 118,299 120,748 — 1969/2013
Total San Jose, CA 4,197 $ 281,386 $ 661,253 $ 124,541 $ 281,386 $ 785,794 $ 1,067,180 $ 332,016 $ 735,164 $ 761,192 $ 38,800

Table of Contents AVALONBAY COMMUNITIES, INC.
REAL ESTATE AND ACCUMULATED DEPRECIATION (Continued) December 31, 2018
(Dollars in thousands)
F-45
2018 2017 2018
Initial Cost Total Cost
Community City and state # of
homes Land and
improvements
Building / Construction
in Progress &
Improvements
Costs Subsequent
to Acquisition / Construction
Land and improvements
Building / Construction
in Progress &
Improvements Total Accumulated Depreciation
Total Cost, Net of
Accumulated Depreciation
Total Cost, Net of
Accumulated Depreciation Encumbrances
Year of Completion/ Acquisition
Oakland - East Bay, CA Avalon Fremont Fremont, CA 308 $ 10,746 $ 43,399 $ 7,458 $ 10,746 $ 50,857 $ 61,603 $ 35,349 $ 26,254 $ 27,278 $ — 1992/1994
Eaves Dublin Dublin, CA 204 5,276 19,642 12,373 5,276 32,015 37,291 18,960 18,331 19,470 — 1989/1997
Eaves Pleasanton Pleasanton, CA 456 11,610 46,552 22,038 11,610 68,590 80,200 42,327 37,873 39,771 — 1988/1994
Eaves Union City Union City, CA 208 4,249 16,820 3,603 4,249 20,423 24,672 14,433 10,239 10,722 — 1973/1996
Avalon Union City Union City, CA 439 14,732 104,024 1,866 14,732 105,890 120,622 34,257 86,365 89,091 — 2009
Avalon Walnut Creek (2) Walnut Creek, CA 422 — 148,468 4,255 — 152,723 152,723 44,298 108,425 112,601 3,699 2010
Avalon Dublin Station Dublin, CA 253 7,772 72,142 450 7,772 72,592 80,364 12,253 68,111 70,863 — 2014
Avalon Dublin Station II Dublin, CA 252 7,762 76,587 (206) 7,762 76,381 84,143 7,497 76,646 79,551 — 2016
Eaves Walnut Creek (1) Walnut Creek, CA 510 30,320 82,375 17,008 30,320 99,383 129,703 23,049 106,654 110,229 — 1987/2013
Avalon Walnut Ridge I Walnut Creek, CA 106 9,860 19,850 5,307 9,860 25,157 35,017 5,781 29,236 30,176 — 2000/2013
Avalon Berkeley Berkeley, CA 94 4,500 28,615 51 4,500 28,666 33,166 4,543 28,623 29,599 — 2014
Total Oakland - East Bay, CA 3,252 $ 106,827 $ 658,474 $ 74,203 $ 106,827 $ 732,677 $ 839,504 $ 242,747 $ 596,757 $ 619,351 $ 3,699
San Francisco, CA Eaves Daly City Daly City, CA 195 $ 4,230 $ 9,659 $ 20,613 $ 4,230 $ 30,272 $ 34,502 $ 18,784 $ 15,718 $ 16,043 $ — 1972/1997
AVA Nob Hill San Francisco, CA 185 5,403 21,567 7,904 5,403 29,471 34,874 18,180 16,694 17,464 20,800 1990/1995
Eaves San Rafael San Rafael, CA 254 5,982 16,885 25,261 5,982 42,146 48,128 23,656 24,472 25,395 — 1973/1996
Eaves Foster City Foster City, CA 288 7,852 31,445 12,532 7,852 43,977 51,829 27,209 24,620 25,304 — 1973/1994
Eaves Pacifica Pacifica, CA 220 6,125 24,796 3,721 6,125 28,517 34,642 19,697 14,945 15,390 17,600 1971/1995
Avalon Sunset Towers San Francisco, CA 243 3,561 21,321 16,264 3,561 37,585 41,146 21,165 19,981 21,194 — 1961/1996
Eaves Diamond Heights San Francisco, CA 154 4,726 19,130 6,445 4,726 25,575 30,301 16,244 14,057 14,655 — 1972/1994
Avalon at Mission Bay I San Francisco, CA 250 14,029 78,452 6,484 14,029 84,936 98,965 44,762 54,203 54,325 — 2003
Avalon at Mission Bay III San Francisco, CA 260 28,687 119,156 603 28,687 119,759 148,446 38,977 109,469 113,287 — 2009
Avalon Ocean Avenue San Francisco, CA 173 5,544 50,906 1,972 5,544 52,878 58,422 12,527 45,895 47,746 — 2012
AVA 55 Ninth San Francisco, CA 273 20,267 97,321 1,285 20,267 98,606 118,873 16,867 102,006 105,711 — 2014
Avalon Hayes Valley San Francisco, CA 182 12,595 81,228 — 12,595 81,228 93,823 10,793 83,030 85,972 — 2015
Avalon San Bruno I San Bruno, CA 300 40,780 68,684 5,946 40,780 74,630 115,410 18,038 97,372 99,104 64,450 2004/2013
Avalon San Bruno II San Bruno, CA 185 23,787 44,934 1,972 23,787 46,906 70,693 10,782 59,911 61,422 28,999 2007/2013
Avalon San Bruno III San Bruno, CA 187 33,303 62,910 3,117 33,303 66,027 99,330 15,217 84,113 86,285 52,090 2010/2013
Total San Francisco, CA 3,349 $ 216,871 $ 748,394 $ 114,119 $ 216,871 $ 862,513 $1,079,384 $ 312,898 $ 766,486 $ 789,297 $ 183,939
TOTAL NORTHERN CALIFORNIA 10,798 $ 605,084 $ 2,068,121 $ 312,863 $ 605,084 $ 2,380,984 $2,986,068 $ 887,661 $ 2,098,407 $ 2,169,840 $ 226,438

Table of Contents AVALONBAY COMMUNITIES, INC.
REAL ESTATE AND ACCUMULATED DEPRECIATION (Continued) December 31, 2018
(Dollars in thousands)
F-46
2018 2017 2018
Initial Cost Total Cost
Community City and state # of
homes Land and
improvements
Building / Construction
in Progress &
Improvements
Costs Subsequent
to Acquisition / Construction
Land and improvements
Building / Construction
in Progress &
Improvements Total Accumulated Depreciation
Total Cost, Net of
Accumulated Depreciation
Total Cost, Net of
Accumulated Depreciation Encumbrances
Year of Completion/ Acquisition
SOUTHERN CALIFORNIA Los Angeles, CA
AVA Burbank Burbank, CA 748 $ 22,483 $ 28,104 $ 49,269 $ 22,483 $ 77,373 $ 99,856 $ 43,470 $ 56,386 $ 58,391 $ — 1961/1997
Avalon Woodland Hills
Woodland Hills, CA 663 23,828 40,372 49,923 23,828 90,295 114,123 48,604 65,519 68,144 — 1989/1997
Eaves Warner Center
Woodland Hills, CA 227 7,045 12,986 10,275 7,045 23,261 30,306 16,667 13,639 13,785 — 1979/1998
Avalon Glendale (2) Glendale, CA 223 — 42,564 2,244 — 44,808 44,808 23,395 21,413 22,931 — 2003
Avalon Burbank Burbank, CA 400 14,053 56,827 25,101 14,053 81,928 95,981 40,332 55,649 58,046 — 1988/2002
Avalon Camarillo Camarillo, CA 249 8,446 40,290 1,232 8,446 41,522 49,968 17,877 32,091 33,255 — 2006
Avalon Wilshire Los Angeles, CA 123 5,459 41,182 1,467 5,459 42,649 48,108 17,219 30,889 32,285 — 2007
Avalon Encino Encino, CA 131 12,789 49,073 1,309 12,789 50,382 63,171 17,728 45,443 46,987 — 2008
Avalon Warner Place Canoga Park, CA 210 7,920 44,845 892 7,920 45,737 53,657 16,667 36,990 38,245 — 2008
AVA Little Tokyo Los Angeles, CA 280 14,734 94,076 1,594 14,734 95,670 110,404 14,164 96,240 98,607 — 2015
Eaves Phillips Ranch Pomona, CA 501 9,796 41,740 2,950 9,796 44,690 54,486 12,077 42,409 43,186 — 1989/2011
Eaves San Dimas San Dimas, CA 102 1,916 7,819 1,458 1,916 9,277 11,193 2,621 8,572 8,922 — 1978/2011
Eaves San Dimas Canyon San Dimas, CA 156 2,953 12,428 812 2,953 13,240 16,193 3,683 12,510 12,972 — 1981/2011
AVA Pasadena Pasadena, CA 84 8,400 11,547 5,552 8,400 17,099 25,499 3,849 21,650 22,255 — 1973/2012
Eaves Cerritos Artesia, CA 151 8,305 21,195 1,526 8,305 22,721 31,026 5,203 25,823 26,583 — 1973/2012
Avalon Playa Vista (1) Los Angeles, CA 309 30,900 72,008 3,102 30,900 75,110 106,010 17,059 88,951 91,108 — 2006/2012
Avalon San Dimas San Dimas, CA 156 9,141 30,727 — 9,141 30,727 39,868 4,894 34,974 36,090 — 2014
Avalon Glendora Glendora, CA 280 18,311 64,759 242 18,311 65,001 83,312 7,380 75,932 78,196 — 2016
Avalon Mission Oaks Camarillo, CA 160 9,600 37,602 1,296 9,600 38,898 48,498 7,097 41,401 42,849 — 2014
Avalon Simi Valley Simi Valley, CA 500 42,020 73,361 5,228 42,020 78,589 120,609 20,230 100,379 102,927 — 2007/2013
Avalon Calabasas (1) Calabasas, CA 600 42,720 107,642 11,255 42,720 118,897 161,617 33,023 128,594 132,313 — 1988/2013
Avalon Oak Creek Agoura Hills, CA 336 43,540 79,974 6,295 43,540 86,269 129,809 25,105 104,704 108,080 — 2004/2013
Avalon Santa Monica on Main Santa Monica, CA 133 32,000 60,770 13,278 32,000 74,048 106,048 16,408 89,640 92,185 — 2007/2013
Avalon Del Mar Station Pasadena, CA 347 20,560 106,556 4,105 20,560 110,661 131,221 24,486 106,735 110,130 — 2006/2013
Eaves Thousand Oaks Thousand Oaks, CA 154 13,950 20,211 2,772 13,950 22,983 36,933 7,194 29,739 30,549 — 1992/2013
Eaves Woodland Hills
Woodland Hills, CA 883 68,940 90,549 11,831 68,940 102,380 171,320 29,786 141,534 145,339 111,500 1971/2013
Avalon Thousand Oaks Plaza Thousand Oaks, CA 148 12,810 22,581 2,524 12,810 25,105 37,915 7,184 30,731 31,559 — 2002/2013
Avalon Pasadena Pasadena, CA 120 10,240 31,558 6,698 10,240 38,256 48,496 8,646 39,850 41,204 — 2004/2013
Total Los Angeles, CA 8,374 $ 502,859 $ 1,343,346 $ 224,230 $ 502,859 $ 1,567,576 $ 2,070,435 $ 492,048 $ 1,578,387 $ 1,627,123 $ 111,500

Table of Contents AVALONBAY COMMUNITIES, INC.
REAL ESTATE AND ACCUMULATED DEPRECIATION (Continued) December 31, 2018
(Dollars in thousands)
F-47
2018 2017 2018
Initial Cost Total Cost
Community City and state # of
homes Land and
improvements
Building / Construction
in Progress &
Improvements
Costs Subsequent to Acquisition / Construction
Land and improvements
Building / Construction
in Progress &
Improvements Total Accumulated Depreciation
Total Cost, Net of
Accumulated Depreciation
Total Cost, Net of
Accumulated Depreciation Encumbrances
Year of Completion/ Acquisition
Orange County, CA
AVA Newport Costa Mesa, CA 145 $ 1,975 $ 3,814 $ 9,904 $ 1,975 $ 13,718 $ 15,693 $ 7,499 $ 8,194 $ 8,634 $ — 1956/1996
Eaves Mission Viejo Mission Viejo, CA 166 2,517 9,257 3,654 2,517 12,911 15,428 9,178 6,250 6,694 7,635 1984/1996
Eaves South Coast Costa Mesa, CA 258 4,709 16,063 13,646 4,709 29,709 34,418 17,892 16,526 17,331 — 1973/1996
Eaves Santa Margarita
Rancho Santa Margarita, CA 301 4,607 16,911 11,237 4,607 28,148 32,755 16,900 15,855 16,586 — 1990/1997
Eaves Huntington Beach (1)
Huntington Beach, CA 304 4,871 19,745 11,058 4,871 30,803 35,674 21,048 14,626 14,971 — 1971/1997
Avalon Irvine I Irvine, CA 279 9,911 67,520 1,522 9,911 69,042 78,953 21,983 56,970 58,578 — 2010
Avalon Irvine II Irvine, CA 179 4,358 40,905 59 4,358 40,964 45,322 8,711 36,611 38,053 — 2013
Eaves Lake Forest Lake Forest, CA 225 5,199 21,134 3,571 5,199 24,705 29,904 6,502 23,402 23,967 — 1975/2011
Avalon Baker Ranch Lake Forest, CA 430 31,689 98,410 27 31,689 98,437 130,126 13,019 117,107 120,694 — 2015
Avalon Irvine III Irvine, CA 156 11,607 43,973 20 11,607 43,993 55,600 4,445 51,155 52,742 — 2016
Total Orange County, CA 2,443 $ 81,443 $ 337,732 $ 54,698 $ 81,443 $ 392,430 $ 473,873 $ 127,177 $ 346,696 $ 358,250 $ 7,635
San Diego, CA AVA Pacific Beach San Diego, CA 564 $ 9,922 $ 40,580 $ 40,991 $ 9,922 $ 81,571 $ 91,493 $ 44,039 $ 47,454 $ 50,243 $ — 1969/1997
Eaves Mission Ridge San Diego, CA 200 2,710 10,924 12,460 2,710 23,384 26,094 15,529 10,565 11,125 — 1960/1997
AVA Cortez Hill (2) San Diego, CA 299 2,768 20,134 23,989 2,768 44,123 46,891 25,017 21,874 23,010 — 1973/1998
Eaves San Marcos San Marcos, CA 184 3,277 13,385 4,548 3,277 17,933 21,210 4,298 16,912 17,578 — 1988/2011
Eaves Rancho Penasquitos San Diego, CA 250 6,692 27,143 4,420 6,692 31,563 38,255 8,230 30,025 30,117 — 1986/2011
Avalon Vista Vista, CA 221 12,689 43,328 94 12,689 43,422 56,111 5,762 50,349 51,891 — 2015
Eaves La Mesa (1) La Mesa, CA 168 9,490 28,482 2,778 9,490 31,260 40,750 8,602 32,148 32,745 — 1989/2013
Avalon La Jolla Colony San Diego, CA 180 16,760 27,694 12,050 16,760 39,744 56,504 9,645 46,859 48,538 — 1987/2013
Total San Diego, CA 2,066 $ 64,308 $ 211,670 $ 101,330 $ 64,308 $ 313,000 $ 377,308 $ 121,122 $ 256,186 $ 265,247 $ —
TOTAL SOUTHERN CALIFORNIA 12,883 $ 648,610 $ 1,892,748 $ 380,258 $ 648,610 $ 2,273,006 $ 2,921,616 $ 740,347 $ 2,181,269 $ 2,250,620 $ 119,135
TOTAL ESTABLISHED COMMUNITIES 54,901 $ 2,901,133 $ 9,844,369 $ 1,216,440 $ 2,901,133 $ 11,060,809 $ 13,961,942 $ 3,592,058 $ 10,369,884 $ 10,701,297 $ 951,194
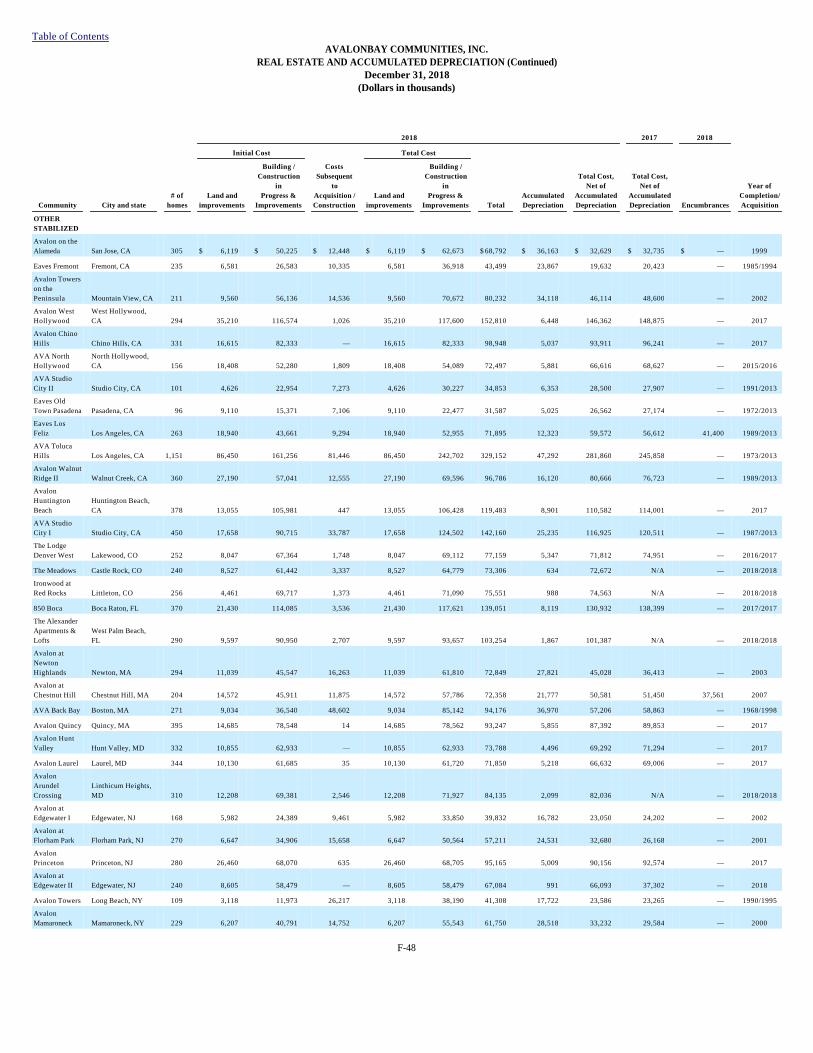
Table of Contents AVALONBAY COMMUNITIES, INC.
REAL ESTATE AND ACCUMULATED DEPRECIATION (Continued) December 31, 2018
(Dollars in thousands)
F-48
2018 2017 2018
Initial Cost Total Cost
Community City and state # of
homes Land and
improvements
Building / Construction
in Progress &
Improvements
Costs Subsequent
to Acquisition / Construction
Land and improvements
Building / Construction
in Progress &
Improvements Total Accumulated Depreciation
Total Cost, Net of
Accumulated Depreciation
Total Cost, Net of
Accumulated Depreciation Encumbrances
Year of Completion/ Acquisition
OTHER STABILIZED Avalon on the Alameda San Jose, CA 305 $ 6,119 $ 50,225 $ 12,448 $ 6,119 $ 62,673 $ 68,792 $ 36,163 $ 32,629 $ 32,735 $ — 1999
Eaves Fremont Fremont, CA 235 6,581 26,583 10,335 6,581 36,918 43,499 23,867 19,632 20,423 — 1985/1994
Avalon Towers on the Peninsula Mountain View, CA 211 9,560 56,136 14,536 9,560 70,672 80,232 34,118 46,114 48,600 — 2002
Avalon West Hollywood
West Hollywood, CA 294 35,210 116,574 1,026 35,210 117,600 152,810 6,448 146,362 148,875 — 2017
Avalon Chino Hills Chino Hills, CA 331 16,615 82,333 — 16,615 82,333 98,948 5,037 93,911 96,241 — 2017
AVA North Hollywood
North Hollywood, CA 156 18,408 52,280 1,809 18,408 54,089 72,497 5,881 66,616 68,627 — 2015/2016
AVA Studio City II Studio City, CA 101 4,626 22,954 7,273 4,626 30,227 34,853 6,353 28,500 27,907 — 1991/2013
Eaves Old Town Pasadena Pasadena, CA 96 9,110 15,371 7,106 9,110 22,477 31,587 5,025 26,562 27,174 — 1972/2013
Eaves Los Feliz Los Angeles, CA 263 18,940 43,661 9,294 18,940 52,955 71,895 12,323 59,572 56,612 41,400 1989/2013
AVA Toluca Hills Los Angeles, CA 1,151 86,450 161,256 81,446 86,450 242,702 329,152 47,292 281,860 245,858 — 1973/2013
Avalon Walnut Ridge II Walnut Creek, CA 360 27,190 57,041 12,555 27,190 69,596 96,786 16,120 80,666 76,723 — 1989/2013
Avalon Huntington Beach
Huntington Beach, CA 378 13,055 105,981 447 13,055 106,428 119,483 8,901 110,582 114,001 — 2017
AVA Studio City I Studio City, CA 450 17,658 90,715 33,787 17,658 124,502 142,160 25,235 116,925 120,511 — 1987/2013
The Lodge Denver West Lakewood, CO 252 8,047 67,364 1,748 8,047 69,112 77,159 5,347 71,812 74,951 — 2016/2017
The Meadows Castle Rock, CO 240 8,527 61,442 3,337 8,527 64,779 73,306 634 72,672 N/A — 2018/2018
Ironwood at Red Rocks Littleton, CO 256 4,461 69,717 1,373 4,461 71,090 75,551 988 74,563 N/A — 2018/2018
850 Boca Boca Raton, FL 370 21,430 114,085 3,536 21,430 117,621 139,051 8,119 130,932 138,399 — 2017/2017
The Alexander Apartments & Lofts
West Palm Beach, FL 290 9,597 90,950 2,707 9,597 93,657 103,254 1,867 101,387 N/A — 2018/2018
Avalon at Newton Highlands Newton, MA 294 11,039 45,547 16,263 11,039 61,810 72,849 27,821 45,028 36,413 — 2003
Avalon at Chestnut Hill Chestnut Hill, MA 204 14,572 45,911 11,875 14,572 57,786 72,358 21,777 50,581 51,450 37,561 2007
AVA Back Bay Boston, MA 271 9,034 36,540 48,602 9,034 85,142 94,176 36,970 57,206 58,863 — 1968/1998
Avalon Quincy Quincy, MA 395 14,685 78,548 14 14,685 78,562 93,247 5,855 87,392 89,853 — 2017
Avalon Hunt Valley Hunt Valley, MD 332 10,855 62,933 — 10,855 62,933 73,788 4,496 69,292 71,294 — 2017
Avalon Laurel Laurel, MD 344 10,130 61,685 35 10,130 61,720 71,850 5,218 66,632 69,006 — 2017
Avalon Arundel Crossing
Linthicum Heights, MD 310 12,208 69,381 2,546 12,208 71,927 84,135 2,099 82,036 N/A — 2018/2018
Avalon at Edgewater I Edgewater, NJ 168 5,982 24,389 9,461 5,982 33,850 39,832 16,782 23,050 24,202 — 2002
Avalon at Florham Park Florham Park, NJ 270 6,647 34,906 15,658 6,647 50,564 57,211 24,531 32,680 26,168 — 2001
Avalon Princeton Princeton, NJ 280 26,460 68,070 635 26,460 68,705 95,165 5,009 90,156 92,574 — 2017
Avalon at Edgewater II Edgewater, NJ 240 8,605 58,479 — 8,605 58,479 67,084 991 66,093 37,302 — 2018
Avalon Towers Long Beach, NY 109 3,118 11,973 26,217 3,118 38,190 41,308 17,722 23,586 23,265 — 1990/1995
Avalon Mamaroneck Mamaroneck, NY 229 6,207 40,791 14,752 6,207 55,543 61,750 28,518 33,232 29,584 — 2000
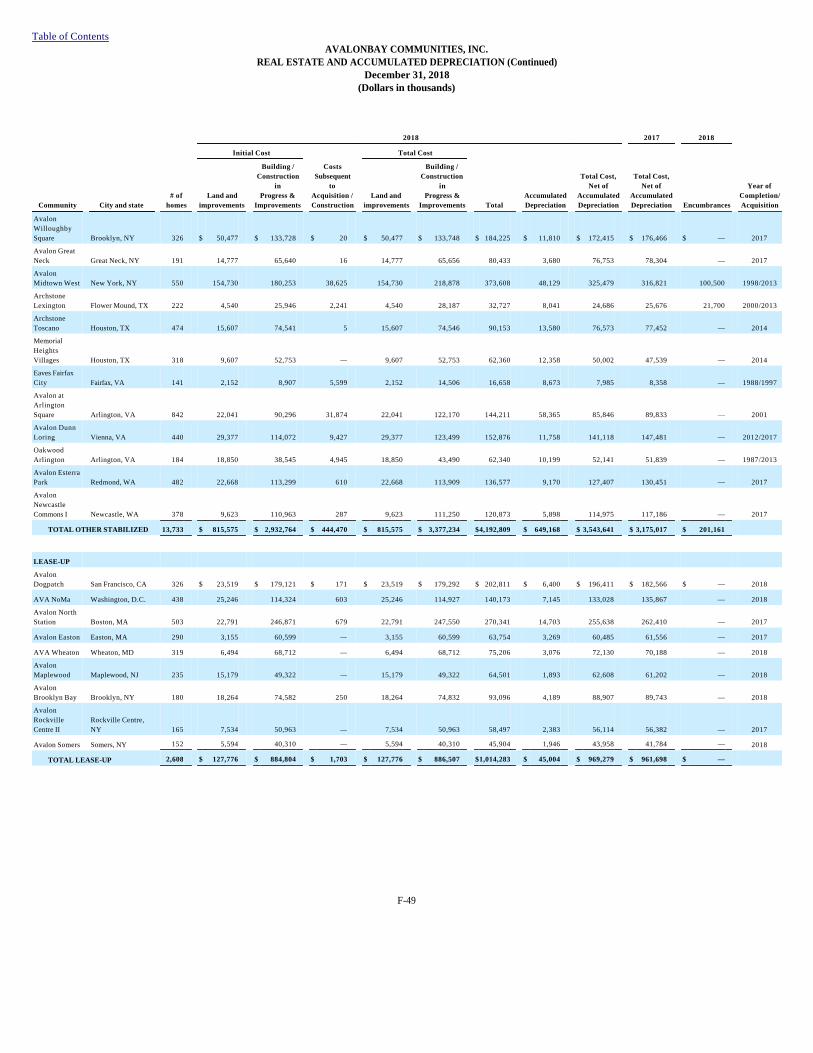
Table of Contents AVALONBAY COMMUNITIES, INC.
REAL ESTATE AND ACCUMULATED DEPRECIATION (Continued) December 31, 2018
(Dollars in thousands)
F-49
2018 2017 2018
Initial Cost Total Cost
Community City and state # of
homes Land and
improvements
Building / Construction
in Progress &
Improvements
Costs Subsequent
to Acquisition / Construction
Land and improvements
Building / Construction
in Progress &
Improvements Total Accumulated Depreciation
Total Cost, Net of
Accumulated Depreciation
Total Cost, Net of
Accumulated Depreciation Encumbrances
Year of Completion/ Acquisition
Avalon Willoughby Square Brooklyn, NY 326 $ 50,477 $ 133,728 $ 20 $ 50,477 $ 133,748 $ 184,225 $ 11,810 $ 172,415 $ 176,466 $ — 2017
Avalon Great Neck Great Neck, NY 191 14,777 65,640 16 14,777 65,656 80,433 3,680 76,753 78,304 — 2017
Avalon Midtown West New York, NY 550 154,730 180,253 38,625 154,730 218,878 373,608 48,129 325,479 316,821 100,500 1998/2013
Archstone Lexington Flower Mound, TX 222 4,540 25,946 2,241 4,540 28,187 32,727 8,041 24,686 25,676 21,700 2000/2013
Archstone Toscano Houston, TX 474 15,607 74,541 5 15,607 74,546 90,153 13,580 76,573 77,452 — 2014
Memorial Heights Villages Houston, TX 318 9,607 52,753 — 9,607 52,753 62,360 12,358 50,002 47,539 — 2014
Eaves Fairfax City Fairfax, VA 141 2,152 8,907 5,599 2,152 14,506 16,658 8,673 7,985 8,358 — 1988/1997
Avalon at Arlington Square Arlington, VA 842 22,041 90,296 31,874 22,041 122,170 144,211 58,365 85,846 89,833 — 2001
Avalon Dunn Loring Vienna, VA 440 29,377 114,072 9,427 29,377 123,499 152,876 11,758 141,118 147,481 — 2012/2017
Oakwood Arlington Arlington, VA 184 18,850 38,545 4,945 18,850 43,490 62,340 10,199 52,141 51,839 — 1987/2013
Avalon Esterra Park Redmond, WA 482 22,668 113,299 610 22,668 113,909 136,577 9,170 127,407 130,451 — 2017
Avalon Newcastle Commons I Newcastle, WA 378 9,623 110,963 287 9,623 111,250 120,873 5,898 114,975 117,186 — 2017
TOTAL OTHER STABILIZED 13,733 $ 815,575 $ 2,932,764 $ 444,470 $ 815,575 $ 3,377,234 $4,192,809 $ 649,168 $ 3,543,641 $ 3,175,017 $ 201,161
LEASE-UP Avalon Dogpatch San Francisco, CA 326 $ 23,519 $ 179,121 $ 171 $ 23,519 $ 179,292 $ 202,811 $ 6,400 $ 196,411 $ 182,566 $ — 2018
AVA NoMa Washington, D.C. 438 25,246 114,324 603 25,246 114,927 140,173 7,145 133,028 135,867 — 2018
Avalon North Station Boston, MA 503 22,791 246,871 679 22,791 247,550 270,341 14,703 255,638 262,410 — 2017
Avalon Easton Easton, MA 290 3,155 60,599 — 3,155 60,599 63,754 3,269 60,485 61,556 — 2017
AVA Wheaton Wheaton, MD 319 6,494 68,712 — 6,494 68,712 75,206 3,076 72,130 70,188 — 2018
Avalon Maplewood Maplewood, NJ 235 15,179 49,322 — 15,179 49,322 64,501 1,893 62,608 61,202 — 2018
Avalon Brooklyn Bay Brooklyn, NY 180 18,264 74,582 250 18,264 74,832 93,096 4,189 88,907 89,743 — 2018
Avalon Rockville Centre II
Rockville Centre, NY 165 7,534 50,963 — 7,534 50,963 58,497 2,383 56,114 56,382 — 2017
Avalon Somers Somers, NY 152 5,594 40,310 — 5,594 40,310 45,904 1,946 43,958 41,784 — 2018
TOTAL LEASE-UP 2,608 $ 127,776 $ 884,804 $ 1,703 $ 127,776 $ 886,507 $1,014,283 $ 45,004 $ 969,279 $ 961,698 $ —

Table of Contents AVALONBAY COMMUNITIES, INC.
REAL ESTATE AND ACCUMULATED DEPRECIATION (Continued) December 31, 2018
(Dollars in thousands)
F-50
2018 2017 2018
Initial Cost Total Cost
Community City and
state # of
homes Land and
improvements
Building / Construction
in Progress &
Improvements
Costs Subsequent to Acquisition / Construction
Land and improvements
Building / Construction
in Progress &
Improvements Total Accumulated Depreciation
Total Cost, Net of
Accumulated Depreciation
Total Cost, Net of
Accumulated Depreciation Encumbrances
Year of Completion/ Acquisition
REDEVELOPMENT
Avalon Studio City Studio City, CA 276 $ 15,756 $ 78,178 $ 11,884 $ 15,756 $ 90,062 $ 105,818 $ 20,132 $ 85,686 $ 82,573 $ — 2002/2013
Eaves Seal Beach Seal Beach, CA 549 46,790 99,999 20,009 46,790 120,008 166,798 26,730 140,068 129,515 — 1971/2013
AVA Van Ness Washington, D.C. 269 22,890 58,691 17,623 22,890 76,314 99,204 16,108 83,096 77,168 — 1978/2013
Avalon Prudential Center II Boston, MA 266 8,776 35,496 59,168 8,776 94,664 103,440 35,845 67,595 64,388 — 1968/1998
Avalon Prudential Center I Boston, MA 243 8,002 32,370 47,717 8,002 80,087 88,089 31,427 56,662 49,809 — 1968/1998
Avalon Court Melville, NY 494 9,228 50,063 14,475 9,228 64,538 73,766 37,666 36,100 30,881 — 1997
Eaves Fairfax Towers Falls Church, VA 415 17,889 74,727 8,473 17,889 83,200 101,089 21,368 79,721 78,629 — 1978/2011
Avalon Ballston Square
Arlington, VA 714 71,640 215,937 25,959 71,640 241,896 313,536 55,469 258,067 256,699 — 1992/2013
Eaves Redmond Campus
Redmond, WA 422 22,580 88,001 21,638 22,580 109,639 132,219 25,077 107,142 99,751 — 1991/2013
TOTAL REDEVLOPMENT 3,648 $ 223,551 $ 733,462 $ 226,946 $ 223,551 $ 960,408 $ 1,183,959 $ 269,822 $ 914,137 $ 869,413 $ —
TOTAL CURRENT COMMUNITIES (3) 74,890 $ 4,068,035 $ 14,395,399 $ 1,889,559 $ 4,068,035 $ 16,284,958 $20,352,993 $ 4,556,052 $ 15,796,941 $ 15,707,425 $ 1,152,355
DEVELOPMENT Avalon Public Market
Emeryville, CA 289 $ — $ 3,995 $ 110,229 $ — $ 114,224 $ 114,224 $ 90 $ 114,134 $ 55,872 $ — N/A
AVA Hollywood Hollywood, CA 695 — 1,157 220,298 — 221,455 221,455 — 221,455 169,007 — N/A
Avalon Walnut Creek II (2)
Walnut Creek, CA 200 — 88 32,168 — 32,256 32,256 — 32,256 8,812 — N/A
Avalon Doral Doral, FL 350 — — 35,154 — 35,154 35,154 — 35,154 N/A — N/A
Avalon at the Hingham Shipyard II
Hingham, MA 190 6,166 37,960 15,309 6,166 53,269 59,435 291 59,144 23,792 — N/A
Avalon Sudbury Sudbury, MA 250 12,525 44,666 22,053 12,525 66,719 79,244 602 78,642 33,595 — N/A
Avalon Saugus Saugus, MA 280 — 59 52,630 — 52,689 52,689 — 52,689 N/A — N/A
Avalon Norwood Nordwood, MA 198 — — 21,641 — 21,641 21,641 59 21,582 N/A — N/A
Twinbrook Station Rockville, MD 238 — — 15,844 — 15,844 15,844 — 15,844 14,072 — N/A
Avalon Towson Towson, MD 371 — 16 42,670 — 42,686 42,686 — 42,686 3,985 — N/A
Avalon Harbor East Baltimore, MD 400 — 63 28,038 — 28,101 28,101 — 28,101 N/A — N/A
Avalon Boonton Boonton, NJ 350 — 1,254 71,648 — 72,902 72,902 — 72,902 29,954 — N/A
Avalon Teaneck Teaneck, NJ 248 — 189 43,319 — 43,508 43,508 — 43,508 18,609 — N/A
Avalon Piscataway Piscataway, NJ 360 1,402 34,406 40,326 1,402 74,732 76,134 386 75,748 28,303 — N/A
Avalon Old Bridge Old Bridge, NJ 252 — — 11,573 — 11,573 11,573 — 11,573 N/A — N/A
Avalon Yonkers Yonkers, NY 590 — 303 88,903 — 89,206 89,206 — 89,206 23,300 — N/A

Table of Contents AVALONBAY COMMUNITIES, INC.
REAL ESTATE AND ACCUMULATED DEPRECIATION (Continued) December 31, 2018
(Dollars in thousands)
_________________________________
F-51
2018 2017 2018
Initial Cost Total Cost
Community City and state # of
homes Land and
improvements
Building / Construction
in Progress &
Improvements
Costs Subsequent to Acquisition / Construction
Land and improvements
Building / Construction
in Progress &
Improvements Total Accumulated Depreciation
Total Cost, Net of
Accumulated Depreciation
Total Cost, Net of
Accumulated Depreciation Encumbrances
Year of Completion/ Acquisition
Avalon Harrison Harrison, NY 143 $ — $ — $ 5,504 $ — $ 5,504 $ 5,504 $ — $ 5,504 N/A $ — N/A
Avalon Belltown Towers Seattle, WA 273 — 1,536 115,897 — 117,433 117,433 — 117,433 50,636 — N/A
AVA Esterra Park Redmond, WA 323 — 1,220 74,532 — 75,752 75,752 — 75,752 37,048 — N/A
Avalon Newcastle Commons II Newcastle, WA 293 — — 22,384 — 22,384 22,384 — 22,384 N/A — N/A
Avalon North Creek Bothell, WA 316 — 151 37,907 — 38,058 38,058 — 38,058 15,432 — N/A
15 West 61st Street (4) New York, NY N/A — 2,519 543,988 — 546,507 546,507 — 546,507 440,712 — N/A
TOTAL DEVELOPMENT 6,609 $ 20,093 $ 129,582 $ 1,652,015 $ 20,093 $ 1,781,597 $ 1,801,690 $ 1,428 $ 1,800,262 $ 953,129 $ —
Land Held for Development N/A $ 84,712 $ — $ — $ 84,712 $ — $ 84,712 $ — $ 84,712 $ 68,364 $ —
Corporate Overhead N/A 10,879 11,414 80,888 10,879 92,302 103,181 54,166 49,015 43,073 5,950,000
2018 Disposed Communities N/A — — — — — — — — 945,566 —
TOTAL 81,499 $ 4,183,719 $ 14,536,395 $ 3,622,462 $ 4,183,719 $ 18,158,857 $22,342,576 $ 4,611,646 $ 17,730,930 $ 17,717,557 $ 7,102,355
(1) This community was under redevelopment for some or all of 2018, with the redevelopment effort primarily focused on the exterior and/or common area, or with the redevelopment effort focused on apartment homes that do not meet the definition of a Redevelopment Community. These redevelopment activities have no expected material impact on community operations, and therefore this community is included in the Established Community portfolio and not classified as a Redevelopment Community.
(2) Some or all of the land for this community is subject to a land lease.
(3) Current Communities excludes Unconsolidated Communities.
(4) 15 West 61st Street is expected to contain 172 residential units and 67,000 square feet of retail space. The Company is pursuing a potential for-sale strategy of individual condominium units for the residential portion, while the Company would maintain ownership of the retail portion. The number of homes that the Company expects the new building to contain upon completion are not included in the apartment home count presented in this Form 10-K.

Table of Contents AVALONBAY COMMUNITIES, INC.
REAL ESTATE AND ACCUMULATED DEPRECIATION (Continued) December 31, 2018
(Dollars in thousands)
Amounts include real estate assets held for sale. Depreciation of AvalonBay Communities, Inc. building, improvements, upgrades and furniture, fixtures and equipment (FF&E) is calculated over the following useful lives, on a straight line basis: Building—30 years Improvements, upgrades and FF&E—not to exceed 7 years The aggregate cost of total real estate for federal income tax purposes was approximately $21,480,345 at December 31, 2018. The changes in total real estate assets for the years ended December 31, 2018, 2017 and 2016 are as follows:
The changes in accumulated depreciation for the years ended December 31, 2018, 2017 and 2016, are as follows:
F-52 (Back To Top)
AVALONBAY COMMUNITIES, INC.
Secretary’s Certificate
The undersigned, Edward M. Schulman, hereby certifies that he is the Secretary of AvalonBay Communities, Inc., a Maryland corporation (the “Company”), and does further certify as follows: On February 14, 2019, at a duly called and held meeting of the Board of Directors of the Company, the Board adopted the following resolution amending the Company’s Second Amended and Restated 2009 Equity Incentive Plan:
“Cause” means:
(i) any material or willful breach by the grantee of any agreement to which the grantee and the Company are parties or of any published policy of the Company that is generally applicable to all employees of the Company (or to a subset of employees applicable to grantee, e.g., all officers or employees of a particular business unit), including, but not limited to, policies concerning insider trading, misuse of confidential information, sexual harassment or policies contained in the Company’s Code of Conduct or Associate Handbook as the same may be amended from time to time; the materiality or willfulness of a breach shall be determined in the sole discretion of the Company;
(ii) any act (other than retirement or other termination of employment) or omission to act by the grantee which may, as determined in the sole discretion of the Company, have a material and adverse effect on the business interests of the Company or any Subsidiary or on the grantee’s ability to perform services for the Company or any Subsidiary, including, without limitation, the commission of or indictment for any crime (other than ordinary traffic violations);,
or (iii) any material misconduct or neglect of duties by the grantee in connection with the business or affairs of the Company or any Subsidiary, including without limitation due to alcohol abuse or use of controlled substances other than in accordance with a valid prescription, as determined by the Company in its sole discretion;
For the year ended
12/31/2018 12/31/2017 12/31/2016
Balance, beginning of period $ 21,935,936 $ 20,776,626 $ 19,268,099 Acquisitions, construction costs and improvements 1,568,878 1,526,516 1,788,515 Dispositions, including casualty losses and impairment loss on planned dispositions (1,162,238 ) (367,206 ) (279,988 )
Balance, end of period $ 22,342,576 $ 21,935,936 $ 20,776,626
For the year ended
12/31/2018 12/31/2017 12/31/2016
Balance, beginning of period $ 4,218,379 $ 3,743,632 $ 3,325,790 Depreciation, including discontinued operations 631,196 584,150 531,434 Dispositions, including casualty losses (237,929 ) (109,403 ) (113,592 )
Balance, end of period $ 4,611,646 $ 4,218,379 $ 3,743,632
Section 2: EX-10.4 (EXHIBIT 10.4)
Resolved: To amend the definition of “Cause” in Section 1 of the Company’s Second Amended and Restated 2009 Equity Incentive Plan as follows (deleted language is struck through, added language is bold and double scored):

(iv) any willful failure, as determined by the Company in its sole discretion, to cooperate fully with a Company internal investigation or an investigation of the Company by regulatory or law enforcement authorities whether or not related to the grantee’s employment with the Company (an “Investigation”), after being instructed by the Company (including any instruction by legal, internal audit, or human resources personnel) to cooperate, or the grantee’s willful destruction of or knowing and intentional failure to preserve documents or other material (including emails, text messages or electronic data) known by the grantee to be relevant to any investigation; or
(v) any fraud or misappropriation, embezzlement or misuse of funds or property belonging to the Company (including through the misapplication of Company property to personal use or fraudulent expense reimbursement reports);

provided, that the following shall apply in connection with and for twenty-four months following a Sale Event: (i) if any act or omission is, in the reasonable judgment of the Company, capable of cure, the grantee first shall have received written notice of the act or omission alleged to constitute Cause and shall have failed to cure after 15 days following such notice from the Company which notice shall specifically identify the act or omission which the Company believes constitutes Cause; and (ii) in the case of an officer, a dismissal of such officer for Cause must be made pursuant to a vote of the Board (after the expiration of any applicable 15 day cure period).
As used in this definition of Cause, an act or omission to act shall be considered “willful” if done, or omitted to be done, by the grantee with knowledge and intent.
The foregoing definition does not in any way limit the Company’s ability to terminate the grantee’s employment at any time, nor will it limit the Company’s ability to terminate the grantee’s employment for poor performance or for “Cause” as defined for other purposes by the Company (e.g., with respect to other severance arrangements or guidelines).
IN WITNESS WHEREOF, the undersigned has signed this certificate as of February 14, 2019.
AVALONBAY COMMUNITIES, INC.
/s/ Edward M. Schulman Name: Edward M. Schulman Title: Secretary
(Back To Top)
[2019-2021 TSR and Operating Metrics Awards] Page 1 of 1
Personal Performance Award Agreement Exhibit
for the Three Year Performance Period Ending December 31, 2021
Name: [Name - #] Initial Target Dollar Value of Award: [Dollar - #] As an officer of Avalonbay Communities, Inc., you have been awarded two performance awards with an aggregate total target dollar value as listed above:
Sixty percent of such total dollar value is allocated to a performance award that employs total shareholder return metrics. The number of target units for such award and other information about such award is set forth in Exhibit A attached hereto. Forty percent of such total dollar value is allocated to a performance award that employs operating performance metrics. The number of target units for such award and other information about such award is set forth in Exhibit B attached hereto.
In consideration of the receipt of such awards, you acknowledge receipt of, and agree to bound by, the two award agreements attached hereto and the Award Terms attached hereto in Exhibit C, the Plan, and any exhibits to the Award Terms (all as defined pursuant to the attached exhibits).
AVALONBAY COMMUNITIES, INC.
Timothy J. Naughton, Chairman and CEO
Agreed and Acknowledged:
The recipient of this award shall agree and acknowledge receipt of this award and its terms through acceptance of the award via the grant acceptance functionality at the recipient’s Merrill Lynch Benefits Online account.
Section 3: EX-10.10 (EXHIBIT 10.10)


[ Exhibit A - TSR Metrics Unit Award 2019-2021] Personal Performance Award Agreement Exhibit
for Total Shareholder Return (TSR) Metrics Units (2019 Award - Maturing December 31, 2021)
Name: [Name-#] Date of Grant: ♦ Dollar Value for TSR Units: [A-#] Valuation per Unit (Monte Carlo value): ♦ Number of TSR Target Units: [B-#] Performance Period: January 1, 2019 - December 31, 2021 Threshold/Target/Max Multiplier: 50%/100%/200% As an officer or associate of AvalonBay Communities, Inc. (“AvalonBay” or the “Company”), you have been awarded Performance-Based Restricted Stock Units (“Units”) that employ total shareholder return (TSR) metrics as outlined below. The award described herein is subject to the “Award Terms of Performance-Based Restricted Stock Units” as most recently approved by the Board of Directors and its Compensation Committee on or before the Date of Grant, a copy of which has been distributed to you with this Award Agreement (the “Award Terms”). Capitalized terms used herein and not defined herein have the meanings ascribed thereto in the Award Terms. This Personal Performance Award Agreement Exhibit contains specific information about the awards being made this year that employ TSR metrics for the indicated Performance Period as well as information about your specific award. TSR Performance Metrics: Your award consists initially of the number of Target Units indicated above but you could earn less or more than that number based on the threshold/target/max multiplier above and the terms described herein. The final number of Units you may earn shall be determined following the completion of the Performance Period based on the Total Shareholder Return of a share of AvalonBay common stock over the Performance Period, expressed as an annualized rate of return (i.e., the rate of return which, when compounded annually over the Performance Period, equals the Total Shareholder Return for the period) (“AVB Annualized Performance”). You have been awarded [B-#] of Target Units that employ TSR-based Performance Metrics. The Performance Metrics that will determine the final number of Units you may earn are as follows:
1. Absolute TSR Metric: Twenty-five percent (25%) of the Target Number of TSR Units may be earned based on comparing the AVB Annualized Performance to absolute targets as follows:
*For results between threshold and target, or between target and maximum, the percentage of twenty-five percent of the Target Number of TSR Units earned shall be based on interpolation.
AVB Annualized Performance
less than 3.00% 0%
3.00% (threshold*) 50%
8.00 % (target*) 100%
13.00% (maximum*) 200%

2. Relative Metric against the FTSE NAREIT Apartment Index: Fifty percent (50%) of the Target Number of TSR Units may be earned based on comparing the AVB Annualized Performance to the annualized total shareholder return of the FTSE NAREIT Equity Apartments Index (FNAPTTR, FN18) (the “Apt Index”) for the Performance Period as follows:
*For results between threshold and target, or between target and maximum, the percentage of fifty percent of the Target Number of TSR Units earned shall be based on interpolation. 3. Relative Metric against the FTSE NAREIT Equity REITs Index: Twenty-five percent (25%) of the Target Number of TSR Units may be earned based on comparing the AVB Annualized Performance to the annualized total shareholder return of the FTSE NAREIT Equity REITs Index (FNRETR)1 (the “REIT Equity Index”) for the Performance Period as follows:
*For results between threshold and target, or between target and maximum, the percentage of twenty-five percent of the Target Number of Units earned shall be based on interpolation.
It is noted that each performance metric is independent of the others. For example, if the threshold is not achieved for the Absolute TSR metric, but target performance is achieved for the Apt Index TSR metric and the REIT Equity Index TSR metric, the number of units earned would equal (50% x 100% x Target Number of Units) + (25% x 100% x Target Number of Units). Earned Units shall be rounded to the nearest whole value. Settlement in Unrestricted AvalonBay Common Stock and Payment of Cash Equal to Accrued Dividends Thereon: Following the end of the Performance Period and the effectiveness of the Compensation Committee’s final determination of (i) the Company’s Total Shareholder Return for the Performance Period and how it compared to the TSR Performance Metrics and goals set forth in this award, and (ii) the number of Units earned by you on account thereof, the earned portion of this Award (i.e., the earned Units) shall be settled with the issuance to you of unrestricted shares of AvalonBay Common Stock effective March 1 of the year following the end of the Performance Period or, if not a business day, the next business day. I.e., for a Performance Period ending December 31, 2021, your shares of unrestricted stock will be issued Tuesday, March 1, 2022. On or about the time of the issuance of such shares of unrestricted stock to you (but in no event later than March 15 of such year), the Company will pay to you, as additional compensation and subject to tax withholding, cash equal in amount to the dividends that would have been payable on such number of shares during the Performance Period based on New York Stock Exchange ex-dividend dates (and not dividend payment dates) that occurred during the Performance Period, without any supplement thereto in the nature of interest or compounding thereon. __________________________________ 1 Note: The FTSE NAREIT Equity REITs index (FNRETR) is described by FTSE as spanning the commercial real estate space across the U.S. economy and contains all equity REITs not designated as timber REITs or infrastructure REITs.
AVB Annualized Performance below (-) or above (+) the Apt Index Return
more than -300 basis points below 0%
-300 basis points(threshold*) 50%
0 basis points (target*) 100%
+300 basis points (maximum*) 200%
AVB Annualized Performance below (-) or above (+) the REIT Equity Index Return
more than -500 basis points below 0%
-500 basis points (threshold*) 50%
0 basis points (target*) 100%
+500 basis points (maximum*) 200%

Forfeiture of Units; Sale Event: As provided in the Award Terms, no Units may be earned if your employment terminates for any reason prior to the completion of the first year of the Performance Period. Thereafter, you may vest in a portion of the award, to be earned and settled in unrestricted shares of AvalonBay common stock and a cash payment equal in amount to the accrued dividends thereon as described above, if your employment terminates due to death, Disability, Retirement, or termination without cause. The Award terms describe special rules that apply in the event of a Sale Event.
[End of Text]

[ Exhibit B - Operating Metrics Unit Award 2019-2021]
Personal Performance Award Agreement Exhibit For
Operating Metrics (2019 Award - Maturing December 31, 2021)
Name: [Name-#] Date of Grant: ♦ Dollar Value for Operating Metrics Units: [C-#] Valuation per Unit (Based on Stock Price): ♦ Number of Operating Metrics Target Units: [D-#] Performance Period: January 1, 2019 - December 31, 2021 Threshold/Target/Max Multiplier: 50%/100%/200% As an officer or associate of AvalonBay Communities, Inc. (“AvalonBay” or the “Company”), you have been awarded Performance-Based Restricted Stock Units (“Units”) that employ operating performance metrics as outlined below. The award described herein is subject to the “Award Terms of Performance-Based Restricted Stock Units” as most recently approved by the Board of Directors and its Compensation Committee on or before the Date of Grant, a copy of which has been distributed to you with this Award Agreement (the “Award Terms”). Capitalized terms used herein and not defined herein have the meanings ascribed thereto in the Award Terms. This Personal Performance Award Agreement Exhibit contains specific information about the awards being made this year that employ operating performance metrics for the indicated Performance Period as well as information about your specific award. Operating Performance Metrics: Your award consists initially of the number of Target Units indicated above but you could earn less or more than that number based on the threshold/target/max multiplier above and the terms described herein. The final number of Units you may earn shall be determined following the completion of the Performance Period based on (AvalonBay’s performance on two operating performance metrics measured over the Performance Period. You have been awarded [D-#] of Target Units that employ operating performance metrics. The Performance Metrics that will determine the final number of Units you may earn are as follows:
1. Core Funds from Operations (“Core FFO”) per share growth, measured over the Performance Period and expressed as a compound annual growth rate, as compared against the Peer Group. A percentage of 66.7% of the Target Number of Operating Metric Units may be earned based on comparing AvalonBay’s Core FFO2 growth as compared to the Peer Group3.
______________________________ 2 The determination of Core FFO and Core FFO per share growth rates for AvalonBay and the Peer Group shall be approved by the Compensation Committee taking into account published Core FFO/share amounts and adjustments deemed appropriate to derive comparable results between the Core FFO and Core FFO per share growth of the Company and its peers, which may include adjustments deemed appropriate in the event of special dividends and distributions to shareholders as a result, for example, of portfolio sales. Core FFO may be calculated (before such adjustments, if any) as presented in the Company’s earnings releases or as presented in third party published reports. 3 The “Peer Group” consists of the following companies, identified by their stock symbolsand may be adjusted as the Compensation Committee of the Board of Directors reasonably deems necessary to take into account unanticipated events, such as merger or acquisition or going private activity by a constituent member: AIV, CPT, EQR, ESS, MAA, and UDR.

*For results between threshold and target, or between target and maximum, the percentage of 66.7% of the Target Number of Operating Metric Units earned shall be based on interpolation. 2. Net Debt (i.e., outstanding indebtedness less cash on the balance sheet) divided by Core Earnings before Interest, Depreciation and Amortization (EBITDA), measured at the end of each quarter during the Performance Period and averaged, as compared against the simple average of the same calculation done for the Peer Group companies over the performance period. A percentage of 33.3% of the Target Number of Operating Metric Units may be earned based on comparing AvalonBay’s Net Debt/EBITDA4 during the performance period as compared to the Peer Group:
*For results between threshold and target, or between target and maximum, the percentage of 33.3% of the Target Number of Operating Metric Units earned shall be based on interpolation.
It is noted that each performance metric is independent of the others. For example, if the threshold is not achieved for the Core FFO metric but target performance is achieved for the Net Debt/Core EBITDA metric, the number of units earned would equal (33.3% x 100% x Target Number of Operating Metric Units). Earned Units shall be rounded to the nearest whole value. Settlement in Unrestricted AvalonBay Common Stock and Payment of Cash Equal to Accrued Dividends Thereon: Following the end of the Performance Period and the effectiveness of the Compensation Committee’s final determination of (i) the Company’s performance for the Performance Period and how it compared to the Operating Performance Metrics and goals set forth in this award, and (ii) the number of Units __________________________________ 4 The determination of Net Debt/Core EBITDA for AvalonBay and the Peer Group shall be approved by the Compensation Committee taking into account published debt and Core EBITDA amounts and adjustments deemed appropriate to derive comparable results between the Net Debt/Core EBITDA of the Company and its peers. Net Debt/Core EBITDA is calculated (before such adjustments, if any) as presented in the Company’s earning releases.
AVB Performance Period Core FFO/share growth below (-) or above (+) the Peer Group OFF/share growth
more than -300 basis points below 0%
-300 basis points (threshold*) 50%
0 basis points (target*) 100%
+300 basis points (maximum*) 200%
AVB Performance Period Net Debt/Core EBITDA more than or less than the Peer Group average
(AVB Net Debt/Core EBITDA calculation minus Peer Group calculation) is more than 1.5 0%
(AVB Net Debt/Core EBITDA calculation minus Peer Group calculation) equals 1.5 (threshold*) 50%
(AVB Net Debt/Core EBITDA calculation minus Peer Group calculation) equals 0 (target*) 100%
(AVB Net Debt/Core EBITDA calculation minus Peer Group calculation) is -1.5 (negative 1.5) or less (i.e., a larger negative number) (maximum*) 200%

earned by you on account thereof, the earned portion of this Award (i.e., the earned Units) shall be settled with the issuance to you of unrestricted shares of AvalonBay Common Stock effective March 1 of the year following the end of the Performance Period or, if not a business day, the next business day. I.e., for a Performance Period ending December 31, 2021, your shares of unrestricted stock will be issued Tuesday, March 1, 2022. On or about the time of the issuance of such shares of unrestricted stock to you (but in no event later than March 15 of such year), the Company will pay to you, as additional compensation and subject to tax withholding, cash equal in amount to the dividends that would have been payable on such number of shares during the Performance Period based on New York Stock Exchange ex-dividend dates (and not dividend payment dates) that occurred during the Performance Period, without any supplement thereto in the nature of interest or compounding thereon. Forfeiture of Units; Sale Event: As provided in the Award Terms, no Units may be earned if your employment terminates for any reason prior to the completion of the first year of the Performance Period. Thereafter, you may vest in a portion of the award, to be earned and settled in unrestricted shares of AvalonBay common stock and a cash payment equal in amount to the accrued dividends thereon as described above, if your employment terminates due to death, Disability, Retirement, or termination without cause . The Award terms describe special rules that apply in the event of a Sale Event.
[End of Text]

[ Exhibit C - Award Terms Distributed with 2019-2021 Performance Award]
AWARD TERMS OF PERFORMANCE-BASED RESTRICTED STOCK UNITS
GRANTED UNDER THE
AVALONBAY COMMUNITIES, INC. SECOND AMENDED AND RESTATED 2009 EQUITY INCENTIVE PLAN
(As most recently approved by the Board of Directors and its Compensation Committee on or before the Date of Grant)
Certain Principal
The Company’s Total Shareholder Return represents the change in the value of an investment in one share of AvalonBay
common stock over the Performance Period, expressed as a percentage, assuming the following:
Introduction You have been granted performance-based restricted stock units under the AvalonBay Communities, Inc. Second Amended and Restated 2009 Equity Incentive Plan (as the same has or may be amended, the “Plan”), subject to the following Award Terms. This grant is also subject to the terms of (i) your Personal Performance Award Agreement Exhibit(s) (“Personal Exhibit”), as further explained herein, and (ii) the Plan, which is hereby incorporated by reference. To the extent that an Award Term conflicts with the Plan, the Plan shall govern.
Type of Award You are being awarded performance-based restricted stock units (the “Units”). Units are bookkeeping entries only, and you shall have no rights as a stockholder of the Company, and no dividend and voting rights, with respect to the Units, nor shall a notional amount be reinvested in respect of “phantom dividends” for the purpose of crediting your account with additional Units.
Terms Your Personal Exhibit sets forth certain principal terms about the Units awarded for the applicable Performance Period, such as the performance metrics which will apply to determine the final number of Units earned. The terms included in your Personal Exhibit include the following:
• Date of Grant • Number of Target Units Awarded • Performance Period • Total Shareholder Return and/or Operating Performance Metrics
No Transfers You may not sell, gift, or otherwise transfer or dispose of any of the Units.
Performance Metrics If you remain an active employee of AvalonBay from the Date of Grant through the last day of the Performance Period, then the number of Units you will earn at the end of the Performance Period will be based upon the performance of (i) the Company’s Total Shareholder Return, and/or (ii) the Company’s performance as measured against certain metrics of operating performance, in each case over the Performance Period and as described in your Personal Exhibit.
Beginning Stock Price: average closing price of a share of AvalonBay common stock over the 20 trading days immediately prior to the first day of the Performance Period. Ending Stock Price: average closing price of a share of AvalonBay common stock over the last 20 trading days of the Performance Period. Dividends reinvested in additional shares of AvalonBay common stock on the ex dividend date for such dividend at the closing price of a share of AvalonBay common stock.
If the Company’s Total Shareholder Return is measured on a relative basis against an index, the Total Shareholder Return of the
index will be measured by using a 20 trading day average of the beginning and ending price or level of the index.
The Compensation Committee of the Board of Directors (the “Compensation Committee”), as promptly as practicable (but in no event later than 60 days) following the conclusion of the Performance Period, shall determine (i) the performance of the Company’s Total Shareholder Return over the Performance Period as compared against the Performance Metrics established for the period and/or the achievement of other operating metrics by the Company, and (ii) the actual number of Units that are earned by you, which shall be a percentage (from zero to 200%) of the Target Units you are awarded at the beginning of the Performance Period. You shall forfeit any portion of this Award that is not earned upon the conclusion of the Performance Period (i.e., any Target Units you are awarded that are in excess of the number of Units earned at the end of the Performance Period, as determined by the Compensation Committee, shall be forfeited).
Forfeiture for Termination of Employment During First Year of Measurement Period; Vesting Provisions After
In the event your employment terminates on or after the completion of the first year of employment (i.e, on or after December 31,
20xx for a Performance Period beginning on January 1, 20xx), then the following shall apply:
First Year In the event your employment terminates for any reason before the completion of the first year of a Performance Period (i.e., for a Performance Period beginning on January 1, 20xx, if your last day of employment is before December 31, 20xx), whether with or without cause, or by reason of death or disability or your voluntary departure or retirement, you shall forfeit all Units and none of the Units shall be earned.
(A) In the event your employment terminates on account of any of the following (each, a “Qualifying Termination”):
• death,

then you shall vest in a percentage of the Performance Award (carried out to the nearest hundredth percentage point), such percentage (the “Percentage”) equaling the number of days of employment served during the Performance Period divided by the total number of days in the Performance Period. Thereafter, when the Performance Period ends, you shall earn the Percentage of the Units that otherwise would have been earned by you had your employment continued through to the end of the Performance Period, and such pro rated number of earned Units shall be settled in unrestricted shares of AvalonBay Common Stock and a cash payment on account of cumulative dividends as described in the related Performance Award Agreement. The Company may require, as a condition to your retaining an interest in the Performance Award following a termination of employment, that you sign and deliver, and do not revoke, a Separation Agreement (as defined in the Restricted Stock Agreement Form (but with a 24 month employee non-solicitation provision instead of a 12 month employee non-solicitation provision) or, if not defined therein, as defined in the Plan) within 30 days of the termination of your employment. For example, with respect to a Performance Award with 1000 target Units, if
then after the Performance Period is completed you would receive 675 fully vested and unrestricted shares of Company common stock (1000 target Units x 150% achievement x 45% vesting = 675) and a cash payment (subject to tax withholding) on account of the dividends earned on such number of shares during the Performance Period.
• Disability (as defined in the Company’s standard form of Restricted Stock Agreement as in effect on March 1 of the first year of the Performance Period and thereafter, if applicable, subsequently amended (the “Restricted Stock Agreement Form” or, if not defined therein, as defined in the Plan),
• Retirement (as defined in the Restricted Stock Agreement Form or, if not defined therein, as defined in the Plan), or• termination without Cause (as defined in the Restricted Stock Agreement Form or, if not defined therein, as defined
in the Plan),
(i) your employment terminates in a Qualifying Termination after the completion of one year of service during the Performance Period and you sign a Separation Agreement as described above,
(ii) you served for 45% of the Performance Period, and (iii) it is determined that 150% of target is achieved for that award,
(B) In the event your employment terminates on account of any reason other than those listed in (A) immediately above (and thus including a termination with

cause or a resignation by you that is not by reason of Retirement), then you shall forfeit all Units and none of the Units shall be earned.
Leaves of
(It is noted that in the event that you acquired a vested interest in a Performance Award on account of a Qualifying Termination, and thereafter a Sale Event is completed, then only the percentage of the award that vested upon the Qualifying Termination shall convert at target into shares of unrestricted stock, and the cash payment related to dividend accrual shall be based on such number).
Absence In the event that you take a leave of absence during the Performance Period, then, unless prohibited by law, the Company may adjust, in its sole discretion and up to a full forfeiture, the percentage of Units that are earned hereunder to equitably reflect (in the sole discretion of the Company) such absence. Without limiting the foregoing, it is noted that such adjustment may be made, in the sole discretion of the Company, by prorating the number of Units that would otherwise be earned without a leave of absence by:
(i) the portion of the year worked without a leave of absence during the last year of the Performance Period (e.g., if nine months are worked during the last year of the Performance Period, there may be a 25% downward adjustment in the percentage of Units that are earned (3 months absence divided by 12 months in the last year of the performance period), or
(ii) the portion of the Performance Period worked without a leave of absence (e.g., if three months are missed due to a leave of absence during a 36 month Performance Period there may be an 8.33% downward adjustment in the percentage of Units that are earned (3 months absence divided by 36 months in the Performance Period)).
Sale Event If a Sale Event occurs during the Performance Period, then all outstanding Performance Awards shall vest at their target value (i.e., target number of units) and one unrestricted share of AvalonBay Common Stock shall be issued to you as of the date of the Sale Event for each Unit so earned, and the Company shall promptly pay to you, subject to tax withholding, an amount of cash equal to the dividends that would have been payble on such number of shares during the Performance Period up until the date of the Sale Event based on New York Stock Exchange ex-dividend dates (and not dividend payment dates) that occurred during the Performance Period, without any supplement thereto in the nature of interest or compounding thereon.
Notices Any notice to be given under the terms of this Award Agreement to the Company shall be addressed to the Company in care of its Secretary, and any notice to be given to

you shall be addressed to you at your address as set forth in the Company’s records. Either party may hereafter designate a different address for notices to be given to it or him or her.
Titles Titles and captions are provided herein for convenience only and are not to serve as a basis for interpretation or construction of this Award Agreement. Capitalized terms used but not defined herein shall have the respective meanings ascribed thereto in the Plan or as the context otherwise reasonably indicates.
Amendment This Award Agreement may be amended only by a writing executed by the parties hereto which specifically states that it is amending this Award Agreement.
Governing Law The laws of the State of Maryland shall govern the interpretation, validity, administration, enforcement and performance of the terms of this Award Agreement regardless of the law that might be applied under principles of conflicts of laws.
Data Privacy Consent In order to administer the Plan and this Award Agreement and to implement or structure future equity grants, the Company, its subsidiaries and affiliates and certain agents thereof (together, the “Relevant Companies”) may process any and all personal or professional data, including but not limited to Social Security or other identification number, home address and telephone number, date of birth and other information that is necessary or desirable for the administration of the Plan and/or this Award Agreement (the “Relevant Information”). By entering into this Award Agreement, you (i) authorize the Company to collect, process, register and transfer to the Relevant Companies all Relevant Information; (ii) waive any privacy rights you may have with respect to the Relevant Information; (iii) authorize the Relevant Companies to store and transmit such information in electronic form; and (iv) authorize the transfer of the Relevant Information to any jurisdiction in which the Relevant Companies consider appropriate. You shall have access to, and the right to change, the Relevant Information. Relevant Information will only be used in accordance with applicable law.
Electronic Delivery The Company may, in its sole discretion, decide to deliver any documents related to current or future participation in the Plan by electronic means. You hereby consent to receive such documents by electronic delivery and agree to participate in the Plan through an on-line or electronic system established and maintained by the Company or a third party designated by the Company. By electronically accepting the Award Agreement and participating in the Plan, you agree to be bound by the terms and conditions in the Plan and this Award Agreement.
Non-Solicitation By accepting an award of Units, you agree that, for a period of at least twenty-four (24) months following your termination of employment with the Company for any reason, you will not, without the prior written consent of the Company, solicit or attempt to solicit for employment with or on behalf of any other person, firm or entity any employee of the Company or any of its affiliates or any other person who was formerly employed by the Company or any of its affiliates within the preceding six months, unless such person’s employment was terminated by the Company or such affiliates.
Recoupment Policy The Company’s Board of Directors has adopted a Policy for Recoupment of Incentive
Compensation (the “Recoupment Policy”), which may be amended from time to time and is available on the Company’s website at www.AvalonBay.com/investors under “Corporate Governance Documents”. By accepting an award of Units, you agree that you have had an opportunity to review the Recoupment Policy and further agree to be bound by the terms of the Recoupment Policy, including without limitation all provisions relating to the recoupment of Incentive Compensation as defined in the Recoupment Policy.
Amendment of Prior Outstanding Award Terms; Acknowledgment and Acceptance
Tax Withholding The Company's obligation (i) to issue or deliver to you any certificate or certificates for unrestricted shares of AvalonBay Common Stock (“Stock”) in settlement of earned Units or (ii) to pay to you any dividends or make any distributions with respect to the shares of Stock issued in settlement of earned Units, is in each case expressly conditioned on the Company's satisfaction of its obligation, if any, to withhold taxes. You shall, not later than the date as of which the receipt of shares of Stock in settlement of earned Units becomes a taxable event for Federal income tax purposes, pay to the Company or make arrangements satisfactory to the Administrator for payment of any Federal, state, and local taxes required by law to be withheld on account of such taxable event. The Company shall satisfy any required minimum tax withholding obligation (or such greater tax withholding as the Administrator may approve) by withholding, from shares of Stock to be issued or released by the transfer agent in connection with the settlement of Units, a number of shares of Stock with an aggregate Fair Market Value that would satisfy the withholding amount due (with the resulting number being rounded up to the nearest whole share of Stock). In addition, by acceptance of this Award, you agrees that for all outstanding Awards not yet vested under the Plan, the Company shall satisfy any required minimum tax withholding obligation (or such greater tax withholding as the Administrator may approve) by withholding from shares of Stock to be issued under such awards a number of shares of Stock with an aggregate Fair Market Value that would satisfy the minimum tax withholding amount due (with the resulting number being rounded up to the nearest whole share of Stock).
of Award. You agree that, to the extent the terms in these Award Terms (including any terms relating to accelerated vesting and conditions thereto, but in no event including (i) the number of units, (ii) the vesting schedule or calendar of vesting dates of units (or shares upon settlement of units or a cash payment equal to accrued dividends thereon), or (iii) the metrics or calculations for determining performance achievement) conflict with the Award Terms in any previously awarded and agreed to performance award agreement that is still outstanding (i.e., unforfeited and the performance period not yet complete), the provisions in these Award Terms shall apply. You also acknowledge that you may be required to evidence your acknowledgement of this award and agreement to the terms hereof by accepting this award in the Company’s stock plan administrator’s system, which acceptance may be required within a certain number of days from the grant date hereof in accordance with instructions and/or announcements provided by the Company to you and failing to accept this award within the Company’s stock plan administrator’s system within such number of days may constitute grounds for forfeiture of this award in the Company’s sole and absolute discretion.

(Back To Top)
Exhibit 21.1
SUBSIDIARY LIST (BY JURISDICTION)
California
Connecticut
Delaware
1
Counterparts This Award Agreement may be executed in one or more counterparts, each of which shall be deemed an original, but all of which together shall constitute one and the same instrument.
Section 4: EX-21.1 (EXHIBIT 21.1)
San Francisco Bay Partners II, Ltd.
Bronxville West, LLC
Forestbroad LLC
Smithtown Galleria Associates Limited Partnership
Town Close Associates Limited Partnership
1100 First DC, LLC
1865 Broadway For-Sale, LLC
1865 Broadway Retail, LLC
4100 Massachusetts Avenue Solar, LLC
Alameda Financing, L.P.
Alexander City Park, LLC
AMP Apartments Subtenant, LLC
AMP Apartments, LLC
AMP Manager LLC
API Emeryville Parkside LLC
Archstone Bay Club Marina LP
Archstone Camargue III LLC
Archstone Carillon Point GP LLC
Archstone Carillon Point LP
Archstone Carillon Point REIT GP LLC
Archstone Carillon Point REIT LP
Archstone Communities LLC
Archstone DC Master Holdings LLC
Archstone DC One Holdings LLC
Archstone Del Mar Station LLC
Archstone Developer LLC
Archstone East 33rd Street GP LLC
Archstone East 33rd Street LP
Archstone East 33rd Street Master Lessee GP LLC
Archstone East 33rd Street Master Lessee LP
Archstone East 33rd Street REIT GP LLC
Archstone East 33rd Street REIT LP
Archstone East 39th Street (Nominee) GP LLC
Archstone East 39th Street (Nominee) LP
Archstone East 39th Street Holdings GP LLC
Archstone East 39th Street Holdings LP
Archstone East 39th Street Land LLC

2
Archstone East 39th Street Principal GP LLC
Archstone East 39th Street Principal LP
Archstone Grosvenor Tower GP LLC
Archstone Grosvenor Tower LP
Archstone Grosvenor Tower REIT GP LLC
Archstone Grosvenor Tower REIT LP
Archstone HoldCO CM LLC
Archstone Huntington Beach College Park LLC
Archstone Huntington Beach Member LLC
Archstone Legacy Place GP LLC
Archstone Legacy Place LP
Archstone Legacy Place REIT GP LLC
Archstone Legacy Place REIT LP
Archstone Lexington Apartments GP LLC
Archstone Lexington Apartments LP
Archstone Lincoln Towers LLC
Archstone Long Beach GP LLC
Archstone Long Beach LP
Archstone Marina Bay GP LLC
Archstone Marina Bay LP
Archstone Marina Bay Nominee LP
Archstone Marina Bay REIT GP LLC
Archstone Marina Bay REIT LP
Archstone Master Property Holdings LLC
Archstone Memorial Heights Villages I LLC
Archstone Multifamily Partners AC Asset Manager LLC
Archstone Multifamily Partners AC CM LLC
Archstone Multifamily Partners AC Funding GP LLC
Archstone Multifamily Partners AC Funding LP
Archstone Multifamily Partners AC GP LLC
Archstone Multifamily Partners AC Investor I LLC
Archstone Multifamily Partners AC Investor II LLC
Archstone Multifamily Partners AC JV Asset Manager LLC
Archstone Multifamily Partners AC JV CM LLC
Archstone Multifamily Partners AC JV GP LLC
Archstone Multifamily Partners AC JV Investor I LLC
Archstone Multifamily Partners AC JV LP
Archstone Multifamily Partners AC LP
Archstone Multifamily Series II LLC
Archstone Multifamily Series III LLC
Archstone Multifamily Series IV LLC
Archstone North Braeswood GP LLC
Archstone North Braeswood LP
Archstone North Capitol Hill 2 GP LLC
Archstone North Capitol Hill 2 LP
Archstone North Capitol Hill GP LLC

3
Archstone North Capitol Hill LP
Archstone Northcreek LLC
Archstone Oak Creek I LLC
Archstone Oak Creek II LLC
Archstone Oakwood Arlington LLC
Archstone Oakwood Toluca Hills LLC
Archstone Old Town Pasadena LLC
Archstone Parallel Residual JV 2, LLC
Archstone Parallel Residual JV, LLC
Archstone Parkland Gardens LLC
Archstone Property Holdings GP LLC
Archstone Property Holdings LLC
Archstone Redmond Campus LLC
Archstone Residual JV, LLC
Archstone San Bruno III LLC
Archstone San Bruno III-B LLC
Archstone San Mateo Holdings LLC
Archstone Smith Corporate Holdings LLC
Archstone Studio 4041 GP LLC
Archstone Studio 4041 LP
Archstone Studio 4041 REIT GP LLC
Archstone Studio 4041 REIT LP
Archstone Texas Land Holdings LLC
Archstone Thousand Oaks LLC
Archstone Trademark JV, LLC
Archstone Tysons Corner LLC
Archstone Venice GP LLC
Archstone Venice LP
Archstone Venice REIT GP LLC
Archstone Venice REIT LP
Archstone Westbury (Nominee) GP LLC
Archstone Westbury (Nominee) LP
Archstone Westbury GP LLC
Archstone Westbury Holdings GP LLC
Archstone Westbury Holdings LP
Archstone Westbury LP
Archstone Westbury Principal GP LLC
Archstone Westbury Principal LP
Archstone-Smith Unitholder Services LLC
Aria at Laurel Hill, LLC
Arlington Square Financing, LLC
ASN 50th Street LLC
ASN Bear Hill LLC
ASN Calabasas I LLC
ASN Calabasas II LLC
ASN La Jolla Colony LLC

4
ASN Lake Mendota Investments LLC
ASN Long Beach LLC
ASN Los Feliz LLC
ASN Meadows at Russett I LLC
ASN Meadows at Russett II LLC
ASN Monument Park LLC
ASN Mountain View LLC
ASN Pasadena LLC
ASN Quincy LLC
ASN Redmond Lakeview LLC
ASN Redmond Park LLC
ASN San Jose LLC
ASN Tanforan Crossing I LLC
ASN Tanforan Crossing II LLC
ASN Thousand Oaks Plaza LLC
ASN Walnut Ridge LLC
ASN Warner Center LLC
ASN Woodland Hills East LLC
AVA Arts District TRS, LLC
AVA Arts District, L.P.
AVA Capitol Hill, LLC
AVA Lawrence Street, LLC
AVA Ninth, L.P.
Avalon 210 Wall, LLC
Avalon 55 Ninth, LLC
Avalon 850 Boca, LLC
Avalon Alderwood Phase I, LLC
Avalon Alexander, LLC
Avalon Anaheim Stadium, L.P.
Avalon Arboretum, L.P.
Avalon Arundel Crossing, LLC
Avalon at 318 I Street, LLC
Avalon at 318 I Street Solar, LLC
Avalon at Ballston, LLC
Avalon at Diamond Heights, L.P.
Avalon at Florham Park, LLC
Avalon at Mission Bay III, L.P.
Avalon at Pacific Bay, L.P.
Avalon at Providence Park, LLC
Avalon at Stratford, LLC
Avalon Baker Ranch, L.P.
Avalon Ballard, LLC
Avalon Belltown, LLC
Avalon Brea Place, LLC
Avalon Brea Place Member, LLC
Avalon Brea Place (Phase I), LLC

5
Avalon Brea Place (Phase II), LLC
Avalon Burlington, LLC
Avalon Chino Hills, L.P.
Avalon Columbia Pike, LLC
Avalon Columbus Circle, LLC
Avalon Columbus Circle Retail, LLC
Avalon Denver West, LLC
Avalon Doral, LLC
Avalon DownREIT V, L.P.
Avalon Dublin Station II, L.P.
Avalon Encino, L.P.
Avalon Exeter, LLC
Avalon Fair Lakes, LLC
Avalon Fairfax City, LLC
Avalon Fashion Valley, L.P.
Avalon Foundry Row, LLC
Avalon Framingham, LLC
Avalon Glendora, L.P.
Avalon Gold, LLC
Avalon Great Neck, LLC
Avalon Green II, LLC
Avalon Grosvenor, L.P.
Avalon Harbor East, LLC
Avalon Hoboken, LLC
Avalon Hoboken TRS, LLC
Avalon Hoboken JV, LLC
Avalon Hollywood GP, LLC
Avalon Hollywood, L.P.
Avalon Hunt Valley, LLC
Avalon Ironwood at Red Rocks, LLC
Avalon Irvine III, L.P.
Avalon Irvine, L.P.
Avalon Laurel, LLC
Avalon Marlborough, LLC
Avalon Milazzo, L.P.
Avalon Mission Oaks, L.P.
Avalon Monrovia, LLC
Avalon Morningside Fee, LLC
Avalon Morrison Park, L.P.
Avalon Mosaic II, LLC
Avalon Mosaic, LLC
Avalon Nashua, LLC
Avalon New Canaan, LLC
Avalon Newport, L.P.
Avalon Norden Place, LLC
Avalon North Creek, LLC

6
Avalon Oak Road, L.P.
Avalon Oak Road GP, LLC
Avalon Ocean Avenue, L.P.
Avalon Old Bridge, LLC
Avalon Ossining, LLC
Avalon Overlake, LLC
Avalon Overlake Phase II, LLC
Avalon Park Crest, LLC
Avalon Piscataway, LLC
Avalon Potomac Yard, LLC
Avalon Princeton, LLC
Avalon Princeton Solar, LLC
Avalon Public Market, L.P.
Avalon Public Market Parcel C, LLC
Avalon Queen Anne, LLC
Avalon Rancho Vallecitos, L.P.
Avalon Ridge at Wheatlands, LLC
Avalon Riverview I, LLC
Avalon Riverview North, LLC
Avalon Rockwell & Lanes, LLC
Avalon Roseland, LLC
Avalon Run, LLC
Avalon San Dimas, L.P.
Avalon Shelton III, LLC
Avalon Shipyard, LLC
Avalon Somers, LLC
Avalon Stuart, LLC
Avalon Studio 77, L.P.
Avalon Teaneck, LLC
Avalon Towers Bellevue, LLC
Avalon Towson, LLC
Avalon Union City, L.P.
Avalon Upper Falls Limited Partnership
Avalon Upper Falls, LLC
Avalon Villa Bonita, L.P.
Avalon Villa San Dimas, L.P.
Avalon Vista, L.P.
Avalon Walnut Creek II, L.P.
Avalon Walnut Creek II GP, LLC
Avalon Watch, LLC
Avalon West Chelsea, LLC
Avalon West Hollywood, L.P.
Avalon West Long Branch, LLC
Avalon White Plains II, LLC
Avalon Willoughby West, LLC
Avalon Wilshire, L.P.

7
Avalon Winbrook Redevelopment, LLC
Avalon Woodland Hills, L.P.
Avalon WP I, LLC
Avalon WP II, LLC
Avalon WP III, LLC
Avalon WP IV, LLC
Avalon WP V, LLC
Avalon WP VI, LLC
Avalon Yonkers ATI Site, LLC
Avalon Yonkers Sun Sites, LLC
AvalonBay Trade Zone Village, LLC
AVB 1865 Broadway, LLC
AVB 1865 Developer, LLC
AVB Albemarle, LLC
AVB Albemarle Solar, LLC
AVB Alderwood Member, LLC
AVB Balboa, LLC
AVB Bloomfield Station Urban Renewal, LLC
AVB Boonton Bondholder, LLC
AVB Bowery II, LLC
AVB Brandywine Member, LLC
AVB Broadway Developer, LLC
AVB Broadway Member, LLC
AVB Consulate, LLC
AVB Del Rey, L.P.
AVB Gallery Place Solar, LLC
AVB Glover Park, LLC
AVB Harrison, LLC
AVB La Mesa GP LLC
AVB La Mesa II GP LLC
AVB La Mesa II LP
AVB La Mesa LP
AVB Legacy DownREIT, LLC
AVB Manager II, LLC
AVB Maple Leaf Apartments GP, LLC
AVB Maple Leaf Apartments Limited Partnership
AVB Maple Leaf REIT, LLC
AVB Market Common, LLC
AVB Meadows, LLC
AVB Morningside Ground Tenant, LLC
AVB Morningside Park, LLC
AVB Morningside Tenant, LLC
AVB North Capitol Hill Solar, LLC
AVB NP II JV GP, LLC
AVB NP II JV Investor, LLC
AVB NY Investor, LLC

8
AVB NY Portfolio CM, LLC
AVB Opera Warehouse GP, LLC
AVB Opera Warehouse TRS, LLC
AVB Opera Warehouse, L.P.
AVB Residual Parallel II, LLC
AVB Santa Monica on Main GP LLC
AVB Santa Monica on Main LP
AVB Simi Valley GP LLC
AVB Simi Valley LP
AVB Southwest Berkeley GP LLC
AVB Southwest Berkeley LP
AVB Statesman, LLC
AVB Statesman Solar, LLC
AVB Studio City GP LLC
AVB Studio City III-A GP LLC
AVB Studio City III-A LP
AVB Studio City III-B GP LLC
AVB Studio City III-B LP
AVB Studio City III-C GP LLC
AVB Studio City III-C LP
AVB Studio City LP
AVB Trademark, LLC
AVB Tunlaw Gardens, LLC
AVB Van Ness Solar, LLC
AVB Walnut Creek GP LLC
AVB Walnut Creek LP
AVB Walnut Creek Station GP LLC
AVB Walnut Creek Station LP
AVB West Chelsea, LLC
AVB Willow Glen GP LLC
AVB Willow Glen LP
Bay Countrybrook L.P.
Bay Pacific Northwest, L.P.
Bellevue Financing, LLC
Bloomingdale Urban Renewal, LLC
Boonton Urban Renewal, LLC
Bowery Place I Low-Income Operator, LLC
Bowery Place I Manager, LLC
BPR Sudbury Development LLC
Capital Mezz LLC
CG-N Affordable LLC
CG-N Affordable Manager LLC
CG-S Affordable LLC
CG-S Affordable Manager LLC
Clinton Green North, LLC
Clinton Green South, LLC
9
Clinton Green Theatre, LLC
Courthouse Hill LLC
Crescent Financing, LLC
Crest Financing, L.P.
CVP II, LLC
CVP III, LLC
Darien Financing, LLC
Dermont Clinton Green, LLC
Doral AVB Member, LLC
Eaves Artesia, L.P.
Eaves Burlington, LLC
Edgewater Financing, LLC
El Paseo Drive Land LLC
Fairfax Towers Financing, L.P.
Garden City Apartments, LLC
Garden City SF, LLC
Garden City Townhomes, LLC
Glen Cove Development LLC
Glen Cove II Development LLC
Hayes Valley, L.P.
La Brea Gateway LLC
Lake Mendota Investments LLC
Laurel Hill Private Sewer Treatment Facility, LLC
Legacy Holdings JV, LLC
Lexford Properties, L.P.
Maplewood Urban Renewal, LLC
Mark Pasadena Financing, L.P.
Mission Bay North Financing, L.P.
MVP I, LLC
Newcastle Construction Management, LLC
Newcastle For Sale, LLC
Newcastle Joint Venture, LLC
Newcastle Multifamily Rental, LLC
North Bergen Residential Urban Renewal, LLC
North Bergen Retail Urban Renewal, LLC
North Point Apartments GP LLC
North Point Apartments Limited Partnership
North Point Holdings GP LLC
North Point Holdings LP
North Point II Apartments, LLC
North Point II JV, LP
North Point II REIT, LLC
North Point REIT LLC
Norwalk Retail, LLC
NYTA MF Investors, LLC
OEC Holdings LLC

District of Columbia
Maryland
10
PHVP I GP, LLC
PHVP I, LP
Pleasant Hill Manager, LLC
Pleasant Hill Transit Village Associates LLC
Quincy Avalon, LLC
Reservoir Community Partners, LLC
Ridgefield Park Urban Renewal, LLC
Roselle Park Urban Renewal, LLC
Roselle Park VP, LLC
San Bruno III Financing, L.P.
Saugus Avalon, LLC
Shady Grove Road Financing, LLC
Sheepshead Bay Road Lender, LLC
Sheepshead Bay Road Manager, LLC
Sheepshead Bay Road Owner, LLC
Sheepshead Bay Road Partner, LLC
Sheepshead Bay Road PM, LLC
Silicon Valley Financing, LLC
Smith Property Holdings Ballston Place L.L.C.
Smith Property Holdings Consulate L.L.C.
Smith Property Holdings Crystal Towers L.P.
Smith Property Holdings Five (D.C.) L.P.
Smith Property Holdings One (D.C.) L.P.
Smith Property Holdings Reston Landing L.L.C.
Smith Property Holdings Seven L.P.
Sudbury Land Avalon, LLC
Union Urban Renewal, LLC
Valet Waste Holdings, Inc.
Wesmont Station Licensee, LLC
Wesmont Station Residential I Urban Renewal, LLC
Wesmont Station Residential II Urban Renewal, LLC
Wesmont Station Retail I Urban Renewal, LLC
Wesmont Station Retail II Urban Renewal, LLC
West Chelsea Transaction, LLC
West Windsor Urban Renewal, LLC
Wharton Urban Renewal, LLC
Woodland Park REIT Holdings GP LLC
Woodland Park REIT Holdings LP
Woodland Park REIT LLC
WP Apartments GP LLC
WP Apartments LP
4100 Massachusetts Avenue Associates, L.P.

11
Archstone
Archstone Inc.
Archstone Multifamily Series I Trust
AVA Arts District GP, Inc.
Avalon 4100 Massachusetts Avenue, Inc.
Avalon Acton, Inc.
Avalon at Chestnut Hill, Inc.
Avalon at Great Meadow, Inc.
Avalon at St. Clare, Inc.
Avalon BFG, Inc.
Avalon Blue Hills, Inc.
Avalon Canton, Inc.
Avalon Chase Glen, Inc.
Avalon Chase Grove, Inc.
Avalon Chino Hills Manager, Inc.
Avalon Cohasset, Inc.
Avalon Collateral, Inc.
Avalon Commons, Inc.
Avalon DownREIT V, Inc.
Avalon Fairway Hills I Associates
Avalon Fairway Hills II Associates
Avalon Fairway II, Inc.
Avalon Glendora Manager, Inc.
Avalon Grosvenor LLC
Avalon Hayes Valley Manager, Inc.
Avalon Mission Oaks Manager, Inc.
Avalon Natick, Inc.
Avalon Oaks, Inc.
Avalon Oaks West, Inc.
Avalon Promenade, Inc.
Avalon Public Market GP, Inc.
Avalon Sharon, Inc.
Avalon Studio 77 GP, Inc.
Avalon Symphony Woods, Inc.
Avalon Twinbrook Station, Inc.
Avalon Upper Falls Limited Dividend Corporation
Avalon West Hollywood Manager, Inc.
AvalonBay Assembly Row, Inc.
AvalonBay Construction Services, Inc.
AvalonBay Grosvenor, Inc.
AvalonBay NYC Development, Inc.
AvalonBay Orchards, Inc.
AvalonBay Traville, LLC
AVB Development Transactions, Inc.
AVB Northborough, Inc.
AVB Realty Management Services, Inc.
Massachusetts
New Jersey
New York
Virginia
FOREIGN ENTITIES:
12
(Back To Top)
Exhibit 23.1
Consent of Independent Registered Public Accounting Firm We consent to the incorporation by reference in the following Registration Statements:
of our reports dated February 22, 2019, with respect to the consolidated financial statements and schedule of AvalonBay Communities, Inc. and the effectiveness of internal control over financial reporting of AvalonBay Communities, Inc. included in this Annual Report (Form 10-K) of AvalonBay Communities, Inc. for the year ended December 31, 2018.
AVB Service Provider, Inc.
Bay Asset Group, Inc.
Bay Development Partners, Inc.
Bay GP, Inc.
Brandywine Apartments of Maryland, LLC
California Multiple Financing, Inc.
California San Bruno III Financing, Inc.
Easton Avalon, Inc.
Georgia Avenue, Inc.
Hingham Shipyard Avalon II, Inc.
Juanita Construction, Inc.
Lexington Ridge-Avalon, Inc.
Norwood Avalon, Inc.
Pomorum Holdings, Inc.
Smith Realty Company
Sudbury Avalon, Inc.
855 Broadway Licensee, LLC
AvalonBay BFG Limited Partnership
Hingham Shipyard East Property Owners Association, Inc.
Smith Property Holdings Cronin’s Landing L.P.
Town Cove Jersey City Urban Renewal, Inc.
Town Run Associates
Avalon Huntington Former S Corp
Hillwood Square Mutual Association
Pomorum Renters Insurance Agency, LLC
Pomorum Insurance Company Ltd. (Bermuda)
Pomorum Renters Insurance Company, Ltd. (Bermuda)
Section 5: EX-23.1 (EXHIBIT 23.1)
(1) Registration Statements and Related Prospectuses (Forms S-3 No. 333-223183, No. 333-87063 and No. 333-107413) of AvalonBay Communities, Inc., and
(2) Registration Statements (Forms S-8 No. 333-216221, No. 333-161258 and No. 333-16837) pertaining to AvalonBay Communities, Inc.’s Deferred Compensation Plan, Equity Incentive Plan and 1994 Stock Incentive Plan and 1996 Non-Qualified Employee Stock Purchase Plan, respectively,
/s/ Ernst & Young LLP Tysons, VA February 22, 2019
(Back To Top)
Exhibit 31.1
CERTIFICATION
I, Timothy J. Naughton, certify that:
(Back To Top)
Exhibit 31.2
CERTIFICATION
I, Kevin P. O’Shea, certify that:
Section 6: EX-31.1 (EXHIBIT 31.1)
1. I have reviewed this annual report on Form 10-K of AvalonBay Communities, Inc.;
2. Based on my knowledge, this report does not contain any untrue statement of a material fact or omit to state a material fact necessary to make the statements made, in light of the circumstances under which such statements were made, not misleading with respect to the period covered by this report;
3. Based on my knowledge, the financial statements, and other financial information included in this report, fairly present in all material respects the financial condition, results of operations and cash flows of the registrant as of, and for, the periods presented in this report;
4. The registrant's other certifying officers and I are responsible for establishing and maintaining disclosure controls and procedures (as defined in Exchange Act Rules 13a - 15(e) and 15d - 15(e)) and internal control over financial reporting (as defined in Exchange Act Rules 13a - 15(f) and 15d - 15(f)) for the registrant and have:
(a) Designed such disclosure controls and procedures, or caused such disclosure controls and procedures to be designed under our supervision, to ensure that material information relating to the registrant, including its consolidated subsidiaries, is made known to us by others within those entities, particularly during the period in which this report is being prepared;
(b) Designed such internal control over financial reporting, or caused such internal control over financial reporting to be designed under our supervision, to provide reasonable assurance regarding the reliability of financial reporting and the preparation of financial statements for external purposes in accordance with generally accepted accounting principles;
(c) Evaluated the effectiveness of the registrant's disclosure controls and procedures and presented in this report our conclusions about the effectiveness of the disclosure controls and procedures, as of the end of the period covered by this report based on such evaluation; and
(d) Disclosed in this report any change in the registrant's internal control over financial reporting that occurred during the registrant's most recent fiscal quarter (the registrant's fourth fiscal quarter in the case of an annual report) that has materially affected, or is reasonably likely to materially affect, the registrant's internal control over financial reporting; and
5. The registrant's other certifying officers and I have disclosed, based on our most recent evaluation of internal control over financial reporting, to the registrant's auditors and the audit committee of the registrant's Board of Directors (or persons performing the equivalent functions):
(a) All significant deficiencies and material weaknesses in the design or operation of internal control over financial reporting which are reasonably likely to adversely affect the registrant's ability to record, process, summarize and report financial information; and
(b) Any fraud, whether or not material, that involves management or other employees who have a significant role in the registrant's internal control over financial reporting.
Date: February 22, 2019
/s/ TIMOTHY J. NAUGHTON
Timothy J. Naughton
Chairman, Chief Executive Officer and President
Section 7: EX-31.2 (EXHIBIT 31.2)
1. I have reviewed this annual report on Form 10-K of AvalonBay Communities, Inc.;
2. Based on my knowledge, this report does not contain any untrue statement of a material fact or omit to state a material fact necessary to make the statements made, in light of the circumstances under which such statements were made, not misleading with respect to the period covered by this report;

(Back To Top)
Exhibit 32
CERTIFICATION
The undersigned officers of AvalonBay Communities, Inc. (the "Company") hereby certify that the Company's annual report on Form 10-K to which this certification is attached (the "Report"), as filed with the Securities and Exchange Commission on the date hereof, fully complies with the requirements of Section 13(a) or 15(d), as applicable, of the Securities Exchange Act of 1934, as amended (the "Exchange Act"), and that the information contained in the Report fairly presents, in all material respects, the financial condition and results of operations of the Company.
This certification is being furnished and not filed, and shall not be incorporated into any document for any purpose, under the Securities Exchange Act of 1934 or the Securities Act of 1933. (Back To Top)
3. Based on my knowledge, the financial statements, and other financial information included in this report, fairly present in all material respects the financial condition, results of operations and cash flows of the registrant as of, and for, the periods presented in this report;
4. The registrant's other certifying officers and I are responsible for establishing and maintaining disclosure controls and procedures (as defined in Exchange Act Rules 13a - 15(e) and 15d - 15(e)) and internal control over financial reporting (as defined in Exchange Act Rules 13a - 15(f) and 15d - 15(f)) for the registrant and have:
(a) Designed such disclosure controls and procedures, or caused such disclosure controls and procedures to be designed under our supervision, to ensure that material information relating to the registrant, including its consolidated subsidiaries, is made known to us by others within those entities, particularly during the period in which this report is being prepared;
(b) Designed such internal control over financial reporting, or caused such internal control over financial reporting to be designed under our supervision, to provide reasonable assurance regarding the reliability of financial reporting and the preparation of financial statements for external purposes in accordance with generally accepted accounting principles;
(c) Evaluated the effectiveness of the registrant's disclosure controls and procedures and presented in this report our conclusions about the effectiveness of the disclosure controls and procedures, as of the end of the period covered by this report based on such evaluation; and
(d) Disclosed in this report any change in the registrant's internal control over financial reporting that occurred during the registrant's most recent fiscal quarter (the registrant's fourth fiscal quarter in the case of an annual report) that has materially affected, or is reasonably likely to materially affect, the registrant's internal control over financial reporting; and
5. The registrant's other certifying officers and I have disclosed, based on our most recent evaluation of internal control over financial reporting, to the registrant's auditors and the audit committee of the registrant's Board of Directors (or persons performing the equivalent functions):
(a) All significant deficiencies and material weaknesses in the design or operation of internal control over financial reporting which are reasonably likely to adversely affect the registrant's ability to record, process, summarize and report financial information; and
(b) Any fraud, whether or not material, that involves management or other employees who have a significant role in the registrant's internal control over financial reporting.
Date: February 22, 2019
/s/ KEVIN P. O’SHEA
Kevin P. O’Shea
Chief Financial Officer
Section 8: EX-32 (EXHIBIT 32)
Date: February 22, 2019
/s/ TIMOTHY J. NAUGHTON
Timothy J. Naughton
Chairman, Chief Executive Officer and President
/s/ KEVIN P. O’SHEA
Kevin P. O’Shea
Chief Financial Officer
Related Documents