Mathematics Vision Project | MVP Licensed under the Creative Commons Attribution-NonCommercial-ShareAlike 3.0 Unported license. Secondary Mathematics III: An Integrated Approach Module 8 Statistics By The Mathematics Vision Project: Scott Hendrickson, Joleigh Honey, Barbara Kuehl, Travis Lemon, Janet Sutorius www.mathematicsvisionproject.org In partnership with the Utah State Office of Education © 2014 Utah State Office of Education 1 1 Secondary Mathematics III

Welcome message from author
This document is posted to help you gain knowledge. Please leave a comment to let me know what you think about it! Share it to your friends and learn new things together.
Transcript

Mathematics Vision Project | MVP Licensed under the Creative Commons Attribution-NonCommercial-ShareAlike 3.0 Unported license.
Secondary Mathematics III:
An Integrated Approach
Module 8
Statistics
By
The Mathematics Vision Project:
Scott Hendrickson, Joleigh Honey,
Barbara Kuehl, Travis Lemon, Janet Sutorius www.mathematicsvisionproject.org
In partnership with the
Utah State Office of Education
© 2014 Utah State Office of Education
1 1
Secondary Mathematics III

Mathematics Vision Project | MVP
Licensed under the Creative Commons Attribution-NonCommercial-ShareAlike 3.0 Unported license.
Secondary Mathematics III Module 8 – Statistics
Classroom Task: 8.1 What is Normal? – A Develop Understanding Task Understand normal distributions and identify their features (S.ID.4) Ready, Set, Go Homework: Statistics 8.1 Classroom Task: 8.2 Just ACT Normal – A Solidify Understanding Task Use the features of a normal distribution to make decisions (S.ID.4) Ready, Set, Go Homework: Statistics 8.2 Classroom Task: 8.3 Y B Normal? – A Solidify Understanding Task Compare normal distributions using z scores (S.ID.4) Ready, Set, Go Homework: Statistics 8.3 Classroom Task: 8.4 Whoa! That’s Weird! – A Practice Understanding Task Compare normal distributions using z scores and understanding of mean and standard deviation (S.ID.4) Ready, Set, Go Homework: Statistics 8.4 Classroom Task: 8.5 Would You Like to Tray a Sample? – A Develop Understanding Task Understand and identify different methods of sampling (S.IC.1) Ready, Set, Go Homework: Statistics 8.5 Classroom Task: 8.6 Would You Like to Try a Sample? – A Develop Understanding Task Uses tables, graphs, equations, and written descriptions of functions to match functions and their inverses together and to verify the inverse relationship between two functions. (S.IC.2) Ready, Set, Go Homework: Statistics 8.6 Classroom Task: 8.7 Let’s Investigate – A Solidify Understanding Task Identify the difference between survey, observational studies, and experiments (S.IC.1, S.IC.2) Ready, Set, Go Homework: Statistics 8.7 Classroom Task: 8.8 Slacker’s Simulation – A Solidify Understanding Task Use simulation to estimate the likelihood of an event (S.IC.2, S.IC.3) Ready, Set, Go Homework: Statistics 8.8
2 2
Secondary Mathematics III

Mathematics Vision Project | MVP
Licensed under the Creative Commons Attribution-NonCommercial-ShareAlike 3.0 Unported license
8.1 What is Normal? A Develop Understanding Task
One very important type of data distribution is called a
“normal distribution.” In this case the word “normal”. In
this task, you will be given pair of data distributions
represented with histograms and distribution curves. In
each pair, one distribution is normal and one is not. Your job is to compare each of the distributions
given and come up with a list of features for normal distributions.
1. This is normal: This is not:
What differences do you see between these distributions?
_________________________________________________________________________________________________________________
2. This is normal: This is not:
What differences do you see between these distributions?
_________________________________________________________________________________________________________________
© 2
01
4 w
ww
.flic
kr.c
om
/ph
oto
s/K
ymb
erly
_Jan
isch
3 3
Secondary Mathematics III

Mathematics Vision Project | MVP
Licensed under the Creative Commons Attribution-NonCommercial-ShareAlike 3.0 Unported license
3. This is normal: This is not:
What differences do you see between these distributions?
_________________________________________________________________________________________________________________
4. This is normal: This is not:
What differences do you see between these distributions?
_________________________________________________________________________________________________________________
5. This is normal: This is not:
What differences do you see between these distributions?
_________________________________________________________________________________________________________________
4 4
Secondary Mathematics III

Mathematics Vision Project | MVP
Licensed under the Creative Commons Attribution-NonCommercial-ShareAlike 3.0 Unported license
6. This is normal: This is not:
What differences do you see between these distributions?
_________________________________________________________________________________________________________________
7. This is normal: This is not:
What differences do you see between these distributions?
_________________________________________________________________________________________________________________
9. Based upon the examples you have seen in #1-7, what are the features of a normal distribution?
10. a. What does the standard deviation tell us about a distribution?
b. Each of the distributions shown below are normal distributions with the same mean but
a different standard deviation.
5 5
Secondary Mathematics III

Mathematics Vision Project | MVP
Licensed under the Creative Commons Attribution-NonCommercial-ShareAlike 3.0 Unported license
Mean = 3, Standard Deviation = 0.5 Mean = 3, Standard Deviation = 1
Mean = 3, Standard Deviation = 0.25
How does changing the standard deviation affect a normal curve? Why does it have this effect?
____________________________________________________________________________________________________________
11. a. What does the mean tell us about a distribution?
b. Each of the distributions shown below are normal distributions with the same standard
deviation but a different mean.
Mean = 1, Standard Deviation = 0.25 Mean = 2, Standard Deviation = 0.25
6 6
Secondary Mathematics III

Mathematics Vision Project | MVP
Licensed under the Creative Commons Attribution-NonCommercial-ShareAlike 3.0 Unported license
Mean = 3, Standard Deviation = 0.25
How does changing the mean affect a normal curve? Why does it have this effect?
_____________________________________________________________________________________________________________
12. Now that you have figured out some of the features of a normal distribution, determine if the
following statements are true or false. In each case, explain your answer.
a. A normal distribution depends on the mean and the standard deviation.
True/False Why?
b. The mean, median, and mode are equal in a normal distribution.
True/False Why?
c. A normal distribution is bimodal.
True/False Why?
d. In a normal distribution, 50% of the population is within one standard deviation of the mean.
True/False Why?
7 7
Secondary Mathematics III

Name Statistics 8.1
Mathematics Vision Project | MVP Licensed under the Creative Commons Attribution-‐NonCommercial-‐ShareAlike 3.0 Unported license
Ready, Set, Go
Ready Topic: Standard Deviations, Percentiles
1. Jordan scores a 53 on his math test. The class average is 57 with a standard deviation of 2 points. How many standard deviations below the mean did Jordan score?
2. In Jordan’s science class, he scored a 114. The class average was a 126 with a standard deviation of 6 points. How many standard deviations below the mean did Jordan score? In comparison to his peers, which test did Jordan perform better on?
3. Rank the data sets below in order of greatest standard deviation to smallest:
𝐴 = 1,2,3,4 B = 2,2,2,2, C = 2,4,6,8 D = 4,5,6,7 E = 1,1.5,2,2.5
4. Robin made it to the swimming finals for her state championship meet. The times in the finals were as follows:
2: 10.3, 2: 12.5, 2: 12.7, 2: 12.38, 2: 20.45, 2: 21.43
If Robin’s time was a 2:12.7, what percent of her competitors did she beat?
5. Remember that in statistics, 𝜇 is the symbol for mean and 𝜎 is the symbol for standard deviation. Using technology, identify the mean and standard deviation for the data set below:
{1.23, 1.3, 1.1, 1.48, 1, 1.14, 5.21, 5.1, 4.63}
𝜇 = 𝜎 =
© 201
4 www.flickr.com
/pho
tos/Kymbe
rly_Janisc
h
8 8
Secondary Mathematics III

Name Statistics 8.1
Mathematics Vision Project | MVP Licensed under the Creative Commons Attribution-‐NonCommercial-‐ShareAlike 3.0 Unported license
6. For the data in number 5, what time would fall one standard deviation above the mean?
Three standard deviations below the mean?
Set Topic: Properties of Normal Curves
7. For each distribution, identify the properties that match with a Normal Distribution, and then decide if the distribution is Normal or not.
A.
Normal Properties: Normal? Yes or No
B.
Normal Properties: Normal? Yes or No
C.
Normal Properties: Normal? Yes or No
9 9
Secondary Mathematics III

Name Statistics 8.1
Mathematics Vision Project | MVP Licensed under the Creative Commons Attribution-‐NonCommercial-‐ShareAlike 3.0 Unported license
D.
Normal Properties: Normal? Yes or No
E. Mean = 0 Median = 0.1 Mode = 0.1
Normal Properties: Normal? Yes or No
F Mean: 68 Median: 68 Mode: 68
Normal Properties: Normal? Yes or No
10 10
Secondary Mathematics III

Name Statistics 8.1
Mathematics Vision Project | MVP Licensed under the Creative Commons Attribution-‐NonCommercial-‐ShareAlike 3.0 Unported license
8. If two Normal distributions have the same standard deviation of 4.9 but different means of 3 and 6, how will the two Normal curves look in relation to each other? Draw a sketch of each Normal curve below.
9. If two Normal distributions have the same mean of 3 but standard deviations of 1 and 4, how will they look in relation to each other? Draw a sketch of each Normal curve below.
10. Several Normal curves are given below. Estimate the standard deviation of each one.
A___________
B___________
C___________
11 11
Secondary Mathematics III

Name Statistics 8.1
Mathematics Vision Project | MVP Licensed under the Creative Commons Attribution-‐NonCommercial-‐ShareAlike 3.0 Unported license
Go
Topic: Inverses
Write the inverse of the given function in the same format as the given function:
11. 𝑓 𝑥 = 3𝑥! + 2 12. 𝑔 𝑥 = !!!!!
13. ℎ 𝑥 = 3 + 2𝑥 − 1 14.
Determine if the following functions are inverses by finding 𝒇 𝒈 𝒙 𝒂𝒏𝒅 𝒈 𝒇 𝒙 .
15. 𝑓 𝑥 = 2𝑥 + 3 and 𝑔 𝑥 = !!𝑥 − !
! 16. 𝑓 𝑥 = 2𝑥! − 3 and 𝑔 𝑥 = !!
!+ 3
12 12
Secondary Mathematics III

Mathematics Vision Project | MVP
Licensed under the Creative Commons Attribution-NonCommercial-ShareAlike 3.0 Unported license
8.2 Just ACT Normal A Solidify Understanding Task
1. One of the most common examples of a normal
distribution is the distribution of scores on
standardized tests like the ACT. In 2010, the mean
score was 21 and the standard deviation was 5.2
(Source: National Center for Education Statistics). Use this information to sketch a normal
distribution curve for this test.
2. Use technology to check your graph. Did you get the points of inflection in the right places?
(Make adjustments, if necessary.)
3. In “What Is Normal”, you learned that the 68 – 95 – 99.7 rule. Use the rule to answer the
following questions:
a. What percentage of students scored below 21?
b. About what percentage of students scored below 16?
c. About what percentage of students scored between 11 and 26?
© 2
01
4 w
ww
.flic
kr.c
om
/ph
oto
s/A
lber
togp
12
3
13 13
Secondary Mathematics III

Mathematics Vision Project | MVP
Licensed under the Creative Commons Attribution-NonCommercial-ShareAlike 3.0 Unported license
3. Your friend, Calvin, would like to go to a very selective college that only admits the top 1% of all
student applicants. Calvin has good grades and scored 33 on the test. Do you think that Calvin’s
ACT score gives him a good chance of being admitted? Explain your answer.
4. Many students like to eat microwave popcorn as they study for the ACT. Microwave popcorn
producers assume that the time it takes for a kernel to pop is distributed normally with a mean of
120 seconds and a standard deviation of 13 for a standard microwave oven. If you’re a devoted
popcorn studier, you don’t want a lot of un-popped kernels, but you know that if you leave the bag
in long enough to be sure that all the kernels are popped, some of the popcorn will burn. How much
time would you recommend for microwaving the popcorn? Use a normal distribution curve and the
features of a normal distribution to explain your answer.
14 14
Secondary Mathematics III

Name Statistics 8.2
© 2014 Mathematics Vision Project | MVP Licensed under the Creative Commons Attribution-‐NonCommercial-‐ShareAlike 3.0 Unported license
Ready, Set, Go!
Ready
Topic: Law of Large Numbers
1. You and your friend are rolling one die over and over again. After 6 rolls, your friend has rolled four fives. Are you surprised by these results? Explain
2. After rolling the die 50 times, you know notice that your rolled a total of 20 fives. Are you surprised now? Explain.
3. You survey 100 people in your school and ask them if they feel your school has adequate parking. Only 30% of the sample feels the school has enough parking. If you have 728 students total in your school, how many would you expect out of all the student body that felt there was enough parking?
Set Topic: Normal Curves
4. The population of NBA players is Normally distributed with a mean of 6’7” and a standard deviation of 3.9 inches. (wikepdia) Greg is considered unusually tall for his high school at 6’ 2”.
a. What percent of NBA players are taller than Greg?
b. What percent are shorter?
c. How tall would Greg have to be in order to be in the top 2.5% of NBA player heights?
© 201
4 www.flickr.com
/pho
tos/Albe
rtogp1
23
15 15
Secondary Mathematics III

Name Statistics 8.2
© 2014 Mathematics Vision Project | MVP Licensed under the Creative Commons Attribution-‐NonCommercial-‐ShareAlike 3.0 Unported license
5. The average height of boy’s at Greg’s school is 5’6” with a standard deviation of 2 “. If we assume the population is Normal,
a. What percent of students is Greg taller than in his school?
b. What percent of students are between 5’ and 5’8”?
6. Jordan is drinking a cup of hot chocolate. From previous research, he knows that it takes a cup of hot chocolate 10 minutes to reach a temperature where his tongue will not burn. The time it takes the chocolate to cool varies Normally with a standard deviation of 2 minutes.
a. How long should he wait to drink his hot chocolate if he wants to be 84% sure that he won’t burn himself?
b. If he waits 8 minutes, what percent of the time will he burn his tongue?
Go Topic: Logarithms
Use the properties of logarithms to expand the expression as a sum or difference, and or constant multiple of logarithms. (Assume all variables are positive.)
7. log! 3𝑥 8. log!!! 9. ln∛𝑥 10. log !
!!!!
!!!
11. log!!"!!!!"
!! 12. log !
!!!"!!!"!
13. log! 27𝑥! 14. log 10! 𝑦
16 16
Secondary Mathematics III

Mathematics Vision Project | MVP
Licensed under the Creative Commons Attribution-NonCommercial-ShareAlike 3.0 Unported license
8.3 Y B Normal? A Solidify Understanding Task
As a college admissions officer, you get to evaluate
hundreds of applications from students that want to
attend your school. Many of them have good grades,
have participated in school activities, have done service
within their communities, and all kinds of other
attributes that would make them great candidates for attending the college you represent. One part
of the application that is considered carefully is the applicants score on the college entrance
examination. At the college you work for, some students have taken the ACT and some students
have taken the SAT.
You have to make a final decision on two applicants. They are both wonderful students with the
very same G.P.A. and class rankings. It all comes down to their test scores. Student A took the ACT
and received a score of 29 in mathematics. Student B took the SAT and received a score of 680 in
mathematics. Since you are an expert in college entrance exams, you know that both tests are
designed to be normally distributed. A perfect ACT is 36. The ACT mathematics section has a mean
of 21 and standard deviation of 5.3. (Source: National Center for Education Statistics 2010) A
perfect score on the SAT math section is 800. The SAT mathematics section has a mean of 516 and
a standard deviation of 116. (Source: www.collegeboard.com 2010 Profile).
1. Based only on their test scores, which student would you choose and why?
This analysis is starting to make you hungry, so you call your friend in the Statistics Department at
the university and ask her to go to lunch with you. During lunch, you tell her of your dilemma. The
conversation goes something like this:
You: I’m not sure that I’m making the right decision about which of two students to admit to the
university. Their entrance exam scores seem like they’re in about the same part of the distribution,
but I don’t know which one is better. It’s like trying to figure out which bag of fruit weighs more
© 2
01
4 w
ww
.flic
kr.c
om
/ph
oto
s/Lo
uis
_Sh
ackl
eto
n
17 17
Secondary Mathematics III

Mathematics Vision Project | MVP
Licensed under the Creative Commons Attribution-NonCommercial-ShareAlike 3.0 Unported license
when one is measured in kilograms and one is measured in pounds. They might look like about the
same amount, but you can’t tell the exact difference unless you put them on the same scale or
convert them to the same units.
Statistician: Actually, there is a way to make comparisons on two different normal distributions
that is like converting the scores to the same unit. The scale is called the “standard normal
distribution”. Since it was invented to make it easy to think about a normal distribution, they set it
up so that the mean is 0 and the standard deviation is 1.
Here’s what your statistician friend drew on her napkin to show you the standard normal
distribution:
You: Well, that looks just like the way I always think of normal distributions.
Statistician: Yes, it’s pretty simple. When we use this scale, we give things a z-score. A z-score of 1
means that it’s 1 standard deviation above the mean. A z-score of -1.3 means that it is between 1
and 2 standard deviations below the mean. Easy-peasy.
What’s even better is that when we have a z-score there are tables that will show the area under the
curve to the left of that score. For a test score like the ACT or SAT, it shows the percentage of the
population (or sample) that is below that score. I’ve got a z-score table right here in my purse. See,
the z-score is -1.3, then 9.68% of the population scored less. You can also say that 90.32% of the
population scored better, so -1.3 wouldn’t be a very good score on a test.
Try it: Let’s say you had two imaginary test takers, Jack and Jill. Jack’s z-score was 1.49 and Jill’s z-
score was 0.89.
2. What percent of the test takers scored below Jack? What percent scored above Jack?
3. What percent of the test takers scored below Jill? What percent scored above Jill?
18 18
Secondary Mathematics III

Mathematics Vision Project | MVP
Licensed under the Creative Commons Attribution-NonCommercial-ShareAlike 3.0 Unported license
4. What percent of the test takers scored between Jack and Jill?
5. Jack and Jill’s friend, Jason, scored -1.49. Find the number of test takers that scored above
him without using a table or technology. Explain your strategy.
You: That’s very cool, but the two scores I’m working with are not given as z-scores. Is there some
way that I can transform values from some normal distribution like the scores on the ACT or SAT to
z-scores?
Statistician: Sure. The scale wouldn’t be so amazing if you couldn’t use it for any normal
distribution. There’s a little formula for transforming a data point from any normal distribution to
a standard normal distribution:
z-score = 𝑑𝑎𝑡𝑎 𝑝𝑜𝑖𝑛𝑡−𝑚𝑒𝑎𝑛
𝑠𝑡𝑎𝑛𝑑𝑎𝑟𝑑 𝑑𝑒𝑣𝑖𝑎𝑡𝑖𝑜𝑛
6. So, if you have an ACT score of 23. The mean score on the ACT is 21 and the standard
deviation is 5.2. What would you estimate the z-score to be?
7. Let’s use the formula to figure it out: z-score = 23−21
5.2 . How was your estimate? Explain
why this value is reasonable.
You: That’s great. I’m going back to the office to decide which student is admitted.
8. Compare the scores of Student A and Student B. Explain which student has the highest
mathematics test score and why.
19 19
Secondary Mathematics III

Name Statistics 8.3
© 2014 Mathematics Vision Project | MVP Licensed under the Creative Commons Attribution-‐NonCommercial-‐ShareAlike 3.0 Unported license
Ready, Set, Go!
Ready
Topic: Probability
At South Beach High School, there are 2500 students attending. Mariana surveys 40 of her friends where they prefer to eat lunch. She created the following two-‐way table showing her results:
9th Grade 10th Grade 11th Grade 12th Grade Totals School Cafeteria
18 6 2 1 28
Off Campus 2 4 3 4 12 Totals 20 10 5 5 40
Mariana plans to use her data to answer the following questions:
I. Do students prefer to eat on campus or off campus overall? II. Is there a difference between grade levels for where students prefer to eat lunch?
1. In Mariana’s sample, what percent of students prefer school lunch?
What percent prefer to eat off campus?
2. For each grade level in her sample, determine the percent of students that prefer school lunch and the percent that prefer off campus lunch. Do you notice anything unusual?
3. Based on her sample, Mariana concludes that students at South Beach High school overall like school lunch. Do you agree or disagree? Why?
© 201
4 www.flickr.com
/pho
tos/Louis_Shackleton
20 20
Secondary Mathematics III

Name Statistics 8.3
© 2014 Mathematics Vision Project | MVP Licensed under the Creative Commons Attribution-‐NonCommercial-‐ShareAlike 3.0 Unported license
Set
A company makes a mean monthly income of $20,300 with a standard deviation of $3,200. In one given month the company makes $29,500.
4. Find the z-‐score.
5. Assuming the companies monthly income is Normal, what percent of the time does the company make more than this amount? Less than?
6. What percent of the time does the company make between $15,000 and $25,000?
7. If the company needs to make $16,400 in order to break even, how likely in a given month is the company to make a profit?
On the Wechsler Adult Intelligence Scale, an average IQ is 100 with a standard deviation of 15 units. (Source: http://en.wikipedia.org/wiki/Intelligence_quotient)
8. IQ scores between 90 and 109 are considered average. Assuming IQ scores follow a Normal distribution, what percent of people are considered average?
9. One measure of Genius is an IQ score of above 135. What percent of people are considered genius?
10. Einstein had an IQ score of 160. What is his z-‐score?
11. What is the probability of an individual having a higher IQ than Einstein?
21 21
Secondary Mathematics III

Name Statistics 8.3
© 2014 Mathematics Vision Project | MVP Licensed under the Creative Commons Attribution-‐NonCommercial-‐ShareAlike 3.0 Unported license
Go Topic: Sketching Polynomials
Without using technology, sketch the graph of a polynomial function with the given characteristics.
12. A quartic function with a leading coefficient of -‐2 with one double zero and two complex roots.
13. 𝑓 𝑥 = 𝑥 + 2 ! 𝑥 − 3 !
14. 𝑔 𝑥 = −2 𝑥 − 3 ! 𝑥 + 5 2𝑥 − 5 !
15. A cubic function with a leading coefficient of 4 and three positive roots.
22 22
Secondary Mathematics III

Mathematics Vision Project | MVP
Licensed under the Creative Commons Attribution-NonCommercial-ShareAlike 3.0 Unported license
8.4 Whoa! That’s Weird! A Practice Understanding Task
Each of the stories below are based upon normal distributions.
Rank order these stories from most unusual to most average.
(1 is the most unusual, 6 is the most average.) In each case,
explain your ranking.
A. The number of red loops in a box of Tutti-Frutti-O’s is
normally distributed with mean of 800 loops and standard deviation 120. Tony bought a
new box, opened it, and counted 1243 red loops. (It didn’t really matter because all the
colors are the same flavor anyway.)
Rank _________ Explanation: _________________________________________________________________________________
B. The weight of house cats is normally distributed with a mean of 10 pounds and standard
deviation 2.1 pounds. My cat, Big Boy, weighs 6 pounds.
Rank _________ Explanation: _________________________________________________________________________________
C. The lifetime of a battery is normally distributed with a mean life of 40 hours and a standard
deviation of 1.2 hours. I just bought a battery and it died after just 20 hours
Rank _________ Explanation: _________________________________________________________________________________
D. The amount that a human fingernail grows in a year is normally distributed with a mean
growth of 3.5 cm and a standard deviation of 0.63 cm. My neighbor’s thumbnail grew all
year without breaking and it is 4.6 cm long with stars and stripes painted on it.
Rank _________ Explanation: _________________________________________________________________________________
E. My little brother was digging in the garden and found a giant earthworm that was 35 cm
long. The length of earthworms is normally distributed with a mean length of 14 cm and a
standard deviation of 5.3 cm.
Rank _________ Explanation: _________________________________________________________________________________
F. The mean length of a human pregnancy is 268 days with a standard deviation of 16 days.
My aunt just had a premature baby delivered after only 245 days.
Rank _________ Explanation: _________________________________________________________________________________
© 2
01
4 w
ww
.flic
kr.c
om
/ph
oto
s/m
att_
maj
ewsk
i
23 23
Secondary Mathematics III

Name Statistics 8.4
Mathematics Vision Project | MVP Licensed under the Creative Commons Attribution-‐NonCommercial-‐ShareAlike 3.0 Unported license
Ready, Set, Go!
Ready Topic: Two-‐Way Tables
The data below is the data from Mrs. Hender’s class. Students needed to score a 60% or better to pass the test.
1st hour: 2nd hour: 3rd hour: 72, 83, 56, 63, 89, 92, 92, 67, 88, 84, 67, 97, 96, 100, 84, 82
80, 83, 81, 81, 67, 90, 70, 71, 72, 77, 81, 85, 86, 77, 74, 51
51, 45, 67, 83, 99, 100, 94, 52, 48, 46, 100, 59, 65, 56, 72, 63
1. Make a two-‐way frequency table showing how many students passed the test and how many failed each class.
1st 2nd 3rd Total Passed Failed
2. What percent of students passed Mrs. Hender’s test in each class? What is the total percent that passed?
3. Use the data from all three classes to create a histogram. What properties of the Normal curve does your histogram have?
4. If Mrs. Hender’s were going to predict her total pass rate using only 2nd hour, would she have a good prediction? Explain why or why not.
© 201
4 www.flickr.com
/pho
tos/matt_majew
ski
24 24
Secondary Mathematics III

Name Statistics 8.4
Mathematics Vision Project | MVP Licensed under the Creative Commons Attribution-‐NonCommercial-‐ShareAlike 3.0 Unported license
Set Topic: Normal Curves
5. Five track athletes are in the running for the Athletic Performance of the Year award. A panel of coaches is trying to decide which athlete is the most deserving to win the award. Rank each athlete below by the given information. Assume all distributions follow a Normal Curve.
a. Javier threw the Javelin 215 ft. The average Javelin throw is 152.08 ft. with a standard deviation of 15.85 ft.
b. Chance ran a 400m time of 46.99 seconds. The average 400m time was 52.6, with a standard deviation of 1.01 seconds.
c. Derick ran a 36.26 in the 300m Hurdles. The average time was 41.77 with a standard deviation of 1.49 seconds.
d. Chad ran a 100m time of 10.59 seconds. The average time was 11.603 seconds with a standard deviation of .29 seconds.
e. Kayden threw the discus 180 ft. The average throw was 122.4 ft. with a standard deviation of 14.38 ft.
Go Topic: Logarithms Solve each equation below for x by applying properties for exponents and logarithms.
6. 2!!! = 128 7. !!"#
= 27 8. 3!!! = 27!!!
9. log 2𝑥 + 4 − log 3𝑥 = 0 10. log! 2𝑥! + 4𝑥 − 2 − log! 10 = 0
11. !" !!!!" !!!!
= 1 12. !"# !!!!!"#!"
= 1 13. !"#! !!!!!"#! !"
= 1
25 25
Secondary Mathematics III

Mathematics Vision Project | MVP
Licensed under the Creative Commons Attribution-NonCommercial-ShareAlike 3.0 Unported license
8.5 Would You Like to Try a Sample? A Develop Understanding Task
In the task Whoa! That’s Weird!, you saw a number of
statistics for things like the average weight of a house
cat. You know it would be impossible to measure all the
house cats to find their average weights, but scientists
still claim to know it.
You’ve probably heard it many times before: “Survey results show that 54% of Americans believe
that. . .” You’re sure that you didn’t participate in the survey and neither did anyone you know, and
yet, the researchers claim that the survey represents the beliefs of all Americans.
How can this be possible? In the next few tasks, we’ll explore how statistics allow us to draw
conclusions about an entire group without actually working with the entire group. Sometimes the
results make sense and other times you might think that they just can’t be right. We will learn how
to make judgments about statistical studies, based on the methods that have been used.
First, we need to get our terms straight. When we talk about the entire group that we are
interested in, that is called the population. When some members of the group are selected to
represent the entire group, that is called a sample. The thing we are interested in knowing about
the population is the parameter of interest.
For each of the scenarios below, identify the population, the sample and the population parameter
of interest.
1. A grocery store wants to know the average number of items that shoppers purchase in each
visit to the store. They decide to count the items in the cart of every twentieth person
through the check stand.
Population _______________________________________________________________________________________
Sample ___________________________________________________________________________________________
Parameter of interest ___________________________________________________________________________
2. A team of biologist wants to know the average weight of fish in a lake. They decide to drop a
net and measure all the fish caught in three different locations in the lake.
Population _______________________________________________________________________________________
© 2
01
4 w
ww
.flic
kr.c
om
/ph
oto
s/M
r_T_
in_D
C
26 26
Secondary Mathematics III

Mathematics Vision Project | MVP
Licensed under the Creative Commons Attribution-NonCommercial-ShareAlike 3.0 Unported license
Sample ___________________________________________________________________________________________
Parameter of interest ___________________________________________________________________________
3. There are lots of different ways that a sample can be chosen from a population. Group the
following examples of ways to select a sample into six categories.
A. You are in charge of school activities. You want to know what activities students would
prefer to participate in during the school year. You decide to put the name of each student
in the school into a big bowl. You draw 100 names and ask those students to respond to a
survey about the activities they prefer.
B. You are in charge of school activities. You want to know what activities students would
prefer to participate in during the school year. You assign each student in the school a
number. You randomly select a starting number among the first 10 numbers and then
select every tenth student in the list from that point forward.
C. You are in charge of school activities. You want to know what activities students would
prefer to participate in during the school year. You use the rolls from each homeroom class.
You put the all the names from one class into the bowl and draw two names from the class.
You go through each homeroom class, drawing 2 names from each class. You ask those
students to respond to a survey about the activities they prefer.
D. You are in charge of school activities. You want to know what activities students would
prefer to participate in during the school year. You get the list of all the homeroom classes
and randomly select 5 classes. You go to each of the classes selected and survey all the
students in that class.
E. You are in charge of school activities. You want to know what activities students would
prefer to participate in during the school year. You stand in the cafeteria during your lunch
break and ask students in they would be willing to participate in your survey as they walk
by.
F. You are in charge of school activities. You want to know what activities students would
prefer to participate in during the school year. You use the rolls from each homeroom class.
You put the all the names from one class into the bowl and draw two names from the class.
You go through each homeroom class, drawing 2 names from each class. You ask those
students to respond to a survey about the activities they prefer.
G. You are in charge of school activities. You want to know what activities students would
prefer to participate in during the school year. You make a lot of copies of the survey about
27 27
Secondary Mathematics III

Mathematics Vision Project | MVP
Licensed under the Creative Commons Attribution-NonCommercial-ShareAlike 3.0 Unported license
the activities that students prefer and you put them on a table outside the cafeteria.
Students can choose to take the survey and drop their responses into a big box on the table.
H. You are interested in finding out the percent of residents in the city that have experienced a
robbery in the past year. Using the city property records, you assign each residence a
number. You use a random number generator to give you a list of numbers. You contact the
residence that corresponds to that number to ask your questions.
I. You want to know the average number of hours that high school seniors spend playing
video games in your state. You randomly select 20 high schools in the state and then ask all
the seniors at each of the 20 high schools about their video game habits.
J. An auto analyst is conducting a satisfaction survey, sampling from a list of 10,000 new car
buyers. The list includes 2,500 Ford buyers, 2,500 GM buyers, 2,500 Honda buyers, and
2,500 Toyota buyers. The analyst selects a sample of 400 car buyers, by randomly sampling
100 buyers of each brand.
K. A shopping mall management company would like to know the average amount that
shoppers in the mall spend during their visit. They post two survey takers near one of the
exits who ask shoppers to tell them what they spent as they leave the mall.
L. A restaurant owner wants to find out the average number of dishes ordered at each table
served on Friday evenings, their busiest time. She decides to collect and analyze every fifth
receipt of the night, starting at 6:00 p.m.
M. N.
28 28
Secondary Mathematics III

Mathematics Vision Project | MVP
Licensed under the Creative Commons Attribution-NonCommercial-ShareAlike 3.0 Unported license
O. P.
4. What might be some of the advantages and disadvantages of each type?
5. A person you know owns a small theater that shows local dramatic productions. She wants to
know the average age of the people that buy tickets to the see the shows so that she can better
select which plays to stage. Explain to the owner why selecting the first 20 people that arrive
for the show may not be a representative sample.
6. Describe a process for selecting a representative sample of the theater patrons.
29 29
Secondary Mathematics III

Name Statistics 8.5
© 2014 Mathematics Vision Project | MVP Licensed under the Creative Commons Attribution-‐NonCommercial-‐ShareAlike 3.0 Unported license
Ready, Set, Go!
Ready Topic: Causation
When collecting data, statisticians are often interested in making predictions. Sometimes, statisticians simply want to know if one variable explains another variable. Often times, statisticians want to determine if one variable actually causes a change in another variable. Given the examples below, decide whether you think the variables simply explain each other, or if you think one variable would cause the other to change.
1. As the amount of food Ollie the elephant eats increases her weight also increases. (Explains/Causes)
2. As Popsicle sales go up in the summer, the number of drownings also increases. (Explains/Causes)
3. As Erika’s feet grow longer, she grows taller. (Explains/Causes)
4. As Tabatha gets older, her reading score improves in school. (Explains/Causes)
Set
For the following scenarios, identify the population, sample and parameter of interest.
5. The local school board wants to get parents to evaluate teachers. They select 100 parents and find that 89% approve of their child’s teacher.
Population: Sample: Parameter:
6. Jarret wants to know the average height of the students in his school. There are 753 students in his high school; he finds the heights of 52 of them.
Population: Sample: Parameter:
7. A government official is interested in the percent of people at JFK airport that are searched by security. He watches 300 people go through security and observes 42 that are searched.
Population: Sample: Parameter:
© 201
4 www.flickr.com
/pho
tos/Mr_T_in_D
C
30 30
Secondary Mathematics III

Name Statistics 8.5
© 2014 Mathematics Vision Project | MVP Licensed under the Creative Commons Attribution-‐NonCommercial-‐ShareAlike 3.0 Unported license
For each scenario, identify what type of sampling was used to obtain the sample. Explain whether or not you think the sample will be representative of the population it was sampled from:
8. Elvira surveys the first 60 students in the lunch line to determine if students at the school are satisfied with school lunch.
Type of sample: Representative? Explain.
9. Elvira selects every 5th student in the lunch line to determine if students at the school are satisfied with school lunch.
Type of sample: Representative? Explain.
10. Elvira randomly selects 7 different tables in the lunchroom and surveys every student on the table to determine if students at the school are satisfied with school lunch.
Type of sample: Representative? Explain.
11. Elvira assigns every student in the school a number and randomly selects 60 students to survey to determine if student at the school are satisfied with school lunch.
Type of sample: Representative? Explain.
12. Elvira wants to determine if students are satisfied with school lunch. She leaves surveys on a table for students to answer as the walk by.
Type of sample: Representative? Explain.
13. Elvira wants to determine if students are satisfied with school lunch. She wants to include input from each grade level at the high school. She randomly surveys 25 freshman, 25 sophomores, 25 juniors, and 25 seniors.
Type of sample: Representative? Explain.
31 31
Secondary Mathematics III

Name Statistics 8.5
© 2014 Mathematics Vision Project | MVP Licensed under the Creative Commons Attribution-‐NonCommercial-‐ShareAlike 3.0 Unported license
Go Topic: Graphs of Trig Functions
For each function identify the amplitude, period, horizontal shift, vertical shift and the endpoints of the primary interval.
14. 𝑓 𝑡 = 120 cos !!𝑡 − 3 + 30 15. 𝑓 𝑡 = 3.5 sin !
!𝑡 + !
!+ 7
Amplitude: Amplitude:
Period: Period:
Horizontal Shift: Horizontal Shift:
Vertical Shift: Vertical Shift:
End Points: End Points:
15. Graph 𝑓 𝑥 = !!sin 𝑥 − 3 + 2.
32 32
Secondary Mathematics III

Mathematics Vision Project | MVP
Licensed under the Creative Commons Attribution-NonCommercial-ShareAlike 3.0 Unported license
8.6 Let’s Investigate A Solidify Understanding Task
When we want to draw conclusions about some
population, there are at least two different statistical
ideas to consider. We learned about sampling in
Would You Like to Try a Sample, since it is usually
more practical to sample the population rather than
somehow measure everyone or everything in the
population.
The second thing to consider is how to measure the parameter of interest, the thing we want to
know about the population. Sometimes it’s obvious, like if you want to know the average weight of
a population, you determine a sample and then put each of the subjects on a scale. Three other
techniques are the following:
Surveys: When they want to know how people feel, what their preferences are, what they
own, how much they make, etc., researchers often construct a survey to ask the people in
the sample about the parameter of interest.
Observational Studies: In this type of study, researchers observe the behavior of the
participants/subjects without trying to influence it in any way so they can learn about the
parameter of interest.
Experiments: In an experiment, researchers manipulate the variables to try to determine
cause and effect.
1. Imagine that you want to know whether a new diet plan is effective in helping people lose
weight. You might choose any of the three methods to determine this.
If you used a survey, you could simply ask people that had tried the diet plan in they lost weight.
If you used an observational study, you might monitor volunteers that try the diet plan and
measure how much weight they lost.
If you used an experiment, you might randomly assign participants to two groups. One group (the
control group) eats as they normally would and the other group (the experimental group) eats
according to the diet plan. At the end of two months, the two groups are compared to see the
average weight gain or loss in each group.
Based on these three examples,
a. What are some possible advantages and disadvantages of surveys?
© 2
01
4 w
ww
.flic
kr.c
om
/ph
oto
s/M
r_T_
in_D
C
33 33
Secondary Mathematics III

Mathematics Vision Project | MVP
Licensed under the Creative Commons Attribution-NonCommercial-ShareAlike 3.0 Unported license
b. What are some possible advantages and disadvantages of observational studies?
c. What are some possible advantages and disadvantage of experiments?
2. Identify which method is illustrated by each example:
a. To determine whether drinking orange juice prevents colds, researchers randomly assigned
participants to a group that drank no orange juice or a group that drank two glasses of orange juice
a day. They measured the number of colds that each group had over the course of the year and
compared the results of the two groups.
b. To determine whether exercise reduces the number of headaches, researchers randomly
selected a group of participants and recorded the number of hours each participant exercised and
the number of headaches each participant experienced.
c. To determine the effectiveness of a new advertising campaign, a restaurant asked every tenth
customer if they had seen the advertisement, and if it had influenced their decision to visit the
restaurant.
d. To determine if a new drug is an effective treatment for the flu, researchers randomly selected
two groups of people that had the flu. One group was given a placebo (a sugar pill that has no
physical effect) and one group was given the new drug. Researchers measured the number of days
that participants experienced flu symptoms and compared the two groups to see if they were
different.
e. To determine if higher speed limits cause more traffic fatalities, researchers compared the
number of traffic deaths on randomly selected stretches of highway with 65 mph speed limits to the
number of traffic deaths on an equal number of randomly selected stretches of highway with 75
mph speed limits.
3. Describe how you might select a sample and use a survey to investigate which soft drink people
prefer: Soda A or Soda B.
4. Describe how you might select a sample and use an observational study to investigate which soft
drink people prefer: Soda A or Soda B.
34 34
Secondary Mathematics III

Mathematics Vision Project | MVP
Licensed under the Creative Commons Attribution-NonCommercial-ShareAlike 3.0 Unported license
5. Describe how you might select a sample and use an experiment to investigate if consuming large
quantities of Soda A causes headaches.
6. Describe the method you would use to determine if excessive texting causes bad grades. Explain
why you chose that method and what conclusions could be drawn from the study.
35 35
Secondary Mathematics III

Statistics 8.6
© 2014 Mathematics Vision Project | MVP Licensed under the Creative Commons Attribution-‐NonCommercial-‐ShareAlike 3.0 Unported license
Ready, Set, Go!
Ready Topic: Finding probabilities from a two-‐way table. The following data represents a random sample of boys and girls and how many prefer cats or dogs. Use the information to answer the questions below. Cats Dogs Total Boys 32 68 100 Girls 41 11 52 Total 73 79 152 1. 𝑃 𝐵 = 2. 𝑃 𝐺 = 3. 𝑃 𝐶 = 4. 𝑃 𝐷 = 5. 𝑃 𝐶 𝐺 = 6. 𝑃 𝐶 𝑜𝑟 𝐵 = 7. 𝑃 𝐷 𝐵 = 8. 𝑃 𝐵 ∩ 𝐷 = 9. If this is a random sample from a school, what total percent of boys in this school do you think would prefer dogs? 10. What percent of students at the school would prefer cats? 11. If you sampled a different 152 students, would you get the same percentages? Explain. 12. What would happen to your percentages if you used a larger sample size?
Set
For the following scenarios, identify each situation as a survey, observational study, or an experiment.
© 2014 www.flickr.com/photos/Mr_T_in_DC
36 36
Secondary Mathematics III

Statistics 8.6
© 2014 Mathematics Vision Project | MVP Licensed under the Creative Commons Attribution-‐NonCommercial-‐ShareAlike 3.0 Unported license
13. To determine if a new pain medication is effective, researchers randomly assign two groups of people to use the pain medication in group 1 and a placebo in group 2. Both groups are asked to rate their pain and the results are compared. 14. Officials want to determine if raising the speed limit from 75 mph to 80 mph will have an impact on safety. To determine this, they watch a stretch of the highway when the speed limit is 75 and see how many accidents there are. Then they observe the number of accidents over a period of time on the same stretch of highway for a speed limit of 80 mph. They then compare the difference. 15. To determine if a new sandwich on the menu is liked more than the original, the manager of the restaurant takes a random sample of customers that have tried both sandwiches and asks them which sandwich they prefer. 16. A newspaper wants to know what their customer satisfaction is. They randomly select 500 customers and ask them. Mrs. Goodmore wants to know if doing homework actually helps students do better on their unit exams. 17. Describe how Mrs. Goodmore could carry out a survey to determine if homework actually helps. Explain the role of randomization in your design. 18. Describe how Mrs. Goodmore could carry out an observational study to determine if homework helps test scores.
37 37
Secondary Mathematics III

Statistics 8.6
© 2014 Mathematics Vision Project | MVP Licensed under the Creative Commons Attribution-‐NonCommercial-‐ShareAlike 3.0 Unported license
19. Describe how Mrs. Goodmore could carry out an experiment to determine if homework helps test scores. Explain how you will use randomization in your design and how you will use a control. 20. If Mrs. Goodmore wants to determine if homework causes test scores to rise, which method would be best? Why?
Go Topic: Normal Curves The average resting heart rate of a young adult is approximately 70 beats per minute with a standard deviation of 10 beats per minute. Assuming resting heart rate follows a Normal Distribution, answer the following questions. 21. Draw and label the Normal curve that describes this distribution. Be sure to label the mean, and the measurements 1, 2, and 3 standard deviations out from the mean. 22. What percent of people have a heart rate between 55 and 80 beats per minute? Label these points on your Normal curve above and shade in the area that represents the percent of people with heartbeats between 55 and 80 beats per minute. 23. If a resting heart rate above 80 beats per minute is considered unhealthy, what percent of people have an unhealthy heart rate?
38 38
Secondary Mathematics III

Mathematics Vision Project | MVP
Licensed under the Creative Commons Attribution-NonCommercial-ShareAlike 3.0 Unported license
8.7 Slacker’s Simulation A Solidify Understanding Task
I know a student who forgot about the upcoming
history test and did not study at all. To protect
his identity, I’ll just call him Slacker. When I
reminded Slacker that we had a test in the next
class, he said that he wasn’t worried because the
test has 10 true/false questions. Slacker said that
he would totally guess on every question, and
since he’s always lucky, he thinks he will get at least 8 out of 10.
I’m skeptical, but Slacker said, “Hey, sometimes you flip a coin and it seems like you just keep
getting heads. You may only have a 50/50 chance of getting heads, but you still might get heads
several times in a row. I think this is just about the same thing. I could get lucky.”
1. What do you think of Slacker’s claim? Is it possible for him to get 8 out of 10 questions
right? Explain.
I thought about it for a minute and said, “Slacker, I think you’re on to something. I’m not sure that
you will get 80% on the test, but I agree that the situation is just like a coin flip. It’s either one way
or the other and they are both equally likely if you’re just guessing.” My idea is to use a coin flip to
simulate the T/F test situation. We can try it many times and see how often we get 8 out of 10
questions right. I’m going to say that if the coin lands on heads, then you guessed the problem
correctly. If it lands on tails, then you got it wrong.
Try it a few times yourself. To save a little time, just flip 10 coins at once and count up the number
of heads for each test.
# Correct (Heads) # Incorrect (Tails) % Correct Test 1 Test 2 Test 3 Test 4 Test 5
Did you get 8 out of 10 correct in any of your trials?
© 2
01
4 w
ww
.flic
kr.c
om
/ph
oto
s/m
arco
arm
ent
39 39
Secondary Mathematics III

Mathematics Vision Project | MVP
Licensed under the Creative Commons Attribution-NonCommercial-ShareAlike 3.0 Unported license
Based on your trials, do you think Slacker has a good chance of getting 80% correct?
Use technology to 50 simulate more tests. Now what do you think of Slacker’s chances of getting
80% correct. Explain why.
40 40
Secondary Mathematics III

Name Statistics 8.7
Secondary 3 © 2014 Mathematics Vision Project | MVP
Licensed under the Creative Commons Attribution-NonCommercial-ShareAlike 3.0 Unported license
Ready, Set, Go!
Ready Topic: Features of Histograms
1. Take a coin and flip it 5 times. Record the
number of times the coin landed with heads up.
Repeat this process 20 times either by hand or by simulation using technology,
http://www.rossmanchance.com/applets/CoinTossing/CoinToss.html
each time recording your results in the table below.
2. Create a histogram of your results below. Describe the shape of the histogram (Shape,
Center, Spread)
# Heads % Heads Frequency 0 0% 1 20% 2 40% 3 60% 4 80% 5 100%
© 2
01
4 w
ww
.flic
kr.c
om
/ph
oto
s/M
r_T_
in_D
C
41 41
Secondary Mathematics III

Name Statistics 8.7
Secondary 3 © 2014 Mathematics Vision Project | MVP
Licensed under the Creative Commons Attribution-NonCommercial-ShareAlike 3.0 Unported license
3. Flip a coin 5 times. Record the number of times heads lands side up. Repeat this
process 20 times either by hand or by simulation using technology.
http://www.rossmanchance.com/applets/CoinTossing/CoinToss.html
Record your results in the table below.
4. Create a histogram of your results below. Describe the shape of the histogram (Shape,
Center, Spread)
5. Compare the shape center and spread of each distribution. What do you notice?
# Heads % Heads Frequency # Heads % Heads Frequency 0 0% 11 55% 1 5% 12 60% 2 10% 13 65% 3 15% 14 70% 4 20% 15 75% 5 25% 16 80% 6 30% 17 85% 7 35% 18 90% 8 40% 19 95% 9 45% 20 100% 10 50%
42 42
Secondary Mathematics III
Name Statistics 8.7
Secondary 3 © 2014 Mathematics Vision Project | MVP
Licensed under the Creative Commons Attribution-NonCommercial-ShareAlike 3.0 Unported license
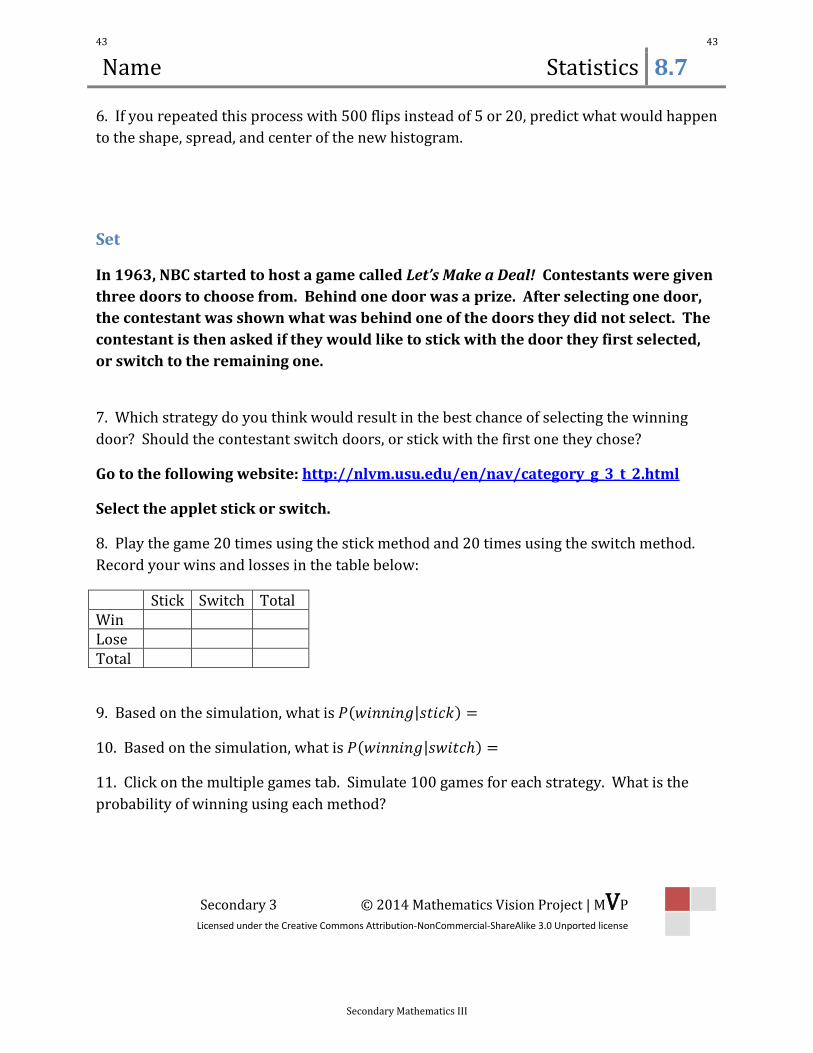
6. If you repeated this process with 500 flips instead of 5 or 20, predict what would happen
to the shape, spread, and center of the new histogram.
Set
In 1963, NBC started to host a game called Let’s Make a Deal! Contestants were given
three doors to choose from. Behind one door was a prize. After selecting one door,
the contestant was shown what was behind one of the doors they did not select. The
contestant is then asked if they would like to stick with the door they first selected,
or switch to the remaining one.
7. Which strategy do you think would result in the best chance of selecting the winning
door? Should the contestant switch doors, or stick with the first one they chose?
Go to the following website: http://nlvm.usu.edu/en/nav/category_g_3_t_2.html
Select the applet stick or switch.
8. Play the game 20 times using the stick method and 20 times using the switch method.
Record your wins and losses in the table below:
Stick Switch Total Win Lose Total
9. Based on the simulation, what is 𝑃(𝑤𝑖𝑛𝑛𝑖𝑛𝑔|𝑠𝑡𝑖𝑐𝑘) =
10. Based on the simulation, what is 𝑃(𝑤𝑖𝑛𝑛𝑖𝑛𝑔|𝑠𝑤𝑖𝑡𝑐ℎ) =
11. Click on the multiple games tab. Simulate 100 games for each strategy. What is the
probability of winning using each method?
43 43
Secondary Mathematics III

Name Statistics 8.7
Secondary 3 © 2014 Mathematics Vision Project | MVP
Licensed under the Creative Commons Attribution-NonCommercial-ShareAlike 3.0 Unported license
Go Topic: Probability
12. For your two-way table in problem 8, create a Venn diagram and a tree diagram below.
13. 𝑃(𝑤𝑖𝑛𝑛𝑖𝑛𝑔) = 14. 𝑃(𝑤𝑖𝑛𝑛𝑖𝑛𝑔 ∩ 𝑠𝑡𝑖𝑐𝑘𝑖𝑛𝑔) =
15. 𝑃(𝑤𝑖𝑛𝑛𝑖𝑛𝑔 ∪ 𝑠𝑡𝑖𝑐𝑘𝑖𝑛𝑔) = 16. 𝑃(𝑙𝑜𝑜𝑠𝑖𝑛𝑔|𝑠𝑡𝑖𝑐𝑘𝑖𝑛𝑔) =
17. 𝑃(𝑤𝑖𝑛𝑛𝑖𝑛𝑔 𝑜𝑟 𝑙𝑜𝑜𝑠𝑖𝑛𝑔) =
18. Are the events winning and sticking independent of each other? Justify your answer using
probabilities.
44 44
Secondary Mathematics III
Related Documents