Secondary Evaluations of MTA 36-Month Outcomes: Propensity Score and Growth Mixture Model Analyses JAMES M. SWANSON, PH.D., STEPHEN P. HINSHAW, PH.D., L. EUGENE ARNOLD, M.D., ROBERT D. GIBBONS, PH.D., SUE MARCUS, PH.D., KWAN HUR, PH.D., PETER S. JENSEN, M.D., BENEDETTO VITIELLO, M.D., HOWARD B. ABIKOFF, PH.D., LAURENCE L. GREENHILL, M.D., LILY HECHTMAN, M.D., WILLIAM E. PELHAM, PH.D., KAREN C. WELLS, PH.D., C. KEITH CONNERS, PH.D., JOHN S. MARCH, M.D., M.P.H., GLEN R. ELLIOTT, PH.D., M.D., JEFFERY N. EPSTEIN, PH.D., KIMBERLY HOAGWOOD, PH.D., BETSY HOZA, PH.D., BROOKE S.G. MOLINA, PH.D., JEFFREY H. NEWCORN, M.D., JOANNE B. SEVERE, M.S., AND TIMOTHY WIGAL, PH.D. ABSTRACT Objective: To evaluate two hypotheses: that self-selection bias contributed to lack of medication advantage at the 36-month assessment of the Multimodal Treatment Study of Children With ADHD (MTA) and that overall improvement over time obscured treatment effects in subgroups with different outcome trajectories. Method: Propensity score analyses, using baseline characteristics and severity of attention-deficit/hyperactivity disorder symptoms at follow-up, established five subgroups (quintiles) based on tendency to take medication at the 36-month assessment. Growth mixture model (GMM) analyses were performed to identify subgroups (classes) with different patterns of outcome over time. Results: All five propensity subgroups showed initial advantage of medication that disappeared by the 36-month assessment. GMM analyses identified heterogeneity of trajectories over time and three classes: class 1 (34% of the MTA sample) with initial small improvement followed by gradual improvement that produced significant medication effects; class 2 (52%) with initial large improvement maintained for 3 years and overrepresentation of cases treated with the MTA Medication Algorithm; and class 3 (14%) with initial large improvement followed by deterioration. Conclusions: We failed to confirm the self-selection hypothesis. We found suggestive evidence of residual but not current benefits of assigned medication in class 2 and small current benefits of actual treatment with medication in class 1. J. Am. Acad. Child Adolesc. Psychiatry. 2007;46(8):1002Y1013. Key Words: attention-deficit/hyperactivity disorder, clinical trial, stimulant, behavior therapy, multimodal treatment. In previous analyses of the initial 14-month outcome (MTA Cooperative Group, 1999a) and persisting 24- month outcome (MTA Cooperative Group, 2004a), we reported a relative advantage of the Multimodal Treatment Study of Children With ADHD (MTA) Medication Algorithm, shown by a greater reduction of Accepted December 19, 2006. Please see end of text for author affiliations. The work reported was supported by cooperative agreement grants and contracts from the National Institute of Mental Health to the following: University of California, Berkeley: U01 MH50461 and N01MH12009; Duke University: U01 MH50477 and N01MH12012; University of California, Irvine: U01 MH50440 and N01MH 12011; Research Foundation for Mental Hygiene (New York State Psychiatric Institute/ Columbia University): U01 MH50467 and N01 MH12007; Long Island- Jewish Medical Center U01 MH50453; New York University: N01MH 12004; University of Pittsburgh: U01 MH50467 and N01 MH 12010; and McGill University N01MH12008. The Office of Special Education Programs of the U.S. Department of Education and the Office of Juvenile Justice and Delinquency Prevention of the Justice Department also participated in funding. The opinions and assertions contained in this report are the private views of the authors and are not to be construed as official or as reflecting the views of the National Institute of Mental Health, the National Institutes of Health, or the Department of Health and Human Services. Reprint requests to Dr. James M. Swanson, UCI Child Development Center, 19722 MacArthur Blvd., Irvine, CA 92612; e-mail: [email protected]. 0890-8567/07/4608-1002Ó2007 by the American Academy of Child and Adolescent Psychiatry. DOI: 10.1097/CHI.0b013e3180686d63 SPECIAL SECTION 1002 J. AM. ACAD. CHILD ADOLESC. PSYCHIATRY, 46:8, AUGUST 2007

Welcome message from author
This document is posted to help you gain knowledge. Please leave a comment to let me know what you think about it! Share it to your friends and learn new things together.
Transcript
Secondary Evaluations of MTA 36-Month Outcomes:Propensity Score and Growth Mixture
Model Analyses
JAMES M. SWANSON, PH.D., STEPHEN P. HINSHAW, PH.D., L. EUGENE ARNOLD, M.D.,
ROBERT D. GIBBONS, PH.D., SUE MARCUS, PH.D., KWAN HUR, PH.D.,
PETER S. JENSEN, M.D., BENEDETTO VITIELLO, M.D., HOWARD B. ABIKOFF, PH.D.,
LAURENCE L. GREENHILL, M.D., LILY HECHTMAN, M.D., WILLIAM E. PELHAM, PH.D.,
KAREN C. WELLS, PH.D., C. KEITH CONNERS, PH.D., JOHN S. MARCH, M.D., M.P.H.,
GLEN R. ELLIOTT, PH.D., M.D., JEFFERY N. EPSTEIN, PH.D., KIMBERLY HOAGWOOD, PH.D.,
BETSY HOZA, PH.D., BROOKE S.G. MOLINA, PH.D., JEFFREY H. NEWCORN, M.D.,
JOANNE B. SEVERE, M.S., AND TIMOTHY WIGAL, PH.D.
ABSTRACT
Objective: To evaluate two hypotheses: that self-selection bias contributed to lack of medication advantage at the 36-month
assessment of theMultimodal Treatment Study of ChildrenWith ADHD (MTA) and that overall improvement over time obscured
treatment effects in subgroups with different outcome trajectories. Method: Propensity score analyses, using baseline
characteristics and severity of attention-deficit/hyperactivity disorder symptoms at follow-up, established five subgroups
(quintiles) based on tendency to take medication at the 36-month assessment. Growth mixture model (GMM) analyses were
performed to identify subgroups (classes) with different patterns of outcome over time. Results: All five propensity subgroups
showed initial advantage of medication that disappeared by the 36-month assessment. GMM analyses identified heterogeneity
of trajectories over time and three classes: class 1 (34% of the MTA sample) with initial small improvement followed by gradual
improvement that produced significant medication effects; class 2 (52%) with initial large improvement maintained for 3 years
and overrepresentation of cases treated with the MTA Medication Algorithm; and class 3 (14%) with initial large improvement
followed by deterioration. Conclusions: We failed to confirm the self-selection hypothesis. We found suggestive evidence of
residual but not current benefits of assignedmedication in class 2 and small current benefits of actual treatment withmedication
in class 1. J. Am. Acad. Child Adolesc. Psychiatry. 2007;46(8):1002Y1013. KeyWords: attention-deficit/hyperactivity disorder,
clinical trial, stimulant, behavior therapy, multimodal treatment.
In previous analyses of the initial 14-month outcome(MTA Cooperative Group, 1999a) and persisting 24-month outcome (MTA Cooperative Group, 2004a), we
reported a relative advantage of the MultimodalTreatment Study of Children With ADHD (MTA)Medication Algorithm, shown by a greater reduction of
Accepted December 19, 2006.Please see end of text for author affiliations.The work reported was supported by cooperative agreement grants and
contracts from the National Institute of Mental Health to the following:University of California, Berkeley: U01 MH50461 and N01MH12009;Duke University: U01 MH50477 and N01MH12012; University ofCalifornia, Irvine: U01 MH50440 and N01MH 12011; ResearchFoundation for Mental Hygiene (New York State Psychiatric Institute/Columbia University): U01 MH50467 and N01 MH12007; Long Island-Jewish Medical Center U01 MH50453; New York University: N01MH12004; University of Pittsburgh: U01 MH50467 and N01 MH 12010; andMcGill University N01MH12008. The Office of Special Education Programs
of the U.S. Department of Education and the Office of Juvenile Justice andDelinquency Prevention of the Justice Department also participatedin funding.
The opinions and assertions contained in this report are the private views ofthe authors and are not to be construed as official or as reflecting the views of theNational Institute of Mental Health, the National Institutes of Health, or theDepartment of Health and Human Services.
Reprint requests to Dr. James M. Swanson, UCI Child Development Center,19722 MacArthur Blvd., Irvine, CA 92612; e-mail: [email protected].
0890-8567/07/4608-1002�2007 by the American Academy of Childand Adolescent Psychiatry.
DOI: 10.1097/CHI.0b013e3180686d63
S P E C I A L S E C T I O N
1002 J. AM. ACAD. CHILD ADOLESC. PSYCHIATRY, 46:8, AUGUST 2007
ADHD symptoms with the medication management(MedMgt) and combined (Comb) conditions thanwith the behavioral (Beh) and community comparison(CC) conditions [(Comb+Med)-(Beh+CC)]. However,this Medication Algorithm advantage declined overtime, and we stated (MTA Cooperative Group, 2004b),BIf the apparent differential deteriorationIcontinues,then the outcome of the four randomly assigned MTAgroups (Comb, MedMgt, Beh, and CC) will convergeover time.^
Intent-to-treat (ITT) analyses of the 36-month out-comes confirm this prediction (Jensen et al., 2007) andrevealed that current medication use at the 36-monthassessment was associated with a slight disadvantagerather than a relative advantage. This led to a self-selection hypothesis that proposes the following: caseswith higher compared to lower severity of psychopathol-ogy at entry into theMTA or during theMTA follow-upphases would be more likely to have adverse outcomes,the same individuals also would be more likely to receivemedication after the initial 14-month interventionperiod, and the association of severity and long-termmedication use would result in selective long-termtreatment of the most severe cases, potentially maskingbeneficial long-term effects of medication.
The ITT analyses also showed a general improve-ment over time across all randomly assigned treatmentgroups. A secondary hypothesis is that this trajectory ofoutcome was heterogeneous within the overall groupand proposes that homogeneous subgroups (latentclasses) could be identified and evaluated for differentialeffects of initial treatment assignment and actual useof medication.
The tests of these two hypotheses presented here wereintended to clarify and qualify the findings ofnonsignificant differences between randomly assignedMTA treatments by the 36-month follow-up. Adiscussion of the relationship of these findings to thegeneral literature on long-term effects of treatment isprovided in the companion paper by Jensen et al.(2007), so it is not repeated here.
The propensity score and growth mixture model(GMM) analytic methods go beyond the ITT methodsused in the companion paper by Jensen et al. (2007),and these methods allow the evaluation of continuationof assigned treatment and actual treatment. Of course,these are secondary analyses in the framework on arandomized clinical trial design, which characterized
the initial phase of the MTA. These adaptations arenecessary as the randomized trial evolved into anaturalistic follow-up study over time. Some limita-tions of these methods are considered in the finalsection of this article.
METHOD
Overall Approach
Propensity score analysis is an accepted means of adjusting forselection factors; it was originally described by Rosenbaum andRubin (1983) (see Marcus and Gibbons, 2001, for review). We usedthis method to evaluate whether baseline characteristics (includinginitial symptom severity and continuing severity) of ADHDsymptoms during follow-up affected decisions to stop, start, orcontinue the use of stimulant medication over time, thus maskingbeneficial medication effects at the 36-month assessment. As inprevious analyses, we defined the overall severity of symptoms as thesummary or average rating per item (0Y3) of the 18 DSM-IVsymptoms on the Swanson, Nolan, and Pelham (SNAP) ratingscale, obtained by averaging across domains (the nine inattentionitems and the nine hyperactivity-impulsivity items) and acrosssources (parent and teacher). Using a linear combination of thepotentially confounding variables, we formed five subgroups(quintiles) based solely on the likelihood of taking medication atthe 36-month assessment. Then, we estimated the relative outcomesof the separate quintiles as well as medication effects separatelywithin each quintile.Growth mixture model (GMM) analysis is an accepted means for
identifying heterogeneity of longitudinal response trajectories (i.e.,growth curves or patterns of response over time) to identifysubgroups or latent classes. This general method was also used in acompanion paper in this issue of the Journal (Jensen et al., 2007) toevaluate the 36-month outcome reflected by other measures relatedto delinquency and substance use. The traditional mixed-effectsregression model originally described by Laird and Ware (1982)(see Hedeker and Gibbons, 2006, for a general overview) is basedon the null hypothesis that a single longitudinal response processexists and that all of the members of the population systematicallydeviate from this common temporal response pattern (or growthcurve). The alternative hypothesis is that there are two or moredifferent longitudinal response processes in the population, withindividual subjects deviating from one of these and outcome betterrepresented by a mixture of temporal response patterns (growthcurves) rather than a single growth curve. We used GMM analysisto identify homogeneous subgroups and then evaluated the effectsof treatment and other fixed effects within each subgroup (latentclass) to determine whether latent class membership was associatedwith baseline factors, including severity of symptoms and treatmentassignment.
Design
To introduce these analytical methods for the evaluation of thelong-term observational follow-up phases of the MTA, we focushere on one outcome measure based on a summary of ADHDsymptoms based on the SNAP (Swanson, 1992) ratings averagedacross domains and sources. This strategy was also used in previousreports (MTA Cooperative Group, 2004a, b). To obtain the
THE MTA AT 3 YEARS: SECONDARY ANALYSES
1003J . AM. ACAD. CHILD ADOLESC. PSYCHIATRY, 46:8, AUGUST 2007
summary score, first the average rating across all 18 DSM-IVADHD items on the SNAP (average across both domains,Inattention and Hyperactivity/Impulsivity) was calculated for eachsource (parent and teacher). In the analyses we defined source as afactor with two levels, so by collapsing across the levels of sourceproduced a summary rating representing the average rating acrossdomains and across sources. For the evaluations of medicationeffects, actual medication status before each of the assessment points(14, 24, and 36 months) was derived from the Services for Childrenand Adolescents Parent Interview (SCAPI; Jensen et al., 2004;Hoagwood et al., 2004). The SCAPI at each assessment pointprovided estimates of the actual medication received by a givenchild, which in some cases differed from that specified by therandomly assigned treatment conditions that were implemented byMTA staff even during the 14-month treatment phase of the study.In the report of outcome at the first (24-month) follow-up (MTACooperative Group, 2004a), medication status was defined by a30-day criterion and was considered to be positive (Med) if medi-cation prescribed for ADHD had been used during the 30-dayinterval before the assessment and negative (No Med) otherwise.For the ITT analyses of 36-month outcome in the companion paperin this issue of the Journal (Jensen et al., 2007), medication statuswas defined by a 50% criterion and considered to represent highmedication use if stimulant medication had been used for at least50% of the days since the previous assessment and low medicationuse otherwise. The overlap of these two definitions was substantial(about 85%), and the results of analyses of medication effects didnot differ for the two definitions. Therefore, we report and discussonly the results based on the new (50%) definition of high and lowmedication use.
Analyses
Propensity Score Analyses. The propensity score methodologyused all of the characteristics measured by the MTA baseline battery,as well as 14- and 24-month severity of ADHD symptoms, tocompute the propensity (based on these variables) for having high orlow medication status leading up to the 36-month assessment, asrecommended in the recent literature (Brookhart et al., 2006). Toidentify covariates that were possibly related to medication status atthe 36-month assessment, univariate analyses were performed usingunpaired t tests for continuous variables and x2 or Fisher exact testfor categorical variables. The variables that were significant at thep < .20 level were included in the propensity score analyses; thislenient significance level was used so that potentially relatedvariables were not excluded. We calculated a single endpointpropensity score that is appropriate for naturalistic follow-up studiesof randomized, controlled mental health intervention trials. Moredetails about this method applied to the MTA data are providedelsewhere (Marcus and Gibbons, 2001). We assigned participants toone of five quintiles corresponding to their propensities to takemedication at the 36-month assessment, regardless of whether theywere actually treated with medication at any assessment point.Because propensity is not certain, we could form high and lowmedication use subgroups within each quintile and contrast them toestimate the effects of medication status on the outcome measure.This procedure is designed to control for a hypothesized effect of themore severely affected cases (assumed to have worse long-termoutcomes) showing a greater likelihood of being treated withmedication, thereby masking the true medication effect.
GMM. The GMM methodology used the four major assessmentpoints (baseline, 14-month, 24-month, and 36-month) to define the
time variable for the evaluation of growth curves (or patterns ofoutcome over time). Medication status, defined as high or low by the50% definition, was a binary time-varying covariate, and a time �medication status interaction term was included to account formedication effects that increased or diminished over time differen-tially within each class identified by the GMM. A quadratic modelwas used to characterize the nonlinear time trend within each class,and the coefficients of the quadratic model were treated as randomeffects within each class. Site was included as a fixed effect in themodel to absorb site-specific effects. Source of ratings (teacher andparent) was included as a random effect in the model to incorporatethe similarities and differences between these sources in the overallanalysis as well as to combine these two sources when the levels werecollapsed.
RESULTS
Previous Analyses
As described in the companion paper in this issue ofthe Journal (Jensen et al., 2007), of the 579 casesentering the MTA protocol (full baseline sample), 485completed the 36-month assessment (84%). In thisfollow-up sample the four assigned treatment groups(MedMgt, Comb, Beh, and CC) did not differsignificantly on the measures in the baseline assessmentbattery. As presented in the companion paper (Jensenet al., 2007), the effects of assigned treatment wereessentially zero (and nonsignificant) at the 36-monthassessment, and the variation in medication status(evaluated by including actual medication use as a time-varying covariate) did not account for the loss of themedication advantage over time.
Propensity Score Analyses
For these analyses medication status was establishedfor the 14-, 24-, and 36-month assessment points basedon the SCAPI reports of taking medication at least 50%(high) or less (low) of the days since the previousassessment. The score reflecting the propensity to takemedication at the 36-month assessment was determinedby considering baseline characteristics and severity ofADHD symptoms at the 14-month and 24-monthassessment points. Of the 33 potential covariates, 27were significant at p < .20, identified by an asterisk inTable 1, and were included in the propensity scoreanalyses. Almost all of the baseline variables as well asthe ADHD ratings at the 14-month and 24-monthassessment points differed significantly across propen-sity quintiles (n = 94Y95 per quintile; Table 1).Quintile 1 (Q1) represented cases least likely to betaking medication at the 36-month assessment, and
SWANSON ET AL.
1004 J. AM. ACAD. CHILD ADOLESC. PSYCHIATRY, 46:8, AUGUST 2007
quintile 5 (Q5) represented those most likely to betaking medication at this point. Compared to Q1, Q5was characterized by the following: greater representa-tion of males (88.3% versus 69.5%), whites (76.6% vs.48.4%), and individuals with a history of medicationuse before MTA entry (59.6% vs. 11.6%); more casesinitially randomized to the Comb and MedMgtconditions and fewer cases to the Beh treatmentcondition, indicating partial long-term adherence tothe medication component of the assigned treatmentregimen; and worse baseline scores on scales measuringsymptoms or characteristics of attention-deficit/hyper-activity disorder and oppositional defiant disorder(from the SNAP), depression (from the Children`sDepression Inventory), anxiety (from the Multidimen-sional Anxiety Scale for Children), and social skills (theSocial Skills Rating Scale). However, Q5 tended to havelower rather than higher severity on SNAP ratings thanQ1 at the 14-month assessment (1.1 vs. 1.2) and the24-month assessment (1.1 vs. 1.4).
At the 36-month assessment, the number of caseswith high versus low medication use status differedacross the quintiles, as would be expected by thedefinition of propensity (n = 24 vs. 71 for Q1; n = 48 vs.47 for Q2; n = 57 vs. 37 for Q3; n = 72 vs. 23 for Q4;n = 89 vs. 5 for Q5). This pattern could reflect aselection bias if outcome at the 36-month assessmentwas progressively worse across the quintiles thatrepresented increasing tendencies to be treated withmedication (i.e., from Q1 to Q5). However, thishypothesis was not supported: Despite the baselinedifferences across quintiles, the symptom severity at the36-month assessment was similar for all five quintiles(Fig. 1). Also, the medication effect over time wassimilar for all five quintiles (Table 1): at 14-monthassessment, all quintiles manifested beneficial between-group differences (positive effect sizes) for contrasts ofthe low and high medication use subgroups, similar tothe overall effect in the initial, end-of-treatment report(MTA Cooperative Group, 1999a), which diminished(by about half) at the 24-month assessment, similar tothe overall effect in the first follow-up report (MTACooperative Group, 2004a), and were absent at the 36-month assessment, similar to the overall loss of medi-cation advantage in the companion report in this issueof the Journal (Jensen et al., 2007). Therefore, pro-pensity analyses using the data available from the MTAassessment batteries do not support the hypothesis that
self-selection masked a beneficial medication effect at36 months.
GMM Analyses
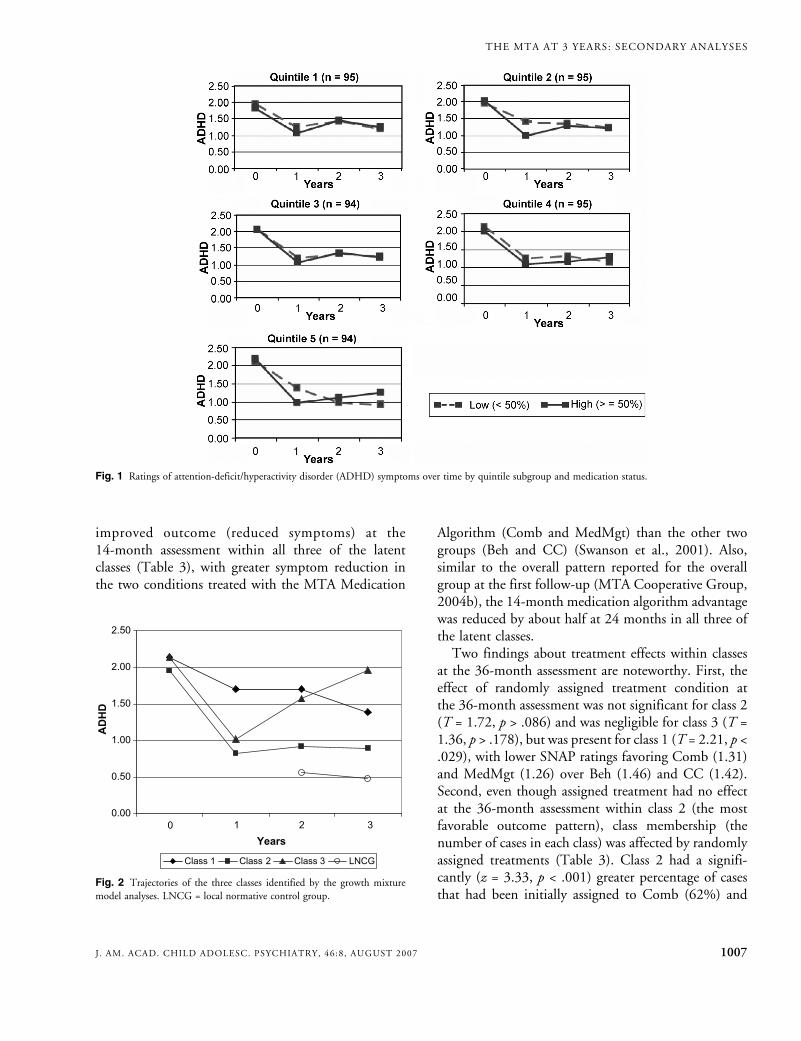
The GMM analysis used the Bayes InformationCriterion to identify the number of latent classes (i.e.,the number of distinct trajectories over time forsummary ADHD ratings). The Bayes InformationCriterion, defined as L 2
j (r) log(N), where L is thelikelihood ratio, N is the sample size, and r is theresidual degrees of freedom, provides the weight ofevidence favoring one model over another. SmallerBayes Information Criterion values indicate better fitsof the model. Three latent classes were identified: class1 (n = 199, 34% of the sample) manifested a linearlydecreasing (improving) symptom trend over time; class2 (n = 299, 52% of the sample) manifested a largeinitial symptom decrease that was maintained overtime; class 3 (n = 81, 14%) manifested a quadratictrend, with an initial decrease followed by a return tobaseline (Fig. 2). An analysis of outcome (SNAPratings) for the three latent classes over time revealed aninteraction of class with time (F = 84.4, p < .001).Ratings of the local normative comparison group
(classmates of the ADHD cases) were available at the24-month and 36-month assessments. As shown inFigure 2, the symptom ratings for all three classes ofADHD cases were still well above (i.e., worse than)those for this nonclinical comparison group. Thus, theoverall pattern of improvement does not reflectcomplete normalization of symptoms.The three classes differed on many of the MTA
baseline variables (Table 2). In general, classes 1 and 3were similar, differing from class 2 on a dimensionreflecting severity and adversity, such that class 2 hadhigher birth weight, higher IQ, and better ratings ofADHD symptoms, Social Skills Rating Scale (lowerratings of problem behaviors and higher ratings ofpositive social skills), and Child Behavior Checklist(lower ratings in general areas of psychopathology). Inother words, the class showing the most consistentimprovement over time was not as severely impaired atentry into the MTA as were the other two classes (seealso Owens et al., 2003, for parallel findings at the14-month outcome).Similar to the overall pattern previously reported for
the entire sample (see MTA Cooperative Group,1999a), randomly assigned treatments produced
THE MTA AT 3 YEARS: SECONDARY ANALYSES
1005J . AM. ACAD. CHILD ADOLESC. PSYCHIATRY, 46:8, AUGUST 2007
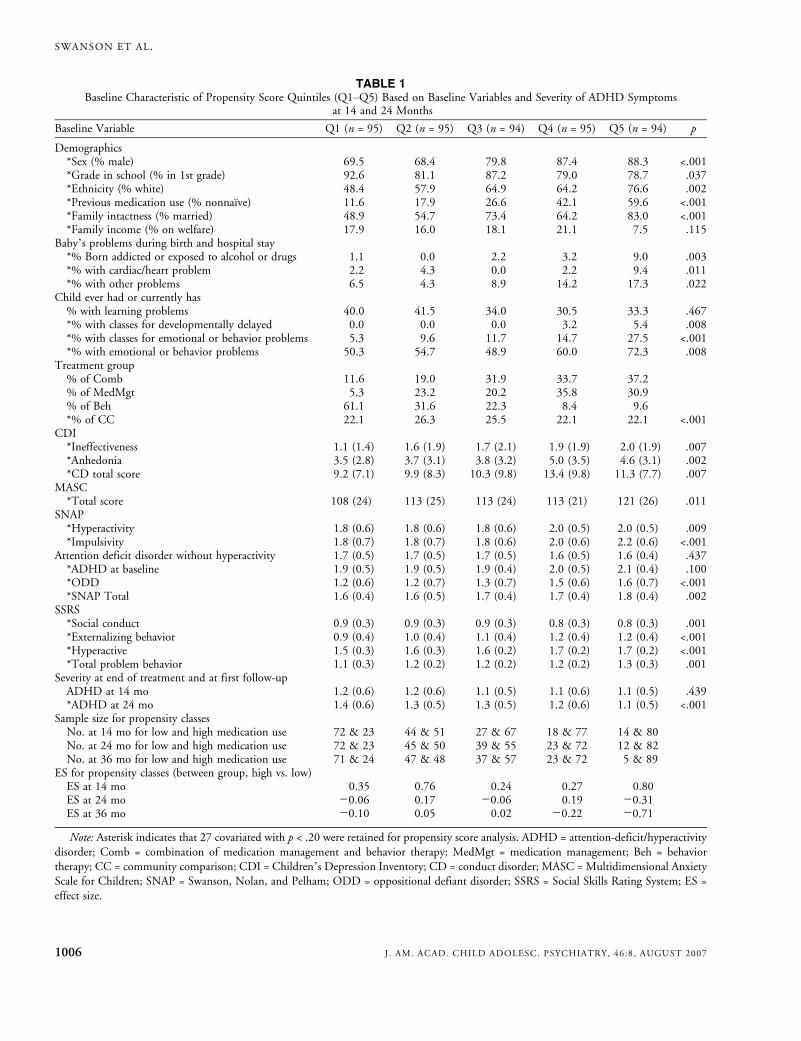
TABLE 1Baseline Characteristic of Propensity Score Quintiles (Q1YQ5) Based on Baseline Variables and Severity of ADHD Symptoms
at 14 and 24 Months
Baseline Variable Q1 (n = 95) Q2 (n = 95) Q3 (n = 94) Q4 (n = 95) Q5 (n = 94) p
Demographics*Sex (% male) 69.5 68.4 79.8 87.4 88.3 <.001*Grade in school (% in 1st grade) 92.6 81.1 87.2 79.0 78.7 .037*Ethnicity (% white) 48.4 57.9 64.9 64.2 76.6 .002*Previous medication use (% nonnaı̈ve) 11.6 17.9 26.6 42.1 59.6 <.001*Family intactness (% married) 48.9 54.7 73.4 64.2 83.0 <.001*Family income (% on welfare) 17.9 16.0 18.1 21.1 7.5 .115
Baby`s problems during birth and hospital stay*% Born addicted or exposed to alcohol or drugs 1.1 0.0 2.2 3.2 9.0 .003*% with cardiac/heart problem 2.2 4.3 0.0 2.2 9.4 .011*% with other problems 6.5 4.3 8.9 14.2 17.3 .022
Child ever had or currently has% with learning problems 40.0 41.5 34.0 30.5 33.3 .467*% with classes for developmentally delayed 0.0 0.0 0.0 3.2 5.4 .008*% with classes for emotional or behavior problems 5.3 9.6 11.7 14.7 27.5 <.001*% with emotional or behavior problems 50.3 54.7 48.9 60.0 72.3 .008
Treatment group% of Comb 11.6 19.0 31.9 33.7 37.2% of MedMgt 5.3 23.2 20.2 35.8 30.9% of Beh 61.1 31.6 22.3 8.4 9.6*% of CC 22.1 26.3 25.5 22.1 22.1 <.001
CDI*Ineffectiveness 1.1 (1.4) 1.6 (1.9) 1.7 (2.1) 1.9 (1.9) 2.0 (1.9) .007*Anhedonia 3.5 (2.8) 3.7 (3.1) 3.8 (3.2) 5.0 (3.5) 4.6 (3.1) .002*CD total score 9.2 (7.1) 9.9 (8.3) 10.3 (9.8) 13.4 (9.8) 11.3 (7.7) .007
MASC*Total score 108 (24) 113 (25) 113 (24) 113 (21) 121 (26) .011
SNAP*Hyperactivity 1.8 (0.6) 1.8 (0.6) 1.8 (0.6) 2.0 (0.5) 2.0 (0.5) .009*Impulsivity 1.8 (0.7) 1.8 (0.7) 1.8 (0.6) 2.0 (0.6) 2.2 (0.6) <.001
Attention deficit disorder without hyperactivity 1.7 (0.5) 1.7 (0.5) 1.7 (0.5) 1.6 (0.5) 1.6 (0.4) .437*ADHD at baseline 1.9 (0.5) 1.9 (0.5) 1.9 (0.4) 2.0 (0.5) 2.1 (0.4) .100*ODD 1.2 (0.6) 1.2 (0.7) 1.3 (0.7) 1.5 (0.6) 1.6 (0.7) <.001*SNAP Total 1.6 (0.4) 1.6 (0.5) 1.7 (0.4) 1.7 (0.4) 1.8 (0.4) .002
SSRS*Social conduct 0.9 (0.3) 0.9 (0.3) 0.9 (0.3) 0.8 (0.3) 0.8 (0.3) .001*Externalizing behavior 0.9 (0.4) 1.0 (0.4) 1.1 (0.4) 1.2 (0.4) 1.2 (0.4) <.001*Hyperactive 1.5 (0.3) 1.6 (0.3) 1.6 (0.2) 1.7 (0.2) 1.7 (0.2) <.001*Total problem behavior 1.1 (0.3) 1.2 (0.2) 1.2 (0.2) 1.2 (0.2) 1.3 (0.3) .001
Severity at end of treatment and at first follow-upADHD at 14 mo 1.2 (0.6) 1.2 (0.6) 1.1 (0.5) 1.1 (0.6) 1.1 (0.5) .439*ADHD at 24 mo 1.4 (0.6) 1.3 (0.5) 1.3 (0.5) 1.2 (0.6) 1.1 (0.5) <.001
Sample size for propensity classesNo. at 14 mo for low and high medication use 72 & 23 44 & 51 27 & 67 18 & 77 14 & 80No. at 24 mo for low and high medication use 72 & 23 45 & 50 39 & 55 23 & 72 12 & 82No. at 36 mo for low and high medication use 71 & 24 47 & 48 37 & 57 23 & 72 5 & 89
ES for propensity classes (between group, high vs. low)ES at 14 mo 0.35 0.76 0.24 0.27 0.80ES at 24 mo j0.06 0.17 j0.06 0.19 j0.31ES at 36 mo j0.10 0.05 0.02 j0.22 j0.71
Note: Asterisk indicates that 27 covariated with p < .20 were retained for propensity score analysis. ADHD = attention-deficit/hyperactivitydisorder; Comb = combination of medication management and behavior therapy; MedMgt = medication management; Beh = behaviortherapy; CC = community comparison; CDI = Children`s Depression Inventory; CD = conduct disorder; MASC = Multidimensional AnxietyScale for Children; SNAP = Swanson, Nolan, and Pelham; ODD = oppositional defiant disorder; SSRS = Social Skills Rating System; ES =effect size.
SWANSON ET AL.
1006 J. AM. ACAD. CHILD ADOLESC. PSYCHIATRY, 46:8, AUGUST 2007
improved outcome (reduced symptoms) at the14-month assessment within all three of the latentclasses (Table 3), with greater symptom reduction inthe two conditions treated with the MTA Medication
Algorithm (Comb and MedMgt) than the other twogroups (Beh and CC) (Swanson et al., 2001). Also,similar to the overall pattern reported for the overallgroup at the first follow-up (MTA Cooperative Group,2004b), the 14-month medication algorithm advantagewas reduced by about half at 24 months in all three ofthe latent classes.Two findings about treatment effects within classes
at the 36-month assessment are noteworthy. First, theeffect of randomly assigned treatment condition atthe 36-month assessment was not significant for class 2(T = 1.72, p > .086) and was negligible for class 3 (T =1.36, p > .178), but was present for class 1 (T = 2.21, p <.029), with lower SNAP ratings favoring Comb (1.31)and MedMgt (1.26) over Beh (1.46) and CC (1.42).Second, even though assigned treatment had no effectat the 36-month assessment within class 2 (the mostfavorable outcome pattern), class membership (thenumber of cases in each class) was affected by randomlyassigned treatments (Table 3). Class 2 had a signifi-cantly (z = 3.33, p < .001) greater percentage of casesthat had been initially assigned to Comb (62%) and
Fig. 1 Ratings of attention-deficit/hyperactivity disorder (ADHD) symptoms over time by quintile subgroup and medication status.
Fig. 2 Trajectories of the three classes identified by the growth mixturemodel analyses. LNCG = local normative control group.
THE MTA AT 3 YEARS: SECONDARY ANALYSES
1007J . AM. ACAD. CHILD ADOLESC. PSYCHIATRY, 46:8, AUGUST 2007
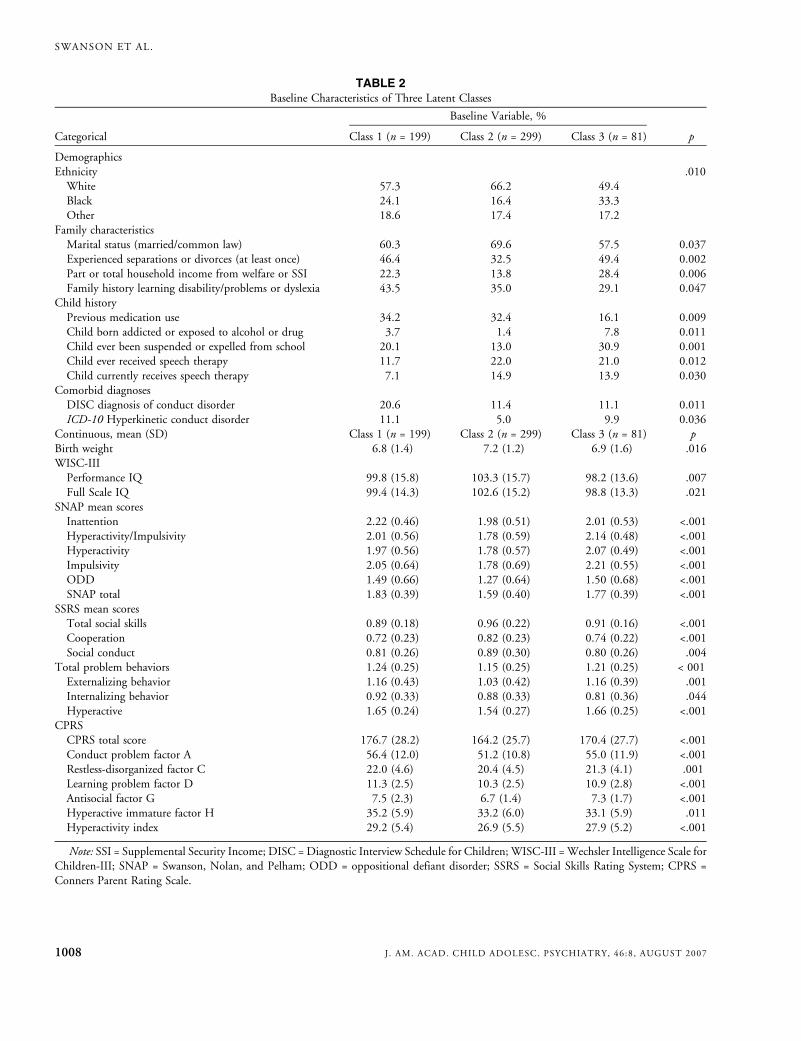
TABLE 2Baseline Characteristics of Three Latent Classes
Baseline Variable, %
Categorical Class 1 (n = 199) Class 2 (n = 299) Class 3 (n = 81) p
DemographicsEthnicity .010White 57.3 66.2 49.4Black 24.1 16.4 33.3Other 18.6 17.4 17.2
Family characteristicsMarital status (married/common law) 60.3 69.6 57.5 0.037Experienced separations or divorces (at least once) 46.4 32.5 49.4 0.002Part or total household income from welfare or SSI 22.3 13.8 28.4 0.006Family history learning disability/problems or dyslexia 43.5 35.0 29.1 0.047
Child historyPrevious medication use 34.2 32.4 16.1 0.009Child born addicted or exposed to alcohol or drug 3.7 1.4 7.8 0.011Child ever been suspended or expelled from school 20.1 13.0 30.9 0.001Child ever received speech therapy 11.7 22.0 21.0 0.012Child currently receives speech therapy 7.1 14.9 13.9 0.030
Comorbid diagnosesDISC diagnosis of conduct disorder 20.6 11.4 11.1 0.011ICD-10 Hyperkinetic conduct disorder 11.1 5.0 9.9 0.036
Continuous, mean (SD) Class 1 (n = 199) Class 2 (n = 299) Class 3 (n = 81) pBirth weight 6.8 (1.4) 7.2 (1.2) 6.9 (1.6) .016WISC-IIIPerformance IQ 99.8 (15.8) 103.3 (15.7) 98.2 (13.6) .007Full Scale IQ 99.4 (14.3) 102.6 (15.2) 98.8 (13.3) .021
SNAP mean scoresInattention 2.22 (0.46) 1.98 (0.51) 2.01 (0.53) <.001Hyperactivity/Impulsivity 2.01 (0.56) 1.78 (0.59) 2.14 (0.48) <.001Hyperactivity 1.97 (0.56) 1.78 (0.57) 2.07 (0.49) <.001Impulsivity 2.05 (0.64) 1.78 (0.69) 2.21 (0.55) <.001ODD 1.49 (0.66) 1.27 (0.64) 1.50 (0.68) <.001SNAP total 1.83 (0.39) 1.59 (0.40) 1.77 (0.39) <.001
SSRS mean scoresTotal social skills 0.89 (0.18) 0.96 (0.22) 0.91 (0.16) <.001Cooperation 0.72 (0.23) 0.82 (0.23) 0.74 (0.22) <.001Social conduct 0.81 (0.26) 0.89 (0.30) 0.80 (0.26) .004
Total problem behaviors 1.24 (0.25) 1.15 (0.25) 1.21 (0.25) < 001Externalizing behavior 1.16 (0.43) 1.03 (0.42) 1.16 (0.39) .001Internalizing behavior 0.92 (0.33) 0.88 (0.33) 0.81 (0.36) .044Hyperactive 1.65 (0.24) 1.54 (0.27) 1.66 (0.25) <.001
CPRSCPRS total score 176.7 (28.2) 164.2 (25.7) 170.4 (27.7) <.001Conduct problem factor A 56.4 (12.0) 51.2 (10.8) 55.0 (11.9) <.001Restless-disorganized factor C 22.0 (4.6) 20.4 (4.5) 21.3 (4.1) .001Learning problem factor D 11.3 (2.5) 10.3 (2.5) 10.9 (2.8) <.001Antisocial factor G 7.5 (2.3) 6.7 (1.4) 7.3 (1.7) <.001Hyperactive immature factor H 35.2 (5.9) 33.2 (6.0) 33.1 (5.9) .011Hyperactivity index 29.2 (5.4) 26.9 (5.5) 27.9 (5.2) <.001
Note: SSI = Supplemental Security Income; DISC = Diagnostic Interview Schedule for Children; WISC-III = Wechsler Intelligence Scale forChildren-III; SNAP = Swanson, Nolan, and Pelham; ODD = oppositional defiant disorder; SSRS = Social Skills Rating System; CPRS =Conners Parent Rating Scale.
SWANSON ET AL.
1008 J. AM. ACAD. CHILD ADOLESC. PSYCHIATRY, 46:8, AUGUST 2007
MedMgt (55%) than to Beh (46%) and CC (45%).Thus, even though treatment assignment did notappear to have any effect on ratings of ADHDsymptoms at the 36-month assessment point, initialassignment to a treatment including the MTA Medica-tion Algorithm increased the chance of being in themost favorable outcome trajectory.
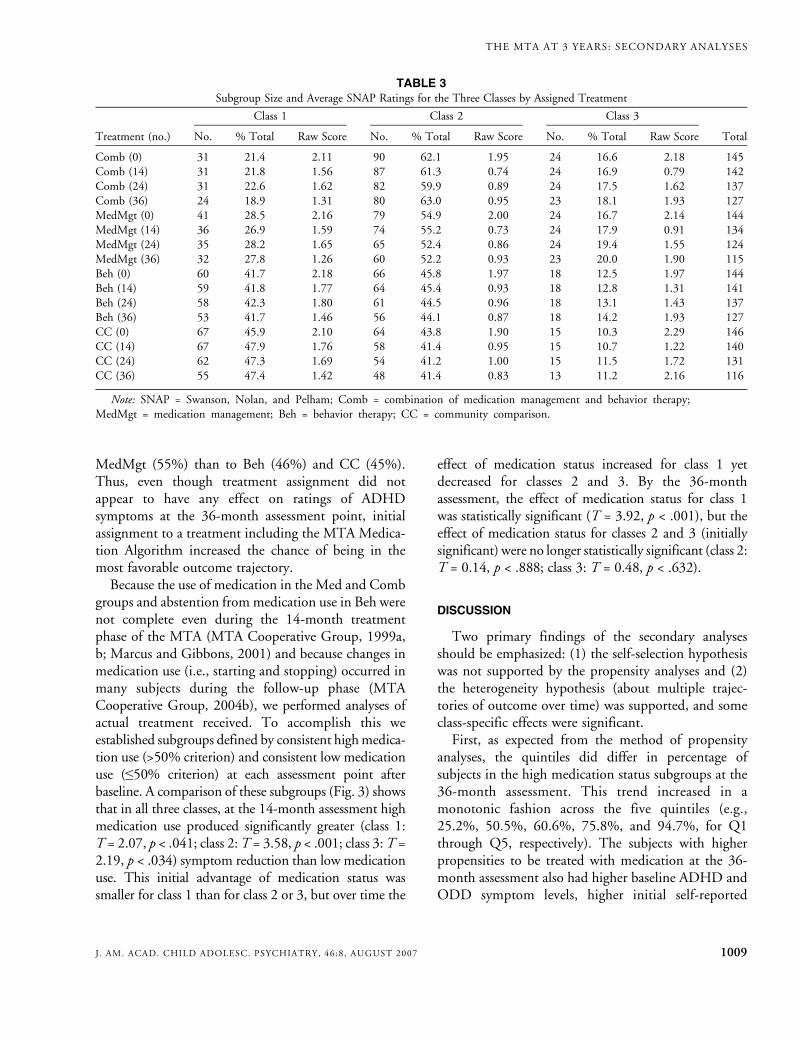
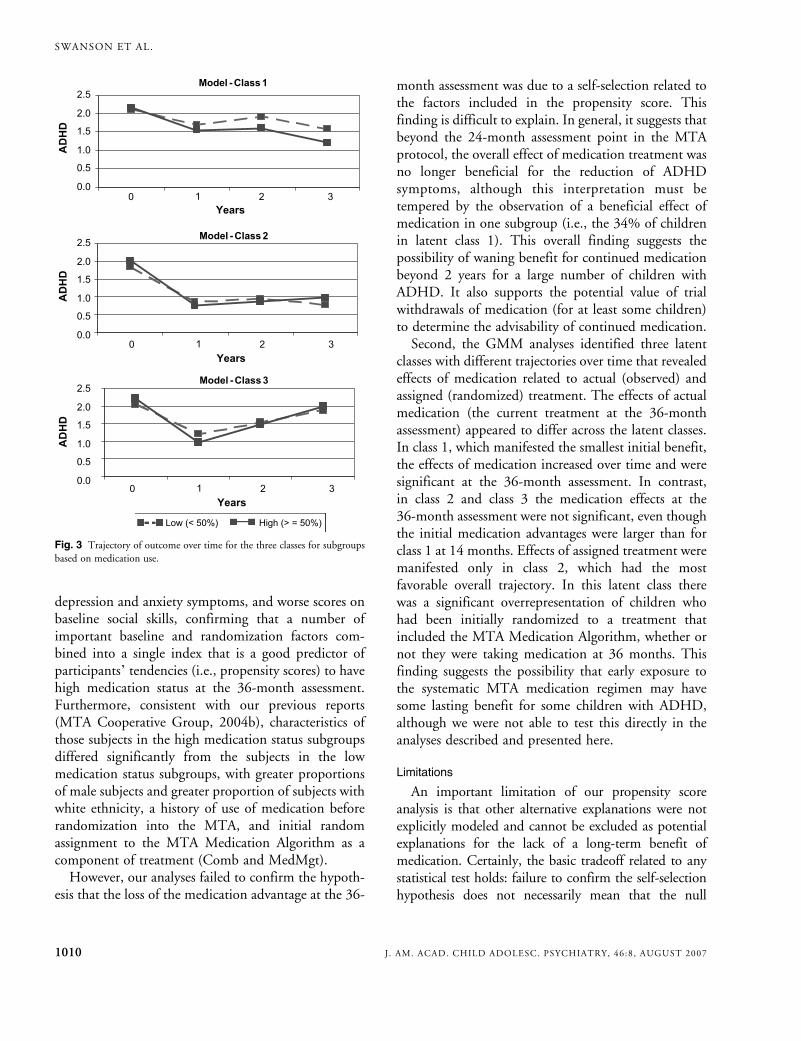
Because the use of medication in the Med and Combgroups and abstention frommedication use in Beh werenot complete even during the 14-month treatmentphase of the MTA (MTA Cooperative Group, 1999a,b; Marcus and Gibbons, 2001) and because changes inmedication use (i.e., starting and stopping) occurred inmany subjects during the follow-up phase (MTACooperative Group, 2004b), we performed analyses ofactual treatment received. To accomplish this weestablished subgroups defined by consistent highmedica-tion use (>50% criterion) and consistent low medicationuse (e50% criterion) at each assessment point afterbaseline. A comparison of these subgroups (Fig. 3) showsthat in all three classes, at the 14-month assessment highmedication use produced significantly greater (class 1:T = 2.07, p < .041; class 2:T = 3.58, p < .001; class 3:T =2.19, p < .034) symptom reduction than low medicationuse. This initial advantage of medication status wassmaller for class 1 than for class 2 or 3, but over time the
effect of medication status increased for class 1 yetdecreased for classes 2 and 3. By the 36-monthassessment, the effect of medication status for class 1was statistically significant (T = 3.92, p < .001), but theeffect of medication status for classes 2 and 3 (initiallysignificant) were no longer statistically significant (class 2:T = 0.14, p < .888; class 3: T = 0.48, p < .632).
DISCUSSION
Two primary findings of the secondary analysesshould be emphasized: (1) the self-selection hypothesiswas not supported by the propensity analyses and (2)the heterogeneity hypothesis (about multiple trajec-tories of outcome over time) was supported, and someclass-specific effects were significant.First, as expected from the method of propensity
analyses, the quintiles did differ in percentage ofsubjects in the high medication status subgroups at the36-month assessment. This trend increased in amonotonic fashion across the five quintiles (e.g.,25.2%, 50.5%, 60.6%, 75.8%, and 94.7%, for Q1through Q5, respectively). The subjects with higherpropensities to be treated with medication at the 36-month assessment also had higher baseline ADHD andODD symptom levels, higher initial self-reported
TABLE 3Subgroup Size and Average SNAP Ratings for the Three Classes by Assigned Treatment
Class 1 Class 2 Class 3
Treatment (no.) No. % Total Raw Score No. % Total Raw Score No. % Total Raw Score Total
Comb (0) 31 21.4 2.11 90 62.1 1.95 24 16.6 2.18 145Comb (14) 31 21.8 1.56 87 61.3 0.74 24 16.9 0.79 142Comb (24) 31 22.6 1.62 82 59.9 0.89 24 17.5 1.62 137Comb (36) 24 18.9 1.31 80 63.0 0.95 23 18.1 1.93 127MedMgt (0) 41 28.5 2.16 79 54.9 2.00 24 16.7 2.14 144MedMgt (14) 36 26.9 1.59 74 55.2 0.73 24 17.9 0.91 134MedMgt (24) 35 28.2 1.65 65 52.4 0.86 24 19.4 1.55 124MedMgt (36) 32 27.8 1.26 60 52.2 0.93 23 20.0 1.90 115Beh (0) 60 41.7 2.18 66 45.8 1.97 18 12.5 1.97 144Beh (14) 59 41.8 1.77 64 45.4 0.93 18 12.8 1.31 141Beh (24) 58 42.3 1.80 61 44.5 0.96 18 13.1 1.43 137Beh (36) 53 41.7 1.46 56 44.1 0.87 18 14.2 1.93 127CC (0) 67 45.9 2.10 64 43.8 1.90 15 10.3 2.29 146CC (14) 67 47.9 1.76 58 41.4 0.95 15 10.7 1.22 140CC (24) 62 47.3 1.69 54 41.2 1.00 15 11.5 1.72 131CC (36) 55 47.4 1.42 48 41.4 0.83 13 11.2 2.16 116
Note: SNAP = Swanson, Nolan, and Pelham; Comb = combination of medication management and behavior therapy;MedMgt = medication management; Beh = behavior therapy; CC = community comparison.
THE MTA AT 3 YEARS: SECONDARY ANALYSES
1009J . AM. ACAD. CHILD ADOLESC. PSYCHIATRY, 46:8, AUGUST 2007
depression and anxiety symptoms, and worse scores onbaseline social skills, confirming that a number ofimportant baseline and randomization factors com-bined into a single index that is a good predictor ofparticipants` tendencies (i.e., propensity scores) to havehigh medication status at the 36-month assessment.Furthermore, consistent with our previous reports(MTA Cooperative Group, 2004b), characteristics ofthose subjects in the high medication status subgroupsdiffered significantly from the subjects in the lowmedication status subgroups, with greater proportionsof male subjects and greater proportion of subjects withwhite ethnicity, a history of use of medication beforerandomization into the MTA, and initial randomassignment to the MTA Medication Algorithm as acomponent of treatment (Comb and MedMgt).However, our analyses failed to confirm the hypoth-
esis that the loss of the medication advantage at the 36-
month assessment was due to a self-selection related tothe factors included in the propensity score. Thisfinding is difficult to explain. In general, it suggests thatbeyond the 24-month assessment point in the MTAprotocol, the overall effect of medication treatment wasno longer beneficial for the reduction of ADHDsymptoms, although this interpretation must betempered by the observation of a beneficial effect ofmedication in one subgroup (i.e., the 34% of childrenin latent class 1). This overall finding suggests thepossibility of waning benefit for continued medicationbeyond 2 years for a large number of children withADHD. It also supports the potential value of trialwithdrawals of medication (for at least some children)to determine the advisability of continued medication.Second, the GMM analyses identified three latent
classes with different trajectories over time that revealedeffects of medication related to actual (observed) andassigned (randomized) treatment. The effects of actualmedication (the current treatment at the 36-monthassessment) appeared to differ across the latent classes.In class 1, which manifested the smallest initial benefit,the effects of medication increased over time and weresignificant at the 36-month assessment. In contrast,in class 2 and class 3 the medication effects at the36-month assessment were not significant, even thoughthe initial medication advantages were larger than forclass 1 at 14 months. Effects of assigned treatment weremanifested only in class 2, which had the mostfavorable overall trajectory. In this latent class therewas a significant overrepresentation of children whohad been initially randomized to a treatment thatincluded the MTA Medication Algorithm, whether ornot they were taking medication at 36 months. Thisfinding suggests the possibility that early exposure tothe systematic MTA medication regimen may havesome lasting benefit for some children with ADHD,although we were not able to test this directly in theanalyses described and presented here.
Limitations
An important limitation of our propensity scoreanalysis is that other alternative explanations were notexplicitly modeled and cannot be excluded as potentialexplanations for the lack of a long-term benefit ofmedication. Certainly, the basic tradeoff related to anystatistical test holds: failure to confirm the self-selectionhypothesis does not necessarily mean that the null
Fig. 3 Trajectory of outcome over time for the three classes for subgroupsbased on medication use.
SWANSON ET AL.
1010 J. AM. ACAD. CHILD ADOLESC. PSYCHIATRY, 46:8, AUGUST 2007
hypothesis (i.e., the lack of self-selection bias) should beaccepted because this could result in false negatives, butthe search for other explanations must be limited innumber to avoid chance effects or false positives.Multiple reasons for including or not includingmedication as a component of treatment at the 36-month assessment point may have been present andcollapsed into the average outcome score for medicationstatus subgroups in any single propensity quintile,canceling out effects that may represent selection biases.For example, some subjects in a given quintile may havestarted or stopped medication for different reasons: agiven participant and family with high propensity to takemedication may have decided to continue administeringit because the child was doing so well that they did notwish to interfere with what seemed to be working,whereas another family with the same propensity mayhave decided to continue medication for precisely theopposite reason, because the child still was not doingwell. Furthermore, a differential biasing effect of assign-ment to the Beh and MedMgt conditions on actualmedication use may be considered. First, those originallyassigned to Beh constituted a disproportionate share ofthose not medicated at follow-up. However, some in Behstarted treatment with medication during the follow-upphase. Even by the 14-month assessment, based on the50% criterion (see above), 13.7% of those assigned toBeh had already supplemented their treatment withnonprotocol medication and the percentage of the Behgroup medicated continued to rise throughout the 36months (Jensen et al., 2007). Second, it is possible that inthe Beh group, an active decision to seek medication wasmotivated more by high severity of symptoms unrespon-sive to treatment than was a passive decision to continueunmedicated. This could have resulted in migration ofsevere or unresponsive cases originally assigned to Beh tothe group taking medication at follow-up, whereas theless severe or treatment-responsive cases assigned toBeh remained unmedicated. In contrast, it is possiblethat the decision to stop medication in the MedMgt orComb groups was motivated more by low severity ofsymptoms than was the decision to continue withmedication, also resulting in migration of less severe orbetter prognosis cases to a naturalistic group that was notreceiving medication.
Pursuing these complex hypotheses of other possibleselection effects would involve multiple post hoc tests,which must be interpreted with caution, but this may
not be a fool`s errand, given the preliminary findings ofsuch effects in two small subgroups reported in thecompanion paper in this issue of the Journal (see Jensenet al., 2007). Further analyses of the impact of otherpossible selection factors on 36-month treatmentoutcomes are beyond the scope of this report, butshould be investigated. For example, separate propen-sity scores could be based on variables suspected todispose to Bbetter^ or Bworse^ outcome, or a distinc-tion based on endogenous or exogenous variables couldbe made that may help disentangle elements of theoverall propensity scores that may be at cross-purposesand thus cancel effects that are present in separatepropensity scores.Another limitation of the propensity score analyses
is that the number of cases with high and lowmedicationuse was quite unbalanced in some quintiles, so some cellswere extremely small for providing an adequate estimateof the medication effect (i.e., in Q5 there were only fiveunmedicated cases that could be compared to 89medicated cases). However, high and low medicationuse was approximately balanced in the intermediatequintiles, and there was still no evidence of a significantmedication effect at the 36-month assessment.One limitation of the GMM analyses is that high
(i.e., severe) baseline ratings on the SNAP was an MTAentry criterion. This logically limits the number andcharacteristics of possible trajectories over time. Forexample, patterns with an initial low severity thatincreases linearly over time or quadratic patterns of lowseverity that increases and then decreases are notpossible if all subjects start with high severity. In aclinical trial for participants who must meet initialcriteria for ADHD, this restriction of range of baselinescore is unavoidable.Another limitation of the GMM analyses is the
inherent difficulty in detecting treatment effects withinlatent classes because classes are defined by subjects withhomogeneous temporal response patterns on changes inADHD symptoms over time. The treatment effectsmay produce such subgroups and obscure develop-mental trends related to natural history, or strongdevelopmental trends may produce such subgroups andobscure treatment effects.Also, use of a single outcome measure (ADHD
symptoms) in propensity score and GMM analyses is alimitation. This restriction was accepted here to providea simple example of the propensity score and GMM
THE MTA AT 3 YEARS: SECONDARY ANALYSES
1011J . AM. ACAD. CHILD ADOLESC. PSYCHIATRY, 46:8, AUGUST 2007
analytical methods, which may be unfamiliar to manyreaders and be unnecessarily complicated by evaluatingmultiple outcome measures. It is possible that if we hadused other outcome measures, such as global impair-ment, social skills, or family function, our findings andconclusions may have been different. These or similaranalyses will be addressed in future papers. In fact,GMM analyses of two additional outcome measures,substance use and delinquency, are considered in thecompanion paper in this issue of the Journal bySwanson et al. (2007), which complement the GMManalysis presented here for outcome based on ADHDsymptoms. These alternative outcome measures areexpected to become more important than the ADHDsymptom measures as the age of the children increasesover future follow-up assessments.
Clinical Implications
One of the three trajectories identified by our GMManalyses suggests a pattern of response of great concernto those treating children with ADHD: children in class3 showed a large initial beneficial effect that was notmaintained but instead completely dissipated over timeas children matured to late childhood or earlyadolescence. This subgroup of 14% of the MTA samplewas characterized by high initial symptom scores andbaseline aggression, lower IQs, lower social skills, andother risk factors. Future research must determinewhether these difficult cases, representing the mostseverely impaired of children with ADHD in the MTA,would have maintained the initial gains and showngreater benefit at the 36-month assessment if muchmore intensive, additional, or longer term treatmentswere delivered than we were able to offer during the 14-month treatment phase of theMTA, or whether creativenew treatment paradigms are needed for this subgroupwith poor prognosis.On a more positive note, our overall findings suggest
that half of the children who met our entry criterion ofmoderate to severe manifestation of ADHD Combinedtype (i.e., class 2) did manifest considerable improve-ment in the initial treatment phase of the MTA andmaintained these gains for 3 years. This improvementwas maintained in the cases initially treated withmedication even after this component of treatment wasdiscontinued. The maintenance of gains followingmedication discontinuation is a controversial topic.This finding is consistent with one study of the long-
term effects of stimulant medication that did not showa return of ADHD symptoms when medication wasstopped after 1 year of treatment (Gillberg et al., 1997),but it is inconsistent with another that did show areturn of ADHD symptoms when medication wasstopped after 1 year of intensive treatment (Abikoffet al., 2004). We should note, however, that disconti-nuation of long-term medication was a patient/familydecision in the MTA, but a result of randomization inthe Gillberg et al. (1997) and Abikoff et al. (2004)studies. Moreover, to enter the latter study, childrenhad to demonstrate clinical benefit with methylpheni-date (improvement in ADHD symptoms, tolerable sideeffects, deterioration with placebo substitution).Furthermore, the Gillberg et al. (1997) study includedyoungsters with PDD or mental retardation diagnoses,which were exclusionary in the MTA and Abikoff et al.studies. It is unknown to what extent these differencescontributed to the inconsistent findings in the litera-ture. However, our findings provide some support forthe common clinical practice of periodically disconti-nuingmedication on a trial basis (a medication holiday),to determine whether it is still necessary.
The Multimodal Treatment Study of Children with ADHD(MTA) was a National Institute of Mental Health (NIMH)cooperative agreement randomized clinical trial involving sixclinical sites. Collaborators from the National Institute of MentalHealth: Peter S. Jensen, M.D. (currently at Columbia University,New York), L. Eugene Arnold, M.D., M.Ed. (currently at OhioState University), Joanne B. Severe, M.S. (Clinical Trials Opera-tions and Biostatistics Unit, Division of Services and InterventionResearch), Benedetto Vitiello, M.D. (Child & Adolescent Treat-ment and Preventive Interventions Research Branch), KimberlyHoagwood, Ph.D. (currently at Columbia University, New York);previous contributors from NIMH to the early phase: JohnRichters, Ph.D. (currently at National Institute of NursingResearch); Donald Vereen, M.D. (currently at National Instituteon Drug Abuse). Principal investigators and co-investigators fromthe clinical sites are: University of California, Berkeley/SanFrancisco: Stephen P. Hinshaw, Ph.D. (Berkeley), Glen R. Elliott,Ph.D., M.D. (San Francisco); Duke University: C. Keith Conners,Ph.D., Karen C. Wells, Ph.D., John March, M.D., M.P.H., JeffreyEpstein, Ph.D.; University of California, Irvine/Los Angeles: JamesSwanson, Ph.D. (Irvine), Dennis P. Cantwell, M.D. (deceased, LosAngeles), Timothy Wigal, Ph.D. (Irvine); Long Island JewishMedical Center/Montreal Children`s Hospital: Howard B. Abikoff,Ph.D. (currently at New York University School of Medicine), LilyHechtman, M.D. (McGill University, Montreal); New York StatePsychiatric Institute/Columbia University/Mount Sinai MedicalCenter, New York: Laurence L. Greenhill, M.D. (ColumbiaUniversity), Jeffrey H. Newcorn, M.D. (Mount Sinai School ofMedicine); University of Pittsburgh: William E. Pelham, Ph.D.(currently at State University of New York, Buffalo), Betsy Hoza,
SWANSON ET AL.
1012 J. AM. ACAD. CHILD ADOLESC. PSYCHIATRY, 46:8, AUGUST 2007
Ph.D. (currently at University of Vermont, Burlington), BrookeMolina, Ph.D. Original statistical and trial design consultant:Helena C. Kraemer, Ph.D. (Stanford University). Follow-up phasestatistical collaborators: Robert D. Gibbons, Ph.D. (University ofIllinois, Chicago), Sue Marcus, Ph.D. (Mt. Sinai School ofMedicine, New York), Kwan Hur, Ph.D. (University of Illinois,Chicago). Collaborator from the Office of Special EducationPrograms/U.S. Department of Education: Thomas Hanley, Ed.D.Collaborator from Office of Juvenile Justice and DelinquencyPrevention/Department of Justice: Karen Stern, Ph.D.
Disclosure: During the course of the MTA, since 1992: Dr. Swansonhas received research support from Alza, Richwood, Shire, Celgene,Novartis, Celltech, Gliatech, Cephalon, Watson, CIBA, Janssen, andMcNeil; has been on the advisory board of Alza, Richwood, Shire,Celgene, Novartis, Celltech, UCB, Gliatech, Cephalon, McNeil, andEli Lilly; has been on the speakers` bureaus of Alza, Shire, Novartis,Celltech, UCB, Cephalon, CIBA, Janssen, and McNeil; and has actedas a consultant to Alza, Richwood, Shire, Celgene, Novartis, Celltech,UCB, Gliatech, Cephalon, Watson, CIBA, Janssen, McNeil, and EliLilly. Dr. Hinshaw has consulted to Noven and Sigma Tau and hasbeen on the speakers` bureau of McNeil. Dr. Arnold has receivedresearch funding from Celgene, Shire, Noven, Eli Lilly, Targacept,Sigma Tau, and Novartis; has consulted to Shire, Noven, Sigma Tau,Ross, and Organon; and has been on the speakers` bureaus of Abbott,Shire, McNeil, and Novartis. Dr. Jensen has received research fundingfromMcNeil; has received unrestricted grants from Pfizer; has consultedto Best Practice, Inc., Shire, Janssen, Novartis, and UCB; and hasparticipated on the speakers’ bureaus of Janssen-Ortho, Alza, McNeil,UCB, CME Outfitters, and the Neuroscience Education Institute. Dr.Vitiello has consulted to Richwood Pharmaceuticals. Dr. Abikoff hasreceived research funding from McNeil, Shire, Eli Lilly, and BristolMyers-Squibb; has consulted to McNeil, Shire, Eli Lilly, Pfizer,Celltech, Cephalon, and Novartis; and has been on the speakers`bureaus of McNeil, Shire, and Celltech. Dr. Greenhill has receivedresearch funding from or has been on the speakers` bureaus of Eli Lilly,Alza, Shire, Cephalon, McNeil, Celltech, Novartis, Sanofi Aventis,Otsuka, and Janssen. Dr. Hechtman has received research funding fromNational Institute of Mental Health, Eli Lilly, GlaxoSmithKline,Janssen-Ortho, Purdue Pharma, and Shire; has been on the speakers`bureau of National Institute of Mental Health, Eli Lilly, Janssen-Ortho, and Shire; and has served on the advisory boards of Eli Lilly,Janssen-Ortho, Purdue Pharma, and Shire. Dr. Pelham has receivedresearch funding from Alza, Shire, Noven, Eli Lilly, and Cephalon; hasserved on the advisory boards of or has consulted to Alza/McNeilRichwood/Shire, Noven, Eli Lilly, Cephalon, Novartis, Celgene, andAbbott; and has been on the speakers` bureaus of Shire and McNeil. Dr.Conners has received research funding from Celgene, Shire, Noven, EliLilly, Targacept, and Novartis; has consulted to Celgene, Shire,Novartis, Alza, and Noven; is on the Lilly Advisory Committee and theShire advisory board; and has been on the speakers` bureaus of Shire,McNeil, Concerta, Johnson & Johnson, and Novartis. Dr. March hasbeen a consultant or scientific advisor to or received research fundingfrom Eli Lilly, Pfizer, Wyeth, Jazz, MedAvante, Shire, Cephalon,Organon, McNeil, and AstraZeneca; serves on a DSMB for Organon,Johnson & Johnson, and AstraZeneca; and holds stock in MedAvante.Dr. Elliott has received research funding from Cephalon, McNeil,Shire, Sigma Tau, and Novartis; has consulted to Cephalon andMcNeil; and has been on the speakers` bureaus of Janssen, Eli Lilly, andMcNeil. Dr. Epstein has received research funding from McNeil, Shire,
Eli Lilly, and Novartis; has been on the advisory board of Shire; and hasbeen on the speakers` bureaus of Shire and McNeil. Dr. Hoza hasreceived research funding from MediaBalance, Inc. and has receivedsupport for educational conferences from Abbott Laboratories. Dr.Newcorn has received research funding from or has been on the speakers`bureaus of Eli Lilly, Alza, Shire, Celgene, McNeil, Celltech/UCB,Novartis, Sanofi Aventis, Janssen, and Bristol-Myers Squibb. Dr.Wigal has received research funding from Eli Lilly, Shire, Novartis, andMcNeil and has been on the speakers` bureaus of McNeil and Shire.The other authors have no financial relationships to disclose.
REFERENCES
Abikoff H, Hechtman L, Klein RG et al. (2004), Symptomatic improvementin children with ADHD treated with long-term methylphenidate andmultimodal psychosocial treatment. J Am Acad Child Adolesc Psychiatry43:802Y811
Brookhart MA, Schneeweiss S, Rothman KJ, Glynn RJ, Anorn J, Sturmer T(2006), Variable selection for propensity score models. Am J Epidemiol163:1149Y1156
Gillberg C, Melander H, von Knorring A et al. (1997), Long-term stimulanttreatment of children with attention-deficit hyperactivity disordersymptoms. A randomized, double-blind, placebo-controlled trial. ArchGen Psychiatry 54:857Y864
Hedeker D, Gibbons RD (2006), Longitudinal Data Analysis. New York:Wiley
Hoagwood K, Jensen P, Arnold LE et al., the MTA Cooperative Group(2004), Reliability of the Services for Children and Adolescents-ParentInterview (SCAPI). J Am Acad Child Adolesc Psychiatry 43:1345Y1354
Jensen PS, Hoagwood K, Roper M et al. (2004), The Services for Childrenand Adolescents-Parent Interview (SCAPI): development and perfor-mance characteristics. J Am Acad Child Adolesc Psychiatry 43:1334Y1344
Jensen PS, Swanson JM, Arnold LE et al. (2007), 3-Year follow-up of theNIMH MTA study. J Am Acad Child Adolesc Psychiatry 46:988Y1001
Laird NM, Ware JH (1982), Random-effects models for longitudinal data.Biometrics 38:963Y974
Marcus SM, Gibbons RD (2001), Estimating the efficacy of receivingtreatment in randomized clinical trials with noncompliance. HealthServices Outcomes Res Methodol 2:247Y258
MTA Cooperative Group (1999a), A 14-month randomized clinical trial oftreatment strategies for attention-deficit/hyperactivity disorder. Arch GenPsychiatry 56:1073Y1086
MTA Cooperative Group (1999b), Moderators and mediators of treatmentresponse for children with attention-deficit/hyperactivity disorder. ArchGen Psychiatry 56:1088Y1096
MTA Cooperative Group (2004a), The NIMHMTA follow-up: 24-monthoutcomes of treatment strategies for attention-deficit/hyperactivitydisorder (ADHD). Pediatrics 113:754Y761
MTA Cooperative Group (2004b), The NIMH MTA follow-up: changesin effectiveness and growth after the end of treatment. Pediatrics113:762Y769
Owens EB, Hinshaw SP, Kraemer HC et al. (2003), Which treatment forwhom for ADHD? Moderators of treatment response in the MTA. JConsult Clin Psychol 71:540Y552
Rosenbaum P, Rubin D (1983), The central role of the propensity score inobservational studies for causal effects. Biometrika 70:41Y55
Swanson JM (1992), School-Based Assessments and Interventions for ADDStudents. Irvine, CA: K.C. Publishing
Swanson JM, Kraemer HC, Hinshaw SP et al. (2001), Clinical relevance ofthe primary findings of the MTA: success rates based on severity ofADHD and ODD symptoms at the end of treatment. J Am Acad ChildAdolesc Psychiatry 40:168Y179
Swanson JM, Elliott GR, Greenhill LL et al. (2007), Effects of stimulantmedication on growth rates across 3 years in theMTA Follow-up. J Am AcadChild Adolesc Psychiatry 46:1014Y1026
THE MTA AT 3 YEARS: SECONDARY ANALYSES
1013J . AM. ACAD. CHILD ADOLESC. PSYCHIATRY, 46:8, AUGUST 2007
Related Documents