Secondary analysis of the CHOIR trial epoetin-α dose and achieved hemoglobin outcomes Lynda A. Szczech 1,2 , Huiman X. Barnhart 2,3 , Jula K. Inrig 1,2 , Donal N. Reddan 1,4 , Shelly Sapp 2,3 , Robert M. Califf 5 , Uptal D. Patel 1,2 , and Ajay K. Singh 6 1 Department of Medicine, The Renal Division, Duke University Medical Center, Durham, North Carolina, USA 2 Duke Clinical Research Institute, North Carolina, Durham, USA 3 Department of Biostatistics and Bioinformatics, Duke University, Durham, North Carolina, USA 4 Department of Medicine, University College Galway, Galway, Ireland 5 Duke Translational Research Institute, Durham, North Carolina, USA 6 The Renal Division, Brigham and Women’s Hospital and Harvard Medical School, Boston, Massachusetts, USA Abstract Trials of anemia correction in chronic kidney disease have found either no benefit or detrimental outcomes of higher targets. We did a secondary analysis of patients with chronic kidney disease enrolled in the Correction of Hemoglobin in the Outcomes in Renal Insufficiency trial to measure the potential for competing benefit and harm from achieved hemoglobin and epoetin dose trials. In the 4 month analysis, significantly more patients in the high-hemoglobin compared to the low- hemoglobin arm were unable to achieve target hemoglobin and required high-dose epoetin-α. In unadjusted analyses, the inability to achieve a target hemoglobin and high-dose epoetin-α were each significantly associated with increased risk of a primary endpoint (death, myocardial infarction, congestive heart failure or stroke). In adjusted models, high-dose epoetin-α was associated with a significant increased hazard of a primary endpoint but the risk associated with randomization to the high hemoglobin arm did not suggest a possible mediating effect of higher target via dose. Similar results were seen in the 9 month analysis. Our study demonstrates that patients achieving their target had better outcomes than those who did not; and among subjects Correspondence: Lynda A. Szczech, Duke University Medical Center, Division of Nephrology, Department of Medicine, Box 3646, Durham, North Carolina 27710, USA. [email protected]. DISCLOSURE The original CHOIR trial was supported by Ortho Biotech Clinical Affairs and Johnson & Johnson Pharmaceutical Research and Development, both subsidiaries of Johnson & Johnson. This analysis was supported by Duke Clinical Research Institute. Dr Szczech reports receiving consulting fees from Ortho Biotech Clinical Affairs, Nabi Pharmaceuticals, Gilead, Fresenius Medical Care, Kureha, Affymax, and Acologix; lecture fees from Nabi Biopharmaceuticals, Fresenius Medical Care, GlaxoSmithKline, Gilead, Genzyme, Abbott, Amgen, and Ortho Biotech; and grant support from Ortho Biotech Clinical Affairs, GlaxoSmithKline, Pfizer, and Genzyme. Dr Barnhart reports receiving consulting fees and grant support from Ortho Biotech Clinical Affairs. Dr Inrig reports support by NIH Grant 1KL2 RR024127 and the R Snyderman Clinical Research Fellowhip Grant. She has also received investigator-initiated research support from Genzyme. Dr Reddan reports receiving consulting fees from Ortho Biotech Clinical Affairs and Shire Pharmaceuticals; lecture fees from Amgen, Novartis, Pfizer, AstraZeneca, and General Electric; and grant support from Ortho Biotech Clinical Affairs, Amgen, and Novartis. Ms Sapp has no disclosures. Dr Califf reported having received research grants and contracts from Merck, Novartis Pharmaceutical, Shering Plough, and Scios Pharma. He also reports receiving consulting fees from Avalere Health, Bayer, Biogen Idec, Grandeis Univ, Bristol Myers Squibb/Sanofi, Eli Lilly, Five Prime, Heart.org/Conceptis, Kowa Research Institute, Nitrox LLC, Sanofi-Aventis, and Vertex. Dr Patel reports support by NIH Grant K23DK075929 and investigator-initiated research support from Abbott Laboratories. Dr Singh reports receiving consulting fees from Ortho Biotech Clinical Affairs, Amgen, Roche, Merck (Germany), Abbott, Watson, and Horizon Blue Cross Blue Shield and lecture fees from Ortho Biotech Clinical Affairs, Roche, Amgen, Abbott, Watson, Scios, Pfizer, and Genzyme; serving on advisory boards for Ortho Biotech Clinical Affairs, Roche, Acologix, Watson, Advanced Magnetics, and Amgen; and receiving grant support from Ortho Biotech Clinical Affairs, Dialysis Clinic, Roche, Baxter, Johnson & Johnson, Amgen, Watson, and Aspreva. No other potential conflict of interest relevant to this article was reported. NIH Public Access Author Manuscript Kidney Int. Author manuscript; available in PMC 2010 July 12. Published in final edited form as: Kidney Int. 2008 September ; 74(6): 791–798. doi:10.1038/ki.2008.295. NIH-PA Author Manuscript NIH-PA Author Manuscript NIH-PA Author Manuscript

Welcome message from author
This document is posted to help you gain knowledge. Please leave a comment to let me know what you think about it! Share it to your friends and learn new things together.
Transcript
Secondary analysis of the CHOIR trial epoetin-α dose andachieved hemoglobin outcomes
Lynda A. Szczech1,2, Huiman X. Barnhart2,3, Jula K. Inrig1,2, Donal N. Reddan1,4, ShellySapp2,3, Robert M. Califf5, Uptal D. Patel1,2, and Ajay K. Singh6
1 Department of Medicine, The Renal Division, Duke University Medical Center, Durham, NorthCarolina, USA 2 Duke Clinical Research Institute, North Carolina, Durham, USA 3 Department ofBiostatistics and Bioinformatics, Duke University, Durham, North Carolina, USA 4 Department ofMedicine, University College Galway, Galway, Ireland 5 Duke Translational Research Institute,Durham, North Carolina, USA 6 The Renal Division, Brigham and Women’s Hospital and HarvardMedical School, Boston, Massachusetts, USA
AbstractTrials of anemia correction in chronic kidney disease have found either no benefit or detrimentaloutcomes of higher targets. We did a secondary analysis of patients with chronic kidney diseaseenrolled in the Correction of Hemoglobin in the Outcomes in Renal Insufficiency trial to measurethe potential for competing benefit and harm from achieved hemoglobin and epoetin dose trials. Inthe 4 month analysis, significantly more patients in the high-hemoglobin compared to the low-hemoglobin arm were unable to achieve target hemoglobin and required high-dose epoetin-α. Inunadjusted analyses, the inability to achieve a target hemoglobin and high-dose epoetin-α wereeach significantly associated with increased risk of a primary endpoint (death, myocardialinfarction, congestive heart failure or stroke). In adjusted models, high-dose epoetin-α wasassociated with a significant increased hazard of a primary endpoint but the risk associated withrandomization to the high hemoglobin arm did not suggest a possible mediating effect of highertarget via dose. Similar results were seen in the 9 month analysis. Our study demonstrates thatpatients achieving their target had better outcomes than those who did not; and among subjects
Correspondence: Lynda A. Szczech, Duke University Medical Center, Division of Nephrology, Department of Medicine, Box 3646,Durham, North Carolina 27710, USA. [email protected] original CHOIR trial was supported by Ortho Biotech Clinical Affairs and Johnson & Johnson Pharmaceutical Research andDevelopment, both subsidiaries of Johnson & Johnson. This analysis was supported by Duke Clinical Research Institute. Dr Szczechreports receiving consulting fees from Ortho Biotech Clinical Affairs, Nabi Pharmaceuticals, Gilead, Fresenius Medical Care, Kureha,Affymax, and Acologix; lecture fees from Nabi Biopharmaceuticals, Fresenius Medical Care, GlaxoSmithKline, Gilead, Genzyme,Abbott, Amgen, and Ortho Biotech; and grant support from Ortho Biotech Clinical Affairs, GlaxoSmithKline, Pfizer, and Genzyme.Dr Barnhart reports receiving consulting fees and grant support from Ortho Biotech Clinical Affairs. Dr Inrig reports support by NIHGrant 1KL2 RR024127 and the R Snyderman Clinical Research Fellowhip Grant. She has also received investigator-initiated researchsupport from Genzyme. Dr Reddan reports receiving consulting fees from Ortho Biotech Clinical Affairs and Shire Pharmaceuticals;lecture fees from Amgen, Novartis, Pfizer, AstraZeneca, and General Electric; and grant support from Ortho Biotech Clinical Affairs,Amgen, and Novartis. Ms Sapp has no disclosures. Dr Califf reported having received research grants and contracts from Merck,Novartis Pharmaceutical, Shering Plough, and Scios Pharma. He also reports receiving consulting fees from Avalere Health, Bayer,Biogen Idec, Grandeis Univ, Bristol Myers Squibb/Sanofi, Eli Lilly, Five Prime, Heart.org/Conceptis, Kowa Research Institute,Nitrox LLC, Sanofi-Aventis, and Vertex. Dr Patel reports support by NIH Grant K23DK075929 and investigator-initiated researchsupport from Abbott Laboratories. Dr Singh reports receiving consulting fees from Ortho Biotech Clinical Affairs, Amgen, Roche,Merck (Germany), Abbott, Watson, and Horizon Blue Cross Blue Shield and lecture fees from Ortho Biotech Clinical Affairs, Roche,Amgen, Abbott, Watson, Scios, Pfizer, and Genzyme; serving on advisory boards for Ortho Biotech Clinical Affairs, Roche,Acologix, Watson, Advanced Magnetics, and Amgen; and receiving grant support from Ortho Biotech Clinical Affairs, DialysisClinic, Roche, Baxter, Johnson & Johnson, Amgen, Watson, and Aspreva. No other potential conflict of interest relevant to this articlewas reported.
NIH Public AccessAuthor ManuscriptKidney Int. Author manuscript; available in PMC 2010 July 12.
Published in final edited form as:Kidney Int. 2008 September ; 74(6): 791–798. doi:10.1038/ki.2008.295.
NIH
-PA Author Manuscript
NIH
-PA Author Manuscript
NIH
-PA Author Manuscript
who achieved their randomized target, no increased risk associated with the higher hemoglobingoal was detected. Prospective studies are needed to confirm this relationship and determine safedosing algorithms for patients unable to achieve target hemoglobin.
Keywordsanemia; chronic kidney disease; epoetin-α; dose; epidemiology and outcomes
Recombinant erythropoietin revolutionized the care of patients with chronic kidney disease(CKD) and end-stage renal disease (ESRD)1,2 reducing blood transfusions andcomplications like iron overload. Although initial therapy was aimed at partial anemiacorrection, observational studies suggested that treatment with erythropoietin-stimulatingagents (ESA) to higher targets was associated with improved survival.3,4 Three randomizedtrials of anemia correction in CKD and ESRD patients, however, failed to demonstrate abenefit of higher hemoglobin targets.5–8 In fact, the final analyses of one trial unexpectedlydemonstrated harm among subjects randomized to higher targets.5
Two factors that may contribute to worse outcomes with higher targets include failure toattain target and higher doses of ESAs. Higher doses of ESAs are required with higherhemoglobin targets,5,7 and the failure to achieve a hemoglobin target leads to furtherincreases in ESA dose. In an observational study among patients with ESRD, a lesserresponse to therapy as well as higher doses of ESA were associated with increased mortality.9
This secondary analysis of subjects with CKD enrolled in the Correction of Hemoglobin andOutcomes in Renal Insufficiency (CHOIR) trial was undertaken to examine the potential forcompeting benefit and harm from achieved dose of hemoglobin and epoetin. Specifically,this analysis examines the associations between ESA dose, inability to achieve hemoglobintarget, and clinical outcomes.
RESULTSFour-month landmark analysis
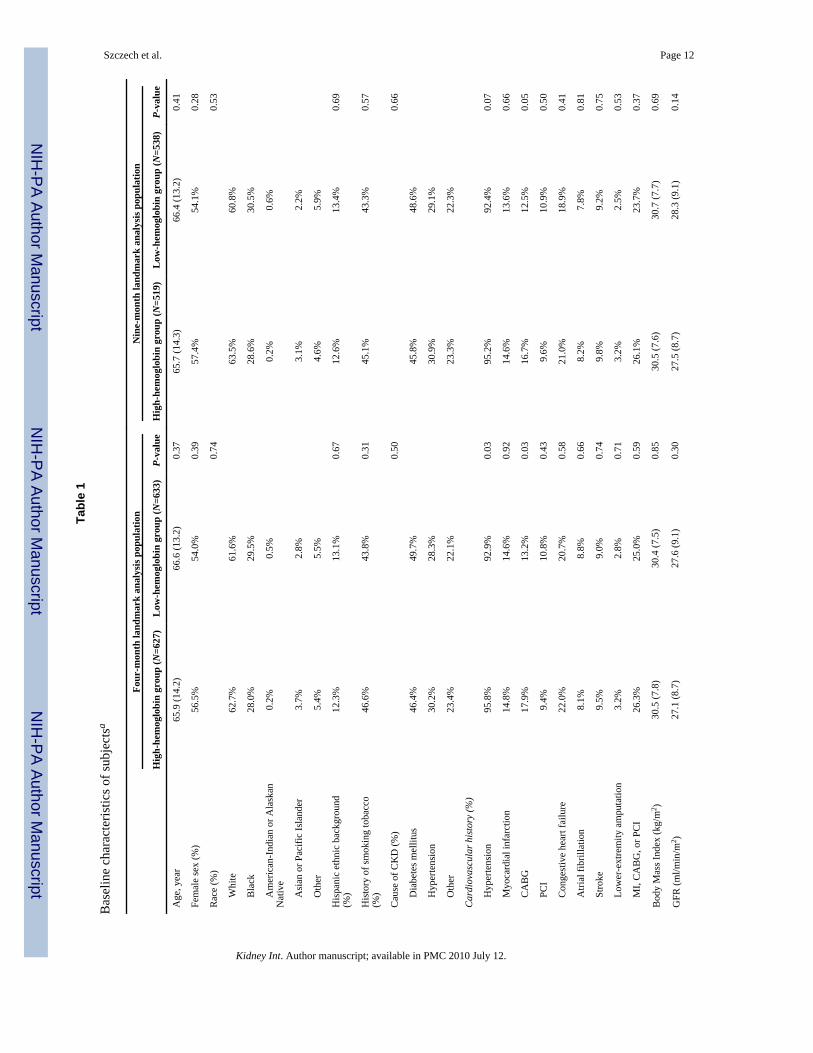
Baseline characteristics including markers of inflammation, such as albumin and ferritin,were similar between groups analyzed in the 4-month landmark analysis (Table 1, n =1290).Hemoglobin at baseline and at 3 weeks (before which subjects all received the same ESAdose) were similar between groups. Subjects randomized to the high-hemoglobin arm had ahigher prevalence of self-reported hypertension and coronary artery bypass graft (both P=0.03).
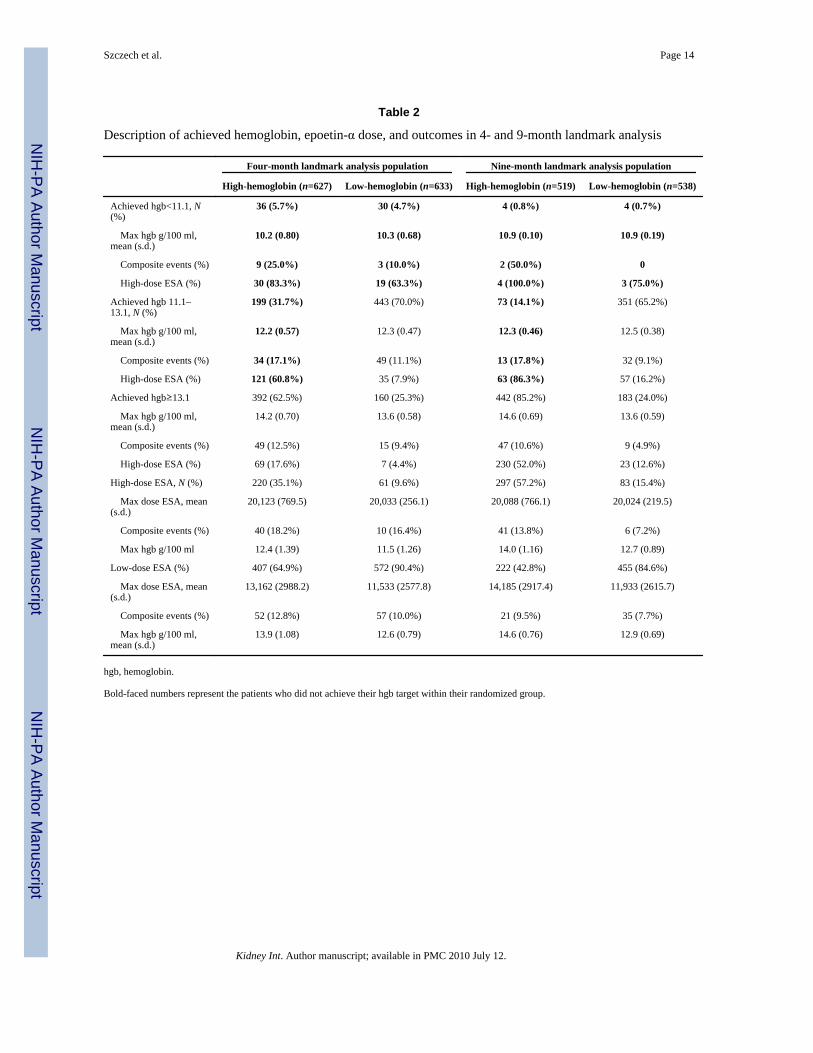
In both treatment groups, subjects not achieving their target hemoglobin within 4 monthsexperienced events at a higher rate (Table 2). During this first 4 months, a greater proportionof subjects in the high-hemoglobin as compared with the low-hemoglobin group wereunable to achieve their target (37.5 vs 4.7%, P<0.001).
Within each arm, subjects receiving high-dose epoetin-α experienced events at a higher rate(18.2 vs 12.8% in the high-hemoglobin and 16.4 vs 10.0% in the low-hemoglobin groups).A larger proportion of subjects in the high-hemoglobin as compared with the low-hemoglobin group required high-dose epoetin-α (35.1 vs 9.6%, P<0.001). Among subjectsnot achieving their target, 64.2% received high-dose epoetin-α as compared with 11.2%among subjects achieving their target (P<0.001).
Szczech et al. Page 2
Kidney Int. Author manuscript; available in PMC 2010 July 12.
NIH
-PA Author Manuscript
NIH
-PA Author Manuscript
NIH
-PA Author Manuscript
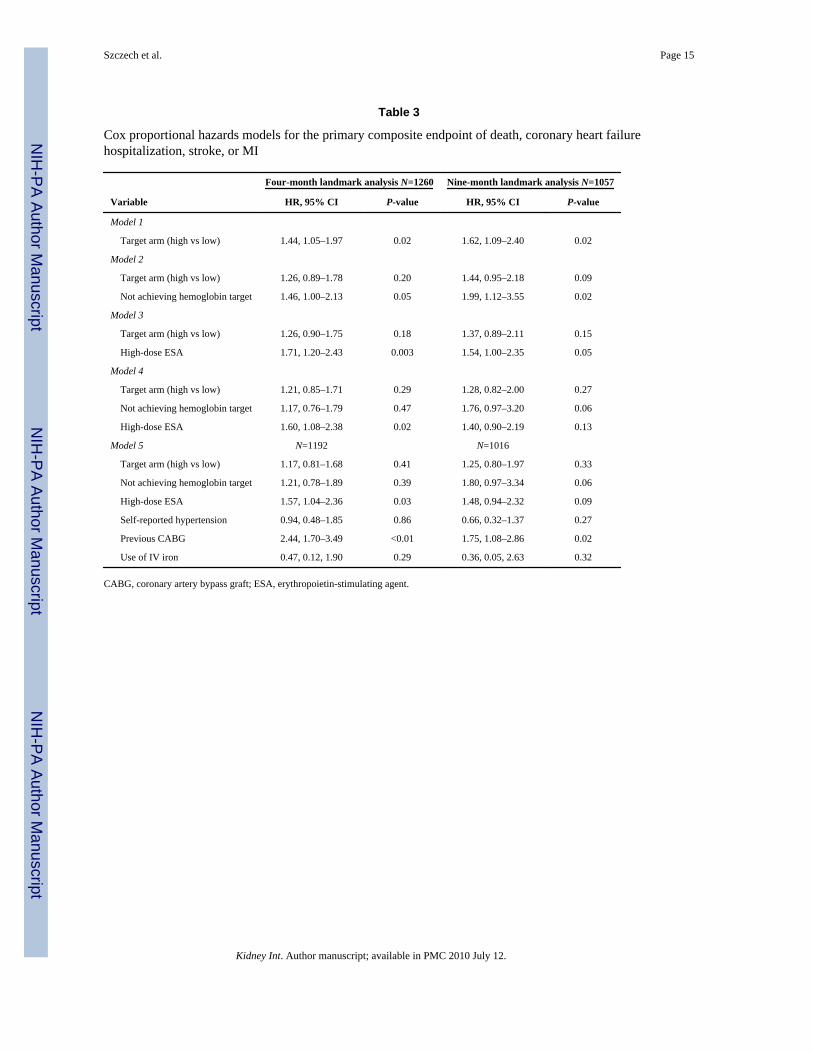
The high-hemoglobin as compared with low-hemoglobin group in the 4-month landmarkanalysis had an increased hazard of the primary end point (1.44, CI 1.05–1.97, P =0.02)(Table 3, PFigure 1). When inability to achieve target hemoglobin and use of high-doseepoetin-α were added to the model with treatment arm separately, treatment arm was notsignificant, and inability to achieve target or use of high-dose epoetin-α were significantpredictors ( =0.05 and 0.003). When dose, target, and inability to achieve target wereentered, only high-dose epoetin-α remained significant (HR =1.60, CI 1.08–2.38, P =0.02).In the adjusted model, high-dose epoetin-α was associated with a 57% increased hazard ofthe primary composite end point (HR 1.57, CI 1.04–2.36, P =0.03) (Table 3, PFigure 1). Astreatment assignment to higher target is significantly associated with inability to achievetarget and use high-dose epoetin-α by the landmark time point, this suggests that detrimentaloutcome of higher target in CHOIR trial may be mediated through the use of high dose. Nosignificant interactions were present between achieved hemoglobin, high-dose ESA, ortreatment arm (all >0.10).
A restricted cubic spline Cox regression model was fitted to examine the relationship ofaverage dose before the 4-month landmark time point with outcome. In the low-hemoglobingroup (median average epoetin dose 5623, 25–75% IQR 3959–8376 U), the relationshipbetween dose and log hazard surrounding the majority of observations appear to be J-shaped(Figure 2a), although the confidence interval widens at higher dosing levels. In the high-hemoglobin group (median epoetin dose 10,786, IQR 7803–14,114 U), the relationshipbetween dose and log hazard surrounding the majority of observations appears to be linear(Figure 2b).
Nine-month landmark analysisFindings of the 9-month landmark analysis were similar to those of the 4-month analysis.Among subjects included in the 9-month landmark analysis (n =1057), factors reflectinginflammation were similar between treatment arms (Table 1).
Subjects not achieving their target hemoglobin within the first 9 months of the trialexperienced events at a higher rate (Table 2). During these first 9 months, a greaterproportion of subjects in the high-hemoglobin, as compared with the low-hemoglobin group,were unable to achieve their target hemoglobin (14.8 vs 0.7%, P<0.001).
Within the high-hemoglobin group, subjects receiving high-dose epoetin-α experiencedevents at a higher rate (13.8 vs 9.5%). Event rates for high- vs low-dose epoetin-α weresimilar in the low-hemoglobin group (7.2 vs 7.7%). A larger proportion of subjects in thehigh-hemoglobin as compared with the low-hemoglobin group required high-dose epoetin-α(57.2 vs 15.4%, P<0.001). Among subjects not achieving their target, 86.4% required high-dose epoetin-α as compared with 31.8% among subjects achieving their target (P<0.001).
Randomization to the high-hemoglobin as compared with the low-hemoglobin group wasassociated with an increased hazard of primary end point (1.62, CI 1.09–2.40, P =0.02)(Table 3, PFigure 1). When added to models containing treatment arm, inability to achievetarget and high-dose epoetin-α separately were predictors of worse outcomes ( =0.02 and0.05). When dose, target, and inability to achieve target were entered, inability to achievetarget trended toward a significant association with outcomes (HR =1.76, CI 0.97–3.20, P=0.06), and high-dose epoetin-α therapy held a similar point estimate as was seen in the 4-month landmark, however, no longer reaching statistical significance (HR =1.40, CI 0.90–2.19, P =0.13). In the adjusted model, relationships were similar (Table 3, Figure 1).
Again, the restricted cubic spline Cox regression model shows that in the low-hemoglobingroup (median epoetin dose 4513, IQR 2949–7026 U), the relationship between dose and
Szczech et al. Page 3
Kidney Int. Author manuscript; available in PMC 2010 July 12.
NIH
-PA Author Manuscript
NIH
-PA Author Manuscript
NIH
-PA Author Manuscript
log hazard surrounding the majority of observations may be J-shaped (Figure 2c), althoughthe confidence interval widens at higher dosing levels. In the high-hemoglobin group(median epoetin dose 10,692, IQR 7821–14,410 U), the relationship between dose and loghazard surrounding the majority of observations was linear (Figure 2d).
DISCUSSIONAlthough complete correction of anemia of kidney disease with epoetin-α has beenassociated with increased mortality compared with partial correction,5,8 the underlyingmechanisms are not clear. This post hoc analysis of CHOIR generates the hypothesis thattoxicities related to high-dose epoetin-α may contribute to worse outcomes among subjectswith higher targets particularly among those who do not achieve their targeted hemoglobin.Further, this analysis demonstrates that subjects achieving their target had better outcomesthan those who did not, and among subjects who achieved their randomized target, noincreased risk associated with the higher hemoglobin goal was detected.
Similar to CHOIR, the Normal Hematocrit study demonstrated a relative risk of 1.28, 95%CI 0.92, 1.78, favoring the low-hematocrit group.8 Subjects achieving the higher target had alower mortality rate than subjects in the lower-hematocrit group.7 Higher hemoglobin valuesalone in both the Normal Hematocrit study and CHOIR were not associated with worseoutcomes. Rather, lower achieved values appeared to be associated with higher mortality.Additionally, in the Normal Hematocrit study, following cessation of the target intervention,subjects randomized to the higher arm had ‘near-identical’ rates of mortality as thoserandomized to the lower target.8 Thus, although being randomized to the higher hemoglobintreatment arm in each study that resulted in higher rates of adverse outcomes overall,achieving the higher hemoglobin target was associated with lower mortality. And followingdiscontinuation of the intervention to achieve the higher target, differences in outcomes arelost. This implies that another factor must be responsible for these outcomes differences.The analysis presented here suggests that factor may be high-doses of epoetin-α.
Epoetin-α requirements are variable among anemic patients.1,7,9,10 This variability has beenattributed to multiple etiologies, including iron deficiency, infection, and inflammation.9–11
Hyporesponsiveness to epoetin requires higher doses.12 Among those in the higher targethemoglobin group, the high doses of epoetin were associated with poorer outcomes, andwhen higher epoetin doses were considered in multivariate analyses, treatment to the higherhemoglobin target was no longer associated with increased risk, suggesting possiblemediating effect of higher target via dose.
Higher doses of epoetin have been demonstrated to be an independent predictor of mortalityin United States Renal Data Service data of hemodialysis patients.9 Across all hematocritcategories, significant direct relationships between dose and mortality were observed. Thesteepest increases in risk were found above the 72.5th dose percentile, corresponding to18,800–29,300 U, similar to the analyses presented here. However, because of theobservational nature of the United States Renal Data Service data set, the possibility thatrelationship between dose and outcome may reflect confounding due by comorbidity andinflammation cannot be excluded.
Defining a relationship between dose and outcomes must attempt to separate the potentialcontribution of increased dose requirement as a marker of comorbidity. Two observationalstudies have demonstrated relationships between epoetin dose requirements and clinicalfactors such as age, diabetes mellitus, and serum ferritin.12,13 This potential for confoundinglimits the ability of a data set with a single hemoglobin target or dosing strategy to discernwhether the risk detected is associated with dose or with clinical factors necessitating the
Szczech et al. Page 4
Kidney Int. Author manuscript; available in PMC 2010 July 12.
NIH
-PA Author Manuscript
NIH
-PA Author Manuscript
NIH
-PA Author Manuscript
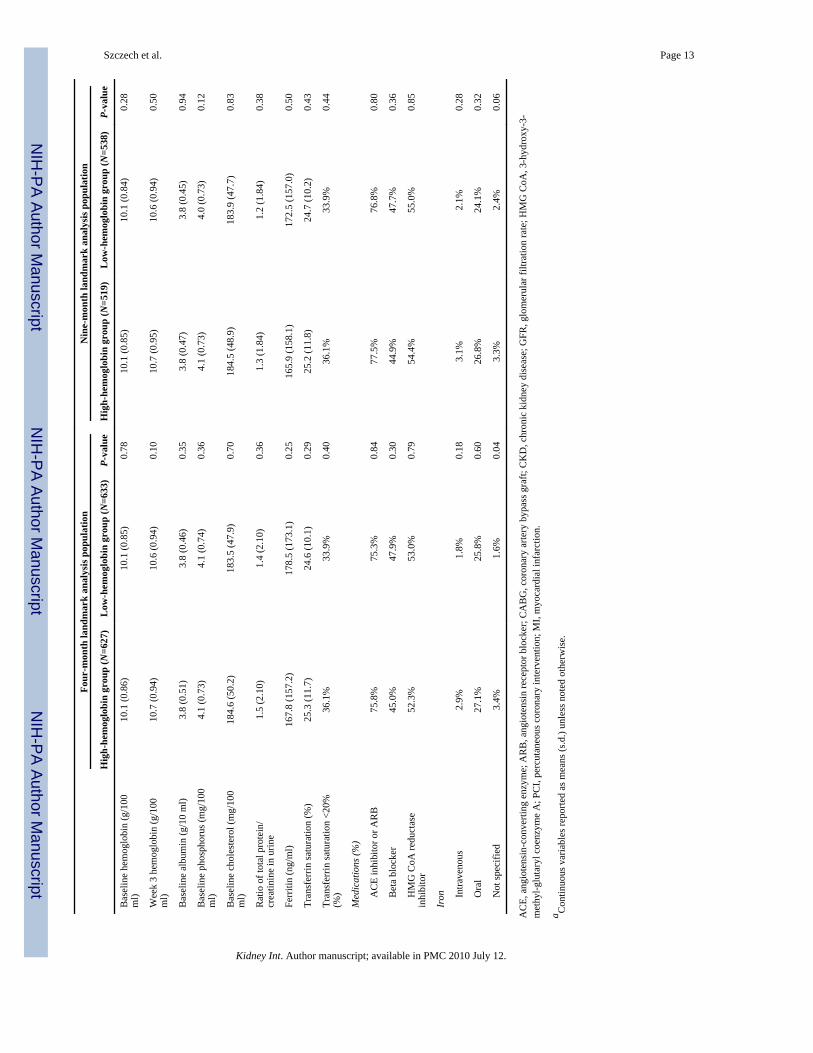
dose. However, a trial randomizing to two targets can take advantage of the benefits ofrandomization. If randomization is successful in equally distributing factors betweentreatment arms, by definition, factors that are reflective of inflammation and epoetin-αresponsiveness will also be equally distributed at the baseline. Supporting the assertion thatsuch factors may be still equally distributed between arms in CHOIR at the landmark time,key parameters between treatment groups were similar. To the extent that albumin andferritin reflect inflammation, no difference between treatment groups was detected.Additionally, as a more functional marker, hemoglobin at baseline and at 3 weeks (beforewhich both treatment groups received the same dose of epoetin-α) were also similar betweengroups. Together, this supports the assertion that there was a relatively equal distribution offactors reflecting epoetin-α resistance between arms. In this setting, rates of adverse eventswere higher among those treated to the higher hemoglobin target. Subjects in the high-hemoglobin group required the use of higher doses of epoetin, which may have predisposedthese patients to a greater dose effect.
The specific mechanisms by which high-doses of epoetin-α may be associated with a greaterrisk of adverse outcomes remain unclear. Erythropoietin receptors have been demonstratedon human endothelial cells and multiple other sites.14,15 Additionally, receptors have beenfound on tumor cells, suggesting potential roles of erythropoietin as angiogenic.16–18
Therapy with large episodic doses of erythropoietin do not reflect normal erythropoietinbiology and have unknown effects on erythropoietin receptors.19 Finally, the nature of therelationship as suggested by these data may not be linear as seen in previous studies11,20,21
Greater epoetin resistance or requirements in the ESRD population may alter key thresholdsin this relationship and deserves additional scrutiny. However, future translational researchto investigate this should allow for the potential that smaller doses may provoke differentialresponses or that the beneficial association with higher hemoglobin may mask therelationship with dose within certain ranges.
The Normal Hematocrit trial and other observational studies have raised concern in the renalcommunity over potential risks associated with the use of intravenous iron.7,22–24 Althoughcontradictory studies exist that argue the presence of this risk,25 it is noteworthy that in theNormal Hematocrit study more subjects in the higher hemoglobin arm received intravenousiron and those who received intravenous iron had a greater odds of mortality compared withthose who did not receive intravenous iron. Although 990 of the 1233 subjects reported inthe primary publication of the Normal Hematocrit study received intravenous iron, its usewas reported in far fewer subjects in CHOIR (n =29). To fully explore the potentialconfounding that may exist between intravenous iron and the relationship presented here, theuse of intravenous iron was included in a multivariable model revealing stability of all pointestimates.
Although this study suggests a relationship between dose and outcomes, it has limitations. Itis a secondary analysis of a trial designed to test the effect of target but not dose onoutcomes. The ability to generalize dose thresholds to other populations should be carefullyconsidered given the volunteerism in trial enrollment. Landmark analyses minimize biasescreated by differential dropout of subjects and intervening events between the time ofrandomization and the inception time for the outcome measurement. However, the impact oflater hemoglobin levels and doses received after the landmark time cannot be examinedusing this methodology. Hemoglobin target, actual hemoglobin, and dose are closely relatedin CHOIR due to the design. Dose is a consequence of failure to respond. Associationsbetween outcomes and hemoglobin, dose, or both may be confounded by factors notavailable in the CHOIR database. Their interplay on outcome cannot be definitely isolatedwithout future, properly designed confirmation study. The conclusions of this analysisshould therefore be considered hypothesis generating. And although hyporesponsiveness
Szczech et al. Page 5
Kidney Int. Author manuscript; available in PMC 2010 July 12.
NIH
-PA Author Manuscript
NIH
-PA Author Manuscript
NIH
-PA Author Manuscript
and high-dose requirements for epoetin significantly attenuated the increased risk associatedwith a higher hemoglobin target in CHOIR, these factors do not fully explain the increase inrisk. Finally, while increased parathyroid hormone levels have been associated with anincreased mortality risk as well as an increased risk of ESA resistance among patients withCKD,26,27 PTH measurements were not performed as a part of the CHOIR trial and willneed to be the subject of further investigation.
This secondary analysis of the CHOIR trial demonstrates a relationship between epoetin-αdose and poorer outcomes beyond the relationship previously appreciated between dose as amarker of resistance conferred by comorbidity. Current Food and Drug Administrationguidance provides a goal for epoetin-α therapy focused on a target hemoglobin.Considerable discussion has recently focused on the target that balances the quality-of-lifebenefit1,28,29 and the poorer outcomes associated with targeting a higher hemoglobin goal inCKD and ESRD populations.5,7 These data suggest that the dose of epoetin-α should play anincreasing role in discussions to determine best policy-maximizing safety. Although futureinvestigations on the impact of dose on outcomes may suggest a maximum dose for allpatients or separate maximum doses for specific subgroups, these data suggest that amongpatients who do not achieve their targeted goal for hemoglobin, consideration should begiven toward limiting dose escalation. For patients who do not respond to lower doses ofepoetin-α, the final hemoglobin achieved may not be as important as the maximum dosesrequired.
MATERIALS AND METHODSStudy subjects
The Correction of Hemoglobin and Outcomes in Renal Insufficiency was a randomized trialcomparing the effect of treatment with epoetin-α to one of two hemoglobin targets on thecomposite end point of death, congestive heart failure, stroke, and myocardial infarction inCKD patients. Methods, baseline characteristics, and results of CHOIR have been reported.5Inclusion criteria were hemoglobin <11.0 g/100 ml and modification of diet in renal diseaseglomerular filtration rate of 15–50 ml/min/1.73 m2 (refs. 30,31)
Two landmark analyses were performed. To be included in either analysis, subjects neededto be free of the composite event at the landmark, receive epoetin-α, and have ≥1 post-baseline hemoglobin measurement. Of the 1432 subjects randomized, 25 were excludedbecause they had not received epoetin-α or obtained post-baseline hemoglobinmeasurement. In the 4- and 9-month landmark analyses, 147 and 350 subjects wereexcluded, respectively, because they had events or terminated the study before thislandmark. The populations for these analyses were 1260 and 1057 subjects.
MeasurementsSubjects in CHOIR were randomized to hemoglobin targets of 11.3 or 13.5 g/100 mlutilizing different dosing algorithms and were administered weekly or biweekly epoetin-αsubcutaneously. Information on ESA dose and hemoglobin were collected at least biweekly.
DefinitionsThree categories of achieved hemoglobin (gm/100 ml) were considered: <11.1, ≥11.1 and<13.1, and ≥13.1. These categories were chosen on the basis of CHOIR’s dosing algorithmdictating no change or decrease in dose if hemoglobin exceeded 11.1 in the low-hemoglobinor 13.1 gm/100 ml in the high-hemoglobin group. Therefore, these values defined a range inwhich subjects functionally met target. Subjects achieved their respective targets if their
Szczech et al. Page 6
Kidney Int. Author manuscript; available in PMC 2010 July 12.
NIH
-PA Author Manuscript
NIH
-PA Author Manuscript
NIH
-PA Author Manuscript
maximum hemoglobin (within the first 4 or 9 months for each analysis) was ≥13.1 gm/100ml in high-hemoglobin or ≥11.1 gm/100 ml in low-hemoglobin group.
Erythropoietin-stimulating agent use was categorized as high- or low-dose if the maximumdose (within the first 4 or 9 months of the study for each landmark analysis) was ≥20,000 or<20,000 U (high vs low dose). This threshold was chosen because CHOIR limited the doseof epoetin-α to 20,000 U/week.
Statistical analysisLandmark analyses32,33 were performed to examine associations between achievedhemoglobin, epoetin-α dose, and outcomes. Analyses were performed using both thecomposite end point and death alone. As conclusions were similar, only analyses using thecomposite end point are presented. Landmark analyses are used to test for effects of a directtreatment arm and associations between post-baseline variables and outcomes. In landmarkanalyses, subjects surviving to the ‘landmark’ time are included. Post randomization but‘pre-landmark’ values of potential predictors are summarized and tested for association withoutcomes.
The association between independent variables (that is, data obtained post-baseline butprelandmark) and survival are estimated from the landmark time point through the end offollow-up using time-to-event analyses. This approach eliminates biases introduced bydefining early event as no-response (hyporesponsiveness) and by including the time beforeresponse as part of the survival time for responders (lead-time bias). The interpretation ofresults is conditional on a subject being free from the composite event before the landmark.No hemoglobin or dose values after the landmark time are utilized.
The landmarks of 4 and 9 months were chosen on the basis of the qualitative observationsthat epoetin-α dose and hemoglobin measurements stabilized at 4 months and outcomescurves comparing treatment arms began to separate at 9 months.5 The P-values ofcomparing the treatment groups for time to composite event in the first 4 or 9 months are0.59 and 0.44, respectively. Data before each landmark were summarized to categorizesubjects on the basis of their ability to achieve hemoglobin target and use of high-dose ESAusing the above definitions.
Multivariable Cox hazards regression analyses were performed. Initial models tested theadditive association of achieved hemoglobin, high-dose ESA, or both to the effect oftreatment arm. Subsequently, an adjusted model including variables that significantlydifferent between groups was developed. Interactions between achieved hemoglobin, high-dose ESA, and treatment arm were tested.
A proportional hazards Cox model was also fit to assess the descriptive effect of averagedose on the outcome. Restricted cubic splines for average dose were used in the Coxregression model within each group without adjusting other variables.34,35 Average epoetin-α dose for each patient for both the 4- and 9-month landmark analyses were calculated usingall values preceding each landmark time point. The log-hazard ratios with their confidenceintervals for increasing average epoetin-α dose were plotted against average dose for eachtarget group and landmark analysis separately. As a complement to the confidence intervals(also plotted on a log scale), frequency distributions of patients with average doserequirements within each treatment group were overlaid on the curves to assist in theinterpretation of the curves.
All statistical analyses were performed using SAS (version 8.2, SAS Institute, Cary, NC,USA).
Szczech et al. Page 7
Kidney Int. Author manuscript; available in PMC 2010 July 12.
NIH
-PA Author Manuscript
NIH
-PA Author Manuscript
NIH
-PA Author Manuscript
AcknowledgmentsThis work was presented at the Federal Drug Advisory Meeting held on September 11, 2007, in Washington, DCand at the American Society Nephrology Annual Meeting on November 4, 2007 in San Francisco, CA.
References1. Eschbach JW, Abdulhadi MH, Browne JK, et al. Recombinant human erythropoietin in anemic
patients with end-stage renal disease. Results of a phase III multicenter clinical trial. Ann InternMed 1989;111:992–1000. [PubMed: 2688507]
2. Bohlius J, Wilson J, Seidenfeld J, et al. Recombinant human erythropoietins and cancer patients:updated meta-analysis of 57 studies including 9353 patients. J Natl Cancer Inst 2006;98:708–714.[PubMed: 16705125]
3. Ma JZ, Ebben J, Xia H, et al. Hematocrit level and associated mortality in hemodialysis patients. JAm Soc Nephrol 1999;10:610–619. [PubMed: 10073612]
4. Xia H, Ebben J, Ma JZ, et al. Hematocrit levels and hospitalization risks in hemodialysis patients. JAm Soc Nephrol 1999;10:1309–1316. [PubMed: 10361870]
5. Singh AK, Szczech L, Tang KL, et al. Correction of anemia with epoetin alfa in chronic kidneydisease. N Engl J Med 2006;355:2085–2098. [PubMed: 17108343]
6. Drueke TB, Locatelli F, Clyne N, et al. Normalization of hemoglobin level in patients with chronickidney disease and anemia. N Engl J Med 2006;355:2071–2084. [PubMed: 17108342]
7. Besarab A, Bolton WK, Browne JK, et al. The effects of normal as compared with low hematocritvalues in patients with cardiac disease who are receiving hemodialysis and epoetin. N Engl J Med1998;339:584–590. [PubMed: 9718377]
8. Besarab A, Goodkin DA, Nissenson AR. The Normal Hematocrit Study—follow-up. N Eng J Med2008;358:433–434.
9. Zhang Y, Thamer M, Stefanik K, et al. Epoetin requirements predict mortality in hemodialysispatients. Am J Kidney Dis 2004;44:866–876. [PubMed: 15492953]
10. IV. NKF-K/DOQI Clinical Practice Guidelines for Anemia of Chronic Kidney Disease. Update2000. Am J Kidney Dis 2001;37:S182–S238. [PubMed: 11229970]
11. Eschbach JW. Anemia management in chronic kidney disease: role of factors affecting epoetinresponsiveness. J Am Soc Nephrol 2002;13:1412–1414. [PubMed: 11961032]
12. Coladonato JA, Frankenfield DL, Reddan DN, et al. Trends in anemia management among UShemodialysis patients. J Am Soc Nephrol 2002;13:1288–1295. [PubMed: 11961017]
13. Regidor DL, Kopple JD, Kovesdy CP, et al. Associations between changes in hemoglobin andadministered erythropoiesis-stimulating agent and survival in hemodialysis patients. J Am SocNephrol 2006;17:1181–1191. [PubMed: 16565261]
14. Anagnostou A, Liu Z, Steiner M, et al. Erythropoietin receptor mRNA expression in humanendothelial cells. Proc Natl Acad Sci USA 1994;91:3974–3978. [PubMed: 8171022]
15. Juul SE, Yachnis AT, Christensen RD. Tissue distribution of erythropoietin and erythropoietinreceptor in the developing human fetus. Early Hum Dev 1998;52:235–249. [PubMed: 9808074]
16. Leo C, Horn LC, Rauscher C, et al. Expression of erythropoietin and erythropoietin receptor incervical cancer and relationship to survival, hypoxia, and apoptosis. Clin Cancer Res2006;12:6894–6900. [PubMed: 17145806]
17. Mohyeldin A, Lu H, Dalgard C, et al. Erythropoietin signaling promotes invasiveness of humanhead and neck squamous cell carcinoma. Neoplasia 2005;7:537–543. [PubMed: 15967106]
18. Ribatti D, Marzullo A, Gentile A, et al. Erythropoietin/erythropoietin-receptor system is involvedin angiogenesis in human hepatocellular carcinoma. Histopathology 2007;50:591–596. [PubMed:17394495]
19. Fishbane S. Recombinant human erythropoietin: has treatment reached its full potential? SeminDial 2006;19:1–4. [PubMed: 16423172]
20. Klassen, PS., et al. Oral presentation. FDA Advisory Committee; [accessed on June 17, 2008].http://www.fda.gov/ohrms/dockets/ac/cder07.htm#CardiovascularRenal
Szczech et al. Page 8
Kidney Int. Author manuscript; available in PMC 2010 July 12.
NIH
-PA Author Manuscript
NIH
-PA Author Manuscript
NIH
-PA Author Manuscript
21. Zhang, Y., et al. Oral Presentation. FDA Advisory Committee Meeting; [accessed on June 17,2008]. http://www.fda.gov/ohrms/dockets/ac/cder07.htm#CardiovascularRenal
22. Feldman HI, Santanna J, Guo W, et al. Iron administration and clinical outcomes in hemodialysispatients. J Am Soc Nephrol 2002;13:734–744. [PubMed: 11856779]
23. Hoen B, Kessler M, Hestin D, et al. Risk factors for bacterial infections in chronic haemodialysisadult patients: a multicentre prospective survey. Nephrol Dial Transplant 1995;10:377–381.[PubMed: 7792034]
24. Hoen B, Paul-Dauphin A, Hestin D, et al. EPIBACDIAL: a multicenter prospective study of riskfactors for bacteremia in chronic hemodialysis patients. J Am Soc Nephrol 1998;9:869–876.[PubMed: 9596085]
25. Feldman HI, Joffe M, Robinson B, et al. Administration of parenteral iron and mortality amonghemodialysis patients. J Am Soc Nephrol 2004;15:1623–1632. [PubMed: 15153574]
26. Kovesdy CP, Ahmadzadeh S, Anderson JE, et al. Secondary hyperparathyroidism is associatedwith higher mortality in men with moderate to severe chronic kidney disease. Kidney Int2008;73:1296–1302. [PubMed: 18337714]
27. Hsu SP, Peng YS, Pai MF, et al. Influence of relative hypoparathyroidism on the responsiveness torecombinant human erythropoietin in hemodialysis patients. Blood Purif 2003;21:220–224.[PubMed: 12784047]
28. Lundin AP, Akerman MJ, Chesler RM, et al. Exercise in hemodialysis patients after treatment withrecombinant human erythropoietin. Nephron 1991;58:315–319. [PubMed: 1910154]
29. Evans RW, Rader B, Manninen DL. The quality of life of hemodialysis recipients treated withrecombinant human erythropoietin. Cooperative Multicenter EPO Clinical Trial Group. JAMA1990;263:825–830. [PubMed: 2404150]
30. Levey AS, Greene T, Kusek J, et al. A simplified equation to predict glomerular filtration rate fromserum creatinine [abstract]. J Am Soc Nephrol 2000;11:155A.
31. Levey AS, Coresh J, Greene T, et al. Using standardized serum creatinine values in themodification of diet in renal disease study equation for estimating glomerular filtration rate. AnnIntern Med 2006;145:247–254. [PubMed: 16908915]
32. Marubini, E.; Valsecchi, MG. Analysing Survival Data from Clinical Trials and ObservationalStudies. John Wiley & Sons; Chichester, West Sussex, England: 2004.
33. Anderson J, Cain K, Gelber R. Analysis of survival by tumor response. J Clin Oncol 1983;1:710–719. [PubMed: 6668489]
34. Stone, CJ.; Koo, CY. Proceedings of the Statistical Computing Section. American StatisticalAssociation; 1985. Additive splines in statistics; p. 45-48.
35. Harrell, FE. Regression Modeling Strategies with Applications to Linear Models, LogisticRegression and Survival Analysis. Springer; New York: 2001.
Szczech et al. Page 9
Kidney Int. Author manuscript; available in PMC 2010 July 12.
NIH
-PA Author Manuscript
NIH
-PA Author Manuscript
NIH
-PA Author Manuscript
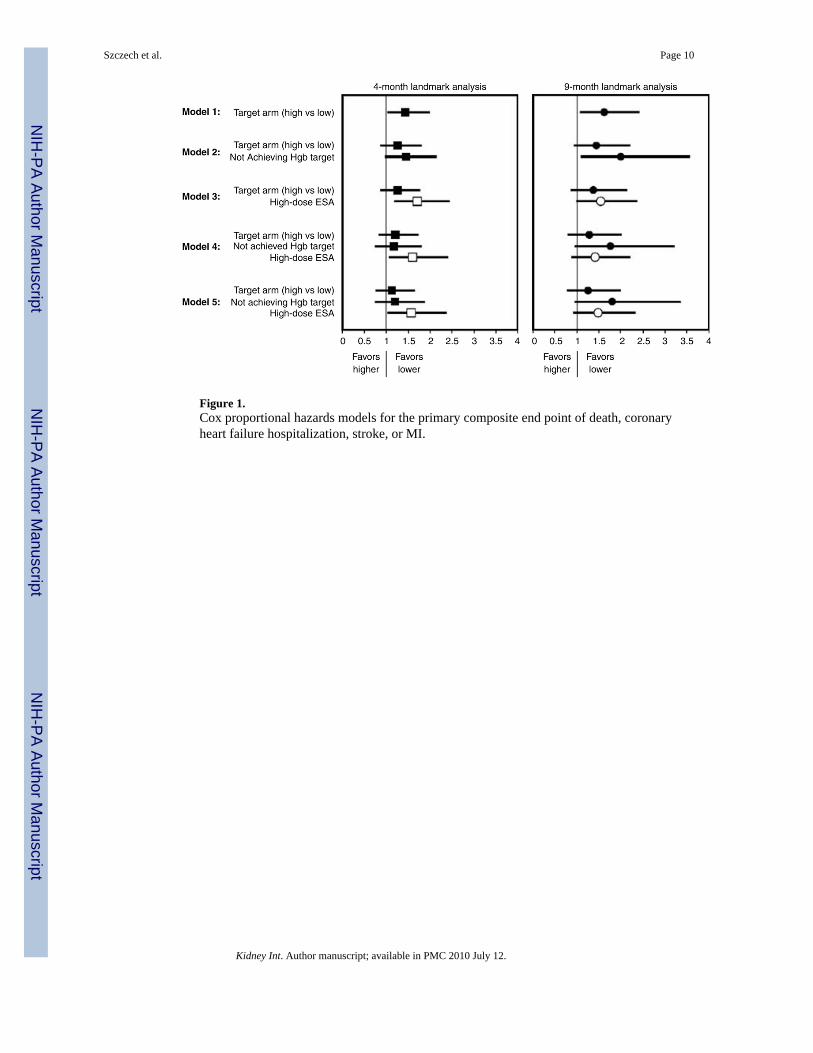
Figure 1.Cox proportional hazards models for the primary composite end point of death, coronaryheart failure hospitalization, stroke, or MI.
Szczech et al. Page 10
Kidney Int. Author manuscript; available in PMC 2010 July 12.
NIH
-PA Author Manuscript
NIH
-PA Author Manuscript
NIH
-PA Author Manuscript
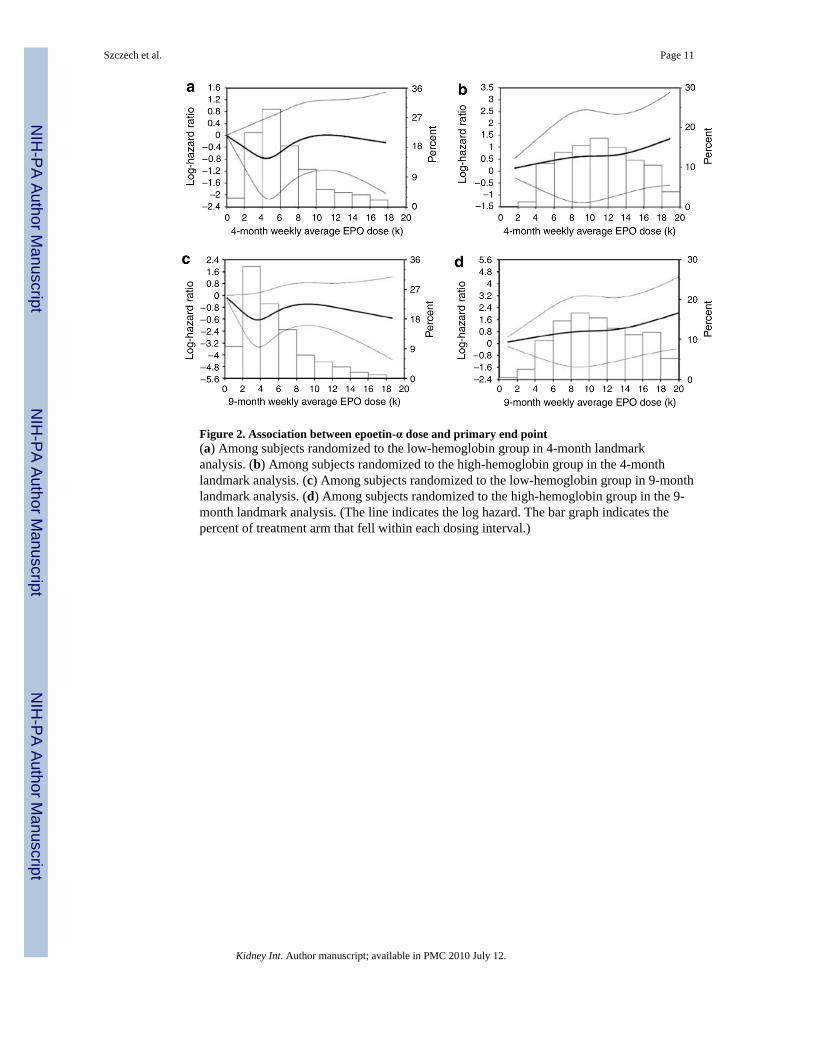
Figure 2. Association between epoetin-α dose and primary end point(a) Among subjects randomized to the low-hemoglobin group in 4-month landmarkanalysis. (b) Among subjects randomized to the high-hemoglobin group in the 4-monthlandmark analysis. (c) Among subjects randomized to the low-hemoglobin group in 9-monthlandmark analysis. (d) Among subjects randomized to the high-hemoglobin group in the 9-month landmark analysis. (The line indicates the log hazard. The bar graph indicates thepercent of treatment arm that fell within each dosing interval.)
Szczech et al. Page 11
Kidney Int. Author manuscript; available in PMC 2010 July 12.
NIH
-PA Author Manuscript
NIH
-PA Author Manuscript
NIH
-PA Author Manuscript
NIH
-PA Author Manuscript
NIH
-PA Author Manuscript
NIH
-PA Author Manuscript
Szczech et al. Page 12
Tabl
e 1
Bas
elin
e ch
arac
teris
tics o
f sub
ject
sa
Four
-mon
th la
ndm
ark
anal
ysis
pop
ulat
ion
Nin
e-m
onth
land
mar
k an
alys
is p
opul
atio
n
Hig
h-he
mog
lobi
n gr
oup
(N=6
27)
Low
-hem
oglo
bin
grou
p (N
=633
)P-
valu
eH
igh-
hem
oglo
bin
grou
p (N
=519
)L
ow-h
emog
lobi
n gr
oup
(N=5
38)
P-va
lue
Age
, yea
r65
.9 (1
4.2)
66.6
(13.
2)0.
3765
.7 (1
4.3)
66.4
(13.
2)0.
41
Fem
ale
sex
(%)
56.5
%54
.0%
0.39
57.4
%54
.1%
0.28
Rac
e (%
)0.
740.
53
W
hite
62.7
%61
.6%
63.5
%60
.8%
B
lack
28.0
%29
.5%
28.6
%30
.5%
A
mer
ican
-Ind
ian
or A
lask
anN
ativ
e0.
2%0.
5%0.
2%0.
6%
A
sian
or P
acifi
c Is
land
er3.
7%2.
8%3.
1%2.
2%
O
ther
5.4%
5.5%
4.6%
5.9%
His
pani
c et
hnic
bac
kgro
und
(%)
12.3
%13
.1%
0.67
12.6
%13
.4%
0.69
His
tory
of s
mok
ing
toba
cco
(%)
46.6
%43
.8%
0.31
45.1
%43
.3%
0.57
Cau
se o
f CK
D (%
)0.
500.
66
D
iabe
tes m
ellit
us46
.4%
49.7
%45
.8%
48.6
%
H
yper
tens
ion
30.2
%28
.3%
30.9
%29
.1%
O
ther
23.4
%22
.1%
23.3
%22
.3%
Car
diov
ascu
lar h
isto
ry (%
)
H
yper
tens
ion
95.8
%92
.9%
0.03
95.2
%92
.4%
0.07
M
yoca
rdia
l inf
arct
ion
14.8
%14
.6%
0.92
14.6
%13
.6%
0.66
C
AB
G17
.9%
13.2
%0.
0316
.7%
12.5
%0.
05
PC
I9.
4%10
.8%
0.43
9.6%
10.9
%0.
50
C
onge
stiv
e he
art f
ailu
re22
.0%
20.7
%0.
5821
.0%
18.9
%0.
41
A
trial
fibr
illat
ion
8.1%
8.8%
0.66
8.2%
7.8%
0.81
St
roke
9.5%
9.0%
0.74
9.8%
9.2%
0.75
Lo
wer
-ext
rem
ity a
mpu
tatio
n3.
2%2.
8%0.
713.
2%2.
5%0.
53
M
I, C
AB
G, o
r PC
I26
.3%
25.0
%0.
5926
.1%
23.7
%0.
37
Bod
y M
ass I
ndex
(kg/
m2 )
30.5
(7.8
)30
.4 (7
.5)
0.85
30.5
(7.6
)30
.7 (7
.7)
0.69
GFR
(ml/m
in/m
2 )27
.1 (8
.7)
27.6
(9.1
)0.
3027
.5 (8
.7)
28.3
(9.1
)0.
14
Kidney Int. Author manuscript; available in PMC 2010 July 12.
NIH
-PA Author Manuscript
NIH
-PA Author Manuscript
NIH
-PA Author Manuscript
Szczech et al. Page 13
Four
-mon
th la
ndm
ark
anal
ysis
pop
ulat
ion
Nin
e-m
onth
land
mar
k an
alys
is p
opul
atio
n
Hig
h-he
mog
lobi
n gr
oup
(N=6
27)
Low
-hem
oglo
bin
grou
p (N
=633
)P-
valu
eH
igh-
hem
oglo
bin
grou
p (N
=519
)L
ow-h
emog
lobi
n gr
oup
(N=5
38)
P-va
lue
Bas
elin
e he
mog
lobi
n (g
/100
ml)
10.1
(0.8
6)10
.1 (0
.85)
0.78
10.1
(0.8
5)10
.1 (0
.84)
0.28
Wee
k 3
hem
oglo
bin
(g/1
00m
l)10
.7 (0
.94)
10.6
(0.9
4)0.
1010
.7 (0
.95)
10.6
(0.9
4)0.
50
Bas
elin
e al
bum
in (g
/10
ml)
3.8
(0.5
1)3.
8 (0
.46)
0.35
3.8
(0.4
7)3.
8 (0
.45)
0.94
Bas
elin
e ph
osph
orus
(mg/
100
ml)
4.1
(0.7
3)4.
1 (0
.74)
0.36
4.1
(0.7
3)4.
0 (0
.73)
0.12
Bas
elin
e ch
oles
tero
l (m
g/10
0m
l)18
4.6
(50.
2)18
3.5
(47.
9)0.
7018
4.5
(48.
9)18
3.9
(47.
7)0.
83
Rat
io o
f tot
al p
rote
in/
crea
tinin
e in
urin
e1.
5 (2
.10)
1.4
(2.1
0)0.
361.
3 (1
.84)
1.2
(1.8
4)0.
38
Ferr
itin
(ng/
ml)
167.
8 (1
57.2
)17
8.5
(173
.1)
0.25
165.
9 (1
58.1
)17
2.5
(157
.0)
0.50
Tran
sfer
rin sa
tura
tion
(%)
25.3
(11.
7)24
.6 (1
0.1)
0.29
25.2
(11.
8)24
.7 (1
0.2)
0.43
Tran
sfer
rin sa
tura
tion
<20%
(%)
36.1
%33
.9%
0.40
36.1
%33
.9%
0.44
Med
icat
ions
(%)
A
CE
inhi
bito
r or A
RB
75.8
%75
.3%
0.84
77.5
%76
.8%
0.80
B
eta
bloc
ker
45.0
%47
.9%
0.30
44.9
%47
.7%
0.36
H
MG
CoA
redu
ctas
ein
hibi
tor
52.3
%53
.0%
0.79
54.4
%55
.0%
0.85
Iron
In
trave
nous
2.9%
1.8%
0.18
3.1%
2.1%
0.28
O
ral
27.1
%25
.8%
0.60
26.8
%24
.1%
0.32
N
ot sp
ecifi
ed3.
4%1.
6%0.
043.
3%2.
4%0.
06
AC
E, a
ngio
tens
in-c
onve
rting
enz
yme;
AR
B, a
ngio
tens
in re
cept
or b
lock
er; C
AB
G, c
oron
ary
arte
ry b
ypas
s gra
ft; C
KD
, chr
onic
kid
ney
dise
ase;
GFR
, glo
mer
ular
filtr
atio
n ra
te; H
MG
CoA
, 3-h
ydro
xy-3
-m
ethy
l-glu
tary
l coe
nzym
e A
; PC
I, pe
rcut
aneo
us c
oron
ary
inte
rven
tion;
MI,
myo
card
ial i
nfar
ctio
n.
a Con
tinuo
us v
aria
bles
repo
rted
as m
eans
(s.d
.) un
less
not
ed o
ther
wis
e.
Kidney Int. Author manuscript; available in PMC 2010 July 12.
NIH
-PA Author Manuscript
NIH
-PA Author Manuscript
NIH
-PA Author Manuscript
Szczech et al. Page 14
Table 2
Description of achieved hemoglobin, epoetin-α dose, and outcomes in 4- and 9-month landmark analysis
Four-month landmark analysis population Nine-month landmark analysis population
High-hemoglobin (n=627) Low-hemoglobin (n=633) High-hemoglobin (n=519) Low-hemoglobin (n=538)
Achieved hgb<11.1, N(%)
36 (5.7%) 30 (4.7%) 4 (0.8%) 4 (0.7%)
Max hgb g/100 ml,mean (s.d.)
10.2 (0.80) 10.3 (0.68) 10.9 (0.10) 10.9 (0.19)
Composite events (%) 9 (25.0%) 3 (10.0%) 2 (50.0%) 0
High-dose ESA (%) 30 (83.3%) 19 (63.3%) 4 (100.0%) 3 (75.0%)
Achieved hgb 11.1–13.1, N (%)
199 (31.7%) 443 (70.0%) 73 (14.1%) 351 (65.2%)
Max hgb g/100 ml,mean (s.d.)
12.2 (0.57) 12.3 (0.47) 12.3 (0.46) 12.5 (0.38)
Composite events (%) 34 (17.1%) 49 (11.1%) 13 (17.8%) 32 (9.1%)
High-dose ESA (%) 121 (60.8%) 35 (7.9%) 63 (86.3%) 57 (16.2%)
Achieved hgb≥13.1 392 (62.5%) 160 (25.3%) 442 (85.2%) 183 (24.0%)
Max hgb g/100 ml,mean (s.d.)
14.2 (0.70) 13.6 (0.58) 14.6 (0.69) 13.6 (0.59)
Composite events (%) 49 (12.5%) 15 (9.4%) 47 (10.6%) 9 (4.9%)
High-dose ESA (%) 69 (17.6%) 7 (4.4%) 230 (52.0%) 23 (12.6%)
High-dose ESA, N (%) 220 (35.1%) 61 (9.6%) 297 (57.2%) 83 (15.4%)
Max dose ESA, mean(s.d.)
20,123 (769.5) 20,033 (256.1) 20,088 (766.1) 20,024 (219.5)
Composite events (%) 40 (18.2%) 10 (16.4%) 41 (13.8%) 6 (7.2%)
Max hgb g/100 ml 12.4 (1.39) 11.5 (1.26) 14.0 (1.16) 12.7 (0.89)
Low-dose ESA (%) 407 (64.9%) 572 (90.4%) 222 (42.8%) 455 (84.6%)
Max dose ESA, mean(s.d.)
13,162 (2988.2) 11,533 (2577.8) 14,185 (2917.4) 11,933 (2615.7)
Composite events (%) 52 (12.8%) 57 (10.0%) 21 (9.5%) 35 (7.7%)
Max hgb g/100 ml,mean (s.d.)
13.9 (1.08) 12.6 (0.79) 14.6 (0.76) 12.9 (0.69)
hgb, hemoglobin.
Bold-faced numbers represent the patients who did not achieve their hgb target within their randomized group.
Kidney Int. Author manuscript; available in PMC 2010 July 12.
NIH
-PA Author Manuscript
NIH
-PA Author Manuscript
NIH
-PA Author Manuscript
Szczech et al. Page 15
Table 3
Cox proportional hazards models for the primary composite endpoint of death, coronary heart failurehospitalization, stroke, or MI
Four-month landmark analysis N=1260 Nine-month landmark analysis N=1057
Variable HR, 95% CI P-value HR, 95% CI P-value
Model 1
Target arm (high vs low) 1.44, 1.05–1.97 0.02 1.62, 1.09–2.40 0.02
Model 2
Target arm (high vs low) 1.26, 0.89–1.78 0.20 1.44, 0.95–2.18 0.09
Not achieving hemoglobin target 1.46, 1.00–2.13 0.05 1.99, 1.12–3.55 0.02
Model 3
Target arm (high vs low) 1.26, 0.90–1.75 0.18 1.37, 0.89–2.11 0.15
High-dose ESA 1.71, 1.20–2.43 0.003 1.54, 1.00–2.35 0.05
Model 4
Target arm (high vs low) 1.21, 0.85–1.71 0.29 1.28, 0.82–2.00 0.27
Not achieving hemoglobin target 1.17, 0.76–1.79 0.47 1.76, 0.97–3.20 0.06
High-dose ESA 1.60, 1.08–2.38 0.02 1.40, 0.90–2.19 0.13
Model 5 N=1192 N=1016
Target arm (high vs low) 1.17, 0.81–1.68 0.41 1.25, 0.80–1.97 0.33
Not achieving hemoglobin target 1.21, 0.78–1.89 0.39 1.80, 0.97–3.34 0.06
High-dose ESA 1.57, 1.04–2.36 0.03 1.48, 0.94–2.32 0.09
Self-reported hypertension 0.94, 0.48–1.85 0.86 0.66, 0.32–1.37 0.27
Previous CABG 2.44, 1.70–3.49 <0.01 1.75, 1.08–2.86 0.02
Use of IV iron 0.47, 0.12, 1.90 0.29 0.36, 0.05, 2.63 0.32
CABG, coronary artery bypass graft; ESA, erythropoietin-stimulating agent.
Kidney Int. Author manuscript; available in PMC 2010 July 12.
Related Documents