Second Quarterly Assessment 8 th Grade Science

Second Quarterly Assessment 8 th Grade Science. Use the information below to answer questions #1 and 2. Toy Car Race Ms. Williams’ science class uses.
Dec 15, 2015
Welcome message from author
This document is posted to help you gain knowledge. Please leave a comment to let me know what you think about it! Share it to your friends and learn new things together.
Transcript

Second Quarterly Assessment 8th Grade Science

Use the information below to answer questions #1 and 2.
Toy Car RaceMs. Williams’ science class uses a toy car race to
study and collect data about forces and motion. The racetrack shown has a 6-meter ramp and a 5-meter level section to the finish line. Two cars compete at a time.

The data table and graph below show the speed and total distance traveled for car 1 and car 2 during the first three seconds of a race.

Question 1 On what section of the racetrack will the forces on
the cars be balanced?
A. the starting blockB. the ramp onlyC. the level section after the rampD. the entire track
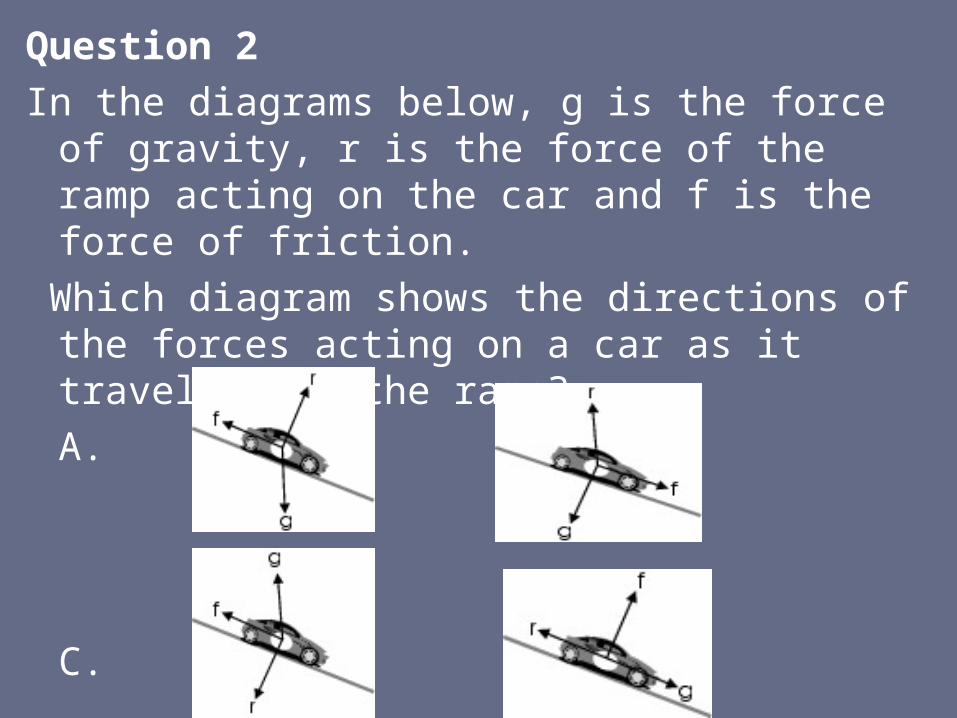
Question 2 In the diagrams below, g is the force of gravity, r is
the force of the ramp acting on the car and f is the force of friction.
Which diagram shows the directions of the forces acting on a car as it travels down the ramp?
A. B.
C. D.

Question 3Use the following information and diagram to answer question #3.
A ball is released from rest at position 1. The diagram shows the ball in four positions as it rolls along a track from left to right.
In which position does the ball have its minimum gravitational potential energy and maximum kinetic energy?
A. 1B. 2C. 3D. 4

Question 4An adult and a small child are at the playground. The
child sits on the end of a seesaw, as shown. The adult weighs twice as much as the child.
At which point on the seesaw will the adult need to sit in order to balance the child’s weight?
A. point AB. point BC. point CD. point D
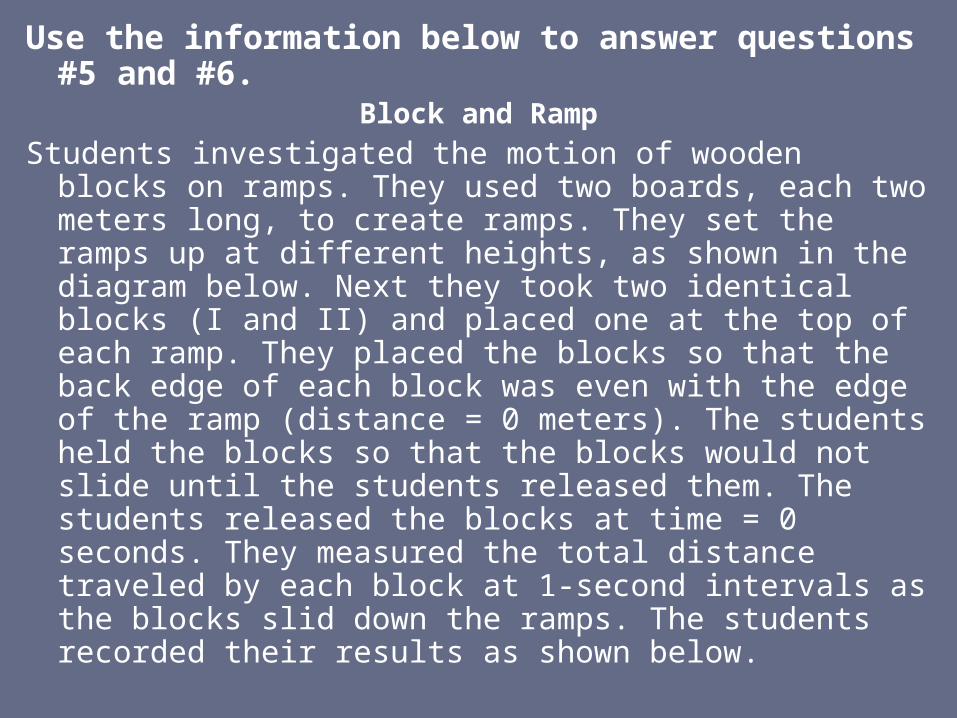
Use the information below to answer questions #5 and #6.Block and Ramp
Students investigated the motion of wooden blocks on ramps. They used two boards, each two meters long, to create ramps. They set the ramps up at different heights, as shown in the diagram below. Next they took two identical blocks (I and II) and placed one at the top of each ramp. They placed the blocks so that the back edge of each block was even with the edge of the ramp (distance = 0 meters). The students held the blocks so that the blocks would not slide until the students released them. The students released the blocks at time = 0 seconds. They measured the total distance traveled by each block at 1-second intervals as the blocks slid down the ramps. The students recorded their results as shown below.


Question 5 Which conclusion is supported by the results of this
investigation as expressed in the data table?
A. As the travel time increases, the speed of the block decreases.
B. As the ramp steepness is increased, the travel time of the block increases.
C. As the distance traveled increases, the average speed of the block increases.
D. As the height of the ramp is increased, the average speed of the block decreases.

Question 6 In your Answer, name two forces that acted on the
blocks as they slid down the ramps. Describe how each force you listed affected the
motion of the block. (4 points)

Use the information below to answer questions 7-8.
Motion Diagram The graph below shows the position of a car in
motion along an east-west road over a period of 10 minutes. The car’s position is recorded at 1-minute intervals. At time = 0, the car’s position is at the starting point.

Question 7 What is the car’s motion relative to the starting point
at time = 8 minutes?
A. at rest at the starting pointB. in motion at the starting point C. moving toward the starting point D. moving away from the starting point

Question 8 What is the total distance traveled by the car after
10 minutes?
A. 600 metersB. 1,200 metersC. 2,000 metersD. 3,600 meters

Model Telephone Investigation Two students want to find out what affects the sounds heard through model telephones. They investigate the materials used and the tightness of the material connecting the cups. Their first three setups are shown. They use the same length of string or wire in each setup. The boy repeats the same sounds at the same volume for each setup.
Use the following investigation to answer questions 9-10.

Question 9 Look at the picture and the table for the Model
Telephone Investigation. In your Answer, explain why the sound was heard
in setup 1. Then, describe what happened to the sound energy in setup 2. (2 points)

Question 10The sound in setup 3 was clearer than the sound in
setup 1. Which statement explains why?A. String creates an echo.B. String vibrates more than wire.C. Wire is used for real telephones.D. Wire transmits sound better than string.

Question 11 The two students want classmates to repeat the
investigation so that they can compare results.What should the students communicate so that results
may be compared?
A. materials and steps used in the investigationB. conclusions about results from the investigationC. where they got the idea for making model
telephonesD. where to purchase the materials for model
telephones
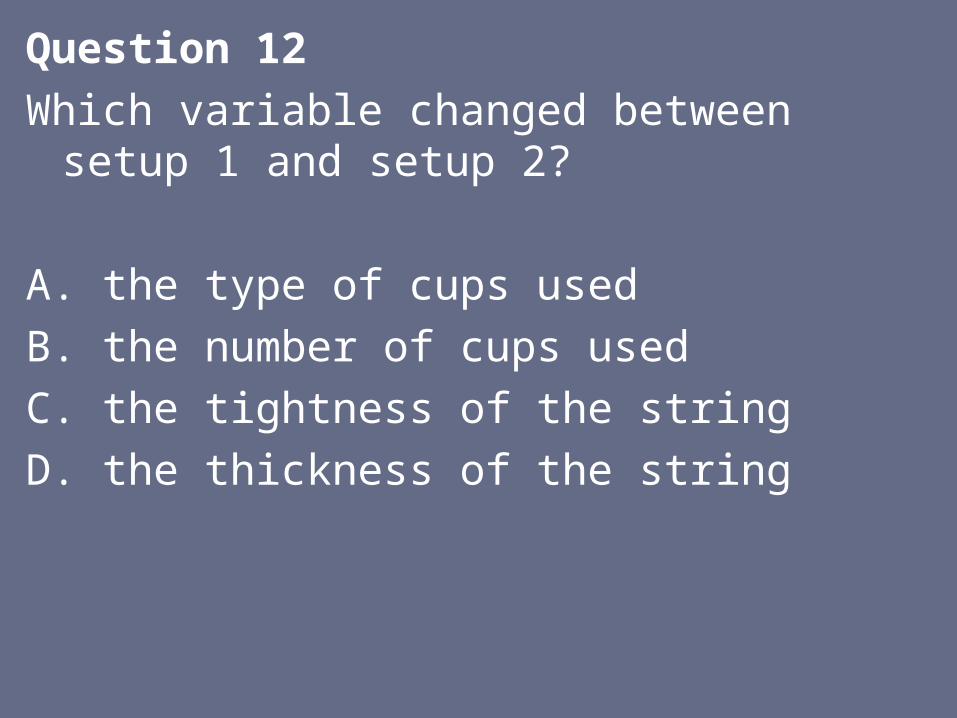
Question 12 Which variable changed between setup 1 and
setup 2?
A. the type of cups usedB. the number of cups usedC. the tightness of the stringD. the thickness of the string
Related Documents