1 Ericsson | Second Quarter Report 2016 Second quarter report 2016 Stockholm, July 19, 2016 SECOND QUARTER HIGHLIGHTS Read more (page) > Sales as reported decreased by -11% YoY. Sales, adjusted for comparable units and currency, decreased by -7% YoY. Mobile broadband sales continued to decline particularly in markets impacted by a weak macro-economic environment. 3 > Sales grew in South East Asia and Oceania. 4G sales in Mainland China and Networks sales in North America were stable. 3 > The current sales trends and business mix are expected to prevail for the second half of the year. 3 > Gross margin declined to 32.3% (33.2%) YoY, mainly due to a larger share of mobile broadband cover- age business with lower hardware margins, and a higher share of services business. 3 > Operating margin decreased to 5.1% (5.9%) YoY, mainly due to negative revaluation effects of currency hedge contracts and a lower gross margin, partly offset by lower operating expenses and restructuring charges. 4 > Further actions are initiated to reduce cost, targeting a new annual run rate of operating expenses, excluding restructuring charges, of SEK 53 b. in the second half of 2017. 3 > Cash flow from operating activities was SEK -0.7 (3.1) b. Cash flow from operating activities for the first six months was SEK -3.1 (-2.8) b. Full-year cash conversion target of more than 70% remains. 9 SEK b. Q2 2016 Q2 2015 YoY change Q1 2016 QoQ change 6 months 2016 6 months 2015 Net sales 54.1 60.7 -11% 52.2 4% 106.3 114.2 Sales growth adj. for comparable units and currency - - -7% - 6% -4% -6% Gross margin 32.3% 33.2% - 33.3% - 32.8% 34.2% Gross margin excluding restructuring charges 33.2% 35.1% - 33.9% - 33.6% 35.7% Operating income 2.8 3.6 -22% 3.5 -20% 6.2 5.7 Operating income excluding restructuring charges 3.8 6.3 -40% 4.1 -8% 7.9 9.1 Operating margin 5.1% 5.9% - 6.7% - 5.9% 5.0% Operating margin excluding restructuring charges 7.0% 10.4% - 7.9% - 7.4% 7.9% Net income 1.6 2.1 -26% 2.1 -26% 3.7 3.6 EPS diluted, SEK 0.48 0.64 -25% 0.60 -20% 1.08 1.04 EPS (Non-IFRS), SEK 1) 0.83 1.45 -43% 0.87 -5% 1.70 2.22 Cash flow from operating activities -0.7 3.1 -123% -2.4 -70% -3.1 -2.8 Net cash, end of period 2) 21.0 28.0 -25% 36.5 -43% 21.0 28.0 1) EPS, diluted, excl. amortizations and write-downs of acquired intangible assets, and excluding restructuring charges. 2) The definition of Net cash is changed to exclude post-employment benefits, see accounting policies. Non-IFRS financial measures are reconciled to the most directly reconcilable line items in the financial statements at the end of this report.

Welcome message from author
This document is posted to help you gain knowledge. Please leave a comment to let me know what you think about it! Share it to your friends and learn new things together.
Transcript

1 Ericsson | Second Quarter Report 2016
Second quarter report 2016
Stockholm, July 19, 2016
SECOND QUARTER HIGHLIGHTSRead more
(page)
> Sales as reported decreased by -11% YoY. Sales, adjusted for comparable units and currency, decreased by -7% YoY. Mobile broadband sales continued to decline particularly in markets impacted by a weak macro-economic environment. 3
> Sales grew in South East Asia and Oceania. 4G sales in Mainland China and Networks sales in North America were stable. 3
> The current sales trends and business mix are expected to prevail for the second half of the year. 3
> Gross margin declined to 32.3% (33.2%) YoY, mainly due to a larger share of mobile broadband cover-age business with lower hardware margins, and a higher share of services business. 3
> Operating margin decreased to 5.1% (5.9%) YoY, mainly due to negative revaluation effects of currency hedge contracts and a lower gross margin, partly offset by lower operating expenses and restructuring charges. 4
> Further actions are initiated to reduce cost, targeting a new annual run rate of operating expenses, excluding restructuring charges, of SEK 53 b. in the second half of 2017. 3
> Cash flow from operating activities was SEK -0.7 (3.1) b. Cash flow from operating activities for the first six months was SEK -3.1 (-2.8) b. Full-year cash conversion target of more than 70% remains. 9
SEK b.Q2
2016Q2
2015YoY
changeQ1
2016QoQ
change6 months
20166 months
2015
Net sales 54.1 60.7 -11% 52.2 4% 106.3 114.2
Sales growth adj. for comparable units and currency - - -7% - 6% -4% -6%
Gross margin 32.3% 33.2% - 33.3% - 32.8% 34.2%
Gross margin excluding restructuring charges 33.2% 35.1% - 33.9% - 33.6% 35.7%
Operating income 2.8 3.6 -22% 3.5 -20% 6.2 5.7
Operating income excluding restructuring charges 3.8 6.3 -40% 4.1 -8% 7.9 9.1
Operating margin 5.1% 5.9% - 6.7% - 5.9% 5.0%
Operating margin excluding restructuring charges 7.0% 10.4% - 7.9% - 7.4% 7.9%
Net income 1.6 2.1 -26% 2.1 -26% 3.7 3.6
EPS diluted, SEK 0.48 0.64 -25% 0.60 -20% 1.08 1.04
EPS (Non-IFRS), SEK 1) 0.83 1.45 -43% 0.87 -5% 1.70 2.22
Cash flow from operating activities -0.7 3.1 -123% -2.4 -70% -3.1 -2.8
Net cash, end of period 2) 21.0 28.0 -25% 36.5 -43% 21.0 28.01) EPS, diluted, excl. amortizations and write-downs of acquired intangible assets, and excluding restructuring charges.2) The definition of Net cash is changed to exclude post-employment benefits, see accounting policies.
Non-IFRS financial measures are reconciled to the most directly reconcilable line items in the financial statements at the end of this report.

2 Ericsson | Second Quarter Report 2016
CEO Comments
The negative industry trends from the first quar-ter have intensified impacting demand for mobile broadband, especially in markets with a weak macro-economic environment. We are delivering on ongoing cost reduction activities. However, in light of market development, management has, with the support of the Board of Directors, initi-ated significant actions to further reduce cost.
Business Sales declined by -11% YoY. Sales, adjusted for comparable units and currency, declined by -7%. Mobile broadband sales continued to decline particularly in markets impacted by a weak macro-economic environment such as Brazil, Russia and the Middle East. In Europe, completion of mobile broadband proj-ects in 2015 continued to have a negative effect on sales growth YoY. 4G sales in Mainland China were stable YoY as the fast pace of deployments continued. Network sales in North America were stable YoY driven by con-tinued mobile broadband capacity investments. Global Services sales declined in North America as activities in Professional Ser-vices were lower.
The transition from 3G to 4G continued primarily in parts of Asia, contributing to solid sales growth in region South East Asia and Oceania.
Sales in the targeted growth areas were 20% of total sales and grew by 5% in the quarter in constant currencies. We continue to focus on increasing software sales and recurrent business to improve profitability over time.
In the strategic partnership with Cisco we have engaged in more than 200 customer opportunities, spanning all major geogra-phies. To date more than 30 deals have been closed forming a good start to reach the targeted sales of USD 1 b. for 2018.
The current sales trends and business mix are expected to pre-vail for the second half of the year.
ProfitabilityActions have been implemented to restore Global Services prof-itability, primarily to rightsize the service delivery operations. Losses in Network Rollout have been significantly reduced and the operating margin, excluding restructuring charges, for Pro-fessional Services has gradually improved to 10% in the quarter.
The Networks business was impacted by lower sales and an increased share of coverage business with a lower hardware margin. The margin decline for Support Solutions was mainly due to lower OSS and BSS software sales.
Profitability declined sequentially mainly due to lower IPR licens-ing revenues. IPR licensing revenues in the quarter were SEK 2.2 b., representing current IPR licensing contract portfolio. Rev-enues in Q1 2016 were SEK 3.8 b. and included certain one-time items.
We are delivering on ongoing cost reduction activities. Operat-ing expenses, excluding restructuring charges, have been reduced by SEK 2.1 b. to SEK 14.0 (16.1) b. YoY, mainly as a result of actions related to the global cost and efficiency pro-gram.
Actions to further reduce costTo manage the lower demand for mobile broadband invest-ments, a set of significant actions has been initiated to further drive efficiency improvements and reduce cost.
The cost and efficiency program targeting savings of SEK 9 b. during 2017, is progressing according to plan. In addition, we will reduce R&D investments in IP and capture efficiency gains from the new company structure. Together, these activities are expected to reduce the annual run rate of operating expenses, excluding restructuring charges, to SEK 53 b. in the second half of 2017. This is to be compared with SEK 63 b. for full-year 2014 and equates to double the previously targeted savings in operat-ing expenses.
The new company structure was implemented as of July 1 to accelerate strategy implementation, to mirror customer ways of working and increase end-to-end accountability for business owners. The new structure will also support cost reductions and efficiency improvements, including removal of existing duplications within product development.
Given current industry trends, we will intensify our activities to reduce cost of sales and adapt our operations to a weaker mobile broadband market.
We will focus on maintaining a strong net cash position through structural improvements in working capital and profitability. In addition, the capital expenditure level will decline as the invest-ments in the global ICT centers have peaked.
Our Networked Society strategy comprises three key elements; leverage of our installed base, investments in new revenue base for sustainable profitable growth (targeted growth areas) and generation of strong cash flow enabling long-term investments and securing a strong balance sheet. Digitalization creates new opportunities with both existing and new customers and I am confident that our strategy and the actions we now take will cre-ate future value for our shareholders.
Hans VestbergPresident and CEO
3 Ericsson | Second Quarter Report 2016
Financial highlights
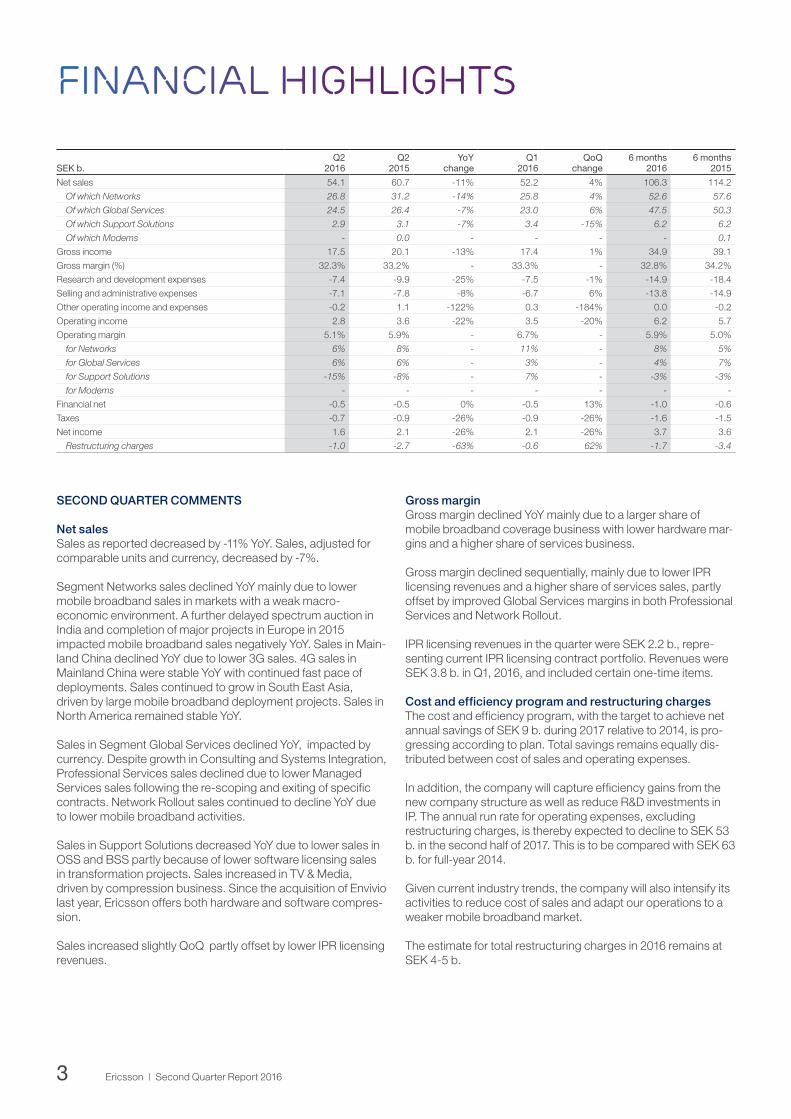
SECOND QUARTER COMMENTS
Net sales Sales as reported decreased by -11% YoY. Sales, adjusted for comparable units and currency, decreased by -7%.
Segment Networks sales declined YoY mainly due to lower mobile broadband sales in markets with a weak macro- economic environment. A further delayed spectrum auction in India and completion of major projects in Europe in 2015 impacted mobile broadband sales negatively YoY. Sales in Main-land China declined YoY due to lower 3G sales. 4G sales in Mainland China were stable YoY with continued fast pace of deployments. Sales continued to grow in South East Asia, driven by large mobile broadband deployment projects. Sales in North America remained stable YoY.
Sales in Segment Global Services declined YoY, impacted by currency. Despite growth in Consulting and Systems Integration, Professional Services sales declined due to lower Managed Services sales following the re-scoping and exiting of specific contracts. Network Rollout sales continued to decline YoY due to lower mobile broadband activities.
Sales in Support Solutions decreased YoY due to lower sales in OSS and BSS partly because of lower software licensing sales in transformation projects. Sales increased in TV & Media, driven by compression business. Since the acquisition of Envivio last year, Ericsson offers both hardware and software compres-sion.
Sales increased slightly QoQ partly offset by lower IPR licensing revenues.
Gross marginGross margin declined YoY mainly due to a larger share of mobile broadband coverage business with lower hardware mar-gins and a higher share of services business. Gross margin declined sequentially, mainly due to lower IPR licensing revenues and a higher share of services sales, partly offset by improved Global Services margins in both Professional Services and Network Rollout.
IPR licensing revenues in the quarter were SEK 2.2 b., repre-senting current IPR licensing contract portfolio. Revenues were SEK 3.8 b. in Q1, 2016, and included certain one-time items.
Cost and efficiency program and restructuring chargesThe cost and efficiency program, with the target to achieve net annual savings of SEK 9 b. during 2017 relative to 2014, is pro-gressing according to plan. Total savings remains equally dis-tributed between cost of sales and operating expenses.
In addition, the company will capture efficiency gains from the new company structure as well as reduce R&D investments in IP. The annual run rate for operating expenses, excluding restructuring charges, is thereby expected to decline to SEK 53 b. in the second half of 2017. This is to be compared with SEK 63 b. for full-year 2014.
Given current industry trends, the company will also intensify its activities to reduce cost of sales and adapt our operations to a weaker mobile broadband market.
The estimate for total restructuring charges in 2016 remains at SEK 4-5 b.
SEK b.Q2
2016Q2
2015YoY
change Q1
2016QoQ
change6 months
20166 months
2015
Net sales 54.1 60.7 -11% 52.2 4% 106.3 114.2
Of which Networks 26.8 31.2 -14% 25.8 4% 52.6 57.6
Of which Global Services 24.5 26.4 -7% 23.0 6% 47.5 50.3
Of which Support Solutions 2.9 3.1 -7% 3.4 -15% 6.2 6.2
Of which Modems - 0.0 - - - - 0.1
Gross income 17.5 20.1 -13% 17.4 1% 34.9 39.1
Gross margin (%) 32.3% 33.2% - 33.3% - 32.8% 34.2%
Research and development expenses -7.4 -9.9 -25% -7.5 -1% -14.9 -18.4
Selling and administrative expenses -7.1 -7.8 -8% -6.7 6% -13.8 -14.9
Other operating income and expenses -0.2 1.1 -122% 0.3 -184% 0.0 -0.2
Operating income 2.8 3.6 -22% 3.5 -20% 6.2 5.7
Operating margin 5.1% 5.9% - 6.7% - 5.9% 5.0%
for Networks 6% 8% - 11% - 8% 5%
for Global Services 6% 6% - 3% - 4% 7%
for Support Solutions -15% -8% - 7% - -3% -3%
for Modems - - - - - - -
Financial net -0.5 -0.5 0% -0.5 13% -1.0 -0.6
Taxes -0.7 -0.9 -26% -0.9 -26% -1.6 -1.5
Net income 1.6 2.1 -26% 2.1 -26% 3.7 3.6
Restructuring charges -1.0 -2.7 -63% -0.6 62% -1.7 -3.4

4 Ericsson | Second Quarter Report 2016
Quarterly sales and reported sales growth year over year
SEK b. %
Quarterly sales
Reported sales growth
Operating expenses and oper-ating expenses, % of sales
SEK b. %
Operating expenses
Operating expenses of sales
Operating income and operating margin
SEK b. %
Operating income
Operating margin
Operating expensesOperating expenses decreased YoY, mainly in R&D expenses due to savings related to the cost and efficiency program and lower restructuring charges. Lower amortization of intangible assets and increased capitalized development expenses also contributed to lower expenses. Operating expenses, excluding restructuring charges, were SEK 14.0. (16.1) b.
Other operating income and expensesOther operating income and expenses declined YoY due to neg-ative revaluation effects of currency hedge contracts in the quar-ter and a capital gain of SEK 0.3 b. in Q2, 2015. The revaluation and realization effects of currency hedge contracts were SEK -0.5 b. This is to be compared with SEK 0.2 b. in Q1, 2016 and SEK 0.6 b. in Q2, 2015.
The main part of the currency hedge contract balance is in USD. The SEK weakened against the USD between June 30, 2016 (SEK/USD rate 8.45) and March 31, 2016 (SEK/USD rate 8.11).
Operating incomeOperating income decreased YoY, due to lower sales, negative revaluation effects of currency hedge contracts and a lower gross margin. The decrease in operating income was partly off-set by lower operating expenses and lower restructuring charges.
Operating income decreased QoQ due to negative effects from currency hedge contracts, a lower gross margin and higher restructuring charges. The decrease in operating income was partly offset by higher sales.
Financial netFinancial net remained stable at SEK -0.5 b., both YoY and QoQ. Financial income improved YoY and QoQ while financial expenses increased YoY and QoQ. The financial net was impacted by low interest rates and depreciated local currencies in certain markets.
TaxesThe tax rate was stable YoY and QoQ.
Net income and EPS Net income and EPS diluted decreased YoY and QoQ, following lower operating income. EPS diluted was SEK 0.48 (0.64) and EPS (Non-IFRS) was SEK 0.83 (1.45).
Employees The number of employees on June 30, 2016 was 116,507 com-pared with 115,300 on March 31, 2016. Almost 4,000 employ-ees left the company in the quarter. The acquisition of Ericpol, adding 2,300 resources, contributed to the total increase in the headcount of the company.
Modems The discontinuation of the modems business was completed in Q3 2015.
5 Ericsson | Second Quarter Report 2016
Regional sales
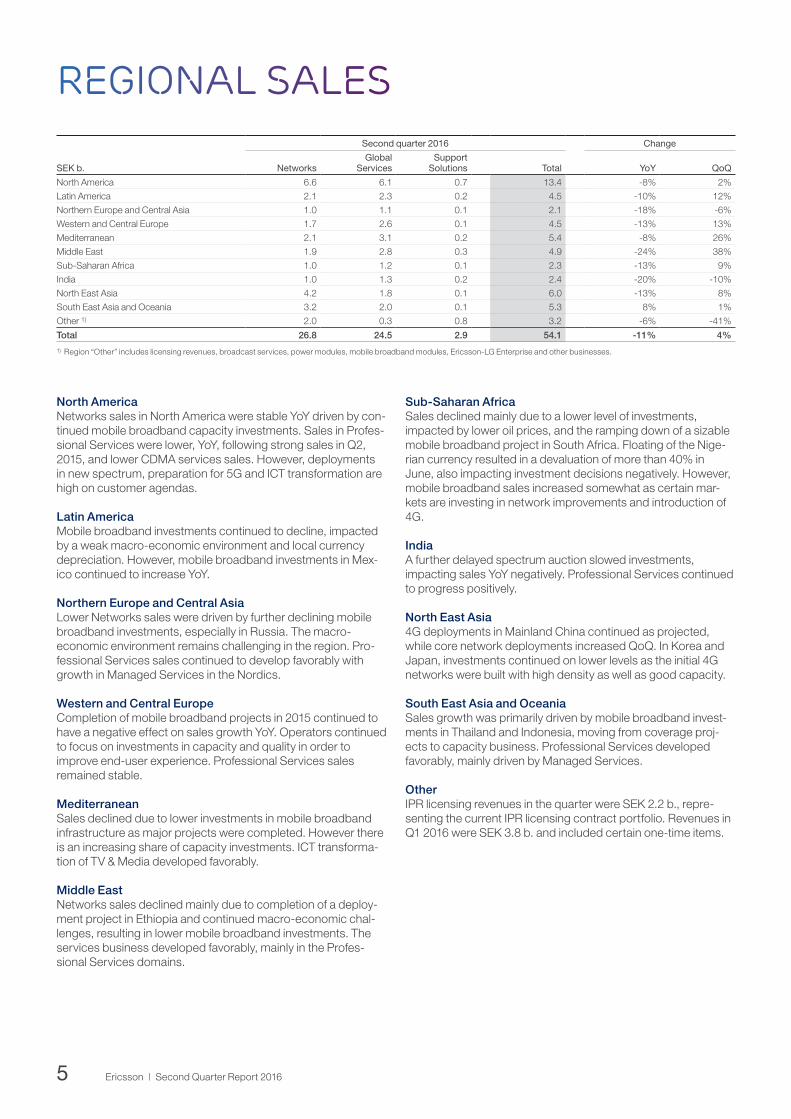
North AmericaNetworks sales in North America were stable YoY driven by con-tinued mobile broadband capacity investments. Sales in Profes-sional Services were lower, YoY, following strong sales in Q2, 2015, and lower CDMA services sales. However, deployments in new spectrum, preparation for 5G and ICT transformation are high on customer agendas.
Latin AmericaMobile broadband investments continued to decline, impacted by a weak macro-economic environment and local currency depreciation. However, mobile broadband investments in Mex-ico continued to increase YoY.
Northern Europe and Central AsiaLower Networks sales were driven by further declining mobile broadband investments, especially in Russia. The macro- economic environment remains challenging in the region. Pro-fessional Services sales continued to develop favorably with growth in Managed Services in the Nordics.
Western and Central EuropeCompletion of mobile broadband projects in 2015 continued to have a negative effect on sales growth YoY. Operators continued to focus on investments in capacity and quality in order to improve end-user experience. Professional Services sales remained stable.
MediterraneanSales declined due to lower investments in mobile broadband infrastructure as major projects were completed. However there is an increasing share of capacity investments. ICT transforma-tion of TV & Media developed favorably.
Middle EastNetworks sales declined mainly due to completion of a deploy-ment project in Ethiopia and continued macro-economic chal-lenges, resulting in lower mobile broadband investments. The services business developed favorably, mainly in the Profes-sional Services domains.
Sub-Saharan AfricaSales declined mainly due to a lower level of investments, impacted by lower oil prices, and the ramping down of a sizable mobile broadband project in South Africa. Floating of the Nige-rian currency resulted in a devaluation of more than 40% in June, also impacting investment decisions negatively. However, mobile broadband sales increased somewhat as certain mar-kets are investing in network improvements and introduction of 4G.
IndiaA further delayed spectrum auction slowed investments, impacting sales YoY negatively. Professional Services continued to progress positively.
North East Asia4G deployments in Mainland China continued as projected, while core network deployments increased QoQ. In Korea and Japan, investments continued on lower levels as the initial 4G networks were built with high density as well as good capacity.
South East Asia and OceaniaSales growth was primarily driven by mobile broadband invest-ments in Thailand and Indonesia, moving from coverage proj-ects to capacity business. Professional Services developed favorably, mainly driven by Managed Services.
OtherIPR licensing revenues in the quarter were SEK 2.2 b., repre-senting the current IPR licensing contract portfolio. Revenues in Q1 2016 were SEK 3.8 b. and included certain one-time items.
Second quarter 2016 Change
SEK b. NetworksGlobal
ServicesSupport
Solutions Total YoY QoQ
North America 6.6 6.1 0.7 13.4 -8% 2%
Latin America 2.1 2.3 0.2 4.5 -10% 12%
Northern Europe and Central Asia 1.0 1.1 0.1 2.1 -18% -6%
Western and Central Europe 1.7 2.6 0.1 4.5 -13% 13%
Mediterranean 2.1 3.1 0.2 5.4 -8% 26%
Middle East 1.9 2.8 0.3 4.9 -24% 38%
Sub-Saharan Africa 1.0 1.2 0.1 2.3 -13% 9%
India 1.0 1.3 0.2 2.4 -20% -10%
North East Asia 4.2 1.8 0.1 6.0 -13% 8%
South East Asia and Oceania 3.2 2.0 0.1 5.3 8% 1%
Other 1) 2.0 0.3 0.8 3.2 -6% -41%
Total 26.8 24.5 2.9 54.1 -11% 4%
1) Region “Other” includes licensing revenues, broadcast services, power modules, mobile broadband modules, Ericsson-LG Enterprise and other businesses.

6 Ericsson | Second Quarter Report 2016
Segment results
Net salesSales as reported decreased by -14% YoY mainly due to lower mobile broadband sales in markets with a weak macro- economic environment. A further delayed spectrum auction in India slowed investments and completion of major projects in Europe in 2015 impacted mobile broadband sales negatively YoY. Sales in Mainland China declined YoY due to lower 3G sales. 4G sales in Mainland China were stable YoY with contin-ued fast pace of deployments. Sales continued to grow in South East Asia, driven by large mobile broadband deployment proj-ects. Sales in North America remained stable YoY.
Sales, adjusted for comparable units and currency, decreased by -11% YoY.
Sales increased QoQ, primarily driven by growth in regions North East Asia and Mediterranean, but was partly offset by a sales decline in region Northern Europe and Central Asia as well as in India.
Deliveries of Ericsson Radio System started at the end of 2015 and will scale to larger volumes during the latter part of this year.
The company has engaged in more than 200 customer oppor-tunities, together with Cisco, spanning all major geographies, except for Brazil where regulatory approval is still pending. To date more than 30 deals have been closed.
Operating income and margin Operating income and margin decreased YoY mainly due to lower sales volumes, a higher share of coverage business with lower hardware margins and negative revaluation effects of cur-rency hedge contracts. Operating expenses declined signifi-cantly YoY, mainly as a result of the ongoing cost and efficiency program.
Sequentially, operating income and margin decreased due to lower IPR licensing revenues.
The effects of revaluation and realization of currency hedge con-tracts were negative at SEK -0.4 (0.5) b. in the quarter. In Q1, 2016, the effects of currency hedge contracts were positive at SEK 0.2 b.
Segment sales
Networks
Global Services
Support Solutions
Quarterly sales and sales growth year over year
SEK b. %
Quarterly sales
Sales growth
Operating income and operating margin
SEK b. %
Operating income
Operating margin
NETWORKS
SEK b.Q2
2016Q2
2015YoY
change Q1
2016QoQ
change6 months
20166 months
2015
Net sales 26.8 31.2 -14% 25.8 4% 52.6 57.6
Sales growth adj. for comparable units and currency - - -11% - 6% -7% -9%
Operating income 1.6 2.4 -35% 2.7 -42% 4.3 3.0
Operating income excluding restructuring charges 2.2 4.3 -49% 3.0 -27% 5.2 5.0
Operating margin 6% 8% - 11% - 8% 5%
Operating margin excluding restructuring charges 8% 14% - 12% - 10% 9%
EBITA margin 7% 10% - 11% - 9% 7%
Restructuring charges -0.6 -1.8 -67% -0.3 106% -0.9 -2.0
7 Ericsson | Second Quarter Report 2016
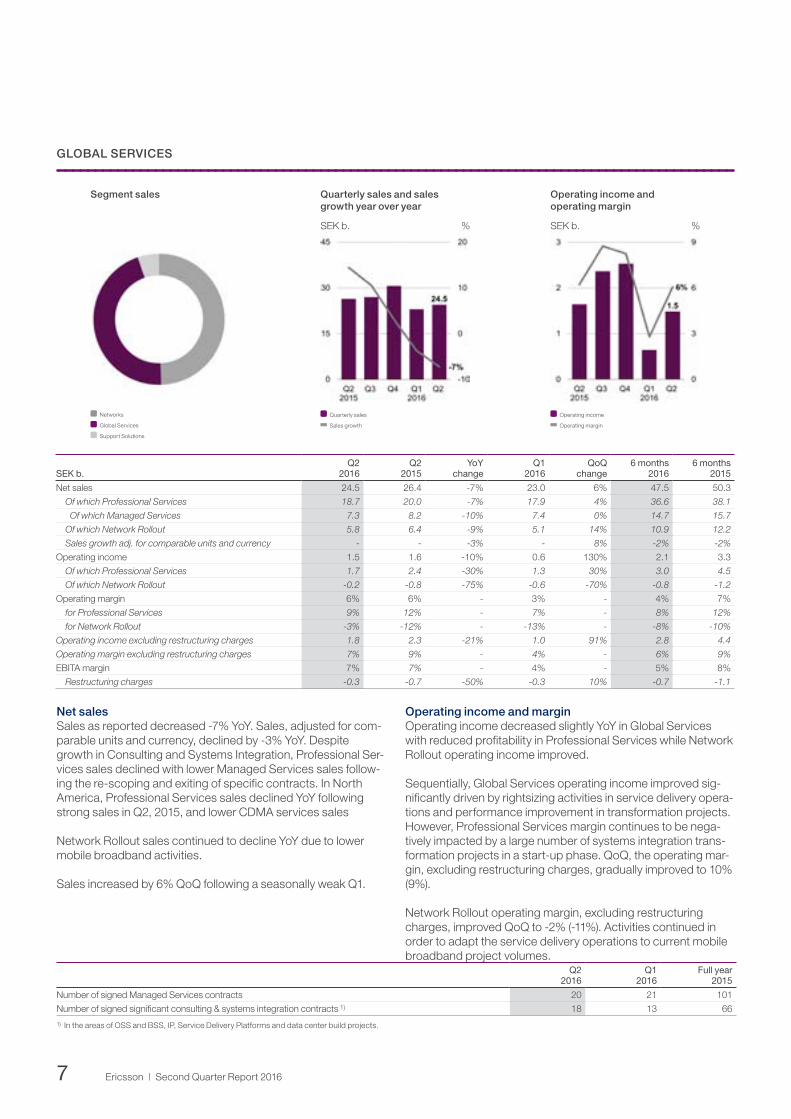
Net salesSales as reported decreased -7% YoY. Sales, adjusted for com-parable units and currency, declined by -3% YoY. Despite growth in Consulting and Systems Integration, Professional Ser-vices sales declined with lower Managed Services sales follow-ing the re-scoping and exiting of specific contracts. In North America, Professional Services sales declined YoY following strong sales in Q2, 2015, and lower CDMA services sales
Network Rollout sales continued to decline YoY due to lower mobile broadband activities.
Sales increased by 6% QoQ following a seasonally weak Q1.
Operating income and marginOperating income decreased slightly YoY in Global Services with reduced profitability in Professional Services while Network Rollout operating income improved.
Sequentially, Global Services operating income improved sig-nificantly driven by rightsizing activities in service delivery opera-tions and performance improvement in transformation projects. However, Professional Services margin continues to be nega-tively impacted by a large number of systems integration trans-formation projects in a start-up phase. QoQ, the operating mar-gin, excluding restructuring charges, gradually improved to 10% (9%).
Network Rollout operating margin, excluding restructuring charges, improved QoQ to -2% (-11%). Activities continued in order to adapt the service delivery operations to current mobile broadband project volumes.
SEK b.Q2
2016Q2
2015YoY
change Q1
2016QoQ
change6 months
20166 months
2015
Net sales 24.5 26.4 -7% 23.0 6% 47.5 50.3
Of which Professional Services 18.7 20.0 -7% 17.9 4% 36.6 38.1
Of which Managed Services 7.3 8.2 -10% 7.4 0% 14.7 15.7
Of which Network Rollout 5.8 6.4 -9% 5.1 14% 10.9 12.2
Sales growth adj. for comparable units and currency - - -3% - 8% -2% -2%
Operating income 1.5 1.6 -10% 0.6 130% 2.1 3.3
Of which Professional Services 1.7 2.4 -30% 1.3 30% 3.0 4.5
Of which Network Rollout -0.2 -0.8 -75% -0.6 -70% -0.8 -1.2
Operating margin 6% 6% - 3% - 4% 7%
for Professional Services 9% 12% - 7% - 8% 12%
for Network Rollout -3% -12% - -13% - -8% -10%
Operating income excluding restructuring charges 1.8 2.3 -21% 1.0 91% 2.8 4.4
Operating margin excluding restructuring charges 7% 9% - 4% - 6% 9%
EBITA margin 7% 7% - 4% - 5% 8%
Restructuring charges -0.3 -0.7 -50% -0.3 10% -0.7 -1.1
Segment sales
Networks
Global Services
Support Solutions
Quarterly sales and sales growth year over year
SEK b. %
Quarterly sales
Sales growth
Operating income and operating margin
SEK b. %
Operating income
Operating margin
GLOBAL SERVICES
Q2 2016
Q1 2016
Full year 2015
Number of signed Managed Services contracts 20 21 101
Number of signed significant consulting & systems integration contracts 1) 18 13 66
1) In the areas of OSS and BSS, IP, Service Delivery Platforms and data center build projects.
8 Ericsson | Second Quarter Report 2016
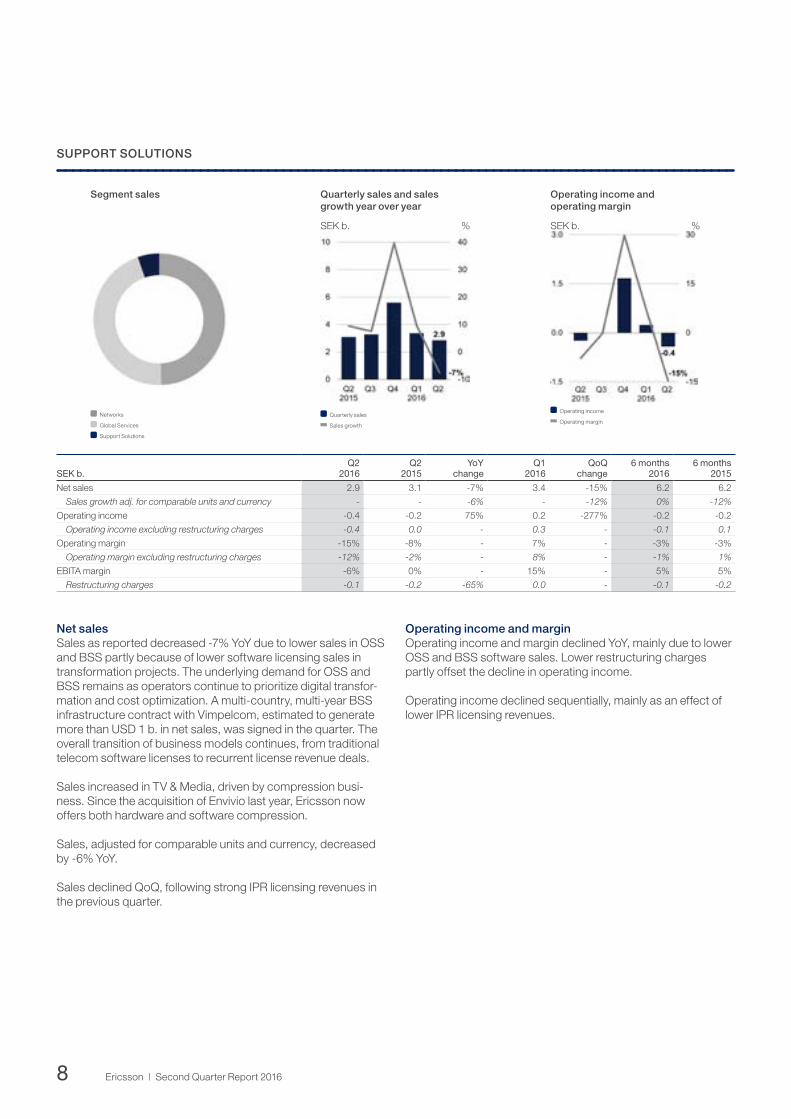
Net salesSales as reported decreased -7% YoY due to lower sales in OSS and BSS partly because of lower software licensing sales in transformation projects. The underlying demand for OSS and BSS remains as operators continue to prioritize digital transfor-mation and cost optimization. A multi-country, multi-year BSS infrastructure contract with Vimpelcom, estimated to generate more than USD 1 b. in net sales, was signed in the quarter. The overall transition of business models continues, from traditional telecom software licenses to recurrent license revenue deals.
Sales increased in TV & Media, driven by compression busi-ness. Since the acquisition of Envivio last year, Ericsson now offers both hardware and software compression.
Sales, adjusted for comparable units and currency, decreased by -6% YoY.
Sales declined QoQ, following strong IPR licensing revenues in the previous quarter.
Operating income and marginOperating income and margin declined YoY, mainly due to lower OSS and BSS software sales. Lower restructuring charges partly offset the decline in operating income.
Operating income declined sequentially, mainly as an effect of lower IPR licensing revenues.
Segment sales
Networks
Global Services
Support Solutions
Quarterly sales and sales growth year over year
SEK b. %
Quarterly sales
Sales growth
Operating income and operating margin
SEK b. %
Operating income
Operating margin
SUPPORT SOLUTIONS
SEK b.Q2
2016Q2
2015YoY
change Q1
2016QoQ
change6 months
20166 months
2015
Net sales 2.9 3.1 -7% 3.4 -15% 6.2 6.2
Sales growth adj. for comparable units and currency - - -6% - -12% 0% -12%
Operating income -0.4 -0.2 75% 0.2 -277% -0.2 -0.2
Operating income excluding restructuring charges -0.4 0.0 - 0.3 - -0.1 0.1
Operating margin -15% -8% - 7% - -3% -3%
Operating margin excluding restructuring charges -12% -2% - 8% - -1% 1%
EBITA margin -6% 0% - 15% - 5% 5%
Restructuring charges -0.1 -0.2 -65% 0.0 - -0.1 -0.2
9 Ericsson | Second Quarter Report 2016
CASH flow
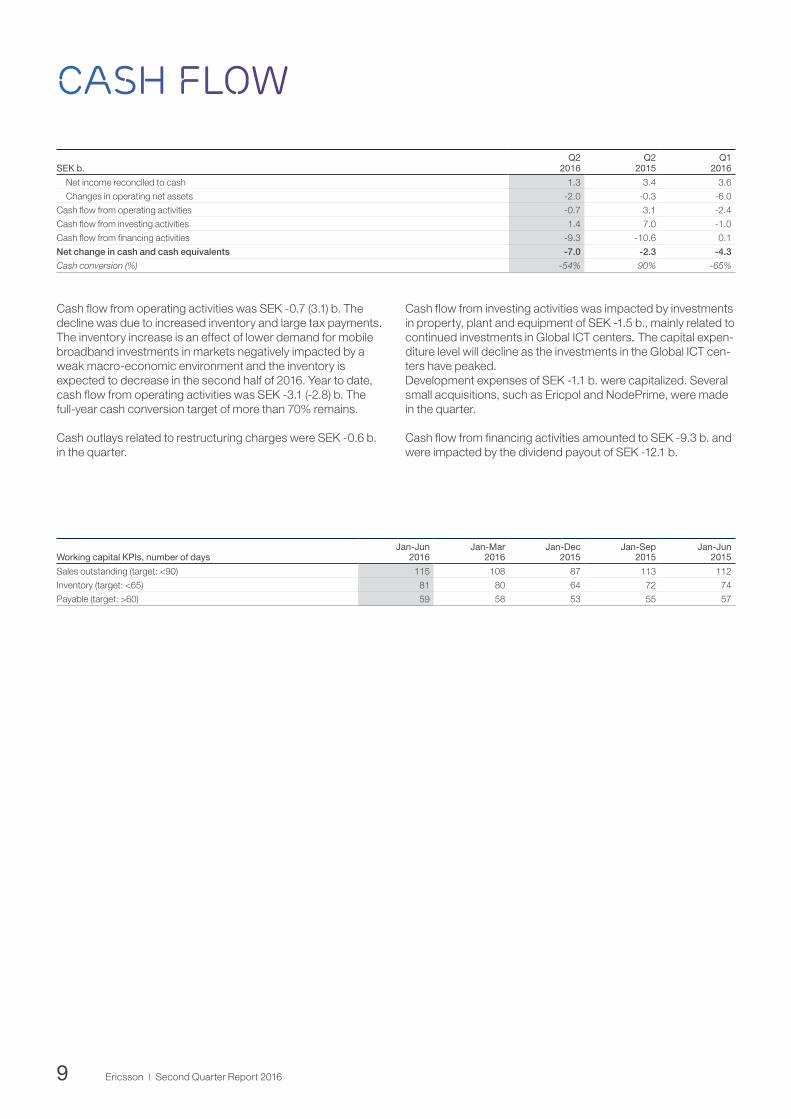
Cash flow from operating activities was SEK -0.7 (3.1) b. The decline was due to increased inventory and large tax payments. The inventory increase is an effect of lower demand for mobile broadband investments in markets negatively impacted by a weak macro-economic environment and the inventory is expected to decrease in the second half of 2016. Year to date, cash flow from operating activities was SEK -3.1 (-2.8) b. The full-year cash conversion target of more than 70% remains.
Cash outlays related to restructuring charges were SEK -0.6 b. in the quarter.
Cash flow from investing activities was impacted by investments in property, plant and equipment of SEK -1.5 b., mainly related to continued investments in Global ICT centers. The capital expen-diture level will decline as the investments in the Global ICT cen-ters have peaked. Development expenses of SEK -1.1 b. were capitalized. Several small acquisitions, such as Ericpol and NodePrime, were made in the quarter.
Cash flow from financing activities amounted to SEK -9.3 b. and were impacted by the dividend payout of SEK -12.1 b.
SEK b.Q2
2016Q2
2015Q1
2016
Net income reconciled to cash 1.3 3.4 3.6
Changes in operating net assets -2.0 -0.3 -6.0
Cash flow from operating activities -0.7 3.1 -2.4
Cash flow from investing activities 1.4 7.0 -1.0
Cash flow from financing activities -9.3 -10.6 0.1
Net change in cash and cash equivalents -7.0 -2.3 -4.3
Cash conversion (%) -54% 90% -65%
Working capital KPIs, number of daysJan-Jun
2016Jan-Mar
2016Jan-Dec
2015Jan-Sep
2015Jan-Jun
2015
Sales outstanding (target: <90) 115 108 87 113 112
Inventory (target: <65) 81 80 64 72 74
Payable (target: >60) 59 58 53 55 57

10 Ericsson | Second Quarter Report 2016
FINANCIAL POSITION
Net cash decreased by SEK -15.5 b. in the quarter mainly as a result of the dividend payout of SEK -12.1 b., increased working capital and large tax payments. The net cash position was SEK 21.0 b.
Post-employment benefits were SEK 27.3 b., compared with SEK 25.7 b. on March 31, 2016, following lower discount rates.
The average maturity of long-term borrowings as of June 30, 2016, was 4.3 years, compared with 5.3 years 12 months earlier.
In the quarter, the revolving Credit Facility of USD 2.0 b. was extended with one year. The facility will expire in 2021.
SEK b.Jun 30
2016Jun 30
2015Mar 31
2016
+ Short-term investments 19.8 20.8 25.1
+ Cash and cash equivalents 28.9 33.0 35.9
Gross cash 48.8 53.8 61.0
– Interest bearing liabilities 27.8 25.8 24.5
Net cash 21.0 28.0 36.5
Equity 136.7 136.7 145.6
Total assets 277.4 278.9 280.3
Capital turnover (times) 1.1 1.3 1.1
Return on capital employed (%) 6.5% 6.9% 6.9%
Equity ratio (%) 49.3% 49.0% 52.0%
Return on equity (%) 5.0% 5.9% 5.4%
Debt maturity profile, Parent Company
SEK b.
Swedish Export Credit Corporation MTN Bond
Nordic Investment Bank
European Investment Bank
Notes and Bonds

11 Ericsson | Second Quarter Report 2016
Parent company
Income after financial items was SEK 13.2 (9.0) b. The increase was mainly due to higher recognized dividends from subsidiar-ies compared with last year.
Major changes in the Parent Company’s financial position for the year; decreased cash, cash equivalents and short-term invest-ments of SEK 15.4 b. In the quarter, the dividend payment of SEK 12.1 b. was made, as decided by the Annual General Meet-ing.
At the end of the quarter, cash, cash equivalents and short-term investments amounted to SEK 33.3 (34.2) b.
The Parent Company has recognized dividends from subsidiar-ies of SEK 12.6 b. in the quarter.
In accordance with the conditions of the long-term variable compensation program (LTV) for Ericsson employees, 3,132,556 shares from treasury stock were distributed to employees or sold in the second quarter. The holding of treasury stock on June 30, 2016, was 69,269,921 Class B shares.
12 Ericsson | Second Quarter Report 2016
Other information
Ericsson resolved on an acquisition offer for C shares for LTV 2016On April 28, 2016, Ericsson announced that, in accordance with the resolution by the Annual General Meeting 2016, the company expands its treasury stock in order to provide shares for the Long-Term Variable Compensation Program (LTV) 2016 for employees in Ericsson.The Board of Directors of Ericsson has resolved, by virtue of an authorization given by the Annual General Meeting on April 13, 2016, to direct an acquisition offer to all holders of C shares to acquire these shares. Acquisition shall be made during the period May 5 - May 20, 2016. Payment for acquired shares shall be made in cash with SEK 5 per share.The offer is part of the financing of Ericsson’s Long-Term Variable Compensation Program 2016 and includes all 26,100,000 C shares which Ericsson has previously decided to issue to AB Industrivärden and Investor AB for the program. AB Industrivärden and Investor AB have informed Ericsson that they intend to accept the offer.Once all 26,100,000 C shares have been acquired by Ericsson, the Board intends to convert them to B shares. After the conver-sion, the number of B shares in issue will amount to 3,069,395,752. On April 28, 2016, Ericsson held 46,002,257 B shares as treasury stock.
Ericsson’s Nomination Committee appointed On May 18, 2016, Ericsson announced that the Nomination Com-mittee for the Annual General Meeting (AGM) 2017 had been appointed in accordance with the instruction for the Nomination Committee, resolved by the Annual General Meeting 2012. The Nomination Committee consists of: Petra Hedengran, Investor AB; Johan Held, Afa Försäkring, Leif Johansson, the Chairman of the Board of Directors, Bengt Kjell, AB Industrivärden and Han-delsbankens Pensionsstiftelse; and Anders Oscarsson, AMF - Försäkring och Fonder. Petra Hedengran is the Chairman of the Nomination Committee.
Increase in the total number of shares and votes in Telefonaktiebolaget LM EricssonOn May 31, 2016, Ericsson confirmed that the company’s share capital amounts to SEK 16,655,758,678 and the total number of shares is 3,331,151,735, of which 261,755,983 are A shares and 3,069,395,752 are B shares. The total number of votes is 568,695,558.2, of which class A shares represent 261,755,983 votes and class B shares represent 306,939,575.2 votes.The increase in the number of shares and votes is caused by the company’s recent issue of 26,100,000 C shares, which shares have subsequently been repurchased by the company and con-verted into B shares, by virtue of a conversion clause in the arti-cles of association. This is in accordance with the resolution by the Annual General Meeting 2016 to expand the treasury stock as part of the financing of Ericsson’s Long-Term Variable Compen-sation Program (LTV) 2016. On May 31, 2016, the company held 69,331,486 shares as treasury stock.
Voluntary request from US AuthoritiesOn June 17, 2016, after speculation in media regarding alleged corruption investigations, Ericsson issued a statement comment-ing on the media reports. Ericsson clarified that in March 2013, it received a voluntary request from US Authorities to answer a number of questions relating to Ericsson’s operations, confirmed by the company already in 2013. Ericsson cooperates with US Authorities to answer these and additional questions. Ericsson has not provided any detailed comments on the request or the questions as such, or if they relate to specific regions or countries, but confirms that it relates to Ericsson’s anti-corruption program and questions related to the Foreign Corrupt Practices Act.
Greek investigation into contract from 1999 On June 19, 2016, Ericsson gave an update about an investiga-tion in Greece relating to a defense agreement signed in 1999 in which Ericsson Microwave Systems delivered an airborne radar system to Greece. Ericsson commented publicly on this case more than two years ago, including in conjunction with its Annual General Meeting. Ericsson Microwave Systems was sold by Ericsson in 2006. Recently, as part of the ongoing investigation, seven current and former Ericsson employees have been served with summons in preliminary investigation proceedings by a Greek prosecutor involving allegations of possible corruption. Ericsson has not been contacted by any authority in this matter.
13 Ericsson | Second Quarter Report 2016
Risk factors
Ericsson’s operational and financial risk factors and uncertain-ties are described in our Annual Report 2015.
Risk factors and uncertainties in focus short term for the Parent Company and the Ericsson Group include, but are not limited to: > Potential negative effects on operators’ willingness to invest
in network development due to uncertainty in the financial markets and a weak economic business environment, or reduced consumer telecom spending, or increased pressure on us to provide financing, or delayed auctions of spectrums;
> Uncertainty regarding the financial stability of suppliers, for example due to lack of financing;
> Effects on gross margins and/or working capital of the busi-ness mix in the Networks segment between capacity sales and new coverage build-outs;
> Effects on gross margins of the business mix in the Global Services segment including proportion of new network build-outs and share of new managed services or digital transfor-mation deals with initial transition costs;
> Effects of the ongoing industry consolidation among our cus-tomers as well as between our largest competitors, e.g. with postponed investments and intensified price competition as a consequence;
> New JV arrangements or partnerships which may not be successful and expose us to future costs;
> Changes in foreign exchange rates, in particular USD; > Political unrest or instability in certain markets; > Effects on production and sales from restrictions with respect
to timely and adequate supply of materials, components and production capacity and other vital services on competitive terms;
> No guarantees that specific restructuring or cost-savings ini-tiatives will be sufficient, successful or executed in time to deliver any improvements in short-term earnings;
> Brexit might lead to economic uncertainty which may impact operators’ investment levels. Various geopolitical forces may impact the global economy and our business
> Cyber security incidents, which may have material negative impact.
Ericsson stringently monitors the compliance with all relevant trade regulations and trade embargos applicable to dealings with customers operating in countries where there are trade restrictions or trade restrictions are discussed. Ericsson oper-ates globally in accordance with Group policies and directives for business ethics and conduct and has a dedicated anti- corruption program. However, in some of the countries where the company operates, corruption risks can be high and compli-ance failure could have a material adverse impact on our busi-ness, financial condition and brand.
This report has not been reviewed by Telefonaktiebolaget LM Ericsson’s auditor.
Date for next report: October 21, 2016
14 Ericsson | Second Quarter Report 2016
Board assurance
The Board of Directors and the CEO certify that the financial report for the six months gives a fair view of the performance of the business, position and profit or loss of the Company and the Group, and describes the principal risks and uncertainties that the Company and the companies in the Group face.
Stockholm, July 19, 2016Telefonaktiebolaget LM Ericsson (publ)Org. Nr. 556016-0680
Helena Stjernholm Leif Johansson Jacob Wallenberg Deputy Chairman Chairman Deputy Chairman
Nora Denzel Börje Ekholm Ulf J. Johansson Member of the Board Member of the Board Member of the Board
Kristin Skogen Lund Kristin S. Rinne Sukhinder Singh Cassidy Member of the Board Member of the Board Member of the Board
Hans Vestberg President, CEO and member of the Board
Pehr Claesson Mikael Lännqvist Karin Åberg Member of the Board Member of the Board Member of the Board

15 Ericsson | Second Quarter Report 2016
Editor’s note
Ericsson invites media, investors and analysts to a press con-ference at the Ericsson Studio, Grönlandsgången 4, Stockholm, at 09.00 (CET), July 19, 2016. A financial analyst, investor and media conference call will begin at 14.00 (CET).
Live webcast of the press conference and conference call as well as supporting slides will be available at www.ericsson.com/press and www.ericsson.com/investors
Video material will be published during the day on www.ericsson.com/press
For further information, please contact:Helena Norrman, Senior Vice President, Chief Marketing and Communications OfficerPhone: +46 10 719 34 72E-mail: [email protected] or [email protected]
Telefonaktiebolaget LM EricssonOrg. number: 556016-0680Torshamnsgatan 21SE-164 83 StockholmPhone: +46 10 719 00 00www.ericsson.com
Investors
Peter Nyquist, Vice President,Head of Investor RelationsPhone: +46 10 714 64 49, +46 70 575 29 06E-mail: [email protected]
Stefan Jelvin, Director,Investor RelationsPhone: +46 10 714 20 39, +46 70 986 02 27E-mail: [email protected]
Åsa Konnbjer, Director, Investor RelationsPhone: +46 10 713 39 28, +46 73 082 59 28E-mail: [email protected]
Rikard Tunedal, Director, Investor RelationsPhone: +46 10 714 54 00, +46 761 005 400E-mail: [email protected]
Media
Ola Rembe, Vice President, Head of External CommunicationsPhone: +46 10 719 97 27, +46 73 024 48 73E-mail: [email protected]
Corporate CommunicationsPhone: +46 10 719 69 92E-mail: [email protected]
16 Ericsson | Second Quarter Report 2016
Safe harbor statement
All statements made or incorporated by reference in this release, other than statements or characterizations of historical facts, are forward-looking statements. These forward-looking statements are based on our current expectations, estimates and projec-tions about our industry, management’s beliefs and certain assumptions made by us. Forward-looking statements can often be identified by words such as “anticipates”, “expects”, “intends”, “plans”, “predicts”, “believes”, “seeks”, “estimates”, “may”, “will”, “should”, “would”, “potential”, “continue”, and varia-tions or negatives of these words, and include, among others, statements regarding: (i) strategies, outlook and growth pros-pects; (ii) positioning to deliver future plans and to realize poten-tial for future growth; (iii) liquidity and capital resources and expenditure, and our credit ratings; (iv) growth in demand for our products and services; (v) our joint venture activities; (vi) eco-nomic outlook and industry trends; (vii) developments of our markets; (viii) the impact of regulatory initiatives; (ix) research and development expenditures; (x) the strength of our competi-tors; (xi) future cost savings; (xii) plans to launch new products and services; (xiii) assessments of risks; (xiv) integration of acquired businesses; (xv) compliance with rules and regulations and (xvi) infringements of intellectual property rights of others.
In addition, any statements that refer to expectations, projec-tions or other characterizations of future events or circum-stances, including any underlying assumptions, are for-ward-looking statements. These forward-looking statements speak only as of the date hereof and are based upon the infor-mation available to us at this time. Such information is subject to change, and we will not necessarily inform you of such changes. These statements are not guarantees of future performance and are subject to risks, uncertainties and assumptions that are diffi-cult to predict. Therefore, our actual results could differ materi-ally and adversely from those expressed in any forward-looking statements as a result of various factors. Important factors that may cause such a difference for Ericsson include, but are not limited to: (i) material adverse changes in the markets in which we operate or in global economic conditions; (ii) increased prod-uct and price competition; (iii) reductions in capital expenditure by network operators; (iv) the cost of technological innovation and increased expenditure to improve quality of service; (v) sig-nificant changes in market share for our principal products and services; (vi) foreign exchange rate or interest rate fluctuations; and (vii) the successful implementation of our business and operational initiatives.
17 Ericsson | Second Quarter Report 2016
Financial STATEMENTS AND ADDITIONAL INFORMATION
ContentsFinancial statements Consolidated income statement 18Statement of comprehensive income 18Consolidated balance sheet 19Consolidated statement of cash flows 20Consolidated statement of changes in equity 21Consolidated income statement – isolated quarters 21Consolidated statement of cash flows – isolated quarters 22Parent Company income statement 23Parent Company statement of comprehensive income 23Parent Company balance sheet 24
Additional information Accounting policies 25Net sales by segment by quarter 26Sales growth adjusted for comparable units and currency 27Operating income by segment by quarter 28Operating margin by segment by quarter 28EBITA by segment by quarter 29EBITA margin by segment by quarter 29Net sales by region by quarter 30Net sales by region by quarter (cont.) 31Top 5 countries in sales 31Net sales by region by segment 32Provisions 33Information on investments 33Other information 34Number of employees 34Restructuring charges by function 35Restructuring charges by segment 35Reconciliation tables, non-IFRS measures 36
18 Ericsson | Second Quarter Report 2016
Apr–Jun Jan–Jun
SEK million 2016 2015 Change 2016 2015 Change
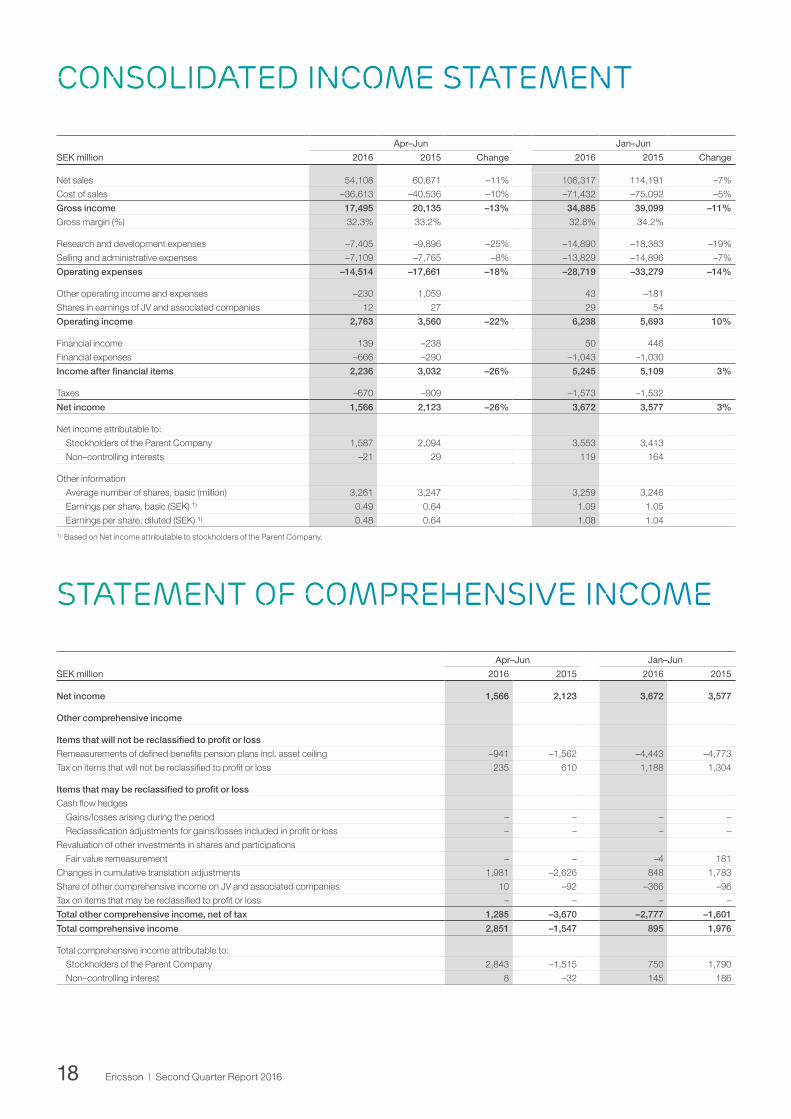
Net sales 54,108 60,671 –11% 106,317 114,191 –7%
Cost of sales –36,613 –40,536 –10% –71,432 –75,092 –5%
Gross income 17,495 20,135 –13% 34,885 39,099 –11%
Gross margin (%) 32.3% 33.2% 32.8% 34.2%
Research and development expenses –7,405 –9,896 –25% –14,890 –18,383 –19%
Selling and administrative expenses –7,109 –7,765 –8% –13,829 –14,896 –7%
Operating expenses –14,514 –17,661 –18% –28,719 –33,279 –14%
Other operating income and expenses –230 1,059 43 –181
Shares in earnings of JV and associated companies 12 27 29 54
Operating income 2,763 3,560 –22% 6,238 5,693 10%
Financial income 139 –238 50 446
Financial expenses –666 –290 –1,043 –1,030
Income after financial items 2,236 3,032 –26% 5,245 5,109 3%
Taxes –670 –909 –1,573 –1,532
Net income 1,566 2,123 –26% 3,672 3,577 3%
Net income attributable to:
Stockholders of the Parent Company 1,587 2,094 3,553 3,413
Non–controlling interests –21 29 119 164
Other information
Average number of shares, basic (million) 3,261 3,247 3,259 3,246
Earnings per share, basic (S EK) 1) 0.49 0.64 1.09 1.05
Earnings per share, diluted (SEK) 1) 0.48 0.64 1.08 1.04
1) Based on Net income attributable to stockholders of the Parent Company.
Apr–Jun Jan–Jun
SEK million 2016 2015 2016 2015
Net income 1,566 2,123 3,672 3,577
Other comprehensive income
Items that will not be reclassified to profit or loss
Remeasurements of defined benefits pension plans incl. asset ceiling –941 –1,562 –4,443 –4,773
Tax on items that will not be reclassified to profit or loss 235 610 1,188 1,304
Items that may be reclassified to profit or loss
Cash flow hedges
Gains/losses arising during the period – – – –
Reclassification adjustments for gains/losses included in profit or loss – – – –
Revaluation of other investments in shares and participations
Fair value remeasurement – – –4 181
Changes in cumulative translation adjustments 1,981 –2,626 848 1,783
Share of other comprehensive income on JV and associated companies 10 –92 –366 –96
Tax on items that may be reclassified to profit or loss – – – –
Total other comprehensive income, net of tax 1,285 –3,670 –2,777 –1,601
Total comprehensive income 2,851 –1,547 895 1,976
Total comprehensive income attributable to:
Stockholders of the Parent Company 2,843 –1,515 750 1,790
Non–controlling interest 8 –32 145 186
CONSOLIDATED INCOME STATEMENT
STATEMENT OF COMPREHENSIVE INCOME

19 Ericsson | Second Quarter Report 2016
SEK millionJun 30
2016Mar 31
2016Dec 31
2015
ASSETS
Non–current assets
Intangible assets
Capitalized development expenses 7,064 6,349 5,493
Goodwill 41,913 40,316 41,087
Intellectual property rights, brands and other intangible assets 8,035 8,400 9,316
Property, plant and equipment 16,856 16,127 15,901
Financial assets
Equity in JV and associated companies 787 851 1,210
Other investments in shares and participations 1,178 1,090 1,275
Customer finance, non–current 2,315 1,663 1,739
Other financial assets, non–current 5,061 4,997 5,634
Deferred tax assets 14,451 14,117 13,183
97,660 93,910 94,838
Current assets
Inventories 34,660 32,252 28,436
Trade receivables 68,461 66,701 71,069
Customer finance, current 2,532 2,346 2,041
Other current receivables 25,297 24,105 21,709
Short–term investments 19,846 25,077 26,046
Cash and cash equivalents 28,931 35,934 40,224
179,727 186,415 189,525
Total assets 277,387 280,325 284,363
EQUITY AND LIABILITIES
Equity
Stockholders' equity 135,746 144,699 146,525
Non–controlling interest in equity of subsidiaries 945 945 841
136,691 145,644 147,366
Non–current liabilities
Post–employment benefits 27,323 25,715 22,664
Provisions, non–current 245 158 176
Deferred tax liabilities 2,036 2,098 2,472
Borrowings, non–current 18,164 22,110 22,744
Other non–current liabilities 2,030 1,834 1,851
49,798 51,915 49,907
Current liabilities
Provisions, current 3,142 3,374 3,662
Borrowings, current 9,653 2,414 2,376
Trade payables 23,709 21,549 22,389
Other current liabilities 54,394 55,429 58,663
90,898 82,766 87,090
Total equity and liabilities 277,387 280,325 284,363
Of which interest–bearing liabilities 27,817 24,524 25,120
Of which net cash 20,960 36,487 41,150
Assets pledged as collateral 2,523 2,513 2,526
Contingent liabilities 1,003 918 922
Consolidated balance sheet

20 Ericsson | Second Quarter Report 2016
Apr–Jun Jan–Jun Jan–Dec
SEK million 2016 2015 2016 2015 2015
Operating activities
Net income 1,566 2,123 3,672 3,577 13,673
Adjustments to reconcile net income to cash
Taxes –3,410 –1,360 –4,618 –3,281 –2,835
Earnings/dividends in JV and associated companies 73 49 57 27 130
Depreciation, amortization and impairment losses 2,104 2,579 4,201 5,260 10,206
Other 988 22 1,640 966 3,110
1,321 3,413 4,952 6,549 24,284
Changes in operating net assets
Inventories –1,667 383 –5,879 –3,636 –366
Customer finance, current and non–current –816 405 –1,067 147 824
Trade receivables –564 3,630 2,844 5,667 7,000
Trade payables 2,457 –1,400 1,840 –3,068 –2,676
Provisions and post–employment benefits 218 1,685 204 1,519 544
Other operating assets and liabilities, net –1,662 –5,038 –5,979 –10,000 –9,013
–2,034 –335 –8,037 –9,371 –3,687
Cash flow from operating activities –713 3,078 –3,085 –2,822 20,597
Investing activities
Investments in property, plant and equipment –1,572 –2,424 –3,046 –4,791 –8,338
Sales of property, plant and equipment 50 1,075 94 1,150 1,301
Acquisitions/divestments of subsidiaries and other operations, net –480 –169 –588 –227 –2,200
Product development –1,099 –843 –2,307 –1,137 –3,302
Other investing activities –890 –280 –155 –162 –543
Short–term investments 5,355 9,678 6,368 10,077 5,095
Cash flow from investing activities 1,364 7,037 366 4,910 –7,987
Cash flow before financing activities 651 10,115 –2,719 2,088 12,610
Financing activities
Dividends paid –12,067 –11,035 –12,100 –11,060 –11,337
Other financing activities 2,761 431 2,855 1,330 627
Cash flow from financing activities –9,306 –10,604 –9,245 –9,730 –10,710
Effect of exchange rate changes on cash 1,652 –1,860 671 –384 –2,664
Net change in cash and cash equivalents –7,003 –2,349 –11,293 –8,026 –764
Cash and cash equivalents, beginning of period 35,934 35,311 40,224 40,988 40,988
Cash and cash equivalents, end of period 28,931 32,962 28,931 32,962 40,224
CONSOLIDATED STATEMENT OF CASH FLOWS
21 Ericsson | Second Quarter Report 2016
SEK million
Jan–Jun Jan–Dec
2016 2015 2015
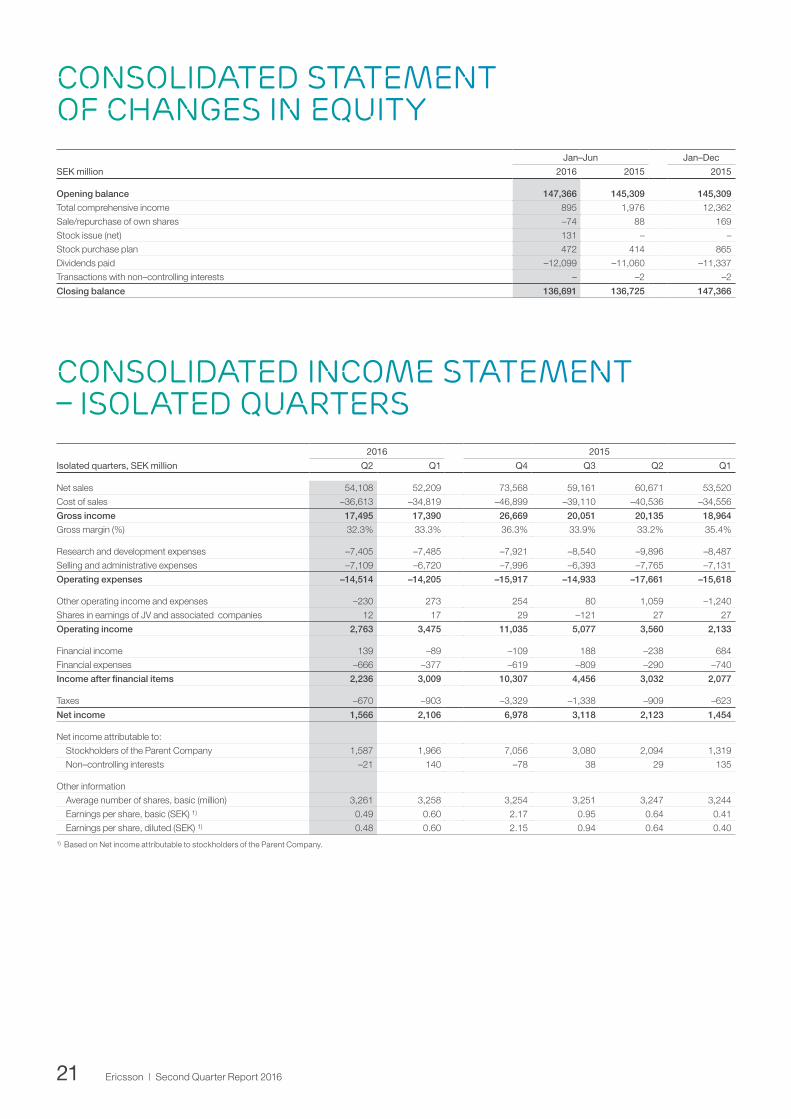
Opening balance 147,366 145,309 145,309
Total comprehensive income 895 1,976 12,362
Sale/repurchase of own shares –74 88 169
Stock issue (net) 131 – –
Stock purchase plan 472 414 865
Dividends paid –12,099 –11,060 –11,337
Transactions with non–controlling interests – –2 –2
Closing balance 136,691 136,725 147,366
CONSOLIDATED STATEMENT OF CHANGES IN EQUITY
2016 2015
Isolated quarters, SEK million Q2 Q1 Q4 Q3 Q2 Q1
Net sales 54,108 52,209 73,568 59,161 60,671 53,520
Cost of sales –36,613 –34,819 –46,899 –39,110 –40,536 –34,556
Gross income 17,495 17,390 26,669 20,051 20,135 18,964
Gross margin (%) 32.3% 33.3% 36.3% 33.9% 33.2% 35.4%
Research and development expenses –7,405 –7,485 –7,921 –8,540 –9,896 –8,487
Selling and administrative expenses –7,109 –6,720 –7,996 –6,393 –7,765 –7,131
Operating expenses –14,514 –14,205 –15,917 –14,933 –17,661 –15,618
Other operating income and expenses –230 273 254 80 1,059 –1,240
Shares in earnings of JV and associated companies 12 17 29 –121 27 27
Operating income 2,763 3,475 11,035 5,077 3,560 2,133
Financial income 139 –89 –109 188 –238 684
Financial expenses –666 –377 –619 –809 –290 –740
Income after financial items 2,236 3,009 10,307 4,456 3,032 2,077
Taxes –670 –903 –3,329 –1,338 –909 –623
Net income 1,566 2,106 6,978 3,118 2,123 1,454
Net income attributable to:
Stockholders of the Parent Company 1,587 1,966 7,056 3,080 2,094 1,319
Non–controlling interests –21 140 –78 38 29 135
Other information
Average number of shares, basic (million) 3,261 3,258 3,254 3,251 3,247 3,244
Earnings per share, basic (SEK) 1) 0.49 0.60 2.17 0.95 0.64 0.41
Earnings per share, diluted (SEK) 1) 0.48 0.60 2.15 0.94 0.64 0.40
1) Based on Net income attributable to stockholders of the Parent Company.
CONSOLIDATED INCOME STATEMENT – ISOLATED QUARTERS

22 Ericsson | Second Quarter Report 2016
2016 2015
Isolated quarters, SEK million Q2 Q1 Q4 Q3 Q2 Q1
Operating activities
Net income 1,566 2,106 6,978 3,118 2,123 1,454
Adjustments to reconcile net income to cash
Taxes –3,410 –1,208 395 51 –1,360 –1,921
Earnings/dividends in JV and associated companies 73 –16 –33 136 49 –22
Depreciation, amortization and impairment losses 2,104 2,097 2,521 2,425 2,579 2,681
Other 988 652 1,092 1,052 22 944
1,321 3,631 10,953 6,782 3,413 3,136
Changes in operating net assets
Inventories –1,667 –4,212 3,496 –226 383 –4,019
Customer finance, current and non–current –816 –251 302 375 405 –258
Trade receivables –564 3,408 2,754 –1,421 3,630 2,037
Trade payables 2,457 –617 886 –494 –1,400 –1,668
Provisions and post–employment benefits 218 –14 –673 –302 1,685 –166
Other operating assets and liabilities, net –1,662 –4,317 4,141 –3,154 –5,038 –4,962
–2,034 –6,003 10,906 –5,222 –335 –9,036
Cash flow from operating activities –713 –2,372 21,859 1,560 3,078 –5,900
Investing activities
Investments in property, plant and equipment –1,572 –1,474 –1,740 –1,807 –2,424 –2,367
Sales of property, plant and equipment 50 44 92 59 1,075 75
Acquisitions/divestments of subsidiaries and other operations, net –480 –108 –945 –1,028 –169 –58
Product development –1,099 –1,208 –1,183 –982 –843 –294
Other investing activities –890 735 –418 37 –280 118
Short–term investments 5,355 1,013 –8,613 3,631 9,678 399
Cash flow from investing activities 1,364 –998 –12,807 –90 7,037 –2,127
Cash flow before financing activities 651 –3,370 9,052 1,470 10,115 –8,027
Financing activities
Dividends paid –12,067 –33 – –277 –11,035 –25
Other financing activities 2,761 94 –669 –34 431 899
Cash flow from financing activities –9,306 61 –669 –311 –10,604 874
Effect of exchange rate changes on cash 1,652 –981 –2,109 –171 –1,860 1,476
Net change in cash and cash equivalents –7,003 –4,290 6,274 988 –2,349 –5,677
Cash and cash equivalents, beginning of period 35,934 40,224 33,950 32,962 35,311 40,988
Cash and cash equivalents, end of period 28,931 35,934 40,224 33,950 32,962 35,311
CONSOLIDATED STATEMENT OF CASH FLOWS – ISOLATED QUARTERS

23 Ericsson | Second Quarter Report 2016
Apr–Jun Jan–Jun Jan–Dec
SEK million 2016 2015 2016 2015 2015
Net sales – – – – –
Cost of sales – – – – –
Gross income – – – – –
Operating expenses –267 –191 –490 –480 –1,040
Other operating income and expenses 616 645 1,190 1,338 2,889
Operating income 349 454 700 858 1,849
Financial net 12,496 6,736 12,507 8,187 14,952
Income after financial items 12,845 7,190 13,207 9,045 16,801
Transfers to (–) / from untaxed reserves – – – – –1,500
Taxes –89 –92 –134 –211 –208
Net income 12,756 7,098 13,073 8,834 15,093
PARENT COMPANY INCOME STATEMENT
Parent company STATEMENT OF COMPREHENSIVE INCOME
Apr–Jun Jan–Jun Jan–Dec
SEK million 2016 2015 2016 2015 2015
Net income 12,756 7,098 13,073 8,834 15,093
Revaluation of other investments in shares and participations
Fair value remeasurement – – 5 181 457
Total other comprehensive income, net of tax – – 5 181 457
Total comprehensive income 12,756 7,098 13,078 9,015 15,550

24 Ericsson | Second Quarter Report 2016
SEK millionJun 30
2016Dec 31
2015
ASSETS
Fixed assets
Intangible assets 675 809
Tangible assets 438 456
Financial assets 103,489 99,914
104,602 101,179
Current assets
Inventories 7 –
Receivables 35,026 25,692
Short–term investments 19,437 25,506
Cash and cash equivalents 13,837 23,118
68,307 74,316
Total assets 172,909 175,495
STOCKHOLDERS' EQUITY, PROVISIONS AND LIABILITIES
Equity
Restricted equity 48,149 48,018
Non–restricted equity 43,532 42,578
91,681 90,596
Provisions 774 807
Non–current liabilities 41,898 46,457
Current liabilities 38,556 37,635
Total stockholders' equity, provisions and liabilities 172,909 175,495
Assets pledged as collateral 523 526
Contingent liabilities 23,004 22,461
PARENT COMPANY BALANCE SHEET

25 Ericsson | Second Quarter Report 2016
Accounting policies
THE GROUP
This interim report is prepared in accordance with IAS 34. The term “IFRS” used in this document refers to the application of IAS and IFRS as well as interpretations of these standards as issued by IASB’s Standards Interpretation Committee (SIC) and IFRS Interpretations Committee (IFRIC). The accounting policies adopted are consistent with those of the annual report for the year ended December 31, 2015, and should be read in conjunc-tion with that annual report.
There is no significant difference between IFRS effective as per June 30, 2016 and IFRS as endorsed by the EU.
Amendments applied as from the first quarter of 2016Net CashThe definition of Net Cash has been adjusted in order to more clearly represent Ericsson’s ability to meet financial obligations. Post-employment benefits will no longer be included in the cal-culation of Net Cash. Net Cash for prior periods has been recal-culated using the new definition. The revised definition is as fol-lows:
Net Cash: Cash and cash equivalents plus short-term invest-ments less interest-bearing liabilities (which include: non-current borrowings and current borrowings).
Accounting for bondsDue to the conditions in the market for government and mort-gage bonds in Sweden, Ericsson now intends to hold bonds purchased in its “Asset management” portfolio until maturity instead of intending to hold them for trading. Bonds purchased in this portfolio after January 1, 2016 will be classified as avail-able-for-sale. There were no purchases made in the first six months of 2016. The impact of this change on the financial statements will be disclosed in the interim report following the first purchase of bonds.
Amendments applied as from the second quarter of 2016APMsAs from the second quarter, Ericsson has applied the new guidelines issued by ESMA* on APMs (Alternative Performance Measures). In summary, an APM is understood as a financial measure of historical or future financial performance, financial position, or cash flows, other than a financial measure defined or specified in IFRS. The APMs presented in the interim report will be reconciled to the most directly reconcilable line items in the financial statements at the end of the interim report.
* European Securities and Markets Authority – a European supervisory authority
26 Ericsson | Second Quarter Report 2016
2016 2015
Isolated quarters, SEK million Q2 Q1 Q4 Q3 Q2 Q1
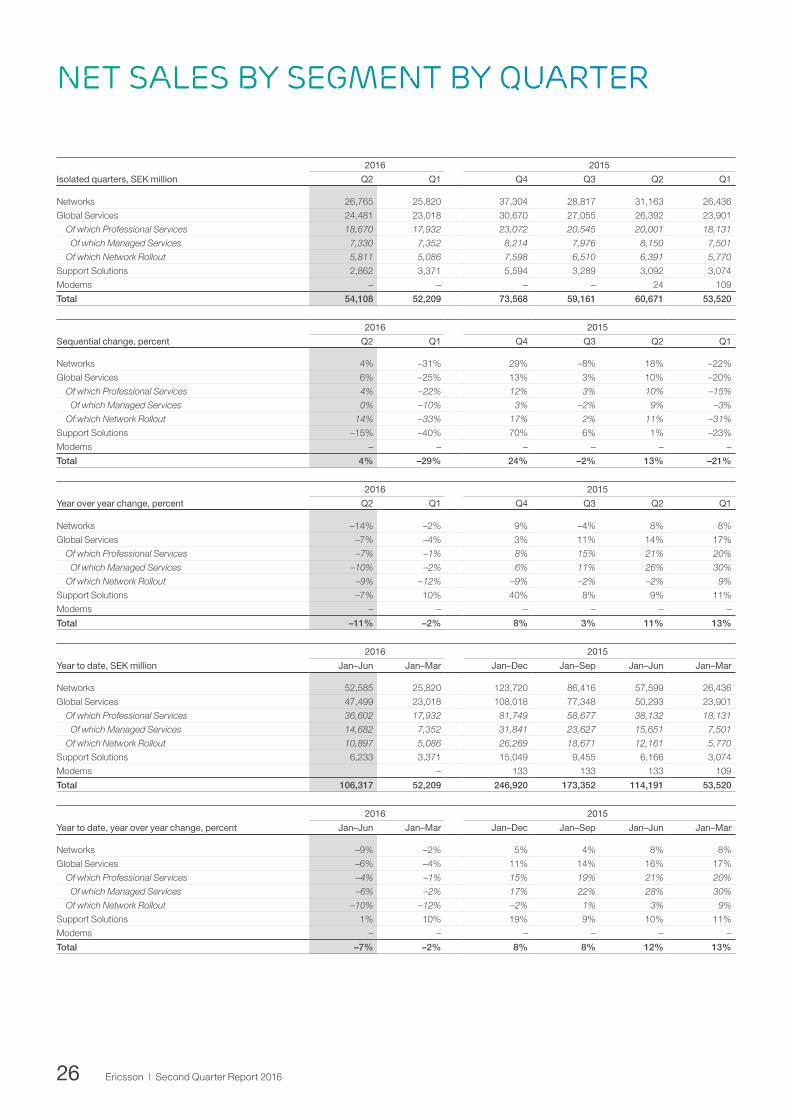
Networks 26,765 25,820 37,304 28,817 31,163 26,436
Global Services 24,481 23,018 30,670 27,055 26,392 23,901
Of which Professional Services 18,670 17,932 23,072 20,545 20,001 18,131
Of which Managed Services 7,330 7,352 8,214 7,976 8,150 7,501
Of which Network Rollout 5,811 5,086 7,598 6,510 6,391 5,770
Support Solutions 2,862 3,371 5,594 3,289 3,092 3,074
Modems – – – – 24 109
Total 54,108 52,209 73,568 59,161 60,671 53,520
2016 2015
Sequential change, percent Q2 Q1 Q4 Q3 Q2 Q1
Networks 4% –31% 29% –8% 18% –22%
Global Services 6% –25% 13% 3% 10% –20%
Of which Professional Services 4% –22% 12% 3% 10% –15%
Of which Managed Services 0% –10% 3% –2% 9% –3%
Of which Network Rollout 14% –33% 17% 2% 11% –31%
Support Solutions –15% –40% 70% 6% 1% –23%
Modems – – – – – –
Total 4% –29% 24% –2% 13% –21%
2016 2015
Year over year change, percent Q2 Q1 Q4 Q3 Q2 Q1
Networks –14% –2% 9% –4% 8% 8%
Global Services –7% –4% 3% 11% 14% 17%
Of which Professional Services –7% –1% 8% 15% 21% 20%
Of which Managed Services –10% –2% 6% 11% 26% 30%
Of which Network Rollout –9% –12% –9% –2% –2% 9%
Support Solutions –7% 10% 40% 8% 9% 11%
Modems – – – – – –
Total –11% –2% 8% 3% 11% 13%
2016 2015
Year to date, SEK million Jan–Jun Jan–Mar Jan–Dec Jan–Sep Jan–Jun Jan–Mar
Networks 52,585 25,820 123,720 86,416 57,599 26,436
Global Services 47,499 23,018 108,018 77,348 50,293 23,901
Of which Professional Services 36,602 17,932 81,749 58,677 38,132 18,131
Of which Managed Services 14,682 7,352 31,841 23,627 15,651 7,501
Of which Network Rollout 10,897 5,086 26,269 18,671 12,161 5,770
Support Solutions 6,233 3,371 15,049 9,455 6,166 3,074
Modems – 133 133 133 109
Total 106,317 52,209 246,920 173,352 114,191 53,520
2016 2015
Year to date, year over year change, percent Jan–Jun Jan–Mar Jan–Dec Jan–Sep Jan–Jun Jan–Mar
Networks –9% –2% 5% 4% 8% 8%
Global Services –6% –4% 11% 14% 16% 17%
Of which Professional Services –4% –1% 15% 19% 21% 20%
Of which Managed Services –6% –2% 17% 22% 28% 30%
Of which Network Rollout –10% –12% –2% 1% 3% 9%
Support Solutions 1% 10% 19% 9% 10% 11%
Modems – – – – – –
Total –7% –2% 8% 8% 12% 13%
NET SALES BY SEGMENT BY QUARTER
27 Ericsson | Second Quarter Report 2016
2016 2015
Sequential change, percent Q2 Q1 Q4 Q3 Q2 Q1
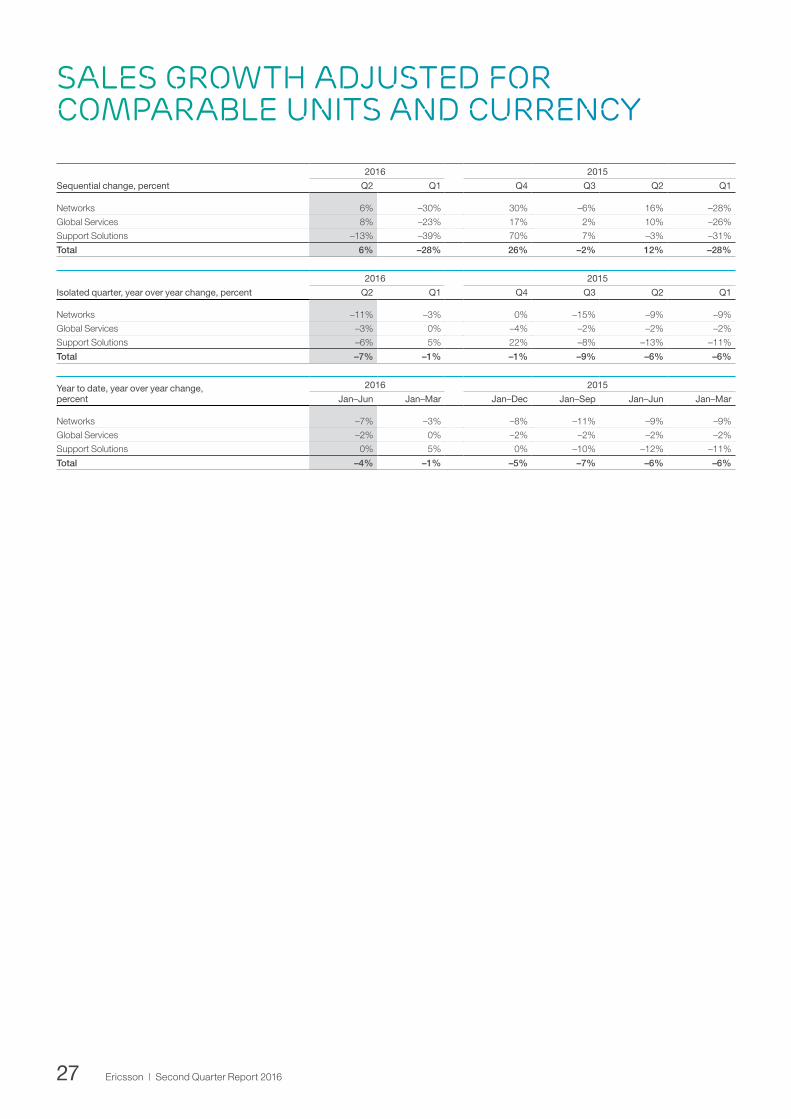
Networks 6% –30% 30% –6% 16% –28%
Global Services 8% –23% 17% 2% 10% –26%
Support Solutions –13% –39% 70% 7% –3% –31%
Total 6% –28% 26% –2% 12% –28%
Isolated quarter, year over year change, percent
2016 2015
Q2 Q1 Q4 Q3 Q2 Q1
Networks –11% –3% 0% –15% –9% –9%
Global Services –3% 0% –4% –2% –2% –2%
Support Solutions –6% 5% 22% –8% –13% –11%
Total –7% –1% –1% –9% –6% –6%
Year to date, year over year change, percent
2016 2015
Jan–Jun Jan–Mar Jan–Dec Jan–Sep Jan–Jun Jan–Mar
Networks –7% –3% –8% –11% –9% –9%
Global Services –2% 0% –2% –2% –2% –2%
Support Solutions 0% 5% 0% –10% –12% –11%
Total –4% –1% –5% –7% –6% –6%
SALES GROWTH ADJUSTED FOR COMPARABLE UNITS AND CURRENCY
28 Ericsson | Second Quarter Report 2016
2016 2015
Isolated quarters, SEK million Q2 Q1 Q4 Q3 Q2 Q1
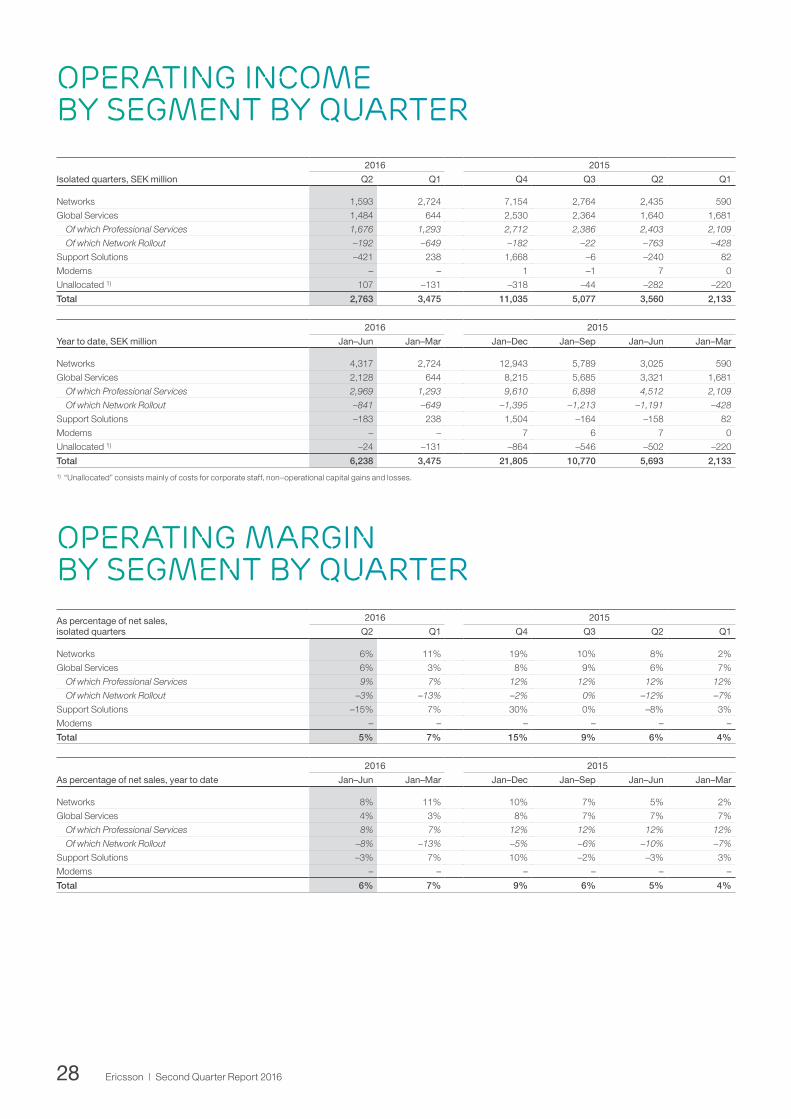
Networks 1,593 2,724 7,154 2,764 2,435 590
Global Services 1,484 644 2,530 2,364 1,640 1,681
Of which Professional Services 1,676 1,293 2,712 2,386 2,403 2,109
Of which Network Rollout –192 –649 –182 –22 –763 –428
Support Solutions –421 238 1,668 –6 –240 82
Modems – – 1 –1 7 0
Unallocated 1) 107 –131 –318 –44 –282 –220
Total 2,763 3,475 11,035 5,077 3,560 2,133
2016 2015
Year to date, SEK million Jan–Jun Jan–Mar Jan–Dec Jan–Sep Jan–Jun Jan–Mar
Networks 4,317 2,724 12,943 5,789 3,025 590
Global Services 2,128 644 8,215 5,685 3,321 1,681
Of which Professional Services 2,969 1,293 9,610 6,898 4,512 2,109
Of which Network Rollout –841 –649 –1,395 –1,213 –1,191 –428
Support Solutions –183 238 1,504 –164 –158 82
Modems – – 7 6 7 0
Unallocated 1) –24 –131 –864 –546 –502 –220
Total 6,238 3,475 21,805 10,770 5,693 2,133
1) “Unallocated” consists mainly of costs for corporate staff, non–operational capital gains and losses.
As percentage of net sales, isolated quarters
2016 2015
Q2 Q1 Q4 Q3 Q2 Q1
Networks 6% 11% 19% 10% 8% 2%
Global Services 6% 3% 8% 9% 6% 7%
Of which Professional Services 9% 7% 12% 12% 12% 12%
Of which Network Rollout –3% –13% –2% 0% –12% –7%
Support Solutions –15% 7% 30% 0% –8% 3%
Modems – – – – – –
Total 5% 7% 15% 9% 6% 4%
2016 2015
As percentage of net sales, year to date Jan–Jun Jan–Mar Jan–Dec Jan–Sep Jan–Jun Jan–Mar
Networks 8% 11% 10% 7% 5% 2%
Global Services 4% 3% 8% 7% 7% 7%
Of which Professional Services 8% 7% 12% 12% 12% 12%
Of which Network Rollout –8% –13% –5% –6% –10% –7%
Support Solutions –3% 7% 10% –2% –3% 3%
Modems – – – – – –
Total 6% 7% 9% 6% 5% 4%
OPERATING INCOME BY SEGMENT BY QUARTER
OPERATING margin BY SEGMENT BY QUARTER

29 Ericsson | Second Quarter Report 2016
2016 2015
Isolated quarters, SEK million Q2 Q1 Q4 Q3 Q2 Q1
Networks 1,784 2,956 7,668 3,233 3,014 1,218
Global Services 1,691 837 2,770 2,604 1,918 1,952
Of which Professional Services 1,849 1,459 2,915 2,605 2,635 2,344
Of which Network Rollout –158 –622 –145 –1 –717 –392
Support Solutions –184 496 1,892 226 –4 308
Modems – – 1 –1 7 0
Unallocated 1) 107 –130 –317 –44 –281 –220
Total 3,398 4,159 12,014 6,018 4,654 3,258
2016 2015
Year to date, SEK million Jan–Jun Jan–Mar Jan–Dec Jan–Sep Jan–Jun Jan–Mar
Networks 4,740 2,956 15,133 7,465 4,232 1,218
Global Services 2,528 837 9,244 6,474 3,870 1,952
Of which Professional Services 3,308 1,459 10,499 7,584 4,979 2,344
Of which Network Rollout –780 –622 –1,255 –1,110 –1,109 –392
Support Solutions 312 496 2,422 530 304 308
Modems – – 7 6 7 0
Unallocated 1) –23 –130 –862 –545 –501 –220
Total 7,557 4,159 25,944 13,930 7,912 3,258
1) “Unallocated” consists mainly of costs for corporate staff, non–operational capital gains and losses.
As percentage of net sales, isolated quarters
2016 2015
Q2 Q1 Q4 Q3 Q2 Q1
Networks 7% 11% 21% 11% 10% 5%
Global Services 7% 4% 9% 10% 7% 8%
Of which Professional Services 10% 8% 13% 13% 13% 13%
Of which Network Rollout –3% –12% –2% 0% –11% –7%
Support Solutions –6% 15% 34% 7% 0% 10%
Modems – – – – – –
Total 6% 8% 16% 10% 8% 6%
As percentage of net sales, year to date
2016 2015
Jan–Jun Jan–Mar Jan–Dec Jan–Sep Jan–Jun Jan–Mar
Networks 9% 11% 12% 9% 7% 5%
Global Services 5% 4% 9% 8% 8% 8%
Of which Professional Services 9% 8% 13% 13% 13% 13%
Of which Network Rollout –7% –12% –5% –6% –9% –7%
Support Solutions 5% 15% 16% 6% 5% 10%
Modems – – – – – –
Total 7% 8% 11% 8% 7% 6%
EBITA BY SEGMENT BY QUARTER
EBITA MARGIN BY SEGMENT BY QUARTER

30 Ericsson | Second Quarter Report 2016
2016 2015
Isolated quarters, SEK million Q2 Q1 Q4 Q3 Q2 Q1
North America 13,426 13,182 17,082 14,355 14,578 12,246
Latin America 4,542 4,040 6,106 5,610 5,067 4,574
Northern Europe & Central Asia 1) 2) 2,093 2,222 2,847 2,520 2,556 2,726
Western & Central Europe 2) 4,466 3,953 5,320 4,540 5,131 4,741
Mediterranean 2) 5,427 4,296 6,971 5,470 5,887 4,982
Middle East 4,921 3,567 6,089 5,728 6,515 4,517
Sub Saharan Africa 2,313 2,120 2,847 2,691 2,653 2,158
India 2,426 2,683 3,172 3,629 3,049 3,531
North East Asia 6,041 5,579 8,916 6,348 6,943 6,030
South East Asia & Oceania 5,272 5,199 5,329 4,750 4,897 4,259
Other 1) 2) 3,181 5,368 8,889 3,520 3,395 3,756
Total 54,108 52,209 73,568 59,161 60,671 53,5201) Of which in Sweden 477 1,113 972 1,135 598 1,0912) Of which in EU 9,635 9,229 12,644 10,584 11,453 10,904
2016 2015
Sequential change, percent Q2 Q1 Q4 Q3 Q2 Q1
North America 2% –23% 19% –2% 19% –6%
Latin America 12% –34% 9% 11% 11% –30%
Northern Europe & Central Asia 1) 2) –6% –22% 13% –1% –6% –33%
Western & Central Europe 2) 13% –26% 17% –12% 8% –22%
Mediterranean 2) 26% –38% 27% –7% 18% –34%
Middle East 38% –41% 6% –12% 44% –34%
Sub Saharan Africa 9% –26% 6% 1% 23% –17%
India –10% –15% –13% 19% –14% 49%
North East Asia 8% –37% 40% –9% 15% –35%
South East Asia & Oceania 1% –2% 12% –3% 15% –14%
Other 1) 2) –41% –40% 153% 4% –10% –19%
Total 4% –29% 24% –2% 13% –21%1) Of which in Sweden –57% 15% –14% 90% –45% 4%2) Of which in EU 4% –27% 19% –8% 5% –24%
2016 2015
Year–over–year change, percent Q2 Q1 Q4 Q3 Q2 Q1
North America –8% 8% 31% 2% –4% 0%
Latin America –10% –12% –7% –5% –6% –3%
Northern Europe & Central Asia 1) 2) –18% –18% –30% –20% –6% 12%
Western & Central Europe 2) –13% –17% –13% –2% 12% 8%
Mediterranean 2) –8% –14% –7% 5% 7% 4%
Middle East –24% –21% –11% –5% 44% 17%
Sub Saharan Africa –13% –2% 9% 10% 41% 19%
India –20% –24% 34% 81% 85% 108%
North East Asia –13% –7% –3% –10% 8% 23%
South East Asia & Oceania 8% 22% 8% 25% 34% 24%
Other 1) 2) –6% 43% 91% 4% 1% 15%
Total –11% –2% 8% 3% 11% 13%1) Of which in Sweden –20% 2% –7% 4% –41% 9%2) Of which in EU –16% –15% –12% –1% 11% 12%
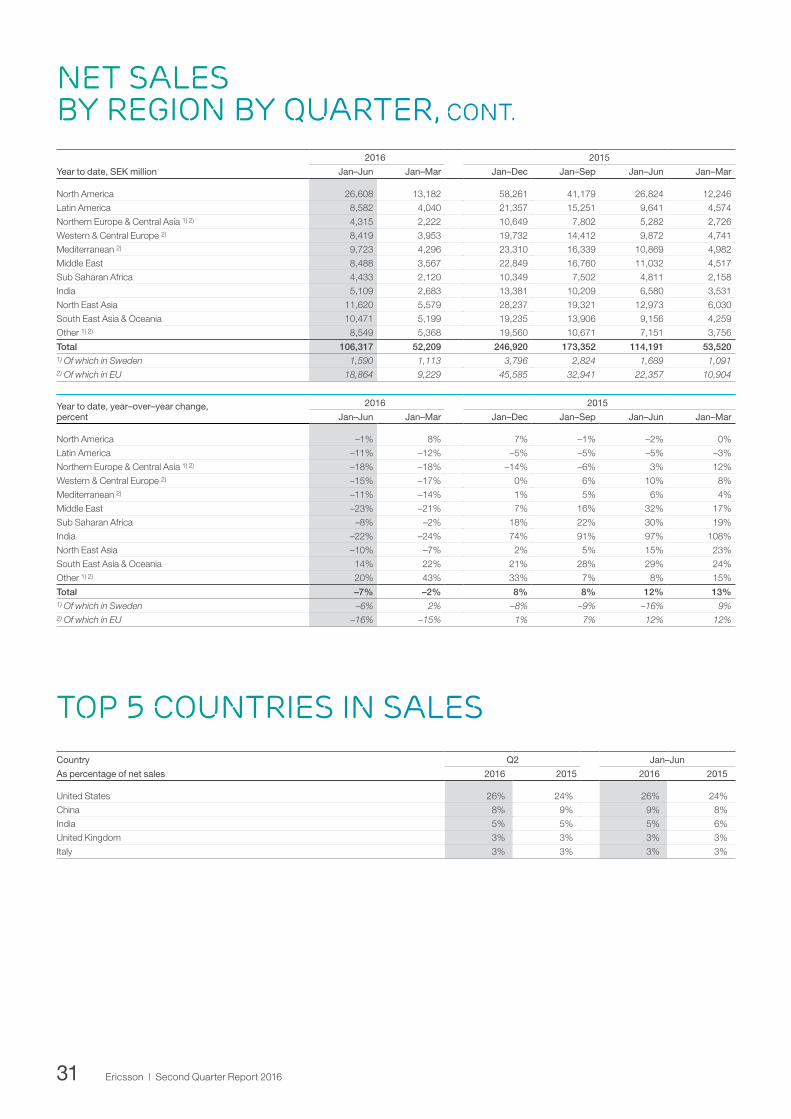
NET SALES BY REGION BY QUARTER
31 Ericsson | Second Quarter Report 2016
2016 2015
Year to date, SEK million Jan–Jun Jan–Mar Jan–Dec Jan–Sep Jan–Jun Jan–Mar
North America 26,608 13,182 58,261 41,179 26,824 12,246
Latin America 8,582 4,040 21,357 15,251 9,641 4,574
Northern Europe & Central Asia 1) 2) 4,315 2,222 10,649 7,802 5,282 2,726
Western & Central Europe 2) 8,419 3,953 19,732 14,412 9,872 4,741
Mediterranean 2) 9,723 4,296 23,310 16,339 10,869 4,982
Middle East 8,488 3,567 22,849 16,760 11,032 4,517
Sub Saharan Africa 4,433 2,120 10,349 7,502 4,811 2,158
India 5,109 2,683 13,381 10,209 6,580 3,531
North East Asia 11,620 5,579 28,237 19,321 12,973 6,030
South East Asia & Oceania 10,471 5,199 19,235 13,906 9,156 4,259
Other 1) 2) 8,549 5,368 19,560 10,671 7,151 3,756
Total 106,317 52,209 246,920 173,352 114,191 53,5201) Of which in Sweden 1,590 1,113 3,796 2,824 1,689 1,0912) Of which in EU 18,864 9,229 45,585 32,941 22,357 10,904
Year to date, year–over–year change, percent
2016 2015
Jan–Jun Jan–Mar Jan–Dec Jan–Sep Jan–Jun Jan–Mar
North America –1% 8% 7% –1% –2% 0%
Latin America –11% –12% –5% –5% –5% –3%
Northern Europe & Central Asia 1) 2) –18% –18% –14% –6% 3% 12%
Western & Central Europe 2) –15% –17% 0% 6% 10% 8%
Mediterranean 2) –11% –14% 1% 5% 6% 4%
Middle East –23% –21% 7% 16% 32% 17%
Sub Saharan Africa –8% –2% 18% 22% 30% 19%
India –22% –24% 74% 91% 97% 108%
North East Asia –10% –7% 2% 5% 15% 23%
South East Asia & Oceania 14% 22% 21% 28% 29% 24%
Other 1) 2) 20% 43% 33% 7% 8% 15%
Total –7% –2% 8% 8% 12% 13%1) Of which in Sweden –6% 2% –8% –9% –16% 9%2) Of which in EU –16% –15% 1% 7% 12% 12%
NET SALES BY REGION BY QUARTER, cont.
TOP 5 COUNTRIES IN SALESCountry Q2 Jan–Jun
As percentage of net sales 2016 2015 2016 2015
United States 26% 24% 26% 24%
China 8% 9% 9% 8%
India 5% 5% 5% 6%
United Kingdom 3% 3% 3% 3%
Italy 3% 3% 3% 3%
32 Ericsson | Second Quarter Report 2016
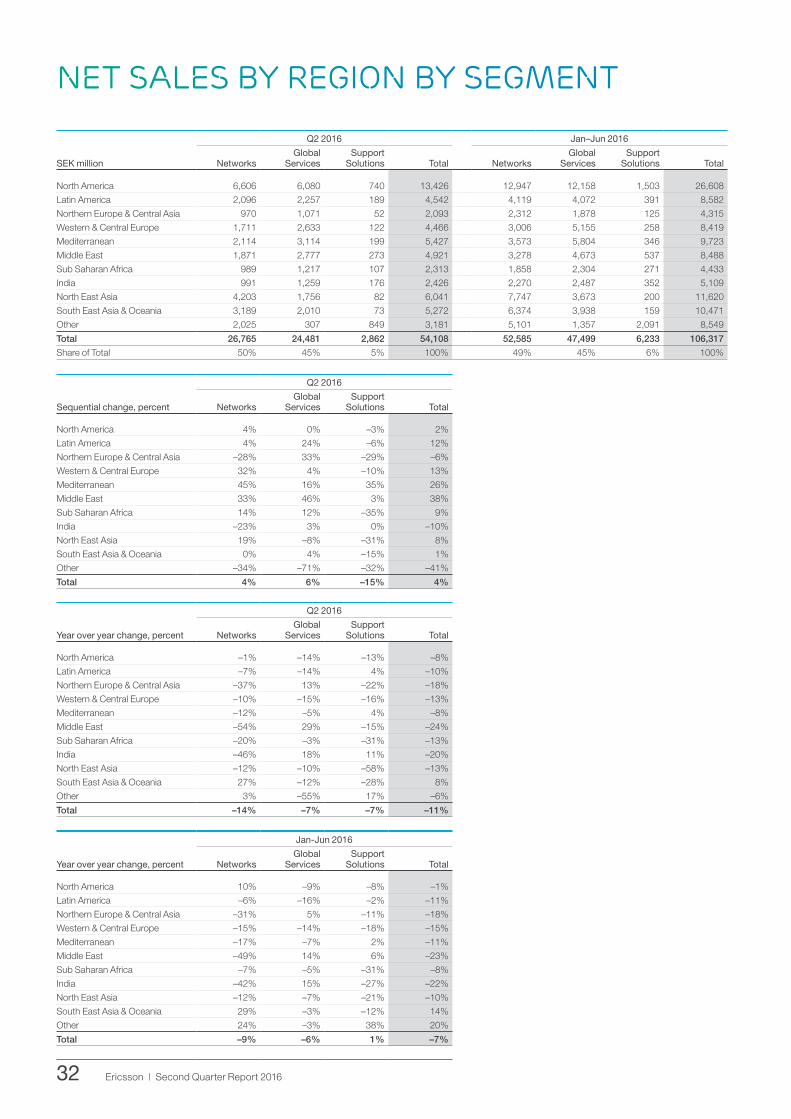
Q2 2016 Jan–Jun 2016
SEK million NetworksGlobal
ServicesSupport
Solutions Total NetworksGlobal
ServicesSupport
Solutions Total
North America 6,606 6,080 740 13,426 12,947 12,158 1,503 26,608
Latin America 2,096 2,257 189 4,542 4,119 4,072 391 8,582
Northern Europe & Central Asia 970 1,071 52 2,093 2,312 1,878 125 4,315
Western & Central Europe 1,711 2,633 122 4,466 3,006 5,155 258 8,419
Mediterranean 2,114 3,114 199 5,427 3,573 5,804 346 9,723
Middle East 1,871 2,777 273 4,921 3,278 4,673 537 8,488
Sub Saharan Africa 989 1,217 107 2,313 1,858 2,304 271 4,433
India 991 1,259 176 2,426 2,270 2,487 352 5,109
North East Asia 4,203 1,756 82 6,041 7,747 3,673 200 11,620
South East Asia & Oceania 3,189 2,010 73 5,272 6,374 3,938 159 10,471
Other 2,025 307 849 3,181 5,101 1,357 2,091 8,549
Total 26,765 24,481 2,862 54,108 52,585 47,499 6,233 106,317
Share of Total 50% 45% 5% 100% 49% 45% 6% 100%
Q2 2016
Sequential change, percent NetworksGlobal
ServicesSupport
Solutions Total
North America 4% 0% –3% 2%
Latin America 4% 24% –6% 12%
Northern Europe & Central Asia –28% 33% –29% –6%
Western & Central Europe 32% 4% –10% 13%
Mediterranean 45% 16% 35% 26%
Middle East 33% 46% 3% 38%
Sub Saharan Africa 14% 12% –35% 9%
India –23% 3% 0% –10%
North East Asia 19% –8% –31% 8%
South East Asia & Oceania 0% 4% –15% 1%
Other –34% –71% –32% –41%
Total 4% 6% –15% 4%
Q2 2016
Year over year change, percent NetworksGlobal
ServicesSupport
Solutions Total
North America –1% –14% –13% –8%
Latin America –7% –14% 4% –10%
Northern Europe & Central Asia –37% 13% –22% –18%
Western & Central Europe –10% –15% –16% –13%
Mediterranean –12% –5% 4% –8%
Middle East –54% 29% –15% –24%
Sub Saharan Africa –20% –3% –31% –13%
India –46% 18% 11% –20%
North East Asia –12% –10% –58% –13%
South East Asia & Oceania 27% –12% –28% 8%
Other 3% –55% 17% –6%
Total –14% –7% –7% –11%
Jan-Jun 2016
Year over year change, percent NetworksGlobal
ServicesSupport
Solutions Total
North America 10% –9% –8% –1%
Latin America –6% –16% –2% –11%
Northern Europe & Central Asia –31% 5% –11% –18%
Western & Central Europe –15% –14% –18% –15%
Mediterranean –17% –7% 2% –11%
Middle East –49% 14% 6% –23%
Sub Saharan Africa –7% –5% –31% –8%
India –42% 15% –27% –22%
North East Asia –12% –7% –21% –10%
South East Asia & Oceania 29% –3% –12% 14%
Other 24% –3% 38% 20%
Total –9% –6% 1% –7%
NET SALES BY REGION BY segment
33 Ericsson | Second Quarter Report 2016
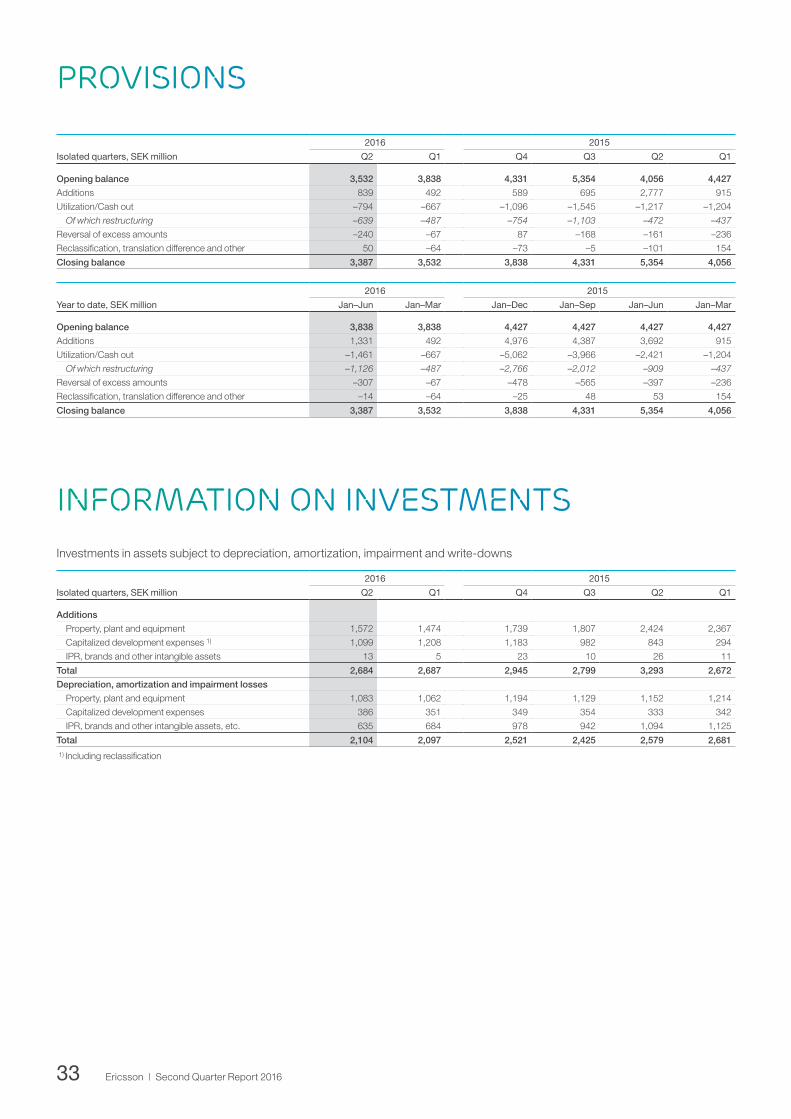
PROVISIONS
Information on INVESTMENTS
2016 2015
Isolated quarters, SEK million Q2 Q1 Q4 Q3 Q2 Q1
Opening balance 3,532 3,838 4,331 5,354 4,056 4,427
Additions 839 492 589 695 2,777 915
Utilization/Cash out –794 –667 –1,096 –1,545 –1,217 –1,204
Of which restructuring –639 –487 –754 –1,103 –472 –437
Reversal of excess amounts –240 –67 87 –168 –161 –236
Reclassification, translation difference and other 50 –64 –73 –5 –101 154
Closing balance 3,387 3,532 3,838 4,331 5,354 4,056
2016 2015
Year to date, SEK million Jan–Jun Jan–Mar Jan–Dec Jan–Sep Jan–Jun Jan–Mar
Opening balance 3,838 3,838 4,427 4,427 4,427 4,427
Additions 1,331 492 4,976 4,387 3,692 915
Utilization/Cash out –1,461 –667 –5,062 –3,966 –2,421 –1,204
Of which restructuring –1,126 –487 –2,766 –2,012 –909 –437
Reversal of excess amounts –307 –67 –478 –565 –397 –236
Reclassification, translation difference and other –14 –64 –25 48 53 154
Closing balance 3,387 3,532 3,838 4,331 5,354 4,056
Investments in assets subject to depreciation, amortization, impairment and write-downs
2016 2015
Isolated quarters, SEK million Q2 Q1 Q4 Q3 Q2 Q1
Additions
Property, plant and equipment 1,572 1,474 1,739 1,807 2,424 2,367
Capitalized development expenses 1) 1,099 1,208 1,183 982 843 294
IPR, brands and other intangible assets 13 5 23 10 26 11
Total 2,684 2,687 2,945 2,799 3,293 2,672
Depreciation, amortization and impairment losses
Property, plant and equipment 1,083 1,062 1,194 1,129 1,152 1,214
Capitalized development expenses 386 351 349 354 333 342
IPR, brands and other intangible assets, etc. 635 684 978 942 1,094 1,125
Total 2,104 2,097 2,521 2,425 2,579 2,681
1) Including reclassification
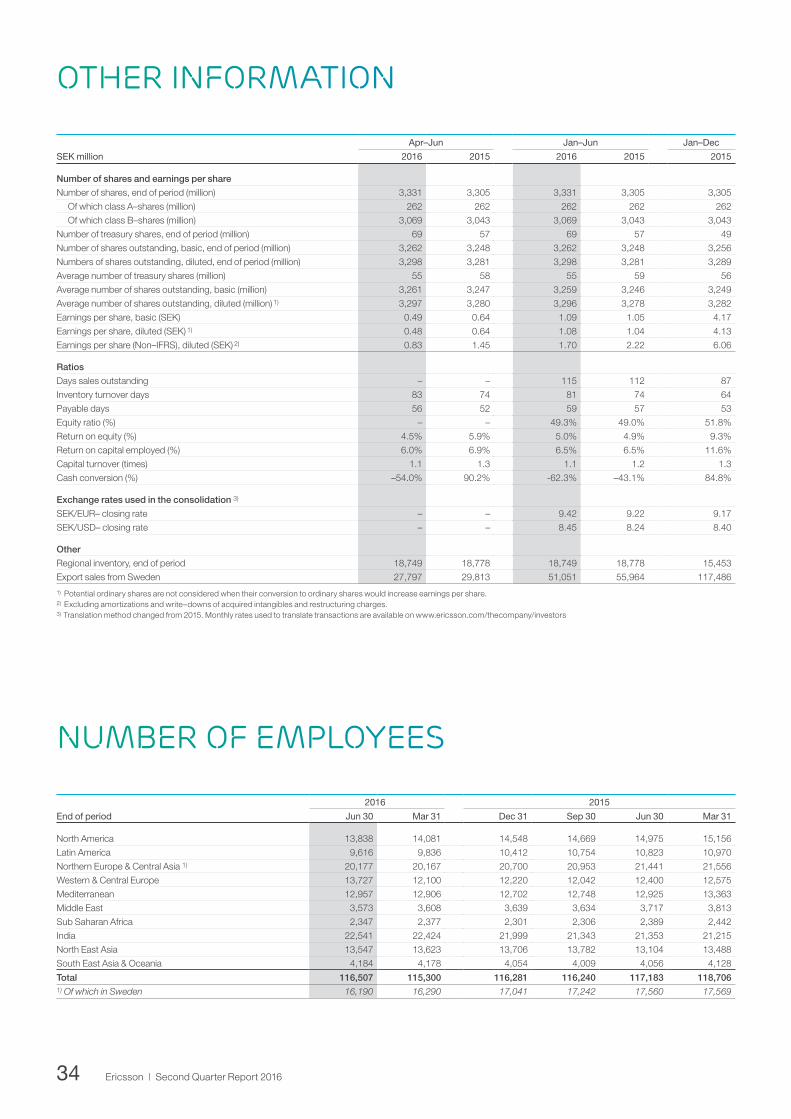
34 Ericsson | Second Quarter Report 2016
OTHER Information
Apr–Jun Jan–Jun Jan–Dec
SEK million 2016 2015 2016 2015 2015
Number of shares and earnings per share
Number of shares, end of period (million) 3,331 3,305 3,331 3,305 3,305
Of which class A–shares (million) 262 262 262 262 262
Of which class B–shares (million) 3,069 3,043 3,069 3,043 3,043
Number of treasury shares, end of period (million) 69 57 69 57 49
Number of shares outstanding, basic, end of period (million) 3,262 3,248 3,262 3,248 3,256
Numbers of shares outstanding, diluted, end of period (million) 3,298 3,281 3,298 3,281 3,289
Average number of treasury shares (million) 55 58 55 59 56
Average number of shares outstanding, basic (million) 3,261 3,247 3,259 3,246 3,249
Average number of shares outstanding, diluted (million) 1) 3,297 3,280 3,296 3,278 3,282
Earnings per share, basic (SEK) 0.49 0.64 1.09 1.05 4.17
Earnings per share, diluted (SEK) 1) 0.48 0.64 1.08 1.04 4.13
Earnings per share (Non–IFRS), diluted (SEK) 2) 0.83 1.45 1.70 2.22 6.06
Ratios
Days sales outstanding – – 115 112 87
Inventory turnover days 83 74 81 74 64
Payable days 56 52 59 57 53
Equity ratio (%) – – 49.3% 49.0% 51.8%
Return on equity (%) 4.5% 5.9% 5.0% 4.9% 9.3%
Return on capital employed (%) 6.0% 6.9% 6.5% 6.5% 11.6%
Capital turnover (times) 1.1 1.3 1.1 1.2 1.3
Cash conversion (%) –54.0% 90.2% -62.3% –43.1% 84.8%
Exchange rates used in the consolidation 3)
SEK/EUR– closing rate – – 9.42 9.22 9.17
SEK/USD– closing rate – – 8.45 8.24 8.40
Other
Regional inventory, end of period 18,749 18,778 18,749 18,778 15,453
Export sales from Sweden 27,797 29,813 51,051 55,964 117,486
1) Potential ordinary shares are not considered when their conversion to ordinary shares would increase earnings per share. 2) Excluding amortizations and write–downs of acquired intangibles and restructuring charges.3) Translation method changed from 2015. Monthly rates used to translate transactions are available on www.ericsson.com/thecompany/investors
2016 2015
End of period Jun 30 Mar 31 Dec 31 Sep 30 Jun 30 Mar 31
North America 13,838 14,081 14,548 14,669 14,975 15,156
Latin America 9,616 9,836 10,412 10,754 10,823 10,970
Northern Europe & Central Asia 1) 20,177 20,167 20,700 20,953 21,441 21,556
Western & Central Europe 13,727 12,100 12,220 12,042 12,400 12,575
Mediterranean 12,957 12,906 12,702 12,748 12,925 13,363
Middle East 3,573 3,608 3,639 3,634 3,717 3,813
Sub Saharan Africa 2,347 2,377 2,301 2,306 2,389 2,442
India 22,541 22,424 21,999 21,343 21,353 21,215
North East Asia 13,547 13,623 13,706 13,782 13,104 13,488
South East Asia & Oceania 4,184 4,178 4,054 4,009 4,056 4,128
Total 116,507 115,300 116,281 116,240 117,183 118,7061) Of which in Sweden 16,190 16,290 17,041 17,242 17,560 17,569
NUMBER OF EMPLOYEES

35 Ericsson | Second Quarter Report 2016
RESTRUCTURING CHARGES BY FUNCTION
RESTRUCTURING CHARGES BY Segment
2016 2015
Isolated quarters, SEK million Q2 Q1 Q4 Q3 Q2 Q1
Cost of sales –461 –328 –282 –351 –1,157 –484
Research and development expenses –422 –257 –305 –547 –1,118 –51
Selling and administrative expenses –138 –47 –117 –80 –469 –79
Total –1,021 –632 –704 –978 –2,744 –614
2016 2015
Year to date, SEK million Jan–Jun Jan–Mar Jan–Dec Jan–Sep Jan–Jun Jan–Mar
Cost of sales –789 –328 –2,274 –1,992 –1,641 –484
Research and development expenses –679 –257 –2,021 –1,716 –1,169 –51
Selling and administrative expenses –185 –47 –745 –628 –548 –79
Total –1,653 –632 –5,040 –4,336 –3,358 –614
2016 2015
Isolated quarters, SEK million Q2 Q1 Q4 Q3 Q2 Q1
Networks –607 –295 –259 –565 –1,842 –173
Global Services –346 –315 –213 –358 –691 –419
Of which Professional Services –273 –237 –60 –316 –175 –140
Of which Network Rollout –73 –78 –153 –42 –516 –279
Support Solutions –68 –22 –230 –37 –194 –19
Modems – – 1 –1 –12 –3
Unallocated – – –3 –17 –5 –
Total –1,021 –632 –704 –978 –2,744 –614
2016 2015
Year to date, SEK million Jan–Jun Jan–Mar Jan–Dec Jan–Sep Jan–Jun Jan–Mar
Networks –902 –295 –2,839 –2,580 –2,015 –173
Global Services –661 –315 –1,681 –1,468 –1,110 –419
Of which Professional Services –510 –237 –691 –631 –315 –140
Of which Network Rollout –151 –78 –990 –837 –795 –279
Support Solutions –90 –22 –480 –250 –213 –19
Modems – – –15 –16 –15 –3
Unallocated – – –25 –22 –5 –
Total –1,653 –632 –5,040 –4,336 –3,358 –614

36 Ericsson | Second Quarter Report 2016
RECONCILIATION TABLEs, NON-IFRS MEASURESThis section includes a reconciliation of certain non-IFRS finan-cial measures to the most directly reconcilable line items in the financial statements. The presentation of non-IFRS financial measures has limitations as analytical tools and should not be considered in isolation or as a substitute for our related financial measures prepared in accordance with IFRS.
Non-IFRS financial measures are presented to enhance an investor’s evaluation of ongoing operating results, to aid in fore-
casting future periods and to facilitate meaningful comparison of results between periods. Management uses these non-IFRS financial measures to, among other things, evaluate ongoing operations in relation to historical results, for internal planning and forecasting purposes and in the calculation of certain per-formance-based compensation.
The non-IFRS financial measures presented in this report may differ from similarly-titled measures used by other companies.
SALES GROWTH ADJUSTED FOR COMPARABLE UNITS ANd CURRENCYSales growth adjusted for the impact of acquisitions and divestments as well as the effects of foreign currency fluctuations.
2016 2015
Isolated quarter, sequential change Q2 Q1 Q4 Q3 Q2 Q1
Reported net sales 54,108 52,209 73,568 59,161 60,671 53,520
Acquired/divested business –35 0 0 0 0 –422
Net FX impact 1,221 766 1,153 335 –608 –3,812
Comparable net sales, excluding FX impact 55,294 52,975 74,721 59,496 60,063 49,286
Sales growth adjusted for comparable units and currency (%) 6% –28% 26% –2% 12% –28%
2016 2015
Isolated quarter, year over year change Q2 Q1 Q4 Q3 Q2 Q1
Reported net sales 54,108 52,209 73,568 59,161 60,671 53,520
Acquired/divested business –95 –73 0 0 0 –422
Net FX impact 2,329 655 –6,005 –6,683 –9,143 –8,475
Comparable net sales, excluding FX impact 56,342 52,791 67,563 52,478 51,528 44,623
Sales growth adjusted for comparable units and currency (%) –7% –1% –1% –9% –6% –6%
2016 2015
Year to date, year over year change Jan–Jun Jan–Mar Jan–Dec Jan–Sep Jan–Jun Jan–Mar
Reported net sales 106,317 52,209 246,920 173,352 114,191 53,520
Acquired/divested business –168 –73 –422 –422 –422 –422
Net FX impact 2,983 655 –30,307 –24,301 –17,618 –8,475
Comparable net sales, excluding FX impact 109,132 52,791 216,191 148,629 96,151 44,623
Sales growth adjusted for comparable units and currency (%) –4% –1% –5% –7% –6% –6%
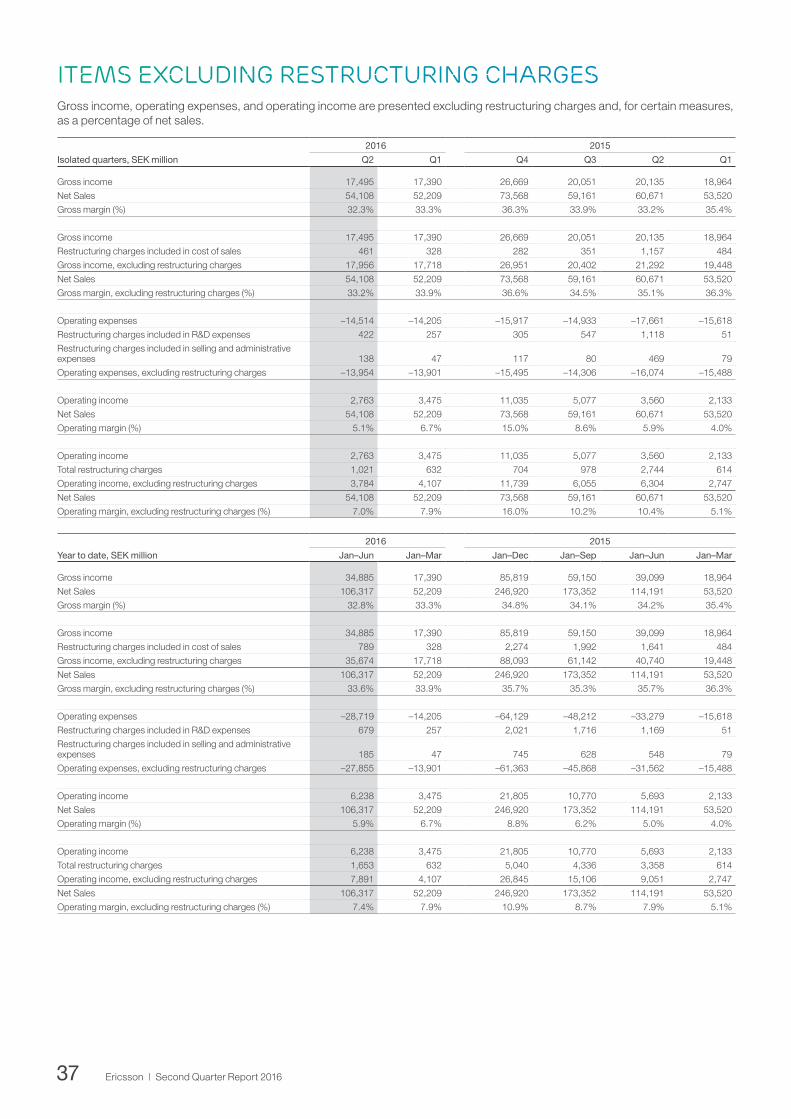
37 Ericsson | Second Quarter Report 2016
Items excluding restructuring chargesGross income, operating expenses, and operating income are presented excluding restructuring charges and, for certain measures, as a percentage of net sales.
2016 2015
Isolated quarters, SEK million Q2 Q1 Q4 Q3 Q2 Q1
Gross income 17,495 17,390 26,669 20,051 20,135 18,964
Net Sales 54,108 52,209 73,568 59,161 60,671 53,520
Gross margin (%) 32.3% 33.3% 36.3% 33.9% 33.2% 35.4%
Gross income 17,495 17,390 26,669 20,051 20,135 18,964
Restructuring charges included in cost of sales 461 328 282 351 1,157 484
Gross income, excluding restructuring charges 17,956 17,718 26,951 20,402 21,292 19,448
Net Sales 54,108 52,209 73,568 59,161 60,671 53,520
Gross margin, excluding restructuring charges (%) 33.2% 33.9% 36.6% 34.5% 35.1% 36.3%
Operating expenses –14,514 –14,205 –15,917 –14,933 –17,661 –15,618
Restructuring charges included in R&D expenses 422 257 305 547 1,118 51
Restructuring charges included in selling and administrative expenses 138 47 117 80 469 79
Operating expenses, excluding restructuring charges –13,954 –13,901 –15,495 –14,306 –16,074 –15,488
Operating income 2,763 3,475 11,035 5,077 3,560 2,133
Net Sales 54,108 52,209 73,568 59,161 60,671 53,520
Operating margin (%) 5.1% 6.7% 15.0% 8.6% 5.9% 4.0%
Operating income 2,763 3,475 11,035 5,077 3,560 2,133
Total restructuring charges 1,021 632 704 978 2,744 614
Operating income, excluding restructuring charges 3,784 4,107 11,739 6,055 6,304 2,747
Net Sales 54,108 52,209 73,568 59,161 60,671 53,520
Operating margin, excluding restructuring charges (%) 7.0% 7.9% 16.0% 10.2% 10.4% 5.1%
2016 2015
Year to date, SEK million Jan–Jun Jan–Mar Jan–Dec Jan–Sep Jan–Jun Jan–Mar
Gross income 34,885 17,390 85,819 59,150 39,099 18,964
Net Sales 106,317 52,209 246,920 173,352 114,191 53,520
Gross margin (%) 32.8% 33.3% 34.8% 34.1% 34.2% 35.4%
Gross income 34,885 17,390 85,819 59,150 39,099 18,964
Restructuring charges included in cost of sales 789 328 2,274 1,992 1,641 484
Gross income, excluding restructuring charges 35,674 17,718 88,093 61,142 40,740 19,448
Net Sales 106,317 52,209 246,920 173,352 114,191 53,520
Gross margin, excluding restructuring charges (%) 33.6% 33.9% 35.7% 35.3% 35.7% 36.3%
Operating expenses –28,719 –14,205 –64,129 –48,212 –33,279 –15,618
Restructuring charges included in R&D expenses 679 257 2,021 1,716 1,169 51
Restructuring charges included in selling and administrative expenses 185 47 745 628 548 79
Operating expenses, excluding restructuring charges –27,855 –13,901 –61,363 –45,868 –31,562 –15,488
Operating income 6,238 3,475 21,805 10,770 5,693 2,133
Net Sales 106,317 52,209 246,920 173,352 114,191 53,520
Operating margin (%) 5.9% 6.7% 8.8% 6.2% 5.0% 4.0%
Operating income 6,238 3,475 21,805 10,770 5,693 2,133
Total restructuring charges 1,653 632 5,040 4,336 3,358 614
Operating income, excluding restructuring charges 7,891 4,107 26,845 15,106 9,051 2,747
Net Sales 106,317 52,209 246,920 173,352 114,191 53,520
Operating margin, excluding restructuring charges (%) 7.4% 7.9% 10.9% 8.7% 7.9% 5.1%

38 Ericsson | Second Quarter Report 2016
EBITA AND EBITA MARGINEarnings before interest, taxes, amortization and write-downs of acquired intangibles, also expressed as a percentage of net sales.
2016 2015
Isolated quarters, SEK million Q2 Q1 Q4 Q3 Q2 Q1
Net Income 1,566 2,106 6,978 3,118 2,123 1,454
Taxes 670 903 3,329 1,338 909 623
Financial income and expenses 527 466 728 621 528 56
Amortization and write-downs of acquired intangibles 635 684 979 941 1,094 1,125
EBITA 3,398 4,159 12,014 6,018 4,654 3,258
Net Sales 54,108 52,209 73,568 59,161 60,671 53,520
EBITA margin (%) 6% 8% 16% 10% 8% 6%
2016 2015
Year to date, SEK million Jan–Jun Jan–Mar Jan–Dec Jan–Sep Jan–Jun Jan–Mar
Net Income 3,672 2,106 13,673 6,695 3,577 1,454
Taxes 1,573 903 6,199 2,870 1,532 623
Financial income and expenses 993 466 1,933 1,205 584 56
Amortization and write-downs of acquired intangibles 1,319 684 4,139 3,160 2,219 1,125
EBITA 7,557 4,159 25,944 13,930 7,912 3,258
Net Sales 106,317 52,209 246,920 173,352 114,191 53,520
EBITA margin (%) 7% 8% 11% 8% 7% 6%
Cash conversion (%)Cash flow from operating activities divided by the sum of net income and adjustments to reconcile net income to cash, expressed as percent.
2016 2015
Isolated quarters, SEK million Q2 Q1 Q4 Q3 Q2 Q1
Net income 1,566 2,106 6,978 3,118 2,123 1,454
Net income reconciled to cash 1,321 3,631 10,953 6,782 3,413 3,136
Cash flow from operating activities –713 –2,372 21,859 1,560 3,078 –5,900
Cash conversion (%) –54.0% –65.3% 199.6% 23.0% 90.2% –188.1%
2016 2015
Year to date, SEK million Jan–Jun Jan–Mar Jan–Dec Jan–Sep Jan–Jun Jan–Mar
Net income 3,672 2,106 13,673 6,695 3,577 1,454
Net income reconciled to cash 4,952 3,631 24,284 13,331 6,549 3,136
Cash flow from operating activities –3,085 –2,372 20,597 –1,262 –2,822 –5,900
Cash conversion (%) –62.3% –65.3% 84.8% –9.5% –43.1% –188.1%
Net cash, end of periodNet cash: Cash and cash equivalents plus short-term investments less interest-bearing liabilities (which include: non-current borrow-ings and current borrowings).
2016 2015
SEK million Q2 Q1 Q4 Q3 Q2 Q1
Cash and cash equivalents 28,931 35,934 40,224 33,950 32,962 35,311
+ Short term investments 19,846 25,077 26,046 17,597 20,807 30,776
– Borrowings, non–current 18,164 22,110 22,744 22,900 22,551 23,496
– Borrowings, current 9,653 2,414 2,376 2,885 3,199 2,847
Net cash, end of period 20,960 36,487 41,150 25,762 28,019 39,744

39 Ericsson | Second Quarter Report 2016
Capital employedTotal assets less non-interest-bearing provisions and liabilities.
2016 2015
SEK million Q2 Q1 Q4 Q3 Q2 Q1
Total assets 277,387 280,325 284,363 278,378 278,916 302,967
Non-interest-bearing provisions and liabilities
Provisions, non-current 245 158 176 35 139 198
Deferred tax liabilities 2,036 2,098 2,472 2,208 3,010 3,156
Other non-current liabilities 2,030 1,834 1,851 1,802 1,939 1,815
Provisions, current 3,142 3,374 3,662 4,296 5,215 3,858
Trade payables 23,709 21,549 22,389 21,734 22,147 24,266
Other current liabilities 54,394 55,429 58,663 58,523 59,461 70,117
Capital employed 191,831 195,883 195,150 189,780 187,005 199,557
Capital turnover (times)Annualized net sales divided by average capital employed.
2016 2015
Isolated quarters, SEK million Q2 Q1 Q4 Q3 Q2 Q1
Net sales 54,108 52,209 73,568 59,161 60,671 53,520
Annualized net sales 216,432 208,836 294,272 236,644 242,684 214,080
Average capital employed
Capital employed at beginning of period 195,883 195,150 189,780 187,005 199,557 189,839
Capital employed at end of period 191,831 195,883 195,150 189,780 187,005 199,557
Average capital employed 193,857 195,517 192,465 188,393 193,281 194,698
Capital turnover (times) 1.1 1.1 1.5 1.3 1.3 1.1
2016 2015
Year to date, SEK million Jan–Jun Jan–Mar Jan–Dec Jan–Sep Jan–Jun Jan–Mar
Net sales 106,317 52,209 246,920 173,352 114,191 53,520
Annualized net sales 212,634 208,836 246,920 231,136 228,382 214,080
Average capital employed
Capital employed at beginning of period 195,150 195,150 189,839 189,839 189,839 189,839
Capital employed at end of period 191,831 195,883 195,150 189,780 187,005 199,557
Average capital employed 193,491 195,517 192,495 189,810 188,422 194,698
Capital turnover (times) 1.1 1.1 1.3 1.2 1.2 1.1
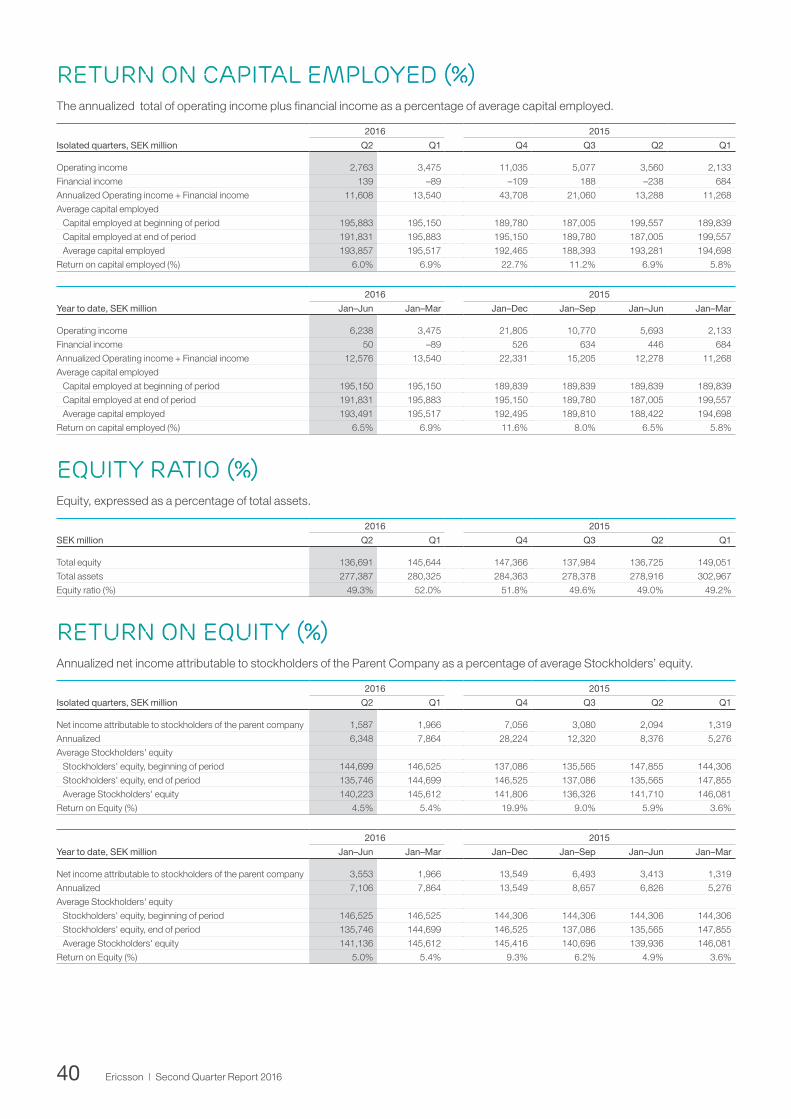
40 Ericsson | Second Quarter Report 2016
Return on capital employed (%)The annualized total of operating income plus financial income as a percentage of average capital employed.
2016 2015
Isolated quarters, SEK million Q2 Q1 Q4 Q3 Q2 Q1
Operating income 2,763 3,475 11,035 5,077 3,560 2,133
Financial income 139 –89 –109 188 –238 684
Annualized Operating income + Financial income 11,608 13,540 43,708 21,060 13,288 11,268
Average capital employed
Capital employed at beginning of period 195,883 195,150 189,780 187,005 199,557 189,839
Capital employed at end of period 191,831 195,883 195,150 189,780 187,005 199,557
Average capital employed 193,857 195,517 192,465 188,393 193,281 194,698
Return on capital employed (%) 6.0% 6.9% 22.7% 11.2% 6.9% 5.8%
2016 2015
Year to date, SEK million Jan–Jun Jan–Mar Jan–Dec Jan–Sep Jan–Jun Jan–Mar
Operating income 6,238 3,475 21,805 10,770 5,693 2,133
Financial income 50 –89 526 634 446 684
Annualized Operating income + Financial income 12,576 13,540 22,331 15,205 12,278 11,268
Average capital employed
Capital employed at beginning of period 195,150 195,150 189,839 189,839 189,839 189,839
Capital employed at end of period 191,831 195,883 195,150 189,780 187,005 199,557
Average capital employed 193,491 195,517 192,495 189,810 188,422 194,698
Return on capital employed (%) 6.5% 6.9% 11.6% 8.0% 6.5% 5.8%
Equity ratio (%)Equity, expressed as a percentage of total assets.
2016 2015
SEK million Q2 Q1 Q4 Q3 Q2 Q1
Total equity 136,691 145,644 147,366 137,984 136,725 149,051
Total assets 277,387 280,325 284,363 278,378 278,916 302,967
Equity ratio (%) 49.3% 52.0% 51.8% 49.6% 49.0% 49.2%
Return on equity (%)Annualized net income attributable to stockholders of the Parent Company as a percentage of average Stockholders’ equity.
2016 2015
Isolated quarters, SEK million Q2 Q1 Q4 Q3 Q2 Q1
Net income attributable to stockholders of the parent company 1,587 1,966 7,056 3,080 2,094 1,319
Annualized 6,348 7,864 28,224 12,320 8,376 5,276
Average Stockholders' equity
Stockholders' equity, beginning of period 144,699 146,525 137,086 135,565 147,855 144,306
Stockholders' equity, end of period 135,746 144,699 146,525 137,086 135,565 147,855
Average Stockholders' equity 140,223 145,612 141,806 136,326 141,710 146,081
Return on Equity (%) 4.5% 5.4% 19.9% 9.0% 5.9% 3.6%
2016 2015
Year to date, SEK million Jan–Jun Jan–Mar Jan–Dec Jan–Sep Jan–Jun Jan–Mar
Net income attributable to stockholders of the parent company 3,553 1,966 13,549 6,493 3,413 1,319
Annualized 7,106 7,864 13,549 8,657 6,826 5,276
Average Stockholders' equity
Stockholders' equity, beginning of period 146,525 146,525 144,306 144,306 144,306 144,306
Stockholders' equity, end of period 135,746 144,699 146,525 137,086 135,565 147,855
Average Stockholders' equity 141,136 145,612 145,416 140,696 139,936 146,081
Return on Equity (%) 5.0% 5.4% 9.3% 6.2% 4.9% 3.6%

41 Ericsson | Second Quarter Report 2016
EPS (Non-ifrs), sekEPS, diluted, excluding amortizations and write-down of acquired intangible assets and excluding restructuring charges.
2016 2015
Isolated quarters Q2 Q1 Q4 Q3 Q2 Q1
EPS diluted, SEK 0.48 0.60 2.15 0.94 0.64 0.40
Restructuring charges 0.22 0.13 0.15 0.21 0.58 0.13
Amortization and write-downs of acquired intangibles 0.13 0.14 0.20 0.20 0.23 0.23
EPS (Non-IFRS) diluted, SEK 0.83 0.87 2.50 1.35 1.45 0.76
2016 2015
Year to date Jan–Jun Jan–Mar Jan–Dec Jan–Sep Jan–Jun Jan–Mar
EPS diluted, SEK 1.08 0.60 4.13 1.98 1.04 0.40
Restructuring charges 0.35 0.13 1.07 0.92 0.71 0.13
Amortization and write-downs of acquired intangibles 0.27 0.14 0.86 0.66 0.46 0.23
EPS (Non-IFRS) diluted, SEK 1.70 0.87 6.06 3.56 2.21 0.76
Related Documents