SECOND QUARTER 2021 MARKET OUTLOOK Prepared by Damian Howard April 1, 2021 Investment and Insurance Products are: Not FDIC Insured * Not a Bank Deposit * Not Bank Guaranteed * May Lose Value * Not Insured by Any Federal Government Agency Our Outlook 2019 2020 2021 Est 2022 Est 2023 Est GDP Growth (1) 2.3% -2.4% 6.9% 3.6% 1.9% Change in Consumer Prices (2) 2.3% 1.3% 2.5% 2.4% 2.4% Fed Funds Target Rate (3) 1.75% 0.25% 0.25% 0.25% 0.50% 5-Year Treasury Yield (3) 1.69% 0.36% 0.98% 1.08% 1.46% 10-Year Treasury Yield (3) 1.92% 0.92% 1.80% 2.00% 2.50% S&P 500 EPS $162 $138 $177 $196 $216 (1) 4 th quarter/4 th quarter (2) December / December (3) Yearend rates Last Month’s Rates and Returns March 31, 2021 Value One Month Change YTD 1 Year Change Fed Funds Target (Upper) 0.25% -- -- -- 2-Year Treasury Yield 0.16% +2 bp +4 bp -4 bp 5-Year Treasury Yield 0.94% +16 bp +58 bp +57 bp 10-Year Treasury Yield 1.74% +28 bp +84 bp +106 bp SNL 30Yr Fixed – U.S. Avg. 3.21% +16 bp +20 bp -45 bp S&P 500 Index* 3,973 4.38% 6.17% 56.35% S&P Midcap 400* 2,609 4.67% 13.47% 83.46% S&P Small Cap 600* 1,319 3.33% 18.24% 95.33% S&P SuperComposite 1500* 916 4.37% 6.91% 58.73% S&P 500 Growth* 2,627 2.64% 2.12% 59.43% S&P 500 Value* 1,396 6.26% 10.77% 50.37% Developed Ex U.S., net ** 7,157 2.30% 3.48% 44.57% Emerging Markets, net ** 638 -1.51% 2.29% 58.39% All Country World, net ** 343 2.67% 4.57% 54.60% Liquid Alternatives *** 180 0.95% 2.15% 15.18% BB U.S. Aggregate * 105 -1.25% -3.37% 0.71% Crude Oil – WTI Near Term $59 -3.80% 21.93% 188.87% Gold – Near Term $1,712 -083% -9.47% 8.24% * = Total return **= MSCI EAFA, EM, & ACWI **** = Wilshire Liquid Alternative Index

Welcome message from author
This document is posted to help you gain knowledge. Please leave a comment to let me know what you think about it! Share it to your friends and learn new things together.
Transcript

SECOND QUARTER 2021 MARKET OUTLOOK
Prepared by Damian Howard April 1, 2021 Investment and Insurance Products are: Not FDIC Insured * Not a Bank Deposit * Not Bank Guaranteed * May Lose Value * Not Insured by Any Federal Government Agency
Our Outlook
2019 2020 2021 Est 2022 Est 2023 Est GDP Growth (1) 2.3% -2.4% 6.9% 3.6% 1.9% Change in Consumer Prices (2) 2.3% 1.3% 2.5% 2.4% 2.4% Fed Funds Target Rate (3) 1.75% 0.25% 0.25% 0.25% 0.50% 5-Year Treasury Yield (3) 1.69% 0.36% 0.98% 1.08% 1.46% 10-Year Treasury Yield (3) 1.92% 0.92% 1.80% 2.00% 2.50% S&P 500 EPS $162 $138 $177 $196 $216 (1) 4th quarter/4th quarter (2) December / December (3) Yearend rates
Last Month’s Rates and Returns
March 31, 2021 Value One Month
Change YTD 1 Year Change
Fed Funds Target (Upper) 0.25% -- -- -- 2-Year Treasury Yield 0.16% +2 bp +4 bp -4 bp 5-Year Treasury Yield 0.94% +16 bp +58 bp +57 bp 10-Year Treasury Yield 1.74% +28 bp +84 bp +106 bp SNL 30Yr Fixed – U.S. Avg. 3.21% +16 bp +20 bp -45 bp S&P 500 Index* 3,973 4.38% 6.17% 56.35% S&P Midcap 400* 2,609 4.67% 13.47% 83.46% S&P Small Cap 600* 1,319 3.33% 18.24% 95.33% S&P SuperComposite 1500* 916 4.37% 6.91% 58.73%
S&P 500 Growth* 2,627 2.64% 2.12% 59.43% S&P 500 Value* 1,396 6.26% 10.77% 50.37%
Developed Ex U.S., net ** 7,157 2.30% 3.48% 44.57% Emerging Markets, net ** 638 -1.51% 2.29% 58.39% All Country World, net ** 343 2.67% 4.57% 54.60% Liquid Alternatives *** 180 0.95% 2.15% 15.18% BB U.S. Aggregate * 105 -1.25% -3.37% 0.71%
Crude Oil – WTI Near Term $59 -3.80% 21.93% 188.87% Gold – Near Term $1,712 -083% -9.47% 8.24%
* = Total return **= MSCI EAFA, EM, & ACWI **** = Wilshire Liquid Alternative Index

SECOND QUARTER 2021 MARKET OUTLOOK
Prepared by Damian Howard April 1, 2021 Investment and Insurance Products are: Not FDIC Insured * Not a Bank Deposit * Not Bank Guaranteed * May Lose Value * Not Insured by Any Federal Government Agency
Security National Bank’s Wealth Management Department authors a monthly economic forecast that provides our investment committee and the bank’s funds management committee with background assumptions for use in investment decisions. We are pleased to share our economic outlook with you. Please be advised our crystal ball is just as clouded as other prognosticators and that all forecasters have poor track records. The First Quarter During the first quarter, stocks, as measured by the S&P 500 Index, gained 6.17%. Please see the chart below. Over the last 30 years, despite a pandemic, a financial crisis, and the terror attacks of 9/11, the S&P 500 has provided fantastic returns. When we do our planning, we incorporate much more muted returns over the next five years, primarily due to today’s high valuations.
Returns for the S&P 500 over Various Periods 1 Month YTD 1 Year 3 Year 5 Year 7 Year 10 Year 15 Year 20 Year 30 Year 4.38% 6.17% 56.35% 16.78% 16.29% 13.59% 13.91% 10.02% 8.64% 10.41%
Total returns ending March 31, 2021 Returns for the S&P 500 over Various Periods Year-to-date, the stocks of pro-cyclical companies outperformed last year’s winners. Market participants rotated out of pandemic stocks and into reopening stocks. The S&P Value Index returned 10.77% versus the 2.12% returned by the Growth Index. Energy was the best performing sector, returning 30.85% as oil prices recovered. Financial Services was the second-best performing sector, returning 15.99%. Consumer Staples and Technology were the two worst performing sectors returning 1.15% and 1.97%, respectively. For the first quarter, the yield on the 10-year U.S. Treasury rose 0.84%. The value of fixed income instruments generally falls as interest rates rise. The Bloomberg Barclays U.S. Aggregate Index had a price return of -4.28% and -3.37% after counting interest income. We expect fixed income to be break-even over the next five years. Free Money It turns out free money makes people feel better! On March 30, the Conference Board reported that consumer confidence soared in March. The index jumped from 90.4 in February to 109.7 in March. The 19.3-point jump was the largest since April 2003, when America was celebrating a quick victory over the forces of Saddam Hussein in Iraq. A fresh check from the Treasury and significant progress on the vaccination front have brightened the consumer’s outlook. She not only feels good about what the economy will look like in six months but also what it looks like today. Increased confidence and plenty of savings will lead to a surge in economic activity for the next six months.
4/19 7/19 10/19 1/20 4/20 7/20 10/20 1/21 4/21
9090
100100
110110
120120
130130
©FactSet Research Systems
US Consumer Confidence

SECOND QUARTER 2021 MARKET OUTLOOK
Prepared by Damian Howard April 1, 2021 Investment and Insurance Products are: Not FDIC Insured * Not a Bank Deposit * Not Bank Guaranteed * May Lose Value * Not Insured by Any Federal Government Agency
After growing at a 4.5% pace during the first quarter, the economy should grow at a blistering 8.5% pace for the next two quarters before gradually ramping down over the subsequent year. We expect the economy to grow at a 6.9% pace for the full year. A tsunami of cash is waiting to be spent. A lot of which will be spent before year-end. There remains considerable slack in the economy. The labor participation rate is a full 2% below its pre-pandemic level. Manufacturing capacity utilization rates are 2.8% below pre-pandemic levels. The supply constraints that are putting pressure on profit margins will lessen as global supply chains return to normal. Please remember, the U.S. is one of the leaders in vaccinating its population. It will take up to a year for the rest of the world to catch up. Inflation will likely spike until midyear as Covid-19 related price distortions show up in statistics. Policymakers remain convinced the impending inflation spike will be a temporary phenomenon. We agree with that assessment. By year-end, rapid economic growth will absorb most of the slack in the economy. At this point, inflation could be an issue. We contend the global forces that kept inflation well controlled for two decades (an aging population, the digital revolution, emerging economies, automation, among others) will continue keeping inflation under control. Currently, we do not think inflation will rise too much above two percent, but continued debt-funded spending has increased the risk of higher inflation. It is not in our base case, but the odds of higher inflation have risen. We continue to watch closely for signs of persistent inflation. Interest rates are likely to rise but can only rise so far. The red line in the chart is the projected deficit in January 2019, prior to the pandemic. The difference between the two is attributed to the pandemic. We estimate that the federal government will spend an additional $6.4 trillion thru 2023 in response to the virus outbreak. The federal debt is expected to rise from $16 trillion to $28 trillion by 2023. The higher debt burden increases the economy’s sensitivity to interest rates. A 1% increase in the average interest rate would consume an additional 7% of projected federal government revenue, almost doubling interest expenditures. It will not require a substantial increase in interest rates to cool the economy rapidly. Once the economy gets past the vaccine and stimulus-fueled high growth phase, economic growth will likely return to the plow-horse economy we experienced during President Obama’s second term. Increased regulation and income distribution policies will add additional impediments to growth. Slow growth with pockets of rapid technological innovation will again be the norm. We strive to invest in those pockets. The

SECOND QUARTER 2021 MARKET OUTLOOK
Prepared by Damian Howard April 1, 2021 Investment and Insurance Products are: Not FDIC Insured * Not a Bank Deposit * Not Bank Guaranteed * May Lose Value * Not Insured by Any Federal Government Agency
long-term trends of digitalization, decarbonization, and advances in healthcare will reassert themselves. Innovators will continue to exceed earnings expectations and capture the laurels. We chose to avoid companies with no earnings but high growth expectations. The stock prices of these companies are more susceptible to rising interest rates. While our portfolios may underperform during this hyper-growth period, they should outperform longer term. Stocks prices follow earnings over the cycle. Berkshire Annual Meeting The Berkshire Annual Meeting will once again be virtual. The exclusive Berkshire shareholder pricing at NFM stores will take place April 21 - May 4. Look for more information and register online at www.nfm.com/berkshire. Your Security National Bank Wealth Management statement showing your Berkshire holding should be sufficient. A shareholder badge is not required. Please see the obligatory disclosures at the bottom of each page and the end of this report.

SECOND QUARTER 2021 MARKET OUTLOOK
Prepared by Damian Howard April 1, 2021 Investment and Insurance Products are: Not FDIC Insured * Not a Bank Deposit * Not Bank Guaranteed * May Lose Value * Not Insured by Any Federal Government Agency
Since 1977, the Federal Reserve has operated under a mandate from Congress to “promote effectively the goals of maximum employment, stable prices, and moderate long-term interest rates” – what is now commonly referred to as the Fed’s dual mandate. For this reason, we always start our economic review with employment followed by inflation. We then review other factors that drive our economic outlook. Employment While the labor markets have healed significantly over the last 12 months, there remains significant progress yet to be made. More than 11.4 million persons remain out of work or face reduced hours due to the pandemic. The Federal Reserve Board (FRB) wants the labor market to return to pre-pandemic levels and underrepresented minorities to fully participate in labor market advances. We expect labor markets will run hot for a while before the FRB moves to increase interest rates. March job growth was significantly better than expected as the economy added 916,000 jobs versus the consensus estimates of 617,500 new jobs added. The U.S. Bureau of Labor Statistics (BLS) revised the prior two months’ jobs number up 156,000. The unemployment rate fell to 6.0%. The participation rate rose to 61.5%, and the employment-to-population ratio rose to 57.8%. Overall, job growth was broad-based, with nearly every major industry reporting gains. During the month, the manufacturing sector added 53,000 jobs or 0.4%. Manufacturing is still down 4% from pre-pandemic levels. Construction added 110,000 (1.5%) jobs as the weather improved. Construction is down 2.4% from pre-pandemic levels. Restaurants and bars added 175,800 positions (1.7%) but remain down 14.7% from pre-pandemic levels. Hotels added 40,100 (2.8%) but remain down 29.5% from pre-pandemic levels. Private, state and local education added 190,000 jobs (1.5%) but remains down 8.1% from pre-pandemic levels. State and local governments added 3,600 (0.0%) non-education positions last month but remains down 4% from pre-pandemic levels. In total, the number of employed persons grew 0.6% in March but remains down 5.5% from pre-pandemic levels. The BLS reports statistics from two monthly surveys. The household survey measures labor force status, including unemployment, by demographic characteristics. The establishment survey measures nonfarm employment, hours, and earnings by industry. There can be some differences in the numbers. The household survey puts the change in employment at 609,000 while the establishment puts the change in employment at 916,000. Both show strong job growth. The unemployment rate fell to 6.0% from 6.2% the previous month. The number of officially unemployed persons fell by 262,000 to 9.7 million. This is down from the 23.1 million reported in April 2020 but up 4.2 million from the number reported in February 2020. The broader U-6 unemployment rate fell to 10.7% from 11.1 the previous month, down considerably from the 22.8% reported in April 2020. The U-6 rate was 7.0% in February 2020. Among the unemployed, the number of persons on temporary layoff decreased by 203,000 to 2.0 million. At its peak, the number of persons on temporary layoff hit 18.0 million. The number of long-term unemployed (those jobless for 27 weeks or more) rose slightly to 4.2 million. The participation rate rose to 61.5%. The participation rate was 62.7% in February 2020. The employment to population ratio also rose to 57.8%. This number was 61.1% in February 2020. If the employment to population ratio were to return to the February 2020 level, an additional 8.6 million jobs would be added.
SECOND QUARTER 2021 MARKET OUTLOOK
Prepared by Damian Howard April 1, 2021 Investment and Insurance Products are: Not FDIC Insured * Not a Bank Deposit * Not Bank Guaranteed * May Lose Value * Not Insured by Any Federal Government Agency
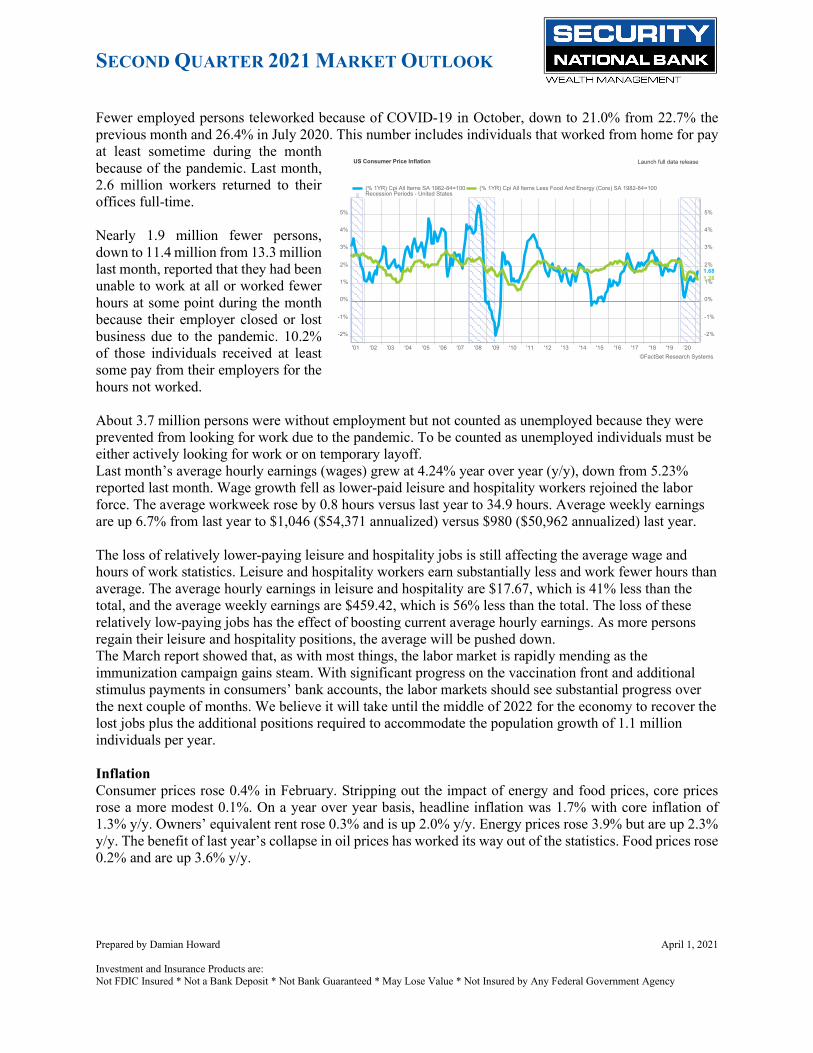
Fewer employed persons teleworked because of COVID-19 in October, down to 21.0% from 22.7% the previous month and 26.4% in July 2020. This number includes individuals that worked from home for pay at least sometime during the month because of the pandemic. Last month, 2.6 million workers returned to their offices full-time. Nearly 1.9 million fewer persons, down to 11.4 million from 13.3 million last month, reported that they had been unable to work at all or worked fewer hours at some point during the month because their employer closed or lost business due to the pandemic. 10.2% of those individuals received at least some pay from their employers for the hours not worked. About 3.7 million persons were without employment but not counted as unemployed because they were prevented from looking for work due to the pandemic. To be counted as unemployed individuals must be either actively looking for work or on temporary layoff. Last month’s average hourly earnings (wages) grew at 4.24% year over year (y/y), down from 5.23% reported last month. Wage growth fell as lower-paid leisure and hospitality workers rejoined the labor force. The average workweek rose by 0.8 hours versus last year to 34.9 hours. Average weekly earnings are up 6.7% from last year to $1,046 ($54,371 annualized) versus $980 ($50,962 annualized) last year. The loss of relatively lower-paying leisure and hospitality jobs is still affecting the average wage and hours of work statistics. Leisure and hospitality workers earn substantially less and work fewer hours than average. The average hourly earnings in leisure and hospitality are $17.67, which is 41% less than the total, and the average weekly earnings are $459.42, which is 56% less than the total. The loss of these relatively low-paying jobs has the effect of boosting current average hourly earnings. As more persons regain their leisure and hospitality positions, the average will be pushed down. The March report showed that, as with most things, the labor market is rapidly mending as the immunization campaign gains steam. With significant progress on the vaccination front and additional stimulus payments in consumers’ bank accounts, the labor markets should see substantial progress over the next couple of months. We believe it will take until the middle of 2022 for the economy to recover the lost jobs plus the additional positions required to accommodate the population growth of 1.1 million individuals per year. Inflation Consumer prices rose 0.4% in February. Stripping out the impact of energy and food prices, core prices rose a more modest 0.1%. On a year over year basis, headline inflation was 1.7% with core inflation of 1.3% y/y. Owners’ equivalent rent rose 0.3% and is up 2.0% y/y. Energy prices rose 3.9% but are up 2.3% y/y. The benefit of last year’s collapse in oil prices has worked its way out of the statistics. Food prices rose 0.2% and are up 3.6% y/y.
'01 '02 '03 '04 '05 '06 '07 '08 '09 '10 '11 '12 '13 '14 '15 '16 '17 '18 '19 '20
-2%-2%
-1%-1%
0%0%
1%1%
2%2%
3%3%
4%4%
5%5%
1.281.68
©FactSet Research Systems
US Consumer Price Inflation Launch full data release
(% 1YR) Cpi All Items SA 1982-84=100 (% 1YR) Cpi All Items Less Food And Energy (Core) SA 1982-84=100Recession Periods - United States

SECOND QUARTER 2021 MARKET OUTLOOK
Prepared by Damian Howard April 1, 2021 Investment and Insurance Products are: Not FDIC Insured * Not a Bank Deposit * Not Bank Guaranteed * May Lose Value * Not Insured by Any Federal Government Agency
We can tell what market participants think the long-term inflation rate will be, by measuring the difference between a 10-year Treasury security and the ten-year Treasury Inflation Protection security (TIPS). The difference implies what market participants expect inflation to average. Inflation expectations fell precipitously during the depth of the pandemic. They have since rebounded to 2.35%, slightly above its 2018 level. A 2.35% CPI number is very close to a 2.0% PCE figure. The FRB prefers the Personal Consumption Expenditure (PCE) as its measure of inflation. Due primarily to differences in how health care costs are allocated between employers and consumers, the PCE tends to run 0.30% below the CPI. The FRB has stated they will not raise interest rates until the PCE has averaged 2.0% over a 12-month period and the economy is at full employment. The market believes the FRB will be able to obtain its inflation target over the next decade. It also maintains that inflation will not materially exceed the goal. Inflation, as measured by the PCE, rose 0.2% in February and is up 1.6% y/y. Core PCE was up 0.1% and is up 1.4% y/y. We look for y/y inflation to spike up in the first half of 2021 as we anniversary the steep price declines in energy and high-contact services during the depth of the recession. Prices will ease but most likely not return to their pre-pandemic sub-2% level. We then expect the CPI to rise as the economy fully recovers and the impact of higher energy prices, massive fiscal and monetary stimulus, plus increased regulation takes effect. The FRB remains committed to being behind the curve when it comes to inflation. Inflation will not be high enough for long enough for the FRB to take away the punchbowl until mid-2023 at the earliest. Credit Markets The yield on the 10-year Treasury fell to a record low of 0.50% on March 9, 2020, as the government shut down the economy to contain the spread of COVID-19. In March, rates rose to 1.74% with better economic prospects and the specter of higher inflation.
Apr May Jun Jul Aug Sep Oct Nov Dec Jan Feb Mar0.4%0.4%
0.6%0.6%
0.8%0.8%
1.0%1.0%
1.2%1.2%
1.4%1.4%
1.6%1.6%
1.8%1.8%
1.72
©FactSet Research Systems
US 10Y Treasury Yield

SECOND QUARTER 2021 MARKET OUTLOOK
Prepared by Damian Howard April 1, 2021 Investment and Insurance Products are: Not FDIC Insured * Not a Bank Deposit * Not Bank Guaranteed * May Lose Value * Not Insured by Any Federal Government Agency
The credit markets were weak in March. Longer-dated issues suffered from rising interest rates. The Bloomberg Barclays (B.B.) U.S. Corporate Investment Grade index had a total return of -1.72%, with a -2.19% price return and 0.47% from income. Credit spreads widened 0.01% to 0.91%. the index has an 8.6-year effective duration, compared to the 6.5-year effective duration of the BB US Aggregate Index. The longer duration increases the investment-grade corporate index’s interest rate sensitivity. The B.B. High Yield index returned 0.15%, with a -0.37% price return and 0.52% from income. Credit spreads tightened by 0.16% to 3.10%; the index has a 3.9-year effective duration. The shorter duration reduces the high yield index’s interest rate sensitivity. With the FRB holding the FFR at 0.00% to 0.25%, the curve’s short end is less volatile. The FRB purchases of debt securities have compressed credits spreads. The FRB is committed to purchasing at least $80 billion of Treasury securities and $40 billion of mortgage-backed securities per month. Prior to the pandemic, the FRB held $4.2 trillion in securities. Today it holds $7.7 trillion. FRB purchases of risk-free assets have the effect of lowering interest rates and forcing investors into riskier assets, this tightens credit spreads. Interest rates will rise, and credit spreads will widen when the FRB starts reducing its purchases, tapering. We expect the FRB to begin tapering sometime in 2022, followed by a rise in the Fed Funds rate around mid-year 2023. The Consumer Sector The drop in personal income was the largest in series history. Personal income fell 7.1% in February as transfer payments (stimulus payments and supplemental unemployment benefits) fell 27% from the month before. Personal income excluding transfer payments rose 0.4% as flat private-sector wages were offset by a 2.3% increase in proprietors’ income and a 0.5% increase in dividend and income on investments. Personal income is up 4.3% y/y. Personal income excluding transfer payments is down 0.1% y/y. Compensation is up 0.2% y/y while proprietors’ income is down 4.8% y/y and interest and dividend are down 3.1% y/y. Small business owners and investors have faced the largest drop in income.
'01 '02 '03 '04 '05 '06 '07 '08 '09 '10 '11 '12 '13 '14 '15 '16 '17 '18 '19 '20-10
-5
0
5
10
15
20
4.34
©FactSet Research Systems
United States - Personal income
4/19 7/19 10/19 1/20 4/20 7/20 10/20 1/21 4/21
2
4
6
8
10
12
0.89
3.05
Bloomberg Barclays US Aggregate Credit - Corporate - High Yield (1983)Bloomberg Barclays US Corporate Investment Grade

SECOND QUARTER 2021 MARKET OUTLOOK
Prepared by Damian Howard April 1, 2021 Investment and Insurance Products are: Not FDIC Insured * Not a Bank Deposit * Not Bank Guaranteed * May Lose Value * Not Insured by Any Federal Government Agency
March and April data will be impacted by the $240 billion of stimulus payments paid out as part of the $1.9 trillion American Rescue Plan (ARP). During the month, consumers saved 13.6% of disposable income. Since the pandemic began, consumers have saved an estimated $1.9 trillion more than their typical savings, equating to 14.5% of annual consumption. Earnings not spent on services are in part being saved. Consumers will spend extra savings over the remainder of this year and into next year as the economy reopens. This supports our above-trend GDP growth rate of 6.9%. Consumer spending on goods and services fell 1.0% for the month. Most of the decline can be attributed to the harsh winter weather that gripped the country’s midsection in February. Consumption is down 0.6% y/y. Purchases of durable goods are up 17.2% y/y. Purchases of non-durable goods are up 6.1% y/y. Purchases of services are down 5.2% y/y. The decline was led by travel (down 27%), recreation (down 29.4%), restaurants (down 12.6%), and hotels (down 54%). All these high-touch sectors will rebound as vaccines are rolled out. Consumer confidence rose smartly in March. Both the perception of present situations and expectations for six months hence rose. The Consumer Confidence Index, compiled by the Conference Board, rose 19.3 points to 109.7. For reference, the average reading over the last twenty years has been 91.6. The present situation component rose to 110.0 from 89.6 the previous month. The forward-looking expectation component rose to 109.6 from 90.9 the previous month. The most recent check from Uncle Sam and significantly higher vaccine distribution clearly improved consumers’ outlook. Fewer respondents thought current business conditions were bad as the net sub-index (good-bad) rose to -12.0 from -23.6 the previous month. Consumers have a substantially better feeling about business conditions in six months as the net sub-index (better - worse) rose to 29.8 from 13.0 the previous month. The same can be said about the labor market. The current conditions net employment sub-index (plentiful - hard to get) rose to 7.8 from -0.8 the prior month. Consumers feel substantially better about the
'01 '02 '03 '04 '05 '06 '07 '08 '09 '10 '11 '12 '13 '14 '15 '16 '17 '18 '19 '20-20
-15
-10
-5
0
5
10
-0.59
©FactSet Research Systems
United States - Personal consumption expenditures
'01 '02 '03 '04 '05 '06 '07 '08 '09 '10 '11 '12 '13 '14 '15 '16 '17 '18 '19 '20
2020
4040
6060
8080
100100
120120
140140
109.70
©FactSet Research Systems
US Consumer Confidence Launch full data release
Composite Series: Index Numbers, 1985=100, Consumer Confidence Index - United StatesRecession Periods - United States

SECOND QUARTER 2021 MARKET OUTLOOK
Prepared by Damian Howard April 1, 2021 Investment and Insurance Products are: Not FDIC Insured * Not a Bank Deposit * Not Bank Guaranteed * May Lose Value * Not Insured by Any Federal Government Agency
employment conditions in six months as the net sub-index (more jobs – fewer jobs) rose to 22.7 from 6.1 the previous month. As expected, consumer confidence improved as more people received their vaccination, and the economy started to reopen. The consumer remains in good shape financially. Household net worth ended 2020 at a record $130 trillion, up $12 trillion or 10.5% for the year. We look for consumers to spend their excess savings as soon as they feel safe doing so. The Business Sector Services comprise 66% of personal consumption expenditures (PCE). Activity in the manufacturing sector is easier to measure and track. Most of our growth and productivity measures were developed after WWII for the manufacturing sector. While it is easy to measure labor cost per widget produced, it is much harder to measure a programmer or an app’s productivity. The Institute for Supply Management (ISM) produces a monthly report on activity in each sector. The reports are sentiment-driven and can be influenced by current events. Nonetheless, they do provide real-time clues to what is happening. Services comprise 66% of personal consumption expenditures (PCE). Activity in the manufacturing sector is easier to measure and track. Most of our growth and productivity measures were developed after WWII for the manufacturing sector. While it is easy to measure labor cost per widget produced, it is much harder to measure a programmer or an app’s productivity. The Institute for Supply Management (ISM) produces a monthly report on activity in each sector. The reports are sentiment-driven and can be influenced by current events. Nonetheless, they do provide real-time clues to what is happening. Both in the U.S. and globally, manufacturers and non-manufacturing orientated businesses report the same story. Growth is broad-based throughout the entire economy. Supply chains are stressed by February’s bad weather and pandemic-related constraints. Lengthening supplier delivery times are making it difficult to fulfill customer orders. The prices paid for inputs are soaring. This is likely to stress operating margins, as rising costs are not expected to be 100% passed on to customers. The service sector accelerated in March. The March reading was an all-time high for this index. Activity in the services sector has grown for ten months in a row. The ISM’s non-manufacturing index rose 8.4 points to 63.7. The two forward-looking components, business activity/production and new orders, both rose substantially, indicating accelerating growth prospects. The business activities/production component rose 13.9 points to 69.4. The new orders component rose 15.3 points to 67.2. Both indices continue to indicate accelerating growth. The employment in the services sector rose 4.5 points to 57.2. Ten industries reported an increase in employment. Three industries reported a reduction in employment. Despite high unemployment, many areas of the economy are facing a labor shortage. We expect the labor pool to expand as Americans reenter the labor market and the participation rate expands.
Non-Manufacturing Sector Direction Business Activity / Production Growing New Orders Growing Employment Growing Supplier Deliveries Slowing Customer Inventories N/A Non-Manufacturing Sector Growing Industries Expanding 18 Industries Contracting 0

SECOND QUARTER 2021 MARKET OUTLOOK
Prepared by Damian Howard April 1, 2021 Investment and Insurance Products are: Not FDIC Insured * Not a Bank Deposit * Not Bank Guaranteed * May Lose Value * Not Insured by Any Federal Government Agency
Supplier deliveries continued to worsen in March. The supplier deliveries component rose by 0.2 points to 61.0. fourteen industries reported slower deliveries. Only two industries reported faster deliveries. Prices paid for materials and services increased in March. The price component rose by 2.2 points to 47.0. All eighteen industries reported higher costs. As a frame of reference, a reading above 50 indicates expansion; a reading below 50 indicates contraction. Readings approximating 50 indicate the same level of activity. The manufacturing sector has adapted to the pandemic better than the service sector. The change in consumer purchasing behavior has also benefited the manufacturing sector. During March, the manufacturing sector grew at an accelerating pace. However, slow supplier deliveries and rising costs remain a serious concern. The manufacturing index rose 3.9 points to 64.7. The figure indicates the manufacturing sector has expanded for ten straight months after contracting sharply in April. The production component rose 4.9 points to 68.1. The new orders component rose 3.2 points to 68.0. The employment component rose 5.2 points to 59.6, indicating increased manufacturing employment. Fourteen industries reported employment growth. No industries reported contractions. Supplier deliveries to manufacturers worsened as the sub-index rose 4.6 points to 76.6, the highest level since 1974. Manufacturers continue to report stressed supply chains. The Prices Paid sub-index fell 0.4 points to 85.6, indicating raw material prices have increased for the 10th consecutive month. All eighteen industries reported increased costs for raw materials. The Morgan Stanley Global Manufacturing PMI (GPMI) rose by 2.5 points to 57.5 in March, an all-time high. The GPMI suggests the global recovery in industrial activity and trade is both broad-based and gaining steam. Demand continues to strengthen in the face of pandemic-restricted supply chains. Production levels are rising, demand remains strong, but supply chains remain constrained. Supplier deliveries remain stressed. Input prices have risen to a 10-year high. Price pressures should fall as economies reopen. All the survey results point to a surge in economic activity over the coming months. The gives us renewed confidence in our above-consensus growth outlook. It also adds to the risk of higher than anticipated inflation.
Manufacturing Sector Direction Production Growing New Orders Growing Employment Growing Supplier Deliveries Slowing Customer Inventories Too Low Manufacturing Sector Growing Industries Expanding 17 Industries Contracting 0

SECOND QUARTER 2021 MARKET OUTLOOK
Prepared by Damian Howard April 1, 2021 Investment and Insurance Products are: Not FDIC Insured * Not a Bank Deposit * Not Bank Guaranteed * May Lose Value * Not Insured by Any Federal Government Agency
The Housing Sector New home sales add significantly more to economic growth than existing home sales. Like much of the economy, the housing sector is suffering from Covid-induced supply chain shortages. There are widespread shortages of new homes for sale, existing homes for sale, workers to build new homes, and lumber and materials to build them. Despite U.S. lumber production being at a 13-year high, lumber prices have never been this expensive. The supply chain was not prepared for the surge in demand. The National Association of Home Builders says that rising lumber prices have added $24,000 to the cost of building the average single-family home and about $9,000 per apartment. The median selling price for new homes has risen $17,600 or 5.3% y/y to $349,400. New home sales plunged in February, registering their largest decline since 2013. New home sales fell to a 775,000 pace from 948,000 pace the month before. New home sales are counted when the contract is signed, not at closing. February’s polar vortex delayed some sales into March. A lack of finished product has also put a cap on sales. The inventory of finished new homes is down 48.1% from last year. As the weather warms and supply chains catch up, new home sales will increase. Single-family housing starts have been in excess of a 1 million run rate since July of 2020. The demand is there. Millennials, now the largest living generation, are entering the housing market. Millennials now account for over 50% of mortgage originations. While mortgage rates are up 0.20% YTD, they are still attractive. Higher rates will push some marginal buyers out of the market. Even at slightly higher mortgage interest rates, demand still outstrips supply. Existing home sales also fell in February. Rough weather, declining affordability, and lack of supply are starting to take a toll. While down 6.6% month over month (m/m), sales are up 9.1% y/y to a 6.22 million annual rate. Existing inventory of homes for sale is at a record low and is down 29.5% y/y. Strong demand and lack of inventory usually leads to rapid price increases. Existing home price appreciation, as measured by the Case-Shiller Home Price Index ticked up a strong 11.1% y/y. We expect supply chains to be stressed for a couple more quarters. As with most of the economy, supply shortages will diminish as the vaccine is fully distributed. Lumber prices will moderate, and more people
'01 '02 '03 '04 '05 '06 '07 '08 '09 '10 '11 '12 '13 '14 '15 '16 '17 '18 '19 '20
-30%
-20%
-10%
0%
10%
20%
200
400
600
800
1,000
1,200
1,400
©FactSet Research Systems
US New Home Sales Launch full data release%Change vs. Prior Month 000's of units
(% 1M) New Residential Sales, New Houses Sold, Total, SA - United States (Left)New Residential Sales, New Houses Sold, Total, SA - United States (Right)Recession Periods - United States
'01 '02 '03 '04 '05 '06 '07 '08 '09 '10 '11 '12 '13 '14 '15 '16 '17 '18 '19 '20
-20%-20%
-15%-15%
-10%-10%
-5%-5%
0%0%
5%5%
10%10%
15%15%
20%20%
10.8711.10
©FactSet Research Systems
S&P/Case-Shiller Home Price Indices
10 City Composite> 20 City Composite

SECOND QUARTER 2021 MARKET OUTLOOK
Prepared by Damian Howard April 1, 2021 Investment and Insurance Products are: Not FDIC Insured * Not a Bank Deposit * Not Bank Guaranteed * May Lose Value * Not Insured by Any Federal Government Agency
will be willing to let strangers tour their homes. Housing should provide a tailwind of economic growth over the next several years. We welcome your comments and suggestions. Please feel free to contact me. Also, please see the obligatory disclosures listed below. DISCLOSURES This material is intended for informational purposes only and does not constitute an invitation or solicitation to invest in any particular investment product. Information contained herein has been obtained from sources believed to be reliable but may change without notice. We do not guarantee its accuracy or completeness. Security National Bank accepts no liability for the results of any action taken based on this information. Financial commentary discussed in this report may not be applicable or suitable for all investors, and investors must make their own independent legal, tax, accounting, and financial evaluations of their risks and merits. Past performance is not indicative of future results. Investments offered by Security National Bank: Are Not a Deposit Are Not FDIC-insured Are Not Guaranteed by the Bank Are Not Insured by Any Federal Government Agency May Go Down in Value
Related Documents