Second Quarter 2014 Review August 14, 2014

Welcome message from author
This document is posted to help you gain knowledge. Please leave a comment to let me know what you think about it! Share it to your friends and learn new things together.
Transcript

Second Quarter 2014 ReviewAugust 14, 2014
2
Cautionary StatementsThis presentation contains “forward-looking statements” within the meaning of Section 27A of the Securities Act of 1933, as amended (the “Securities Act”) and Section 21E of
the Securities Exchange Act of 1934, as amended (the “Exchange Act”). All statements, other than statements of historical fact included in this presentation, regarding Eclipse
Resources’ strategy, future operations, financial position, estimated revenues and income/losses, projected costs and capital expenditures, prospects, plans and objectives of
management are forward-looking statements. When used in this presentation, the words “will,” “would,” “could,” “believe,” “anticipate,” “intend,” “estimate,” “expect,”
“project” and similar expressions are intended to identify forward-looking statements, although not all forward-looking statements contain such identifying words. These
forward-looking statements are based on Eclipse Resources’ current expectations and assumptions about future events and are based on currently available information as to the
outcome and timing of future events. When considering forward-looking statements, you should keep in mind the risk factors and other cautionary statements described under
the heading “Risk Factors” in Eclipse Resources’ final prospectus dated June 19, 2014 and filed with the Securities Exchange Commission pursuant to Rule 424(b) of the
Securities Act on June 23, 2014 (the “IPO Prospectus”), and in “Item 1A. Risk Factors” of Eclipse Resources’ Quarterly Report on Form 10-Q.
Forward-looking statements may include statements about Eclipse Resources’ business strategy; reserves; general economic conditions; financial strategy, liquidity and capital
required for developing its properties and timing related thereto; realized natural gas, NGLs and oil prices; timing and amount of future production of natural gas, NGLs and oil;
its hedging strategy and results; future drilling plans; competition and government regulations, including those related to hydraulic fracturing; the anticipated benefits under its
commercial agreements; pending legal matters relating to its leases; marketing of natural gas, NGLs and oil; leasehold and business acquisitions; the costs, terms and
availability of gathering, processing, fractionation and other midstream services; general economic conditions; credit markets; uncertainty regarding its future operating results,
including initial production rates and liquid yields in its type curve areas; and plans, objectives, expectations and intentions contained in this presentation that are not historical.
Eclipse Resources cautions you that these forward-looking statements are subject to all of the risks and uncertainties, most of which are difficult to predict and many of which
are beyond its control, incident to the exploration for and development, production, gathering and sale of natural gas, NGLs and oil. These risks include, but are not limited to;
legal and environmental risks, drilling and other operating risks, regulatory changes, commodity price volatility, inflation, lack of availability of drilling, production and
processing equipment and services, counterparty credit risk, the uncertainty inherent in estimating natural gas, NGLs and oil reserves and in projecting future rates of
production, cash flow and access to capital, the timing of development expenditures, and the other risks described under the heading “Item 1A. Risk Factors” in Eclipse
Resources’ Final Prospectus of Form S-1 and in “Item 1A. Risk Factors” of this the Company’s Quarterly Report on Form 10-Q.
Reserve engineering is a process of estimating underground accumulations of natural gas, NGLs and oil that cannot be measured in an exact way. The accuracy of any reserve
estimate depends on the quality of available data, the interpretation of such data and price and cost assumptions made by reserve engineers. In addition, the results of drilling,
testing and production activities may justify revisions of estimates that were made previously. If significant, such revisions could change the schedule of any further production
and development drilling. Accordingly, reserve estimates may differ significantly from the quantities of natural gas, NGLs and oil that are ultimately recovered.
Should one or more of the risks or uncertainties described in Eclipse Resources’ Quarterly Report on Form 10-Q occur, or should underlying assumptions prove incorrect, the
Company’s actual results and plans could differ materially from those expressed in any forward-looking statements.
All forward-looking statements, expressed or implied, included in this presentation are expressly qualified in their entirety by this cautionary statement. This cautionary
statement should also be considered in connection with any subsequent written or oral forward-looking statements that Eclipse Resources or persons acting on the Company’s
behalf may issue.
Except as otherwise required by applicable law, Eclipse Resources disclaims any duty to update any forward-looking statements, all of which are expressly qualified by the
statements in this section, to reflect events or circumstances after the date of this presentation.

3
Successfully completed initial public offering of 30.3 million shares resulting in net
proceeds of $545.4 million
Revenues grew to $27.0 million, a 9% increase over the first quarter of 2014 while adjusted
EBITDAX (a non-GAAP measure) for the quarter was $11.3 million
Strong Financial
Results
Key Highlights
Record
Production &
Operating
Results
New Firm
Transportation
Agreements
Average Daily Production
41.9 Mmcfe/d, a 9% increase from the first quarter 2014
58.2 Mmcfe/d in June 2014, 52% increase from the first quarter 2014 average
Commenced drilling 24 gross (16 net) operated Utica Shale wells achieving an average time
from spud to rig release of 23 days for wells drilled to total depth during the quarter
Turned to sales 3 gross (2.5 net) operated Utica Shale dry gas wells
Average initial flowing pressure of 5,838 psi over the first five days
30-day sales rate of 34.9 Mmcf/d using the company’s restricted choke production method
Mid-year 2014 proved reserves increased by 70% from March 31, 2014 to 186.4 Bcfe (22%
liquids) with a pre-tax PV10 of $337.9 million
Increased Utica Shale leasehold to approximately 99,300 net acres and Marcellus Project Area
to approximately 26,400 net acres
205,000 Dth per day on Columbia Gas Transmission’s Utica Access project accessing the
Columbia Transmission (TCO) Pool
Up to 150,000 Dth per day on Energy Transfer’s “Rover” project going north to Dawn,
Ontario and south to the Gulf Coast
Up to 100,000 Dth per day on the TETCO “Team 2014” project, providing flexibility to
move gas to the northeastern M3 market, the Gulf Coast and Midwestern markets

4
Pipeline Start Date Term Volume (Dth/d) Market
Floating Basis Firm Sales Nov-14 5 months 80,000 Tied to Dominion South
Fixed Basis Firm Sales Apr-15 7 months 50,000 Henry Hub less $1.328
Fixed Basis Firm Sales Nov-15 5 months 20,000 Henry Hub less $0.900
TETCO Apr-15 9.5 years 100,000 Gulf Coast, Midwest & M3
TCO Nov-16 15 years 205,000 TCO Pool
Energy Transfer Dec-16 15 years 50,000 Canada
Energy Transfer Jun-17 15 years 100,000 Gulf Coast
Midstream/Marketing Update
1. Henry Hub Natural Gas Differentials
During the second quarter, several agreements totaling 455,000 dekatherms of firm transportation were executed and come on line as early as April 2015
Based on current market conditions, differential for operated natural gas production is expected to average
approximately $0.90 to $1.00 per MMBtu below NYMEX during 2015
All long term firm transportation agreements expected to beat 90 cent long term differential target
(including transportation costs)
Start Date Term Volume (Dth/d) Average Differential ($/Dth)1
Nov-14 5 months 25,000 ($1.067)
Apr-15 7 months 25,000 ($1.208)Natural Gas Basis Swaps
5
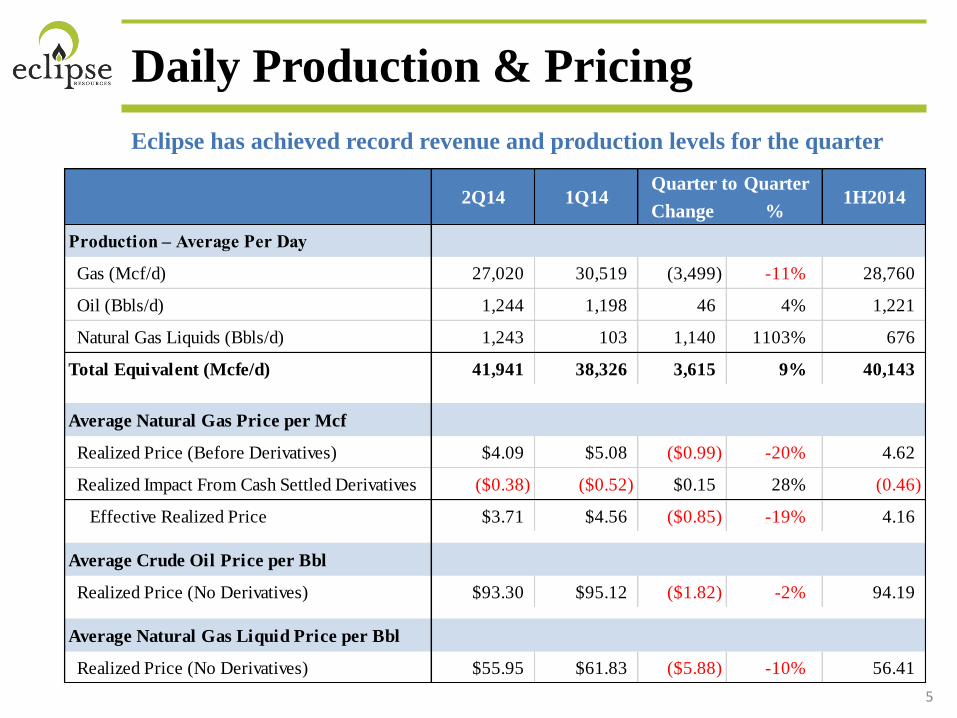
Daily Production & Pricing
Eclipse has achieved record revenue and production levels for the quarter
Change %
Production – Average Per Day
Gas (Mcf/d) 27,020 30,519 (3,499) -11% 28,760
Oil (Bbls/d) 1,244 1,198 46 4% 1,221
Natural Gas Liquids (Bbls/d) 1,243 103 1,140 1103% 676
Total Equivalent (Mcfe/d) 41,941 38,326 3,615 9% 40,143
Average Natural Gas Price per Mcf
Realized Price (Before Derivatives) $4.09 $5.08 ($0.99) -20% 4.62
Realized Impact From Cash Settled Derivatives ($0.38) ($0.52) $0.15 28% (0.46)
Effective Realized Price $3.71 $4.56 ($0.85) -19% 4.16
Average Crude Oil Price per Bbl
Realized Price (No Derivatives) $93.30 $95.12 ($1.82) -2% 94.19
Average Natural Gas Liquid Price per Bbl
Realized Price (No Derivatives) $55.95 $61.83 ($5.88) -10% 56.41
Quarter to Quarter1H20142Q14 1Q14

6
Selected Financial Highlights
Unconventional direct LOE were impacted by start-up operational expenses, cost per unit of production should decrease as wells are added and production increases
Gathering, compression, processing and fuel charges associated with non-operated properties in the second quarter were 100% higher than previous estimates
Change %
Natural Gas Revenue $10.1 $14.0 ($3.9) -28% $24.0
Oil Revenue $10.6 $10.3 $0.3 3% $20.8
Natural Gas Liquids Revenue $6.3 $0.6 $5.8 1001% $6.9
Total Revenue (excluding derivatives) $27.0 $24.8 $2.2 9% $51.7
per Mcfe $7.06 $7.19 ($0.12) -2% $7.12
Lease Operating Expense $2.6 $1.8 $0.9 48% $4.4
Transportation, gathering and compression $2.9 $0.9 $2.0 226% $3.9
Production and ad valorem taxes $0.7 $0.4 $0.3 99% $1.1
Total Lifting Cost per Mcfe $1.65 $0.88 $0.77 87% $1.29
General & Administrative $8.4 $8.4 $0.0 0% $16.8
DD&A & Accretion $10.1 $12.2 ($2.1) -17% $22.4
Interest Expense $11.6 $13.6 ($2.0) -15% $25.3
Loss on Derivatives ($0.9) ($3.6) $2.7 76% ($4.5)
Adjusted Net Loss ($10.4) ($22.4) $12.0 54% ($12.0)
per Share ($0.08) ($0.17)
Adjusted EBITDAX $11.3 $11.9 ($0.6) -5% $23.3
per Mcfe $2.97 $3.46 ($0.49) -14% $3.20
(in millions except per share and per Mcfe data)2Q14 1Q14
Quarter to Quarter1H2014

7
Borrowing Base $100 million
Outstanding Borrowings $0 million
Letters of Credit Outstanding $25 million
Available Debt $75 million
Cash Balance $493 million
Total Liquidity (6/30/2014) $568 million
Liquidity Status
Balance Sheet and Liquidity Review
Eclipse has ample liquidity to execute its drilling program
Balance Sheet Summary
(in $ thousands)
Actual as of
6/30/14
Actual as of
12/31/13Change
Cash $493,420 $109,509 $383,911
AR and Other Current Assets 45,257 9,272 35,985
Oil and Gas Properties 1,345,318 1,018,084 327,234
Other Assets 6,882 6,658 224
Total Assets $1,890,877 $1,143,523 $747,354
AP and Accrued Liabilities $142,300 $55,459 $86,841
Accrued Interest Payable 23,243 20,294 2,949
Senior Notes 412,823 389,247 23,576
Deferred Taxes and Other Liabilities 106,721 10,552 96,169
Total Equity 1,205,790 667,971 537,819
Total Liabilities and Equity $1,890,877 $1,143,523 $747,354

8
Current Operations Activity
Eclipse continues to meet or exceed its drilling and completions goals
Operated Drilling Activity 4 Operated horizontal rigs
Spud 24 gross (16 net) wells in 2nd quarter, drilled 11 gross
( 6 net) to TD
Averaged 23 days spud to rig release
Drilled longest lateral to date on Duane Weisand well in Noble
County at 9,096’
Set spud to rig release company record on Mizer Farms 7H,
Harrison County in 17 days with total measured depth of 14,881’
Since company inception, have spud 47 wells with both big rig
and top hole with 32 wells TD’s thru 7/31/14
Operated Completions Activity
2 frac spreads working In discussion to dedicate second frac spread
6 completed wells in 2nd quarter with an average of 3.6 frac
stages per pad per day
Deliberate frac design testing program in progress Parameters under review include stage spacing, fluid type,
sand concentration, and cluster spacing
Non-Operated Activity
Participated in 16 gross (2.5 net) wells spuds
12 gross (2.6 net) wells turned-to-sales during the second quarter
As of July 31, 2014, interest in 62 gross (11.6 net) non-operated wells 9 gross (2.6 net) drilling
40 gross (8.1 net) producing
Operated Spuds in 1H14
9
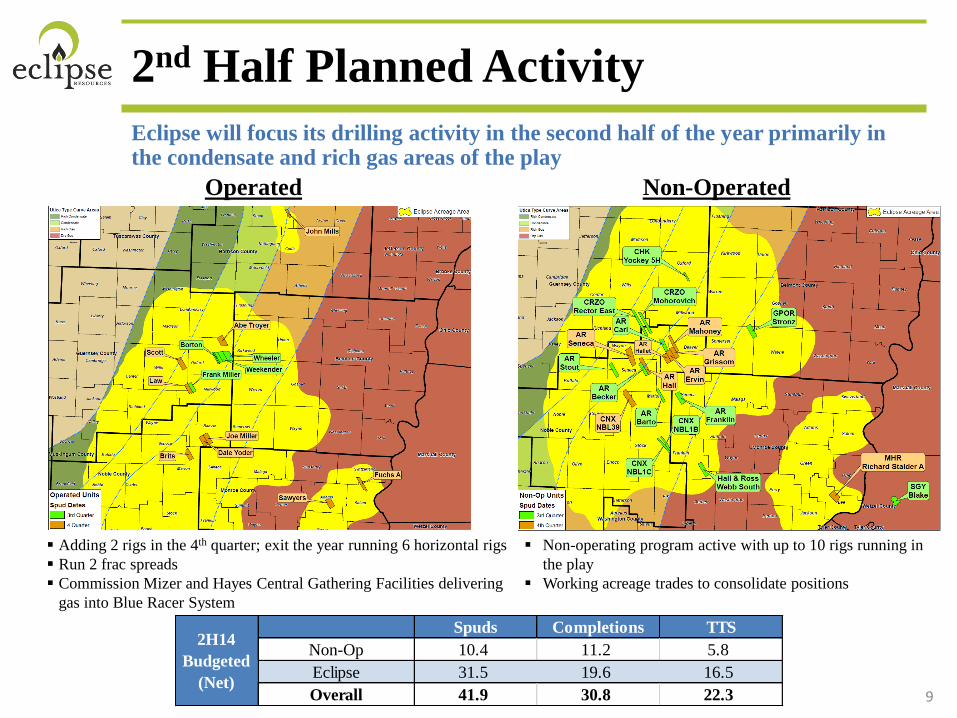
2nd Half Planned Activity
Operated Non-Operated
Adding 2 rigs in the 4th quarter; exit the year running 6 horizontal rigs
Run 2 frac spreads
Commission Mizer and Hayes Central Gathering Facilities delivering
gas into Blue Racer System
Non-operating program active with up to 10 rigs running in
the play
Working acreage trades to consolidate positions
Eclipse will focus its drilling activity in the second half of the year primarily in the condensate and rich gas areas of the play
Spuds Completions TTS
Non-Op 10.4 11.2 5.8
Eclipse 31.5 19.6 16.5
Overall 41.9 30.8 22.3
2H14
Budgeted
(Net)
10
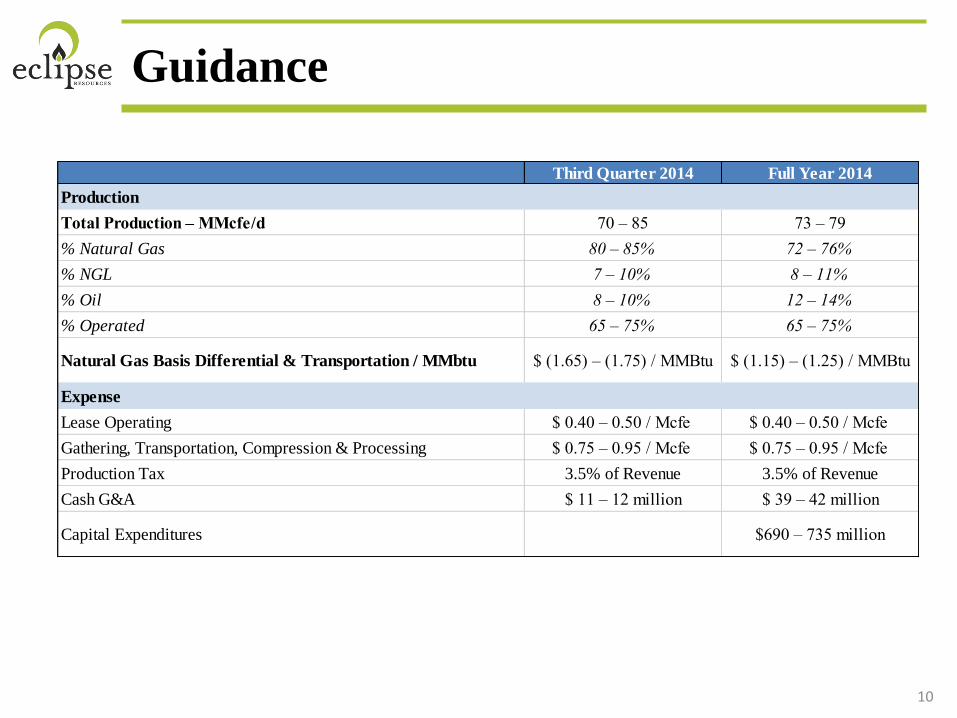
Guidance
Third Quarter 2014 Full Year 2014
Production
Total Production – MMcfe/d 70 – 85 73 – 79
% Natural Gas 80 – 85% 72 – 76%
% NGL 7 – 10% 8 – 11%
% Oil 8 – 10% 12 – 14%
% Operated 65 – 75% 65 – 75%
Natural Gas Basis Differential & Transportation / MMbtu $ (1.65) – (1.75) / MMBtu $ (1.15) – (1.25) / MMBtu
Expense
Lease Operating $ 0.40 – 0.50 / Mcfe $ 0.40 – 0.50 / Mcfe
Gathering, Transportation, Compression & Processing $ 0.75 – 0.95 / Mcfe $ 0.75 – 0.95 / Mcfe
Production Tax 3.5% of Revenue 3.5% of Revenue
Cash G&A $ 11 – 12 million $ 39 – 42 million
Capital Expenditures $690 – 735 million
11
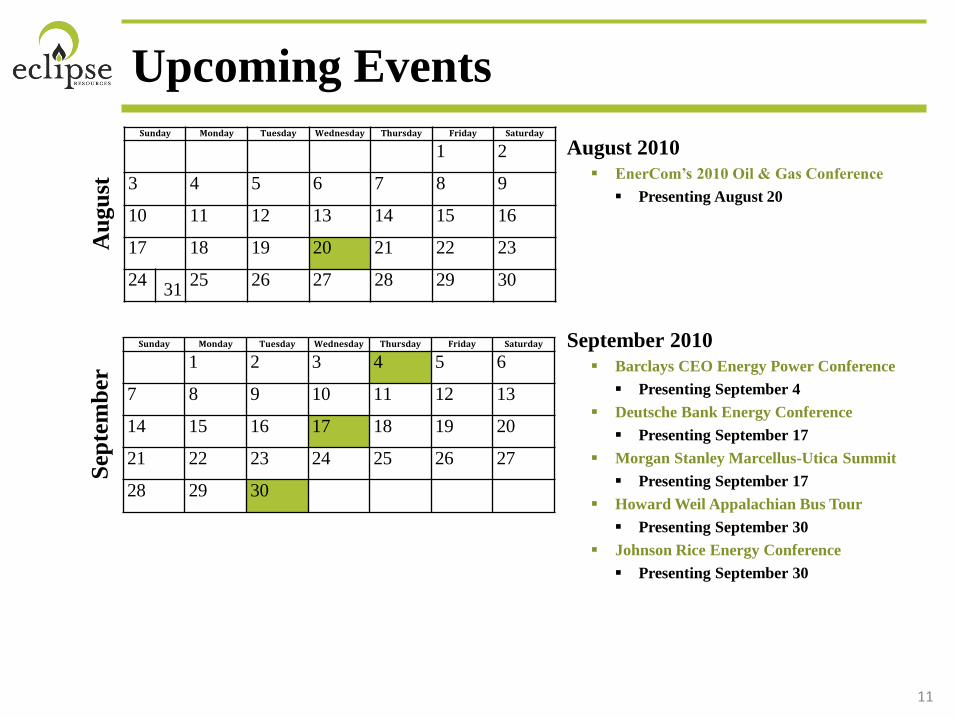
Sunday Monday Tuesday Wednesday Thursday Friday Saturday
1 2
3 4 5 6 7 8 9
10 11 12 13 14 15 16
17 18 19 20 21 22 23
2431
25 26 27 28 29 30
Sunday Monday Tuesday Wednesday Thursday Friday Saturday
1 2 3 4 5 6
7 8 9 10 11 12 13
14 15 16 17 18 19 20
21 22 23 24 25 26 27
28 29 30
August 2010
EnerCom’s 2010 Oil & Gas Conference
Presenting August 20
September 2010
Barclays CEO Energy Power Conference
Presenting September 4
Deutsche Bank Energy Conference
Presenting September 17
Morgan Stanley Marcellus-Utica Summit
Presenting September 17
Howard Weil Appalachian Bus Tour
Presenting September 30
Johnson Rice Energy Conference
Presenting September 30
Upcoming EventsA
ugu
stS
epte
mb
er

Appendix
Non-GAAP Reconciliation Tables

13
Adjusted EBITDAX
Change %
Net loss (112,648) (18,451) ($94,197) 511% (131,099)
Depreciation, depletion & amortization 9,957 12,027 ($2,070) -17% 21,984
Exploration Expense 9,295 4,545 $4,750 105% 13,840
Incentive unit compensation 27 29 ($2) -7% 56
Accretion of asset retirement obligations 191 186 $5 3% 377
Gain on reduction of pension liablilty 0 (2,208) $2,208 -100% (2,208)
Loss on derivative instruments 863 3,611 ($2,748) -76% 4,474
Net cash payment on derivative instruments (790) (1,441) $651 -45% (2,231)
Net cash paid for option premium (141) 0 (141)
Interest expense 11,618 13,636 ($2,018) -15% 25,254
Other income (1,585) 0 (1,585)
Income tax expense 94,541 0 94,541
Adjusted EBITDAX 11,328 11,934 ($606) -5% 23,262
per Mcfe $2.97 $3.46 ($0) -14% $2.81
1H2014(in thousands except per Mcfe data)
2Q14 1Q14Quarter to Quarter
14
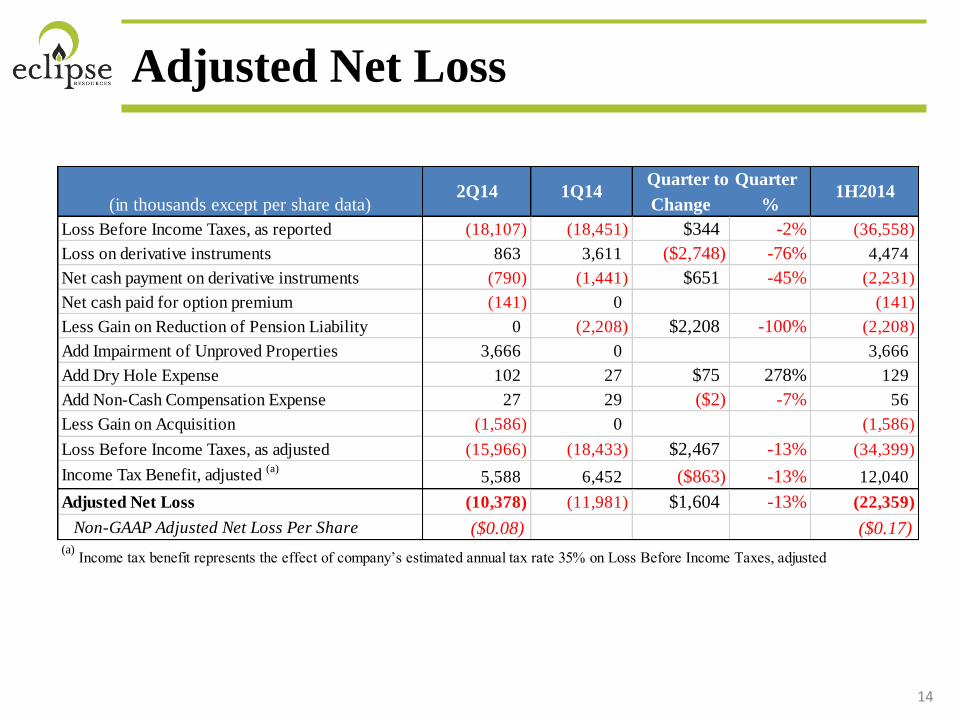
Adjusted Net Loss
Change %
Loss Before Income Taxes, as reported (18,107) (18,451) $344 -2% (36,558)
Loss on derivative instruments 863 3,611 ($2,748) -76% 4,474
Net cash payment on derivative instruments (790) (1,441) $651 -45% (2,231)
Net cash paid for option premium (141) 0 (141)
Less Gain on Reduction of Pension Liability 0 (2,208) $2,208 -100% (2,208)
Add Impairment of Unproved Properties 3,666 0 3,666
Add Dry Hole Expense 102 27 $75 278% 129
Add Non-Cash Compensation Expense 27 29 ($2) -7% 56
Less Gain on Acquisition (1,586) 0 (1,586)
Loss Before Income Taxes, as adjusted (15,966) (18,433) $2,467 -13% (34,399)
Income Tax Benefit, adjusted (a)
5,588 6,452 ($863) -13% 12,040
Adjusted Net Loss (10,378) (11,981) $1,604 -13% (22,359)
Non-GAAP Adjusted Net Loss Per Share ($0.08) ($0.17)(a)
Income tax benefit represents the effect of company’s estimated annual tax rate 35% on Loss Before Income Taxes, adjusted
(in thousands except per share data)2Q14 1Q14
Quarter to Quarter1H2014
15
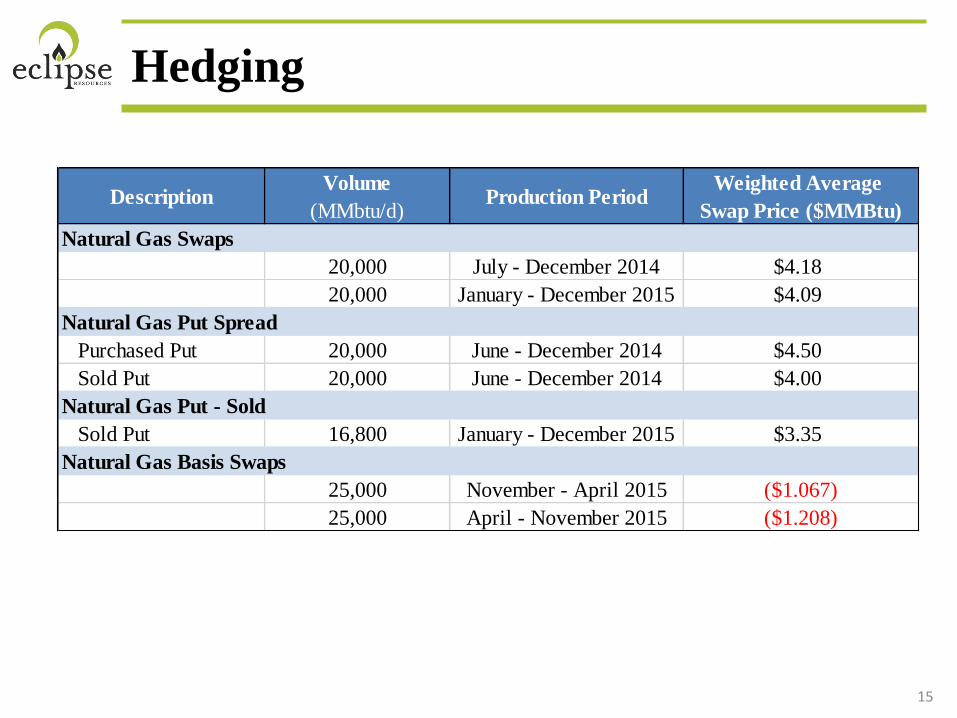
Hedging
DescriptionVolume
(MMbtu/d)Production Period
Weighted Average
Swap Price ($MMBtu)
Natural Gas Swaps
20,000 July - December 2014 $4.18
20,000 January - December 2015 $4.09
Natural Gas Put Spread
Purchased Put 20,000 June - December 2014 $4.50
Sold Put 20,000 June - December 2014 $4.00
Natural Gas Put - Sold
Sold Put 16,800 January - December 2015 $3.35
Natural Gas Basis Swaps
25,000 November - April 2015 ($1.067)
25,000 April - November 2015 ($1.208)
Related Documents