SEC Training - Risk Management Washington, D.C., February 27, 2006 Robert J. Frey, Ph.D. Director, Program in Quantitative Finance Applied Mathematics and Statistics, Stony Brook University

Welcome message from author
This document is posted to help you gain knowledge. Please leave a comment to let me know what you think about it! Share it to your friends and learn new things together.
Transcript
SEC Training - Risk ManagementWashington, D.C., February 27, 2006
Robert J. Frey, Ph.D.Director, Program in Quantitative Finance
Applied Mathematics and Statistics, Stony Brook University

The Concept of Risk
2

What Is Risk?
• How likely is a given outcometo occur?
• How much does that outcomescare you?
3

The Risk Equation
Risk = Uncertainty + Consequences
4

A 5%positionloss…
• …at 1:1 leverage is aninconvenience.
• …at 5:1 leverage is a disaster.
• …at 10:1 leverage puts you outof business.
• …at 20:1 leverage bankruptsyou.
5

MFA Sound Practicesfor Hedge Fund Managers
6

MFASound Practices
• Management and Internal Trading
Controls
• Responsibilities to Investors
• Valuation Policies and Procedures
• Risk Monitoring
• Regulatory Controls
• Transactional Practices
• Business Continuity and Disaster
Recovery
7

Sources ofUncertainty(guaranteed incomplete)
• Market Economic Growth Interest and Inflation Rates Foreign Exchange Credit and Counter-party
• Operational Lack of Discipline Lack of Flexibility Operational Errors and Deficiencies
• Strategy Non-Stationarity Overfitting Lack of Realism
• Event Risk Regulatory Changes Political Upheavals
8

RiskMonitoring
Source: MFA’s 2005 Sound Practices forHedge Fund Managers, p. IV-2
• Reports to Senior Management
• Develop and Implement aSystem of Checks and Balances
• Conduct Back Tests and StressTests
• Quantify and Monitor CurrentExposures
9

RiskClassificationSource: MFA’s 2005 Sound Practices forHedge Fund Managers, pp. IV-3 to IV-9
• Market Risk
• Liquidity Risk
• Credit Risk
• Leverage Risk
• Operational Risk
• Valuation Risk
10

MonitoringRisk
Source: MFA’s 2005 Sound Practices forHedge Fund Managers, pp. AI-1 to AI-22
• General Techniques No one numerical or statistical
measure is complete
Employ multiple measures• VaR• Stress Testing• Scenario Analysis
• Funding Liquidity Risk The fund’s ability to absorb losses
Volatility a key element
• Leverage (in context) Multiple Definitions
Not an Independently UsefulMeasure
11
The Character of Security Returns
12
13
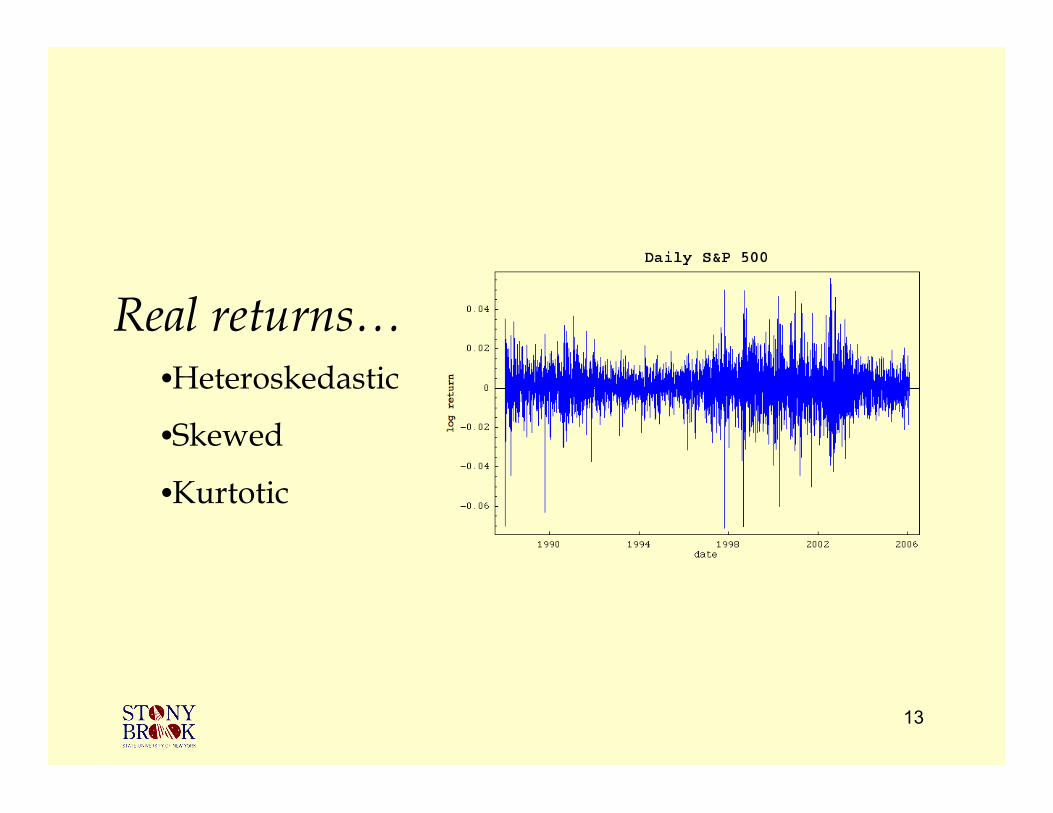
Real returns…•Heteroskedastic
•Skewed
•Kurtotic
14
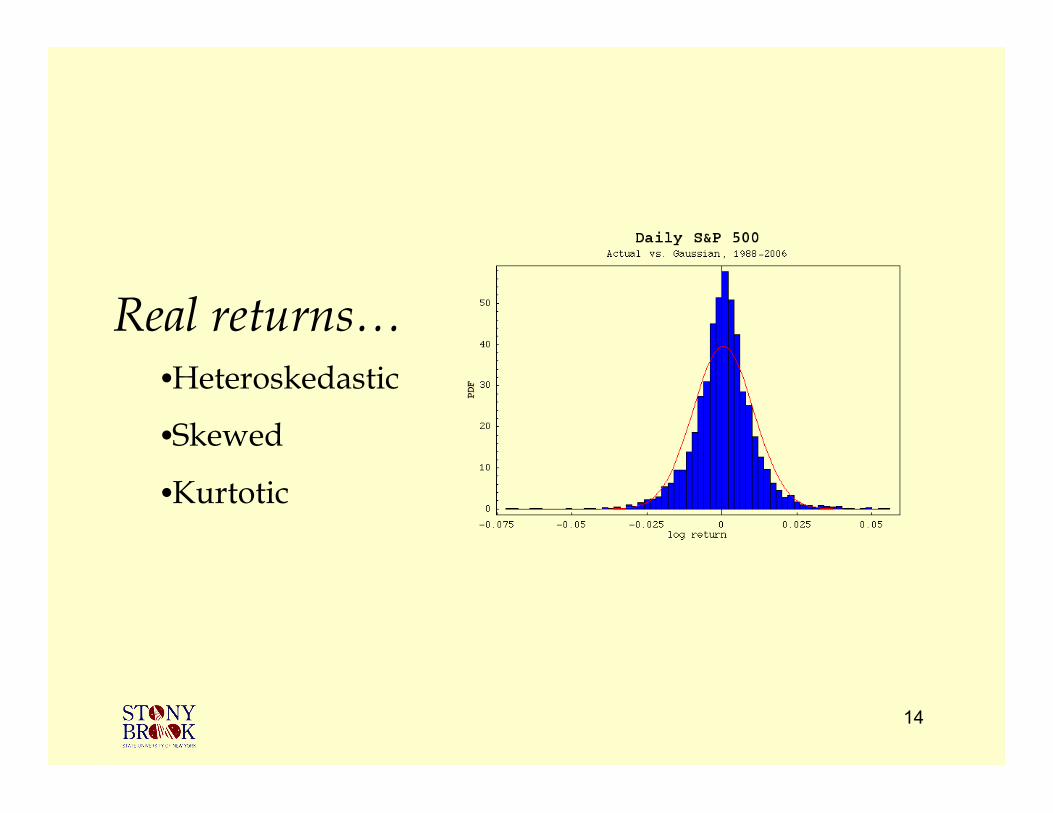
Real returns…•Heteroskedastic
•Skewed
•Kurtotic

15
4,558 tradingdays
Observations
(–3.9%, –3.9 σ)Century “Fence”*
4.4 billion yearsTheoretical Frequency*
(–7.1%, -7.0 σ)Maximum Drawdown
9Outlier Count
1.0%Return σ
ResultStatistic
0.045%Return µOutlier
AnalysisS &P 500 Daily Returns
1988 - 2006
* Assuming a Gaussian Distribution with the same mean and standard deviation.

16
602 tradingmonths
Observations
(–12.3%, –3.1 σ)Century “Fence”*
23.2 million yearsTheoretical Frequency*
(–24.3%, -5.8 σ)Maximum Drawdown
2Outlier Count
4.2%Return σ
ResultStatistic
0.83%Return µOutlier
AnalysisS &P 500 Monthly Returns
1956 - 2006
* Assuming a Gaussian Distribution with the same mean and standard deviation.

Controlling Risk with Hedging
17
Derivatives&
Risk
• Derivatives transfer risk - either
increasing or decreasing it.
• Hedges typically involve some form
of “leverage”.
• Overconfidence and bad assumptions
have serious consequences.
18

Systematicvs.
Idiosyncratic
• Certain risk factors are systematic;
i.e., they are shared across securities.
• Others are idiosyncratic; i.e., they are
unique to each particular security.
• Systematic risk can not be diversified
away but idiosyncratic risk can.
19

Arbitrage(Theory)
• Relative performance returns can besmall but independent.
• Buy a long position in “undervalued”assets.
• Sell a short position in “overvalued”assets.
• Hedge out systematic factors so thatonly idiosyncratic risks…andreturns…remain.
• Diversify aggressively; lever up to an“interesting” return.
20
Arbitrage(Practice)
• Risk models are not perfect, so there arealways missing factors…and unhedgedsystematic exposures.
• Maintaining a long-short hedge must bedone dynamically: Volatility exposure,trading costs, difficulty in selling shortsetc. make managing a portfoliooperationally difficult.
• Markets evolve, making models obsolete.
• With many arbitrage based strategiesmanagers experience steady and mildlypositive returns punctuated by periods ofextremely poor performance.
21
22
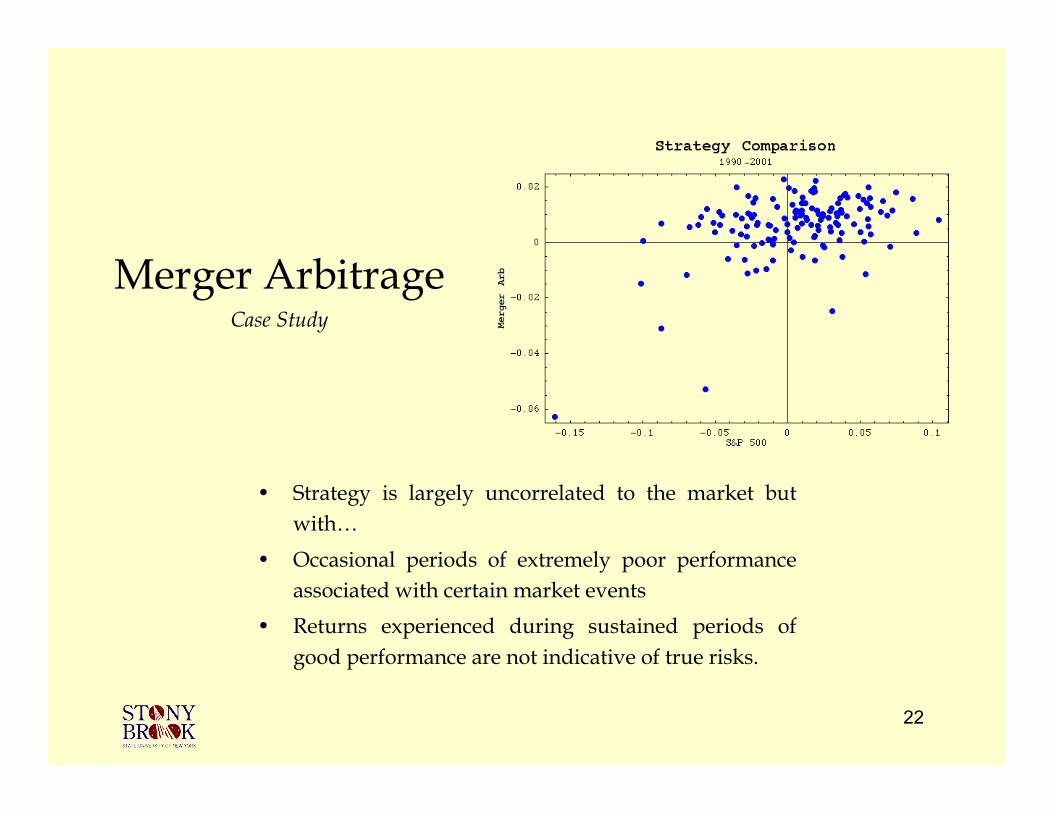
• Strategy is largely uncorrelated to the market butwith…
• Occasional periods of extremely poor performanceassociated with certain market events
• Returns experienced during sustained periods ofgood performance are not indicative of true risks.
Merger ArbitrageCase Study

WhyHedges
Fail
• Following the map…not looking at the road…makes iteasy to overlook the obvious.
• Models, even at their best, are not representative. Markets are not continuous. Models depend on statistical estimates; the “true”
parameters are unknown. Markets evolve and change all the time.
• Model errors are amplified by high leverage. Risk is underestimated: Leverage is encouraged. Even small errors are deadly.
• Changes in market behavior during stress periodsinvalidate basic assumptions. Correlations increase during stress periods. Liquidity disappears as supply and demand become
imbalanced.
• Two most dangerous comments are… “This time it’s different…” “This time it’s just like…”
23

A Few Useful Quotes…
24

TheQuant’s
Trap
Today’s scientists have substituted
mathematics for experiments, and they
wander off through equation after
equation, and eventually build a
structure which has no relation to reality.
Nikola Tesla (1856—1943)
25

TheModeler’s
Trap
Life is not an illogicality; yet it is a trap
for logicians. It looks just a little more
mathematical and regular than it is; its
exactitude is obvious, but its inexactitude
is hidden; its wildness lies in wait.
G.K. Chesterton (1874—1936)
26

Thank You!
27
Related Documents