Sec 10.3 Coefficient of Determination and Standard Error of the Estimate.

Sec 10.3 Coefficient of Determination and Standard Error of the Estimate.
Dec 24, 2015
Welcome message from author
This document is posted to help you gain knowledge. Please leave a comment to let me know what you think about it! Share it to your friends and learn new things together.
Transcript
Sec 10.3
Coefficient of Determination and Standard Error of the Estimate.

Review concepts
x 1 2 3 4 5
y 10 8 12 16 20
′
fill in the third row of the table for each x value.

Review concepts
x 1 2 3 4 5
y 10 8 12 16 20
′ 7.6 10.4 13.2 16 18.8

Test 10-11Friday April 18
Monday April 7Periods 5-8 assembly schedule
MONDAY 21 PERIODS 5-8 WED SCHEDULE.
Wed April 23 ACTOur class doesn’t meet

Variation
Bluman, Chapter 10 5
Regression line
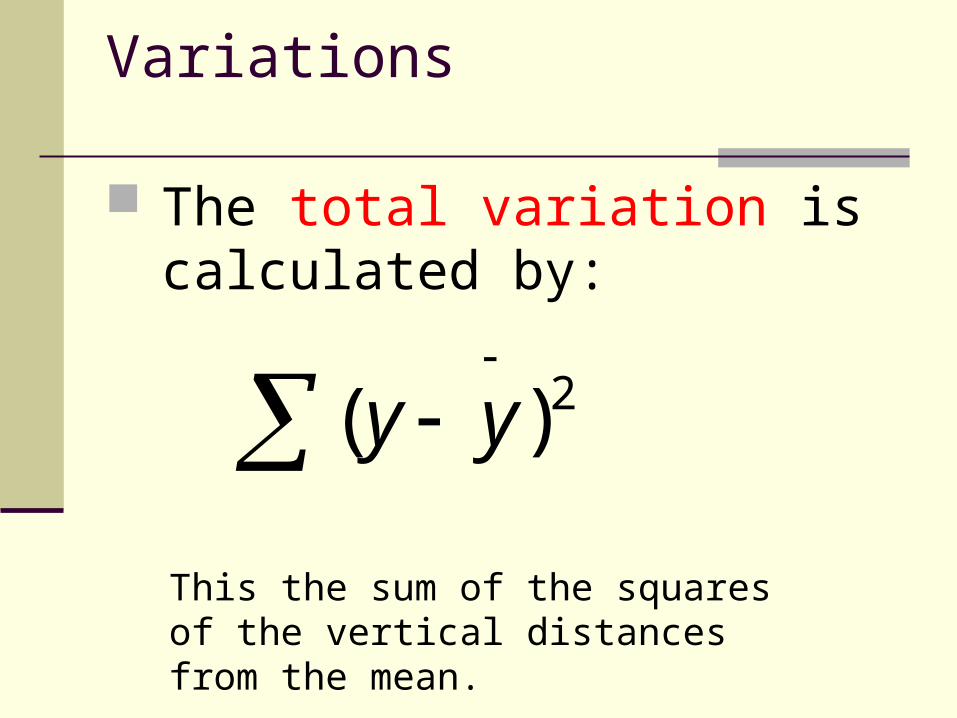
Variations
The total variation is calculated by:
This the sum of the squares of the vertical distances from the mean.
2)(
yy

2 parts of variation
The total variation is made up off two types of variation:
1. Explained variation: attributed to the relationship between x & y.
2. Unexplained variation: due to chance.
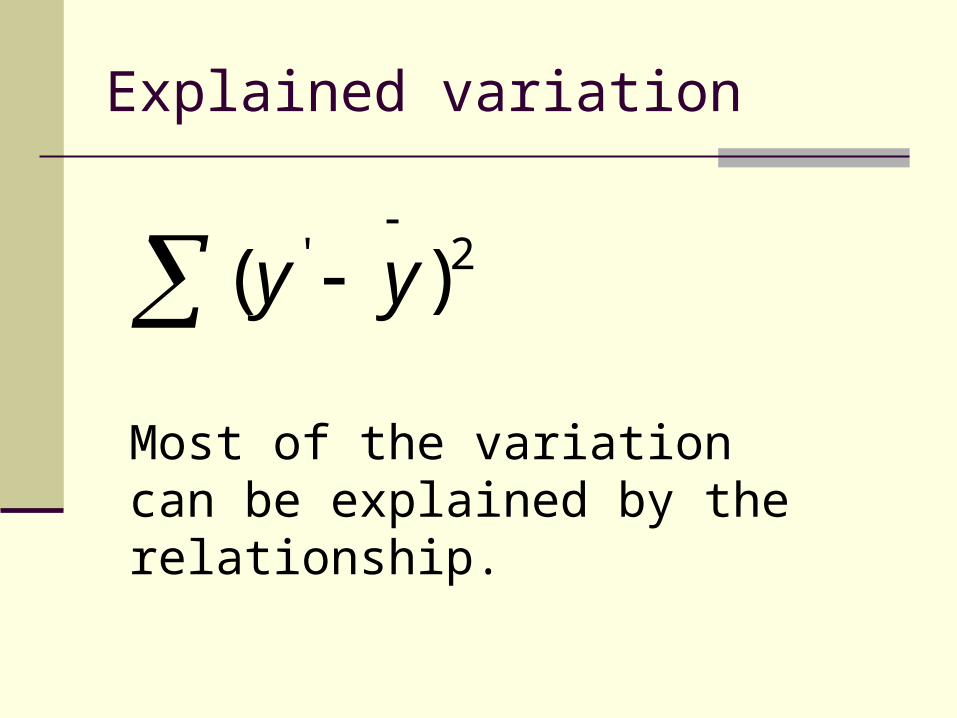
Explained variation
2
2'
)(
)(
yy
yy
2' )(
yy
Most of the variation can be explained by the relationship.

Unexplained variation
2')( yy
When this variation is small then the value of r will be close to 1 or -1.
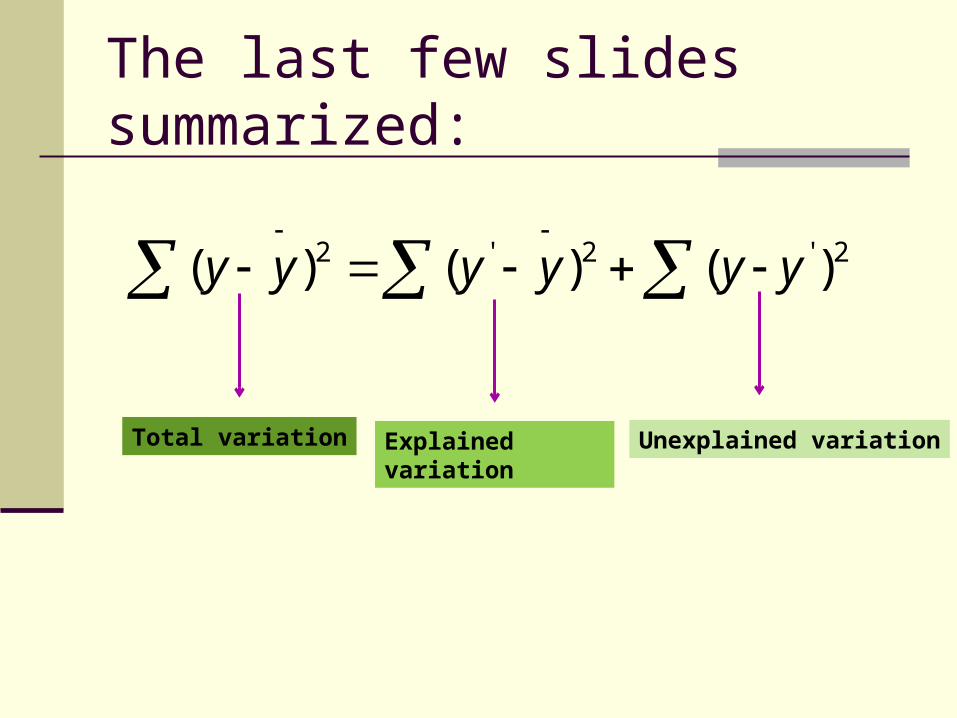
The last few slides summarized:
2'2'2 )()()( yyyyyy
Explained variation Unexplained variationTotal variation

Residuals
The values of (y-y') are called residuals.
A residual is the difference between the actual value of y and the predicted value of y' for a given x value.
The mean of the residuals is always zero.

Coefficient of . . .
1.Determination, r2
2.non-determination, 1-r2

Coefficient of determination, r2
The coefficient of determination,r2, is a measure of the variation of the dependent variable that is explained by the regression line and the independent variable.

Coefficient of Determiation The coefficient of determination is the
ratio of the explained variation to the total variation.
The symbol for the coefficient of determination is r 2.
Another way to arrive at the value for r 2 is to square the correlation coefficient.
Bluman, Chapter 10 14
2 explained variation
total variationr

Coefficient of Nondetermination:
Coefficient nondetermination is the measure of the rest of the variation that is not explained by r2.
It is the complement of r2 and equals to 1-r2.

Coefficient of Nondetermiation The coefficient of nondetermination is
a measure of the unexplained variation. The formula for the coefficient of
determination is 1.00 – r 2.
Bluman, Chapter 10 16
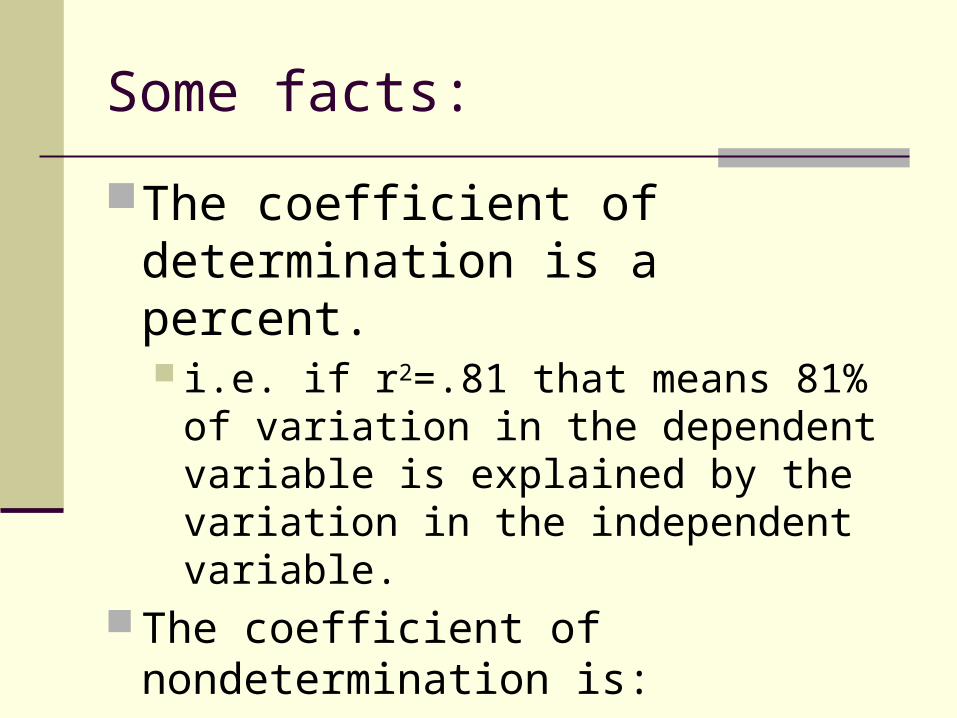
Some facts:
The coefficient of determination is a percent. i.e. if r2=.81 that means 81% of variation
in the dependent variable is explained by the variation in the independent variable.
The coefficient of nondetermination is: 1-81%=19% and it means that 19% …
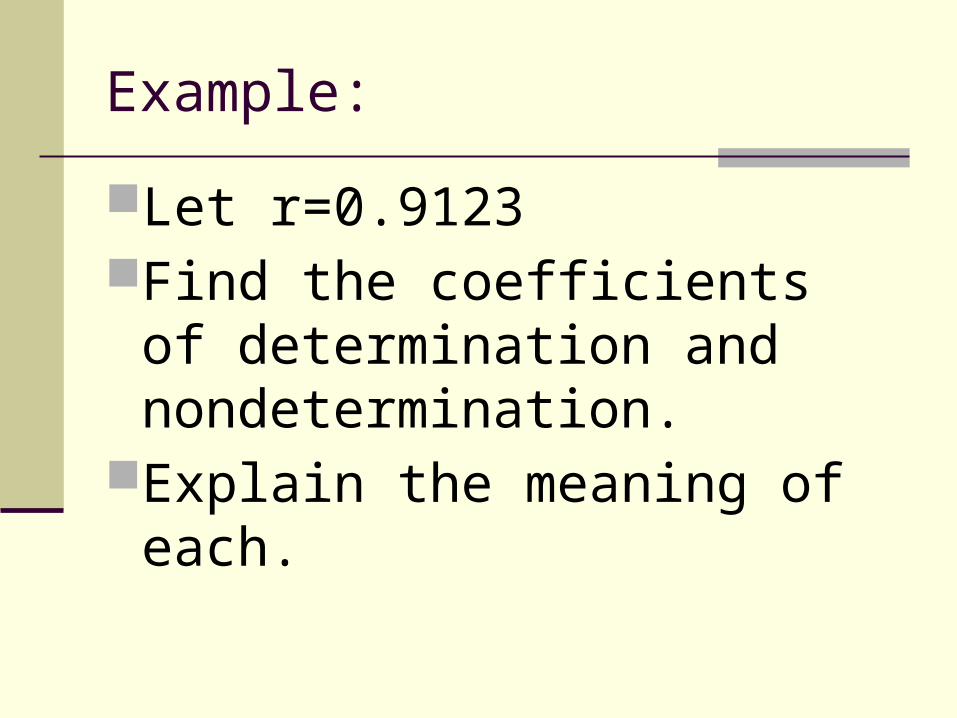
Example:
Let r=0.9123Find the coefficients of
determination and nondetermination.
Explain the meaning of each.
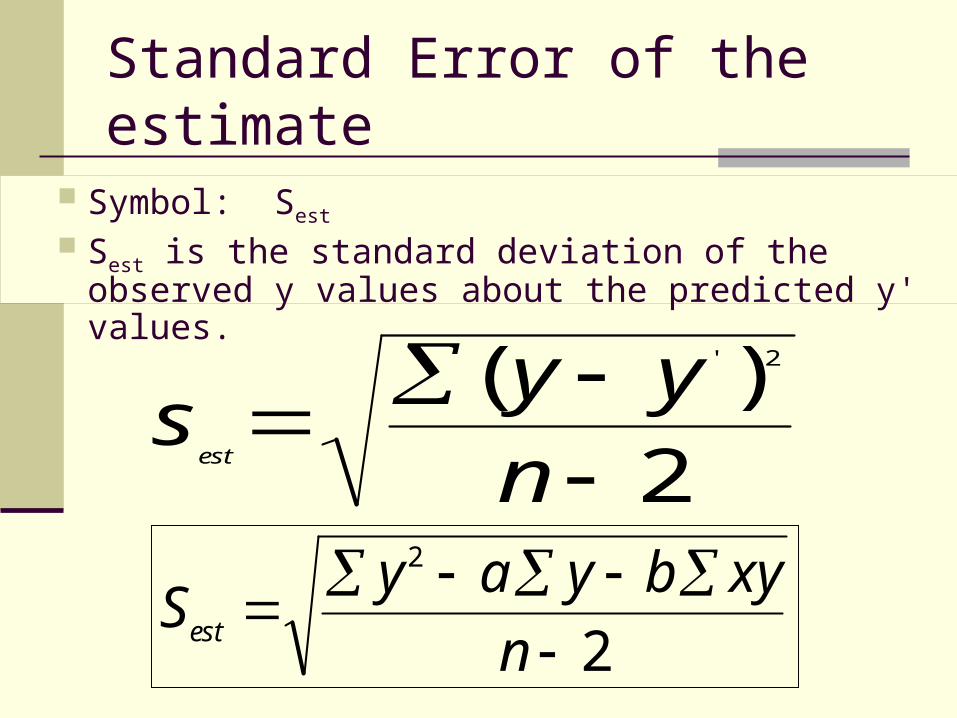
Standard Error of the estimate
Symbol: Sest
Sest is the standard deviation of the observed y values about the predicted y' values.
2
2
n
xybyaySest
2)( 2'
n
yys
est

Standard Error of the Estimate The standard error of estimate,
denoted by sest is the standard deviation of the observed y values about the predicted y' values. The formula for the standard error of estimate is:
Bluman, Chapter 10 20
2
2
est
y ys
n

Chapter 10Correlation and Regression
Section 10-3Example 10-12
Page #569
Bluman, Chapter 10 21

A researcher collects the following data and determines that there is a significant relationship between the age of a copy machine and its monthly maintenance cost. The regression equation is y = 55.57 + 8.13x. Find the standard error of the estimate.
Example 10-12: Copy Machine Costs
Bluman, Chapter 10 22

Example 10-12: Copy Machine Costs
Bluman, Chapter 10 23
MachineAge x
(years)Monthlycost, y y ¢ y – y ¢ (y – y ¢)2
ABCDEF
123446
6278709093103
63.7071.8379.9688.0988.09
104.35
-1.706.17
-9.961.914.91
-1.35
2.8938.068999.2016
3.648124.1081
1.8225
169.7392
55.57 8.13
55.57 8.13 1 63.70
55.57 8.13 2 71.83
55.57 8.13 3 79.96
55.57 8.13 4 88.09
55.57 8.13 6 104.35
y x
y
y
y
y
y
2
2
est
y ys
n
169.73926.51
4 ests

Chapter 10Correlation and Regression
Section 10-3Example 10-13
Page #570
Bluman, Chapter 10 24

Example 10-13: Copy Machine Costs
Bluman, Chapter 10 25
2
2
est
y a y b xys
n

Example 10-13: Copy Machine Costs
Bluman, Chapter 10 26
496 1778
MachineAge x
(years)Monthlycost, y xy y2
ABCDEF
123446
6278709093
103
62156210360372618
3,8446,0844,9008,1008,649
10,609
2
2
est
y a y b xys
n
42,186
42,186 55.57 496 8.13 17786.48
4
ests

Formula for the Prediction Interval about a Value y
Bluman, Chapter 10 27
2
2 22
2
2 22
11
11
with d.f. = - 2
est
est
n x Xy t s y
n n x x
n x Xy t s
n n x x
n

Chapter 10Correlation and Regression
Section 10-3Example 10-14
Page #571
Bluman, Chapter 10 28

For the data in Example 10–12, find the 95% prediction interval for the monthly maintenance cost of a machine that is 3 years old.
Step 1: Find
Step 2: Find y for x = 3.
Step 3: Find sest.
(as shown in Example 10-13)
Example 10-14: Copy Machine Costs
Bluman, Chapter 10 29
2, , and . x x X2 20
20 82 3.36
x x X
55.57 8.13 3 79.96 y
6.48ests

Step 4: Substitute in the formula and solve.
Example 10-14: Copy Machine Costs
Bluman, Chapter 10 30
2
2 22
2
2 22
11
11
est
est
n x Xy t s y
n n x x
n x Xy t s
n n x x
2
2
2
2
6 3 3.3179.96 2.776 6.48 1
6 6 82 20
6 3 3.3179.96 2.776 6.48 1
6 6 82 20
y
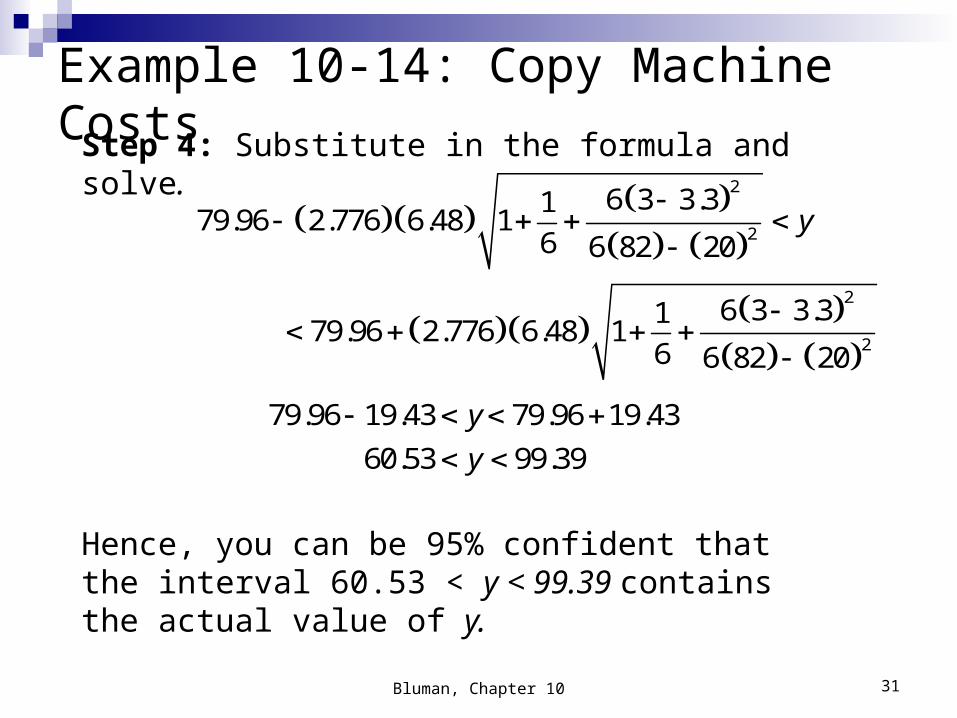
Step 4: Substitute in the formula and solve.
Example 10-14: Copy Machine Costs
Bluman, Chapter 10 31
2
2
2
2
6 3 3.3179.96 2.776 6.48 1
6 6 82 20
6 3 3.3179.96 2.776 6.48 1
6 6 82 20
y
79.96 19.43 79.96 19.43
60.53 99.39
y
y
Hence, you can be 95% confident that the interval 60.53 < y < 99.39 contains the actual value of y.

Read section 10.3
Take notes on Residuals.
Review the calculator steps.
Page 574 #1-7 all, 9-17 odds
Bluman, Chapter 10 32
Related Documents


