PLEASE SCROLL DOWN FOR ARTICLE This article was downloaded by: [Tsinghua University] On: 26 August 2010 Access details: Access Details: [subscription number 912295224] Publisher Taylor & Francis Informa Ltd Registered in England and Wales Registered Number: 1072954 Registered office: Mortimer House, 37- 41 Mortimer Street, London W1T 3JH, UK International Journal of Remote Sensing Publication details, including instructions for authors and subscription information: http://www.informaworld.com/smpp/title~content=t713722504 Estimation of evapotranspiration using a remote sensing model over agricultural land in the North China Plain Dawen Yang a ; He Chen a ; Huimin Lei a a State Key Laboratory of Hydro-Science and Engineering, Department of Hydraulic Engineering, Tsinghua University, Beijing, PR China Online publication date: 04 August 2010 To cite this Article Yang, Dawen , Chen, He and Lei, Huimin(2010) 'Estimation of evapotranspiration using a remote sensing model over agricultural land in the North China Plain', International Journal of Remote Sensing, 31: 14, 3783 — 3798 To link to this Article: DOI: 10.1080/01431161.2010.483492 URL: http://dx.doi.org/10.1080/01431161.2010.483492 Full terms and conditions of use: http://www.informaworld.com/terms-and-conditions-of-access.pdf This article may be used for research, teaching and private study purposes. Any substantial or systematic reproduction, re-distribution, re-selling, loan or sub-licensing, systematic supply or distribution in any form to anyone is expressly forbidden. The publisher does not give any warranty express or implied or make any representation that the contents will be complete or accurate or up to date. The accuracy of any instructions, formulae and drug doses should be independently verified with primary sources. The publisher shall not be liable for any loss, actions, claims, proceedings, demand or costs or damages whatsoever or howsoever caused arising directly or indirectly in connection with or arising out of the use of this material.

Welcome message from author
This document is posted to help you gain knowledge. Please leave a comment to let me know what you think about it! Share it to your friends and learn new things together.
Transcript
PLEASE SCROLL DOWN FOR ARTICLE
This article was downloaded by: [Tsinghua University]On: 26 August 2010Access details: Access Details: [subscription number 912295224]Publisher Taylor & FrancisInforma Ltd Registered in England and Wales Registered Number: 1072954 Registered office: Mortimer House, 37-41 Mortimer Street, London W1T 3JH, UK
International Journal of Remote SensingPublication details, including instructions for authors and subscription information:http://www.informaworld.com/smpp/title~content=t713722504
Estimation of evapotranspiration using a remote sensing model overagricultural land in the North China PlainDawen Yanga; He Chena; Huimin Leia
a State Key Laboratory of Hydro-Science and Engineering, Department of Hydraulic Engineering,Tsinghua University, Beijing, PR China
Online publication date: 04 August 2010
To cite this Article Yang, Dawen , Chen, He and Lei, Huimin(2010) 'Estimation of evapotranspiration using a remotesensing model over agricultural land in the North China Plain', International Journal of Remote Sensing, 31: 14, 3783 —3798To link to this Article: DOI: 10.1080/01431161.2010.483492URL: http://dx.doi.org/10.1080/01431161.2010.483492
Full terms and conditions of use: http://www.informaworld.com/terms-and-conditions-of-access.pdf
This article may be used for research, teaching and private study purposes. Any substantial orsystematic reproduction, re-distribution, re-selling, loan or sub-licensing, systematic supply ordistribution in any form to anyone is expressly forbidden.
The publisher does not give any warranty express or implied or make any representation that the contentswill be complete or accurate or up to date. The accuracy of any instructions, formulae and drug dosesshould be independently verified with primary sources. The publisher shall not be liable for any loss,actions, claims, proceedings, demand or costs or damages whatsoever or howsoever caused arising directlyor indirectly in connection with or arising out of the use of this material.
Estimation of evapotranspiration using a remote sensing model overagricultural land in the North China Plain
DAWEN YANG, HE CHEN* and HUIMIN LEI
State Key Laboratory of Hydro-Science and Engineering, Department of Hydraulic
Engineering, Tsinghua University, Beijing, 100084, PR China
Evapotranspiration (ET) from agricultural land is the most common form of water
consumption in the North China Plain. Based on in situ measurements by an eddy
covariance (EC) system, the present study tested the surface energy balance system
(SEBS) model for estimating surface energy fluxes from a wheat/maize rotation
cropland. Applicability of the SEBS model using Moderate Resolution Imaging
Spectroradiometer (MODIS) land products to estimate ET was further validated.
The model proved to be appropriate to measure heat flux during the wheat-growing
season, but underestimated the sensible heat flux during the maize-growing season.
Although the SEBS model performed better during the wheat-growing season, the
relative error of the latent heat flux was within 20% in both wheat- and maize-
growing seasons. Results showed that the SEBS model using remote sensing data
could provide a reasonable estimate of the surface energy fluxes from an irrigated
cropland in the North China Plain.
1. Introduction
Evapotranspiration (ET) constitutes the main part of terrestrial surface energy bal-
ance and water balance in land surface process analyses. Water balance, which
determines the total amount and spatial/temporal distribution of water resources, is
substantially influenced by surface ET over a wide range of spatial and temporal
scales. ET is essential for understanding hydrological processes and climate dynamics,as well as the interaction between land surface and atmosphere. It is also closely
associated with crop production and agricultural drought monitoring. Therefore,
estimating surface ET is of great importance in hydrology, water management and
agriculture (Glenn et al. 2007).
The North China Plain is a major food-producing region where more than half of
China’s wheat and one-third of its maize are grown (Wang et al. 2008). However, the
North China Plain has been exposed to a serious water shortage crisis due to dry
climate, dense population and rapid economic growth (Cai 2008). Agricultureaccounts for 70% of the total water consumption in this region (Zhang et al. 2003).
The huge amount of groundwater drawn for irrigation leads to serious groundwater
depression and the drying up of rivers (Yang et al. 2004). Sustainable crop production
in the North China Plain, therefore, relies on the irrigation efficiency and strict water
resource management, which require an accurate estimate of ET over vast areas of
croplands.
Since Brown and Rosenberg (1973) first used thermal infrared remotely sensed
temperature in a resistance model for predicting evapotranspiration, quantitative
*Corresponding author. Email: [email protected]
International Journal of Remote SensingISSN 0143-1161 print/ISSN 1366-5901 online # 2010 Taylor & Francis
http://www.tandf.co.uk/journalsDOI: 10.1080/01431161.2010.483492
International Journal of Remote Sensing
Vol. 31, No. 14, 20 July 2010, 3783–3798
Downloaded By: [Tsinghua University] At: 08:04 26 August 2010
estimation of ET based on remotely sensed data has developed rapidly. Currently,
estimation of regional surface ET requires a significant incorporation of auxiliary
surface parameters derived from remotely sensed data. Several models have been
proposed for the use of remote sensing data to estimate regional ET, such as Two-
Source Energy Balance Model (TSEB) (Norman et al. 1995), Surface Energy BalanceAlgorithm for Land (SEBAL) (Bastiaanssen et al. 1998), Simplified Surface Energy
Balance Index (S-SEBI) (Roerink et al. 2000), Surface Energy Balance System (SEBS)
(Su 2002), Evapo-Transpiration Mapping Algorithm (ETMA) (Loheide II and
Gorelick 2005), Mapping Evapo-Transpiration at high Resolution with Internalized
Calibration (METRIC) (Allen et al. 2007a), and Simplified Two-Source Energy
Balance (STSEB) (Sanchez et al. 2008). Detailed discussion of remote sensing-based
ET models was presented by Gowda et al. (2008). Most of these models, which can be
characterized either as single-layer or dual-layer, are based on a land surface energybalance equation. Dual-layer models have two sets of resistances across a bare soil
and a vegetation component, and include the interaction between these two compo-
nents. Single-layer models use only one resistance and assume that all surfaces can be
represented by one effective temperature and humidity value. Compared to single-
layer models, the greater physical realism of dual-layer models requires more ancillary
data and calibration. Therefore, a complicated parameterized dual-layer model has
not shown significant advantage over a simple, but correctly calibrated, single-layer
model (French et al. 2005, Timmermans et al. 2005, 2007).Among single-layer models, methods using remote sensing data to estimate heat
exchange are divided into two main categories: (1) calculation of sensible heat flux (H)
and determination of latent heat flux (LE) as the residual of the energy balance
equation (Hatfield et al. 1984, Choudhury et al. 1986); and (2) estimation of the
crop water stress index (CWSI) or surface energy balance index (SEBI), and deriva-
tion of H and LE from these indexes (Jackson et al. 1981, Menenti and Choudhury
1993). These models have been evaluated across various areas (e.g. French et al. 2005,
Jia et al. 2003, Allen et al. 2007b, van der Kwast et al. 2009), but large errors in the heatflux estimation have been reported. This indicates that validation and comparison of
these models are still necessary in specific regions.
The objective of the study is to test the SEBS model for estimating surface energy
fluxes over a wheat/maize rotation cropland in the North China Plain using MODIS
land products and in situ measurement by an eddy covariance (EC) system.
The applicability of the SEBS model using Moderate Resolution Imaging
Spectroradiometer (MODIS) land products for estimating ET was further validated.
2. Model description
SEBS is a single-layer model that uses an excess resistance term which accounts for the
differences of the roughness lengths for heat and momentum between vegetation and
soil surface (van der Kwast et al. 2009). It consists of three components: (i) a set of tools
for the determination of land surface physical parameters from spectral reflectance and
radiance; (ii) an extended model for the determination of roughness length for heat
transfer (Su et al. 2001); and (iii) a new formulation for the determination of evaporativefraction on the basis of energy balance at limiting cases (Su 2002). There are two
methods in SEBS based on whether the third component is included. In the case of
the third component not being included, LE is obtained as the residual of the energy
balance equation when H is obtained from the first two components (denoted the
3784 D. Yang et al.
Downloaded By: [Tsinghua University] At: 08:04 26 August 2010
residual method); otherwise, LE is calculated by the evaporative fraction and con-
strained by limiting cases (denoted the EF method).
Equations to calculate LE either through the residual method or the EF method
were given by Su (2002). However, the parameterization schemes of roughness length
of momentum transfer (z0m), zero displacement height (d), fractional coverage (fc),and soil heat flux (G0) were modified for the site used in this study.
The roughness length of momentum transfer and the zero displacement height are
derived from empirical relationships, which are fitted functions to curves given by
Shaw and Pereira (1982) from the second-order closure theory, proposed by
Choudhury and Monteith (1988).
d ¼ 1:1h ln 1þ X 1=4� �
; X ¼ CdðLAIÞ (1)
z0m ¼ z0s þ 0:3hX 1=2; 0 � X � 0:20:3h 1� d=hð Þ; 0:2 < X < 1:5
�;
(2)
where h is the canopy height (m), LAI is the leaf area index, Cd is the drag coefficient
of the foliage elements, generally assumed to be 0.2, and z0s is the substrate roughness
height (m), commonly taken as 0.01 for bare soil (Shuttleworth and Wallace 1985).
The fractional canopy coverage can be calculated by the scaled normalized differ-
ence vegetation index (NDVI) as:
fc ¼ðNDVIÞ � ðNDVIÞmin
ðNDVIÞmax � ðNDVIÞmin
; (3)
where (NDVI)min and (NDVI)max are the NDVI for bare soil (fc ¼ 0) and full
vegetation (fc ¼ 1), respectively.
Net radiation, Rn, is estimated as:
Rn ¼ 1� að ÞRswd þ es eaT4a � T4
s
� �; (4)
where Ta and Ts are the air and land surface temperature (K), respectively, a is the
albedo, Rswd is the downward solar radiation (W m-2), s is the Stefan–Bolzmannconstant (5.67 � 10-8 W m-2 K-4), e is the emissivity of the surface, and ea is the
emissivity of the atmosphere, which could be estimated as follows (Brutsaert 1975):
ea ¼ 1:24 ea=Tað Þ1=7 (5)
where ea is the air vapour pressure. The parameters a, e, and Ts can be derived from
remote sensing data of visible and thermal infrared spectral ranges.Soil heat flux is calculated using the multifactor ratio method by Bastiaanssen
(2000):
G0 ¼ Ts 0:0038þ 0:0074að Þ 1� 0:98 NDVIð Þ4� �
Rn (6)
3. Experimental set-up
3.1 Study area
The Weishan flux site (36� 390 N, 116� 030 E) stands at the centre of the Weishan
Irrigation District (36� 80–37� 10 N and 115� 250–116� 310 E) located along the lower
Satellite-based observations of hydrological processes 3785
Downloaded By: [Tsinghua University] At: 08:04 26 August 2010
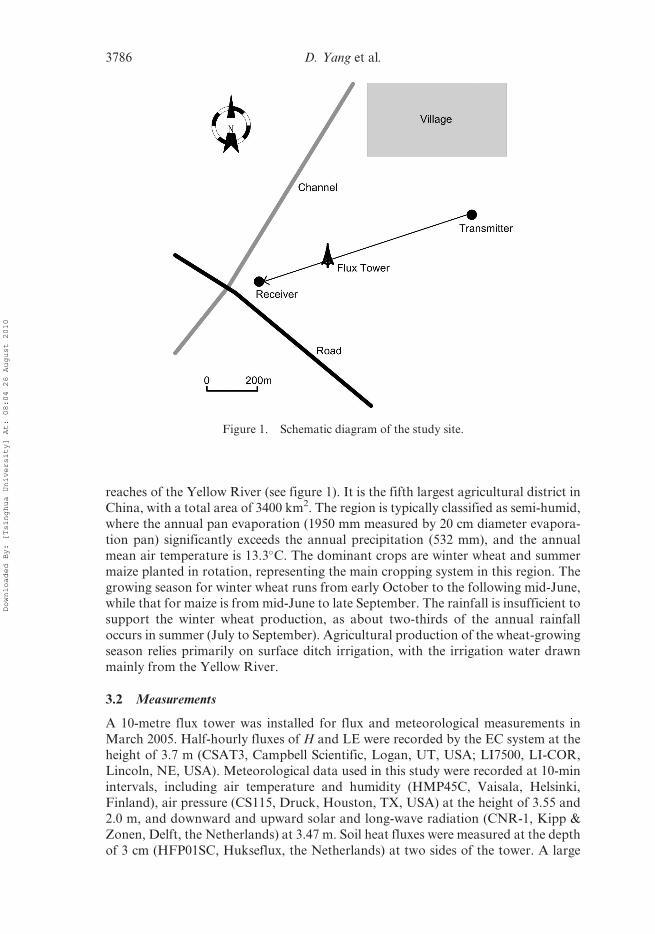
reaches of the Yellow River (see figure 1). It is the fifth largest agricultural district in
China, with a total area of 3400 km2. The region is typically classified as semi-humid,
where the annual pan evaporation (1950 mm measured by 20 cm diameter evapora-
tion pan) significantly exceeds the annual precipitation (532 mm), and the annual
mean air temperature is 13.3�C. The dominant crops are winter wheat and summer
maize planted in rotation, representing the main cropping system in this region. The
growing season for winter wheat runs from early October to the following mid-June,while that for maize is from mid-June to late September. The rainfall is insufficient to
support the winter wheat production, as about two-thirds of the annual rainfall
occurs in summer (July to September). Agricultural production of the wheat-growing
season relies primarily on surface ditch irrigation, with the irrigation water drawn
mainly from the Yellow River.
3.2 Measurements
A 10-metre flux tower was installed for flux and meteorological measurements in
March 2005. Half-hourly fluxes of H and LE were recorded by the EC system at theheight of 3.7 m (CSAT3, Campbell Scientific, Logan, UT, USA; LI7500, LI-COR,
Lincoln, NE, USA). Meteorological data used in this study were recorded at 10-min
intervals, including air temperature and humidity (HMP45C, Vaisala, Helsinki,
Finland), air pressure (CS115, Druck, Houston, TX, USA) at the height of 3.55 and
2.0 m, and downward and upward solar and long-wave radiation (CNR-1, Kipp &
Zonen, Delft, the Netherlands) at 3.47 m. Soil heat fluxes were measured at the depth
of 3 cm (HFP01SC, Hukseflux, the Netherlands) at two sides of the tower. A large
Figure 1. Schematic diagram of the study site.
3786 D. Yang et al.
Downloaded By: [Tsinghua University] At: 08:04 26 August 2010
aperture scintillometer (LAS) (BLS450, Scintec, Rottenburg, Germany) was set up in
this area in March 2008. The LAS had an aperture size of 0.15 m, and the light source
was a light-emitting diode operating at a peak wavelength of 880 nm. The transmitter
and the receiver were located between two sides of the flux tower at a distance of 878 m
(see figure 1), and erected both with a height of 8.4 m. The optimal transect wasperpendicular to the prevailing wind direction and parallel to the Earth’s surface. The
LAS thus followed a north-east–south-west orientation, as the predominant wind
direction was south by east.
The emitted radiation was scattered by the turbulent medium in the path. The
variance of intensity of received radiation was proportional to the structure parameter
of the refractive index of air, C 2n (Hill 1992), which mainly depended on temperature
fluctuations. The structure parameter of temperature C 2T could be deduced from C 2
n
measurements (Von Randow et al. 2008) as follows:
C2T � C2
n �T2
a
0:78� 10�6P
� �2
1þ 0:03
b
� ��2
; (7)
where P is the air pressure (Pa), and b is the Bowen ratio (H/LE) that provides acorrection for humidity-related scintillations. It is generally believed the factor invol-
ving b can be omitted when it is larger than 0.6 (Chehbouni et al. 1999).
To derive H from C2T, Monin-Obukhov similarity theory relationships are needed
(Von Randow 2008). The similarity relationships used in this study were proposed by
De Bruin et al. (1993). The LAS could only measure C2n, so the estimation of H should
also be aided by air temperature and wind speed obtained from field observations, as
well as the Bowen ratio derived from the EC system.
The canopy height (h) was measured weekly in 2008 at several locations surround-ing the tower. Data were fitted to one curve to represent the typical change of canopy
height during a year. The LAI was determined periodically during wheat- and maize-
growing seasons from 2006 to 2008. Prior to July 2008, the LAI was directly measured
by randomly selecting samples within the cropland. After July 2008, the LAI was
measured by a plant canopy analyser (LAI-2000, LI-COR, Lincoln, NE, USA).
4. Data acquisition and analysis
4.1 Model input
Two datasets were required as inputs to the model. The first dataset consisted of land
surface temperature, albedo, and NDVI, which were derived from either daily or
composite MODIS land products. The second dataset included air temperature andhumidity, atmosphere pressure, wind speed at reference height, and downward solar
radiation, which were automatically measured by instruments at the flux tower.
MODIS data were used in the study because of the relatively high temporal
resolution (daily to 16 days) and acceptable spatial resolution (250 m to 1000 m).
MODIS data used in this study were from 2006 to 2008 and were downloaded from
the NASA Data Center (https://wist.echo.nasa.gov/api/). Broadband surface albedo
was derived from seven shortwave channels using Liang’s (2000) method, and NDVI
was calculated from MODIS 250-m resolution images for the red and near-infraredbands (Huete et al. 2002). Land surface temperature and emissivity were retrieved
from 1-km resolution brightness temperature in MODIS band 31 and 32. Collection 5
data including MOD09GA, MOD11A1, MOD09Q1 onboard the Terra satellite, and
Satellite-based observations of hydrological processes 3787
Downloaded By: [Tsinghua University] At: 08:04 26 August 2010
corresponding MYD products onboard the Aqua satellite were used in this study (Yi
et al. 2008). Descriptions of these products can be found from the MODIS website
(http://modis-land.gsfc.nasa.gov/). The images were re-projected from the Sinusoidal
(SIN) projection into the Universal Transverse Mercator (UTM) projection and the
resample resolution was 1 km. Images with heavy cloud cover were removed accord-ing to the quality flags in the datasets.
4.2 Uncertainty in flux measurements
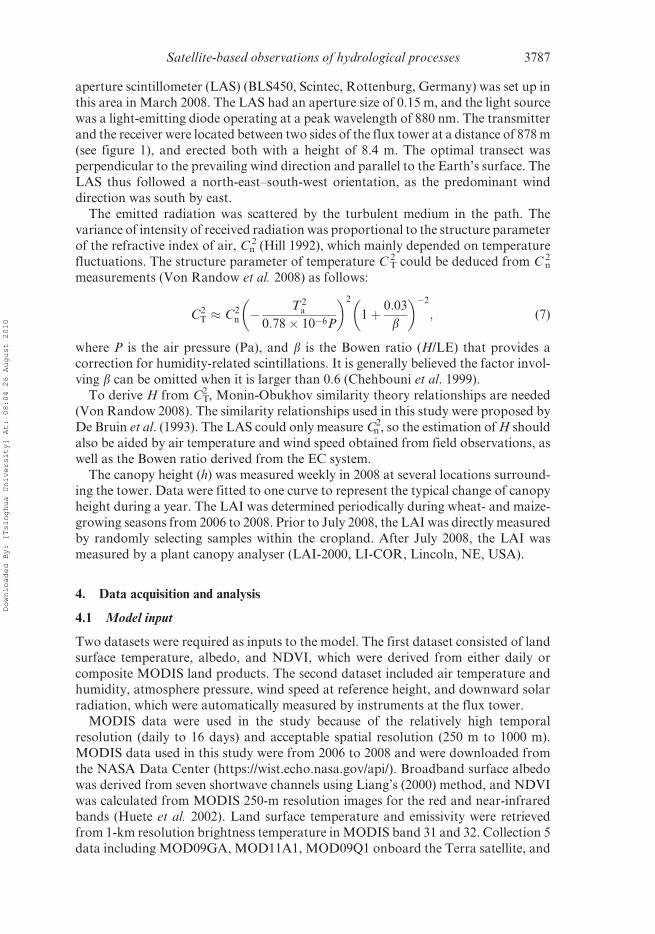
The EC system was used to provide surface validation data for evaluating the remote
sensing model (Lei and Yang 2010). Using half-hour data in 2008, the slope between
the available energy flux (Rn – G0) and the sum of H and LE fluxes at the flux tower
site was 0.74, with a determination coefficient (r2) of 0.86 (see figure 2). The slope forthe wheat-growing season (from March to May) was 0.76, slightly higher than that for
the maize-growing season (from July to September), at 0.73. The energy balance
closure indicated that the EC measurements might underestimate H and/or
LE. Similar energy-imbalance issues were also reported using other EC measurements
(Wilson et al. 2002, Li et al. 2005a). Possible causes of observed energy imbalances
include instrumental effects, advection influence, and heterogeneity of the landscape
(Wilson et al. 2002, Li and Yu 2007, Foken 2008). Imbalance may also be partly
attributable to the G0 measurements at this site. The G0 showed a high spatialvariability, with mean values of G0/Rn at 0.07 and 0.16 at the two observation points.
Twine et al. (2000) suggested two methods to enforce energy balance closure. The
first method assumes that measurements of H are reliable. LE is then corrected as a
residual of the energy balance (RE method). Another method assumes that both H
and LE are under-measured, and they are corrected by the measured Rn and Bowen
ratio, which are assumed to be reliable (BR method). Because no consensus has yet
been reached regarding this energy balance closure issue in EC measurements, further
analysis is still needed to reduce the uncertainty in flux measurements.
Figure 2. Linear regression between the available energy flux (Rn – G0) and the sum of sensibleand latent heat (LE þ H).
3788 D. Yang et al.
Downloaded By: [Tsinghua University] At: 08:04 26 August 2010
5. Results and discussion
5.1 Validation of the model using ground observation data
To evaluate the model without the effect of potential uncertainties from remote
sensing data, intensive ground observational data were used as inputs to validatethe model. Half-hourly ground observations during daytime (from 9 a.m. to 4 p.m.) in
2007, including surface temperature and albedo, were used to drive the model.
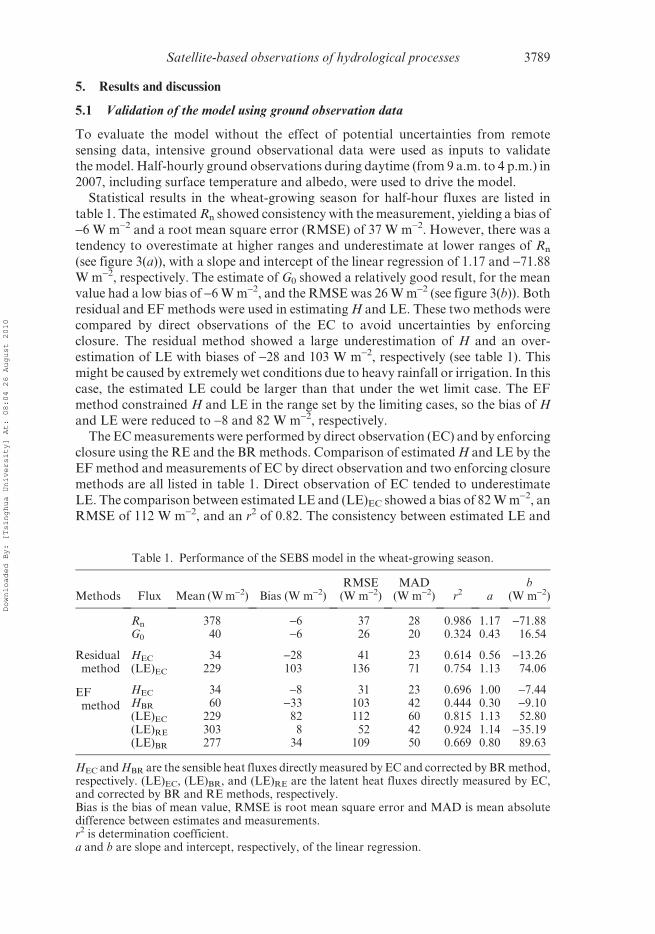
Statistical results in the wheat-growing season for half-hour fluxes are listed in
table 1. The estimated Rn showed consistency with the measurement, yielding a bias of
-6 W m-2 and a root mean square error (RMSE) of 37 W m-2. However, there was a
tendency to overestimate at higher ranges and underestimate at lower ranges of Rn
(see figure 3(a)), with a slope and intercept of the linear regression of 1.17 and -71.88
W m-2, respectively. The estimate of G0 showed a relatively good result, for the meanvalue had a low bias of -6 W m-2, and the RMSE was 26 W m-2 (see figure 3(b)). Both
residual and EF methods were used in estimating H and LE. These two methods were
compared by direct observations of the EC to avoid uncertainties by enforcing
closure. The residual method showed a large underestimation of H and an over-
estimation of LE with biases of -28 and 103 W m-2, respectively (see table 1). This
might be caused by extremely wet conditions due to heavy rainfall or irrigation. In this
case, the estimated LE could be larger than that under the wet limit case. The EF
method constrained H and LE in the range set by the limiting cases, so the bias of H
and LE were reduced to -8 and 82 W m-2, respectively.
The EC measurements were performed by direct observation (EC) and by enforcing
closure using the RE and the BR methods. Comparison of estimated H and LE by the
EF method and measurements of EC by direct observation and two enforcing closure
methods are all listed in table 1. Direct observation of EC tended to underestimate
LE. The comparison between estimated LE and (LE)EC showed a bias of 82 W m-2, an
RMSE of 112 W m-2, and an r2 of 0.82. The consistency between estimated LE and
Table 1. Performance of the SEBS model in the wheat-growing season.
Methods Flux Mean (W m-2) Bias (W m-2)RMSE
(W m-2)MAD
(W m-2) r2 ab
(W m-2)
Rn 378 -6 37 28 0.986 1.17 -71.88G0 40 -6 26 20 0.324 0.43 16.54
Residualmethod
HEC 34 -28 41 23 0.614 0.56 -13.26(LE)EC 229 103 136 71 0.754 1.13 74.06
EFmethod
HEC 34 -8 31 23 0.696 1.00 -7.44HBR 60 -33 103 42 0.444 0.30 -9.10(LE)EC 229 82 112 60 0.815 1.13 52.80(LE)RE 303 8 52 42 0.924 1.14 -35.19(LE)BR 277 34 109 50 0.669 0.80 89.63
HEC and HBR are the sensible heat fluxes directly measured by EC and corrected by BR method,respectively. (LE)EC, (LE)BR, and (LE)RE are the latent heat fluxes directly measured by EC,and corrected by BR and RE methods, respectively.Bias is the bias of mean value, RMSE is root mean square error and MAD is mean absolutedifference between estimates and measurements.r2 is determination coefficient.a and b are slope and intercept, respectively, of the linear regression.
Satellite-based observations of hydrological processes 3789
Downloaded By: [Tsinghua University] At: 08:04 26 August 2010
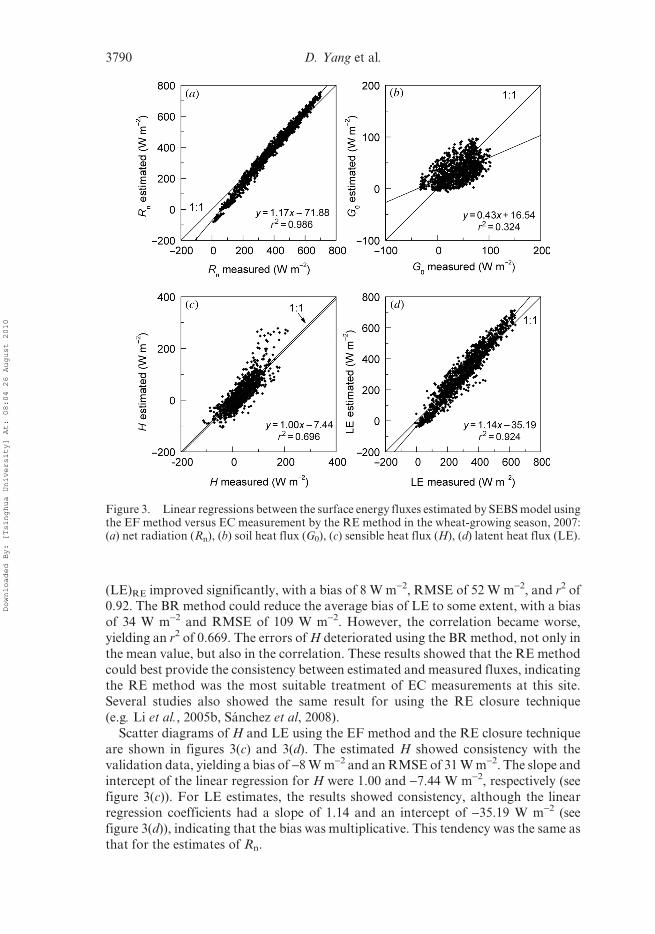
(LE)RE improved significantly, with a bias of 8 W m-2, RMSE of 52 W m-2, and r2 of
0.92. The BR method could reduce the average bias of LE to some extent, with a bias
of 34 W m-2 and RMSE of 109 W m-2. However, the correlation became worse,
yielding an r2 of 0.669. The errors of H deteriorated using the BR method, not only in
the mean value, but also in the correlation. These results showed that the RE method
could best provide the consistency between estimated and measured fluxes, indicatingthe RE method was the most suitable treatment of EC measurements at this site.
Several studies also showed the same result for using the RE closure technique
(e.g. Li et al., 2005b, Sanchez et al, 2008).
Scatter diagrams of H and LE using the EF method and the RE closure technique
are shown in figures 3(c) and 3(d). The estimated H showed consistency with the
validation data, yielding a bias of -8 W m-2 and an RMSE of 31 W m-2. The slope and
intercept of the linear regression for H were 1.00 and -7.44 W m-2, respectively (see
figure 3(c)). For LE estimates, the results showed consistency, although the linearregression coefficients had a slope of 1.14 and an intercept of -35.19 W m-2 (see
figure 3(d)), indicating that the bias was multiplicative. This tendency was the same as
that for the estimates of Rn.
Figure 3. Linear regressions between the surface energy fluxes estimated by SEBS model usingthe EF method versus EC measurement by the RE method in the wheat-growing season, 2007:(a) net radiation (Rn), (b) soil heat flux (G0), (c) sensible heat flux (H), (d) latent heat flux (LE).
3790 D. Yang et al.
Downloaded By: [Tsinghua University] At: 08:04 26 August 2010
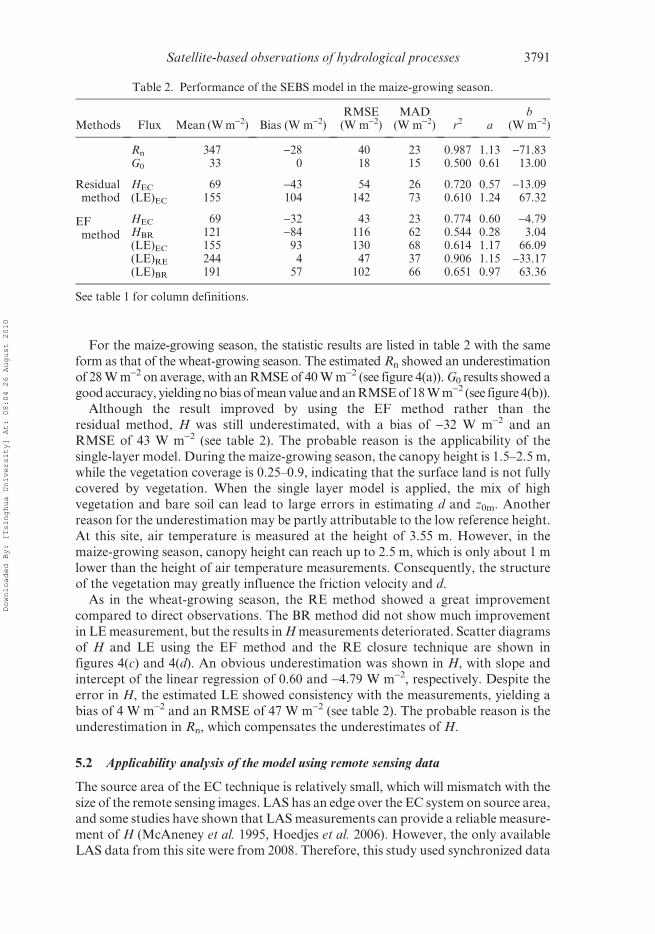
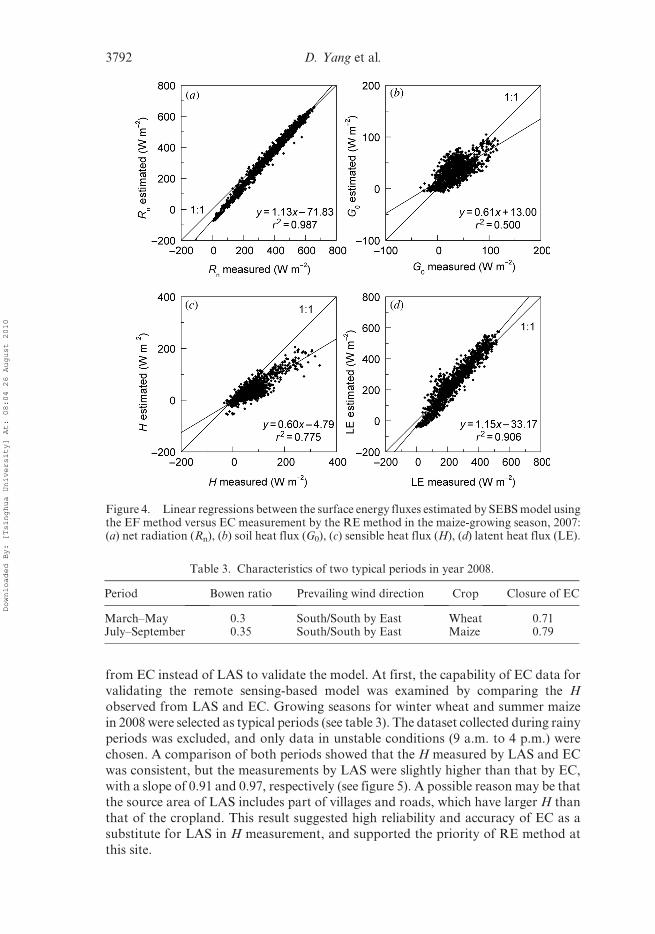
For the maize-growing season, the statistic results are listed in table 2 with the same
form as that of the wheat-growing season. The estimated Rn showed an underestimation
of 28 W m-2 on average, with an RMSE of 40 W m-2 (see figure 4(a)). G0 results showed agood accuracy, yielding no bias of mean value and an RMSE of 18 W m-2 (see figure 4(b)).
Although the result improved by using the EF method rather than the
residual method, H was still underestimated, with a bias of -32 W m-2 and an
RMSE of 43 W m-2 (see table 2). The probable reason is the applicability of the
single-layer model. During the maize-growing season, the canopy height is 1.5–2.5 m,
while the vegetation coverage is 0.25–0.9, indicating that the surface land is not fully
covered by vegetation. When the single layer model is applied, the mix of high
vegetation and bare soil can lead to large errors in estimating d and z0m. Anotherreason for the underestimation may be partly attributable to the low reference height.
At this site, air temperature is measured at the height of 3.55 m. However, in the
maize-growing season, canopy height can reach up to 2.5 m, which is only about 1 m
lower than the height of air temperature measurements. Consequently, the structure
of the vegetation may greatly influence the friction velocity and d.
As in the wheat-growing season, the RE method showed a great improvement
compared to direct observations. The BR method did not show much improvement
in LE measurement, but the results in H measurements deteriorated. Scatter diagramsof H and LE using the EF method and the RE closure technique are shown in
figures 4(c) and 4(d). An obvious underestimation was shown in H, with slope and
intercept of the linear regression of 0.60 and -4.79 W m-2, respectively. Despite the
error in H, the estimated LE showed consistency with the measurements, yielding a
bias of 4 W m-2 and an RMSE of 47 W m-2 (see table 2). The probable reason is the
underestimation in Rn, which compensates the underestimates of H.
5.2 Applicability analysis of the model using remote sensing data
The source area of the EC technique is relatively small, which will mismatch with the
size of the remote sensing images. LAS has an edge over the EC system on source area,
and some studies have shown that LAS measurements can provide a reliable measure-
ment of H (McAneney et al. 1995, Hoedjes et al. 2006). However, the only available
LAS data from this site were from 2008. Therefore, this study used synchronized data
Table 2. Performance of the SEBS model in the maize-growing season.
Methods Flux Mean (W m-2) Bias (W m-2)RMSE
(W m-2)MAD
(W m-2) r2 ab
(W m-2)
Rn 347 -28 40 23 0.987 1.13 -71.83G0 33 0 18 15 0.500 0.61 13.00
Residualmethod
HEC 69 -43 54 26 0.720 0.57 -13.09(LE)EC 155 104 142 73 0.610 1.24 67.32
EFmethod
HEC 69 -32 43 23 0.774 0.60 -4.79HBR 121 -84 116 62 0.544 0.28 3.04(LE)EC 155 93 130 68 0.614 1.17 66.09(LE)RE 244 4 47 37 0.906 1.15 -33.17(LE)BR 191 57 102 66 0.651 0.97 63.36
See table 1 for column definitions.
Satellite-based observations of hydrological processes 3791
Downloaded By: [Tsinghua University] At: 08:04 26 August 2010
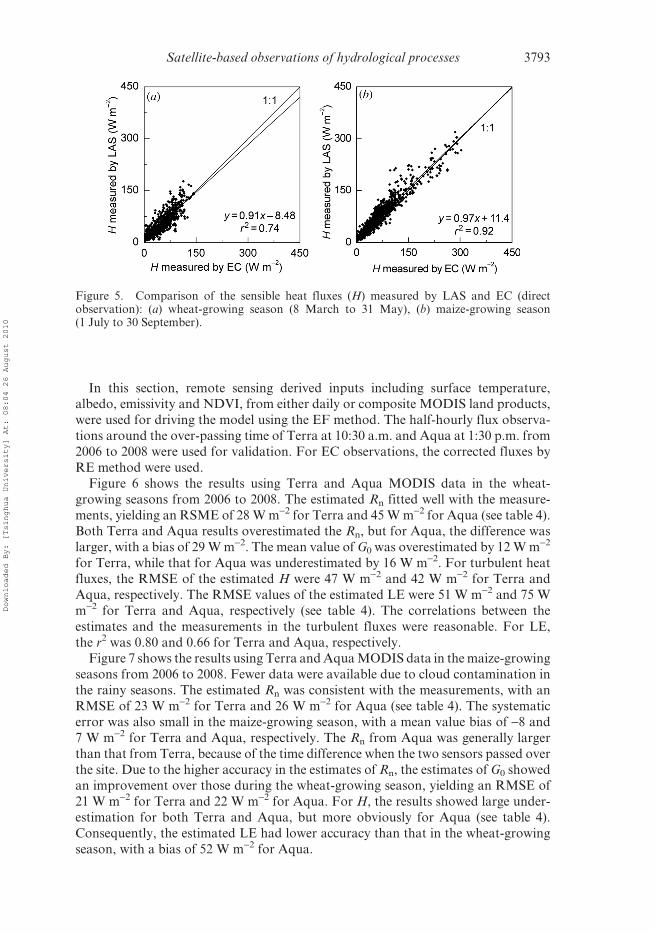
from EC instead of LAS to validate the model. At first, the capability of EC data for
validating the remote sensing-based model was examined by comparing the H
observed from LAS and EC. Growing seasons for winter wheat and summer maize
in 2008 were selected as typical periods (see table 3). The dataset collected during rainy
periods was excluded, and only data in unstable conditions (9 a.m. to 4 p.m.) were
chosen. A comparison of both periods showed that the H measured by LAS and EC
was consistent, but the measurements by LAS were slightly higher than that by EC,
with a slope of 0.91 and 0.97, respectively (see figure 5). A possible reason may be thatthe source area of LAS includes part of villages and roads, which have larger H than
that of the cropland. This result suggested high reliability and accuracy of EC as a
substitute for LAS in H measurement, and supported the priority of RE method at
this site.
Figure 4. Linear regressions between the surface energy fluxes estimated by SEBS model usingthe EF method versus EC measurement by the RE method in the maize-growing season, 2007:(a) net radiation (Rn), (b) soil heat flux (G0), (c) sensible heat flux (H), (d) latent heat flux (LE).
Table 3. Characteristics of two typical periods in year 2008.
Period Bowen ratio Prevailing wind direction Crop Closure of EC
March–May 0.3 South/South by East Wheat 0.71July–September 0.35 South/South by East Maize 0.79
3792 D. Yang et al.
Downloaded By: [Tsinghua University] At: 08:04 26 August 2010
In this section, remote sensing derived inputs including surface temperature,albedo, emissivity and NDVI, from either daily or composite MODIS land products,
were used for driving the model using the EF method. The half-hourly flux observa-
tions around the over-passing time of Terra at 10:30 a.m. and Aqua at 1:30 p.m. from
2006 to 2008 were used for validation. For EC observations, the corrected fluxes by
RE method were used.
Figure 6 shows the results using Terra and Aqua MODIS data in the wheat-
growing seasons from 2006 to 2008. The estimated Rn fitted well with the measure-
ments, yielding an RSME of 28 W m-2 for Terra and 45 W m-2 for Aqua (see table 4).Both Terra and Aqua results overestimated the Rn, but for Aqua, the difference was
larger, with a bias of 29 W m-2. The mean value of G0 was overestimated by 12 W m-2
for Terra, while that for Aqua was underestimated by 16 W m-2. For turbulent heat
fluxes, the RMSE of the estimated H were 47 W m-2 and 42 W m-2 for Terra and
Aqua, respectively. The RMSE values of the estimated LE were 51 W m-2 and 75 W
m-2 for Terra and Aqua, respectively (see table 4). The correlations between the
estimates and the measurements in the turbulent fluxes were reasonable. For LE,
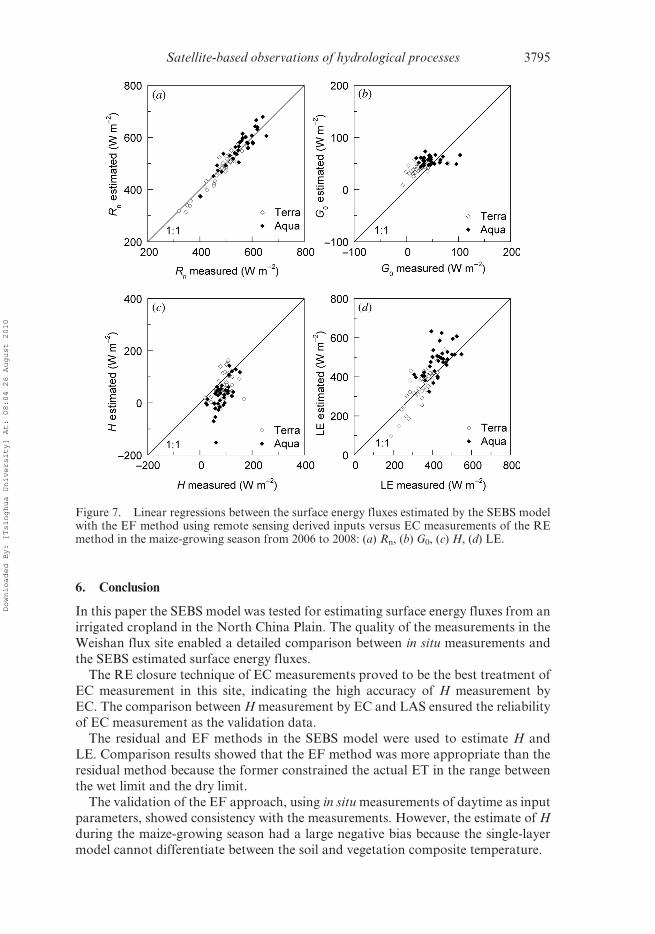
the r2 was 0.80 and 0.66 for Terra and Aqua, respectively.Figure 7 shows the results using Terra and Aqua MODIS data in the maize-growing
seasons from 2006 to 2008. Fewer data were available due to cloud contamination in
the rainy seasons. The estimated Rn was consistent with the measurements, with an
RMSE of 23 W m-2 for Terra and 26 W m-2 for Aqua (see table 4). The systematic
error was also small in the maize-growing season, with a mean value bias of -8 and
7 W m-2 for Terra and Aqua, respectively. The Rn from Aqua was generally larger
than that from Terra, because of the time difference when the two sensors passed over
the site. Due to the higher accuracy in the estimates of Rn, the estimates of G0 showedan improvement over those during the wheat-growing season, yielding an RMSE of
21 W m-2 for Terra and 22 W m-2 for Aqua. For H, the results showed large under-
estimation for both Terra and Aqua, but more obviously for Aqua (see table 4).
Consequently, the estimated LE had lower accuracy than that in the wheat-growing
season, with a bias of 52 W m-2 for Aqua.
Figure 5. Comparison of the sensible heat fluxes (H) measured by LAS and EC (directobservation): (a) wheat-growing season (8 March to 31 May), (b) maize-growing season(1 July to 30 September).
Satellite-based observations of hydrological processes 3793
Downloaded By: [Tsinghua University] At: 08:04 26 August 2010
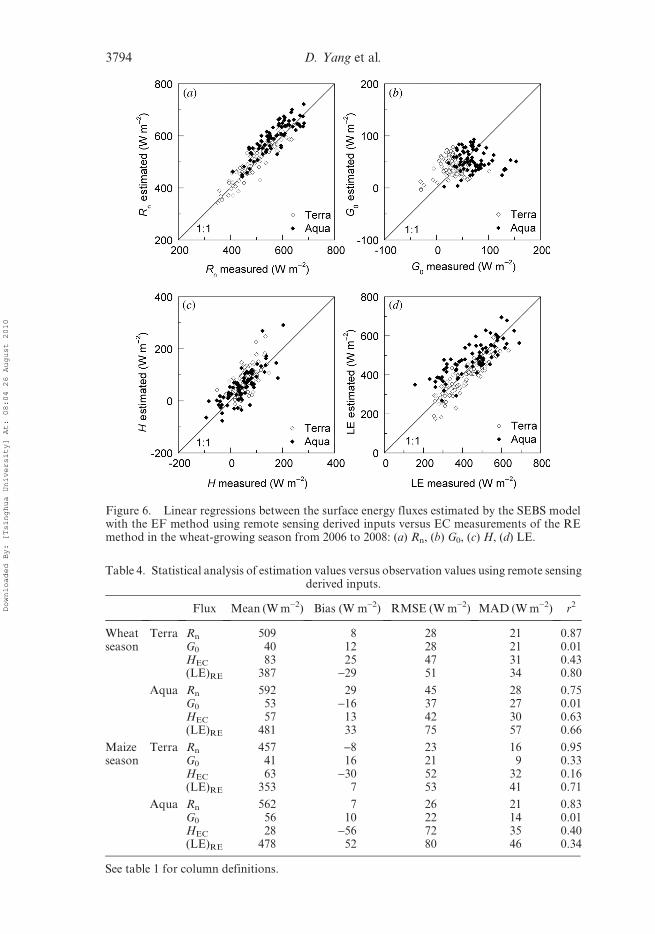
Figure 6. Linear regressions between the surface energy fluxes estimated by the SEBS modelwith the EF method using remote sensing derived inputs versus EC measurements of the REmethod in the wheat-growing season from 2006 to 2008: (a) Rn, (b) G0, (c) H, (d) LE.
Table 4. Statistical analysis of estimation values versus observation values using remote sensingderived inputs.
Flux Mean (W m-2) Bias (W m-2) RMSE (W m-2) MAD (W m-2) r2
Wheatseason
Terra Rn 509 8 28 21 0.87G0 40 12 28 21 0.01HEC 83 25 47 31 0.43(LE)RE 387 -29 51 34 0.80
Aqua Rn 592 29 45 28 0.75G0 53 -16 37 27 0.01HEC 57 13 42 30 0.63(LE)RE 481 33 75 57 0.66
Maizeseason
Terra Rn 457 -8 23 16 0.95G0 41 16 21 9 0.33HEC 63 -30 52 32 0.16(LE)RE 353 7 53 41 0.71
Aqua Rn 562 7 26 21 0.83G0 56 10 22 14 0.01HEC 28 -56 72 35 0.40(LE)RE 478 52 80 46 0.34
See table 1 for column definitions.
3794 D. Yang et al.
Downloaded By: [Tsinghua University] At: 08:04 26 August 2010
6. Conclusion
In this paper the SEBS model was tested for estimating surface energy fluxes from anirrigated cropland in the North China Plain. The quality of the measurements in the
Weishan flux site enabled a detailed comparison between in situ measurements and
the SEBS estimated surface energy fluxes.
The RE closure technique of EC measurements proved to be the best treatment of
EC measurement in this site, indicating the high accuracy of H measurement by
EC. The comparison between H measurement by EC and LAS ensured the reliability
of EC measurement as the validation data.
The residual and EF methods in the SEBS model were used to estimate H andLE. Comparison results showed that the EF method was more appropriate than the
residual method because the former constrained the actual ET in the range between
the wet limit and the dry limit.
The validation of the EF approach, using in situ measurements of daytime as input
parameters, showed consistency with the measurements. However, the estimate of H
during the maize-growing season had a large negative bias because the single-layer
model cannot differentiate between the soil and vegetation composite temperature.
Figure 7. Linear regressions between the surface energy fluxes estimated by the SEBS modelwith the EF method using remote sensing derived inputs versus EC measurements of the REmethod in the maize-growing season from 2006 to 2008: (a) Rn, (b) G0, (c) H, (d) LE.
Satellite-based observations of hydrological processes 3795
Downloaded By: [Tsinghua University] At: 08:04 26 August 2010
The applicability of the model was explored by means of a comparison between the
measurement of EC and the model estimate driven by MODIS land surface products.
The model performed much better during the wheat-growing season than during the
maize-growing season. As a result, relative error in the estimate of LE was within 20%,
either in the wheat-growing season or in the maize-growing season, indicating that theapplicability of the model using remote sensing data in the estimation of ET is acceptable.
Acknowledgements
This research was supported by the National 973 Project of China (2006CB403405)
and the National Natural Science Founding Projects of China (50939004).
References
ALLEN, R.G., TASUMI., M. and TREZZA, L., 2007a, Satellite-based energy balance for Mapping
Evapotranspiration with Internalized Calibration (METRIC)—Model. Journal of
Irrigation and Drainage Engineering-ASCE, 133, pp. 380–394.
ALLEN, R.G., TASUMI, M., MORSE, A., TREZZA, R., WRIGHT, J.L., BASTIAANSSEN, W., KRAMBER,
W., LORITE, I. and ROBINSON, C.W., 2007b, Satellite-based energy balance for Mapping
Evapotranspiration with Internalized Calibration (METRIC)—Applications. Journal
of Irrigation and Drainage Engineering-ASCE, 133, pp. 395–406.
BASTIAANSSEN, W.G.M., 2000, SEBAL-based sensible and latent heat fluxes in the irrigated
Gediz Basen, Turkey. Journal of Hydrology, 229, pp. 87–100.
BASTIAANSSEN, W.G.M., MENENTI, M., FEDDES, R.A. and HOLTSLAG, A.A.M., 1998, A remote
sensing surface energy balance algorithm for land (SEBAL):1. Formulation. Journal of
Hydrology, 212–213, pp. 198–212.
BROWN, K.W. and ROSENBERG, N.J., 1973., A resistance model to predict evapotranspiration
and its application to a sugar beet field. Agronomy Journal, 65, pp. 341–347.
BRUTSAERT, W., 1975, On a derivable formula for long-wave radiation from clear skies. Water
Resources Research, 11, pp. 742–744.
CAI, X., 2008, Water stress, water transfer and social equity in Northern China-Implications for
policy reforms. Journal of Environmental Management, 87, pp. 14–25.
CHEHBOUNI, A., KERR, Y.H., WATTS, C., HARTOGENSIS, O., SCOTT, R., SCHIELDGE, J., LEE, K.,
SHUTTLEWORTH, W.J., DEDIEU, G. and DE BRUIN, H.A.R., 1999, Estimation of area-
average sensible heat flux using a large-aperture scintillometer during the Semi-Arid
Land-Surface-Atmosphere (SALSA) experiment. Water Resources Research, 35,
pp. 2505–2511.
CHOUDHURY, B.J. and MONTEITH, J.L., 1988, A four-layers model for the heat budget of homo-
geneous land surfaces. Quarterly Journal of the Meteorological Society, 114, pp. 373–398.
CHOUDHURY, B.J., REGINATO, R.J. and IDSO, S.B., 1986, An analysis of infrared temperature
observations over wheat and calculation of latent heat flux. Agriculture Forest
Meteorology, 37, pp. 75–88.
DE BRUIN, H.A.R, KOSHIEK, W. and VAN DEN HURK, B.J.J.M., 1993, A verification of some
methods to determine the fluxes of momentum, sensible heat and water vapor using
standard deviation and structure parameter of scalar meteorological quantities.
Boundary-Layer Meteorology, 63, pp. 231–257.
FOKEN, T., 2008, The energy balance closure problem: an overview. Ecological Applications, 18,
pp. 1351–1367.
FRENCH, A.N., JACOB, F., ANDERSON, M.C., KUSTAS, W.P., TIMMERMANS, W., GIESKE, A., SU, Z.,
SU, H., MCCABE, M.F., LI, F., PRUEGER, J. and BRUNSELL, N., 2005, Surface energy fluxes
with the Advanced Spaceborne Thermal Emission and Reflection radiometer (ASTER)
at the Iowa 2002 SMACEX site (USA). Remote Sensing of Environment, 99, pp. 55–65.
3796 D. Yang et al.
Downloaded By: [Tsinghua University] At: 08:04 26 August 2010
GLENN, E.P., HUETE, A.R., NAGLER, P.L., HIRSCHBOECK, K.K. and BROWN, P., 2007, Review:
integrating remote sensing and ground methods to estimate evapotranspiration.
Critical Reviews in Plant Science, 26, pp. 139–168.
GOWDA, P.H., CHAVEZ, J.L, COLAIZZI, P.D., EVETTE, S.R., HOWELL, T.A. and TOLK, J.A., 2008,
ET mapping for agricultural water management: present status and challenges.
Irrigation Science, 26, pp. 223–237.
HATFIELD, J.L., REGINATO, R.J. and IDSO, S.B., 1984, Evaluation of canopy temperature-
evapotranspiration models over various crops. Agricultural and Forest Meteorology,
32, pp. 41–53.
HILL, R.J., 1992, Review of optical scintillation methods of measuring the refractive-index
spectrum, inner scale and surface fluxes. Waves in Random Media, 2, pp. 179–201.
HOEDJES, J.C.B., CHEHBOUNI, A., EZZAHAR, Z., ESCADAFAL, R. and DE BRUIN, H.A.R., 2006,
Comparison of large aperture scintillometer and eddy covariance measurements: can
thermal infrared data be used to capture footprint-induced differences. Journal of
Hydrometeorology, 8, pp. 144–159.
HUETE, A., DIDAN, K., MIURA, T., RODRIGUEZ, E.P., GAO, X. and FERREIRA, L.G., 2002,
Overview of the radiometric and biophysical performance of the MODIS vegetation
indices. Remote Sensing of Environment, 83, pp. 195–213.
JACKSON, R.D., IDSO, S.B., REGINATO, R.J. and PINTER, P.J., 1981, Canopy temperature as a
crop water-stress indicator. Water Resource Research, 17, pp. 1133–1138.
JIA, L., SU, Z., VAN DEN HURK, B., MENENTI, M., MOENE, A., DE BRUIN, H.A.R., YRISARRY,
J.J.B., IBANEZ, M. and CUESTA, A., 2003, Estimation of sensible heat flux using the
Surface Energy Balance System (SEBS) and ATSR measurements. Physics and
Chemistry of the Earth, 28, pp. 75–88.
LEI, H.M. and YANG, D.W., 2010, Seasonal and interannual variations in carbon dioxide
exchange over a cropland in the North China Plain. Global Change Biology, doi:
10.1111/j. 1365–2486. 2009.02136.x.
LI, F., KUSTAS, W.P., PRUEGER, J.H., NEALE, C.M.U. and JACKSON, J.J., 2005a, Utility of remote
sensing based two-source energy balance model under low and high vegetation cover
conditions. Journal of Hydrometeorology, 6, pp. 878–891.
LI, L. and YU, Q., 2007, Quantifying the effects of advection on canopy energy budgets and
water use efficiency in an irrigated wheat field in the North China Plain. Agricultural
Water Management, 89, pp. 116–122.
LI, Z., YU, G., WEN, X. and ZHANG, L., 2005b, Energy balance closure at ChinaFLUX sites.
Science in China Series D: Earth Sciences, 48, pp. 51–62.
LIANG, S., 2000, Narrowband to broadband conversions of land surface albedo I Algorithms.
Remote Sensing of Environment, 76, pp. 213–238.
LOHEIDE II, S.P. and GORELICK, S.M., 2005, A local-scale, high-resolution evapotranspiration
mapping algorithm (ETMA) with hydroecological applications at riparian meadow
restoration sites. Remote Sensing of Environment, 98, pp. 182–200.
MCANENEY, K.J., GREEN, A.E. and ASTILL, M.S., 1995, Large-aperture scintillometry: the
homogeneous case. Agricultural and Frost Meteorology, 76, pp. 149–162.
MENENTI, M. and CHOUDHURY, B.J., 1993, Parameterization of land surface evapotranspiration
using a location-dependent potential evapotranspiration and surface temperature
range. In Exchange Processes at the Land Surface for a Range of Space and Time
Scales, H.J. Bolle, R.A. Feddes and J.D. Kalma, (Eds), pp. 561–568 (Wallingford,
UK: IAHS publications).
NORMAN, J.M., KUSTAS, W.P. and HUMES, K.S., 1995, Source approach for estimating soil and
vegetation energy fluxes in observations of directional radiometric surface temperature.
Agricultural and Forest Meteorology, 77, pp. 263–293.
ROERINK, G.J., SU Z. and MENENTI M., 2000, S-SEBI: a simple remote sensing algorithm to
estimate the surface energy balance. Physical and Chemistry Earth (B), 25, pp. 145–157.
Satellite-based observations of hydrological processes 3797
Downloaded By: [Tsinghua University] At: 08:04 26 August 2010
SANCHEZ, J.M., KUSTAS, W.P., CASELLES, V. and ANDERSON, M.C., 2008, Modelling surface
energy fluxes over maize using a two-source patch model and radiometric soil and
canopy temperature observations. Remote Sensing of Environment, 112, 1130–1143.
SHAW, R.H. and PEREIRA, A.R., 1982, Aerodynamic roughness of a plant canopy: a numerical
experiment. Agriculture Forest Meteorology, 26, pp. 51–65.
SHUTTLEWORTH, W.J. and WALLACE, J.S., 1985, Evaporation from sparse crops—an energy
combination theory. Quarterly Journal of the Meteorological Society, 111, pp. 839–855.
SU Z., 2002, The Surface Energy Balance System (SEBS) for estimation of turbulent heat fluxes.
Hydrology and Earth System Sciences, 6, pp. 85–99.
SU, Z., SCHMUGGE, T., KUSTAS W.P. and MASSMAN, W.J., 2001, An evaluation of two models for
estimation of the roughness height for heat transfer between the land surface and the
atmosphere. Journal of Applied Meteorology, 40, pp. 1933–1951.
TIMMERMANS, W.J., VAN DER KWAST, J., GIESKE, A.S.M., SU, Z., OLIOSO, A., JIA, L. and ELBERS,
J., 2005, Intercomparison of energy flux models using ASTER imagery at the SPARC
2004 site (BARRAX, Spain). In ESA Proceeding WPP-250, SPARC Final Workshop,
4–5 July 2005, (Enschede, The Netherlands: International Institute for Geo-
Information Science and Earth Observation).
TIMMERMANS, W.J., KUSTAS, W.P., ANDERSON, M.C. and FRENCH, A.N., 2007, An intercompar-
ison of the Surface Energy Balance Algorithm for Land (SEBAL) and the Two-Source
Energy Balance (TSEB) modeling schemes. Remote Sensing of Environment, 108,
pp. 369–384.
TWINE, T.E., KUSTAS, W.P., NORMAN, J.M., COOK, D.R., HOUSER, P.R., MEYERS, T.P.,
PRUEGER, J.H., STARKS, P.J. and WESELY, M.L., 2000, Correcting eddy-covariance
flux underestimates over a grassland. Agricultural and Forest Meteorology, 103,
pp. 279–300.
VAN DER KWAST, J., TIMMERMANS, W., GIESKE, A., SU, J., OLIOSO, A., JIA, L., ELBERS, J.,
KARSSENBERG, D. and DE JONG, S., 2009, Evaluation of the Surface Energy Balance
System (SEBS) applied to ASTER imagery with flux-measurements at the SPARC 2004
site (Barrax, Spain). Hydrology and Earth System Sciences, 13, pp. 1337–1347.
VON RANDOW, C., KRUIJT, B., HOLTSLAG, A.A.M. and DE OLIVEIRA, M.B.L., 2008, Exploring
eddy-covariance and large-aperture scintillometer measurements in an Amazonian rain
forest. Agricultural and Forest Meteorology, 148, pp. 680–690.
WANG, E.L., YU, Q., WU, D. and XIA, J., 2008, Climate, agricultural production and hydro-
logical balance in the North China Plain. International Journal of Climatology, 28,
pp. 1959–1970.
WILSON, K., GOLDSTEIN, A., FALGE, E., AUBINET, M., BALDOCCHI, D., BERBIGIER, P., BERNHOFER,
C., CEULEMANS, R., DOLMAN, H., FIELD, C., GRELLE, A., IBROM, A., LAW, B.E.,
KOWALSKI, A., MEYERS, T., MONCRIEFF, J., MONSON, R., OECHEL, W., TENHUNEN, J.,
VALENTINI, R. and VERNA, S., 2002, Energy balance closure at FLUXNET sites.
Agricultural and Forest Meteorology, 113, pp. 223–243.
YANG, D., LI, C., HU, H., LEI, Z., YANG, S., KUSUDA, T., KOIKE, T. and MUSIAKE, K., 2004,
Analysis of water resources variability in the Yellow River of China during the last half
century using historical data. Water Resources Research, 40, W06502, doi: 10.1029/
2003WR002763.
YI, Y., YANG, D., HUANG, J. and CHEN, D., 2008, Evaluation of MODIS surface reflectance
products for wheat leaf area index (LAI) retrieval. ISPRS Journal of Photogrammetry
and Remote Sensing, 63, pp. 661–677.
ZHANG, X., PEI, D. and HU, C., 2003, Conserving groundwater for irrigation in the North China
Plain. Irrigation Science, 21, pp. 159–166.
3798 D. Yang et al.
Downloaded By: [Tsinghua University] At: 08:04 26 August 2010
Related Documents