1 23 Environmental Science and Pollution Research ISSN 0944-1344 Volume 20 Number 3 Environ Sci Pollut Res (2013) 20:1396-1412 DOI 10.1007/s11356-012-1099-2 Seasonal variation of pharmaceutically active compounds in surface (Tagus River) and tap water (Central Spain) Y. Valcárcel, S. González Alonso, J. L. Rodríguez-Gil, A. Castaño, J. C. Montero, J. J. Criado-Alvarez, I. J. Mirón & M. Catalá

Welcome message from author
This document is posted to help you gain knowledge. Please leave a comment to let me know what you think about it! Share it to your friends and learn new things together.
Transcript

1 23
Environmental Science and PollutionResearch ISSN 0944-1344Volume 20Number 3 Environ Sci Pollut Res (2013)20:1396-1412DOI 10.1007/s11356-012-1099-2
Seasonal variation of pharmaceuticallyactive compounds in surface (Tagus River)and tap water (Central Spain)
Y. Valcárcel, S. González Alonso,J. L. Rodríguez-Gil, A. Castaño,J. C. Montero, J. J. Criado-Alvarez,I. J. Mirón & M. Catalá

1 23
Your article is protected by copyright and
all rights are held exclusively by Springer-
Verlag. This e-offprint is for personal use only
and shall not be self-archived in electronic
repositories. If you wish to self-archive your
work, please use the accepted author’s
version for posting to your own website or
your institution’s repository. You may further
deposit the accepted author’s version on a
funder’s repository at a funder’s request,
provided it is not made publicly available until
12 months after publication.

RESEARCH ARTICLE
Seasonal variation of pharmaceutically active compoundsin surface (Tagus River) and tap water (Central Spain)
Y. Valcárcel & S. González Alonso & J. L. Rodríguez-Gil &A. Castaño & J. C. Montero & J. J. Criado-Alvarez &
I. J. Mirón & M. Catalá
Received: 4 April 2012 /Accepted: 16 July 2012 /Published online: 31 July 2012# Springer-Verlag 2012
Abstract Numerous studies have shown the presence ofpharmaceutically active compounds (PhACs) in differentenvironmental compartments, for example, in surface wateror wastewater ranging from nanograms per litre to micro-grams per litre. Likewise, some recent studies have pointedto seasonal variability, thus indicating that PhAcs concen-trations in the aquatic environment may depend on the timeof year. This work intended to find out (1) whether Tagusfluvial and drinking water were polluted with differentgroups of PhACs and (2) if their concentrations differedbetween winter and summer seasons. From the 58 substan-ces analysed, 41 were found belonging to the main thera-peutic groups. Statistical differences were seen forantibacterials, antidepressants, anxiolytics, antiepileptics,and cardiovascular drugs, with higher concentrations beingdetected in winter than in summer. These results mightindicate that the PhACs analysed in this study undergo
lower environmental degradation in winter than in summer.In order to confirm these initial results, a continuous mon-itoring should be performed especially on those PhACs thateither because of an elevated consumption or an intrinsicchemical persistence are poorly degraded during wintermonths due to low temperatures and solar irradiation. It isespecially important to identify which of these specificPhACs are in order to recommend their substitution byequally effective and safe substances but also environmen-tally friendly.
Keywords Pharmaceuticals . Seasonal variation . Surfacewater . Drinking water . Mediterranean region . Spain
AbbreviationsDSSTP downstream sewage treatment plantDWTP Drinking water treatment plant
A. CastañoEnvironmental Toxicology Area,National Centre of Environmental Health,Carlos III Health Institute,Majadahonda,Madrid, Spain
J. J. Criado-AlvarezCastilla-La Mancha Health Service (SESCAM),Talavera de la Reina, Toledo, Spain
I. J. MirónPublic Health District of Torrijos,Castilla-La Mancha Regional Health Authority,Avda de la Estacion 102,45500 Torrijos, Toledo, Spain
J. C. MonteroHealth Science Institute of Castilla–La Mancha,Talavera de la Reina, Castile–La Mancha, Spain
Environ Sci Pollut Res (2013) 20:1396–1412DOI 10.1007/s11356-012-1099-2
Responsible editor: Hongwen Sun
Y. Valcárcel (*) : S. G. AlonsoDepartment of Preventive Medicine, Public Health,Immunology and Medical Microbiology,Faculty of Health Science, Rey Juan Carlos University,Avda. Atenas s/n. Alcorcón,28922 Madrid, Spaine-mail: [email protected]
M. CataláDepartment of Biology and Geology,School of Experimental Science & Technology,Rey Juan Carlos University,C/Tulipán s/n. Móstoles,28933 Madrid, Spain
J. L. Rodríguez-GilCentre for Toxicology, School of Environmental Sciences,University of Guelph,Bovey Building, N1G2W1,Guelph, ON, Canada
Author's personal copy

MR Madrid regionPhACs Pharmaceutically active compoundsINE National Statistics Institute (Instituto Nacional de
Estadística)SIGRE Integrated System of Management and Collection
of Packaging and Medicines (Sistema Integradode Gestión y Recogida de Envases yMedicamentos)
RSP River sampling pointCE Centre of Spain
Introduction
The environmental occurrence of pharmaceuticals and theireffects on aquatic ecosystems is a topic that has arisen greatinterest in the scientific community in the past few years.Since the initial studies published in the late 1970s (Higniteand Azarnoff 1977), numerous papers have reported the pres-ence of pharmacologically active compounds (PhACs) (hor-mones, antibacterials, blood–lipid regulators, analgesics/anti-inflammatory agents, antidepressants, antiepileptics, cytotoxicdrugs, antihistamines, etc.) in different environmental com-partments. Low concentrations (in the nanograms per litre tomicrograms per litre range) have been found in surface waters(rivers, lakes and seas), groundwater, sediments and tap water(Richardson and Ternes 2011). However, a better understand-ing of the spatial and temporal variation of this sort of pollu-tants still remains a priority (Lapworth et al. 2012).
Studies in Spain have demonstrated the presence of PhACsin the main north-eastern (Gros et al. 2007; Huerta-Fontela etal. 2007) and western basins (Carballa et al. 2004), as well asin different rivers of Madrid Region (González Alonso et al.2010; Martinez Bueno et al. 2010; Fernandez et al. 2010;Rodriguez-Gil et al. 2010; Valcarcel et al. 2011a,b). Theconcentrations of such compounds are normally in the nano-grams per litre range, although some, such as carbamazepine,ibuprofen or hydrochlorothiazide, are found in the micro-grams per litre range. As these substances are not adequatelydegraded during conventional water treatment, they are notcompletely removed (Carballa et al. 2005; Radjenovic et al.2007) and eventually reach drinking water (Radjenovic et al.2008; Mompelat et al. 2009). The effluent flows from sewagetreatment plants (STPs) are believed to be the main route ofentry of PhACs into the aquatic environment. These com-pounds reach the STPs from two main sources, namely theexcretion of unmetabolized medicines or their metabolites,and the disposal of unused medication down the drain or indomestic garbage (Bound and Voulvoulis 2004). In order toensure correct management of such waste, the Spanish phar-maceutical industry created Sistema Integrado de Gestión yRecogida de Envases yMedicamentos (SIGRE), an integratedsystem for selective drug collection. In 2009, SIGRE collected
a total of 123,935 kg of waste drugs in the AutonomousCommunity of Castile–La Mancha, with 38,844 kg beingcollected in Toledo province. However, in light of the highconsumption rate for pharmaceuticals in Spain, which rankseighth in the world in terms of pharmaceutical prescriptionrates, various studies have suggested that the reported quanti-ties are totally insufficient (Glassmeyer et al. 2009).
The present study focuses on the Tagus River, the longestriver in the Iberian Peninsula, and one of the most importantriver basins in the western Mediterranean area. Furthermore,several studies have indicated that the level of PhACsmay varydepending on the climatic conditions (Kolpin et al. 2004; Choiet al. 2008), an effect that could be enhanced in semiarid zoneswhere hydrological cycles are extremely irregular, with severeperiods of drought throughout the year. Although the predic-tion of the effect of global change on the hydrological systemof the western Mediterranean region is complex, recent datademonstrate that there has been a marked reduction in wateravailability in the Tagus basin due to both drought and increas-ing water demand (Lorenzo-Lacruz et al. 2010). This phenom-enon puts the already vulnerable Tagus aquatic environmentsat high risk and suggests the need for an intensive monitoringprogramme in order to protect not only aquatic ecosystems butespecially the quality of drinking water sources.
The aim of this study was to determine the winter–sum-mer seasonal variation of 55 PhACs and three metabolites atdifferent sampling points in the Tagus River basin in Toledoprovince and in the drinking water supply of Talavera de laReina. We also present an estimation of the efficacy withwhich these substances are eliminated by the drinking watertreatment plant at Talavera de la Reina.
Material and methods
Description of the sampling site
The province of Toledo belongs to the AutonomousCommunity of Castile–La Mancha and houses its capital,Toledo. Castile–La Mancha is located in the southern interiorof the Iberian peninsula, occupying the greater part of thesouthern sub-plateau, the vast plain of the Plateau of Castile.According to the official data of the National StatisticsInstitute (INE, January 11, 2008) Castilla–La Mancha has2,043,100 inhabitants in its five provinces. Despite being thethird largest of Spain’s regions by surface area, it is only theninth most populous with 4.42 % of Spain’s population. Thesource of the Tagus is found in the Albarracin mountains(Teruel), and it goes on to cross numerous provinces beforeflowing into the Atlantic at Lisbon (Portugal). The Tagusenters Toledo province directly from Madrid Region (MR),crosses the province in an East–West direction, passingthrough the two main population centres of the province,
Environ Sci Pollut Res (2013) 20:1396–1412 1397
Author's personal copy

namely Talavera de la Reina (88,856 inhabitants) and Toledo(82,291 inhabitants) (INEbase 2009), before moving onthrough Cáceres province (Extremadura) and into Portugal.One of the specific features of this study regards the importanceof monitoring water quality in the Tagus after passing throughthe Madrid region, the most populated area in Spain and one ofthe most densely populated areas in the continental semiaridMediterranean region (6,386,932 inhabitants, INEbase 2009).
The Tagus River was sampled in the dilution area, ap-proximately 100 m downstream from the effluent outflowsof the main STPs in Toledo province and coinciding withpoints of the integrated water quality monitoring network ofTagus River (Table 1). Points at the entry RSP1 (Añover deTajo) and exit RSP5 (Azután) of Tagus in Toledo provincewere also sampled. The main geographical and demographicdata of the region are presented in Fig. 1 (INEbase 2009).
The main drinking water supply areas of Toledo andTalavera de la Reina were selected for our study (RSP6).Grab tap-water samples were taken in public places(Table 2), and a further grab sample was taken from theCazalegas reservoir (Alberche River) close to the inlet of theTalavera de la Reina Water Treatment Plant (Table 1).
Water samples were collected on two dates, namely 24thSeptember 2008 for late summer and 24th February 2009for mid-winter. Grab water samples of both fluvial and tapwater (500 mL) were collected in pre-rinsed amber glassbottles, chilled and sent frozen to the laboratory of analysiswithin the following 24 h.
Procedural blanks and spiked samples were analysed.None of the target compounds were detected in the proce-dural blanks. Spiked samples were determined with goodprecision and recoveries. All samples were spiked with theinternal surrogate standard 13C-phenacetin to compensatefor losses involved in the sample extraction. The limit ofdetection, mean recovery and relative standard deviation ofthe method have been reported elsewhere (Martinez Buenoet al. 2010).
Pharmaceuticals selected
The PhCAs analysed in this study were selected on the basisof several criteria, including interest for environmental andpublic health, high consumption by resident population andavailable techniques for detection. Consequently, 58 PhCAsbelonging to 12 therapeutic groups were analysed in thewater samples (Table 3).
Pharmaceutical analysis
Sample preparation
Preconcentration of the samples prior to chromatographicanalysis was performed by solid-phase extraction (SPE), T
able
1Cod
esof
thesamplingpo
intsandcharacteristicsof
theSTPsmon
itored
Sam
ple
code
Type
ofsample
Receiving
water
body
Sam
pling
locatio
nsNam
eof
STP
upstream
STPeffluent
(m3/year)
Hospitals
Indu
strial
compo
nent
Pop
ulation
equivalent
Real
popu
latio
nserved
Treatment
Water
Sludg
e
RSP1
Fluvial
Taug
usExito
fMadrid
region
––
––
––
–
RSP2
Fluvial
Taug
usTo
ledo
city
CiudadDeTo
ledo
8,76
0,00
0Virgen
delValle
(geriatric
hospital)
andminor
clinics
0%
120,00
075
,000
BAS
d+s
RSP3
Fluvial
Taug
usTo
ledo
Indu
strial
park
Santamaría
dela
Bequerencia
7,30
0,00
0To
ledo
General
Hospital
20–30
%12
0,00
019
,000
TF
d+s
RSP4
Fluvial
Taug
usTalavera
dela
Reina
Talavera
dela
Reina
18,000
,000
Talavera
General
Hospitaland
minor
clinics
20%
126,00
089
,000
BAS
s
RSP5
Reservo
ir(irrigation)
Azutan
reservoir
Azutan
reservoir
––
––
––
––
RSP6
Reservo
ir(drink
ing
water)
Cazalegas
reservoir
Cazalegas
reservoir
––
––
––
––
These
data
wereob
tained
from
thewater
quality
networkof
theTagus
Hyd
rographicCon
federatio
n(http
://www.chtajo.es/redes/calidad/calidad.htm
),ToledoTow
nHallandTalavera
dela
Reina
Tow
nHall(http
://www.aqu
alia.es/talavera)
BASbiolog
ic-activated
slud
ge,TFtertiary
filtration,
danaerobicdigestion,
sspin
drying
1398 Environ Sci Pollut Res (2013) 20:1396–1412
Author's personal copy

using commercial OasisTM HLB cartridges (200 mg, 6 cc)from Waters (Mildford, MA, USA) and an automatedASPEC XL sample processor from Gilson (Villiers-le-Bel,France) for the purpose. The operational procedure has been
described in detail elsewhere (Martinez Bueno et al. 2010).Briefly, the cartridges were preconditioned with MeOH(6 mL) and high-performance liquid chromatography(HPLC)-grade deionised water (5 mL, pH adjusted to 8 with
Table 2 Characteristics of the drinking water samples and their respective treatment plants
Samplecode
Water supplyarea
Sampling site Town Populationserved
Watertreated(m3/day)
Treatments
PO C/F D Fi S
POT1 Toledo city Regionaladministrationsite
TOLEDO 75,000 12,100 Cl2 and/or O3 Aluminiumpolychloride
Dynamic
(pulsator) Sand Cl2POT2 Santa
María de laBequerencia
Pharmacy TOLEDO 19,000 6,600 O3 Aluminiumpolychloride
Static Sand Cl2
POT3 Talavera de laReina
Regionaladministrationsite
TALAVERADE LAREINA
100,000 248,000 Cl2 and activecarbon(partially O3)
DKFLOC WP 310Al2(SO4)3 anionicpolyelectrolite
Static Sand Cl2
The data were obtained from the water quality network of the Tagus Hydrographic Confederation (http://www.chtajo.es/redes/calidad/calidad.htm),Toledo Town Hall and Talavera de la Reina Town Hall (http://www.aqualia.es/talavera)
PO preoxidation, C/F coagulation/floculation, D decantation, Fi filtration, s sterilization
Fig. 1 Map showing the study area and the location of the sampling points
Environ Sci Pollut Res (2013) 20:1396–1412 1399
Author's personal copy

Table 3 Characteristics of the pharmaceuticals analysed
Therapeutic group PhAC CAS Quantification limit (ng/L)
Analgesics, anti-inflammatorydrugs and antipyretics
Anhydrous codeine 76-57-3 125
Diclofenac 15307-86-5 1
Ibuprofen 15687-27-1 7
Indometacin 53-86-1 1
Ketoprofen 22071-15-4 2
Mefenamic acid 61-68-7 2
Naproxen 22204-53-1 14
Paracetamol (acetaminophen) 103-90-2 4
Phenazone (antipyrine) 60-80-0 2
Propyphenazone 479-92-5 1
Salicylic acid 69-72-7 1
Antibacterials Anhydrous azithromycin 83905-01-5 13
Ciprofloxacin 85721-33-1 6
Clarithromycin 81103-11-9 6
Erythromycin 114-07-8 1
Metronidazole 443-48-1 3
Norfloxacin 70458-96-7 10
Ofloxacin 82419-36-1 3
Sulfamethoxazole 723-46-6 1
Tetracycline 60-54-8 23
Trimethoprim 738-70-5 2
Antidepressants Amitriptyline 50-48-6 1
Citalopram (for citalopram hydrobromide) 59729-33-8 1
Clomipramine 303-49-1 2
Fluoxetine (for fluoxetine hydrochloride) 54910-89-3 1
Paroxetine 61869-08-7 2
Venlafaxine 93413-69-5 1
Antiepileptics Carbamazepine 298-46-4 1
Carbamazepine 10,11-epoxidea 36507-30-9 1
Primidone 125-33-7 5
Antihistamines Loratadine 79794-75-5 1
Antineoplastics andimmunosuppressants
Cyclophosphamide 50-18-0 3
Ifosfamide 3778-73-2 1
Anxiolytics, sedatives,hypnotics and antipsychotics
Diazepam 439-14-5 1
Bronchiodilators andanti-asthma drugs
Salbutamol 18559-94-9 1
Cardiovascular drugs Atenolol 29122-68-7 1
Bezafibrate 41859-67-0 1
Clofibrate 637-07-0 3
Fenofibrate 49562-28-9 2
Frusemide (furosemide) 54-31-9 2
Gemfibrozil 25812-30-0 7
Hydrochlorothiazide 58-93-5 7
Metoprolol tartrate 56392-17-7 1
Mevastatin 73573-88-3 3
Nadolol 42200-33-9 1
Pravastatin sodium 81131-70-6 6
Propanolol 525-66-6 1
1400 Environ Sci Pollut Res (2013) 20:1396–1412
Author's personal copy

20 % NH4OH) at a flow rate of 1 mL/min. Aliquots of200 mL of sample (pH adjusted to 8) were then loaded intothe cartridge at a flow rate of 10 mL/min, rinsed with 5 mLof deionised water and finally eluted with 2×4 mL ofMeOH at 1 mL/min. The extracts so obtained were finallyevaporated until almost dryness, reconstituted with 1 mL ofMeOH/water, 10:90 (v/v), filtered, and diluted 1:1 withMeOH/water (10:90) prior to analysis.
Liquid chromatography–QTRAP–mass spectrometry
Analysis of the selected pharmaceuticals was performedby a 3200 quadrupole-ion trap (QTRAP) MS/MS system(Applied Biosystems, Ontario, Canada) using a turboionspray source in positive and negative modes.Separation was performed in an Agilent TechnologiesHPLC series 1100, equipped with a reversed-phase C-18analytical column (ZORBAX SB, 250×3.0 mm I.D.;5 μm). For analysis in positive mode, the compoundswere separated using acetonitrile (mobile phase A) andHPLC-grade water with 0.1 % formic acid (mobilephase B) at a flow rate of 0.2 mL/min. A linear gradi-ent progressed from 10 % A to 100 % A in 40 min,after which the mobile phase composition was main-tained at 100 % A for 10 min. The re-equilibration timewas 15 min. Compounds analysed in negative modewere separated using acetonitrile (mobile phase A) andHPLC-grade water (mobile phase B) at a flow rate of0.3 mL/min. LC gradient progressed from 30 % 203 Ato 100 % A in 7 min and was maintained at 100 % Afor 8 min. The re-equilibration time was 10 min. Theinjection volume was 20 μL in both modes. Specificoperational conditions were optimised and have beendescribed elsewhere (Martinez Bueno et al. 2010).
Statistics
PhAC concentrations were analysed by computing indi-ces of central tendency and dispersion (minimum andmaximum) as well as the 90th percentile. The first valueabove the limit of quantification was considered theminimum value, and only values above the limit ofquantification were used for median and mean calcula-tion. Non-parametric statistical techniques were used forthis study. These methods are appropriate because thedata did not exhibit normal distributions and because ofthe presence of censored data (concentrations below theanalytical limits of quantification). The limit of quanti-fication value was used for censored data (Focazio et al.2008). The Wilcoxon matched pair signed rank test wasused to test for differences in the medians of twogroups. p values <0.05 were considered statisticallysignificant throughout the analysis. The statistical anal-ysis of data was performed using the Data Analysis andStatistical Software (STATA, version 10).
Average percent removal by drinking water treatment
The average percent removal by the Talavera de laReina Drinking Water Treatment Plant (DWTP) wascalculated for the PhACs detected using the formula[1– (Tw/R)×100] (Stackelberg et al. 2007), where Tw isthe concentration in tap water (POT3), and R is theconcentration in the reservoir water (Cazalegas, RSP6).The removal process was considered satisfactory if thetap water concentration in POT3 was below the limit ofquantification. The efficacy of the DWTP was calculat-ed for two seasons, namely summer (September 2008)and winter (February 2009).
Table 3 (continued)
Therapeutic group PhAC CAS Quantification limit (ng/L)
Simvastatin 79902-63-9 8
Sotalol hydrochloride 959-24-0 2
Gastointestinal drugs Famotidine 76824-35-6 5
Lansoprazole 103577-45-3 8
Omeprazole 73590-58-6 1
Ranitidine (for ranitidine hydrochloride) 66357-35-5 2
Local anaesthetics Mepivacaine 96-88-8 2
Stimulants Caffeine 58-08-2 4
Cotinineb 486-56-6 2
Nicotine 54-11-5 4
Paraxanthinec 611-59-6 3
aMetabolite of carbamazepinebMetabolite of caffeinecMetabolite of nicotine
Environ Sci Pollut Res (2013) 20:1396–1412 1401
Author's personal copy

Results
PhAC levels in fluvial samples. Seasonality
Figure 2 shows the total concentration of PhACs detected ateach sampling point in late summer and mid-winter. Thehighest concentration was detected at sampling point RSP2,which corresponds to the discharge from the Ciudad deToledo STP, in mid-winter, followed by RSP1, the entry ofthe Tagus River into Toledo province from the Madridregion, in late summer. The next highest PhACs concentra-tions were obtained at RSP3, which is located downstreamthe discharge of the Santa María de la Bequerencia STP,followed by RSP4 (downstream the discharge of theTalavera de la Reina STP) and finally RSP5 (Azutan reser-voir). A seasonal variation was observed at all river sam-pling points except for RSP1, with the PhAC concentrationbeing higher in winter than in summer. The largest seasonalvariation was found for RSP5. Table 4 summarizes theresults of physical and chemical properties of sample points.
A total of 41 substances were detected in both seasons.Table 5 shows the median, minimum and maximum con-centration of every substance detected and the statisticalsignificance of the summer–winter variability. The highestmedian concentration in late summer corresponded to caf-feine (240 ng/L; range, 14–1558 ng/L), followed by ibupro-fen (500 ng/L; only found at one point), hydrochlorothiazide(179 ng/L; 25–272 ng/L) and naproxen (87 ng/L; 87–262 ng/L). The highest median in mid-winter was foundfor gemfibrozil (437 ng/L; range, 11–966 ng/L), followed bycaffeine (313 ng/L; 196–388 ng/L), atenolol (236 ng/L;
148–265 ng/L), ibuprofen (217 ng/L; 180–267 ng/L) andhydrochlorothiazide (217 ng/L; 165–335 ng/L).
Statistical significant seasonal variations were found fortrimethoprim, venlafaxine, primidone, atenolol, bezafibrate,gemfibrozil, metoprolol, propanolol and sotalol, the concen-trations of which were higher in mid-winter in all casesexcept for venlafaxine. The number of substances found inwinter was also higher than in summer.
As far as the frequency of detection is concerned, 12 sub-stances, namely the analgesics/antipyretics phenazone and pro-pyphenazone, the antibacterial ofloxacin, the antidepressantvenlafaxine, the antiepileptics primidone, carbamazepine andits metabolite carbamazepine 10,11-epoxide, the local anaesthe-tic mepivacaine, the anxiolytic diazepam and all the stimulantsstudied (caffeine, nicotine and cotinine), were found in everysample in late summer (Fig. 3). The substances with the highestconcentrations in summer were caffeine, cotinine and nicotine.
A total of 25 substances were detected in the wintersamples (Fig. 3); ibuprofen, atenolol, gemfibrozil and caf-feine were found in all the winter samples; and hydrochlo-rothiazide was found in 80 % of the samples.
Phenazone, propyphenazone, diazepam, venlafaxine, car-bamazepine, carbamazepine 10,11-epoxide, primidone,mepivacaine, caffeine, nicotine and cotinine were obtainedin all samples in both summer and winter.
An inter-season comparison of the mean concentration foreach therapeutic group is shown in Table 6. Statistically sig-nificant differences (p<0.05) were found for antibacterials/antiprotozoals, antidepressants, antiepileptics, anxiolytics, sed-atives/hypnotics and antipsychotics and cardiovascular drugs,for which higher concentrations were found in winter than in
Fig. 2 Concentrations of the pharmaceuticals and metabolites detected
1402 Environ Sci Pollut Res (2013) 20:1396–1412
Author's personal copy

summer at the selected sampling points. No significant differ-ences were observed for the remaining groups.
Occurrence of PhACs in the water supply
A summary of the results obtained in tap water samples can befound in Table 7. The median nicotine, cotinine and caffeineconcentrations were 15 (range, 7–23), 8 (5–16) and 24.5 ng/L(6–70 ng/L), respectively. Caffeine and cotinine were detectedin all samples in both summer and winter, whereas ketoprofenwas only detected in one summer sample at a concentration of3 ng/L. Although the inter-season differences were not statis-tically significant, higher concentrations were observed inwinter than in summer, with the greatest differences beingobserved for caffeine and nicotine.
Untreated water from the Cazalegas reservoir, the sourcefor the Talavera de la Reina DWTP, was also sampled (RSP6).Along with caffeine, nicotine and cotinine, sulfamethoxazole,paroxetine, carbamazepine and atenolol were also detected.The concentration values are shown in Table 7. The highestconcentrations detected were for caffeine (250 ng/L) andnicotine (164 ng/L). Nicotine, caffeine, carbamazepine andcotinine were detected in both seasons, whereas paroxetineand sulfamethoxazole were found only in summer and winter,respectively. Higher concentrations of all substances detectedwere also found in winter than in summer, except for parox-etine, which was only detected in summer.
Removal of PhACs by the Talavera de la Reina WTP
Figure 4 shows the concentrations of pharmaceuticalsdetected at sampling points POT3 and RSP6, as well asthe percentage removal. A significant reduction in thePhAC concentrations after treatment in the DWTP can beseen. The concentration of the six compounds detected inuntreated water (RSP6) was at least 50 % higher than in tapwater (POT3), with three of them not reaching the detectionlimit in tap water. The average percentage removal by the
DWTP was 72 %, with a minimum of 52 % for cotinine inwinter and a maximum of 89 % for caffeine in summer. Theremoval efficacy therefore seems to be better in summerthan winter, albeit RSP6 winter concentrations are notablylarger in winter.
Discussion
The PhACs found in our study are similar to those found inother studies performed either in Spain, Europe (Togola andBudzinski 2008; Ternes 1998; Bendz et al. 2005; Kasprzyk-Hordern et al. 2008), the USA (Kolpin et al. 2002) orCanada (Metcalfe et al. 2003), where most of the substanceswe analysed were also detected.
In general, the concentrations detected in this study arelower than those reported by other authors in Spain (Gros etal. 2007; González Alonso et al. 2010; Martinez Bueno et al.2010; Fernandez et al. 2010; Valcarcel et al. 2011a).However, the pattern of occurrence of certain pharmaceut-icals is in agreement with the results reported previously byour group in a recent study concerning the occurrence ofanalgesics and medications for cardiovascular pathologies inthe Tagus basin in the Madrid region just before its entryinto Toledo province (Valcarcel et al. 2011a).
Although the concentrations obtained in the presentstudy, which focussed on the Tagus River downstreamMadrid region, are in general fairly low, cardiovasculardrugs, such as the lipid regulators gemfibrozil and hydro-chlorothiazide and the β-blocker atenolol, still show thehighest concentrations. The high concentrations of caf-feine found in both summer and winter should also benoted. In accordance with the results obtained by ourgroup in the Madrid region, the analgesics ibuprofenand naproxen were also found in large concentrations(Valcarcel et al. 2011a). Likewise, all were found at100 % of the sampling points in winter, except forhydrochlorothiazide, which was detected at 80 % of
Table 4 Physical and chemical properties of sample points
Sample Code September 2008 (Summer) February 2009 (Winter)
WT(°C)
pH DO(mg/L)
C(μS/cm)
BOD5(mg O2/L)
TSS (mg/l) WT (°C) pH DO (mg/L) C (μS/cm) BOD5 (mg O2/L) TSS (mg/L)
RSP1 25.6 8.0 8.4 2,503 6 34 8.9 7.4 7.7 1,009 4 38
RSP2 23.1 8.2 8.9 2,361 4 35 8.6 7.5 7.3 1,689 5 35
RSP3 21.9 8.3 8.3 2,428 5 43 8.8 7.5 7.6 1,595 5 46
RSP4 25.4 8.5 9.2 2,519 4 22 8.3 7.1 9.6 786 3 52
RSP5 26.1 8.6 7.9 1,416 4 4 7.9 7.3 9.4 909 5 10
RSP6 23 7.5 7.2 101 3 24 6.8 8.5 12.6 289 3 8
WT water temperature, DO dissolved oxygen, C conductivity, BOD biochemical oxygen demand, TSS total suspended solids
Environ Sci Pollut Res (2013) 20:1396–1412 1403
Author's personal copy

Tab
le5
Seasonalvariability
inthePhA
Cconcentrations
(ng/L):sign
ificantpvalues
(<0.05
)aredisplayedin
italics
SUMMER
WIN
TER
RSP1
RSP2
RSP3
RSP4
RSP5
Range
(min
a –max)
Medianb
RSP1
RSP2
RSP3
RSP4
RSP5
Range
(min
a –max)
Medianb
pvaluec
Analgesics,anti-inflam
matorydrug
sandantip
yretics
Diclofenac
105
2022
<1
<1
22–10
522
117
145
139
48<1
48–14
512
80.07
90
Ibup
rofen
500
<7
<7
<7
<7
500
500
222
180
267
205
217
180–
267
217
–
Indo
methacin
<1
88
2<1
2–8
213
1315
10<1
10–15
130.07
86
Ketop
rofen
<2
1816
6<2
6–18
68
<2
<2
<2
<2
88
–
Mefenam
icAcid
<2
77
<2
<2
77
55
4<2
<2
4–5
50.71
74
Naproxen
<14
185
262
87<14
87–26
287
143
166
148
117
109
109–
166
143
0.60
37
Paracetam
ol(A
cetaminop
hen)
<4
4957
78<4
49–78
4940
2012
83<4
12–83
300.66
38
Phenazone
(Antipyrine)
1622
2461
6215–62
2413
1522
1810
10–22
150.12
29
Propy
phenazon
e9
910
85
5–10
910
910
94
4–10
90.38
21
Salicylic
Acid
7<1
<1
<1
<1
77
<1
<1
<1
<1
<1
––
–
Antibacterials,antip
rotozoals
Clarithromycin
<6
<6
<6
<6
<6
––
3244
1624
1212–64
32–
Erythromycin
<1
<1
<1
<1
<1
––
7787
7661
5959–87
76–
Oflox
acin
44
55
44–5
420
176
6<3
6–20
120.16
36
Sulfametho
xazole
<1
6358
50<1
50–63
5874
6569
6557
57–74
650.08
74
Trimetho
prim
<2
<2
44
<2
44
2729
2412
77–
2924
0.01
89
Metronidazole
<3
119
<3
<3
9–11
1019
710
<3
55–
199
0.42
82
Antidepressants
Citalopram
hydrob
romide
<1
<1
<1
<1
<1
––
108
<1
<1
<1
8–10
9–
Venlafaxine
83
419
33–19
467
8339
7446
39–83
670.00
21
Antiepileptics
Carbamazepine
5550
5356
4112–56
5044
4341
3830
30–44
410.73
94
Carbamazepine10
,11-epox
ide
129
1113
88–13
1110
714
1110
7–14
100.86
62
Primidon
e67
5851
5734
34–67
5752
3842
5228
28–52
420.01
81
Anx
iolytic
sedativ
eshy
pnoticsandantip
sychotics
Diazepam
42
32
22–6
327
5049
73
3–50
270.06
28
Bronchiod
ilators
andanti-asthmadrug
s
Salbu
tamol
<1
2<1
<1
<1
22
<1
<1
<1
<1
<1
––
–
Cardiov
asculardrug
s
Ateno
lol
<1
110
102
64<1
64–110
102
265
242
236
148
152
148–
265
236
0.00
69
Bezafibrate
1611
176
<1
6–17
1414
5115
6346
3434–14
563
0.02
20
Clofibric
acid
<3
1111
7<3
7–11
11<3
11<3
<3
<3
1111
–
Fenofibrate
<2
48
<2
<2
4–8
68
<2
<2
<2
<2
88
–
1404 Environ Sci Pollut Res (2013) 20:1396–1412
Author's personal copy

Tab
le5
(con
tinued)
SUMMER
WIN
TER
RSP1
RSP2
RSP3
RSP4
RSP5
Range
(min
a –max)
Medianb
RSP1
RSP2
RSP3
RSP4
RSP5
Range
(min
a –max)
Medianb
pvaluec
Frusemide(furosem
ide)
51<2
<2
<2
<2
5151
224
7573
<2
<2
73–22
475
–
Gem
fibrozil
320
1113
<7
5111–32
032
437
950
936
348
296
296–
966
437
0.04
29
Hyd
rochlorothiazide
191
179
272
25<7
25–27
217
916
533
526
614
816
816
5–33
521
70.09
70
Metop
rololTartrate
<1
34
4<1
2–4
412
1313
96
6–13
120.00
38
Pravastatin
Sod
ium
2518
27<6
<6
18–27
25<6
6249
2526
25–62
380.16
56
Propano
lol
<1
35
2<1
2–5
311
109
54
4–11
90.01
67
Sotalol
Hyd
rochloride
<2
1010
4<2
4–10
1015
1016
1510
10–16
150.02
78
Gastrointestin
aldrug
s
Fam
otidine
<5
<5
<5
10<5
1010
4037
3111
<5
11–40
34–
Local
Anaesthetics
Mepivacaine
5<2
35
43–5
55
67
54
4–7
50.17
78
Stim
ulants
Nicotine
7014
1159
104
11–10
459
5045
2540
4425–50
440.52
95
Cotinine
157
117
6955
2020–15
769
5029
3340
2828–50
330.09
37
Caffeine
155
826
424
026
214
14–155
824
038
831
319
629
035
519
6–38
831
30.15
92
Paraxanthine
310
072
513
51–10
072
301
8876
9413
276–30
194
0.17
98
aMinim
un:firstvalueabov
ethequ
antificationlim
itbMediancalculated
with
concentrationabov
ethequ
antificationlim
itcWilcon
xonmatched
pairssign
edrank
stest
Environ Sci Pollut Res (2013) 20:1396–1412 1405
Author's personal copy

the sampling points. The detection frequency decreasesin summer (range, 20–60 %).
The ubiquitous detection of the antidepressant venlafax-ine, the antiepileptics carbamazepine and primidone, theanalgesic phenazone and the local anaesthetic mepivacaine
in both summer and winter should also be noted. Althoughthe concentrations were not especially high (especially formepivacaine), the fact that they were detected in everysingle sample indicates that these substances escape sewagewater treatment plants in either season. These results agree
Fig. 3 Frequently detected compounds in surface-water sites in this study in late summer and mid-winter
1406 Environ Sci Pollut Res (2013) 20:1396–1412
Author's personal copy

with our previous studies in the Tagus basin, where venla-faxine and mepivacaine were found in 100 % of samples(González Alonso et al. 2010) (Valcarcel et al. 2011b).These substances may therefore pose an environmental haz-ard and are candidates for inclusion in lists of prioritypollutants.
The four stimulants analysed, namely nicotine, caffeine,paraxanthine and cotinine, were present in all samples andalso proved to be especially persistent. A similar pattern wasfound for the Tagus basin in the Madrid region (Valcarcel etal. 2011b). Although the concentrations found in this studyare lower than those reported in this previous study, they are
nevertheless consistent with the data reported by Fernandezet al. (2010) along the Henares–Jarama–Tagus river systemas well as in other parts of Spain (Huerta-Fontela et al.2008a; Martinez Bueno et al. 2010) and the rest of the world(reviewed by (Buerge et al. 2003).
In general, the number of substances, their concentrationsand frequency of detection were all higher in winter than insummer. This seasonal variation may be related to eithersocietal (production, consumption and excretion) or envi-ronmental factors (solar irradiance, precipitation, tempera-ture, etc.) (Conley et al. 2008). Thus, the high temperatures,increased periods of light and its intensity all contribute tothe environmental degradation of most of these substancesin summer (Vieno et al. 2005). Different studies performedin different geographical areas have also reported higherconcentrations in winter (Vieno et al. 2005; Daneshvar etal. 2010a,b; Sui et al. 2011). A study in Switzerland showedthat during the winter season loads of macrolide antibioticsin STPs were two time higher than in summer (McArdell etal. 2003). The works by Bonvin et al (2011), Conley et al.(2008), Choi et al. (2008), Loraine and Pettigrove (2006) orHua et al. (2006) also analyze the variation of severalpharmaceuticals with regard to seasonality, concluding,however, that concentrations are larger in spring or summer-time. To the best of our knowledge, only three previousstudies, namely those by Fernández et al. (2010) in theHenares–Jarama–Tagus system, Camacho-Muñoz et al. inthe Doñana National Park (Southern Spain) (Camacho-Munoz et al. 2010), and Gracia-Lor et al. in theMediterranean Area of Valencia (Gracia-Lor et al. 2012)have investigated the seasonal variation of pharmaceuticalsin Mediterranean fluvial systems. The first two studiesreported higher concentrations of pharmaceuticals in thesummer period (June–September), and their authors attrib-uted the results to a lesser dilution of wastewater discharges
Table 6 Seasonal variation by therapeutic groups: significant p values(<0.05) are displayed in italics
Therapeutic group Season Mean ±SD p value
Analgesics, anti-inflammatory drugsand antipyretics
Summer 28.15 ±38.82 0.080Winter 39.72 ±50.51
Antidepressants Summer 1.23 ±2.06 0.043Winter 10.9 ±16.97
Antiepileptics Summer 38.33 ±19.07 0.043Winter 30.67 ±13.96
Antibacterian,antiprotozoals
Summer 4.42 ±6.80 0.043Winter 20.14 ±21.91
Anxiolytics, sedatives,hypnotics andantipsychotics
Summer 13 ±0 0.043Winter 136 ±0
Bronchiodilators andanti-asthma drugs
Summer 3 ±0 0.317Winter 0 ±0
Cardiovascular drugs Summer 22.79 ±32.67 0.043Winter 88.66 ±113.72
Gastrointestinal drugs Summer 0.5 ±0.95 0.068Winter 8.8 ±10.84
Stimulants Summer 161.85 ±167.66 0.686Winter 130.85 ±105.91
Table 7 PhAC levels detected in tap water and in Talavera de la Reina’s drinking water Cazalegas reservoir (ng/L)
Therapeutic group PhAC Tap water p value Reservoir
POT1 POT2 POT3 RSP6
Summer Winter Summer Winter Summer Winter Summer Winter
Analgesics, anti-inflammatorydrugs and antipyretics
Ketoprofen <2 <2 <2 <2 3 <2 0.317 <2 <2
Antibacterials Sulfamethoxazole <1 <1 <1 <1 <1 <1 – <1 6
Antidepressants Paroxetine <2 <2 <2 <2 <2 <2 – 5 <2
Antiepileptics Carbamazepine <1 <1 <1 <1 <1 <1 – 3 10
Cardiovascular drugs Atenolol <1 <1 <1 6 <1 <1 0.317 <1 <1
Stimulants Nicotine 17 15 10 7 <4 23 1.000 84 164
Cotinine 10 5 6 16 6 14 0.285 15 29
Caffeine 13 38 9 36 6 70 0.109 55 250
Total 40 58 25 65 15 107 0.109 162 450
Environ Sci Pollut Res (2013) 20:1396–1412 1407
Author's personal copy

and decreased river flow rates in summer. They alsoreported very low concentrations in the winter period(December–February) and proposed that increased rainfalland river flow rates, together with temperature, could beresponsible, whereas in the recent study by Gracia-Lor et al.(2012) seasonal variation was not clearly observed. In spiteof the great deal of studies analysing seasonal variation, it isdifficult to compare them with our data or to address adiscussion due to the enormous diversity in the methodolo-gies chosen and the proposed timing of monitoring.
However, the Tagus basin is strictly regulated upstreamby important reservoirs, and the flow rates remain relativelyconstant throughout the year (Lorenzo-Lacruz et al. 2010).Although the effect of higher environmental and biological
degradation, or even increased STP efficacy, with highersummer temperatures and sun irradiance cannot be ruledout, we believe that the entry of these substances into theenvironment depends largely on the number of medicalprescriptions, and their completion by patients, as well aspopulation habits. The coincidence between the mostdetected therapeutic groups and the most consumed sup-ports this hypothesis.
Stimulant beverages or tobacco seem to be the mostlikely sources for the group of stimulants. The “Databaseof Consumption in Family Homes” (“Base de datos deConsumo en Hogares”, http://www.mapa.es) showed notemporal variation in the consumption of these substancesin Castille–La Mancha. Thus, coffee and tea [the beverages
Fig. 4 Efficacy of the drinkingwater treatment plant atTalavera de la Reina
1408 Environ Sci Pollut Res (2013) 20:1396–1412
Author's personal copy

with highest caffeine content (Barone and Roberts 1996)]were consumed in similar amounts in September 2008 andFebruary 2009 (226,000 and 233,000 kg, respectively).Tobacco (the main nicotine source) was also consumed withequal intensity and frequency and has a stable inter-seasonalpattern of consumption (Infante and Rubio-Colavida 2004).
The difference between summer and winter concentra-tions was found to be significant for antibacterials, antide-pressants, antiepileptics and cardiovascular drugs, which arethe most widely consumed groups of medications in thegeneral population. Indeed, antibiotics are ranked thirdamongst all pharmaceuticals used in human medicine.Furthermore, antidepressants, antipsychotics and antiepilep-tics are some of the top selling pharmaceuticals in retailpharmacies (October 2008), ranking third, fourth and fifthrespectively (IMS Health 2006; http://www.imshealth.com),and in Spain, together with pharmaceuticals for cardiovas-cular pathologies, they are the most prescribed in primaryhealthcare centres (Farmaindustria 2002; Sans et al. 2002).
Antibiotic consumption is clearly seasonal, decreasing insummer and increasing during winter (including March) andOctober (García del Pozo et al. 2004). Likewise, the con-sumption of psychoactive pharmaceuticals is associatedwith seasonal changes, with consumption peaking autumnand spring. Although we did not perform measurements inthese periods, other studies performed in Spain havereported that their use increases in autumn, when both theamount of sunlight and daytime temperatures decrease(Carrasco et al. 2001). A seasonal variability has also beenshown for blood cholesterol and pressure (either for hyper-or normotensive individuals), both of which increase duringthe colder months; therefore, the incidence of cardiovascularpathologies is also higher in winter than in summer, therebyexplaining the higher consumption of cardiovascular drugs(Miguel et al. 2001; Segura 2004) and thus their presence influvial water.
As far as drinking water (tap water) is concerned, con-centrations of the anti-inflammatory ketoprofen, the cardio-vascular atenolol and the stimulants caffeine, nicotine andcotinine were found to be above the detection limit. Severalstudies have reported PhACs from different therapeuticgroups in drinking water (reservoir drinking water, finishedwater after DWTP and tap water) (Mompelat et al. 2009).The present study, together with that published recently byHuerta Fontela et al. (2011), is the first to report the detec-tion of atenolol in drinking water. Both studies reportedsimilar concentrations.
The caffeine concentrations detected were similar tothose reported in other studies in Spain (Huerta-Fontela etal. 2008b), Europe (Togola and Budzinski 2008) and otherparts of the world (Stackelberg et al. 2004, 2007; Wang et al.2011). However, the cotinine concentration is 30 timeslower than that reported by Huerta-Fontela et al. (2008b)
in NE Spain but in the same range as that reported forfinished water (Stackelberg et al. 2004) in the USA andCanada. The nicotine concentration detected in our studywas higher than that reported by Huerta-Fontela et al.(2008b) in finished water. As was the case for river water,higher concentrations were detected in winter than in sum-mer in tap water samples (except for nicotine in POT1 andPOT2), although the seasonality was not statistically signif-icant in this case. However, this may be due to the samplesize as several of the compounds were only found in onesample. The data for caffeine and cotinine are in accordancewith those found for fluvial water; in other words, they werepresent in every sample, at higher concentrations than theother PhACs and the concentrations were higher in winterthan in summer. These findings agree with those reportedrecently by Wang et al. (2011), who found that concentra-tions were generally higher during the winter months than insummer as a result of the high persistence of these com-pounds and their low degradability by either STPs orDWTPs (Mompelat et al. 2009).
RSP6 corresponds to untreated water from the Cazalegasreservoir near the inlet of the Talavera de la Reina DWTP,and eight out of the 58 PhACs (sulfamethoxazole, paroxe-tine, carbamazepine, ketoprofen, atenolol, caffeine, nicotineand cotinine) were detected at this sampling point. Giventhat no STP discharges are known upstream, the source ofthese substances could be the discharge of untreated waste-water from two populations (Serranillos Playa andUrbanización Atalaya del Alberche) located near the reser-voir, as well as its recreational use. The persistency andubiquity of these PhACs in the aqueous environment couldfacilitate their detection. Similar concentrations werereported in drinking water surface reservoirs in Spain(Huerta-Fontela et al. 2008a; Fernandez et al. 2010) andother parts of the world (Heberer 2002; Buerge et al. 2003;Hua et al. 2006; Benotti and Brownawell 2007; Zhang et al.2008; Focazio et al. 2008).
A reduction in the concentration and number of com-pounds was observed upon comparison of the PhACs in tapwater (POT3) after treatment (DWTP) and untreated waterfrom the Cazalegas reservoir (RSP6). This reduction isachieved by removal treatments at the Talavera de la ReinaDWTP, which include ozonation as well as other more con-ventional treatments. These findings are consistent with thosereported in other studies involving water after treatment at aDWTP (Ternes et al. 2002, 2003; Westerhoff et al. 2005;Vieno et al. 2005; Togola and Budzinski 2008; Benotti et al.2009; Hollender et al. 2009; Zimmermann et al. 2011). It isnoteworthy to remark the presence of 3 ng/L of ketoprofen inthe summer drinking water sample (POT3), while this sub-stance is below the limit of detection in the untreated watersample (RSP6). This could be due to the one-off nature of thesampling, which means that the tap water sample could have a
Environ Sci Pollut Res (2013) 20:1396–1412 1409
Author's personal copy
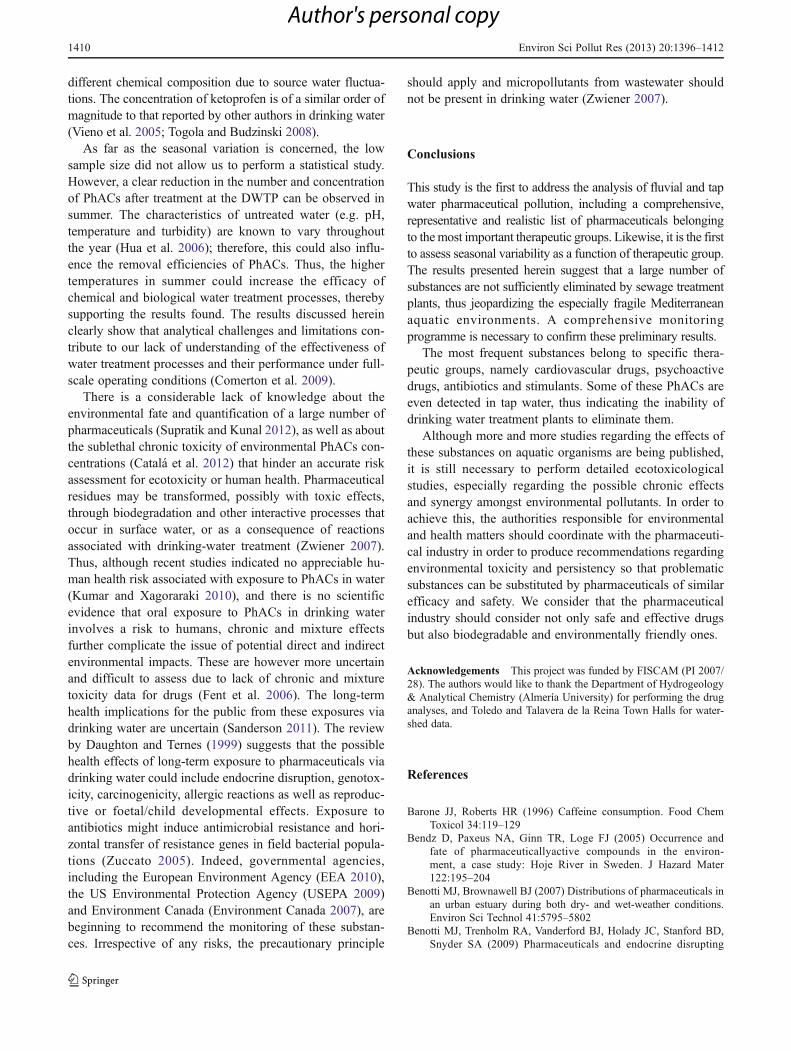
different chemical composition due to source water fluctua-tions. The concentration of ketoprofen is of a similar order ofmagnitude to that reported by other authors in drinking water(Vieno et al. 2005; Togola and Budzinski 2008).
As far as the seasonal variation is concerned, the lowsample size did not allow us to perform a statistical study.However, a clear reduction in the number and concentrationof PhACs after treatment at the DWTP can be observed insummer. The characteristics of untreated water (e.g. pH,temperature and turbidity) are known to vary throughoutthe year (Hua et al. 2006); therefore, this could also influ-ence the removal efficiencies of PhACs. Thus, the highertemperatures in summer could increase the efficacy ofchemical and biological water treatment processes, therebysupporting the results found. The results discussed hereinclearly show that analytical challenges and limitations con-tribute to our lack of understanding of the effectiveness ofwater treatment processes and their performance under full-scale operating conditions (Comerton et al. 2009).
There is a considerable lack of knowledge about theenvironmental fate and quantification of a large number ofpharmaceuticals (Supratik and Kunal 2012), as well as aboutthe sublethal chronic toxicity of environmental PhACs con-centrations (Catalá et al. 2012) that hinder an accurate riskassessment for ecotoxicity or human health. Pharmaceuticalresidues may be transformed, possibly with toxic effects,through biodegradation and other interactive processes thatoccur in surface water, or as a consequence of reactionsassociated with drinking-water treatment (Zwiener 2007).Thus, although recent studies indicated no appreciable hu-man health risk associated with exposure to PhACs in water(Kumar and Xagoraraki 2010), and there is no scientificevidence that oral exposure to PhACs in drinking waterinvolves a risk to humans, chronic and mixture effectsfurther complicate the issue of potential direct and indirectenvironmental impacts. These are however more uncertainand difficult to assess due to lack of chronic and mixturetoxicity data for drugs (Fent et al. 2006). The long-termhealth implications for the public from these exposures viadrinking water are uncertain (Sanderson 2011). The reviewby Daughton and Ternes (1999) suggests that the possiblehealth effects of long-term exposure to pharmaceuticals viadrinking water could include endocrine disruption, genotox-icity, carcinogenicity, allergic reactions as well as reproduc-tive or foetal/child developmental effects. Exposure toantibiotics might induce antimicrobial resistance and hori-zontal transfer of resistance genes in field bacterial popula-tions (Zuccato 2005). Indeed, governmental agencies,including the European Environment Agency (EEA 2010),the US Environmental Protection Agency (USEPA 2009)and Environment Canada (Environment Canada 2007), arebeginning to recommend the monitoring of these substan-ces. Irrespective of any risks, the precautionary principle
should apply and micropollutants from wastewater shouldnot be present in drinking water (Zwiener 2007).
Conclusions
This study is the first to address the analysis of fluvial and tapwater pharmaceutical pollution, including a comprehensive,representative and realistic list of pharmaceuticals belongingto themost important therapeutic groups. Likewise, it is the firstto assess seasonal variability as a function of therapeutic group.The results presented herein suggest that a large number ofsubstances are not sufficiently eliminated by sewage treatmentplants, thus jeopardizing the especially fragile Mediterraneanaquatic environments. A comprehensive monitoringprogramme is necessary to confirm these preliminary results.
The most frequent substances belong to specific thera-peutic groups, namely cardiovascular drugs, psychoactivedrugs, antibiotics and stimulants. Some of these PhACs areeven detected in tap water, thus indicating the inability ofdrinking water treatment plants to eliminate them.
Although more and more studies regarding the effects ofthese substances on aquatic organisms are being published,it is still necessary to perform detailed ecotoxicologicalstudies, especially regarding the possible chronic effectsand synergy amongst environmental pollutants. In order toachieve this, the authorities responsible for environmentaland health matters should coordinate with the pharmaceuti-cal industry in order to produce recommendations regardingenvironmental toxicity and persistency so that problematicsubstances can be substituted by pharmaceuticals of similarefficacy and safety. We consider that the pharmaceuticalindustry should consider not only safe and effective drugsbut also biodegradable and environmentally friendly ones.
Acknowledgements This project was funded by FISCAM (PI 2007/28). The authors would like to thank the Department of Hydrogeology& Analytical Chemistry (Almería University) for performing the druganalyses, and Toledo and Talavera de la Reina Town Halls for water-shed data.
References
Barone JJ, Roberts HR (1996) Caffeine consumption. Food ChemToxicol 34:119–129
Bendz D, Paxeus NA, Ginn TR, Loge FJ (2005) Occurrence andfate of pharmaceuticallyactive compounds in the environ-ment, a case study: Hoje River in Sweden. J Hazard Mater122:195–204
Benotti MJ, Brownawell BJ (2007) Distributions of pharmaceuticals inan urban estuary during both dry- and wet-weather conditions.Environ Sci Technol 41:5795–5802
Benotti MJ, Trenholm RA, Vanderford BJ, Holady JC, Stanford BD,Snyder SA (2009) Pharmaceuticals and endocrine disrupting
1410 Environ Sci Pollut Res (2013) 20:1396–1412
Author's personal copy

compounds in U.S. drinking water. Environ Sci Technol 43:597–603
Bonvin F, Ruthler R, Chève N, Halder J, Kohn T (2011) Spatial andtemporal presence of a wastewater-derived micropollutant plumein Geneva. Environ Sci Technol 45:4702–4709
Bound JP, Voulvoulis N (2004) Pharmaceuticals in the aquatic envi-ronment—a comparison of risk assessment strategies. Chemo-sphere 56:1143–1155
Buerge IJ, Poiger T, Muller MD, Buser HR (2003) Caffeine, ananthropogenic marker for wastewater contamination of surfacewaters. Environ Sci Technol 37:691–700
Camacho-Munoz D, Martin J, Santos JL, Aparicio I, Alonso E (2010)Occurrence, temporal evolution and risk assessment of pharma-ceutically active compounds in Doñana Park (Spain). J HazardMater 183:602–608
Carballa M, Omil F, Lema JM, Llompart M, Garcia-Jares C,Rodriguez I et al (2004) Behavior of pharmaceuticals, cos-metics and hormones in a sewage treatment plant. Water Res38:2918–2926
Carballa M, Omil F, Lema JM, Llompart M, Garcia C, Rodriguez I,Gomez M, Ternes T (2005) Behaviour of pharmaceuticals andpersonal care products in a sewage treatment plant of northwestSpain. Water Sci Technol 52:29–35
Carrasco P, Astasio P, Ortega P, Jimenez R, Gil A (2001) Factoresasociados al consumo de fármacos psicotropos en la poblaciónadulta española. Datos obtenidos a partir de las Encuestas Nacio-nales de Salud de España de los años 1993, 1995 y 1997. MedinaClinica 116:324–329
Catalá M, González Alonso S, Montero JC, Valcarcel Y (2012) Letterto the Editor Response to the letter to the editor by Maraver et al.(2012). Nicotine traces detected in bottled mineral water. Sci TotalEnviron 424:358–359
Choi K, Kim Y, Jung J, Kim MH, Kim CS, Kim NH et al (2008)Occurrences and ecological risks of roxithromycin, trimethoprim,and chloramphenicol in the Han River, Korea. Environ ToxicolChem 27:711–719
Comerton AM, Andrews RC, Bagley DM (2009) Practical over-view of analytical methods for endocrine-disrupting com-pounds, pharmaceuticals and personal care products in waterand wastewater. Philos Transact A Math Phys Eng Sci367:3923–3939
Conley JM, Symes SJ, Schorr MS, Richards SM (2008) Spatial andtemporal analysis of pharmaceutical concentrations in the upperTennessee River basin. Chemosphere 73:1178–1187
Daneshvar A, Svanfelt J, Kronberg L, Prevost M, Weyhenmeyer GA(2010a) Seasonal variations in the occurrence and fate of basicand neutral pharmaceuticals in a Swedish river-lake system. Che-mosphere 80:301–309
Daneshvar A, Svanfelt J, Kronberg L, Weyhenmeyer GA (2010b)Winter accumulation of acidic pharmaceuticals in a Swedish river.Environ Sci Pollut Res Int 17:908–916
Daughton CG, Ternes TA (1999) Pharmaceuticals and personal careproducts in the environment: agents of subtle change? EnvironHealth Perspect 107:907–938
Environment Canada (2007) Pharmaceuticals and personal careproducts in the Canadian environment: research and policydirections. Workshop Proceedings Minister of Public Worksand Government Services Canada. NWRI Scientific Assess-ment Report No 8. Burlington, Ontario. http://www.ec.gc.ca/inre-nwri/C00A589F-1CB5-4B81-93C9-8305E2BFEED3/ppcp-ppsp_2007-e.pdf
European Environment Agency (2010) Pharmaceuticals in the envi-ronment Results of an EEA workshop. EEA Technical report No1/2010. Copenhagen. http://www.eea.europa.eu/publications/pharmaceuticals-in-the-environment-result-of-an-eea-workshop/at_download/file
Farmaindustria (2002) La industria farmacéutica en cifras. http://www.farmaindustria.es/idc/groups/public/documents/publicaciones/farma_002843.pdf. Accessed Feb 2010).
Fent K, Weston AA, Caminada D (2006) Ecotoxicology of humanpharmaceuticals. Aquat Toxicol 76:122–159
Fernandez C, Gonzalez-Doncel M, Pro J, Carbonell G, Tarazona JV(2010) Occurrence of pharmaceutically active compounds in sur-face waters of the Henares–Jarama–Tajo River system (Madrid,Spain) and a potential risk characterization. Sci Total Environ408:543–551
Focazio MJ, Kolpin DW, Barnes KK, Furlong ET, Meyer MT, ZauggSD et al (2008) A national reconnaissance for pharmaceuticalsand other organic wastewater contaminants in the United States—(II) untreated drinking water sources. Sci Total Environ 402:201–216
García del Pozo J, Ramos SE, De Abajo F, Mateos CR (2004) Uti-lización de los antihipertensivos en España (1995-2001). Rev EspCardiol 57:241–249
Glassmeyer ST, Hinchey EK, Boehme SE, Daughton CG, RuhoyIS, Conerly O et al (2009) Disposal practices for unwanted residen-tial medications in the United States. Environ Int 35:566–572
González Alonso S, Catalá M, Romo R, Rodríguez J, Gil A,Valcárcel Y (2010) Pollution by psychoactive pharmaceuti-cals in the Rivers of Madrid metropolitan Area (Spain).Environ Int 36:195–210
Gracia-Lor E, Sancho JV, Serrano R, Hernández F (2012) Occurrenceand removal of pharmaceuticals in wastewater treatment plants atthe Spanish Mediterranean area of Valencia. Chemosphere87:453–562
Gros M, Petrovic M, Barcelo D (2007) Wastewater treatment plants asa pathway for aquatic contamination by pharmaceuticals in theEbro river basin (northeast Spain). Environ Toxicol Chem26:1553–1562
Heberer T (2002) Occurence, fate and removal of pharmaceuticalsresidues in the aquatic environment: a review of recent researchdate. Toxciol Lett 131:5–17
Hignite C, Azarnoff DL (1977) Drugs and drug metabolites asenvironmental contaminants: chlorophenoxyisobutyrate and salicy-clic acid in sewage water effluent. Life Sci 20:337–341
Hollender J, Zimmermann SG, Koepke S, Krauss M, McArdell CS, OrtC et al (2009) Elimination of organic micropollutants in a munic-ipal wastewater treatment plant upgraded with a full-scale post-ozonation followed by sand filtration. Environ Sci Technol43:7862–7869
Hua W, Bennett ER, Letcher RJ (2006) Ozone treatment and thedepletion of detectable pharmaceuticals and atrazine herbicide indrinking water sourced from the upper Detroit River, Ontario,Canada. Water Res 40:2259–2266
Huerta-Fontela M, Galceran MT, Ventura F (2007) Ultraperformanceliquid chromatography-tandem mass spectrometry analysis ofstimulatory drugs of abuse in wastewater and surface waters. AnalChem 79:3821–3829
Huerta-Fontela M, Galceran MT, Martin-Alonso J, Ventura F (2008a)Occurrence of psychoactive stimulatory drugs in wastewaters innorth-eastern Spain. Sci Total Environ 397:31–40
Huerta-Fontela M, Galceran MT, Ventura F (2008b) Stimulatory drugsof abuse in surface waters and their removal in a conventionaldrinking water treatment plant. Environ Sci Technol 42:6809–6816
Huerta-Fontela M, Galceran MT, Ventura F (2011) Occurrence andremoval of pharmaceuticals and hormones through drinking watertreatment. Water Res 45:1432–1442
IMS Health (2006) IMS Health Service Team. Available from: http://www.imshealth.com Accesed November 2011
INEbase (2009) National Statistics Institute on-line database. AccessedNovember 2011
Environ Sci Pollut Res (2013) 20:1396–1412 1411
Author's personal copy

Infante C, Rubio-Colavida JM (2004) La prevalencia del consumo detabaco en España. Adicciones 16:59–73
Kasprzyk-Hordern B, Dinsdale RM, Guwy AJ (2008) The occurrenceof pharmaceuticals, personal care products, endocrine disruptorsand illicit drugs in surface water in South Wales, UK. Water Res42:3498–3518
Kolpin DW, Frulong ET, Meyer MT, Thurman EM, Zauggs SD, BarberLB, Bouxton HT (2002) Pharmaceuticals, hormones and otherorganic wastewater contaminants in US stream (1999-2000). Anational reconnaissance. Environ Sci Technol 36:1202–1211
Kolpin DW, Skopec M, Meyer MT, Furlong ET, Zaugg SD (2004)Urban contribution of pharmaceuticals and other organic waste-water contaminants to streams during differing flow conditions.Sci Total Environ 328:119–130
Kumar A, Xagoraraki I (2010) Human health risk assessment ofpharmaceuticals in water: an uncertainty analysis for meprobamate,carbamazepine, and phenytoin. Regul Toxicol Pharmacol 57:146–156
Lapworth DJ, Baran N, Stuart ME, Ward RS (2012) Emerging organiccontaminants in groundwater: a review of sources, fate andoccurrence. Environ Int 163:287–303
Loraine GA, Pettigrove ME (2006) Seasonal variation in concentra-tions of pharmaceuticals and personal care products in drinkingwater and reclaimed wastewater in southern California. EnvironSci Technol 40:687–695
Lorenzo-Lacruz J, Vicente-Serrano SM, López-Moreno JI, BegueríabS, García-Ruiz JM, Cuadrat JM (2010) The impact of droughtsand water management on various hydrological systems in theheadwaters of the Tagus River (central Spain). J Hydrol 386:13–26
Martinez Bueno M, Hernando M, Herrera S, Gómez M, Fernández-Alba AR, Bustamante I et al (2010) Pilot survey of chemicalcontaminants from industrial and human activities in river watersin Spain. Int J Environ Anal Chem 90:321–343
McArdell CS, Molnar E, Suter MJ, Giger W (2003) Occurrence andfate of macrolide antibiotics in wastewater treatment plants and inthe Glatt Valley watershed, Switzerland. Environ Sci Technol37:5479–5486
Metcalfe CD,MiaoXS, Koenig BG, Struger J (2003) Distribution of acidicand neutral drugs in surface waters near sewage treatment plants in thelower Great Lakes, Canada. Environ Toxicol Chem 22:2881–2889
Miguel A, Martínez M, Vendrell J, Armando Y, Puig J (2001) Cambiosestacionales de la presión arterial en la hipertensión leve. Medic-ina Clínica 117:372–374
Mompelat S, Le BB, Thomas O (2009) Occurrence and fate of phar-maceutical products and by-products, from resource to drinkingwater. Environ Int 35:803–814
Radjenovic J, Petrovic M, Barcelo D (2007) Analysis of pharmaceut-icals in wastewater and removal using a membrane bioreactor.Anal Bioanal Chem 387:1365–1377
Radjenovic J, Petrovic M, Ventura F, Barcelo D (2008) Rejection ofpharmaceuticals in nanofiltration and reverse osmosis membranedrinking water treatment. Water Res 42:3601–3610
Richardson SD, Ternes TA (2011) Water analysis: emerging contami-nants and current issues. Anal Chem 83:4614–4648
Rodriguez-Gil JL, Catalá M, González Alonso S, Romo MarotoR, Valcarcel Y, Segura Y et al (2010) Heterogeneous photo-Fentontreatment for the reduction of pharmaceutical contaminationin Madrid rivers and ecotoxicological evaluation by a mini-aturized fern spores bioassay. Chemosphere 80:381–388
Sanderson H (2011) Presence and risk assessment of pharmaceuticalsin surface water and drinking water.Water Sci Technol 63:2143–2148
Sans S, Paluzie G, Puig T, Balaña L, Balaguer-Vintró I (2002) Preva-lencia del consumo de medicamentos en la población adulta deCataluña. Gac Sanit 16:121–130
Segura J (2004) Variación estacional de los niveles plasmáticos decolesterol: implicaciones terapéuticas y posibles mecanismos.Hipertensión 21:278–279
Stackelberg PE, Furlong ET, Meyer MT, Zaugg SD, HendersonAK, Reissman DB (2004) Persistence of pharmaceutical com-pounds and other organic wastewater contaminants in a con-ventional drinking-water-treatment plant. Sci Total Environ329:99–113
Stackelberg PE, Gibs J, Furlong ET, Meyer MT, Zaugg SD, LippincottRL (2007) Efficiency of conventional drinking-water-treatmentprocesses in removal of pharmaceuticals and other organic com-pounds. Sci Total Environ 377:255–272
Sui Q, Huang J, Deng S, Chen W, Yu G (2011) Seasonal variation inthe occurrence and removal of pharmaceuticals and personal careproducts in different biological wastewater treatment process.Environ Sci Technol 45:3341–3348
Supratik K, Kunal R (2012) Risk assessment for ecotoxicity of phar-maceuticals—an emerging issue. Expert Opin Drug Saf 11:235–274
Ternes TA (1998) Occurrence of drugs in German sewage treatmentplants and rivers. Water Res 32:3245–3260
Ternes TA, Meisenheimer M, McDowell D, Sacher F, Brauch HJ,Haist-Gulde B et al (2002) Removal of pharmaceuticals duringdrinking water treatment. Environ Sci Technol 36:3855–3863
Ternes TA, Stuber J, Herrmann N, McDowell D, Ried A, KampmannM, Teiser B (2003) Ozonation: a tool for removal of pharmaceut-icals, contrast media and musk fragrances from wastewater? Wa-ter Res 37:1976–1982
Togola A, Budzinski H (2008) Multi-residue analysis of pharmaceuti-cal compounds in aqueous samples. J Chromatogr (A) 1177:150–158
United States Environmental Protection Agency (2009) ContaminantCandidate List 3 (CCL3). EPA 815-R-09-008.Washington, DC
Valcarcel Y, González Alonso S, Rodriguez-Gil JL, Romo R, Gil A,Catala M (2011a) Analysis of the presence of cardiovascular andanalgesic/anti-inflammatory/antipyretic pharmaceuticals in river-and drinking-water of the Madrid Region in Spain. Chemosphere82:1062–1071
Valcarcel Y, González Alonso S, Rodriguez-Gil JL, Gil A, Catala M(2011b) Detection of pharmaceutically active compounds in therivers and tap water of the Madrid Region (Spain) and potentialecotoxicological risk. Chemosphere 84:1336–1348
Vieno NM, Tuhkanen T, Kronberg L (2005) Seasonal variation in theoccurrence of pharmaceuticals in effluents from a sewage treat-ment plant and in the recipient water. Environ Sci Technol39:8220–8226
Wang C, Shi H, Adams CD, Gamagedara S, Stayton I, Timmons T et al(2011) Investigation of pharmaceuticals in Missouri natural anddrinking water using high performance liquid chromatography-tandem mass spectrometry. Water Res 45:1818–1828
Westerhoff P, Yoon Y, Snyder S, Wert E (2005) Fate of endocrine-disruptor, pharmaceutical, and personal care product chemicalsduring simulated drinking water treatment processes. Environ SciTechnol 39:6649–6663
Zhang Y, Geissen SU, Gal C (2008) Carbamazepine and diclofenac:removal in wastewater treatment plants and occurrence in waterbodies. Chemosphere 73:1151–1161
Zimmermann SG, Wittenwiler M, Hollender J, Krauss M, Ort C,Siegrist H, von Gunten U (2011) Kinetic assessment and model-ing of an ozonation step for full-scale municipal wastewatertreatment: micropollutant oxidation, by-product formation anddisinfection. Water Res 45:605–617
Zuccato E, Castiglioni S, Farrellin R, Reitano G, Bagnati R, ChiabrandoC, Pomati F, Rosseti C, Calamaria D (2005) Pharmaceuticals in theenvironment in Italy: causes, occurences, effects and control. Envi-ron Sci Pollut Res Int 13:15–25
Zwiener C (2007) Occurrence and analysis of pharmaceuticals andtheir transformation products in drinking water treatment. AnalBioanal Chem 387:1159–1162
1412 Environ Sci Pollut Res (2013) 20:1396–1412
Author's personal copy
Related Documents