SEASONAL VARIATION OF MILK IN CENTRAL VALLEY CALIFORNIA AND THE ASSOCIATION OF MILK VARAITION WITH THE COMPOSITION AND TEXTURE OF LOW MOISTURE PART SKIM MOZZARELLA A Thesis presented to the Faculty of California Polytechnic State University, San Luis Obispo In Partial Fulfillment of the Requirements for the Degree Master of Science in Agriculture, with Specialization in Dairy Products Technology By Vaideki Jai, December, 2014

Welcome message from author
This document is posted to help you gain knowledge. Please leave a comment to let me know what you think about it! Share it to your friends and learn new things together.
Transcript
SEASONAL VARIATION OF MILK IN CENTRAL VALLEY CALIFORNIA AND
THE ASSOCIATION OF MILK VARAITION WITH THE COMPOSITION
AND TEXTURE OF LOW MOISTURE PART SKIM MOZZARELLA
A Thesis
presented to
the Faculty of California Polytechnic State University,
San Luis Obispo
In Partial Fulfillment of the Requirements for the Degree
Master of Science in Agriculture, with Specialization in Dairy Products Technology
By
Vaideki Jai,
December, 2014

ii
©2014
Vaideki Jai
ALL RIGHTS RESERVED
iii
COMMITTEE MEMBERSHIP
TITLE: Seasonal Variation of Milk in Central Valley California and the Association between Milk Composition and the Chemical Composition and Texture of Low Moisture Part Skim Mozzarella
AUTHOR: Vaideki Jai
DATE SUBMITTED: December 2014
COMMITTEE CHAIR: Rafael Jiménez-Flores, Ph.D., Professor of Dairy Products Technology California Polytechnic State University, San Luis Obispo, California.
COMMITTEE MEMBER: Ulric J. Lund, Ph.D., Professor of Statistics,
California Polytechnic State University, San Luis Obispo, CA.
COMMITTEE MEMBER: Amy Lammert, Ph.D., Assistant Professor of Food Science and Nutrition, California Polytechnic State University, San Luis Obispo, CA.
iv
ABSTRACT
Seasonal Variation of Milk in Central Valley California and the Association
between Milk Composition and the Chemical Composition and Texture of Low
Moisture Part Skim Mozzarella
Vaideki Jai
The chemical composition of milk (specifically casein, fat, and calcium) is known to
affect the quality and functional properties of Mozzarella cheese. Therefore,
concentrations of total nitrogen, casein nitrogen, non-casein nitrogen, non-protein
nitrogen, true nitrogen, casein nitrogen to total nitrogen ratio, casein nitrogen to true
nitrogen ratio, fat, total calcium, total solids, somatic cells, and pH were measured in silo
milk samples collected weekly over 18-months from a large dairy plant in Central Valley,
California from July 2008 to December 2009 to verify changes and correlate to low
moisture part skim Mozzarella (LMPS) characteristics. LMPS mozzarella cheese from
the same plant was also collected biweekly during the same period and analyzed five
days post manufacture for total nitrogen, water soluble nitrogen, total calcium, water
soluble calcium, salt, pH, fat in dry matter and total solids and texture properties (i.e.,
hardness (g), cohesiveness, springiness, chewiness (g), aggregation index (AGI), and
percentage cheese loss during shredding). Significant seasonal variations of total
nitrogen, non-protein nitrogen, casein nitrogen, casein nitrogen to total nitrogen ratio,
casein nitrogen to true nitrogen ratio, and total calcium in milk were explained using a
linear model equivalent to a basic single cosinor model with sine and cosine of week
(converted into radians) as predictors. Correlation studies were done between milk
composition and cheese composition, milk composition and cheese textural
characteristics as well as cheese composition and cheese texture, showing that
v
concentration of total calcium and nitrogen fractions in cheese milk significantly affected
the texture and composition of LMPS mozzarella. Also, the cheese total nitrogen, total
calcium and water soluble calcium affected the cheese texture. The LMPS Mozzarella
that was firmer and more cohesive had less loss during shredding and aggregated to a
lesser extent. The milk total nitrogen, non-protein nitrogen, casein nitrogen, casein to
total protein ratio, casein to true protein ratio, and total calcium had positive correlation
with each other. However, the milk non-casein nitrogen did not significantly correlate
with other nitrogen fractions and total calcium of milk. In addition, there was a
significant increase of water soluble nitrogen, percent loss in shredding and aggregation
index, and a significant decrease of hardness, and chewiness of LMPS Mozzarella
ripened at 8.90 C in comparison to the cheese ripened at 3.30 C for 21 days.
Keywords: Seasonal variation, milk composition in California, Low Moisture Part Skim
(LMPS) Mozzarella, LMPS Mozzarella chemical composition, LMPS
Mozzarella texture characteristics, ripening study of LMPS Mozzarella
vi
TABLE OF CONTENTS
LIST OF TABLES .............................................................................................................. x
LIST OF FIGURES ........................................................................................................... xi
I. INTRODUCTION ....................................................................................................... 1
II. REVIEW OF LITERATURE ...................................................................................... 4
A. Brief Outline ................................................................................................. 4
B. Milk Composition ......................................................................................... 4
C. Quality of Milk affecting Cheese Quality .................................................... 5
1. Somatic Cell Count (SCC) ......................................................................... 5
2. Protein ......................................................................................................... 8
3. Fat ............................................................................................................. 10
4. pH ............................................................................................................. 10
5. Salts .......................................................................................................... 11
6. Miscellaneous Components ...................................................................... 11
7. Milk Components and Cheese Making .................................................... 12
D. Factors affecting Milk Composition ........................................................... 13
1. Genetic ...................................................................................................... 14
2. Interval between Milkings ........................................................................ 15
3. Completeness of Milking .......................................................................... 15
4. Age and Stage of Lactation ...................................................................... 15
5. Feeding Regime ........................................................................................ 16
6. Disease ...................................................................................................... 17
7. Seasonal Variation .................................................................................... 17
7a. Studies on Seasonal Variation of Milk Composition ........................ 18
7b. Studies on Seasonal Variation of MIlk Composition in
California ..................................................................................... 27
E. Low Moisture Part Skim (LMPS) Mozzarella ........................................... 31
F. Manufacturing of Low Moisture Part Skim (LMPS) Mozzarella .............. 32
G. Characteristics of LMPS Mozzarella Cheese Structure ............................. 38
H. Functional Properties of LMPS Mozzarella ............................................... 42
1. Shreddability and Matting Behavior ......................................................... 42
2. Texture of Cheese ..................................................................................... 46
I. Proteolysis and Ageing of Cheese .............................................................. 48
III. MATERIALS AND METHODS ............................................................................ 52
A. Sample collection ....................................................................................... 52
vii
1. Milk Sampling .......................................................................................... 52
2. Low moisture part skim mozzarella (LMPS) sampling ............................ 53
B. Analysis of Milk Samples .......................................................................... 54
1. Total Nitrogen ........................................................................................... 54
2. Non- protein Nitrogen (NPN) ................................................................... 54
3. Non-casein Nitrogen (NCN) ..................................................................... 55
4. True Nitrogen ........................................................................................... 56
5. Casein Nitrogen ........................................................................................ 56
6. Total Solids ............................................................................................... 56
7. Fat Content ............................................................................................... 57
8. Somatic Cells ............................................................................................ 57
9. pH Measurement ....................................................................................... 57
10. Total Calcium ........................................................................................... 58
C. Analysis of cheese parameters ................................................................... 58
1. Total Nitrogen ........................................................................................... 58
2. Water Soluble Nitrogen (WSN) ............................................................... 58
3. pH Measurement ....................................................................................... 59
4. Moisture Content ...................................................................................... 59
5. Fat ............................................................................................................. 59
6. Salt Content of Cheese ............................................................................. 60
7. Fat in Dry Matter (FDM) .......................................................................... 60
8. Total Calcium in Cheese ........................................................................... 60
9. Water Soluble Calcium in Cheese ............................................................ 61
10. Texture Attributes of LMPS Mozzarella .................................................. 61
10a. Textural Profile Analysis(TPA) ........................................................ 61
10b. Aggregation Index (AGI) .................................................................. 64
D. Statistical Analysis for Modeling the Seasonal Variation .......................... 65
1. Interpretation of R-squared value in Multiple Linear Regression
Model ........................................................................................................ 66
2. Interpretation of the p-value in Multiple Linear Regression
Analysis .................................................................................................... 67
E. Correlation studies ...................................................................................... 67
1. Interpretation of the Correlation or Pearson Correlation Coefficient ....... 68
F. Ripening Studies ......................................................................................... 68
1. Statistical Analysis in Ripening Study ..................................................... 69
2. UREA PAGE ............................................................................................ 69
2a. Sample Preparation ............................................................................. 70
2b Gel Preparation .................................................................................... 70
2c. Running Gel ....................................................................................... 71
viii
IV. RESULTS AND DISCUSSION ............................................................................. 72
A. Analysis of Milk ......................................................................................... 72
1. Milk Composition ..................................................................................... 72
2. Correlation of Milk Composition ............................................................. 76
3. Variation of Milk Composition ................................................................ 77
4. Modeling of Milk Components for Seasonal Variation ........................... 83
B. LMPS Mozzarella Analysis ........................................................................ 85
1. Analysis of LMPS Mozzarella Composition ............................................ 86
2. Textural Analysis of LMPS Mozzarella ................................................... 91
3. Effect of Milk Composition on Cheese Composition and Cheese
Texture ...................................................................................................... 97
C. The Effect of Temperature on Ripening ................................................... 101
V. CONCLUSIONS ..................................................................................................... 108
VI. RECOMMENDATIONS FOR FUTURE WORK ................................................ 111
REFERENCES ............................................................................................................... 112
APPENDICES
Appendix 1. Milk Raw Data ................................................................................. 124
Appendix 2 . Milk Statistics (analyzed in Minitab 17.0) ...................................... 133
1. Descriptive Statistics of Milk Composition .................................. 133
2. Regression Analysis of Milk for Total Nitrogen ........................... 133
Appendix 3.Temperature Profile in Visalia and Fresno (Central Valley
California) from 2008 -2009 (Obtained from
www.weathersource.com) ......................................................................... 154
Appendix 4.The precipitation in Visalia and Fresno (Central Valley
California) from 2008 -2009 (Obtained from
www.weathersource.com) ......................................................................... 156
Appendix 5. LMPS Mozzarella Composition after 5 Days of Manufacture
(raw data) ................................................................................................... 158
Appendix 6. LMPS Mozzarella Textural Analysis after 5 Days of
Manufacture (raw data) ............................................................................. 160
Appendix 7. LMPS Mozzarella Textural Analysis after 5 Days of
Manufacture .............................................................................................. 162
Appendix 8. LMPS Mozzarella Ripened at 3.30 C for 21 Days (raw data) ......... 163
Appendix 9. LMPS Mozzarella Ripened at 8.90 C for 21 Days (raw data) .......... 165
ix
Appendix 10. Statistical Analysis of 21 days Ripened LMPS
Mozzarella ................................................................................................. 167
1. Descriptive Statistics of Cheese Parameters when
Ripened at 3.30 C ................................................................. 167
2. Descriptive Statistics of Cheese Parameters when
Ripened at 8.90 C ................................................................. 167
3. Paired t-tests between Cheese Parameters when
Ripened at 3.30 C (38F) and 8.90 C (48F) ............................ 168
x
LIST OF TABLES
Table 1. Change in types of somatic cells present in milks with increasing
somatic cell counts (Taken from Barbano et al. 1987a) ....................................... 7
Table 2. Casein fractions and importance to cheese making (Taken from Goff,
H.D., 2009) ........................................................................................................... 9
Table 3. Composition (g/100g) of cow’s milk from various breed (Taken from
Huppertz and Kelly, 2009) ................................................................................. 14
Table 4. Seasonal variation of casein to total protein ratio (Taken from Lacroix
et al., 1996) ......................................................................................................... 26
Table 5. Composition of milk received by four California cheese plants (Taken
from Bruhn & Franke, 1991) .............................................................................. 28
Table 6. Compositional standards for mozzarella in United States (Adapted from
Code of Federal Regulation (CFR) 133.155 to 133.158) ................................... 32
Table 7. Factors influencing the shreddability of cheese (Adapted from Childs et
al. 2007) .............................................................................................................. 45
Table 8. Specific settings selected for TPA with the TA-XT2 texture analyzer. ............. 62
Table 9. Descriptive statistics for milk composition: ....................................................... 73
Table 10. Correlation between milk components ............................................................. 76
Table 11. Regression analysis results of milk components .............................................. 83
Table 12. Descriptive statistics for LMPS mozzarella after five days of
manufacture ........................................................................................................ 86
Table 13. Correlation between LMPS mozzarella compositions ...................................... 91
Table 14. Descriptive statistics for textural properties of mozzarella after five
days of manufacture ........................................................................................... 92
Table 15. Correlation between cheese composition and cheese texture ........................... 92
Table 16. Correlation between cheese textural parameters .............................................. 97
Table 17. Correlation between cheese composition and milk composition ...................... 98
Table 18. Correlation between milk composition and cheese texture ............................ 100
Table 19. Statistical analysis of fresh and ripened cheese .............................................. 103
xi
LIST OF FIGURES
Figure 1. Approximate composition of milk (Adapted from Walstra et al., 2006a)........... 5
Figure 2. Coagulum formation in cheese making (Adapted from Wedholm, 2008
and Walstra et al., 2006b) ................................................................................ 12
Figure 3. Changes in the concentrations of fat, protein and lactose over a lactation
of a cow (Taken from www.irli.org) ................................................................ 16
Figure 4. Monthly average non- protein nitrogen (NPN) as a percent of total
nitrogen (TN) (Taken from Verdi et al. 1987) ................................................. 19
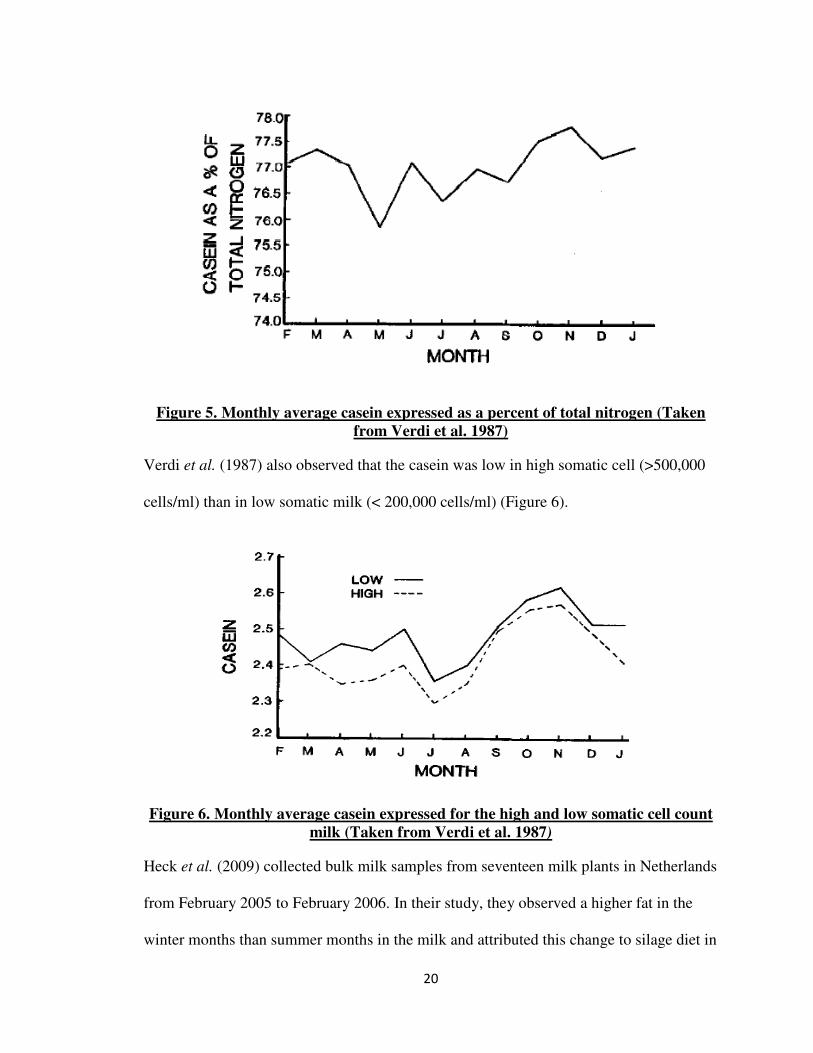
Figure 5. Monthly average casein expressed as a percent of total nitrogen (Taken
from Verdi et al. 1987) ..................................................................................... 20
Figure 6. Monthly average casein expressed for the high and low somatic cell count
milk (Taken from Verdi et al. 1987) ................................................................ 20
Figure 7. Weekly variation in the concentration of protein, fat, lactose (Taken from
Heck et al., 2009) ............................................................................................. 21
Figure 8. Variations of total protein in milk (average of seven Quebec cheese
plants) (Taken from Lacroix et al. 1996) ......................................................... 23
Figure 9. Variations of non-casein fraction in milk (average of seven Quebec
cheese plants (Taken from Lacroix et al. 1996) ............................................... 24
Figure 10. Variations of non-protein fraction in milk (average of seven Quebec
cheese plants) (Taken from Lacroix et al. 1996) .............................................. 24
Figure 11. Variation of casein to total protein (CP) ratio (Taken from Lacroix et al.
1996) ................................................................................................................ 25
Figure 12. Variation of casein to true protein (CPt) ratio (Takenfrom Lacroix et al.
1996) ................................................................................................................ 25
Figure 13. Monthly variation of fat from four breeds in California (1974 -1975)
(Adapted from Bruhn & Franke, 1977)............................................................ 30
Figure 14. Monthly variation of protein from four breeds in California (1974 -1975)
(Adapted from Bruhn & Franke, 1977)............................................................ 30
Figure 15. Large scale manufacture of LMPS Mozzarella cheese in enclosed vats
(Taken from McMahon & Oberg, 2011).......................................................... 33
xii
Figure 16. Curd formation after rennetting of milk inside an enclosed vat (Adapted
from McMahon & Oberg, 2011) ...................................................................... 35
Figure 17. Curd mass cut into pieces as it exits the draining, matting and
cheddaring belt (Taken from McMahon & Oberg, 2011) ................................ 35
Figure 18. Curd being mechanically stretched in hot water (Taken from McMahon
& Oberg, 2011) ................................................................................................ 36
Figure 19. Hot mass exiting the cooker/stretcher (Taken from McMahon & Oberg,
2011) ................................................................................................................ 37
Figure 20. Mechanical molding of hot cheese into rectangular blocks (Taken from
McMahon & Oberg, 2011) ............................................................................... 38
Figure 21. Blocks of LMPS mozzarella entering the brining tank (Taken from
McMahon & Oberg, 2011) ............................................................................... 38
Figure 22. Scanning electron micrograph of curd after whey is drained (Taken from
McMahon & Oberg, 2011). .............................................................................. 39
Figure 23. Scanning electron micrograph of hot LMPS mozzarella after stretching
(Taken from McMahon & Oberg, 2011).......................................................... 40
Figure 24. Scanning electron micrograph of cheese after four weeks of storage
(Taken from McMahon and Oberg, 2011). ...................................................... 49
Figure 25. Level of pH4.6 soluble nitrogen expressed as a percentage of total
nitrogen in low moisture mozzarella (Adapted from Feeney et al., 2001). ..... 51
Figure 26. Milk sampling plan .......................................................................................... 53
Figure 27. The texture profile analysis curve for cheese using TAX-T2 texture
analyzer (Adapted from TTC Texture Technologies, 2009). ........................... 62
Figure 28. Variation of total solids with respect to total nitrogen, fat, total calcium
and casein nitrogen. .......................................................................................... 77
Figure 29. Variation of Nitrogen fractions (total nitrogen (TN), non-protein
nitrogen (NPN), and non-casein nitrogen (NCN)) in milk .............................. 78
Figure 30. Variation of casein, casein/total protein ratio, and casein/true protein
ratio .................................................................................................................. 78
Figure 31. Variation of fat, total solids, and total calcium in milk ................................... 79
Figure 32. Variation of pH and somatic cell count ........................................................... 79
xiii
Figure 33. Variation of cheese total nitrogen (TN%), water soluble nitrogen
(WSN%) ........................................................................................................... 87
Figure 34. Variation of cheese fat in dry matter (FDM %), moisture (%) and salt
(%) .................................................................................................................... 88
Figure 35. Variation of cheese total calcium (%), water soluble calcium (WSC %),
pH ..................................................................................................................... 89
Figure 36. Variation cheese TPA (hardness (H (g)), cohesiveness (C), springiness
(Sp), and chewiness (Ch (g)) ............................................................................ 93
Figure 37. Variation of aggregation index (AGI) and % loss in shredder ........................ 95
Figure 38. Urea- PAGE of sodium caseinate and LMPS mozzarella ripened at
different temperatures. Lane 1 & 2 – Sodium caseinate standard. Lane 3,
4, and 5 – Fresh cheese. Lane 6 and 7 – Cheese Ripened at 3.30 C. Lane
8 and 9 – Cheese ripened at 8.90 C................................................................. 106
1
I. INTRODUCTION
Milk is natures’ most nutritious food, and its composition determines the ability to make
good quality dairy products. With milk prices being based on the composition (milk fat,
true protein, and other dairy solids) dairy farmers have changed their farming practices to
produce milk with high protein, fat, and solids (Henrichs et al., 2005). Milk components
especially casein, fat, calcium, and pH influences the cheese making aspects,
composition, and yield (Fox & Cogan, 2004). Therefore, the composition of milk is of
great importance for the dairy industry due to the interest in changing the composition of
milk to suit the processors and consumers requirements. Seasonal variation of milk
composition is due to a combination of factors like heat stress, breed differences, stage of
lactation, feeding practices and photoperiod (Laben, 1963). These changes are more
pronounced in countries like New Zealand, Ireland, and parts of Australia countries
where milk is produced from spring calving herds fed on pasture (Heck et al. 2009). In
California, the seasonal variation in milk composition is thought to be minimal because
of the large herd sizes, even calving pattern all year round, and feeding mostly
concentrates versus pasture (Bruhn & Franke, 1977). However, in California, some
researchers have reported seasonal variation of milk components. Nickerson (1960)
found that 18 of 23 milk components varied with season except proteose-peptone, non-
protein nitrogen, two minor phosphorus compounds, and soluble calcium. He also
reported that variations in most of the constituents were lowest in May through July and
highest in November through January (Laben, 1963). Bruhn & Franke (1991) found that
protein, fat, and solid not fat in milk were higher in winter and lower in summer months
in California. Bruhn & Franke (1977) studied the variation of gross composition of
California milk due to breed differences and environmental conditions. They observed
2
that the fat and protein concentrations for all breeds were significantly lower from May
through August and higher from November through February. To the contrary, Frank et
al. (1987) found that there was no variation of protein or its fractions in milk with season
in the four regions in California (North Bay, L.A. Basin, S. San Joaquin Valley, and
North West Coast) from where milk samples were collected.
Low moisture part skim (LMPS) Mozzarella is a variety of pasta–filata cheese used
widely in pizzas in the United States. The extensive use of LMPS Mozzarella in pizzas
and other related foods is due to their longer shelf life and good shredding properties.
These essential quality attributes are due to their low moisture content (≤ 52 %) and fat in
dry matter (< 45%) when compared with other types of Mozzarella (Kindstedt et al.,
1999). In 1985, about 75% of all Mozzarella produced was used as an ingredient in food
service mainly in pizza (Kindstedt, 1999). The production of low moisture Mozzarella
has increased worldwide due to the increase in demand for pizza and related foods.
Large-scale production of cheese requires a precise control and monitor of all aspects of
cheese making process (Kindstedt et al., 1999). Along with the good manufacturing
practices, raw milk quality plays an important role in the Mozzarella yield and quality
(Barbano, 1987a). Even though, in California, seasonal variations in milk composition
are said to be less, the impact of the variation of milk composition remains in question
pertaining to utilization in cheese.
Therefore, in this study, the composition of silo milk (total nitrogen, casein nitrogen, non-
casein nitrogen, non-protein nitrogen, true nitrogen, casein, casein to total nitrogen ratio,
casein to true nitrogen ratio, fat, total calcium, total solids, somatic cells, and pH)
collected weekly from a plant in Central Valley, California from July 2008 to December
3
2009 was analyzed for any seasonal variation using linear regression analysis. Also, the
LMPS Mozzarella manufactured in the same plant during the same period was analyzed
on a biweekly basis to see if the seasonal variation of milk composition had any effect on
the cheese composition (total nitrogen, water soluble nitrogen, total calcium, water
soluble calcium, salt, pH, fat in dry matter and total solids) and un-heated textural
characteristics (hardness, cohesiveness, springiness, chewiness, aggregation index and
percentage loss in shredder). Correlation analysis was done between milk components
and cheese composition and texture for the sampling period (July 2009 – April 2010). To
observe if there was any association within milk components, mozzarella components
and texture characteristics correlation analysis was done as follows: 1) Between different
milk components for the entire sampling period (July 2008 to December 2009) 2)
Between different cheese components for the sampling period (July 2008 to November
2009) 3) Between cheese textural characteristics for the sampling period (July 2008 to
November 2009) 4) Between cheese composition and textural properties for the
sampling period (July 2008 to November 2009). Finally, a ripening study was done to
analyze the impact of storage temperature (3.30 C and 8.90 C) on pH, water-soluble
nitrogen, and the above mentioned textural characteristics of LMPS Mozzarella.
4
II. REVIEW OF LITERATURE
A. Brief Outline
This review consists of different parts in relation to the objective of the study. In the first
part, how different components of milk affect the cheese composition and quality are
discussed briefly. In the next part, factors that affect the milk quality, especially the effect
of seasonal variation on milk are reviewed in depth. Then, the manufacture of Low
Moisture Part Skim (LMPS) Mozzarella and characteristics of the cheese structure in
relation to its composition are discussed. Next, the functional properties of LMPS
Mozzarella before heating such as shreddability, matting behavior, and textural properties
are briefly summarized. Finally, the chemical and functional changes that Mozzarella
undergoes during proteolysis are examined.
B. Milk Composition
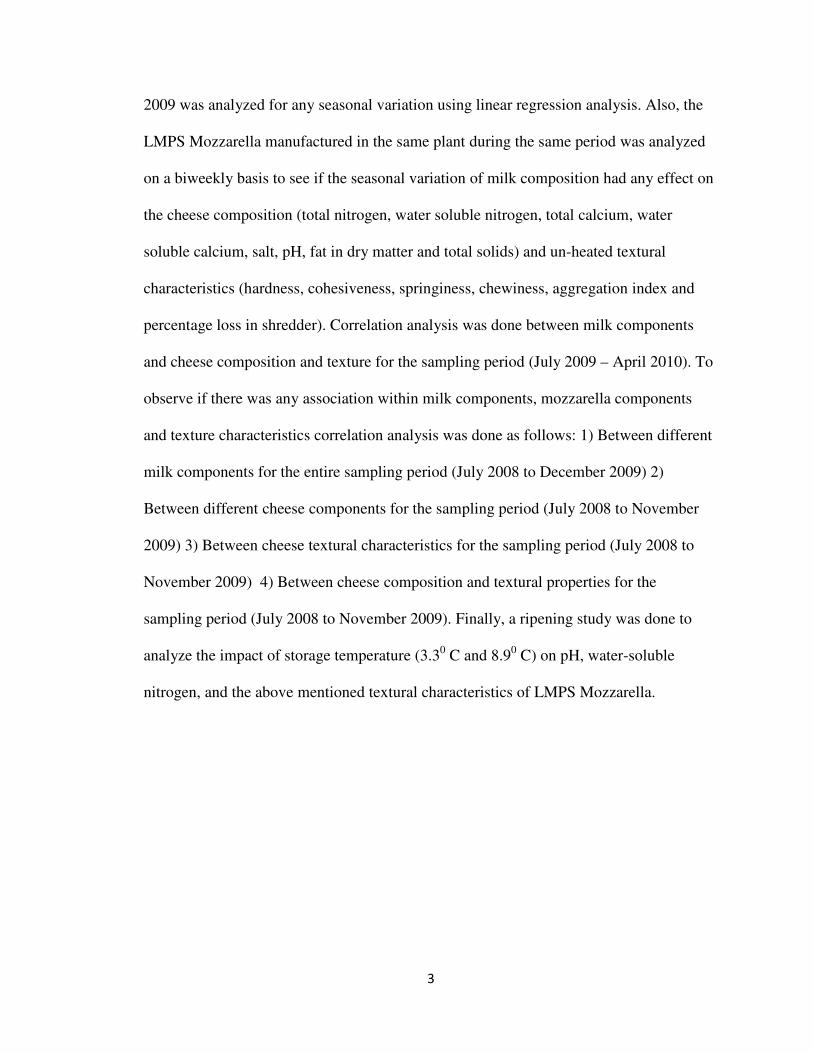
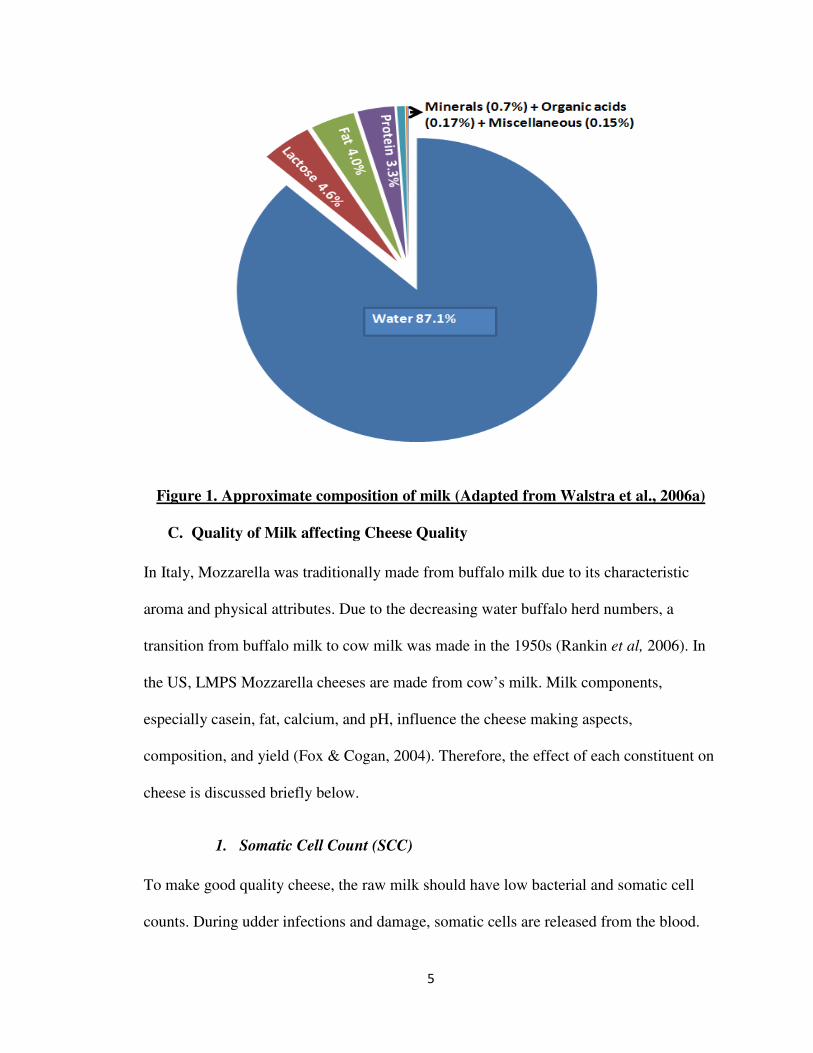
Milk is a complex fluid matrix consisting of nutritious components that makes it a
“Complete Food”. The composition of milk with approximate concentrations is shown in
Figure 1 (Walstra et al., 2006a).
5
Figure 1. Approximate composition of milk (Adapted from Walstra et al., 2006a)
C. Quality of Milk affecting Cheese Quality
In Italy, Mozzarella was traditionally made from buffalo milk due to its characteristic
aroma and physical attributes. Due to the decreasing water buffalo herd numbers, a
transition from buffalo milk to cow milk was made in the 1950s (Rankin et al, 2006). In
the US, LMPS Mozzarella cheeses are made from cow’s milk. Milk components,
especially casein, fat, calcium, and pH, influence the cheese making aspects,
composition, and yield (Fox & Cogan, 2004). Therefore, the effect of each constituent on
cheese is discussed briefly below.
1. Somatic Cell Count (SCC)
To make good quality cheese, the raw milk should have low bacterial and somatic cell
counts. During udder infections and damage, somatic cells are released from the blood.

6
However, milk from healthy cows also contains low numbers of somatic cells in the form
of epithelial cells (<100,000 cells/ml). Apart from infections, late stage of lactation, heat
stress, and poor feeding practices contribute to high levels of SCC (Rankin et al., 2006).
An increased SCC in raw milk affects the constituents of milk and thereby affects rennet
coagulation properties, syneresis, and cheese yield (Verdi et al., 1987).
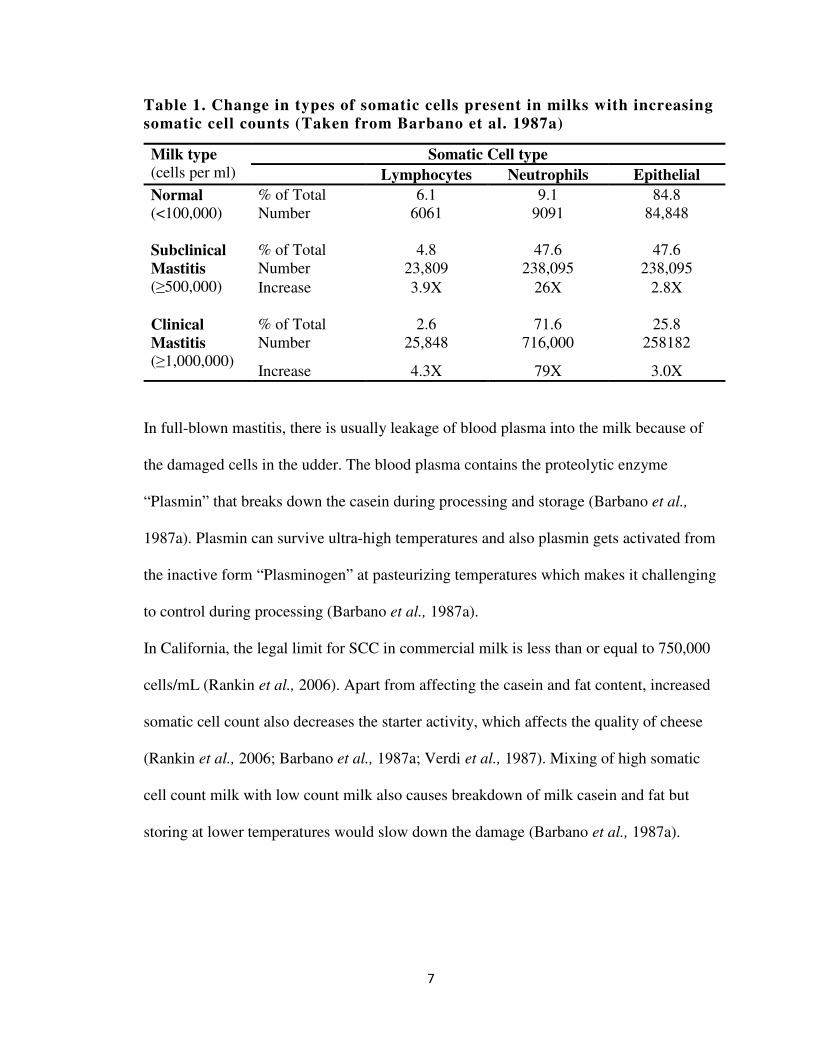
Epithelial cells or other somatic cells in milk from non-mastitis or normal cows constitute
80% of the SCC (SCC < 100,000 cells/ml) (Barbano et al., 1987a). In milk from cows
with subclinical mastitis (SCC ≥500,000 cells/ml) or mastitis (SCC > 1,000,000 cells/ml),
neutrophils are present more than 26 fold and lymphocytes are present more than 3.9 fold
when compared to normal milk (SCC<100,000 cells/ml) (see Table 1). Neutrophils are a
type of white blood cells that carry very active proteases, lipases, phospholipases, and
specific chemicals to fight infection and tissue damage. During cheese making, levels of
protease and lipase enzymes makes the curd weak due to break down of casein, fat, etc.,
and hence causes a lot of shattering during cutting and milling. This causes more fines,
impaired whey drainage, and higher moisture content in the cheese (Barbano et al.,
1987a).
7
Table 1. Change in types of somatic cells present in milks with increasing
somatic cell counts (Taken from Barbano et al. 1987a)
Milk type (cells per ml)
Somatic Cell type
Lymphocytes Neutrophils Epithelial
Normal (<100,000)
% of Total Number
6.1 6061
9.1 9091
84.8 84,848
Subclinical
Mastitis (≥500,000)
% of Total Number
4.8 23,809
47.6 238,095
47.6 238,095
Increase
3.9X 26X 2.8X
Clinical
Mastitis
(≥1,000,000)
% of Total Number
2.6 25,848
71.6 716,000
25.8 258182
Increase 4.3X 79X 3.0X
In full-blown mastitis, there is usually leakage of blood plasma into the milk because of
the damaged cells in the udder. The blood plasma contains the proteolytic enzyme
“Plasmin” that breaks down the casein during processing and storage (Barbano et al.,
1987a). Plasmin can survive ultra-high temperatures and also plasmin gets activated from
the inactive form “Plasminogen” at pasteurizing temperatures which makes it challenging
to control during processing (Barbano et al., 1987a).
In California, the legal limit for SCC in commercial milk is less than or equal to 750,000
cells/mL (Rankin et al., 2006). Apart from affecting the casein and fat content, increased
somatic cell count also decreases the starter activity, which affects the quality of cheese
(Rankin et al., 2006; Barbano et al., 1987a; Verdi et al., 1987). Mixing of high somatic
cell count milk with low count milk also causes breakdown of milk casein and fat but
storing at lower temperatures would slow down the damage (Barbano et al., 1987a).
8
2. Protein
Total protein consists of three main fractions - casein, whey protein and non-protein, and
these constitute 77.9%, 17.2% and 4.9% respectively, (Walstra et al., 1999). In cheese
making, during coagulum formation, casein forms the main structural framework by
trapping fat and moisture. This network formation and its properties determine to a larger
extent the amount of other milk constituents retained in cheese (Walstra et al., 2006b).
Bovine casein is present in milk as aggregates and contains the colloidal calcium
phospahte (CCP). Casein precipitates out at pH 4.6, and as the pH is lowered, the CCP
dissolves into soluble phase (Walstra et al., 2006c). Casein micelle consists of four
individual components known as αs1- casein, αs2 - casein, β - casein and κ - casein in the
approximate ratios of 4:1:4:1 (w/w) (Banks, 2007). A portion of the β –casein is divided
into gamma casein and proteose peptone by the action of proteolytic enzymes. Each of
the four main casein components varies due to the degree of phosphorylation,
glycosylation, disulphide bonding, proteolysis and genetic polymorphism (Walstra et al.,
2006c). Banks (2007) reported that the BB genotypes of β - lactoglobulin and κ - casein
have a good effect on the rennetting properties, cause higher recoveries of fat, less loss of
fines in whey, and high yields. The casein fractions and some properties important to
cheese making are shown in Table 2.
9
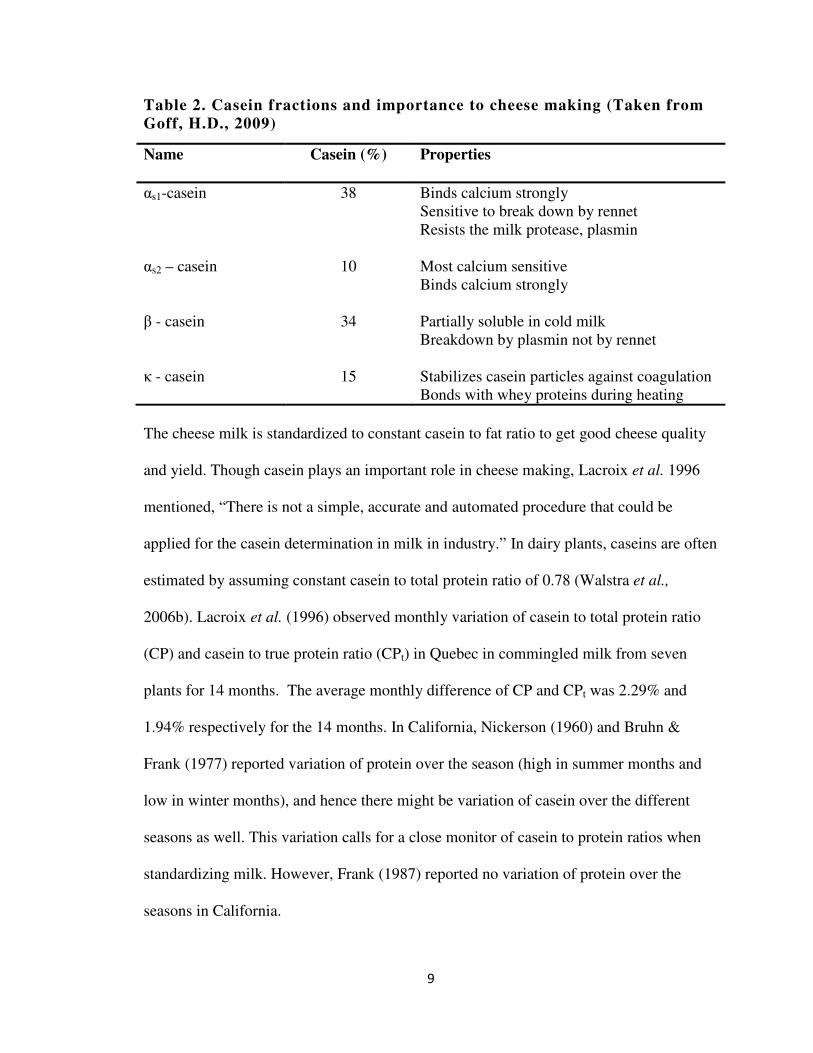
Table 2. Casein fractions and importance to cheese making (Taken from
Goff, H.D., 2009)
Name Casein (%) Properties
αs1-casein 38 Binds calcium strongly Sensitive to break down by rennet Resists the milk protease, plasmin
αs2 – casein 10 Most calcium sensitive Binds calcium strongly
β - casein 34 Partially soluble in cold milk Breakdown by plasmin not by rennet
κ - casein 15 Stabilizes casein particles against coagulation Bonds with whey proteins during heating
The cheese milk is standardized to constant casein to fat ratio to get good cheese quality
and yield. Though casein plays an important role in cheese making, Lacroix et al. 1996
mentioned, “There is not a simple, accurate and automated procedure that could be
applied for the casein determination in milk in industry.” In dairy plants, caseins are often
estimated by assuming constant casein to total protein ratio of 0.78 (Walstra et al.,
2006b). Lacroix et al. (1996) observed monthly variation of casein to total protein ratio
(CP) and casein to true protein ratio (CPt) in Quebec in commingled milk from seven
plants for 14 months. The average monthly difference of CP and CPt was 2.29% and
1.94% respectively for the 14 months. In California, Nickerson (1960) and Bruhn &
Frank (1977) reported variation of protein over the season (high in summer months and
low in winter months), and hence there might be variation of casein over the different
seasons as well. This variation calls for a close monitor of casein to protein ratios when
standardizing milk. However, Frank (1987) reported no variation of protein over the
seasons in California.
10
3. Fat
Fat is present in milk as small globules, and its size is known to vary according to the
cow breed. During the maturation process, fat via lipolysis imparts texture, flavor, and
aroma to cheese. In the coagulum, fat is trapped by the casein network, and its presence
in the curd inhibits syneresis thereby influencing the moisture retention of the curd
(Banks, 2007). Low fat cheese is hard in texture and lacks flavor. Even one percent fat
can produce considerable flavor in cheese and this is widely exploited in the low fat
cheese industry (Neil, 2010).
4. pH
The pH of milk plays an important role in cheese making, and the milk composition,
especially the amount of salts, influence the pH value. The pH of natural milk is about
6.7 but varies slightly (Kelly, 2007a). The use of refrigeration in milk handling and
storage has minimized the acid producing bacteria thereby maintaining the pH close to
6.7. The pH increases slightly in late lactation milk, mastitis milk, and during storage due
to loss of CO2. This increase in pH is not suitable for the action of chymosin, which
requires an acidic pH optimum function (Kelly, 2007a). Pre-acidification of milk is done
at the start of the cheese making process to offset the increase in pH. The milk is pre-
acidified by adding acid (acidogen, gluconic acid lactone, etc.) or by limited growth of
lactic acid starter followed by pasteurization (Fox & Cogan, 2004).
11
5. Salts
Salts are present in low quantities in milk as metallic components (sodium, potassium,
calcium, magnesium, manganese, iron, and copper) and non-metallic elements such as
sulphur, chlorine, and phosphorous (Neil, 2010).
Calcium is the most important salt in cheese making, and it is partitioned between the
colloidal phase (calcium phosphate within the casein micelles) and the soluble phase of
milk. After rennet coagulation, the formation of the rennet coagulum is dependent on the
amount of soluble calcium and insoluble calcium present in the milk. Calcium ions
neutralize the negative charges on the casein micelles by forming bonds between
negatively charged phosphate groups on the casein micelles. The coagulation time and
firmness depend on the calcium ion activity (Kelly, 2007b).
The partition of calcium into soluble and insoluble form depends on the pH. As the pH
decreases, the colloidal calcium becomes more soluble and is completely solubilized at
pH 4.6. The amount of calcium retained in curd will depend on the pH at which the whey
is drained. Calcium chloride is often added to cheese milk to fasten the rate of
coagulation and increase the firmness of the curd (Fox and Cogan, 2004).
6. Miscellaneous Components
Lactose acts as the substrate for the starter cultures to produce lactic acid, and hence, aids
in acid production during cheese making. Approximately 10% of the lactose is used by
the starter bacteria to produce lactic acid, and the remaining is lost with the whey (Neil,
2010). For cheeses used in pizza, the galactose component of the lactose molecule gives
the desired browning. Galactose is obtained by adding appropriate cultures that utilizes
12
only the glucose molecule of the disaccharide lactose for acid production (McMahon &
Oberg, 2011).
Different enzymes gain entry into milk through bacteria present in the teats canals or
from organisms present in the environment. These enzymes affect the quality of raw milk
and can affect the fats and proteins during ripening to impart delicate flavors and aromas
in aged cheese (Neil, 2010). Milk fat contains the fat-soluble vitamins (A, D, E and K),
and most of the water-soluble vitamins (B complex and vitamin C) are lost during the
draining of whey. These vitamins act as food for the bacteria to grow during cheese
ripening (Neil, 2010).
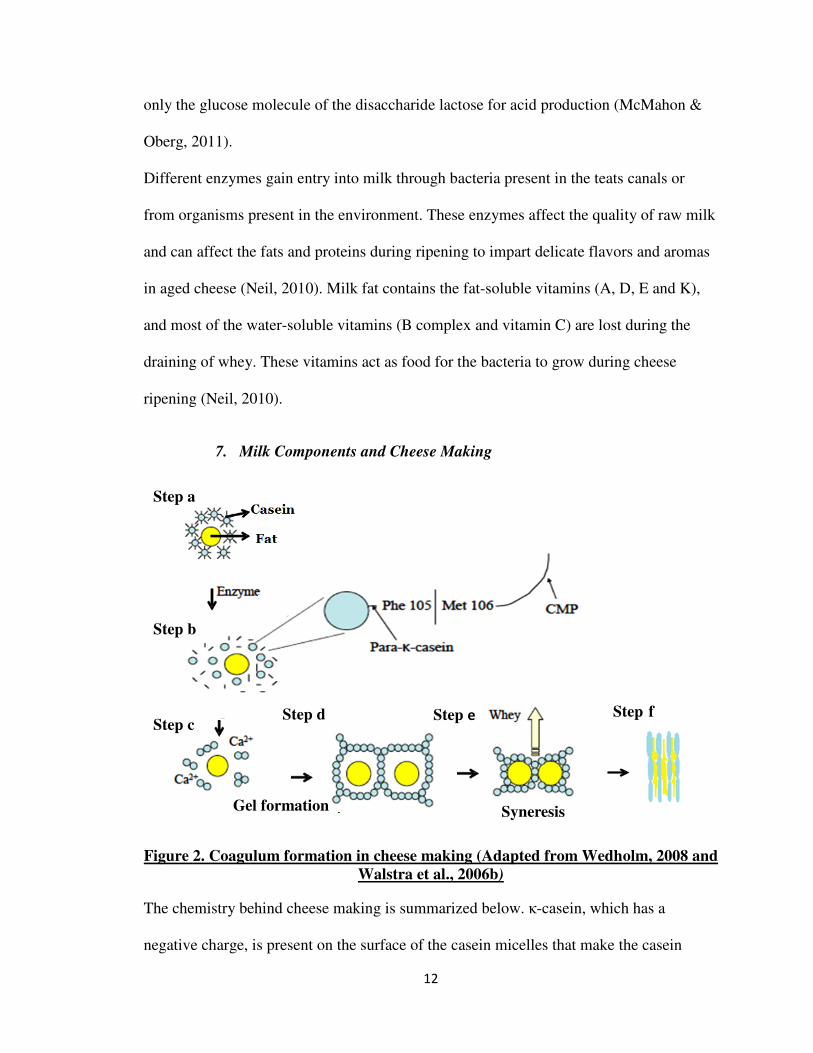
7. Milk Components and Cheese Making
Figure 2. Coagulum formation in cheese making (Adapted from Wedholm, 2008 and
Walstra et al., 2006b)
The chemistry behind cheese making is summarized below. κ-casein, which has a
negative charge, is present on the surface of the casein micelles that make the casein
Gel formation Syneresis
Step a
Step b
Step c Step d Step f Step e
13
micelles repel each other in the milk serum. The casein molecules also trap the milk fat
globules (Figure 2, step a). The clotting steps occur in two steps. First, when rennet is
added, it cleaves the Phe105-Met106 bond of κ-casein into para-κ-casein, which stays with
the casein micelle and a hydrophilic caseinomacropeptide (CMP) that ends up in the
whey fraction (Figure 2, step b). The para-κ-casein micelles, which have a neutral net
charge, form small-elongated shaped aggregates (Figure 2, step c). This is followed by
the non-enzymatic second stage in which a three dimensional network is formed by the
aggregation of para-κ-casein micelles under the influence of calcium ions. A
gel/coagulum is formed that traps the fat and moisture. This coagulum gets firmer as
more bonds are forms by the hydrophobic and electrostatic interactions between the
micelles and also by calcium phosphate linkages between the micelles (Figure 2, step d).
The clotting process is influenced by calcium concentration, pH and temperature.
Syneresis (expelling of the whey) occurs when the gel is cut, and it is further enhanced
during the cooking, stirring, and cheddaring process (Wedholm, 2008; Fox &
McSweeney, 1998; Walstra et al., 2006b). Due to the pressure applied, some bonds are
broken, and new ones are formed, and hence, expelling the whey out in the process.
Other factors that influence syneresis are increased temperature and reduced pH of milk.
In the mozzarella process, the milled curd is plasticized, kneaded, and stretched with
heat. The curd fibers reorganize and orient themselves in a unidirectional direction giving
Mozzarella the characteristic texture (Figure 2, step f) (Kindstedt et al., 1994).
D. Factors affecting Milk Composition
As described earlier, milk components play an important role in cheese making. Milk
composition varies within a country and from one region to another (Barbano, 1987a).
14
This variation is caused by a combination of genetic and environmental factors like age,
stage of lactation, feeding, health status, and climatic conditions (Fox & McSweeney,
1998). The various factors that bring about changes in the milk composition are discussed
briefly below.
1. Genetic
Selective breeding of dairy cattle is done to increase the milk yield and produce milk
with more fat and protein. In the US, 90% of the dairy herd consists of Holsteins. The
Holsteins are known for producing large volumes of milk and have dominated milk
production since 1945. Jersey represents 7% and Ayrshire, Brown Swiss, Guernsey, and
Milking Shorthorn makes up 2% of the milking herd population (Wendroff & Paulus,
2011). Milk composition varies between breeds, and breed selection has decreased this
variability to a great extent (Huppertz & Kelly, 2009).
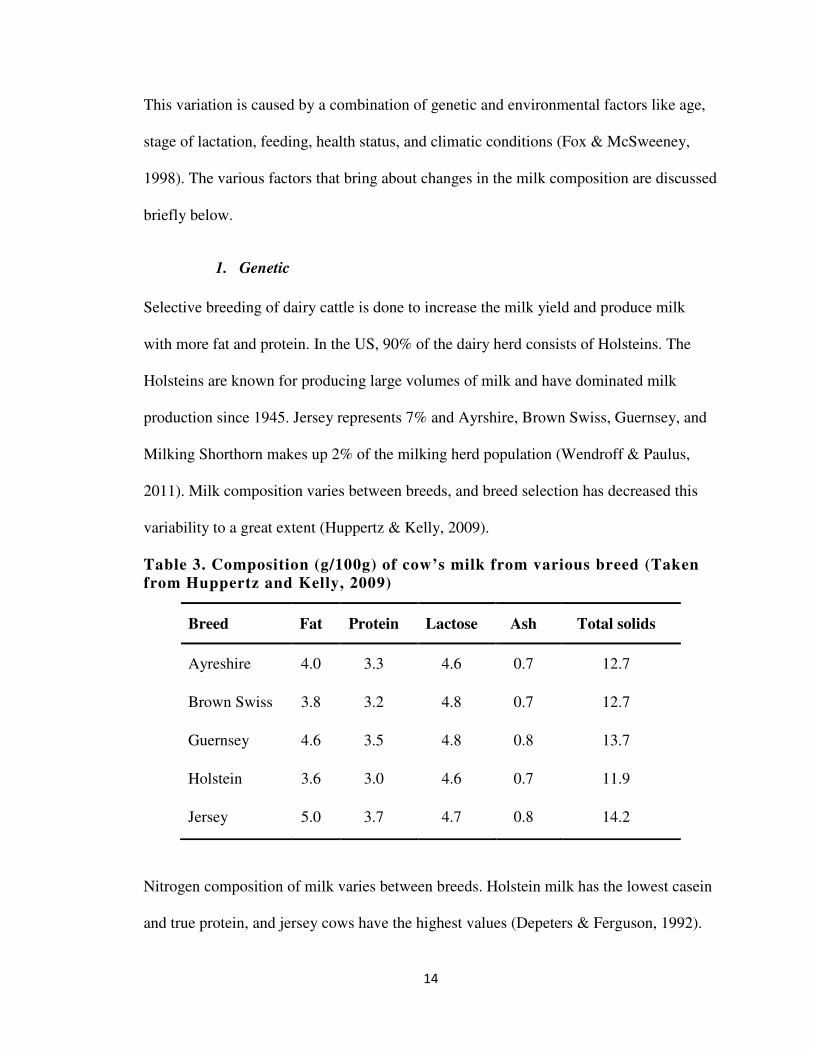
Table 3. Composition (g/100g) of cow’s milk from various breed (Taken
from Huppertz and Kelly, 2009)
Breed Fat Protein Lactose Ash Total solids
Ayreshire 4.0 3.3 4.6 0.7 12.7
Brown Swiss 3.8 3.2 4.8 0.7 12.7
Guernsey 4.6 3.5 4.8 0.8 13.7
Holstein 3.6 3.0 4.6 0.7 11.9
Jersey 5.0 3.7 4.7 0.8 14.2
Nitrogen composition of milk varies between breeds. Holstein milk has the lowest casein
and true protein, and jersey cows have the highest values (Depeters & Ferguson, 1992).
15
Apart from breeding, environment and various physiological factors also influence the
yield and composition of milk (Glantz et al., 2009).
2. Interval between Milkings
The fat content of milk varies between the morning and evening milk due to a shorter
interval between the morning and evening milking than between the evening and morning
milking. Milking of cows at regular intervals will reduce this variability. SNF and protein
content does not vary much with the milking interval (Walstra et al. 2006a).
3. Completeness of Milking
Fat droplets tend to accumulate in the upper portions of the alveoli due to their low
specific gravity. Hence, the first milk drawn from the udder is low in fat while the last
drawn milk is high in fat. However, there is no net loss of fat as it is picked up in
subsequent milkings. Also, mixing of milk tends to even out this variability (Nickerson,
1999).
4. Age and Stage of Lactation
As the cow ages, with each successive lactation, the fat and solid not fat content
decreases by about 0.02% and 0.12%, respectively (Laben, 1963). The fat, lactose, and
protein contents of milk vary according to stage of lactation as shown in (Figure 3).
Solids-not-fat (SNF) content is usually highest during the first two to three weeks, and
then a slight decrease is observed. The protein content of milk tends to be higher during
the initial and later part of the lactation period and decrease at about 60 days of the
lactation cycle. The fat content tends to increase during the later part of the lactation.
However, the protein to fat ratio is highest at about 60 days of lactation (peak of
16
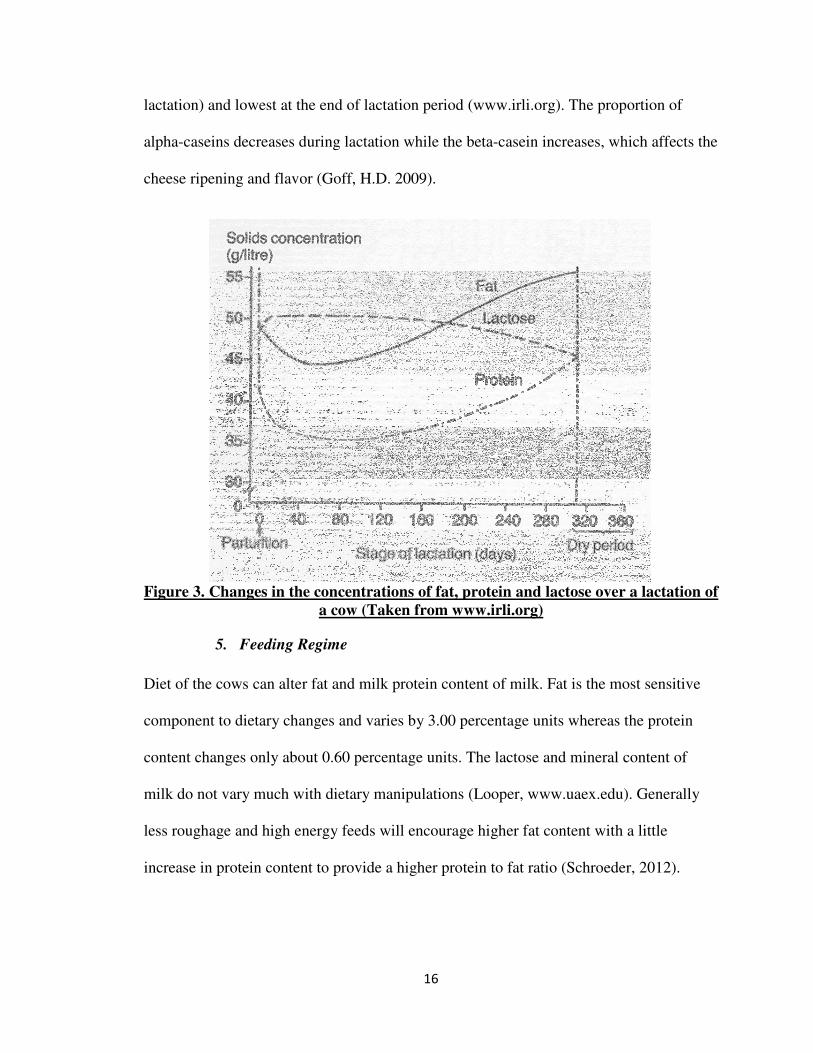
lactation) and lowest at the end of lactation period (www.irli.org). The proportion of
alpha-caseins decreases during lactation while the beta-casein increases, which affects the
cheese ripening and flavor (Goff, H.D. 2009).
Figure 3. Changes in the concentrations of fat, protein and lactose over a lactation of
a cow (Taken from www.irli.org)
5. Feeding Regime
Diet of the cows can alter fat and milk protein content of milk. Fat is the most sensitive
component to dietary changes and varies by 3.00 percentage units whereas the protein
content changes only about 0.60 percentage units. The lactose and mineral content of
milk do not vary much with dietary manipulations (Looper, www.uaex.edu). Generally
less roughage and high energy feeds will encourage higher fat content with a little
increase in protein content to provide a higher protein to fat ratio (Schroeder, 2012).
17
6. Disease
Disease can raise the normal body temperature of lactating cow, and this can affect the
milk yield and composition. Laben (1963) observed that mastitis could reduce the yield
of milk, SNF, and protein up to 10 to 12%. Though other diseases tend to affect milk
composition, mastitis is the most widely studied disease that affects the milk
composition. Even subclinical mastitis is also known to increase the somatic cell count,
sodium, chloride, free fatty acids, and levels of blood constituents in milk and decrease
fat, solids-not-fat, and lactose. Mastitis does not change the total protein content
significantly, but a decrease in the level of casein and an increase in the levels of albumin
and immunoglobulin have been reported (Dohoo & Meek, 1982). These changes in the
milk from mastitis cows decrease the cheese yield and alter the quality of cheese
produced (Looper, www.uaex.edu).
7. Seasonal Variation
Milk generally has higher fat and protein content during the winter and fall months and
lowest during the spring and summer months. This variation is attributed mainly to
change in climatic conditions and feeding regime. During spring, the green pastures tend
to provide low fiber in diet, whichdecreases the fat and protein content in milk. In
summer months, the heat stress reduces the dry matter intake resulting in decrease of fat
and protein content (Looper, www.uaex.edu). Apart from diet and hot weather, stage of
lactation, calving patterns, humidity, photoperiod, somatic cell count, etc., also contribute
to variation in milk composition. Hence, it is difficult to single out one factor as the main
cause to seasonal variation is due to a combination of multiple factors (Fox & Cogan,
2004).
18
7.a. Studies on Seasonal Variation of Milk Composition
Bernabucci et al. (2002) studied the variation of milk composition with regard to the
environmental temperature for two seasons: spring and summer. The study comprised of
40 mid lactating Holstein cows in central Italy. The feed during the study was a ration
based feed with concentrates given by self-feeders. The cows were balanced for genetic
index, housed, and milked in the same way for the entire study. During the experiment,
the average temperature was 11.60 ± 2.60 C in spring during daytime and 6.40 ± 3.50 C
during nighttime. In summer, the temperature was 29.90 ± 2.90 C during daytime and
21.90 ± 4.10 C during nighttime. They found that milk yield during the summer was 10%
lower (p-value < 0.01) than during the spring. Milk protein percentages were 9.9% lower
(p-value < 0 .01) in the summer than in the spring (3.01% vs. 3.31%, respectively).
Casein percentage and casein number were lower (p-value < 0.01) in the summer than in
the spring (2.18% vs. 2.58% and 72.4 % vs. 77.9% for casein content and casein number,
respectively). αs-casein and β-casein content were lower (P < 0.01) in the summer milk.
There was no difference found for κ -casein and somatic cells between seasons. They
found that summer cows consumed less dry matter, protein, and energy than spring cows
due to heat stress, which contributed to less milk yield and protein in the summer milk.
Ozrenk &Inci (2008) studied the seasonal effect on milk composition in Van Province
Turkey. They collected milk from 12 points in the region during winter (January –
March) and summer (June – August). They found that milk fat, protein, and total solid
percentages were significantly higher during the winter than the summer months. They
suggested that these changes might be due to the feeding pattern (high grains diet and low
fiber diets in winter), difference in photo light period and temperature differences.
19
Bertocchi et al. (2013) investigated annual, seasonal, and monthly variations in milk
characteristics (somatic cell count, total bacterial count, fat, and protein percentage) and
thermal humidity index (THI) -milk characteristics relationships over a seven-year period
(2003-2009) in Holstein dairy farms in Po Valley, Italy. They found high somatic cell
count, total bacterial counts, lower fat, and protein percentage in summer months.
However, they reported that the THI – milk characteristics study suggested that heat load
was not the main factor contributing to fat and protein decrease. They speculated that the
photo-period and lactation stage might be the contributing factor.
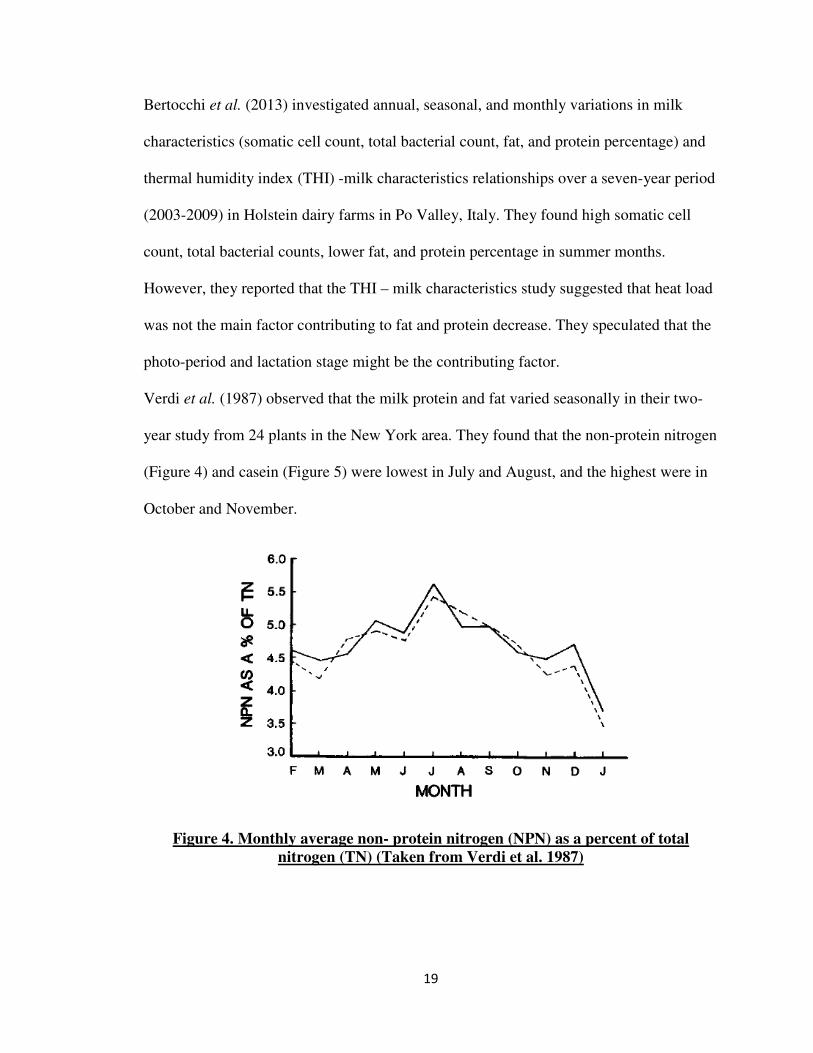
Verdi et al. (1987) observed that the milk protein and fat varied seasonally in their two-
year study from 24 plants in the New York area. They found that the non-protein nitrogen
(Figure 4) and casein (Figure 5) were lowest in July and August, and the highest were in
October and November.
Figure 4. Monthly average non- protein nitrogen (NPN) as a percent of total
nitrogen (TN) (Taken from Verdi et al. 1987)
20
Figure 5. Monthly average casein expressed as a percent of total nitrogen (Taken
from Verdi et al. 1987)
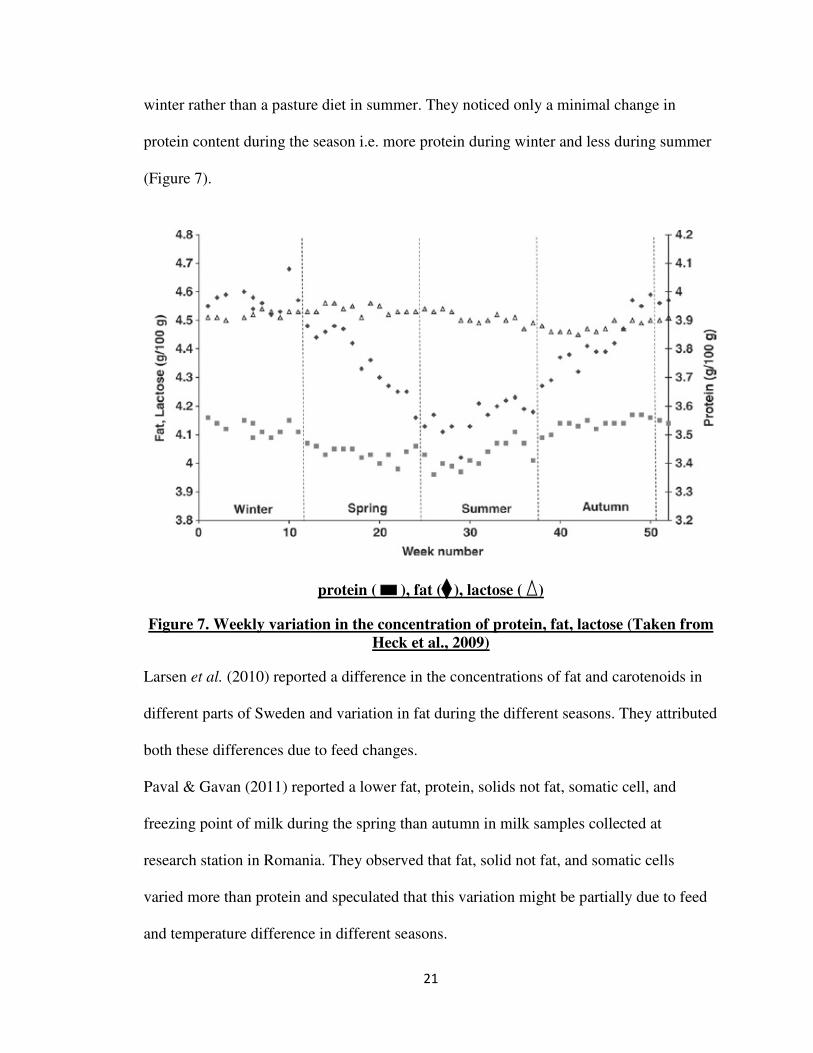
Verdi et al. (1987) also observed that the casein was low in high somatic cell (>500,000
cells/ml) than in low somatic milk (< 200,000 cells/ml) (Figure 6).
Figure 6. Monthly average casein expressed for the high and low somatic cell count
milk (Taken from Verdi et al. 1987)
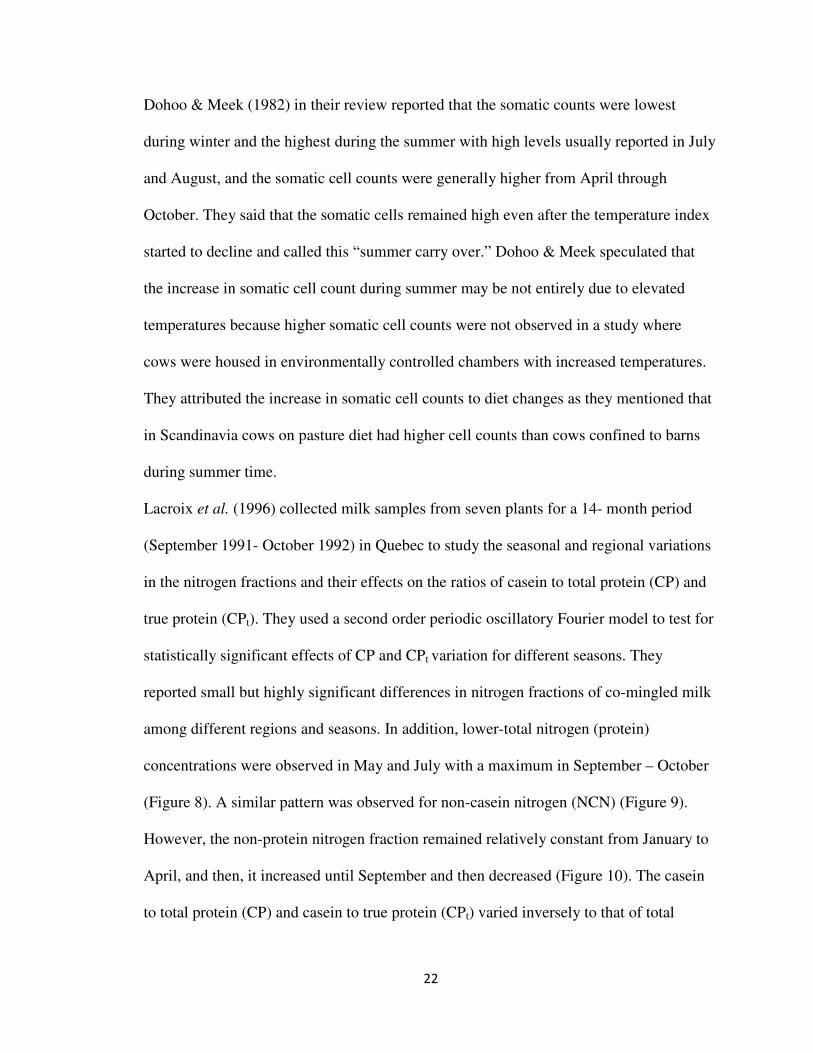
Heck et al. (2009) collected bulk milk samples from seventeen milk plants in Netherlands
from February 2005 to February 2006. In their study, they observed a higher fat in the
winter months than summer months in the milk and attributed this change to silage diet in
21
winter rather than a pasture diet in summer. They noticed only a minimal change in
protein content during the season i.e. more protein during winter and less during summer
(Figure 7).
protein ( ), fat ( ), lactose ( )
Figure 7. Weekly variation in the concentration of protein, fat, lactose (Taken from
Heck et al., 2009)
Larsen et al. (2010) reported a difference in the concentrations of fat and carotenoids in
different parts of Sweden and variation in fat during the different seasons. They attributed
both these differences due to feed changes.
Paval & Gavan (2011) reported a lower fat, protein, solids not fat, somatic cell, and
freezing point of milk during the spring than autumn in milk samples collected at
research station in Romania. They observed that fat, solid not fat, and somatic cells
varied more than protein and speculated that this variation might be partially due to feed
and temperature difference in different seasons.
22
Dohoo & Meek (1982) in their review reported that the somatic counts were lowest
during winter and the highest during the summer with high levels usually reported in July
and August, and the somatic cell counts were generally higher from April through
October. They said that the somatic cells remained high even after the temperature index
started to decline and called this “summer carry over.” Dohoo & Meek speculated that
the increase in somatic cell count during summer may be not entirely due to elevated
temperatures because higher somatic cell counts were not observed in a study where
cows were housed in environmentally controlled chambers with increased temperatures.
They attributed the increase in somatic cell counts to diet changes as they mentioned that
in Scandinavia cows on pasture diet had higher cell counts than cows confined to barns
during summer time.
Lacroix et al. (1996) collected milk samples from seven plants for a 14- month period
(September 1991- October 1992) in Quebec to study the seasonal and regional variations
in the nitrogen fractions and their effects on the ratios of casein to total protein (CP) and
true protein (CPt). They used a second order periodic oscillatory Fourier model to test for
statistically significant effects of CP and CPt variation for different seasons. They
reported small but highly significant differences in nitrogen fractions of co-mingled milk
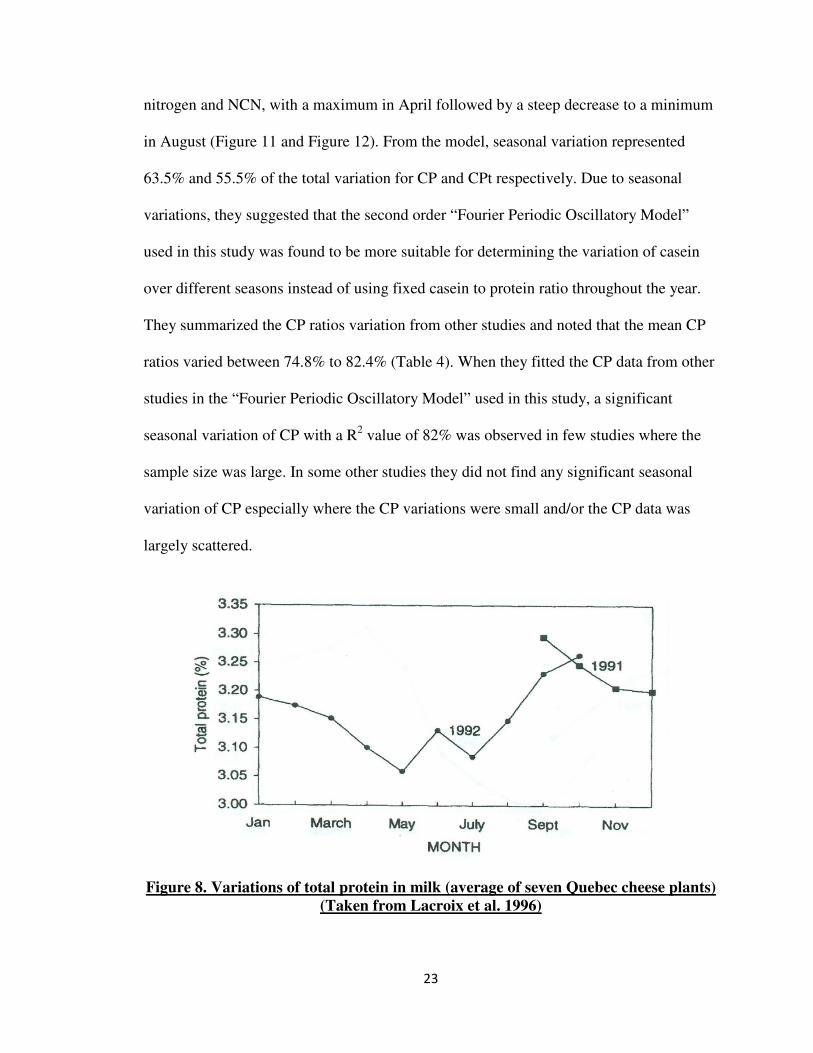
among different regions and seasons. In addition, lower-total nitrogen (protein)
concentrations were observed in May and July with a maximum in September – October
(Figure 8). A similar pattern was observed for non-casein nitrogen (NCN) (Figure 9).
However, the non-protein nitrogen fraction remained relatively constant from January to
April, and then, it increased until September and then decreased (Figure 10). The casein
to total protein (CP) and casein to true protein (CPt) varied inversely to that of total
23
nitrogen and NCN, with a maximum in April followed by a steep decrease to a minimum
in August (Figure 11 and Figure 12). From the model, seasonal variation represented
63.5% and 55.5% of the total variation for CP and CPt respectively. Due to seasonal
variations, they suggested that the second order “Fourier Periodic Oscillatory Model”
used in this study was found to be more suitable for determining the variation of casein
over different seasons instead of using fixed casein to protein ratio throughout the year.
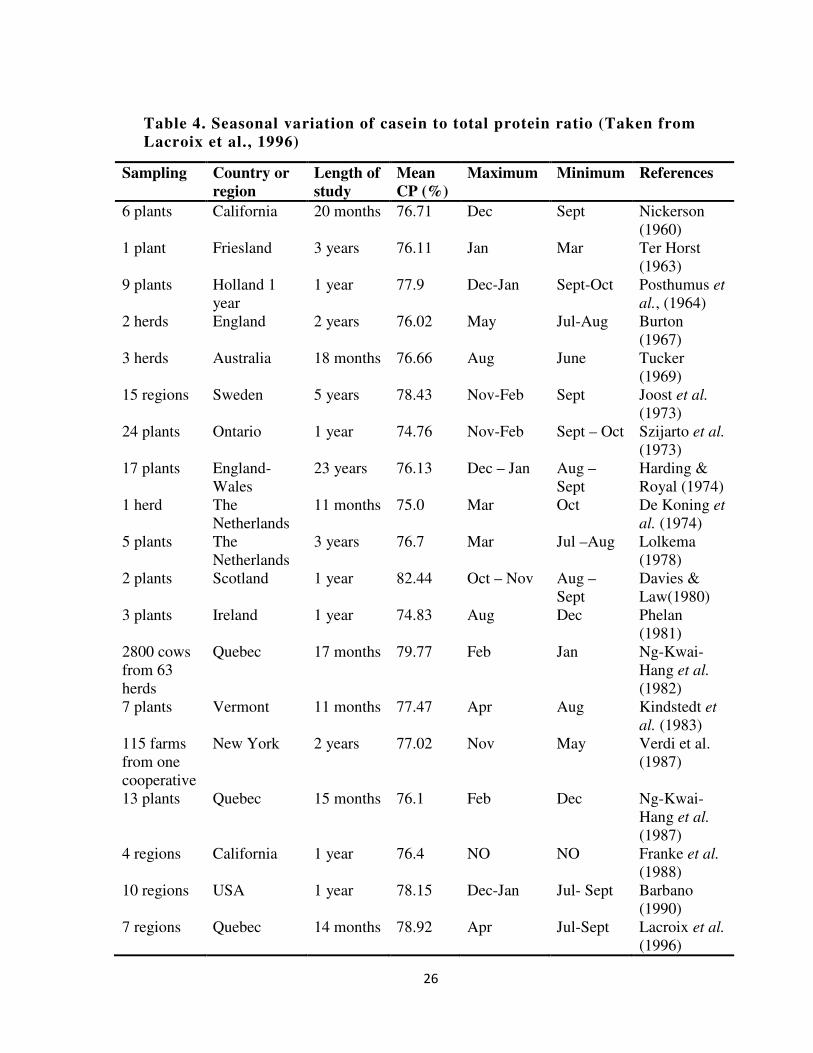
They summarized the CP ratios variation from other studies and noted that the mean CP
ratios varied between 74.8% to 82.4% (Table 4). When they fitted the CP data from other
studies in the “Fourier Periodic Oscillatory Model” used in this study, a significant
seasonal variation of CP with a R2 value of 82% was observed in few studies where the
sample size was large. In some other studies they did not find any significant seasonal
variation of CP especially where the CP variations were small and/or the CP data was
largely scattered.
Figure 8. Variations of total protein in milk (average of seven Quebec cheese plants)
(Taken from Lacroix et al. 1996)
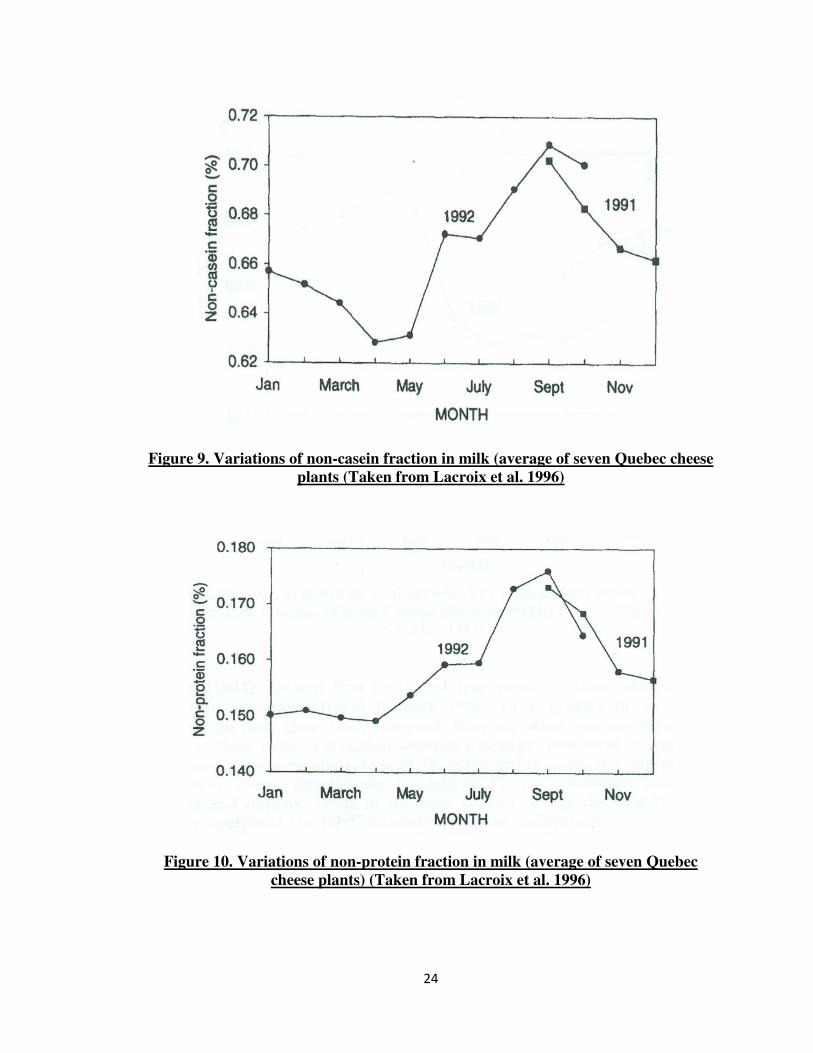
24
Figure 9. Variations of non-casein fraction in milk (average of seven Quebec cheese
plants (Taken from Lacroix et al. 1996)
Figure 10. Variations of non-protein fraction in milk (average of seven Quebec
cheese plants) (Taken from Lacroix et al. 1996)

25
Figure 11. Variation of casein to total protein (CP) ratio (Taken from Lacroix et al.
1996)
Figure 12. Variation of casein to true protein (CPt) ratio (Takenfrom Lacroix et al.
1996)
26
Table 4. Seasonal variation of casein to total protein ratio (Taken from
Lacroix et al., 1996)
Sampling Country or
region
Length of
study
Mean
CP (%)
Maximum Minimum References
6 plants California 20 months 76.71 Dec Sept Nickerson (1960)
1 plant Friesland 3 years 76.11 Jan Mar Ter Horst (1963)
9 plants Holland 1 year
1 year 77.9 Dec-Jan Sept-Oct Posthumus et
al., (1964) 2 herds England 2 years 76.02 May Jul-Aug Burton
(1967) 3 herds Australia 18 months 76.66 Aug June Tucker
(1969) 15 regions Sweden 5 years 78.43 Nov-Feb Sept Joost et al.
(1973) 24 plants Ontario 1 year 74.76 Nov-Feb Sept – Oct Szijarto et al.
(1973) 17 plants England-
Wales 23 years 76.13 Dec – Jan Aug –
Sept Harding & Royal (1974)
1 herd The Netherlands
11 months 75.0 Mar Oct De Koning et
al. (1974) 5 plants The
Netherlands 3 years 76.7 Mar Jul –Aug Lolkema
(1978) 2 plants Scotland 1 year 82.44 Oct – Nov Aug –
Sept Davies & Law(1980)
3 plants Ireland 1 year 74.83 Aug Dec Phelan (1981)
2800 cows from 63 herds
Quebec 17 months 79.77 Feb Jan Ng-Kwai-Hang et al. (1982)
7 plants Vermont 11 months 77.47 Apr Aug Kindstedt et
al. (1983) 115 farms from one cooperative
New York 2 years 77.02 Nov May Verdi et al. (1987)
13 plants Quebec 15 months 76.1 Feb Dec Ng-Kwai-Hang et al. (1987)
4 regions California 1 year 76.4 NO NO Franke et al. (1988)
10 regions USA 1 year 78.15 Dec-Jan Jul- Sept Barbano (1990)
7 regions Quebec 14 months 78.92 Apr Jul-Sept Lacroix et al. (1996)
27
7.b. Studies on Seasonal Variation of Milk Composition in California
In California, the seasonal variation in milk composition is thought to be minimal
because of the large herd sizes, constant production of milk maintained by having equal
number of cows freshen up each month, and feeding in dry lot throughout the year
(alfalfa and grain in proportion to production). Herds are also monitored regularly by
analyzing their milk for fat, protein, and lactose for payment by using Infra-Red Analyzer
(Bruhn & Franke, 1977). However, few studies have reported some seasonal changes in
the milk composition, and it is briefly discussed below.
Nickerson (1960) collected bulk milk samples from six processing plants in different
areas in California (Visalia, Newman, Davis, Willows, Petaluma, and Fernbridge). The
samples were collected over a nine-month period (June 1955 to October 1956) and
analyzed for 23 milk components. He reported significant compositional difference
among the bulk milk samples, both seasonally and within areas. He observed that 18 of
23 components, which include total solids, fat, SNF, total nitrogen, casein, and total
calcium varied significantly. Only proteose-peptone and non-protein nitrogen, two minor
phosphorus compounds, and soluble calcium failed to vary with season. He also noticed
that the milk that had the lowest average protein content also had the lowest calcium and
magnesium levels and vice versa. Most constituents that varied were lowest in May
through July and highest in November through January.
Frank et al. (1987) studied the suitability of California raw milks for the production of
cheese during 1983 by measuring the distribution of nitrogen of farm milk from four
major dairy regions in California. The four regions are North Bay, L.A. Basin, S. San
Joaquin Valley, and North West Coast. Though they observed a regional difference in
28
total protein and protein fractions, they found that there was no significant variation of
protein or its fraction with season in all the four regions.
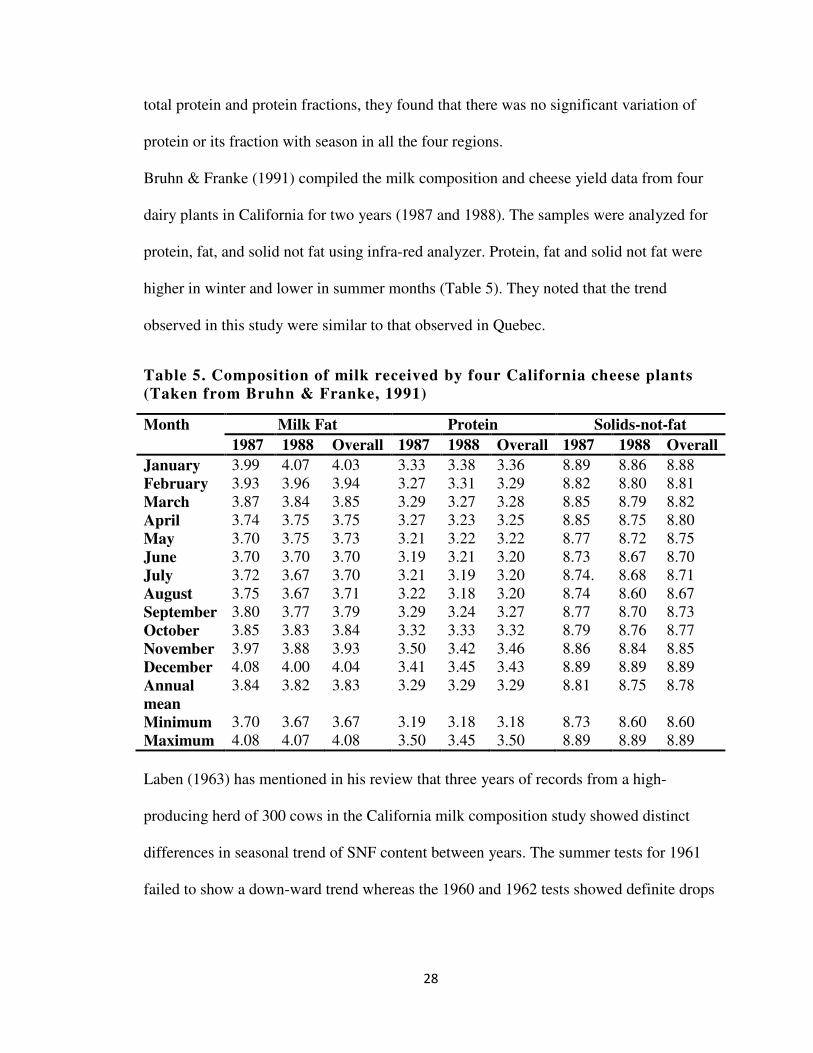
Bruhn & Franke (1991) compiled the milk composition and cheese yield data from four
dairy plants in California for two years (1987 and 1988). The samples were analyzed for
protein, fat, and solid not fat using infra-red analyzer. Protein, fat and solid not fat were
higher in winter and lower in summer months (Table 5). They noted that the trend
observed in this study were similar to that observed in Quebec.
Table 5. Composition of milk received by four California cheese plants
(Taken from Bruhn & Franke, 1991)
Month Milk Fat Protein Solids-not-fat
1987 1988 Overall 1987 1988 Overall 1987 1988 Overall
January 3.99 4.07 4.03 3.33 3.38 3.36 8.89 8.86 8.88 February 3.93 3.96 3.94 3.27 3.31 3.29 8.82 8.80 8.81 March 3.87 3.84 3.85 3.29 3.27 3.28 8.85 8.79 8.82 April 3.74 3.75 3.75 3.27 3.23 3.25 8.85 8.75 8.80 May 3.70 3.75 3.73 3.21 3.22 3.22 8.77 8.72 8.75 June 3.70 3.70 3.70 3.19 3.21 3.20 8.73 8.67 8.70 July 3.72 3.67 3.70 3.21 3.19 3.20 8.74. 8.68 8.71 August 3.75 3.67 3.71 3.22 3.18 3.20 8.74 8.60 8.67 September 3.80 3.77 3.79 3.29 3.24 3.27 8.77 8.70 8.73 October 3.85 3.83 3.84 3.32 3.33 3.32 8.79 8.76 8.77 November 3.97 3.88 3.93 3.50 3.42 3.46 8.86 8.84 8.85 December 4.08 4.00 4.04 3.41 3.45 3.43 8.89 8.89 8.89 Annual
mean
3.84 3.82 3.83 3.29 3.29 3.29 8.81 8.75 8.78
Minimum 3.70 3.67 3.67 3.19 3.18 3.18 8.73 8.60 8.60 Maximum 4.08 4.07 4.08 3.50 3.45 3.50 8.89 8.89 8.89
Laben (1963) has mentioned in his review that three years of records from a high-
producing herd of 300 cows in the California milk composition study showed distinct
differences in seasonal trend of SNF content between years. The summer tests for 1961
failed to show a down-ward trend whereas the 1960 and 1962 tests showed definite drops
29
in SNF tests from June through August. Milk fat test showed an almost identical
fluctuation of winter peaks and summer depressions all three years.
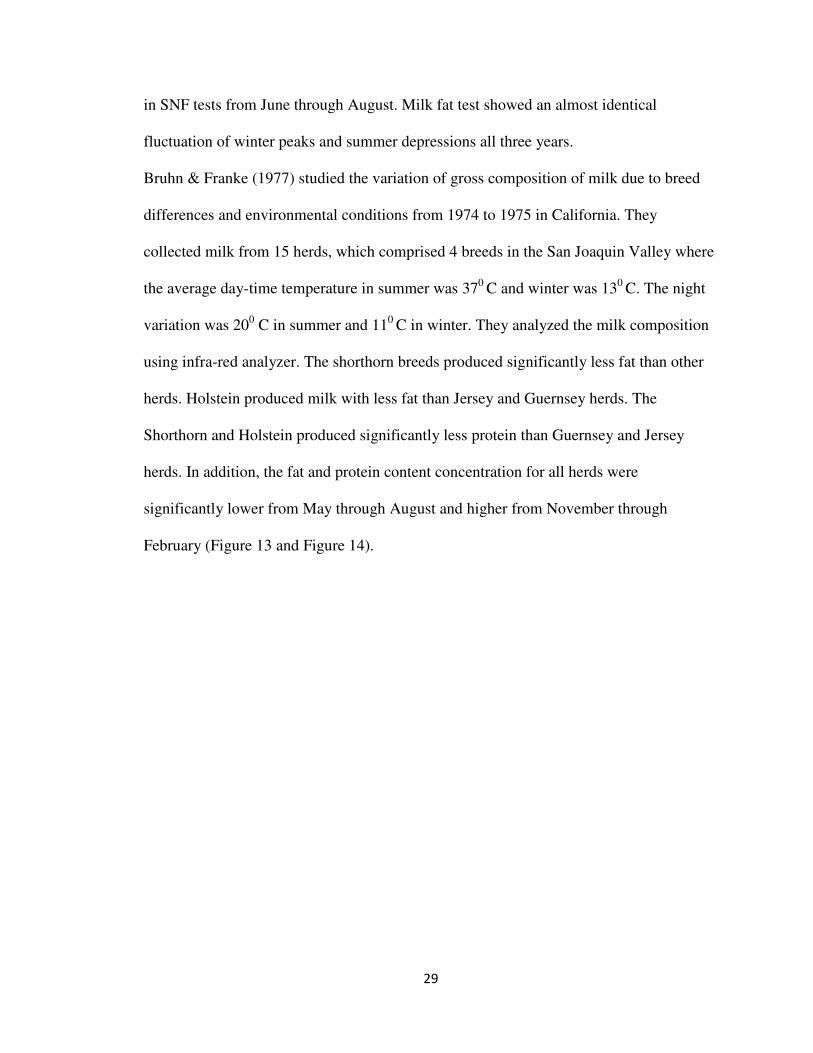
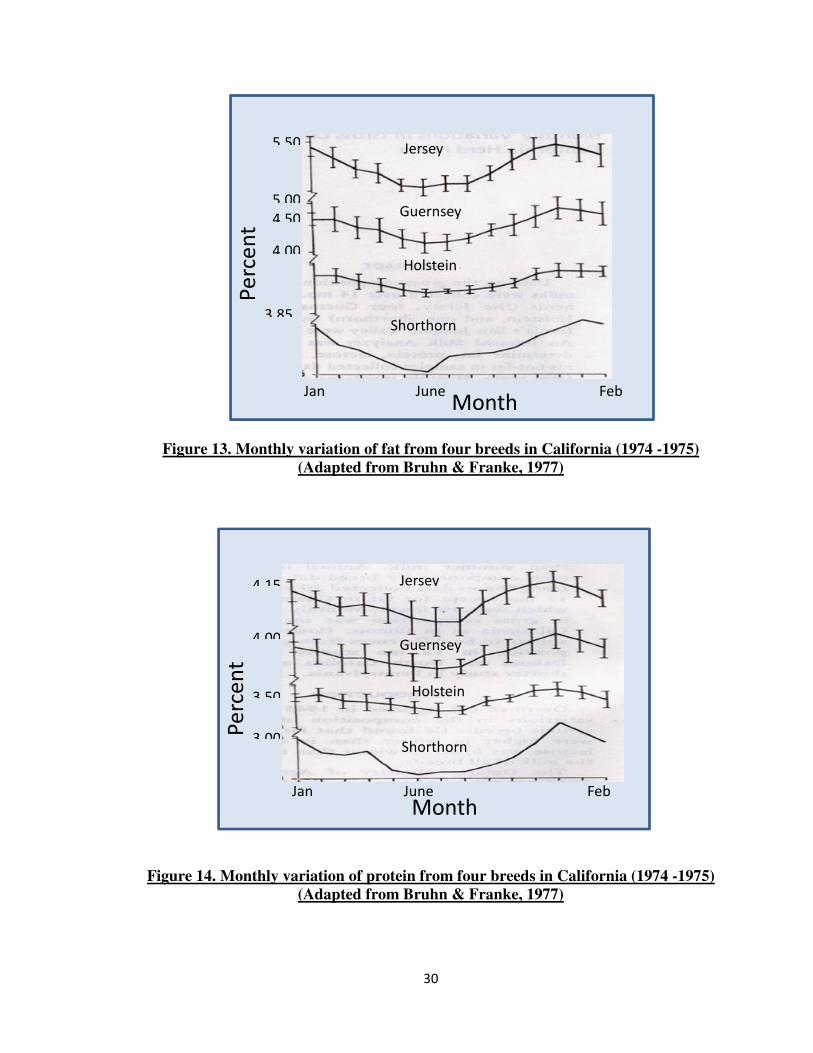
Bruhn & Franke (1977) studied the variation of gross composition of milk due to breed
differences and environmental conditions from 1974 to 1975 in California. They
collected milk from 15 herds, which comprised 4 breeds in the San Joaquin Valley where
the average day-time temperature in summer was 370 C and winter was 130 C. The night
variation was 200 C in summer and 110 C in winter. They analyzed the milk composition
using infra-red analyzer. The shorthorn breeds produced significantly less fat than other
herds. Holstein produced milk with less fat than Jersey and Guernsey herds. The
Shorthorn and Holstein produced significantly less protein than Guernsey and Jersey
herds. In addition, the fat and protein content concentration for all herds were
significantly lower from May through August and higher from November through
February (Figure 13 and Figure 14).
30
Figure 13. Monthly variation of fat from four breeds in California (1974 -1975)
(Adapted from Bruhn & Franke, 1977)
Figure 14. Monthly variation of protein from four breeds in California (1974 -1975)
(Adapted from Bruhn & Franke, 1977)
P
erc
en
t
Month
5.50
4.50
5.00
4.00
3.85
Jan June Feb
Jersey
Guernsey
Holstein
Shorthorn
Jersey
Guernsey
Holstein
Shorthorn
4.15
4.00
3.50
3.00 Pe
rce
nt
Jan June Feb Month
31
E. Low Moisture Part Skim (LMPS) Mozzarella
Mozzarella, originally made from buffalo milk in Italy, is one of the prominent members
in the pasta-filata cheese. Pasta-filata cheeses are made by plasticizing and kneading
fresh curd in hot water, which reorganizes into a unidirectional fibrous structure
(Kindstedt et al., 2004). When Italian cuisine, especially pizza, became popular in the
U.S, mozzarella began gaining importance. In 1985, 75% of all Mozzarella produced in
the US was used for pizza (Kindstedt, 1999). In 2010, 2.5 billion kg of Italian cheeses
were sold around the word and U.S accounts for about 2/3rd of global mozzarella
production. Most of the Mozzarella produced in the U.S. is targeted for the food service
industry (Jones G.M, 2011).
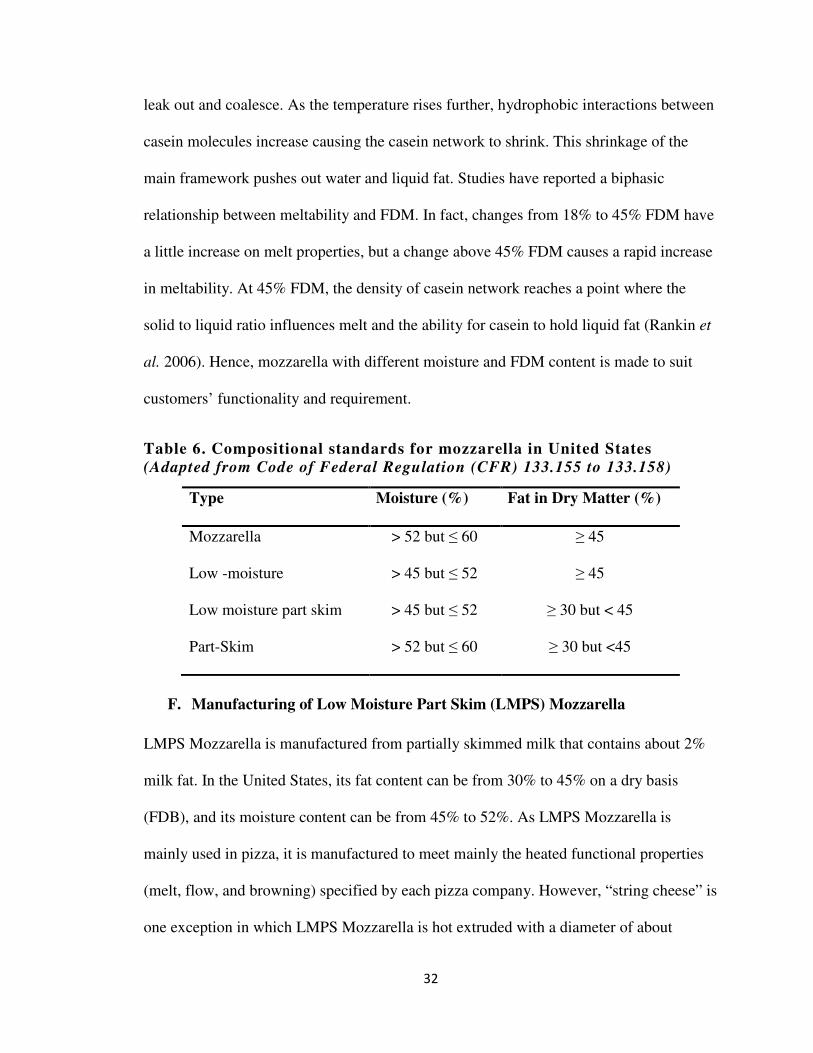
Mozzarella cheese is divided into four separate categories defined by standards of
identity in Code of Federal Regulation. It is categorized on the basis of moisture content
and fat in dry matter (FDM) as indicated in Table 6. Mozzarella and part skim mozzarella
have high moisture content and are soft bodied thereby shred poorly, clump together
more, and have a limited shelf life. Hence, these varieties of Mozzarella are mostly
consumed as table cheese and are not used often in food service as an ingredient for
pizza. In contrast, low moisture and low moisture part skim Mozzarella have much lower
water content (typically 47-48%), longer shelf life, and firmer body. These properties
impart good shredding and matting properties, and therefore, are used primarily as
ingredients for pizza and related foods (Kindstedt, 1999). A FDM of 45% is a critical for
the meltability and free oil release of Mozzarella (Rankin et al., 2006). During melting,
initial heat causes relaxation of the protein – protein bonds, which increases the
movement of casein strands and eventual collapse of the casein matrix, allowing fat to
32
leak out and coalesce. As the temperature rises further, hydrophobic interactions between
casein molecules increase causing the casein network to shrink. This shrinkage of the
main framework pushes out water and liquid fat. Studies have reported a biphasic
relationship between meltability and FDM. In fact, changes from 18% to 45% FDM have
a little increase on melt properties, but a change above 45% FDM causes a rapid increase
in meltability. At 45% FDM, the density of casein network reaches a point where the
solid to liquid ratio influences melt and the ability for casein to hold liquid fat (Rankin et
al. 2006). Hence, mozzarella with different moisture and FDM content is made to suit
customers’ functionality and requirement.
Table 6. Compositional standards for mozzarella in United States
(Adapted from Code of Federal Regulation (CFR) 133.155 to 133.158)
Type Moisture (%) Fat in Dry Matter (%)
Mozzarella > 52 but ≤ 60 ≥ 45
Low -moisture > 45 but ≤ 52 ≥ 45
Low moisture part skim > 45 but ≤ 52 ≥ 30 but < 45
Part-Skim > 52 but ≤ 60 ≥ 30 but <45
F. Manufacturing of Low Moisture Part Skim (LMPS) Mozzarella
LMPS Mozzarella is manufactured from partially skimmed milk that contains about 2%
milk fat. In the United States, its fat content can be from 30% to 45% on a dry basis
(FDB), and its moisture content can be from 45% to 52%. As LMPS Mozzarella is
mainly used in pizza, it is manufactured to meet mainly the heated functional properties
(melt, flow, and browning) specified by each pizza company. However, “string cheese” is
one exception in which LMPS Mozzarella is hot extruded with a diameter of about
33
1.5cm, brined, cut into finger-length pieces, and packaged as individually wrapped
pieces. It is a popular snack and generally consumed cold (McMahon & Oberg, 2011).
Traditionally, manufacture of low moisture Mozzarella is quite similar to that of cheddar,
with some notable changes. To compensate for the variation of milk composition, the
milk is standardized to ensure that manufactures meet the required levels of fat in dry
matter and moisture content. The milk is standardized to a casein-to-fat ratio of about 1.2
by removing cream or by adding solids in the form of liquid or dried skim milk
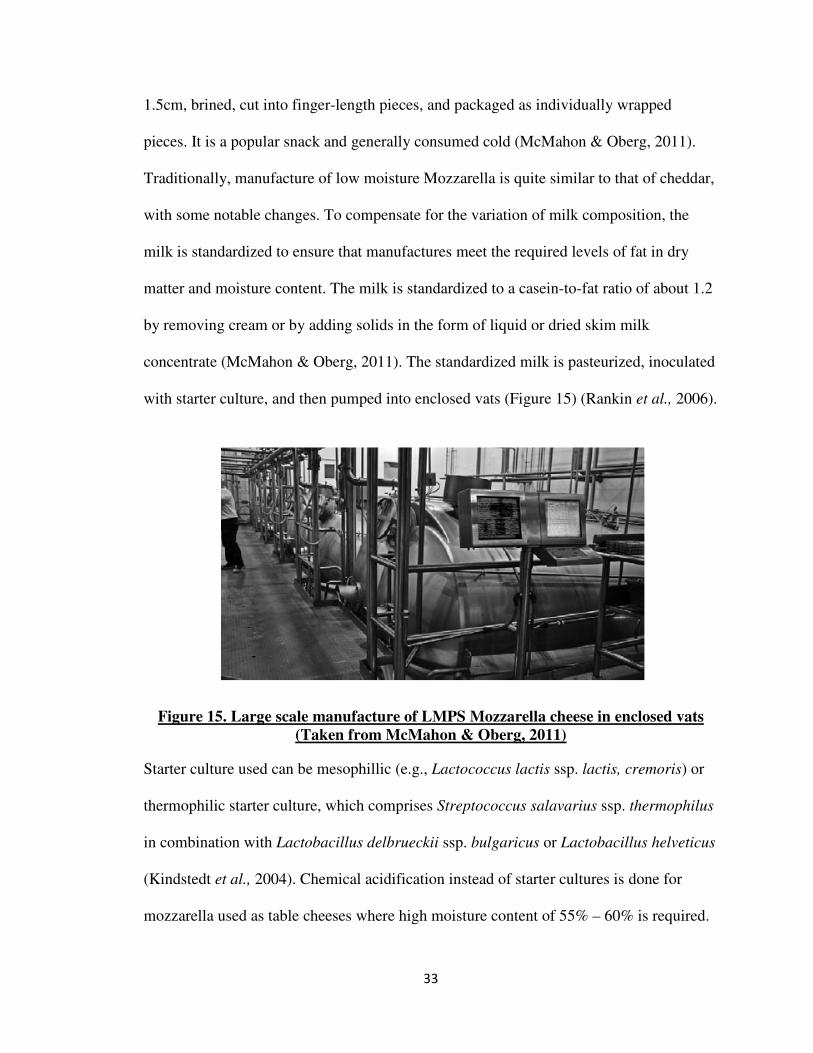
concentrate (McMahon & Oberg, 2011). The standardized milk is pasteurized, inoculated
with starter culture, and then pumped into enclosed vats (Figure 15) (Rankin et al., 2006).
Figure 15. Large scale manufacture of LMPS Mozzarella cheese in enclosed vats
(Taken from McMahon & Oberg, 2011)
Starter culture used can be mesophillic (e.g., Lactococcus lactis ssp. lactis, cremoris) or
thermophilic starter culture, which comprises Streptococcus salavarius ssp. thermophilus
in combination with Lactobacillus delbrueckii ssp. bulgaricus or Lactobacillus helveticus
(Kindstedt et al., 2004). Chemical acidification instead of starter cultures is done for
mozzarella used as table cheeses where high moisture content of 55% – 60% is required.
34
Chemical acidification is not used extensively for making low moisture Mozzarella
(McMahon & Oberg, 2011). Usually, thermophilic starters are used in the production of
low moisture part skim mozzarella. As this cheese has a mild flavor, the main function of
the starter is to produce lactic acid, which will solubilize the casein associated calcium so
that the curd will melt and stretch in hot water to give the desired texture and functional
properties. Then inoculated cheese milk is coagulated with rennet. Since thermophilic
cultures are used for LMPS Mozzarella, the milk is set at about 350 C (McMahon &
Oberg, 2011). Before the rennetting process, calcium chloride may be added to enhance
rennet properties, namely reduce the gelling time, and increase curd firmness. The
amount of calcium chloride depends on the quality of milk (Rankin et al., 2006).
However, addition of calcium chloride 40% (w/w) was found to cause weeping, water
loss, reduction in pH, and a more aggregated para casein matrix. This indicates that
calcium addition reduces the casein hydration and hence reduces the levels of moisture
and impacts the texture of mozzarella (Guinee & Fox, 2004).

35
Figure 16. Curd formation after rennetting of milk inside an enclosed vat (Adapted
from McMahon & Oberg, 2011)
The set curd (Figure 16) is cut to 2 inch pieces, stirred, and heated to about 400 C. At pH
6.2–6.3, it is pumped to a large enclosed conveyor belt system (Figure 17) where the
whey is drained, and the curd is stirred until a pH of 5.1 to 5.4 is reached (McMahon &
Oberg, 2011).
Figure 17. Curd mass cut into pieces as it exits the draining, matting and
cheddaring belt (Taken from McMahon & Oberg, 2011)
If salting of the curd is done at this step, the curd is removed at a slightly higher pH, and
salt is added. The milled curds, unsalted, partially salted or salted, are stretched
36
mechanically in hot brine or hot water and mechanically worked in a cooker/stretching
machine to produce the plastic consistency characteristic of pasta-filata cheeses
(McMahon & Oberg, 2011). In an industry, stretching and plasticization is usually done
in a two-step process. In the first step, the curd enters a reservoir of hot water at the front
of the mixer where the curd temperature increases to 500-550 C. The curd at this
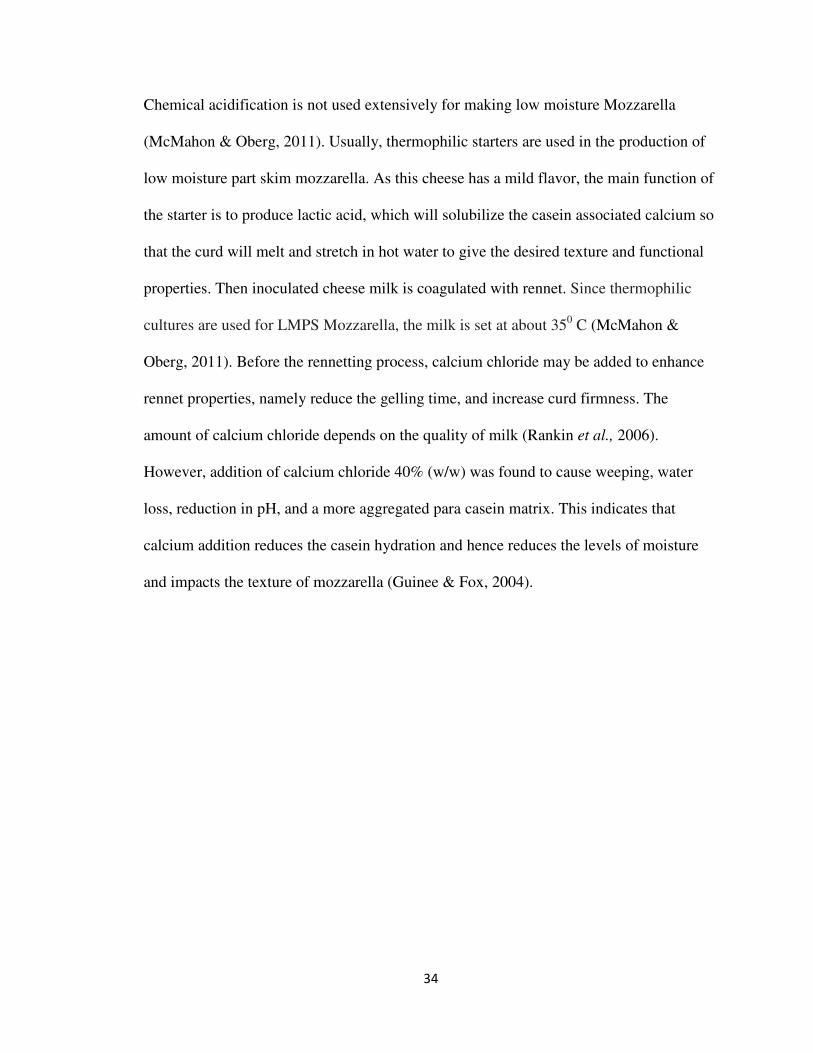
temperature is transformed into a plastic workable consistency. In the second stage, the
plasticized curd is kneaded and stretched by single or twin-screw augers as shown in
Figure 18 (Kindstedt et al., 2004).
Figure 18. Curd being mechanically stretched in hot water (Taken from McMahon
& Oberg, 2011)
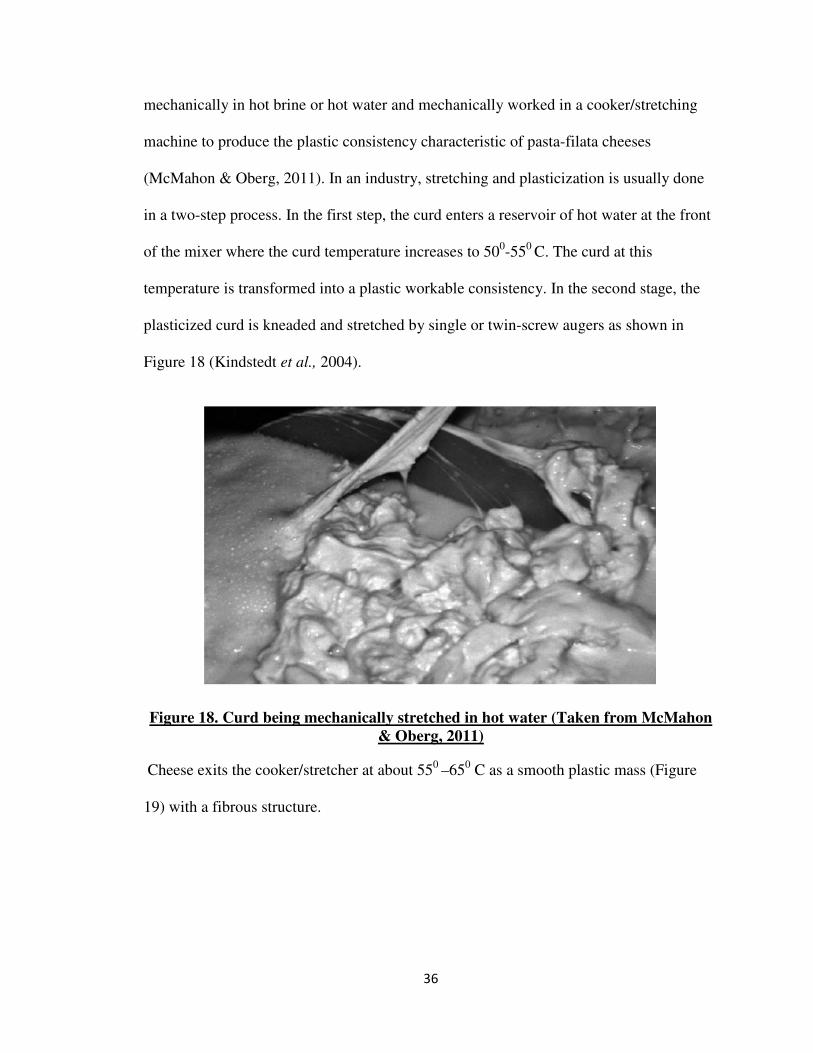
Cheese exits the cooker/stretcher at about 550 –650 C as a smooth plastic mass (Figure
19) with a fibrous structure.
37
Figure 19. Hot mass exiting the cooker/stretcher (Taken from McMahon & Oberg,
2011)
The hot mass of cheese is either filled under pressure into molds (Figure 20) or extruded
as a continuous ribbon, which is cooled in cold water, cold brine, or in a cooling tunnel.
Dry salt can be added before stretching or as hot cheese mass exits the cooker/stretcher,
or 5-10% hot brine solution is used as a part of the stretching process. Mechanization of
the cheese making process allows virtually any shape of block to be formed (Kindstedt et
al., 2004). The cheese blocks can also be cooled and then salted in a cool 5-10% brine
solution (Figure 21). Then the cheese block is dried and vacuum packaged (McMahon &
Oberg, 2011).
38
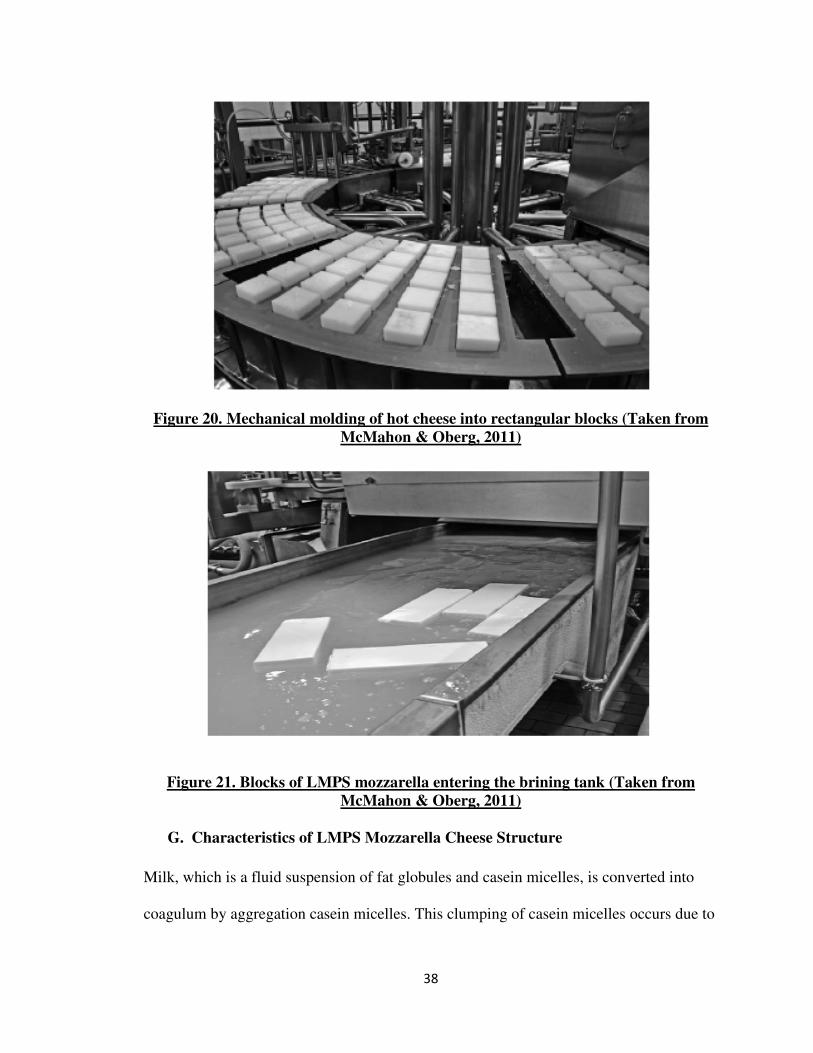
Figure 20. Mechanical molding of hot cheese into rectangular blocks (Taken from
McMahon & Oberg, 2011)
Figure 21. Blocks of LMPS mozzarella entering the brining tank (Taken from
McMahon & Oberg, 2011)
G. Characteristics of LMPS Mozzarella Cheese Structure
Milk, which is a fluid suspension of fat globules and casein micelles, is converted into
coagulum by aggregation casein micelles. This clumping of casein micelles occurs due to
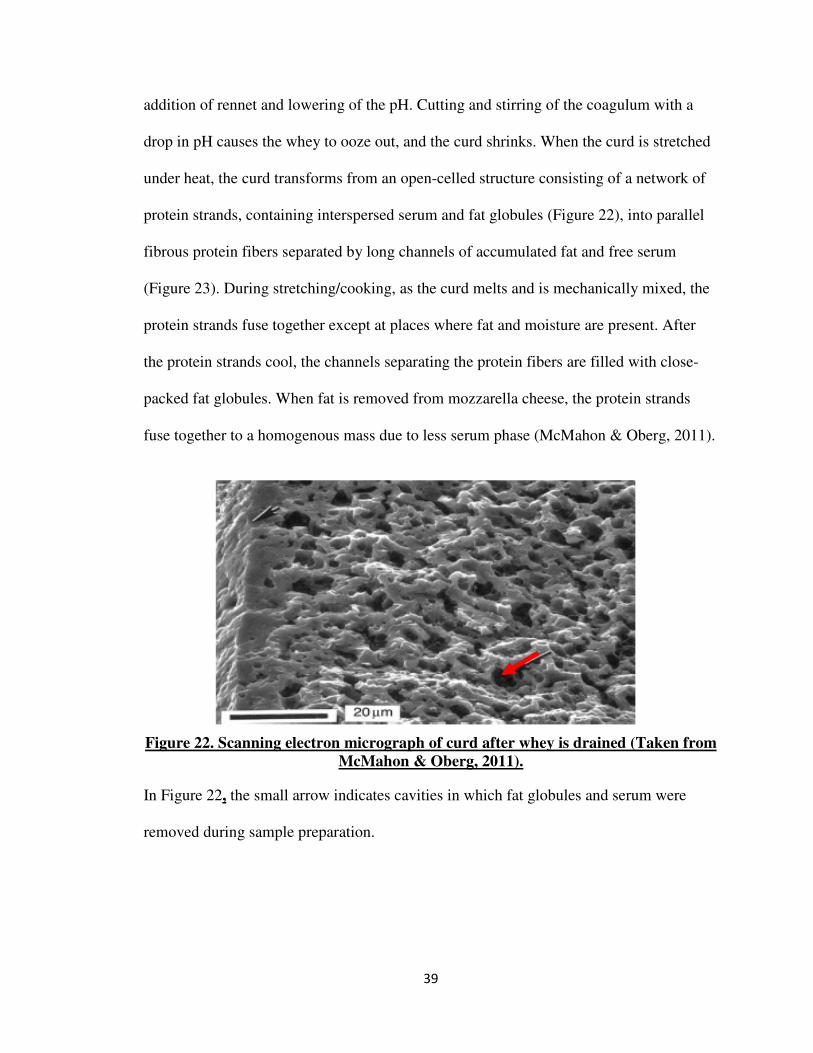
39
addition of rennet and lowering of the pH. Cutting and stirring of the coagulum with a
drop in pH causes the whey to ooze out, and the curd shrinks. When the curd is stretched
under heat, the curd transforms from an open-celled structure consisting of a network of
protein strands, containing interspersed serum and fat globules (Figure 22), into parallel
fibrous protein fibers separated by long channels of accumulated fat and free serum
(Figure 23). During stretching/cooking, as the curd melts and is mechanically mixed, the
protein strands fuse together except at places where fat and moisture are present. After
the protein strands cool, the channels separating the protein fibers are filled with close-
packed fat globules. When fat is removed from mozzarella cheese, the protein strands
fuse together to a homogenous mass due to less serum phase (McMahon & Oberg, 2011).
Figure 22. Scanning electron micrograph of curd after whey is drained (Taken from
McMahon & Oberg, 2011).
In Figure 22, the small arrow indicates cavities in which fat globules and serum were
removed during sample preparation.
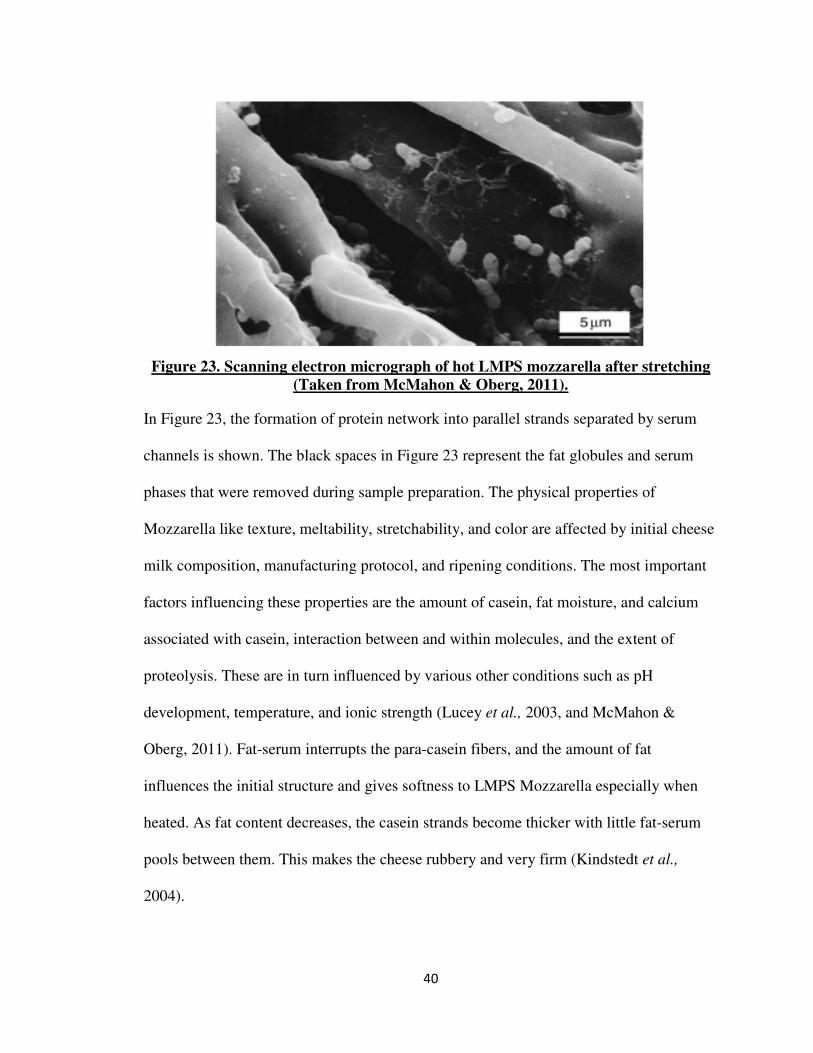
40
Figure 23. Scanning electron micrograph of hot LMPS mozzarella after stretching
(Taken from McMahon & Oberg, 2011).
In Figure 23, the formation of protein network into parallel strands separated by serum
channels is shown. The black spaces in Figure 23 represent the fat globules and serum
phases that were removed during sample preparation. The physical properties of
Mozzarella like texture, meltability, stretchability, and color are affected by initial cheese
milk composition, manufacturing protocol, and ripening conditions. The most important
factors influencing these properties are the amount of casein, fat moisture, and calcium
associated with casein, interaction between and within molecules, and the extent of
proteolysis. These are in turn influenced by various other conditions such as pH
development, temperature, and ionic strength (Lucey et al., 2003, and McMahon &
Oberg, 2011). Fat-serum interrupts the para-casein fibers, and the amount of fat
influences the initial structure and gives softness to LMPS Mozzarella especially when
heated. As fat content decreases, the casein strands become thicker with little fat-serum
pools between them. This makes the cheese rubbery and very firm (Kindstedt et al.,
2004).
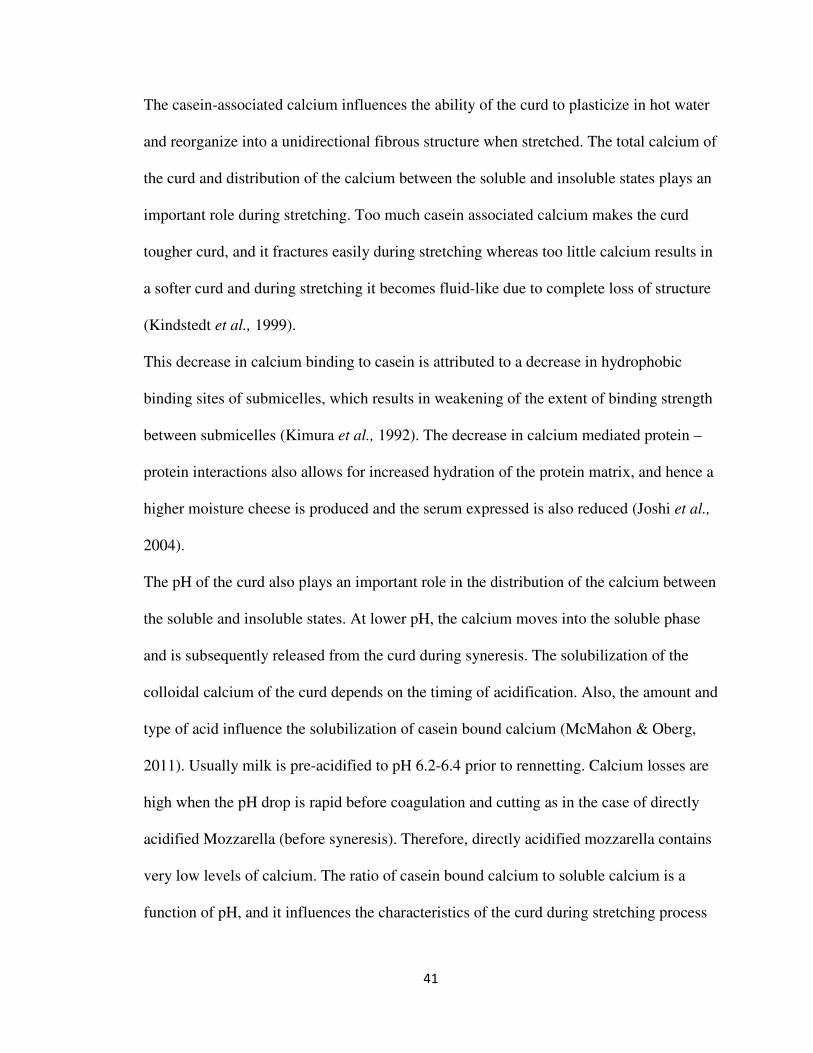
41
The casein-associated calcium influences the ability of the curd to plasticize in hot water
and reorganize into a unidirectional fibrous structure when stretched. The total calcium of
the curd and distribution of the calcium between the soluble and insoluble states plays an
important role during stretching. Too much casein associated calcium makes the curd
tougher curd, and it fractures easily during stretching whereas too little calcium results in
a softer curd and during stretching it becomes fluid-like due to complete loss of structure
(Kindstedt et al., 1999).
This decrease in calcium binding to casein is attributed to a decrease in hydrophobic
binding sites of submicelles, which results in weakening of the extent of binding strength
between submicelles (Kimura et al., 1992). The decrease in calcium mediated protein –
protein interactions also allows for increased hydration of the protein matrix, and hence a
higher moisture cheese is produced and the serum expressed is also reduced (Joshi et al.,
2004).
The pH of the curd also plays an important role in the distribution of the calcium between
the soluble and insoluble states. At lower pH, the calcium moves into the soluble phase
and is subsequently released from the curd during syneresis. The solubilization of the
colloidal calcium of the curd depends on the timing of acidification. Also, the amount and
type of acid influence the solubilization of casein bound calcium (McMahon & Oberg,
2011). Usually milk is pre-acidified to pH 6.2-6.4 prior to rennetting. Calcium losses are
high when the pH drop is rapid before coagulation and cutting as in the case of directly
acidified Mozzarella (before syneresis). Therefore, directly acidified mozzarella contains
very low levels of calcium. The ratio of casein bound calcium to soluble calcium is a
function of pH, and it influences the characteristics of the curd during stretching process
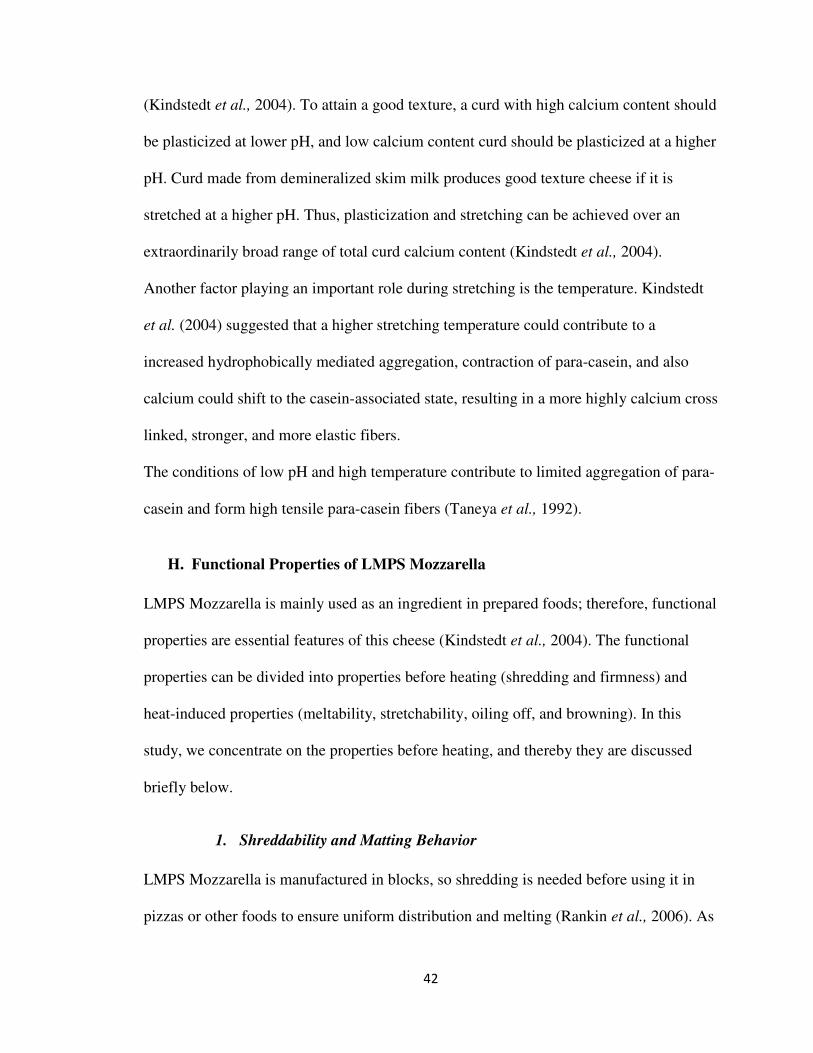
42
(Kindstedt et al., 2004). To attain a good texture, a curd with high calcium content should
be plasticized at lower pH, and low calcium content curd should be plasticized at a higher
pH. Curd made from demineralized skim milk produces good texture cheese if it is
stretched at a higher pH. Thus, plasticization and stretching can be achieved over an
extraordinarily broad range of total curd calcium content (Kindstedt et al., 2004).
Another factor playing an important role during stretching is the temperature. Kindstedt
et al. (2004) suggested that a higher stretching temperature could contribute to a
increased hydrophobically mediated aggregation, contraction of para-casein, and also
calcium could shift to the casein-associated state, resulting in a more highly calcium cross
linked, stronger, and more elastic fibers.
The conditions of low pH and high temperature contribute to limited aggregation of para-
casein and form high tensile para-casein fibers (Taneya et al., 1992).
H. Functional Properties of LMPS Mozzarella
LMPS Mozzarella is mainly used as an ingredient in prepared foods; therefore, functional
properties are essential features of this cheese (Kindstedt et al., 2004). The functional
properties can be divided into properties before heating (shredding and firmness) and
heat-induced properties (meltability, stretchability, oiling off, and browning). In this
study, we concentrate on the properties before heating, and thereby they are discussed
briefly below.
1. Shreddability and Matting Behavior
LMPS Mozzarella is manufactured in blocks, so shredding is needed before using it in
pizzas or other foods to ensure uniform distribution and melting (Rankin et al., 2006). As
43
explained by Kindstedt et al. 2004, the term shreddability refers to many functional
properties such as:
1. The ability of block to be passed through the shredder easily
2. Geometry and integrity of the shreds
3. Property of the curd not to shatter and form fines during shredding
4. Ability of the cheese to be free flowing and not clump together after shredding.
The problems with clogging the machines during shredding and causing the cheese to
mat after shredding often occur when the cheese is soft and pasty. Firm and dry cheese
cause the cheese to fracture easily and produce shattered shreds and fines (Childs et al.,
2007).
Chen (2003) reported that mozzarella cheese to be shredded must be firm in texture and
not adhesive. He reported that firmness does not vary over aging (a typical decrease is
about one unit through three months of aging). He noted that adhesiveness changes to a
greater extent with proteolysis. A firmer cheese with better shredding properties at higher
moisture content of 50% can be obtained if the curd temperature after the stretching
process was increased from 1350 F to 1500 F. They did not observe this effect at 47%
moisture. They also reported that without lowering the moisture content, firmer cheese
could be obtained if the final pH of the cheese is higher, and the mineral (calcium)
retention is increased.
Researchers found the firmer and less adhesive the cheese, the higher the quality of
shreds. Commercial shredders use centrifugal force to direct cheese cubes into stationery
blades, thus converting cheese cubes into shreds. A firm textured cheese has less
deformation, and blades are able to make cleaner cuts. In addition, a firm textured cheese

44
cube maintains a uniform speed, and blades can shred the entire length of the cube. On
the other hand, a soft textured cheese bends and deforms around the blade, slowing the
portion of the cheese cube in contact with the blade. The opposite side of cheese cube is
moving faster and has greater momentum. The momentum directs the cube away from
the blade before the blade cuts a full block length producing shorter and thinner shreds.
An adhesive cheese sticks to the blades slowing the portion of the cheese in contact with
the blade and resulting in shorter shreds (Rankin et al., 2006).
In low moisture Mozzarella, cheese composition, mainly high moisture content and fat
content (FDM of 45%), causes cheese to clog in the shredder. The increase in moisture
content and fat in cheese causes a decrease in modulus of elasticity, which causes
difficulty during shredding (Kindstedt et al., 2004).
Age of cheese at the time of shredding also affects the quality of shreds. Newly
manufactured cheese has a lot of moisture on the surface than within the body of cheese
and hence shreds poorly. Four to five days of ageing causes the moisture to absorb into
the cheese due to hydration of the para-casein matrix, and thereby the shredding quality
improves. Due to proteolysis, Mozzarella cheese that is aged too long will become too
soft and gummy and thereby will clog in the shredder and will not produce high quality
shreds (Kindstedt et al., 2004).
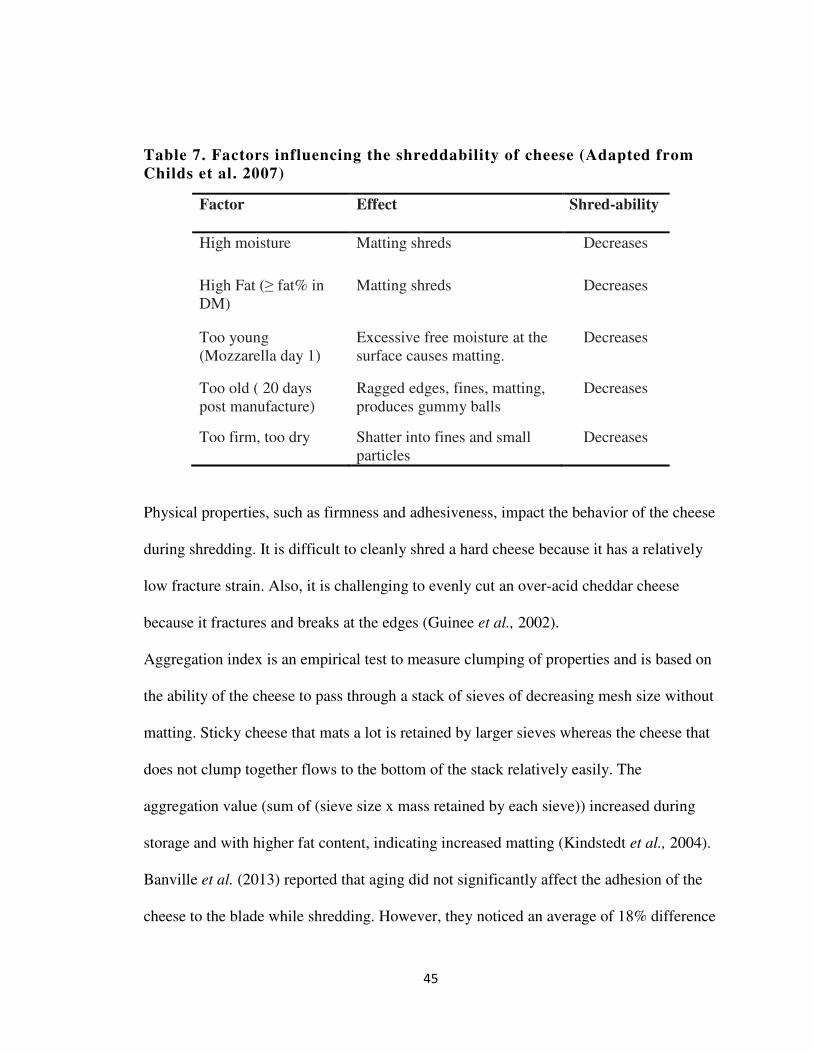
45
Table 7. Factors influencing the shreddability of cheese (Adapted from
Childs et al. 2007)
Factor Effect Shred-ability
High moisture Matting shreds Decreases
High Fat (≥ fat% in DM)
Matting shreds Decreases
Too young (Mozzarella day 1)
Excessive free moisture at the surface causes matting.
Decreases
Too old ( 20 days post manufacture)
Ragged edges, fines, matting, produces gummy balls
Decreases
Too firm, too dry Shatter into fines and small particles
Decreases
Physical properties, such as firmness and adhesiveness, impact the behavior of the cheese
during shredding. It is difficult to cleanly shred a hard cheese because it has a relatively
low fracture strain. Also, it is challenging to evenly cut an over-acid cheddar cheese
because it fractures and breaks at the edges (Guinee et al., 2002).
Aggregation index is an empirical test to measure clumping of properties and is based on
the ability of the cheese to pass through a stack of sieves of decreasing mesh size without
matting. Sticky cheese that mats a lot is retained by larger sieves whereas the cheese that
does not clump together flows to the bottom of the stack relatively easily. The
aggregation value (sum of (sieve size x mass retained by each sieve)) increased during
storage and with higher fat content, indicating increased matting (Kindstedt et al., 2004).
Banville et al. (2013) reported that aging did not significantly affect the adhesion of the
cheese to the blade while shredding. However, they noticed an average of 18% difference
46
in adhesion for cheese stored at eight and thirty-six days, indicating a trend that ageing
increased adhesion. In addition, more adhesion was observed when the cheese was
shredded at room temperature (220 C) than at 40 C and 130 C. A lower rennetting pH was
found to increase the adhesion on the blade when shredding is done at room temperature,
causing the cheese to adhere more to the blade. However, lower rennetting pH decreased
fines during the shredding process. They also observed that matting was highest in room
temperature 220 C and lowest at 40 C.
Childs et al. (2007) evaluated adhesive properties of cheese by measuring tack energy,
which is the energy required to separate two materials that are not bound permanently.
They concluded that an increase in tack energy was associated with an increase in cheese
adherence to the cutting blade. Tack energy for Monterey jack and process cheese was
greater than the tack energy for mozzarella cheese, which indicates that a three- month
Monterey jack had greater adhesion to the blade than the young Mozzarella. They found
that the tack energy and visco-elastic properties were the best indicators of shredding
defects, and adherence to the blade was positively associated with cheese viscosity, and
the production of fines was associated with increases in firmness.
2. Texture of Cheese
Fox et al. 2002 stated, “Rheology involves those properties that respond to stress or strain
that is applied during processing and consumption of cheese.” These properties include
elasticity, viscosity, fracture stress, and firmness among others. Texture is defined as a
sensory attribute resulting from the perceptions perceived by senses like sight, touch,
chewing, and swallowing (Fox et al., 2000).

47
Sensory evaluation of cheese texture requires extensive training, and therefore it is time
consuming. Also, the wide variation in the test results can affect the conclusion of the
study. As a result, instrumental methods were developed to quantify the sensory
perceptions of texture (Fox et al., 2000).
Many empirical and imitative instrumental tests have been developed to measure the
sensory texture descriptors, but by far the most popular imitative test is the uniaxial
double bite compression test at a constant speed, using texture analyzers like Instron
Universal testing Machine, TA.XT2 and TA.HD texture analyzers (Callagahan & Guinee,
2004). The texture profile analysis (TPA) graph obtained using the double bite
compression test is shown and explained in the material and methods section.
Many studies have shown high correlation of mechanical parameters with sensory
parameters like mechanical hardness with sensory hardness. Hence, by using instrumental
methods, the small changes in physical characteristics of cheese can be quantified
(Callagahan & Guinee, 2004). However, because of factors like complexity of
mastication, differences between individuals in the perception of texture, and the effect of
time of day, the texture analyzer cannot become a complete substitute to sensory
evaluation (Halmos, 2000).
The hardness or firmness of mozzarella studied using the similar uniaxial compression
tests have shown that low moisture mozzarella became significantly softer with
increasing age (proteolysis), higher levels of fat and moisture content, and decreasing
levels of calcium and pH (Kindstedt et al., 2004).
Yun et al. (1993) reported that TPA hardness of un-melted low moisture mozzarella
appeared to decrease with decreasing cooking temperature and increasing moisture
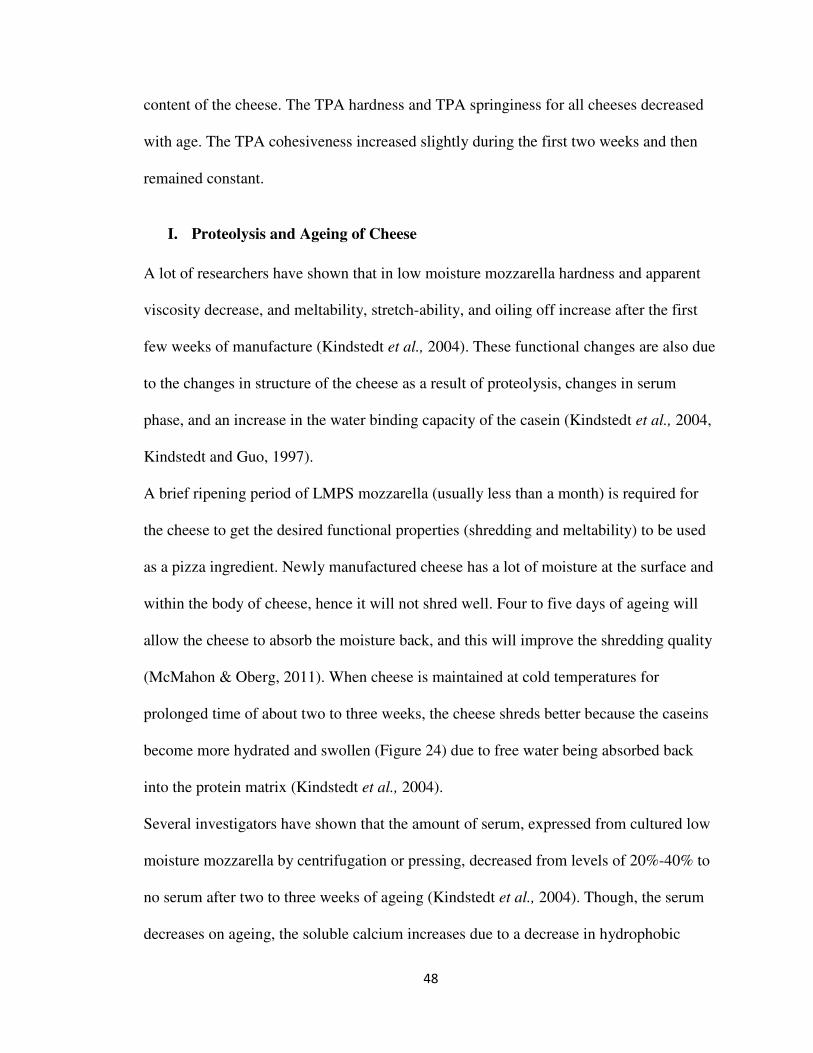
48
content of the cheese. The TPA hardness and TPA springiness for all cheeses decreased
with age. The TPA cohesiveness increased slightly during the first two weeks and then
remained constant.
I. Proteolysis and Ageing of Cheese
A lot of researchers have shown that in low moisture mozzarella hardness and apparent
viscosity decrease, and meltability, stretch-ability, and oiling off increase after the first
few weeks of manufacture (Kindstedt et al., 2004). These functional changes are also due
to the changes in structure of the cheese as a result of proteolysis, changes in serum
phase, and an increase in the water binding capacity of the casein (Kindstedt et al., 2004,
Kindstedt and Guo, 1997).
A brief ripening period of LMPS mozzarella (usually less than a month) is required for
the cheese to get the desired functional properties (shredding and meltability) to be used
as a pizza ingredient. Newly manufactured cheese has a lot of moisture at the surface and
within the body of cheese, hence it will not shred well. Four to five days of ageing will
allow the cheese to absorb the moisture back, and this will improve the shredding quality
(McMahon & Oberg, 2011). When cheese is maintained at cold temperatures for
prolonged time of about two to three weeks, the cheese shreds better because the caseins
become more hydrated and swollen (Figure 24) due to free water being absorbed back
into the protein matrix (Kindstedt et al., 2004).
Several investigators have shown that the amount of serum, expressed from cultured low
moisture mozzarella by centrifugation or pressing, decreased from levels of 20%-40% to
no serum after two to three weeks of ageing (Kindstedt et al., 2004). Though, the serum
decreases on ageing, the soluble calcium increases due to a decrease in hydrophobic
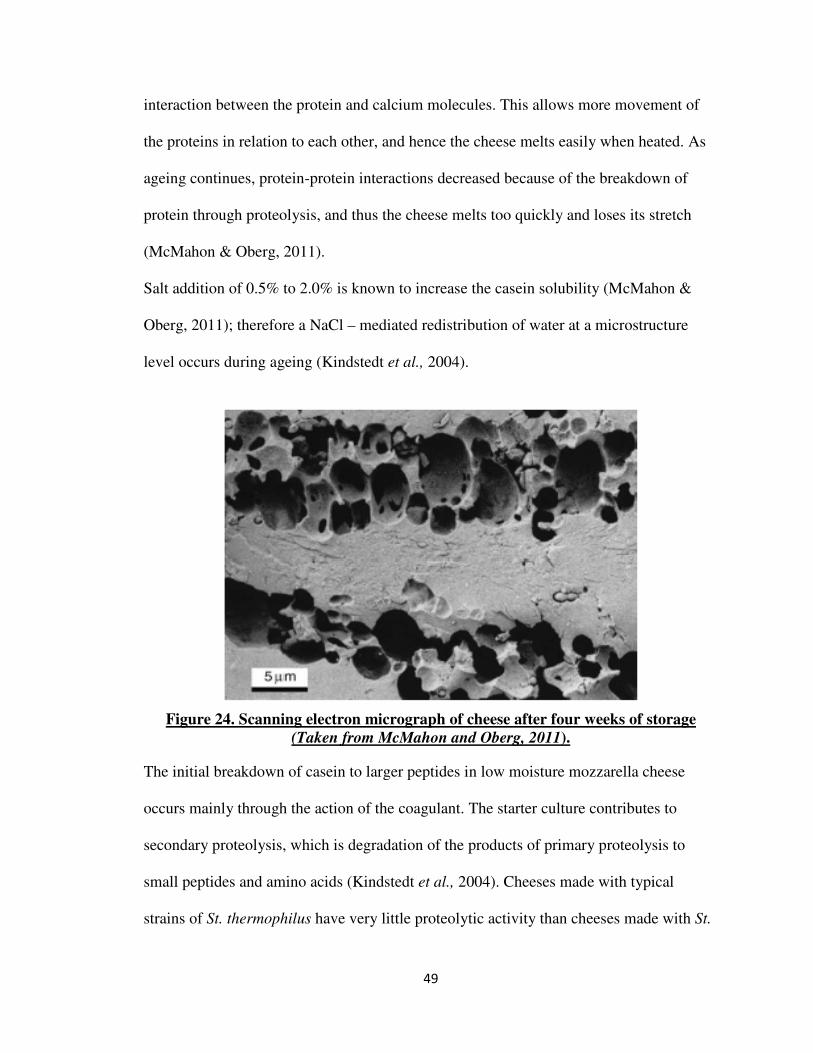
49
interaction between the protein and calcium molecules. This allows more movement of
the proteins in relation to each other, and hence the cheese melts easily when heated. As
ageing continues, protein-protein interactions decreased because of the breakdown of
protein through proteolysis, and thus the cheese melts too quickly and loses its stretch
(McMahon & Oberg, 2011).
Salt addition of 0.5% to 2.0% is known to increase the casein solubility (McMahon &
Oberg, 2011); therefore a NaCl – mediated redistribution of water at a microstructure
level occurs during ageing (Kindstedt et al., 2004).
Figure 24. Scanning electron micrograph of cheese after four weeks of storage
(Taken from McMahon and Oberg, 2011).
The initial breakdown of casein to larger peptides in low moisture mozzarella cheese
occurs mainly through the action of the coagulant. The starter culture contributes to
secondary proteolysis, which is degradation of the products of primary proteolysis to
small peptides and amino acids (Kindstedt et al., 2004). Cheeses made with typical
strains of St. thermophilus have very little proteolytic activity than cheeses made with St.

50
thermophilus combined with Lactobacillus helveticus. This is because Lactobacillus
helveticus has a more proteolytic activity whereas strains of St. thermophilus have very
little proteolytic activity. Lactobacillus delbruekii also causes proteolysis of αs1 –casein.
The proteolysis of β-casein occurs very slowly with most of the β-casein remaining intact
(McMahon & Oberg, 2011). However, there is evidence of plasmin activity in mozzarella
cheese during ripening, and this causes degradation of the β-casein to form the γ-casein
(Creamer, 1976).
The proteolysis occurs in the first month of storage depending on cheese composition,
residual coagulant, and manufacturing methods. Cheeses with higher moisture content
undergo faster proteolysis. Increasing or decreasing the residual coagulant level in the
cheese has a corresponding effect on the rate of initial cleavage of caseins. The extent of
proteolysis varies widely depending on the temperature and time of hot water stretching
and the consequent thermal inactivation of the starter culture. If the curd is stretched at a
higher temperature, the residual coagulant and starter activity in the cheese will be
limited; hence the cheese will have to be stored for a longer time to get the desirable
functional properties (McMahon & Oberg, 2011).
Feeney et al. (2001) reported that water-soluble nitrogen (WSN) soluble at pH 4.6
increased in low moisture mozzarella as it matured at different temperatures for 70 days
(Figure 25). After 15 days, there was significant difference in pH 4.6 WSN between
cheese ripened at 100 C, 150 C, and cheese ripened at 00, 40 C. Urea- PAGE of the pH 4.6
insoluble portion showed that there was αs1-casein degradation during ripening and
increasing temperatures affected the degradation significantly. The maximum proteolysis
of αs1-casein was observed at 100 C and 150 C.
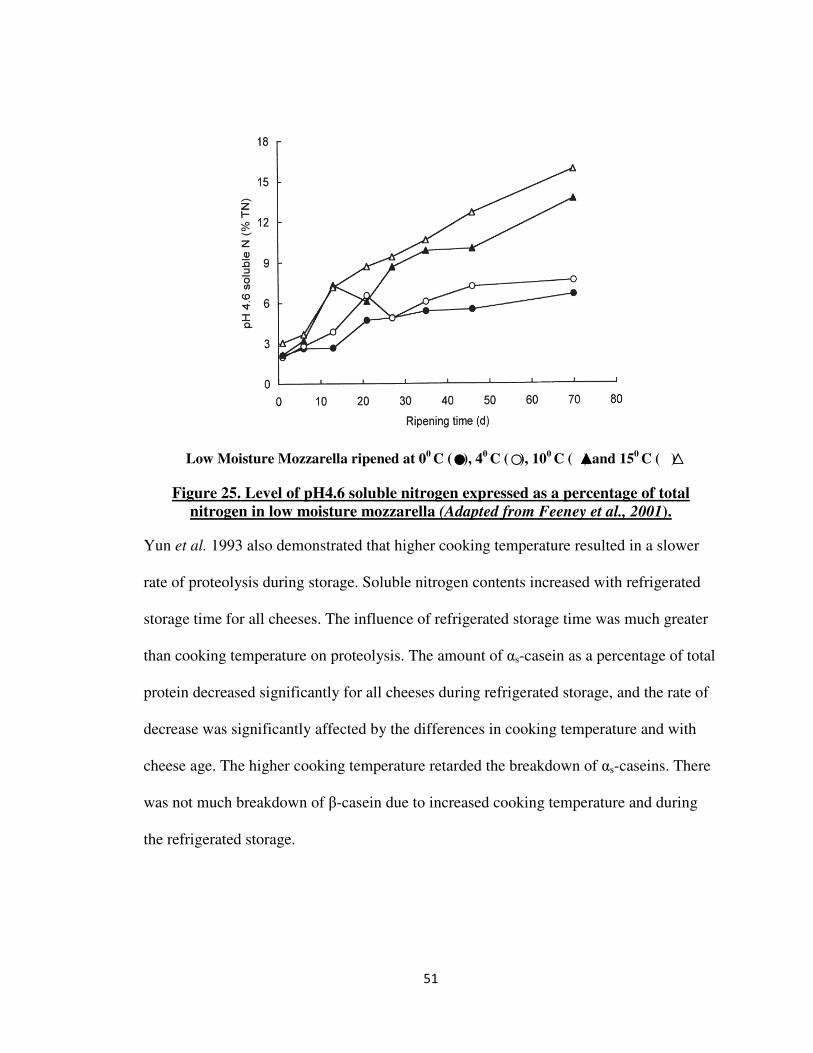
51
Low Moisture Mozzarella ripened at 00 C ( ), 4
0 C ( ), 10
0 C ( ) and 15
0 C ( )
Figure 25. Level of pH4.6 soluble nitrogen expressed as a percentage of total
nitrogen in low moisture mozzarella (Adapted from Feeney et al., 2001).
Yun et al. 1993 also demonstrated that higher cooking temperature resulted in a slower
rate of proteolysis during storage. Soluble nitrogen contents increased with refrigerated
storage time for all cheeses. The influence of refrigerated storage time was much greater
than cooking temperature on proteolysis. The amount of αs-casein as a percentage of total
protein decreased significantly for all cheeses during refrigerated storage, and the rate of
decrease was significantly affected by the differences in cooking temperature and with
cheese age. The higher cooking temperature retarded the breakdown of αs-caseins. There
was not much breakdown of β-casein due to increased cooking temperature and during
the refrigerated storage.
52
III. MATERIALS AND METHODS
A. Sample collection
1. Milk Sampling
Composite milk samples were collected every week at a plant in Central Valley
California from July 2008 to December 2009. A total of seventy-six milk samples were
collected every week over a period of 18 months. A weekly composite milk sample was
made from silo milk collected every day. One tablet of 18 mg broad spectrum Microtabs
II was added to the 40 ml milk as a preservative, and the milk sample was stored at 40 C.
Two weekly composite milk samples were then shipped to Dairy Products Technology
Center, California Polytechnic State University, San Luis Obispo, California (DPTC, Cal
Poly) over night in a cooler box. The schematic diagram of the milk sampling plan is
shown in Figure 26.
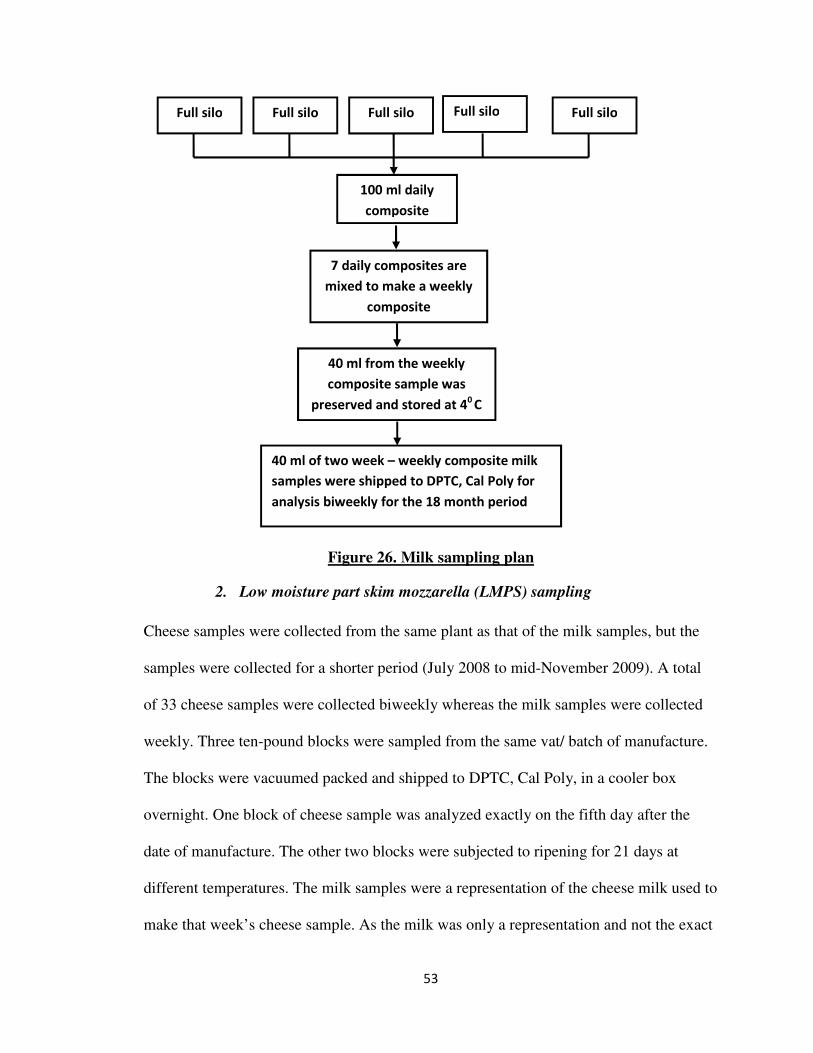
53
Figure 26. Milk sampling plan
2. Low moisture part skim mozzarella (LMPS) sampling
Cheese samples were collected from the same plant as that of the milk samples, but the
samples were collected for a shorter period (July 2008 to mid-November 2009). A total
of 33 cheese samples were collected biweekly whereas the milk samples were collected
weekly. Three ten-pound blocks were sampled from the same vat/ batch of manufacture.
The blocks were vacuumed packed and shipped to DPTC, Cal Poly, in a cooler box
overnight. One block of cheese sample was analyzed exactly on the fifth day after the
date of manufacture. The other two blocks were subjected to ripening for 21 days at
different temperatures. The milk samples were a representation of the cheese milk used to
make that week’s cheese sample. As the milk was only a representation and not the exact
Full silo
100 ml daily
composite
7 daily composites are
mixed to make a weekly
composite
Full silo Full silo Full silo
40 ml of two week – weekly composite milk
samples were shipped to DPTC, Cal Poly for
analysis biweekly for the 18 month period
40 ml from the weekly
composite sample was
preserved and stored at 40 C
Full silo
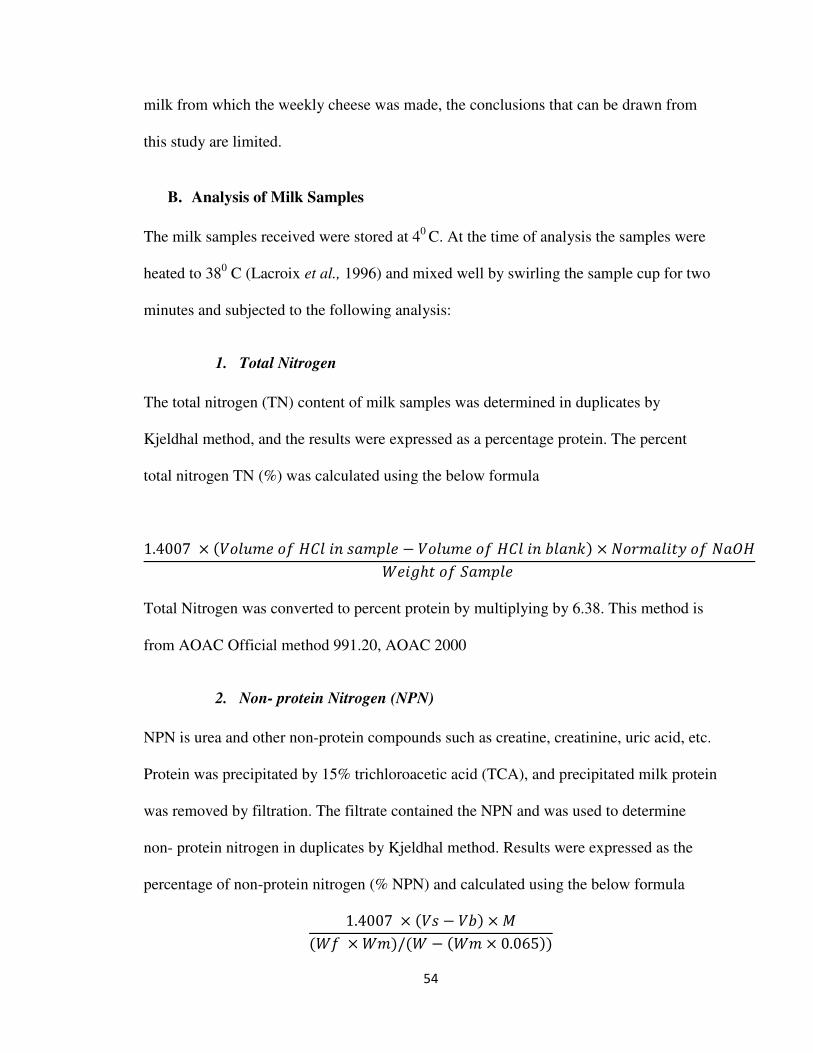
54
milk from which the weekly cheese was made, the conclusions that can be drawn from
this study are limited.
B. Analysis of Milk Samples
The milk samples received were stored at 40 C. At the time of analysis the samples were
heated to 380 C (Lacroix et al., 1996) and mixed well by swirling the sample cup for two
minutes and subjected to the following analysis:
1. Total Nitrogen
The total nitrogen (TN) content of milk samples was determined in duplicates by
Kjeldhal method, and the results were expressed as a percentage protein. The percent
total nitrogen TN (%) was calculated using the below formula
1.4007 × ��� ��������� ��� − �� ������������� × �� ���������� ��!ℎ��#� ���
Total Nitrogen was converted to percent protein by multiplying by 6.38. This method is
from AOAC Official method 991.20, AOAC 2000
2. Non- protein Nitrogen (NPN)
NPN is urea and other non-protein compounds such as creatine, creatinine, uric acid, etc.
Protein was precipitated by 15% trichloroacetic acid (TCA), and precipitated milk protein
was removed by filtration. The filtrate contained the NPN and was used to determine
non- protein nitrogen in duplicates by Kjeldhal method. Results were expressed as the
percentage of non-protein nitrogen (% NPN) and calculated using the below formula
1.4007 × �� − �� × $� � × �/� − � × 0.065��
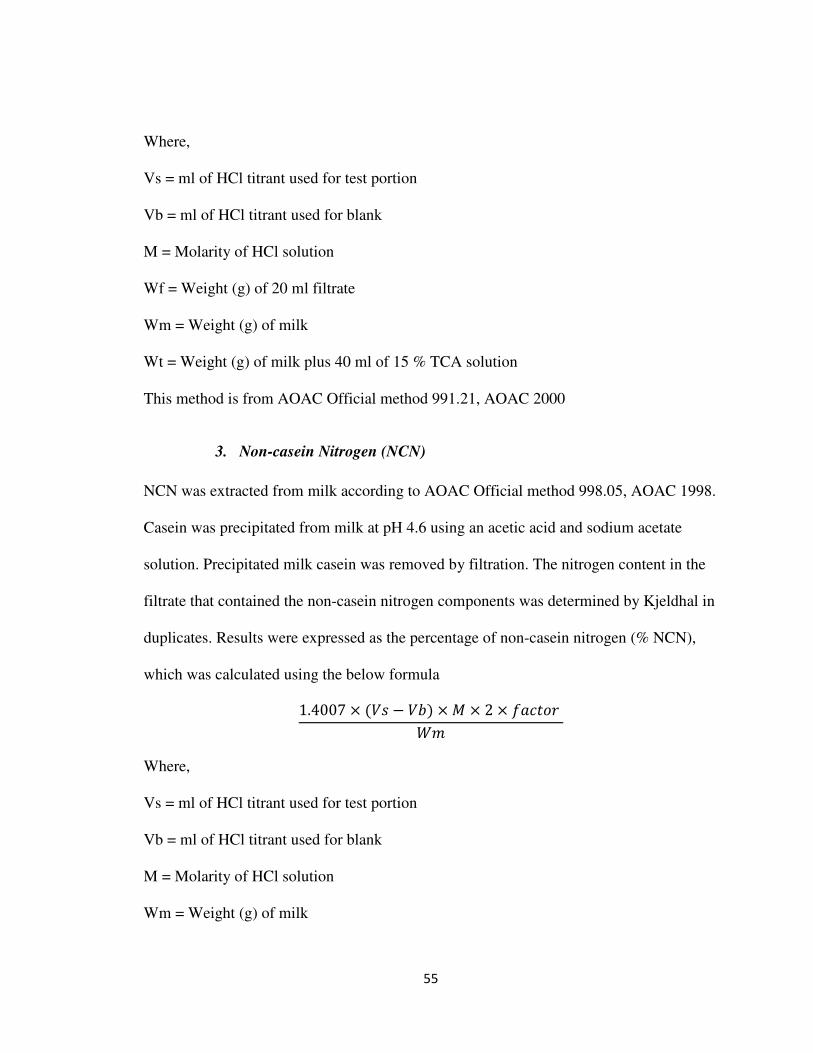
55
Where,
Vs = ml of HCl titrant used for test portion
Vb = ml of HCl titrant used for blank
M = Molarity of HCl solution
Wf = Weight (g) of 20 ml filtrate
Wm = Weight (g) of milk
Wt = Weight (g) of milk plus 40 ml of 15 % TCA solution
This method is from AOAC Official method 991.21, AOAC 2000
3. Non-casein Nitrogen (NCN)
NCN was extracted from milk according to AOAC Official method 998.05, AOAC 1998.
Casein was precipitated from milk at pH 4.6 using an acetic acid and sodium acetate
solution. Precipitated milk casein was removed by filtration. The nitrogen content in the
filtrate that contained the non-casein nitrogen components was determined by Kjeldhal in
duplicates. Results were expressed as the percentage of non-casein nitrogen (% NCN),
which was calculated using the below formula
1.4007 × �� − �� ×$ × 2 × ��)��
Where,
Vs = ml of HCl titrant used for test portion
Vb = ml of HCl titrant used for blank
M = Molarity of HCl solution
Wm = Weight (g) of milk
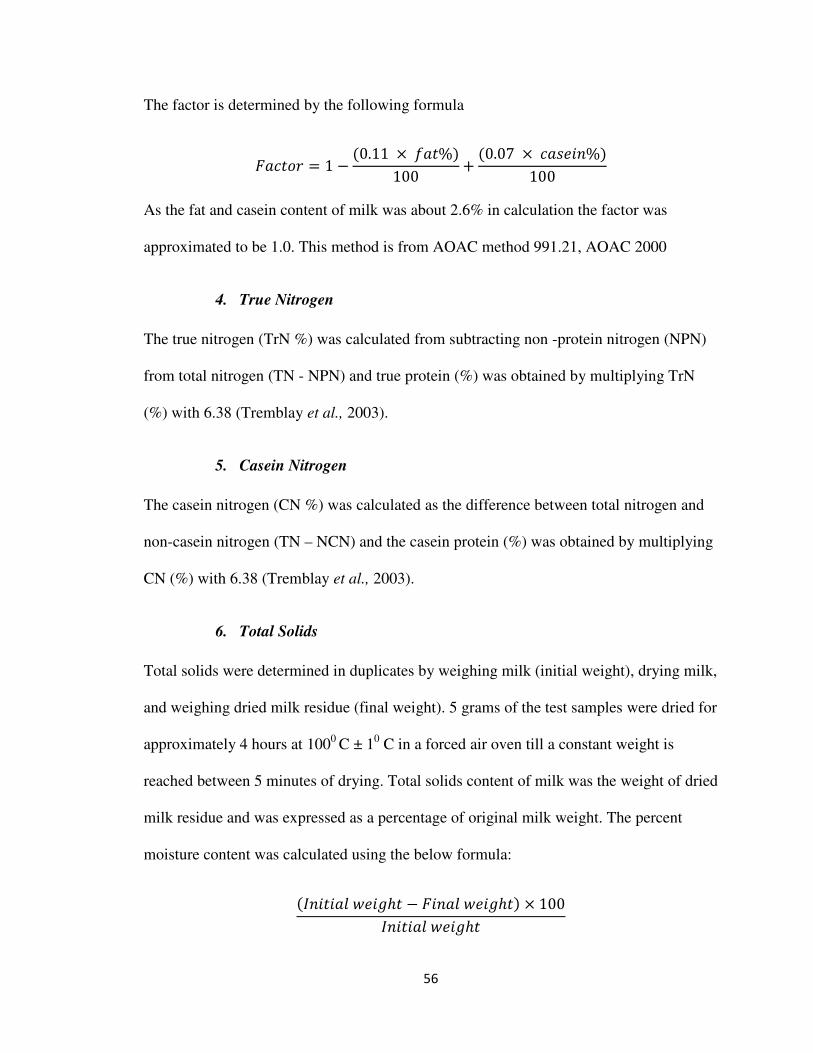
56
The factor is determined by the following formula
*�)�� = 1 − �0.11 × ���%�100 + �0.07 × )�����%�100
As the fat and casein content of milk was about 2.6% in calculation the factor was
approximated to be 1.0. This method is from AOAC method 991.21, AOAC 2000
4. True Nitrogen
The true nitrogen (TrN %) was calculated from subtracting non -protein nitrogen (NPN)
from total nitrogen (TN - NPN) and true protein (%) was obtained by multiplying TrN
(%) with 6.38 (Tremblay et al., 2003).
5. Casein Nitrogen
The casein nitrogen (CN %) was calculated as the difference between total nitrogen and
non-casein nitrogen (TN – NCN) and the casein protein (%) was obtained by multiplying
CN (%) with 6.38 (Tremblay et al., 2003).
6. Total Solids
Total solids were determined in duplicates by weighing milk (initial weight), drying milk,
and weighing dried milk residue (final weight). 5 grams of the test samples were dried for
approximately 4 hours at 1000 C ± 10 C in a forced air oven till a constant weight is
reached between 5 minutes of drying. Total solids content of milk was the weight of dried
milk residue and was expressed as a percentage of original milk weight. The percent
moisture content was calculated using the below formula:
�.������/��!ℎ� − *����/��!ℎ�� × 100.������/��!ℎ�
57
And the percent total solid was calculated as �100 −%$������)������. This
method is from AOAC Official method 990.20, AOAC 2000
7. Fat Content
Fat was extracted using Mojonnier method where a mixture of ethers was used to extract
fat from known weight of milk. Then the ether extract was decanted into dry weighing
dish, and ether was evaporated. Extracted fat was dried to constant weight. Result was
expressed as a percentage of fat by weight (AOAC Official method 989.05, AOAC
2000). The samples were analyzed in duplicates. The percent fat was calculated using the
below formula:
�� ��!ℎ��0��ℎ + ���� − ��!ℎ��0��ℎ� × 100 ��!ℎ�� ������0������
8. Somatic Cells
Somatic cells were measured using a Delaval Somatic Cell Counter DCC. Milk sample
was filled in a cassette and inserted in the Delaval Somatic Cell Counter DCC. The
cassette has a DNA specific fluorescent reagent that stains the nuclei. Then a digital
camera counts the stained nuclei while taking picture of the somatic cells’ nuclei one by
one. The readings were then displayed as the number of cells per micro liter of milk
(Delaval cell counter DCC manual). The samples were run in triplicates.
9. pH Measurement
The pH of milk was measured in duplicates by using an Orion pH meter (model 410).
Each time the pH meter was calibrated with buffers pH 4 and pH 7, and the slope was
always 98% to 100%.
58
10. Total Calcium
Total calcium (%) was measured in duplicates according to the method by Metzger et al.
(2000a), followed by Varian 55B Atomic Absorption Spectrophotometer. A sample size
of 0.75 gram of milk was added to 29.25 gram of 40% trichloroacetic acid. After 30
minutes, the mixture was filtered through Whatman Number 541. Ten grams of filtrate
was added to 9.6 grams of distilled water and 0.4 gram of 5% lanthanum oxide. This final
extract was then aspirated into Varian 55B Atomic Absorption Spectrophotometer fitted
with a calcium lamp for calcium determination.
C. Analysis of Cheese Parameters
One block of 10 lb cheese sample was analyzed on the fifth day after manufacture. If the
cheese samples arrived early, the cheese was stored at 3.30 C before analysis. All the
cheese samples were brought to a core temperature of 3.30 C before sampling for
analysis. The analysis carried out on the cheese on a biweekly basis is described below.
1. Total Nitrogen
Total nitrogen (%) was measured in duplicates according to AOAC official method
920.123, AOAC (2000). Two grams of cheese were taken and analyzed using Kjeldhal
method, which follows the same procedure as the total protein determination of milk (see
B. 1).
2. Water Soluble Nitrogen (WSN)
Water soluble nitrogen was extracted by homogenizing cheese with distilled water in the
ratio of 1:2. The homogenized mixture was incubated at 400 C for one hour. Then the
mixture was filtered using Whatman filter paper No. 1 (Kuchroo & Fox, 1982). Five
59
grams of the obtained filtrate were analyzed in duplicates for nitrogen content using
Kjeldhal. The procedure followed in analysis of the filtrate was similar to that of total
protein determination of milk (see B.1).
3. pH Measurement
The pH of cheese was measured in duplicates on 1:1 slurry of the cheese made with
distilled water. The pH was measured using Orion pH meter model 410.
4. Moisture Content
The moisture content of cheese was measured in duplicates using vacuum oven method
(AOAC Official Method 948.12, AOAC 2000). Two to three grams of cheese were
weighed in a flat –bottomed metal dish, and the dish was weighed (initial weight was
noted). The dish was dried to constant weight in a vacuum oven at 1000 C. The dishes
were removed and placed in a desiccator, cooled, and weighed (final weight). The percent
moisture content was calculated using the below formula.
�.������/��!ℎ� − *����/��!ℎ�� × 100.������/��!ℎ�
5. Fat
The fat content of cheese was analyzed in duplicates using the Babcock method by Wehr
& Frank (2004). Ten ml of hot water were pipetted into a Babcock bottle containing 9.00
grams of cheese. The sample was thoroughly mixed and about 15 ml of sulfuric acid was
added in three ml aliquots in intervals. The bottle was mechanically shaken till the lump
of cheese was broken down. Then, the bottle was filled with hot water and centrifuged to
separate out the fat. The bottle was then incubated in a water bath at 600 C, and the
60
readings that marked read on the bottle corresponded to the percentage of fat in the
cheese.
6. Salt Content of Cheese
The salt content of cheese was measured in duplicates using Nelson Jameson Chloride
Analyzer M 925. Approximately five grams of the sample were measured and added to a
blender jar. Taking into account the moisture of the cheese, distill water was added to
yield a total of 100 grams.
Amount of water used = 100 – (Sample weight x % Moisture in sample).
The mixture was blended at a medium speed for 30 seconds. Then, the mixture was
filtered using Whatman #1 filter paper. The chloride analyzer was calibrated according to
the owner’s manual. Then, 250 µl of the filtrate was added and titrated using the chloride
analyzer, which provided the results in mg/l. The obtained reading was multiplied by 0.4
to get the percentage of salt in the cheese sample. Calibration of the machine and sample
analysis was done according to Arnold (2008a) and the Nelson Jameson Chloride
Analyzer M 925 manual
7. Fat in Dry Matter (FDM)
FDM (%) was calculated using the formula
%*���)ℎ����%1������0���)ℎ���� × 100
8. Total Calcium in Cheese
Total calcium (%) was measured in duplicates according to the method described by
Metzger et al. (2000a). A sample size of 1.00 gram of cheese was blended with 30 gram
61
of 40% trichloroacetic acid using a blender for 30 seconds. After 30 minutes, the mixture
was filtered through Whatman Number 541. One gram of the obtained filtrate was added
with nine grams of 40% trichloroacetic acid, 9.6 grams of distilled water, and 0.4 gram of
5% lanthanum oxide. This final extract was then aspirated into Varian 55B Atomic
Absorption Spectrophotometer fitted with a calcium lamp for calcium determination.
9. Water Soluble Calcium in Cheese
The water soluble calcium in cheese filtrate (%) was measured in duplicates according to
the method described in Metzger et al. (2000a) and Metzger et al. (2000b). Five grams
of cheese were blended with 50 grams of distilled water at 600 C for 30 seconds using a
blender. The cheese filtrate was then filtered through Whatman No. 1 filter paper
(Metzger et al. 2000b). A final extract was prepared using the obtained filtrate as
described by Metzger et al. (2000a) (except one gram of cheese filtrate was used to
prepare the final extract instead of 0.75 gram of milk (see B.10)). The extract was then
aspirated into Varian 55B Atomic Absorption Spectrophotometer fitted with a calcium
lamp for calcium determination.
10. Texture Attributes of LMPS Mozzarella
10. a. Textural Profile Analysis (TPA)
Ten cubes of 2 cm x 2 cm x 2 cm were cut from different locations in a block of LMPS
Mozzarella. Then, the cubes were covered and conditioned in the refrigerator for two
hours followed by 30 minutes in room temperature. Five cubes were used to measure
hardness, cohesiveness, springiness, and chewiness by using a TAX-T2 Texture
Analyzer, Texture Technologies Corp., Scarsdale, NY. The cheese sample preparation
and parameters were set in the TAX-T2 Texture Analyzer are according to procedure
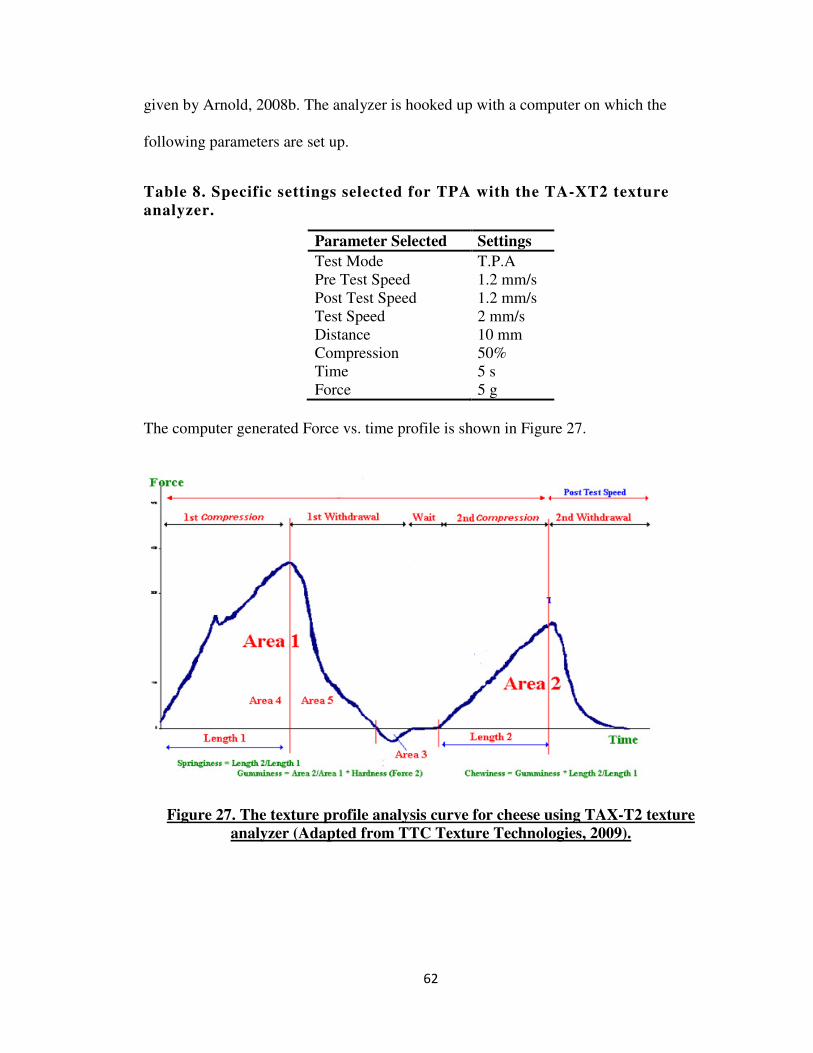
62
given by Arnold, 2008b. The analyzer is hooked up with a computer on which the
following parameters are set up.
Table 8. Specific settings selected for TPA with the TA-XT2 texture
analyzer.
Parameter Selected Settings
Test Mode T.P.A Pre Test Speed 1.2 mm/s Post Test Speed Test Speed
1.2 mm/s 2 mm/s
Distance 10 mm Compression 50% Time 5 s Force 5 g
The computer generated Force vs. time profile is shown in Figure 27.
Figure 27. The texture profile analysis curve for cheese using TAX-T2 texture
analyzer (Adapted from TTC Texture Technologies, 2009).
63
Definition of Texture Parameters and Physical Definitions
Hardness
The force required to compress a cheese between the molar teeth or between the tongue
and palate to a given deformation. The hardness was calculated as the peak force of the
first compression of the product (peak of the first curve in Figure 27) (TTC Texture
Technologies, 2009).
Cohesiveness
According TTC texture technologies website (2009) cohesiveness is “the extent to which
a cheese can be deformed before it ruptures.” Cohesiveness is basically how good the
cheese withstands a second deformation relative to the first deformation. It was measured
as the area of work during the second compression divided by the area of work during the
first compression (Refer to Area 2/Area 1 in Figure 27) (TTC Texture Technologies,
2009).
Springiness
Springiness is defined as the extent to which the cheese physically springs back after it
has been deformed. The cheese springs back to an extent after the first compression, so
the wait time between the first and second compression can be relatively important. In
some cases, a long wait time will allow a product to spring back more than it might under
the conditions being researched.
Springiness was measured as the distance of the height of the cheese on the second
compression (Length 2), divided by the original compression distance (Length 1) (Refer
Length 1 and 2 in Figure 27) (TTC Texture Technologies, 2009).
64
Chewiness
The length of time or the number of chews required to masticate a cheese ready for
swallowing. Chewiness is a product of hardness, cohesiveness and springiness (TTC
Texture Technologies, 2009).
10. b. Aggregation Index (AGI)
Aggregation index (AGI) is an empirical test to measure the matting behavior of cheese
based on its ability to penetrate down through a stack of vibrating sieves of decreasing
mesh size (Kindstedt et al., 2004). The procedure followed to measure AGI is adapted
and modified version given in Kindstedt et al.,2004. A cheese sample of 500 grams was
shredded from a block of cheese using Univex Shredder (Salem, NH). From the same
block, another 500 grams of cheese was cut into 2 cm x 2 cm x 2 cm cubes. The
temperature of cheese during the process was maintained at 3.30 C ± 10 C. Then, the
cubes and shreds were placed in the top most sieve in a stack of sieves that had was
arranged in a decreasing sieve size from top to bottom. The sieve sizes used were 6.35
mm, 5.6 mm, 4.74 mm, 3.35 mm, 2.36 mm, 1.00 mm and pan. The stack of sieves along
with cheese was shaken in a mechanical shaker for 20 seconds. Sticky cheese that matted
excessively was retained by larger sieves whereas cheese that remained free flowing
penetrated to the bottom of the stack. Larger AGI indicated that the cheese matted
excessively and vice versa (Kindstedt et al., 2004).
The aggregation index value of mozzarella cheese was calculated as a weighted average
of sieve size x mass of cheese retained by each sieve divided by the total amount of
cheese i.e.,
65
AGI = ∑ 345657485×9:77;5<:4=5>?@5:AB74565:C<5;7B:D4=E<F<:G:9FH=<FCAB5575IG:A5>4=<B5<FI9F7<74565?5CF;57B:D4=E
10. c. Percentage Loss during Shredding
A block of 2 pounds of cheese was shredded in a Univex Shredder (Salem, NH). The
temperature of the cheese during shredding was maintained at 3.30 C ± 10 C. The
percentage of cheese lost in shredder is calculated using the below formula.
.������/��!ℎ��)ℎ���� − ��!ℎ��)ℎ����������ℎ��00��!.������/��!ℎ��)ℎ���� × 100
D. Statistical Analysis for Modeling the Seasonal Variation
Seasonal variation of components in milk were analyzed using a multiple linear
regression model equivalent to a basic single cosinor model (Y= m+ A cos (t-Φ) + ε)
with sine and cosine of week as predictors
y = βo + β1 cosine (time) + β2 sine (time) + ε
Where y was the milk component and time was week between 1 and 52. Time was
converted into an angular variable by multiplying it by 2π/52, βo is the intercept, β1 and
β2 are the slopes of the cosine and sine functions respectively, and ε is the residual error
term.
Peck & Devore, 2008, stated the basic assumptions of the multiple linear regression
model as follows:
1. “The distribution of ε at any particular x value has a mean or average of zero.
2. The standard deviation of ε is the same of any particular value of x.
3. The distribution of ε at any particular x value is normal.
66
4. The random deviations ε1, ε2, ε3….. εn associated with different observations are
independent of one another”.
Lacroix et al. (1996) used a second order periodic oscillatory Fourier model to analyze
the seasonal variations in casein to total protein and casein to true protein ratios. The
Fourier model is similar to the multiple linear regression model used in this study and is
as follows:
� = � +J��)���K�� + ��sin��K��=OP
4OP
Where y was the response variable, t was the time (predictor), ω was the frequency and
ω=360/12=300, ai and bi were the regression coefficients, and ao was the intercept or the
mean value for y.
Statistical analysis was done using Minitab version 17.0. The assumptions were checked
using residual plots. To meet the model assumptions, the residuals were checked to have
no systematic patterns.
1. Interpretation of R-squared value in Multiple Linear Regression Model
Coefficient of determination (R-squared value) is the statistical measurement that
indicates how well the data fits the observed data. Frost (2013) defined R-squared value
as the “percentage of the response variable variation that is explained by regression
model.”
R-squared =�QR������0S��������/�1���S�������� Frost (2013) explained that R-square valued lies between zero and 100%, where 0% and
100% means that the model explains no variability and all variability, respectively, of the
67
response data around its average value. The higher the R-squared indicates that the model
fits the data better.
2. Interpretation of the p-value in Multiple Linear Regression Analysis
The null hypothesis (Ho) in linear regression analysis is that the R-squared is equal to
zero indicating that the model does not explain any variability in the response. The
alternative hypothesis (Ha) is that the model explains at least some variability in the
response. A p-value < 0.05 indicates that the Ho can be rejected. This would show that
the model explains some variability in the response (y value). The p-values for individual
predictors can also be examined to test whether each predictor variable is significantly
associated with the response, after controlling for all other predictors in the model. A p-
value < 0.05 for such a test on an individual predictor indicates that it is a meaningful
addition to the model because changes in the x value were associated with changes in the
response variable (y). However, a p-value > 0.05 indicates that the null hypothesis cannot
be rejected and hence changes in the predictor were not related with changes in the
response variable (Frost, 2013).
E. Correlation Studies
Correlation studies were carried out between milk components, cheese composition,
cheese texture, and the milk composition and the corresponding week cheese composition
and textural aspects using Minitab version 17.0. Correlations, except between milk
composition and cheese composition and texture, were done for the 18-month period. The
correlation analysis between milk composition and cheese composition, and texture was
done only for a ten-month period because from May 2009 changes in the production
68
protocol of cheese were done to increase the firmness of cheese, thereby reducing the loss
during shredding. The p-values and Pearson correlation coefficient were noted.
1. Interpretation of the Correlation or Pearson Correlation Coefficient
The correlation coefficient measures the strength of a linear relationship between two
variables. The correlation coefficient is always between -1 and +1. The closer the
correlation is to ± 1, the closer the two variables are to having a perfect linear relationship
(Peck & Devore, 2008). The correlation coefficient interpreted by Ratner,
(http://www.dmstat1.com/res/ TheCorrelationCoefficientDefined.html) is as follows:
- 1.0 to -0.7 - strong negative association
- 0.7 to -0.3 - moderate negative association
- 0.3 to +0.3 - little or no association
+ 0.3 to + 0.7 - moderate positive association
+0.7 to +1.0 - strong positive association
F. Ripening Studies
Two blocks of 10 lb vacuum packed cheese samples were subjected to ripening studies.
One block was ripened at 3.30 C and the other at 8.90 C for 21 days from the date of
manufacture. After 21 days, both the cheese blocks ripened at different temperatures were
brought to a core temperature of 3.30 C before carrying out analysis.
The ripened samples were analyzed for pH, WSN, and textural studies, which include
Texture Profile Analysis (TPA), % loss shredder, and aggregation index.
69
1. Statistical Analysis in Ripening Study
The parameters of the cheese, ripened at different temperatures were compared using
paired t-test analyzed using Minitab version 17.0. This test determines whether the
parameters’ means differ from each other in a significant way under the assumptions that
the paired differences are independent and identically normally distributed. The data was
analyzed using Minitab 17.0 and assumptions were checked using a normality plot. If the
p-value from the normality plot is greater than 0.05, it means that the data may follow a
normal distribution.
2. Urea PAGE
Proteolysis of the samples ripened at 3.30 C and 8.90 C was assessed by comparing with
the fresh samples.
2. a. Sample Preparation
For ripening study, fresh cheese sample C08090110 (Jan 09) and 21 day cheese sample
(same lot C08090110) ripened at 3.30 C and 8.90 C were taken and subjected to analysis.
Sodium caseinate was used as reference standards for both the studies. The samples were
prepared according to the procedure consolidated by Arnold, 2008c. A ten mg sample
was mixed with1.0 ml of 1X sample buffer (0.75 g tris base, 49 g urea, 0.4 ml conc. HCl,
0.7 ml beta mercaptoethanol, 0.15 g bromophenol blue, and distilled water). For standard,
five mg of sodium caseinate was mixed with 1.0 ml of 1X sample buffer. The samples
were incubated in a water bath for 30 minutes.
70
2. b. Gel Preparation
10% Poly acrylamide resolving gels were prepared by making a solution of 5.0 ml of
40% poly acrylamide, 14.0 ml of separating gel buffer (32.15 g of tris (hydroxymethyl)
methylamine, 150 g urea, 2.86 ml of concentrated HCl which is made up to 500 ml with
water (pH 8.9)), 10 µl TEMED, 75.2 µl of ammonium persulfate, 0.100 g of N, N’
methylene bisacrylamide and 1.0 ml of distilled water. The Bio-Rad Mini Protean gel
spacer plates were assembled according to the manufacturer’s instruction on the Mini-
PROTEAN 3 Multi-Casting Chamber. The prepared solution was then carefully pipetted
in between the plates until they were 3/4th full. Then, distilled water was pipetted on top
and the gel was allowed to polymerize for 30 minutes. Once the resolving gel was
polymerized, the water layer was poured off, and the plates were filled with 4%
acrylamide stacking gel solution (9.0 ml of stacking buffer (4.15 g of tris
(hydroxymethyl) methylamine, 150 g urea, 2.2 ml of concentrated HCl which is made up
to 500 ml with water), 10 µl TEMED, 60 µl of ammonium persulfate, pH 7.6), 0.1 ml of
SDS ml, 1 ml of 40% acrylamide, 50 micro L of 10% APS, 5 micro L of TEMED). A
Mini Protean Comb was inserted to generate the wells and was allowed to polymerize for
15 minutes. The gel was prepared according to the procedure consolidated by Matt R.
Arnold, 2008c.
2. c. Running Gel
The above prepared gel plates were removed from Mini-PROTEAN 3 Multi-Casting
Chamber and were mounted in XCell Surelock Mini-Cell chamber (EI0001). The
chamber was then filled with electrode buffer (3.0 g tris base, 14.6 g glycine, and 1000
ml of distilled water, pH 8.4). The cell unit was connected to a Bio-Rad power unit
(PAC300, BioRad) and was pre run for 15 minutes at 150 V. Then, the gel was loaded
71
with 4 µl of the samples and standards. The gel was run at 100 V for 90 minutes or until
the tracking buffer line reached the end of the plate. The gel was removed from the cell
unit and spacer plates. The gel was immersed in a staining solution (2.5 g Coomassie
Brilliant Blue R -250) and incubated in this solution overnight on a rotary incubator (Max
2000 E-class, Barnstead, IA) at room temperature. After 24 hours the gels were removed
from staining solution and de-stained with several changes of distilled water. The gel was
prepared according to the procedure consolidated by Arnold, 2008c.
72
IV. RESULTS AND DISCUSSION
The results are summarized in parts and are briefly discussed below. In the first part of
the study, the seasonal variation and correlation between milk components in weekly
bulk milk samples (76 samples) collected from a plant in Central Valley, California were
studied for an 18- month period. Secondly, the thirty-three low moisture part skim
mozzarella samples collected on a biweekly basis from the same plant during the same
period was analyzed for any variation in their composition and un-melted textural
properties (shreddability, aggregation index, % loss in shredder, and TPA characteristics).
Correlation analyses were done among the cheese composition, cheese textural
characteristics’, and between cheese composition and texture. In the third part, the
association between milk composition and cheese composition and texture were studied
using correlation analysis. Finally, the association between ripening temperature and the
cheese pH, water soluble nitrogen, and un-melted textural properties of LMPS
Mozzarella was studied.
This was an observational study, and hence no cause and effect conclusions can be drawn
as there are a lot of variables that were not controlled.
A. Analysis of Milk
1. Milk Composition
The average data for milk composition for seventy-six bulk milk samples obtained from
silos on a weekly basis from a plant in Central Valley, California from July 2008 to
December 2009 are shown in Table 9.
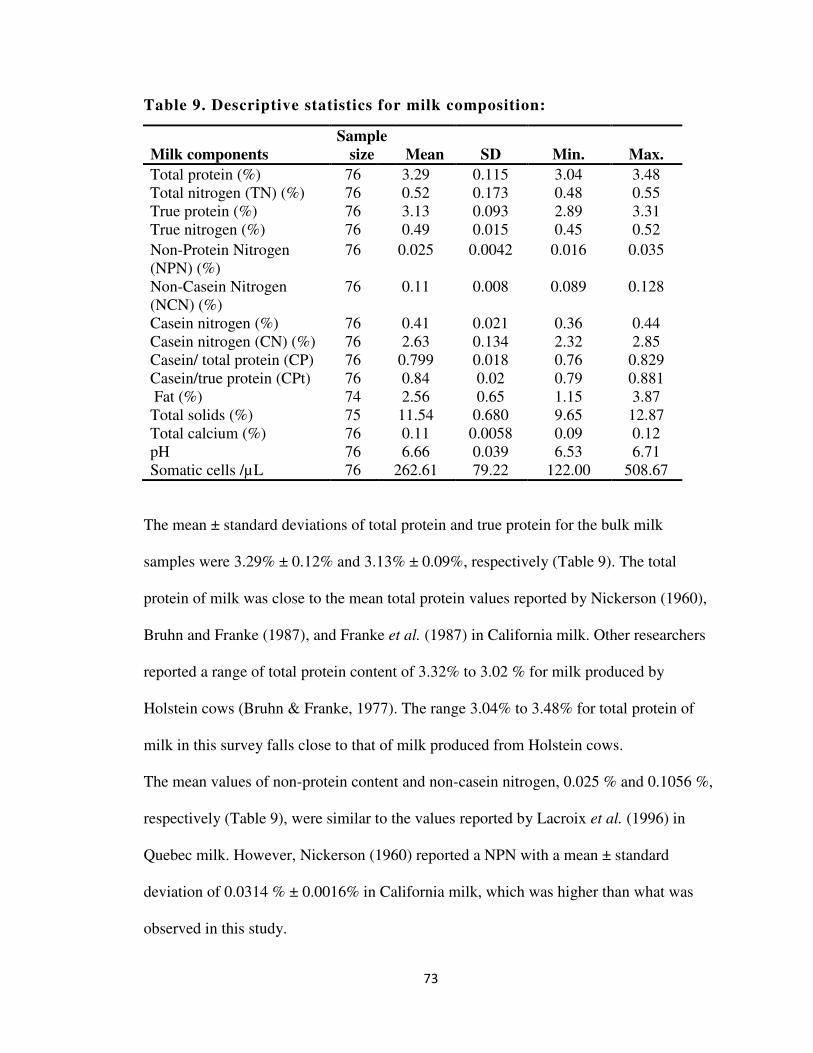
73
Table 9. Descriptive statistics for milk composition:
Milk components
Sample
size Mean SD Min. Max.
Total protein (%) 76 3.29 0.115 3.04 3.48
Total nitrogen (TN) (%) 76 0.52 0.173 0.48 0.55 True protein (%) 76 3.13 0.093 2.89 3.31
True nitrogen (%) 76 0.49 0.015 0.45 0.52
Non-Protein Nitrogen (NPN) (%)
76 0.025 0.0042 0.016 0.035
Non-Casein Nitrogen (NCN) (%)
76 0.11 0.008 0.089 0.128
Casein nitrogen (%) 76 0.41 0.021 0.36 0.44 Casein nitrogen (CN) (%) 76 2.63 0.134 2.32 2.85 Casein/ total protein (CP) 76 0.799 0.018 0.76 0.829 Casein/true protein (CPt) 76 0.84 0.02 0.79 0.881 Fat (%) 74 2.56 0.65 1.15 3.87
Total solids (%) 75 11.54 0.680 9.65 12.87
Total calcium (%) 76 0.11 0.0058 0.09 0.12
pH 76 6.66 0.039 6.53 6.71
Somatic cells /µL 76 262.61 79.22 122.00 508.67
The mean ± standard deviations of total protein and true protein for the bulk milk
samples were 3.29% ± 0.12% and 3.13% ± 0.09%, respectively (Table 9). The total
protein of milk was close to the mean total protein values reported by Nickerson (1960),
Bruhn and Franke (1987), and Franke et al. (1987) in California milk. Other researchers
reported a range of total protein content of 3.32% to 3.02 % for milk produced by
Holstein cows (Bruhn & Franke, 1977). The range 3.04% to 3.48% for total protein of
milk in this survey falls close to that of milk produced from Holstein cows.
The mean values of non-protein content and non-casein nitrogen, 0.025 % and 0.1056 %,
respectively (Table 9), were similar to the values reported by Lacroix et al. (1996) in
Quebec milk. However, Nickerson (1960) reported a NPN with a mean ± standard
deviation of 0.0314 % ± 0.0016% in California milk, which was higher than what was
observed in this study.
74
The casein fraction represented 79.91% ± 1.7 % of the total protein (CP) and 83.97 % ±
2.14% of true protein (CPt) (Table 9), which was in range with the values (CP 78.92 %)
and CPt (83.12%) reported by Lacroix et al. (1996) in Quebec milk samples. However,
the mean CP value of 79.91% is higher than the mean value of 76.71 % and 76.4%
reported by Nickerson (1960) and Franke et al. (1987), respectively, in milk from
California. The larger range of standard deviation observed for CPt compared with CP
indicates that casein varied more to true protein than that of total protein. This larger
variation of casein may due to variation of NPN along with TN. As standardization of
milk is done with a target of casein to fat ratio, hence a variation of casein or fat in milk
will affect the hardness of cheese unless the moisture content of the curd is increased or
decreased to accommodate the changes in hardness (Gunasekaran and Ak, 2000a).
In this study, the average ± standard deviation of fat content in bulk milk samples was
found to be 2.56% ±0.66 % (Table 9). The mean value of fat content was low compared
to mean values observed 3.82% and 3.67% by Nickerson (1960) and Bruhn & Franke
(1991), respectively, in California milk. The minimum was found to be as low as 1.15%
and high as 3.87% (Table 9). The milk samples were heated to 380 C before analysis to
allow fat to get distributed evenly. However, the variation of milk fat was very high with
a ± 0.66 % standard deviation during the entire sampling period.
The average value for total solids was 11.543% with a standard deviation of ± 0.680%
(Table 9), which was close to 11.18 % ± 1.432 % reported by Ozrenk &Inci (2008).
Some researchers reported the average total solids content of milk as 12.5% (Walstra et
al., 2006). The total solids like any other milk components were found to vary according
75
to breed and other factors (Nickerson, 1960 and Ozrenk &Inci, 2008). The standard
deviation of total solids was ± 0.68 % (Table 9), which was close to that of fat ± 0.66 %.
The mean ± standard deviation of total calcium in silo milk samples was found to be
0.11% ± 0.006 % (Table 9), which was quite in range with the values reported by
Metzger et al. (2000a) (0.114%) and Fox and Cogan (0.12%). Calcium plays an
important role in rennet coagulation and firmness of milk coagulum during the cheese
making process. Also in mozzarella, the inherent casein associated calcium and
phosphate influences the ability of curd to plasticize and form unidirectional fibrous
structure (Kindstedt et al., 1999).
The average somatic cell count (SCC) along with the standard deviation in the bulk milk
samples for the 18 month period was 262.61 ±79.22 cells/µl, which was within the range
for healthy cows (SCC < 750,000 cells/ml). Barbano et al. (1987) reported that the milk
from sub clinical mastitis has SCC ≥ 500, 000 cells/ml and this could affect the quality of
milk, in turn affecting the yield and quality of cheese. The maximum value during the
study obtained was 508, 000 cells/ml. This somatic cell count greater than 500,000
cells/ml was found only for two samples (May 2009 and October 2008 - Appendix 1).
Other than the two milk samples, most of the milk samples had somatic cell count below
500,000 cells/ml, which indicates that all the milk samples were free from mastitis.
The average ± standard deviation of pH for the milk samples was found to be 6.66 ±
0.039, which is within the normal range of 6.7 (Kelly, 2000a).
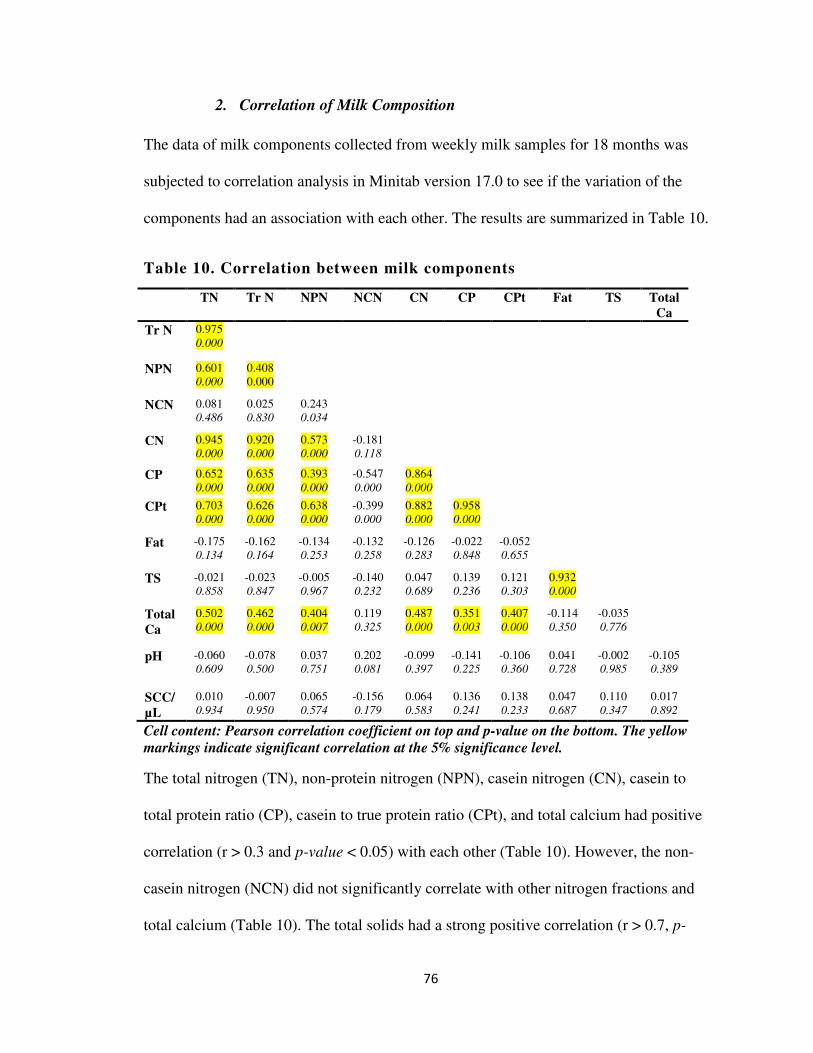
76
2. Correlation of Milk Composition
The data of milk components collected from weekly milk samples for 18 months was
subjected to correlation analysis in Minitab version 17.0 to see if the variation of the
components had an association with each other. The results are summarized in Table 10.
Table 10. Correlation between milk components
TN Tr N NPN NCN CN CP CPt Fat TS Total
Ca
Tr N 0.975 0.000
NPN 0.601 0.000
0.408 0.000
NCN 0.081 0.486
0.025 0.830
0.243 0.034
CN 0.945 0.000
0.920 0.000
0.573 0.000
-0.181 0.118
CP 0.652 0.000
0.635 0.000
0.393 0.000
-0.547 0.000
0.864 0.000
CPt 0.703 0.000
0.626 0.000
0.638 0.000
-0.399 0.000
0.882 0.000
0.958 0.000
Fat -0.175 0.134
-0.162 0.164
-0.134 0.253
-0.132 0.258
-0.126 0.283
-0.022 0.848
-0.052 0.655
TS -0.021 0.858
-0.023 0.847
-0.005 0.967
-0.140 0.232
0.047 0.689
0.139 0.236
0.121 0.303
0.932 0.000
Total
Ca
0.502 0.000
0.462 0.000
0.404 0.007
0.119 0.325
0.487 0.000
0.351 0.003
0.407 0.000
-0.114 0.350
-0.035 0.776
pH -0.060 0.609
-0.078 0.500
0.037 0.751
0.202 0.081
-0.099 0.397
-0.141 0.225
-0.106 0.360
0.041 0.728
-0.002 0.985
-0.105 0.389
SCC/
µL
0.010 0.934
-0.007 0.950
0.065 0.574
-0.156 0.179
0.064 0.583
0.136 0.241
0.138 0.233
0.047 0.687
0.110 0.347
0.017 0.892
Cell content: Pearson correlation coefficient on top and p-value on the bottom. The yellow
markings indicate significant correlation at the 5% significance level.
The total nitrogen (TN), non-protein nitrogen (NPN), casein nitrogen (CN), casein to
total protein ratio (CP), casein to true protein ratio (CPt), and total calcium had positive
correlation (r > 0.3 and p-value < 0.05) with each other (Table 10). However, the non-
casein nitrogen (NCN) did not significantly correlate with other nitrogen fractions and
total calcium (Table 10). The total solids had a strong positive correlation (r > 0.7, p-
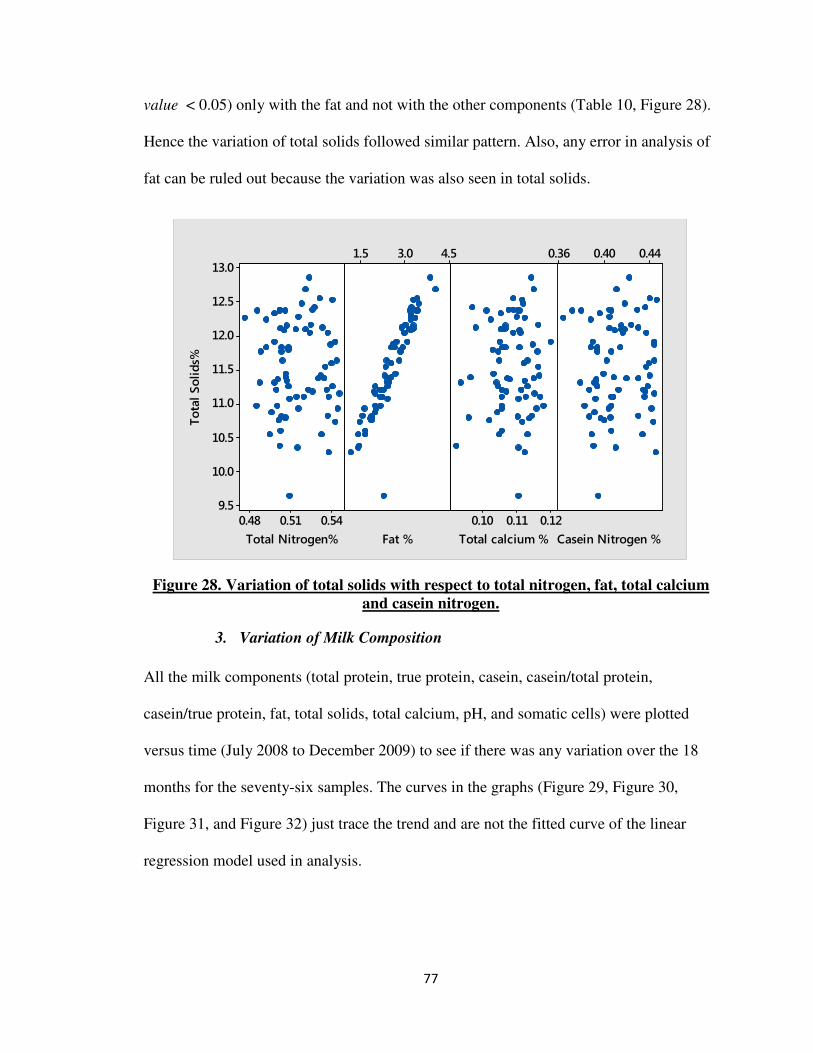
77
value < 0.05) only with the fat and not with the other components (Table 10, Figure 28).
Hence the variation of total solids followed similar pattern. Also, any error in analysis of
fat can be ruled out because the variation was also seen in total solids.
Figure 28. Variation of total solids with respect to total nitrogen, fat, total calcium
and casein nitrogen.
3. Variation of Milk Composition
All the milk components (total protein, true protein, casein, casein/total protein,
casein/true protein, fat, total solids, total calcium, pH, and somatic cells) were plotted
versus time (July 2008 to December 2009) to see if there was any variation over the 18
months for the seventy-six samples. The curves in the graphs (Figure 29, Figure 30,
Figure 31, and Figure 32) just trace the trend and are not the fitted curve of the linear
regression model used in analysis.
0.540.510.48
13.0
12.5
12.0
11.5
11.0
10.5
10.0
9.5
4.53.01.5
0.120.110.10
0.440.400.36
Total Nitrogen%
Tota
l Solids%
Fat % Total calcium % Casein Nitrogen %
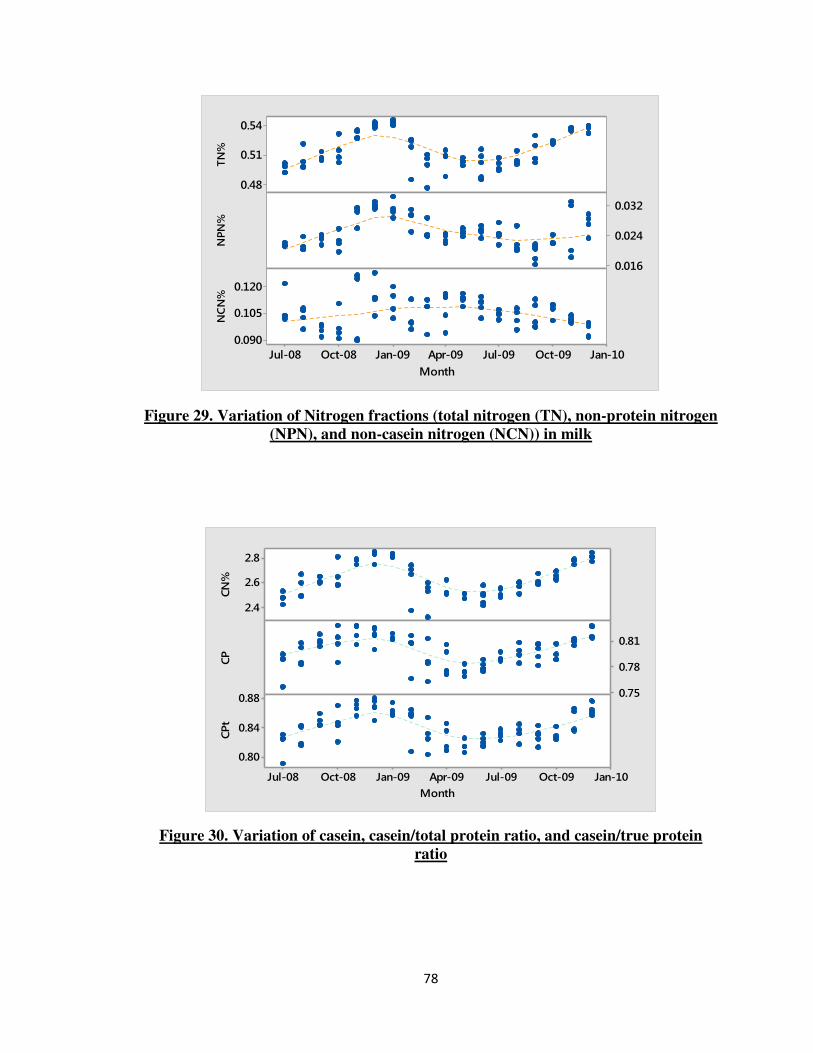
78
Figure 29. Variation of Nitrogen fractions (total nitrogen (TN), non-protein nitrogen
(NPN), and non-casein nitrogen (NCN)) in milk
Figure 30. Variation of casein, casein/total protein ratio, and casein/true protein
ratio
0.54
0.51
0.48
0.032
0.024
0.016
Jan-10Oct-09Jul-09Apr-09Jan-09Oct-08Jul-08
0.120
0.105
0.090
TN%
NPN%
Month
NCN%
2.8
2.6
2.4
0.81
0.78
0.75
Jan-10Oct-09Jul-09Apr-09Jan-09Oct-08Jul-08
0.88
0.84
0.80
CN%
CP
Month
CPt
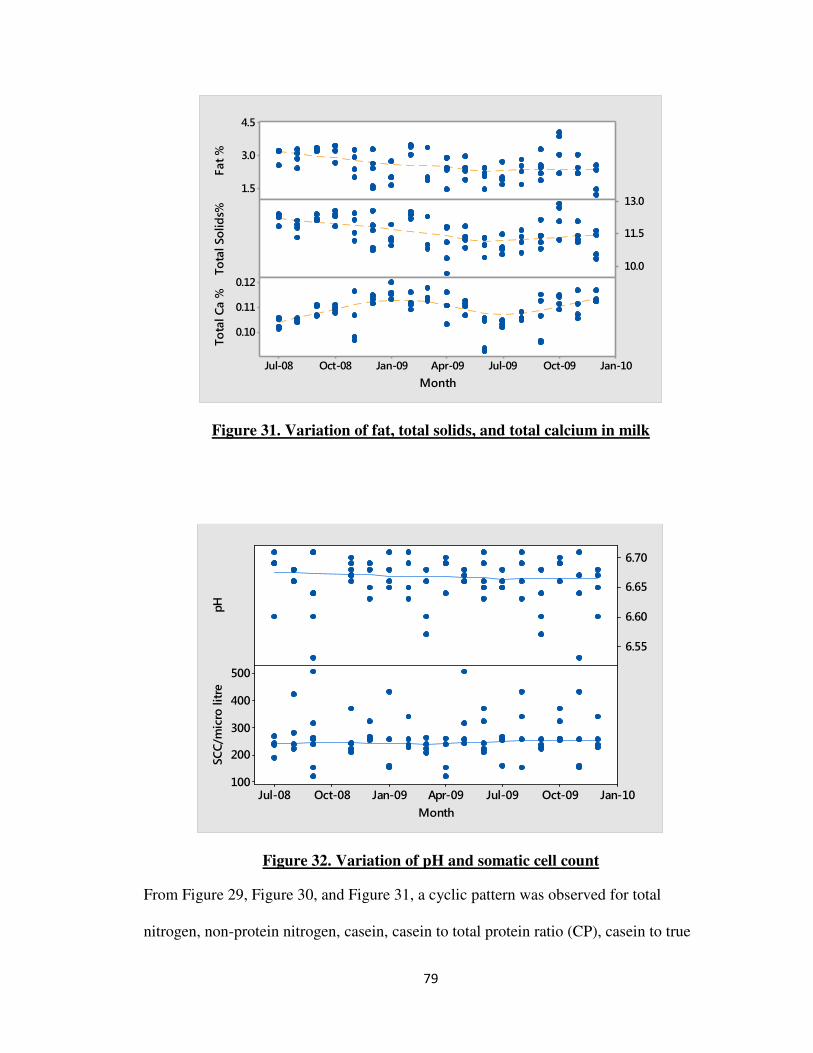
79
Figure 31. Variation of fat, total solids, and total calcium in milk
Figure 32. Variation of pH and somatic cell count
From Figure 29, Figure 30, and Figure 31, a cyclic pattern was observed for total
nitrogen, non-protein nitrogen, casein, casein to total protein ratio (CP), casein to true
4.5
3.0
1.513.0
11.5
10.0
Jan-10Oct-09Jul-09Apr-09Jan-09Oct-08Jul-08
0.12
0.11
0.10
Fat %
Tota
l Solids%
Month
Tota
l Ca %
6.70
6.65
6.60
6.55
Jan-10Oct-09Jul-09Apr-09Jan-09Oct-08Jul-08
500
400
300
200
100
pH
Month
SCC/m
icro
litre
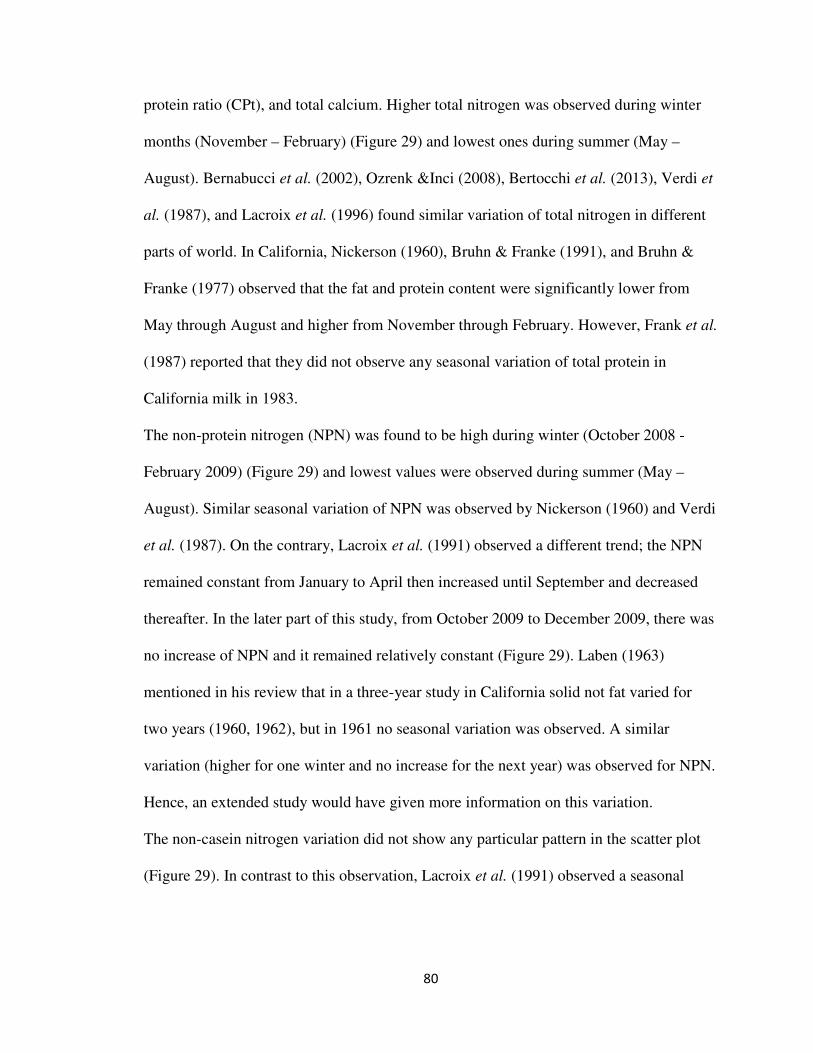
80
protein ratio (CPt), and total calcium. Higher total nitrogen was observed during winter
months (November – February) (Figure 29) and lowest ones during summer (May –
August). Bernabucci et al. (2002), Ozrenk &Inci (2008), Bertocchi et al. (2013), Verdi et
al. (1987), and Lacroix et al. (1996) found similar variation of total nitrogen in different
parts of world. In California, Nickerson (1960), Bruhn & Franke (1991), and Bruhn &
Franke (1977) observed that the fat and protein content were significantly lower from
May through August and higher from November through February. However, Frank et al.
(1987) reported that they did not observe any seasonal variation of total protein in
California milk in 1983.
The non-protein nitrogen (NPN) was found to be high during winter (October 2008 -
February 2009) (Figure 29) and lowest values were observed during summer (May –
August). Similar seasonal variation of NPN was observed by Nickerson (1960) and Verdi
et al. (1987). On the contrary, Lacroix et al. (1991) observed a different trend; the NPN
remained constant from January to April then increased until September and decreased
thereafter. In the later part of this study, from October 2009 to December 2009, there was
no increase of NPN and it remained relatively constant (Figure 29). Laben (1963)
mentioned in his review that in a three-year study in California solid not fat varied for
two years (1960, 1962), but in 1961 no seasonal variation was observed. A similar
variation (higher for one winter and no increase for the next year) was observed for NPN.
Hence, an extended study would have given more information on this variation.
The non-casein nitrogen variation did not show any particular pattern in the scatter plot
(Figure 29). In contrast to this observation, Lacroix et al. (1991) observed a seasonal
81
variation (high for winter months and low for summer months) of non-casein nitrogen in
their study.
The casein (calculated TN - NCN) showed a cyclic pattern with highs during the winter
months and low values during the summer months (Figure 30). In spite of NCN being
almost constant, casein nitrogen varied due to the variation contributed by the total
nitrogen. A similar seasonal variation of casein was reported by Nickerson (1960) in
California. On the other hand, Franke et al. (1987) did not find any significant seasonal
variation of casein in California milk in 1983.
Casein to total protein ratio (CP) and casein to true protein ratio (CPt) also followed a
similar variation as that of the total nitrogen and casein. Lacroix et al. (1991) in their
study found that CP and CPt values were high during the winters and spring. In their
study, they compiled the CP values and variation by various researchers, and most of
them showed that the high values were in winter and spring, and low ones were in
summer. However, Franke et al. (1987) reported that in California milk, there was no
significant variation of CP during their survey in 1983.
Total calcium also had a cyclic pattern with highs in January to April (winter – spring
months) and low in May – July (summer) and again peaking up around October (Figure
31). Highest level calcium of 0.12 % was observed in January 09 month, and a low level
of 0.09% was observed in June 2009. Nickerson (1960) also observed similar seasonal
variation of total calcium in milk during 1955 to 1958 in California. In this study, the
total calcium variation followed a similar trend to that of total protein (Figure 29, Figure
30). This observation was also in line with that of Nickerson (1960) who noticed that
82
milk that had the lowest average protein content also had the lowest calcium content and
milk with the highest average protein had the highest calcium content.
Even though fat and total solids varied considerably between samples with a standard
deviation ± 0.65% and ±0.68% respectively (Table 9), there was no particular high and
low values for any season. Their variation was random as shown in Figure 31. In contrast,
a lot of researchers reported low fat in milk during summer and highs in winter (Ozrenk
&Inci 2008; Verdi et al. 1987; Pavan & Gavan 2011; Heck et al. 2009; Larsen et al.
2010). Also, Heck et al. (2009) and Larsen et al. (2010) noticed that milk fat varied more
with season compared to other components. They attributed this variation to change in
diet during different seasons and noticed that fat varies to a greater extent with change in
diet than other milk components. In California, Nickerson (1960), Bruhn & Franke
(1991), and Bruhn & Franke (1977) observed that the fat content was significantly lower
from May through August and higher from November through February. However, Frank
et al. (1987) reported that he did not observe any seasonal variation of total protein in
California milk in 1983. Ozrenk &Inci (2008) and Nickerson (1960) found that the total
solids also varied seasonally, with high levels in winter and low values in summer.
The somatic cell count and pH variation did not show any seasonal patterns (Figure 32).
However, Bertocchi et al. (2013) and Dohoo & Meek (1982) have reported that the
somatic counts vary seasonally (lowest counts during winter and the highest counts
during the summer). They attributed the increase in somatic cells due to change in diet
and heat stress.
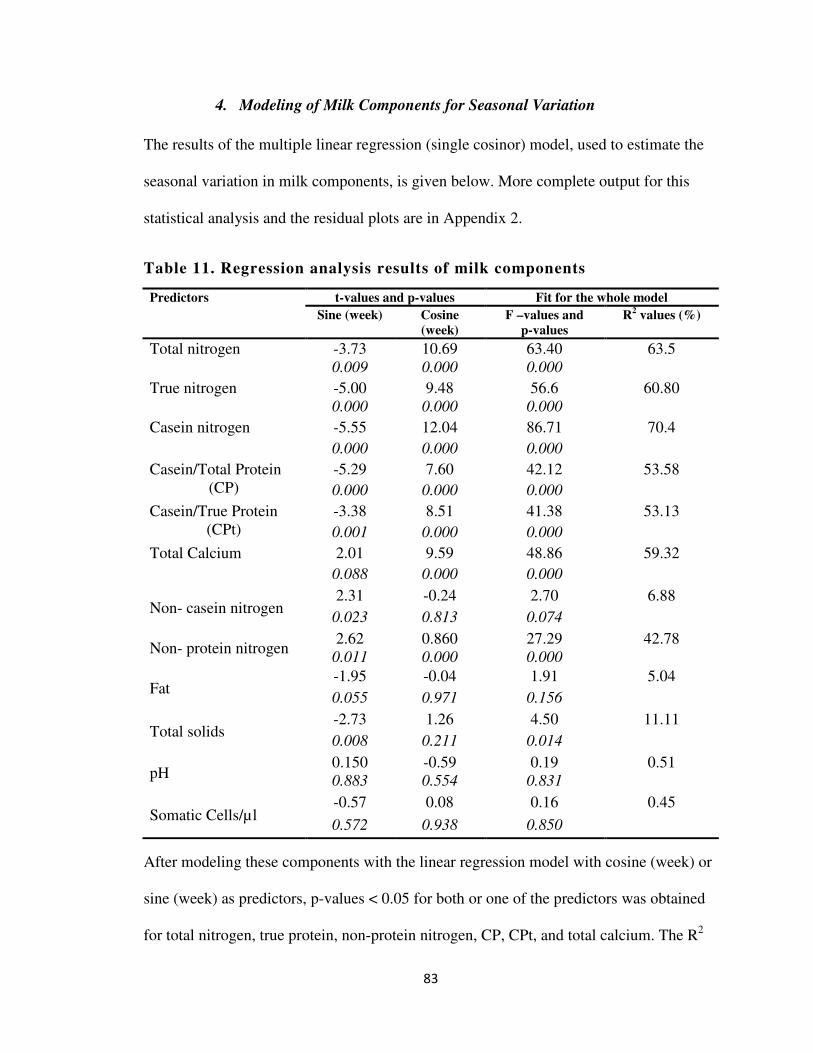
83
4. Modeling of Milk Components for Seasonal Variation
The results of the multiple linear regression (single cosinor) model, used to estimate the
seasonal variation in milk components, is given below. More complete output for this
statistical analysis and the residual plots are in Appendix 2.
Table 11. Regression analysis results of milk components
Predictors t-values and p-values Fit for the whole model
Sine (week) Cosine
(week)
F –values and
p-values
R2 values (%)
Total nitrogen -3.73 10.69 63.40 63.5 0.009 0.000 0.000
True nitrogen -5.00 9.48 56.6 60.80 0.000 0.000 0.000
Casein nitrogen -5.55 12.04 86.71 70.4
0.000 0.000 0.000
Casein/Total Protein (CP)
-5.29 7.60 42.12 53.58
0.000 0.000 0.000
Casein/True Protein (CPt)
-3.38 8.51 41.38 53.13
0.001 0.000 0.000
Total Calcium 2.01 9.59 48.86 59.32
0.088 0.000 0.000
Non- casein nitrogen 2.31 -0.24 2.70 6.88
0.023 0.813 0.074
Non- protein nitrogen 2.62 0.860 27.29 42.78
0.011 0.000 0.000
Fat -1.95 -0.04 1.91 5.04
0.055 0.971 0.156
Total solids -2.73 1.26 4.50 11.11
0.008 0.211 0.014
pH 0.150 -0.59 0.19 0.51 0.883 0.554 0.831
Somatic Cells/µl -0.57 0.08 0.16 0.45
0.572 0.938 0.850
After modeling these components with the linear regression model with cosine (week) or
sine (week) as predictors, p-values < 0.05 for both or one of the predictors was obtained
for total nitrogen, true protein, non-protein nitrogen, CP, CPt, and total calcium. The R2
84
>50% (Table 11) for total nitrogen, true nitrogen, casein nitrogen, CP, CPt, and total
calcium shows that more than 50% of the data fitted well in the model. The R2 value for
non- protein nitrogen was 42.78% (Table 11), which shows that 42.78% of data fitted
well in the model. These findings indicate that significant seasonal variations in total
nitrogen, true nitrogen, casein, non-protein nitrogen, total calcium of casein/total protein,
casein/true protein, and non-protein nitrogen in silo milk during the sampling period (July
2008 – December 2009) can be explained using the linear regression model with time as
an angular variable. The model showed less than 12% variation for pH, fat, total solids,
and somatic cells; thereby, no significant seasonal variation could be explained for these
components as the p-values > 0.05%. The hottest months in Central Valley, California,
during 2008 and 2009 were from June to September with temperatures reaching above
1000 F (refer Appendix 3). In addition, these years (2008 and 2009) had very little
precipitation (refer Appendix 4). Hence, the variation of total nitrogen, casein nitrogen,
non-protein nitrogen and total calcium can be attributed to longer photoperiods and high
temperatures (above 1000 F), which causes less food intake due to heat stress during the
summer months compared to the winter months. Therefore, the accuracy of fixed
casein/total protein ratio often used in dairy plants to estimate casein content of milk
throughout different seasons is questionable. Thus, it may be concluded that estimating
casein from true protein or casein from total protein while accounting for monthly
variations of total nitrogen and non-protein nitrogen should be more accurate.
Calibration of infra-red instruments has been traditionally done using total nitrogen by
Kjeldahl as the reference (Barbano, 1994). A systematic bias error of 0.03% - 0.06% total
protein can be created between infra-red milk analyzers as a result of differences in the
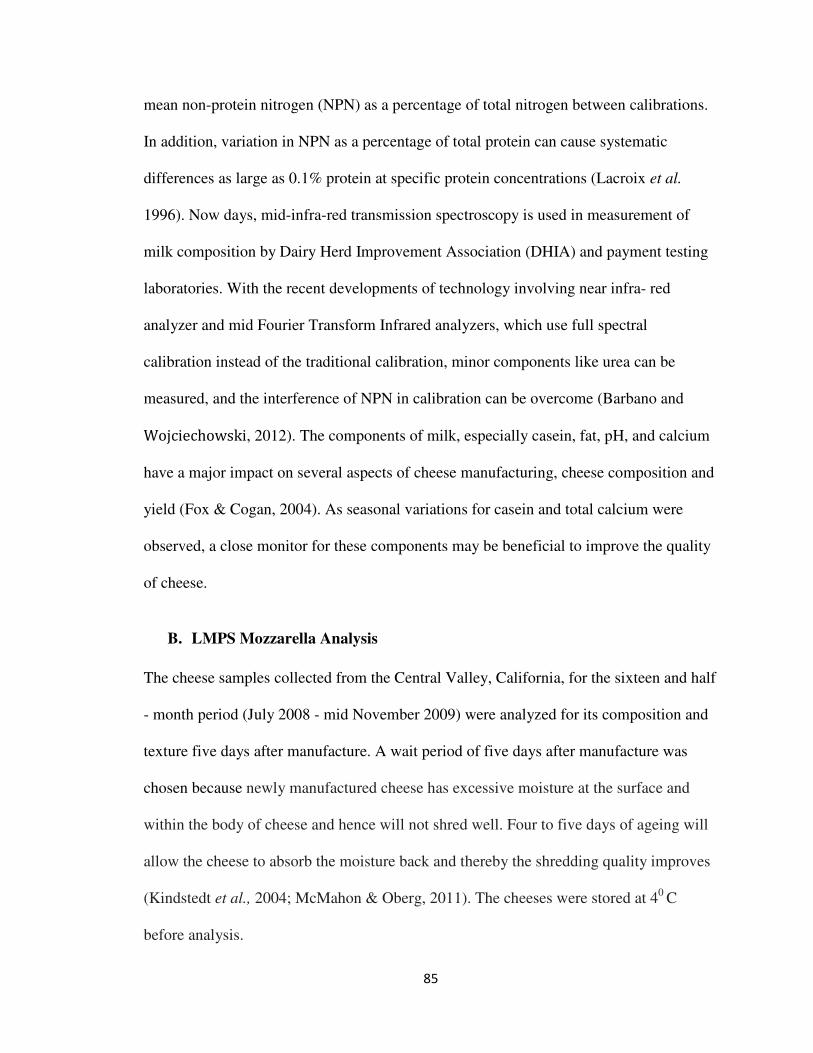
85
mean non-protein nitrogen (NPN) as a percentage of total nitrogen between calibrations.
In addition, variation in NPN as a percentage of total protein can cause systematic
differences as large as 0.1% protein at specific protein concentrations (Lacroix et al.
1996). Now days, mid-infra-red transmission spectroscopy is used in measurement of
milk composition by Dairy Herd Improvement Association (DHIA) and payment testing
laboratories. With the recent developments of technology involving near infra- red
analyzer and mid Fourier Transform Infrared analyzers, which use full spectral
calibration instead of the traditional calibration, minor components like urea can be
measured, and the interference of NPN in calibration can be overcome (Barbano and
Wojciechowski, 2012). The components of milk, especially casein, fat, pH, and calcium
have a major impact on several aspects of cheese manufacturing, cheese composition and
yield (Fox & Cogan, 2004). As seasonal variations for casein and total calcium were
observed, a close monitor for these components may be beneficial to improve the quality
of cheese.
B. LMPS Mozzarella Analysis
The cheese samples collected from the Central Valley, California, for the sixteen and half
- month period (July 2008 - mid November 2009) were analyzed for its composition and
texture five days after manufacture. A wait period of five days after manufacture was
chosen because newly manufactured cheese has excessive moisture at the surface and
within the body of cheese and hence will not shred well. Four to five days of ageing will
allow the cheese to absorb the moisture back and thereby the shredding quality improves
(Kindstedt et al., 2004; McMahon & Oberg, 2011). The cheeses were stored at 40 C
before analysis.
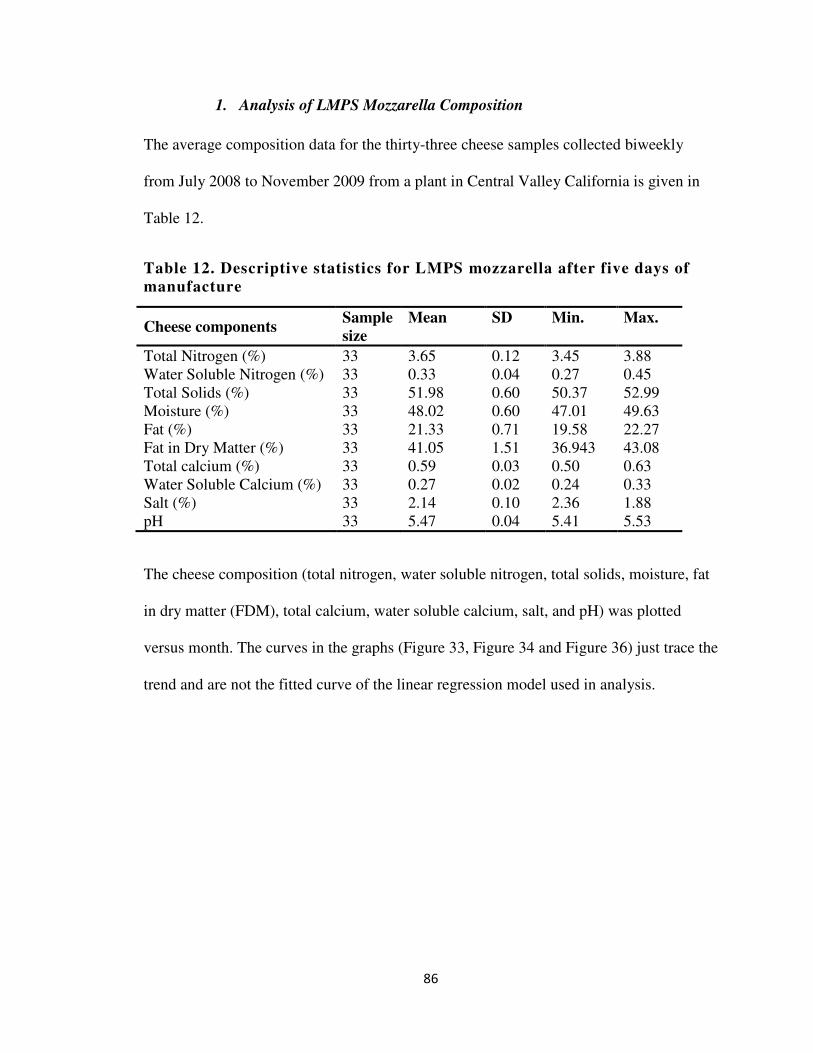
86
1. Analysis of LMPS Mozzarella Composition
The average composition data for the thirty-three cheese samples collected biweekly
from July 2008 to November 2009 from a plant in Central Valley California is given in
Table 12.
Table 12. Descriptive statistics for LMPS mozzarella after five days of
manufacture
Cheese components Sample
size
Mean SD Min. Max.
Total Nitrogen (%) 33 3.65 0.12 3.45 3.88 Water Soluble Nitrogen (%) 33 0.33 0.04 0.27 0.45 Total Solids (%) 33 51.98 0.60 50.37 52.99 Moisture (%) 33 48.02 0.60 47.01 49.63 Fat (%) 33 21.33 0.71 19.58 22.27 Fat in Dry Matter (%) 33 41.05 1.51 36.943 43.08 Total calcium (%) 33 0.59 0.03 0.50 0.63 Water Soluble Calcium (%) 33 0.27 0.02 0.24 0.33 Salt (%) 33 2.14 0.10 2.36 1.88 pH 33 5.47 0.04 5.41 5.53
The cheese composition (total nitrogen, water soluble nitrogen, total solids, moisture, fat
in dry matter (FDM), total calcium, water soluble calcium, salt, and pH) was plotted
versus month. The curves in the graphs (Figure 33, Figure 34 and Figure 36) just trace the
trend and are not the fitted curve of the linear regression model used in analysis.
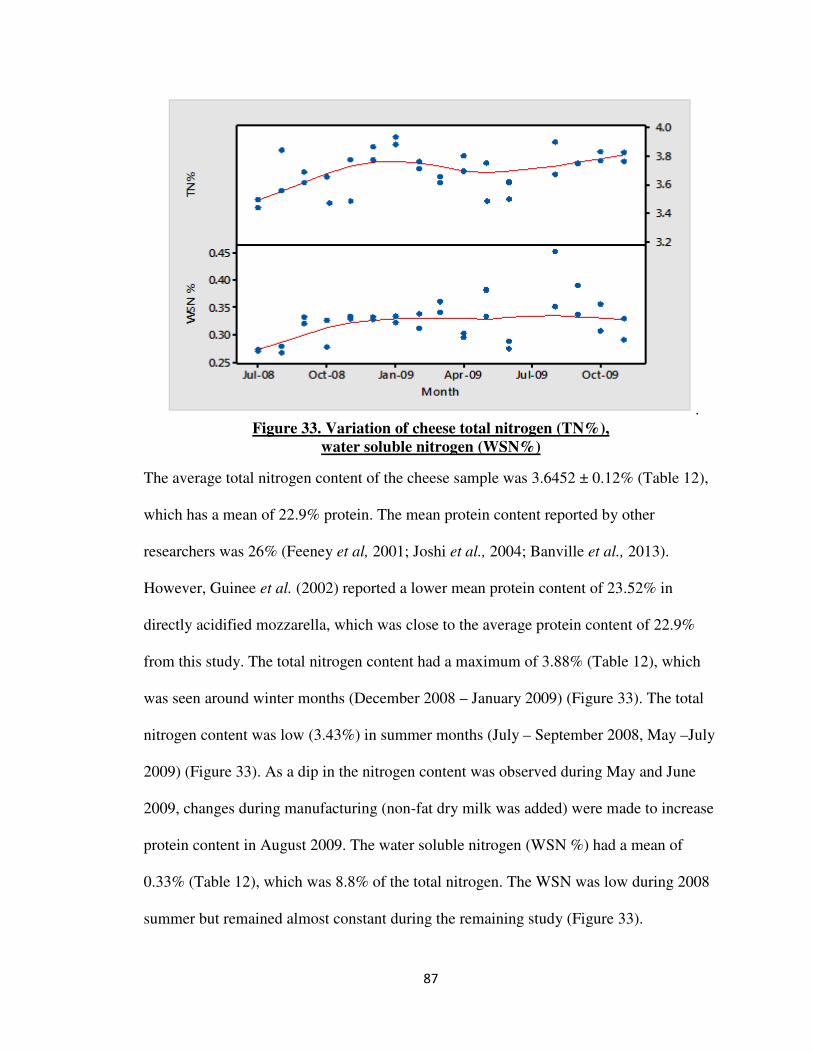
87
.
Figure 33. Variation of cheese total nitrogen (TN%),
water soluble nitrogen (WSN%)
The average total nitrogen content of the cheese sample was 3.6452 ± 0.12% (Table 12),
which has a mean of 22.9% protein. The mean protein content reported by other
researchers was 26% (Feeney et al, 2001; Joshi et al., 2004; Banville et al., 2013).
However, Guinee et al. (2002) reported a lower mean protein content of 23.52% in
directly acidified mozzarella, which was close to the average protein content of 22.9%
from this study. The total nitrogen content had a maximum of 3.88% (Table 12), which
was seen around winter months (December 2008 – January 2009) (Figure 33). The total
nitrogen content was low (3.43%) in summer months (July – September 2008, May –July
2009) (Figure 33). As a dip in the nitrogen content was observed during May and June
2009, changes during manufacturing (non-fat dry milk was added) were made to increase
protein content in August 2009. The water soluble nitrogen (WSN %) had a mean of
0.33% (Table 12), which was 8.8% of the total nitrogen. The WSN was low during 2008
summer but remained almost constant during the remaining study (Figure 33).

88
Figure 34. Variation of cheese fat in dry matter (FDM %), moisture (%)
and salt (%)
The mean ± standard deviation for moisture and fat in dry matter (FDM) of LMPS
mozzarella was 48.024 ± 0.599 % and 41.05 ±1.508%, respectively (Table 12). The
percent moisture content and FDM were within the limits for standard of identity of
LMPS Mozzarella specified by CFR 133.157. Very high and low levels of salt can
decrease protein solubility and affect the melting properties. A 2% salt content is the
optimal level as it increases the casein solubility to a sufficient level, thereby giving the
required meltability in mozzarella (McMahon & Oberg, 2011). The mean ± standard
deviation of salt content was found to be 2.14 ± 0.10 % (Table 12). From Figure 34, the
FDM, moisture content and salt were almost constant during the entire sampling period.
42
40
38
49
48
47
Oct-09Jul-09Apr-09Jan-09Oct-08Jul-08
2.4
2.2
2.0
FDM
%M
oistu
re %
Month
Salt %
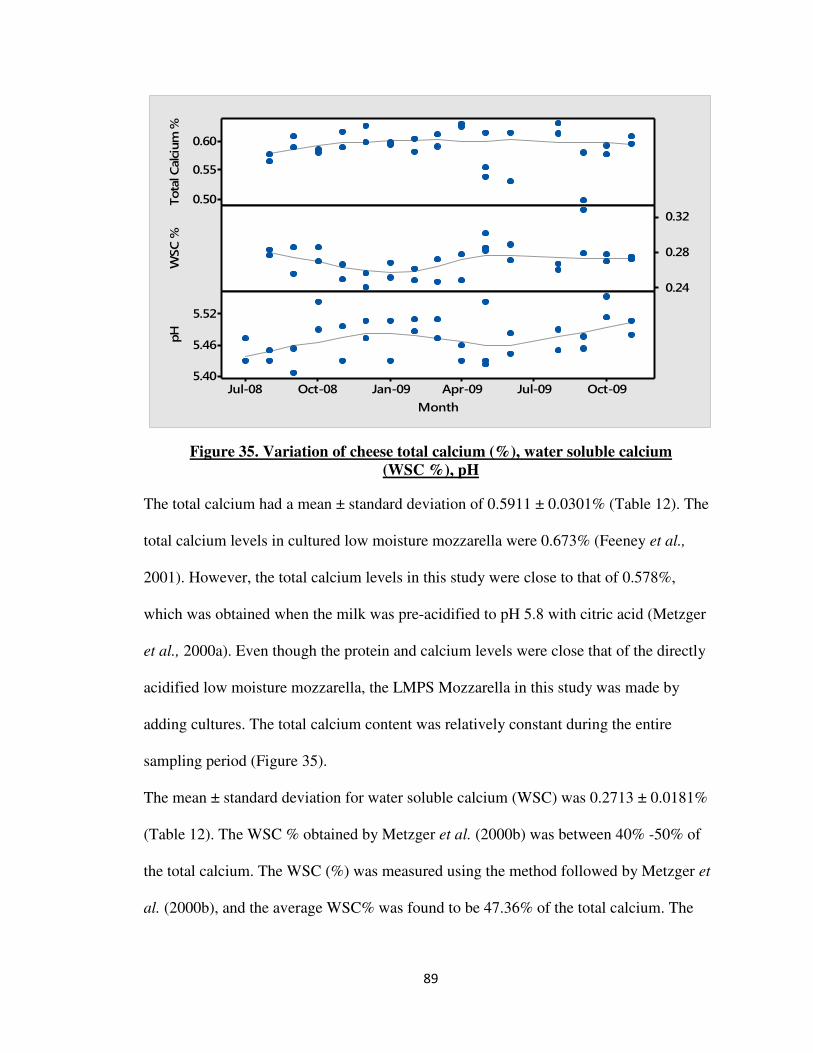
89
Figure 35. Variation of cheese total calcium (%), water soluble calcium
(WSC %), pH
The total calcium had a mean ± standard deviation of 0.5911 ± 0.0301% (Table 12). The
total calcium levels in cultured low moisture mozzarella were 0.673% (Feeney et al.,
2001). However, the total calcium levels in this study were close to that of 0.578%,
which was obtained when the milk was pre-acidified to pH 5.8 with citric acid (Metzger
et al., 2000a). Even though the protein and calcium levels were close that of the directly
acidified low moisture mozzarella, the LMPS Mozzarella in this study was made by
adding cultures. The total calcium content was relatively constant during the entire
sampling period (Figure 35).
The mean ± standard deviation for water soluble calcium (WSC) was 0.2713 ± 0.0181%
(Table 12). The WSC % obtained by Metzger et al. (2000b) was between 40% -50% of
the total calcium. The WSC (%) was measured using the method followed by Metzger et
al. (2000b), and the average WSC% was found to be 47.36% of the total calcium. The
0.60
0.55
0.50
0.32
0.28
0.24
Oct-09Jul-09Apr-09Jan-09Oct-08Jul-08
5.52
5.46
5.40
Total Calcium %
WSC %
Month
pH
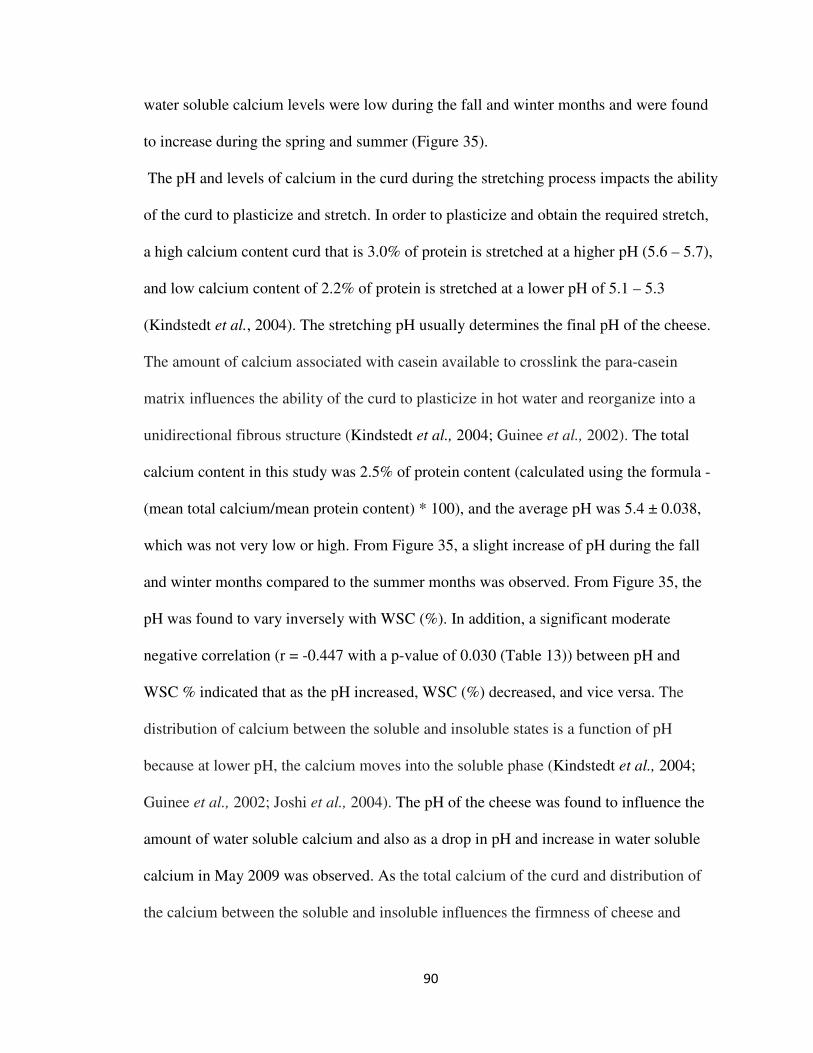
90
water soluble calcium levels were low during the fall and winter months and were found
to increase during the spring and summer (Figure 35).
The pH and levels of calcium in the curd during the stretching process impacts the ability
of the curd to plasticize and stretch. In order to plasticize and obtain the required stretch,
a high calcium content curd that is 3.0% of protein is stretched at a higher pH (5.6 – 5.7),
and low calcium content of 2.2% of protein is stretched at a lower pH of 5.1 – 5.3
(Kindstedt et al., 2004). The stretching pH usually determines the final pH of the cheese.
The amount of calcium associated with casein available to crosslink the para-casein
matrix influences the ability of the curd to plasticize in hot water and reorganize into a
unidirectional fibrous structure (Kindstedt et al., 2004; Guinee et al., 2002). The total
calcium content in this study was 2.5% of protein content (calculated using the formula -
(mean total calcium/mean protein content) * 100), and the average pH was 5.4 ± 0.038,
which was not very low or high. From Figure 35, a slight increase of pH during the fall
and winter months compared to the summer months was observed. From Figure 35, the
pH was found to vary inversely with WSC (%). In addition, a significant moderate
negative correlation (r = -0.447 with a p-value of 0.030 (Table 13)) between pH and
WSC % indicated that as the pH increased, WSC (%) decreased, and vice versa. The
distribution of calcium between the soluble and insoluble states is a function of pH
because at lower pH, the calcium moves into the soluble phase (Kindstedt et al., 2004;
Guinee et al., 2002; Joshi et al., 2004). The pH of the cheese was found to influence the
amount of water soluble calcium and also as a drop in pH and increase in water soluble
calcium in May 2009 was observed. As the total calcium of the curd and distribution of
the calcium between the soluble and insoluble influences the firmness of cheese and

91
hence the texture of cheese (Kindstedt et al., 2004), the pH of the finished cheese was
increased above 5.45 from August 2009 to prevent the water soluble calcium from
decreasing.
Table 13. Correlation between LMPS mozzarella compositions
Cheese
parameters
WSN Total
solids
Fat FDM Total
Ca
WSC Salt pH
Total
nitrogen
0.299 0.071 -0.364 -0.335 -0.088 -0.169 0.145 -0.062
0.091 0.696 0.041 0.041 0.639 0.364 0.419 0.733
WSN -0.528 0.090 0.294 -0.063 0.025 0.239 -0.093
0.002 0.623 0.097 0.735 0.894 0.180 0.608
Total solids -0.163 -0.294 -0.205 -0.03 -0.210 0.153
0.373 0.097 0.269 0.870 0.242 0.395
Fat 0.950 -0.059 0.331 -0.158 0.178
0.000 0.756 0.069 0.380 0.322
FDM -0.288 0.304 -0.075 0.110
0.116 0.097 0.678 0.544
Total Ca -0.639 -0.076 -0.319
0.000 0.683 0.080
WSC -0.028 -0.447
0.882 0.030
Salt -0.203
0.257
Cell content: Pearson correlation coefficient on top and p- value on the bottom. The yellow
markings indicate significant correlation.
2. Textural Analysis of LMPS Mozzarella
The LMPS Mozzarella samples were analyzed for un-melted textural properties such as
textural profile analysis (hardness, cohesiveness, springiness, and chewiness), loss in
shredder, and aggregation index for the 18-month period. The average textural data
obtained during this study is given in Table 14.
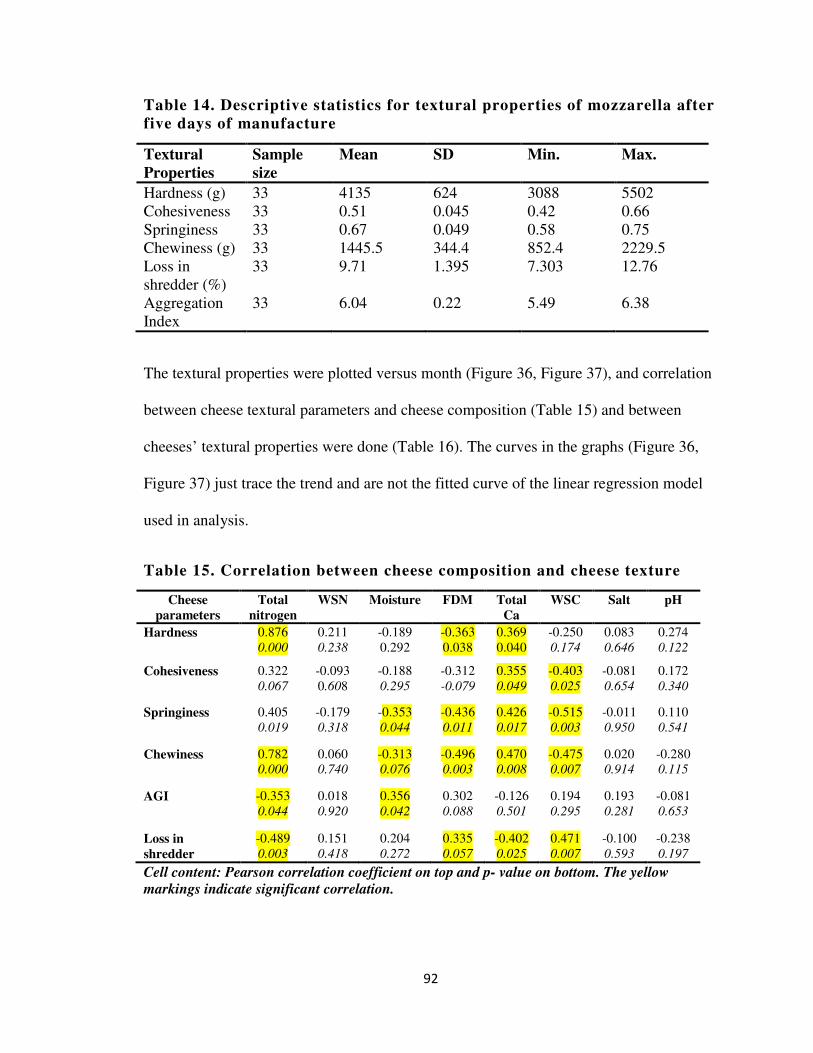
92
Table 14. Descriptive statistics for textural properties of mozzarella after
five days of manufacture
Textural
Properties
Sample
size
Mean SD Min. Max.
Hardness (g) 33 4135 624 3088 5502 Cohesiveness 33 0.51 0.045 0.42 0.66 Springiness 33 0.67 0.049 0.58 0.75 Chewiness (g) 33 1445.5 344.4 852.4 2229.5 Loss in shredder (%)
33 9.71 1.395 7.303 12.76
Aggregation Index
33 6.04 0.22 5.49 6.38
The textural properties were plotted versus month (Figure 36, Figure 37), and correlation
between cheese textural parameters and cheese composition (Table 15) and between
cheeses’ textural properties were done (Table 16). The curves in the graphs (Figure 36,
Figure 37) just trace the trend and are not the fitted curve of the linear regression model
used in analysis.
Table 15. Correlation between cheese composition and cheese texture
Cheese
parameters
Total
nitrogen
WSN Moisture FDM Total
Ca
WSC Salt pH
Hardness 0.876 0.000
0.211 0.238
-0.189 0.292
-0.363 0.038
0.369 0.040
-0.250 0.174
0.083 0.646
0.274 0.122
Cohesiveness 0.322 0.067
-0.093 0.608
-0.188 0.295
-0.312 -0.079
0.355 0.049
-0.403 0.025
-0.081 0.654
0.172 0.340
Springiness 0.405 0.019
-0.179 0.318
-0.353 0.044
-0.436 0.011
0.426 0.017
-0.515 0.003
-0.011 0.950
0.110 0.541
Chewiness 0.782 0.000
0.060 0.740
-0.313 0.076
-0.496 0.003
0.470 0.008
-0.475 0.007
0.020 0.914
-0.280 0.115
AGI -0.353 0.044
0.018 0.920
0.356 0.042
0.302 0.088
-0.126 0.501
0.194 0.295
0.193 0.281
-0.081 0.653
Loss in
shredder
-0.489 0.003
0.151 0.418
0.204 0.272
0.335 0.057
-0.402 0.025
0.471 0.007
-0.100 0.593
-0.238 0.197
Cell content: Pearson correlation coefficient on top and p- value on bottom. The yellow
markings indicate significant correlation.
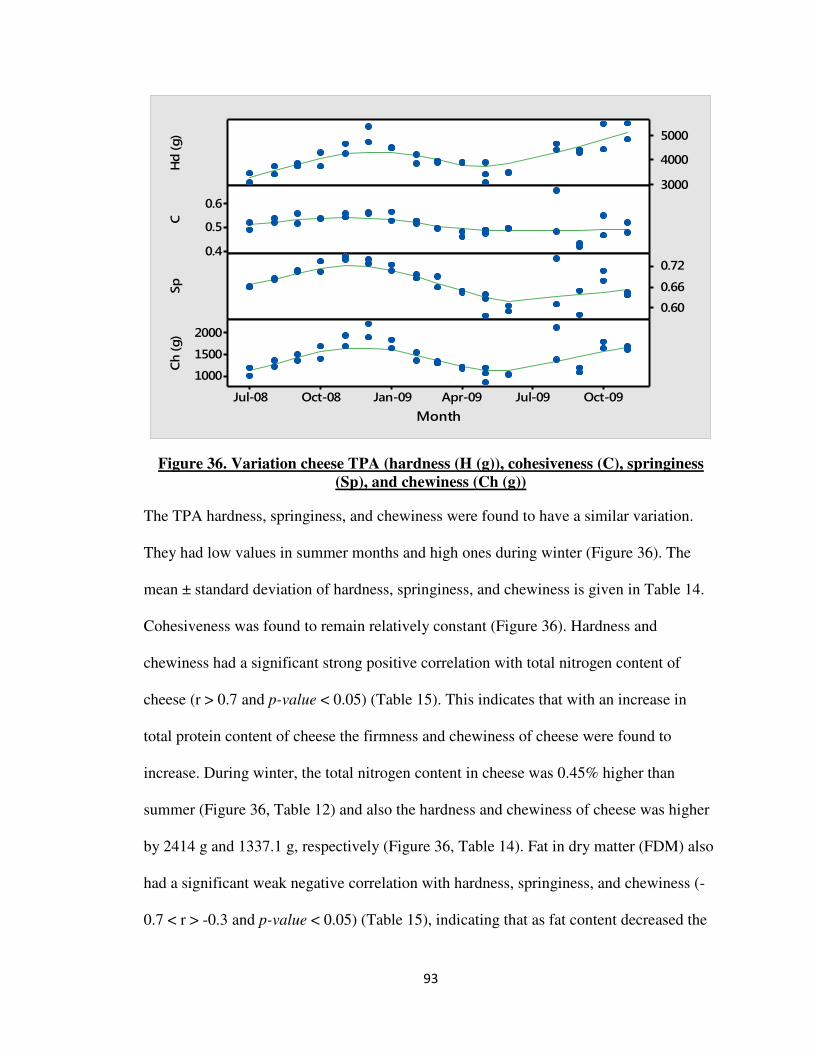
93
Figure 36. Variation cheese TPA (hardness (H (g)), cohesiveness (C), springiness
(Sp), and chewiness (Ch (g))
The TPA hardness, springiness, and chewiness were found to have a similar variation.
They had low values in summer months and high ones during winter (Figure 36). The
mean ± standard deviation of hardness, springiness, and chewiness is given in Table 14.
Cohesiveness was found to remain relatively constant (Figure 36). Hardness and
chewiness had a significant strong positive correlation with total nitrogen content of
cheese (r > 0.7 and p-value < 0.05) (Table 15). This indicates that with an increase in
total protein content of cheese the firmness and chewiness of cheese were found to
increase. During winter, the total nitrogen content in cheese was 0.45% higher than
summer (Figure 36, Table 12) and also the hardness and chewiness of cheese was higher
by 2414 g and 1337.1 g, respectively (Figure 36, Table 14). Fat in dry matter (FDM) also
had a significant weak negative correlation with hardness, springiness, and chewiness (-
0.7 < r > -0.3 and p-value < 0.05) (Table 15), indicating that as fat content decreased the
5000
4000
3000
0.6
0.5
0.40.72
0.66
0.60
Oct-09Jul-09Apr-09Jan-09Oct-08Jul-08
2000
1500
1000
Hd (g)
CSp
Month
Ch (g)
94
TPA hardness, springiness and chewiness increased. Though there was a variation of fat
in dry matter by 6.14% (Table 12) during the sampling period, no seasonal variation was
observed (Figure 34). Also, moisture had a weak negative correlation with springiness
and chewiness (-0.7 < r> -0.3 and p - value <0.05) (Table 15). As moisture content in
cheese decreased, the springiness and chewiness were found to increase. Though there
was a variation of moisture content by 2.59% (Table 12) during the sampling period, no
seasonal variation was observed (Figure 34). Total calcium had a significant positive
weak correlation (0.7< r > 0.3 and p- value < 0.05) (Table 15) with hardness,
cohesiveness, springiness and chewiness, as total calcium increased the hardness,
springiness and chewiness increased. Though there was a variation of total calcium by
0.14% (Table 12) during the sampling period, no seasonal variation was observed (Figure
35). Cohesiveness, springiness and chewiness were found to decrease with water soluble
calcium. i.e., WSC had a significant weak negative correlation (-0.7> r> -0.3 and p- value
<0.05) (Table 15) with cohesiveness, springiness and chewiness. The hardness of cheese
was not found to have any significant correlation with the WSC (%). During the sampling
period, the water soluble calcium varied by 0.08% (Table 12); higher values were
observed during summer and low ones in winter (Figure 35). Therefore, most of the TPA
characteristics of cheese were dependent on the cheese total nitrogen, total calcium,
FDM, water soluble calcium, and moisture content.
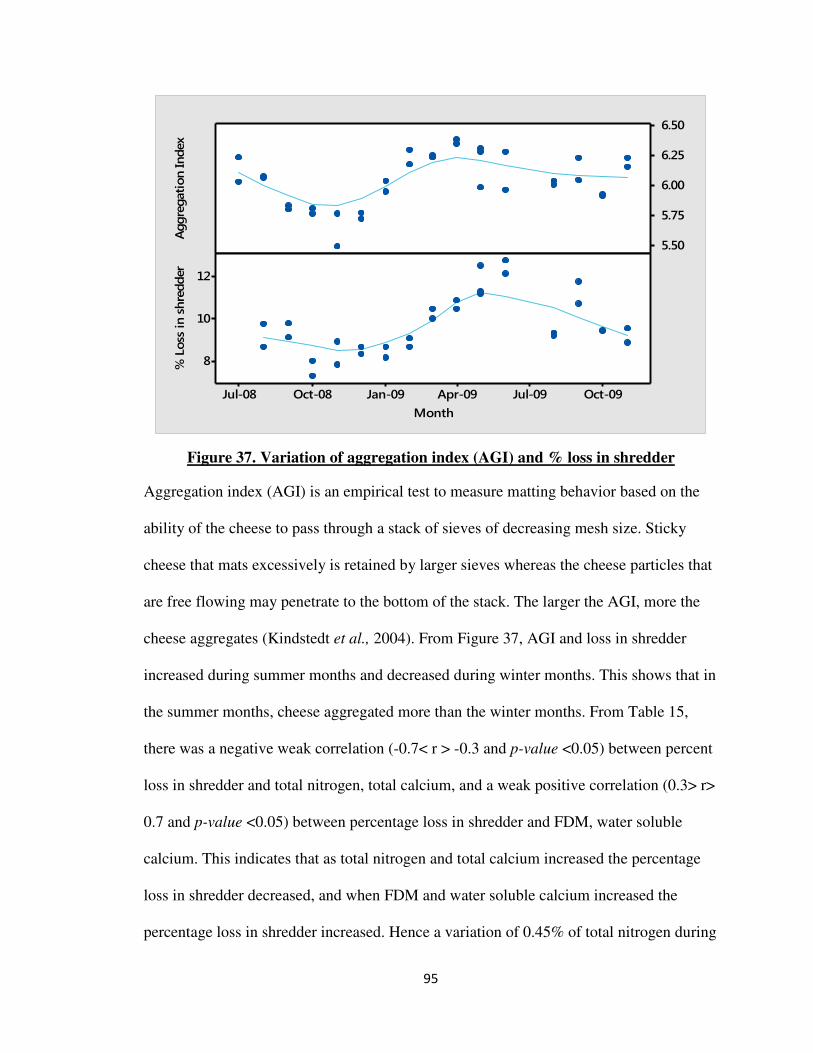
95
Figure 37. Variation of aggregation index (AGI) and % loss in shredder
Aggregation index (AGI) is an empirical test to measure matting behavior based on the
ability of the cheese to pass through a stack of sieves of decreasing mesh size. Sticky
cheese that mats excessively is retained by larger sieves whereas the cheese particles that
are free flowing may penetrate to the bottom of the stack. The larger the AGI, more the
cheese aggregates (Kindstedt et al., 2004). From Figure 37, AGI and loss in shredder
increased during summer months and decreased during winter months. This shows that in
the summer months, cheese aggregated more than the winter months. From Table 15,
there was a negative weak correlation (-0.7< r > -0.3 and p-value <0.05) between percent
loss in shredder and total nitrogen, total calcium, and a weak positive correlation (0.3> r>
0.7 and p-value <0.05) between percentage loss in shredder and FDM, water soluble
calcium. This indicates that as total nitrogen and total calcium increased the percentage
loss in shredder decreased, and when FDM and water soluble calcium increased the
percentage loss in shredder increased. Hence a variation of 0.45% of total nitrogen during
6.50
6.25
6.00
5.75
5.50
Oct-09Jul-09Apr-09Jan-09Oct-08Jul-08
12
10
8
Aggregation Index
Month
% Loss
in shredder
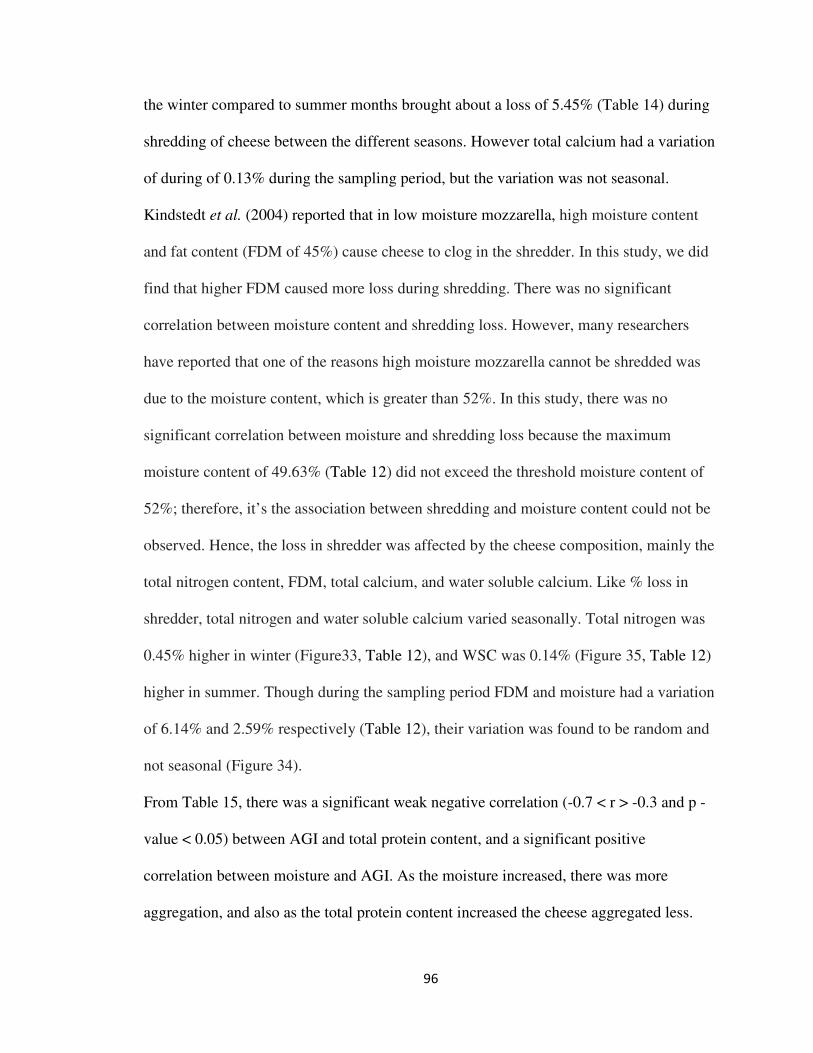
96
the winter compared to summer months brought about a loss of 5.45% (Table 14) during
shredding of cheese between the different seasons. However total calcium had a variation
of during of 0.13% during the sampling period, but the variation was not seasonal.
Kindstedt et al. (2004) reported that in low moisture mozzarella, high moisture content
and fat content (FDM of 45%) cause cheese to clog in the shredder. In this study, we did
find that higher FDM caused more loss during shredding. There was no significant
correlation between moisture content and shredding loss. However, many researchers
have reported that one of the reasons high moisture mozzarella cannot be shredded was
due to the moisture content, which is greater than 52%. In this study, there was no
significant correlation between moisture and shredding loss because the maximum
moisture content of 49.63% (Table 12) did not exceed the threshold moisture content of
52%; therefore, it’s the association between shredding and moisture content could not be
observed. Hence, the loss in shredder was affected by the cheese composition, mainly the
total nitrogen content, FDM, total calcium, and water soluble calcium. Like % loss in
shredder, total nitrogen and water soluble calcium varied seasonally. Total nitrogen was
0.45% higher in winter (Figure33, Table 12), and WSC was 0.14% (Figure 35, Table 12)
higher in summer. Though during the sampling period FDM and moisture had a variation
of 6.14% and 2.59% respectively (Table 12), their variation was found to be random and
not seasonal (Figure 34).
From Table 15, there was a significant weak negative correlation (-0.7 < r > -0.3 and p -
value < 0.05) between AGI and total protein content, and a significant positive
correlation between moisture and AGI. As the moisture increased, there was more
aggregation, and also as the total protein content increased the cheese aggregated less.
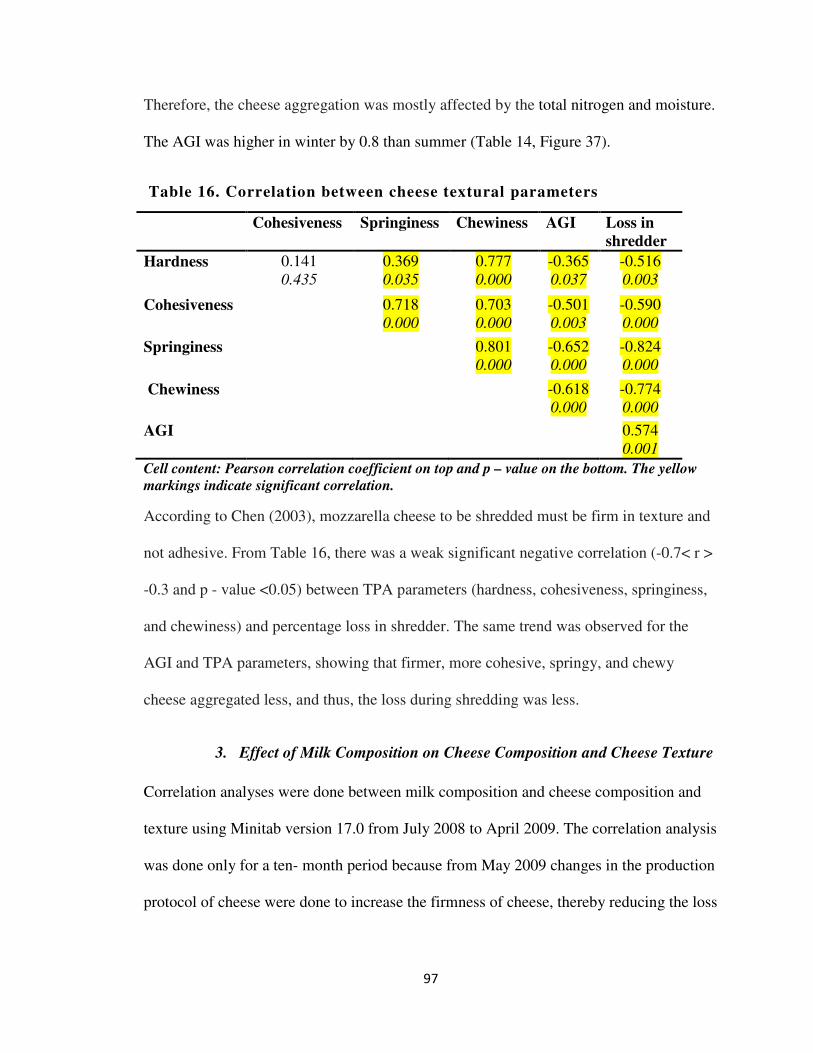
97
Therefore, the cheese aggregation was mostly affected by the total nitrogen and moisture.
The AGI was higher in winter by 0.8 than summer (Table 14, Figure 37).
Table 16. Correlation between cheese textural parameters
Cohesiveness Springiness Chewiness AGI Loss in
shredder
Hardness 0.141 0.435
0.369 0.035
0.777 0.000
-0.365 0.037
-0.516 0.003
Cohesiveness 0.718 0.000
0.703 0.000
-0.501 0.003
-0.590 0.000
Springiness 0.801 0.000
-0.652 0.000
-0.824 0.000
Chewiness -0.618 0.000
-0.774 0.000
AGI 0.574 0.001
Cell content: Pearson correlation coefficient on top and p – value on the bottom. The yellow
markings indicate significant correlation.
According to Chen (2003), mozzarella cheese to be shredded must be firm in texture and
not adhesive. From Table 16, there was a weak significant negative correlation (-0.7< r >
-0.3 and p - value <0.05) between TPA parameters (hardness, cohesiveness, springiness,
and chewiness) and percentage loss in shredder. The same trend was observed for the
AGI and TPA parameters, showing that firmer, more cohesive, springy, and chewy
cheese aggregated less, and thus, the loss during shredding was less.
3. Effect of Milk Composition on Cheese Composition and Cheese Texture
Correlation analyses were done between milk composition and cheese composition and
texture using Minitab version 17.0 from July 2008 to April 2009. The correlation analysis
was done only for a ten- month period because from May 2009 changes in the production
protocol of cheese were done to increase the firmness of cheese, thereby reducing the loss
98
during shredding. The corresponding week milk and cheese samples were correlated for
the ten- month period, and the results are summarized in Table 17 and Table 18.
Table 17. Correlation between cheese composition and milk composition
Cheese Composition
Milk
Components
TN WSN Moisture FDM Total
Ca WSC Salt pH
TN 0.725 0.003
0.263 0.262
-0.549 0.012
-0.552 0.012
0.050 0.845
-0.171 0.498
-0.048 0.841
-0.090 0.707
True N 0.635 0.003
0.187 0.431
-0.531 0.016
-0.522 0.018
-0.012 0.961
-0.242 0.333
-0.056 0.816
-0.100 0.675
NPN 0.728 0.000
0.400 0.080
-0.505 0.023
-0.499 0.025
0.306 0.095
0.073 0.773
-0.017 0.944
0.083 0.727
NCN 0.056 0.814
0.014 0.953
-0.454 0.045
-0.296 0.205
0.590 0.010
0.327 0.185
0.103 0.665
0.397 0.083
Casein 0.744 0.000
-0.308 0.187
-0.410 0.072
-0.464 0.039
-0.061 0.809
-0.262 0.293
-0.086 0.718
-0.186 0.433
CPt 0.648 0.002
0.319 0.171
-0.125 0.598
-0.255 0.277
-0.217 0.388
-0.355 0.148
-0.136 0.568
-0.307 0.188
CP 0.759 0.000
0.393 0.086
-0.217 0.358
-0.337 0.146
-0.109 0.667
- 0.248 0.321
-0.113 0.635
-0.258 0.272
Fat -0.149 0.543
-0.115 0.640
0.166 0.498
0.411 0.080
-0.524 0.031
-0.229 0.377
-0.037 0.881
0.125 0.610
TS 0.064 0.394
-0.005 0.984
0.088 0.727
0.261 0.281
-0.518 0.033
-0.290 0.258
0.009 0.862
-0.064 0.794
Total Ca 0.624 0.003
0.577 0.008
-0.176 0.450
-0.219 0.355
0.430 0.045
0.252 0.314
0.246 0.297
-0.056 0.81
Somatic
cells/µL
0.339 0.144
-0.098 0.680
-0.344 0.137
-0.231 0.328
-0.281 0.258
-0.191 0.447
0.007 0.977
0.252 0.283
pH -0.297 0.213
-0.411 0.072
-0.401 0.080
-0.047 0.846
0.189 0.453
0.112 0.657
0.056 0.813
0.331 0.154
Cell content: Pearson correlation coefficient (r) on top and p – value on the bottom.
The yellow -markings indicate significant correlation.
The raw milk quality, especially the casein, pH, total calcium, fat, and somatic cells, has
an important impact on the quality and yield of cheese (Barbano, 1987; Kindstedt et al.,
2004). Cheese milk was standardized to a ratio of casein to fat of 1.2 to get a good yield
and meet the standard of identity of LMPS Mozzarella (Rankin et al., 2006). In cheese
making, casein plays an important role in cheese composition, texture, and yield. It forms
99
the structural network in which fat and moisture are trapped. The formation and
properties of the coagulum derived from casein network determines the efficiency of milk
constituents’ retention in cheese (Walstra et al., 2006). Therefore, a significant strong
positive correlation (r >0.7 and p-value < 0.05) (Table 17) was observed between total
nitrogen, true nitrogen, casein, non-protein nitrogen content and casein to total protein
(CP) of milk and total nitrogen content of cheese. Also, there was a moderate positive
correlation between (0.7 < r > 0.3 and p-value < 0.05) (Table 17) between total calcium
true nitrogen, and casein to true protein (CPt) ratio and total nitrogen content of cheese.
From Table 17, there was a moderate positive correlation between (0.7 < r > 0.3 and p-
value < 0.05) between total calcium in milk and cheese. From Table 18, milk total
nitrogen, true nitrogen NPN, casein, CP, CPt and had a significant strong to moderate
positive correlation with the TPA characteristics of cheese (r > 0.6 and p- value < 0.05).
Also, a significant strong moderate negative correlation (-0.8 < r > -0.4 and p- value <
0.05) between milk total nitrogen, true nitrogen NPN, casein, CP, CPt NPN, casein, CP,
and CPt with loss in shredder and AGI were observed. The total calcium content in milk
correlated positively (r > 0.4, p-value >0.2) (Table 18) with hardness in cheese. As the
total nitrogen content, true nitrogen, casein and non- protein content of milk varied by
0.06 %, 0.066% 0.53% and 0.019% respectively (Table 9), there was variation of 0.45%
of total nitrogen (Table 12), 5.45% loss in shredder, 0.90 of AGI in cheese between
seasons (Table 14), with higher values being in summer and lower ones in summer. In
milk, the variation of NPN over different seasons was found to have an association on the
total nitrogen content, casein, and true nitrogen, thereby influencing the CP and CPt
ratios.
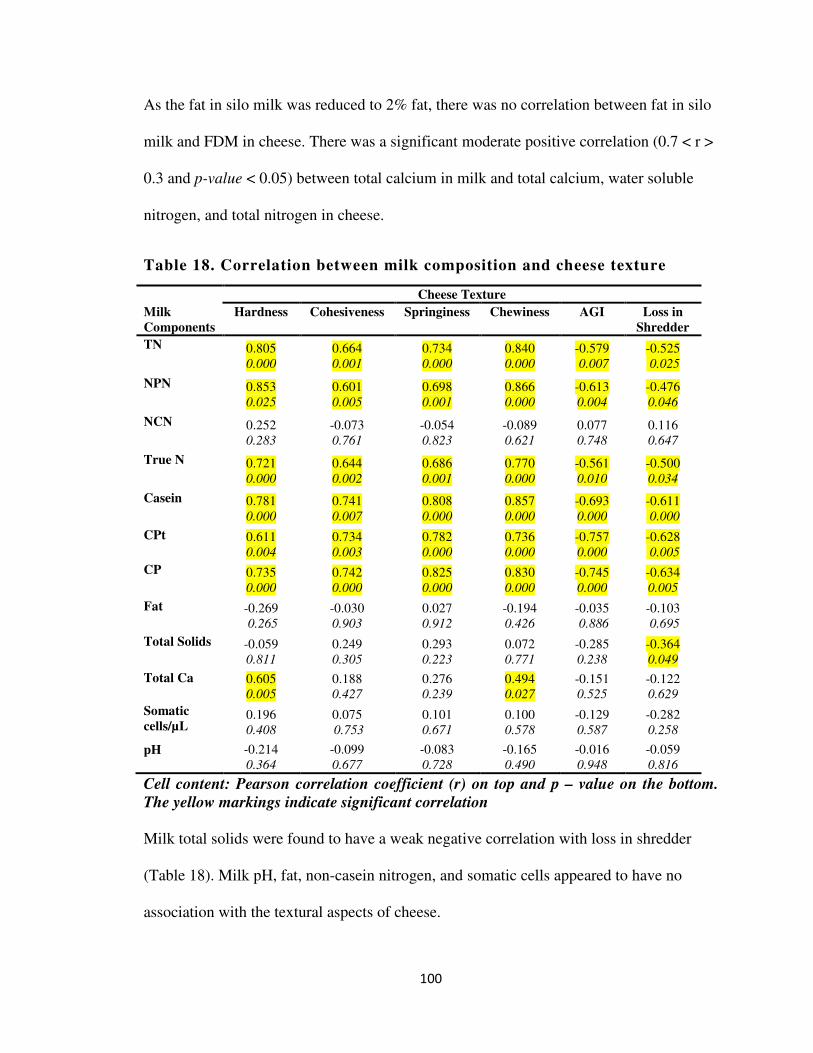
100
As the fat in silo milk was reduced to 2% fat, there was no correlation between fat in silo
milk and FDM in cheese. There was a significant moderate positive correlation (0.7 < r >
0.3 and p-value < 0.05) between total calcium in milk and total calcium, water soluble
nitrogen, and total nitrogen in cheese.
Table 18. Correlation between milk composition and cheese texture
Cheese Texture
Milk
Components
Hardness Cohesiveness Springiness Chewiness AGI Loss in
Shredder
TN 0.805 0.000
0.664 0.001
0.734 0.000
0.840 0.000
-0.579 0.007
-0.525 0.025
NPN 0.853 0.025
0.601 0.005
0.698 0.001
0.866 0.000
-0.613 0.004
-0.476 0.046
NCN 0.252 0.283
-0.073 0.761
-0.054 0.823
-0.089 0.621
0.077 0.748
0.116 0.647
True N 0.721 0.000
0.644 0.002
0.686 0.001
0.770
0.000 -0.561 0.010
-0.500 0.034
Casein 0.781 0.000
0.741 0.007
0.808 0.000
0.857 0.000
-0.693 0.000
-0.611 0.000
CPt 0.611 0.004
0.734 0.003
0.782 0.000
0.736 0.000
-0.757 0.000
-0.628 0.005
CP 0.735 0.000
0.742 0.000
0.825 0.000
0.830 0.000
-0.745 0.000
-0.634 0.005
Fat -0.269 0.265
-0.030 0.903
0.027 0.912
-0.194 0.426
-0.035 0.886
-0.103 0.695
Total Solids -0.059 0.811
0.249 0.305
0.293 0.223
0.072 0.771
-0.285 0.238
-0.364 0.049
Total Ca 0.605 0.005
0.188 0.427
0.276 0.239
0.494 0.027
-0.151 0.525
-0.122 0.629
Somatic
cells/µL 0.196 0.408
0.075 0.753
0.101 0.671
0.100 0.578
-0.129 0.587
-0.282 0.258
pH -0.214 0.364
-0.099 0.677
-0.083 0.728
-0.165 0.490
-0.016 0.948
-0.059 0.816
Cell content: Pearson correlation coefficient (r) on top and p – value on the bottom.
The yellow markings indicate significant correlation
Milk total solids were found to have a weak negative correlation with loss in shredder
(Table 18). Milk pH, fat, non-casein nitrogen, and somatic cells appeared to have no
association with the textural aspects of cheese.
101
Therefore, during the manufacture of cheese, the calcium, total protein, and casein
content in cheese milk should be monitored closely as they are found to have a significant
association with the texture and composition of LMPS mozzarella. But as the milk is only
a representation and not the exact milk from which the weekly cheese was made, the
conclusions that can be drawn from the study were limited.
C. The Effect of Temperature on Ripening
The ripening temperature influences the rate of proteolysis, the cheese composition,
cheese texture, and micro flora. Most of the studies have concentrated on cheddar and
Dutch varieties (Creamer, 1976; Kindstedt et al., 2004). In low moisture mozzarella,
Feeney et al. observed that after 15 days of ripening, there was significant difference in
pH 4.6 WSN between cheeses ripened at 100 C and 150 C and cheese ripened at 00 C and
40 C. Also extensive degradation of αs1-casein was observed at 100 C and 150 C. The
study indicated that changing the ripening temperature provides a convenient means of
controlling proteolysis without altering the type of proteolysis. A lot of researchers have
reported that they saw a significant difference in proteolysis when cheeses were ripened
above 10o C, or if the cheese was ripened for more than 50 days at temperatures below
100 C (Jana & Mandal, 2011).
A brief ripening period of LMPS mozzarella (usually less than a month) is required for
the cheese to get the desired functional properties to be used as a pizza ingredient When
cheese is maintained at cold temperatures for about two to three weeks, the caseins
become more hydrated and swollen due to free water being absorbed back into the
protein matrix, and the cheese protein matrix expands into the fat-serum channel giving
the cheese the desired meltabilty and oiling off properties (Kindstedt et al., 2004). Newly
102
manufactured cheese has excessive moisture at the surface and within the body of cheese,
hence it will not shred well. Four to five days of ageing will allow the cheese to absorb
the moisture back, and this will improve the shredding quality (McMahon & Oberg,
2011). Thus, the cheese is shredded typically two to three weeks after manufacture.
Therefore, in this study the main focus was to see if there was an association between
temperature (below 100 C) and the LMPS mozzarella unheated textural properties, pH,
and water soluble nitrogen when ripened for a short period of time (21 days). Thereby,
two blocks of 10 lb vacuum packed cheese samples shipped from the plant in Central
Valley, California, were subjected to ripening, one block at 3.30 C and the other at 8.90 C
for 21 days from the date of manufacture. After 21 days, both the cheese blocks ripened
at different temperatures were brought to a core temperature of 3.30 C before carrying out
the analysis. The results are summarized in Table 19.
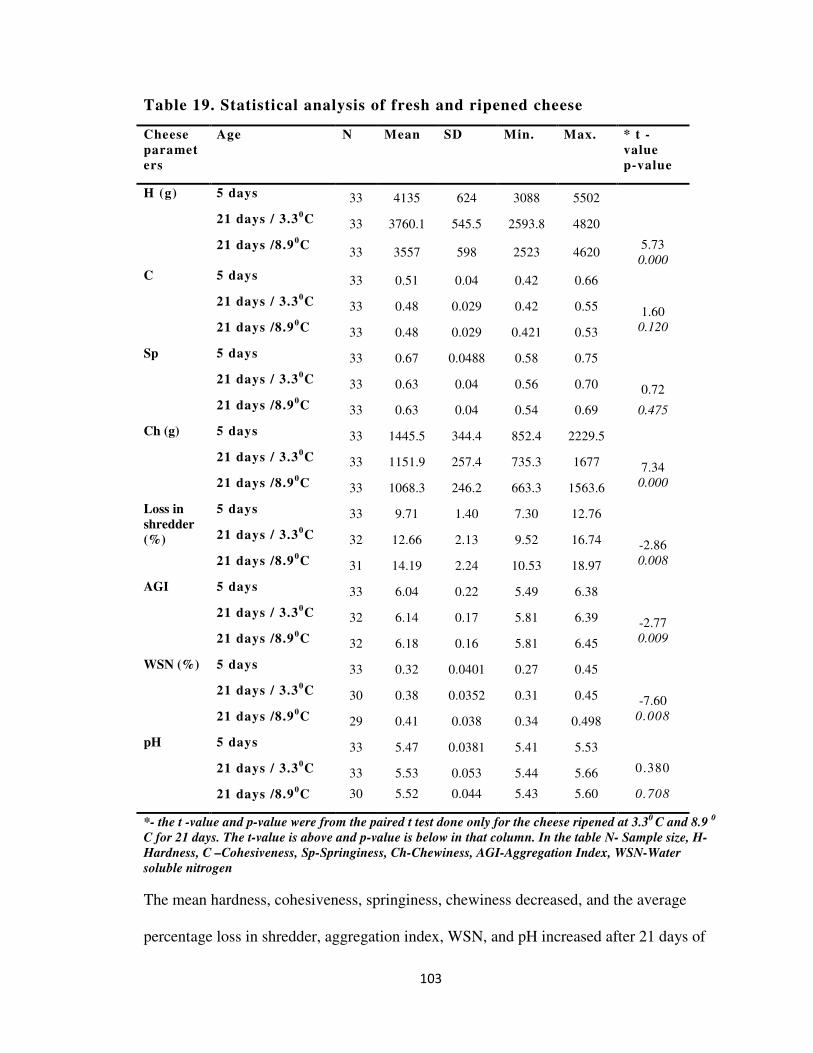
103
Table 19. Statistical analysis of fresh and ripened cheese
Cheese
paramet
ers
Age N Mean SD Min. Max. * t -
value
p-value
H (g) 5 days 33 4135 624 3088 5502
21 days / 3.30C 33 3760.1 545.5 2593.8 4820
21 days /8.90C
33 3557 598 2523 4620 5.73
0.000
C 5 days 33 0.51 0.04 0.42 0.66
21 days / 3.30C 33 0.48 0.029 0.42 0.55 1.60
21 days /8.90C 33 0.48 0.029 0.421 0.53 0.120
Sp
5 days 33 0.67 0.0488 0.58 0.75
21 days / 3.30C 33 0.63 0.04 0.56 0.70 0.72
21 days /8.90C 33 0.63 0.04 0.54 0.69 0.475
Ch (g) 5 days 33 1445.5 344.4 852.4 2229.5
21 days / 3.30C 33 1151.9 257.4 735.3 1677 7.34
21 days /8.90C 33 1068.3 246.2 663.3 1563.6 0.000
Loss in
shredder
(%)
5 days 33 9.71 1.40 7.30 12.76
21 days / 3.30C 32 12.66 2.13 9.52 16.74 -2.86
21 days /8.90C 31 14.19 2.24 10.53 18.97 0.008
AGI 5 days 33 6.04 0.22 5.49 6.38
21 days / 3.30C 32 6.14 0.17 5.81 6.39 -2.77
21 days /8.90C 32 6.18 0.16 5.81 6.45 0.009
WSN (%) 5 days 33 0.32 0.0401 0.27 0.45
21 days / 3.30C 30 0.38 0.0352 0.31 0.45 -7.60
21 days /8.90C 29 0.41 0.038 0.34 0.498 0.008
pH 5 days 33 5.47 0.0381 5.41 5.53
21 days / 3.30C 33 5.53 0.053 5.44 5.66 0.380
21 days /8.90C 30 5.52 0.044 5.43 5.60 0.708
*- the t -value and p-value were from the paired t test done only for the cheese ripened at 3.30 C and 8.9
0
C for 21 days. The t-value is above and p-value is below in that column. In the table N- Sample size, H-
Hardness, C –Cohesiveness, Sp-Springiness, Ch-Chewiness, AGI-Aggregation Index, WSN-Water
soluble nitrogen
The mean hardness, cohesiveness, springiness, chewiness decreased, and the average
percentage loss in shredder, aggregation index, WSN, and pH increased after 21 days of
104
manufacture in comparison to the five day old cheese. Yun et al. (1993c) reported a
decrease in textural characteristics namely hardness, cohesiveness, and springiness when
cheese was ripened for 50 days at 40 C. As LMPS mozzarella ripened, Jana & Mandal
(2011) reported that there was a significant decrease in the concentration of intact casein
and firmness. Kindstedt et al. (1994) observed that for low moisture mozzarella the water
soluble nitrogen increased significantly during seven weeks of ripening, but the rate of
increase depended on the different coagulants. The increase in water soluble nitrogen can
cause an increase in pH (Jana & Mandal, 2011). Hence, the decrease in intact casein
during proteolysis would be the contributing factor for a decrease in hardness,
cohesiveness, springiness, chewiness, and an increase in WSN and pH during the 21-day
ripening period. In commercial shredders, where centrifugal force is used for shredding, a
firm textured cheese has less deformation, and blades are able to make cleaner cut. In
addition, a firm textured cheese cube maintains a uniform speed, and blades can cut
shreds the length of the cube. On the other hand, a soft textured cheese bends and
deforms around the blade, slowing the portion of the cheese cube in contact with the
blade (Rankin et al., 2006). Hence, the decrease in firmness would have attributed to the
increase in percentage loss of shredder. There was an increase in aggregation index,
which indicates that the shredded cheese clumped and aggregated more in the 21-day
ripened cheese than the 5-day old cheese. However, the increase in aggregation index
(AGI) was very minimal (approximately 2%), and this could be overcome by application
of anti-caking agents (Jana & Mandal, 2011).
105
From Table 19 the average hardness, cohesiveness, springiness and chewiness were
greater in cheese ripened at 3.30 C than the cheese ripened at 8.90 C. The mean loss in
shredder, AGI, and water soluble nitrogen was less in cheese ripened at 3.30 C. The mean
aggregation index (AGI) and pH were similar in cheese ripened at different temperatures.
Paired t- test analyses were done using Minitab Version 17.0 to analyze whether there
was any significant difference (at α=0.05) between the hardness, cohesiveness,
springiness, chewiness, aggregation index, percentage loss in shredder, pH, and WSN.
The data was independent and the p-values were all greater than 0.05 in the normality
plots indicating that the data was normally distributed (Appendix 8). There was a
significant difference in the water soluble nitrogen (WSN), hardness, chewiness,
aggregation index, and percent loss in shredder with a p-value < 0.05 when ripened at
different temperatures (3.30 C and 8.90 C) (Table 19). At 95% confidence limit there was
no significant difference in the pH, cohesiveness, and springiness of cheese.

106
Figure 38. Urea- PAGE of sodium caseinate and LMPS mozzarella ripened at
different temperatures. Lane 1 & 2 – Sodium caseinate standard. Lane 3, 4, and 5 –
Fresh cheese. Lane 6 and 7 – Cheese Ripened at 3.30 C. Lane 8 and 9 – Cheese
ripened at 8.90C
Urea-polyacrylamide gel electrophoretogram of the fresh and cheese ripened at different
temperatures are shown in. Overall, the trends observed with PAGE are consistent with
those of water soluble nitrogen (p –value <0.05 (Table 19)), which showed that
proteolysis was significantly affected by ripening temperature. Increasing the ripening
temperature resulted in an increase in the rate of degradation of αs1 -casein where most of
the degradation was observed at 8.90 C. In agreement with previous studies on Mozzarella
(Yun et al., 1993a; Yun et al., 1993b; Fox P.F., 1989), there was very little hydrolysis of
β-casein over the 21- day period. The relatively low degree of age-related degradation of
β-casein, compared to as αs1 -casein, has also been observed for other cheese varieties
1 2 3 4 5 6 7 8 9 10
γ -β -
αs1
-
107
such as Cheddar, Gouda, and Blue-cheese (Creamer, 1976). Hence, in this study we can
conclude that there was an increase in the rate of proteolysis at 8.90 C than at 3.30 C. This
rate of proteolysis affected the water soluble nitrogen and the textural properties mainly
hardness, chewiness, aggregation index, and percentage loss during shredding of LMPS
Mozzarella
108
V. CONCLUSIONS
In this study, seasonal observations for total nitrogen, casein nitrogen, non-protein
nitrogen, true nitrogen, casein to total nitrogen ratio, casein to true nitrogen ratio, and
total calcium were measured and analyzed in the silo milk collected from a plant in
Central Valley, California, from July 2008 to December 2009. The seasonal changes
showed that all the above constituents had highest values during winter months and low
ones in summer months. In addition, 2008 and 2009 had very less precipitation
(Appendix 4), and the hottest months were in June to September with temperatures
crossing over 1000 F (Appendix 3). Hence, the variation of total nitrogen, casein nitrogen,
non-protein nitrogen and total calcium can be attributed to the high temperatures (above
1000 F), less food intake due to heat stress, and longer photoperiods during the summer
months compared to the winter months.
Therefore, the accuracy of fixed casein to total protein ratio often used in dairy plants to
estimate casein content of milk throughout different seasons is questionable. Thus, it may
be concluded that estimating casein from true protein or casein from total protein while
accounting for monthly variations of total nitrogen and non-protein nitrogen should be
more accurate. As there was a seasonal variation for casein and total calcium, a close
monitor of these components may be beneficial to improve the quality and consistency of
cheese throughout the year.
The total nitrogen and pH of low moisture part skim (LMPS) mozzarella was found to
have higher values in winter months and decrease during summer. The water soluble
calcium of the LMPS mozzarella was found to be less in winter months than summer
months. As the pH of cheese was found to decrease, the water soluble calcium levels
increased and vice versa. The hardness, chewiness and springiness of cheese were found
109
to have high values in winter and low ones in summer. The loss during shredding and
aggregation of LMPS Mozzarella were more in summer than winter months.
The total nitrogen, total calcium, and water soluble calcium of the cheese were found to
have significant correlation with the hardness, chewiness, aggregation index and loss in
the shredder. Also, the total calcium, total protein, casein, and non-protein nitrogen
content in cheese milk were found to have a significant association on the texture and
composition of LMPS mozzarella. As the total nitrogen content, true nitrogen, casein,
non-protein content, and total calcium of milk varied by 0.06 %, 0.066% 0.53%, 0.019%,
and 0.03% respectively (Table 9), there was a variation of 0.45% of total nitrogen, 0.13%
total calcium 0.088% water soluble calcium, (Table 12), 2414 g of hardness, 5.45% loss
in shredder, and 0.90 of AGI (Table 14) in LMPS Mozzarella between seasons. The pH
of the cheese did not significantly correlate with the textural characteristics of the cheese.
However, as pH of cheese had a moderate negative with water soluble calcium and loss
in shredder correlated positively with the water soluble calcium. pH of cheese was
increased to above 5.45 during summer months to prevent the water soluble calcium
levels from increasing, and hence the loss in shredder was minimized. The total nitrogen
content of cheese during the summer months was also increased by changing the
manufacturing protocol. Hence, the firmness of cheese was increased, and the
aggregation index and percentage losses in shredder were minimized during the summer
months.
Therefore, higher total nitrogen content, mainly the casein content and total calcium of
milk, brought about higher total nitrogen content of LMPS Mozzarella and firmer cheese,
which in turn contributed to less loss in shredder and less aggregation in LMPS
110
Mozzarella. Since the milk samples were only a representation and not the exact milk
from which the cheese was made, the conclusions that can be drawn from this study are
limited.
Also, there was a significant difference (α =0.05) in the water soluble nitrogen (WSN),
hardness, chewiness, aggregation index, and percent loss in shredder with a p-value <
0.05 when LMPS Mozzarella was ripened at different temperatures (3.30 C and 8.90 C)
for 21 days (Table 19). At 95% confidence limit, there was no significant difference in
the pH, cohesiveness, and springiness of cheese when the cheese was ripened at different
temperatures. Increasing the ripening temperature resulted in an increase in the rate of
degradation of αs1 -casein where most of the degradation was observed at 8.90 C. There
was relatively low degree of age-related degradation of β-casein, compared to as αs1 –
casein. Hence, in this study we can conclude that there was an increase in the rate of
proteolysis at 8.90 C than at 3.30 C. This rate of proteolysis affected water soluble
nitrogen content of cheese and the textural properties of LMPS Mozzarella mainly the
hardness, chewiness, aggregation index, and percentage loss during shredding.
111
VI. RECOMMENDATIONS FOR FUTURE WORK
• In this study, the seasonal variation of milk components was analyzed by
collecting milk samples from only one plant in the Central valley, California. To
eliminate limitations’, milk samples should be taken from different plants and
different areas in California to give us more information on the seasonal variation
of milk composition.
• Also, the milk used for making cheese should be analyzed to study the association
of milk composition on cheese composition and texture. In this study the milk
from silo was only a representation and not the exact milk from which the cheese
was made, hence the conclusions that can be drawn from the study were limited.
• As this was an observational study, no cause and effect conclusions can be drawn.
Hence a well-designed experimental study would give more substantial
conclusions
112
REFERENCES
AOAC (1995) Official Methods of Analysis. Dairy Products. 16th ed. Association of
Official Analytical Chemists. Arlington, VA. pp: 11-13.
AOAC (2000) Official Methods of Analysis. Dairy Products 17th ed. Association of
Official Analytical Chemists. Arlington, VA. pp: 1- 57.
Arnold R.M., (2008a). Lab Procedures Compiled by Arnold – Analysis of Salt in Cheese,
Samples Dairy Products Technology Center, California Polytechnic State
University, San Luis Obispo, CA.
Arnold R.M., (2008b). Lab Procedures Compiled by Arnold – Texture Profile Analysis of
Cheese Samples. Dairy Products Technology Center, California Polytechnic State
University, San Luis Obispo, CA.
Arnold R.M., (2008c). Lab Procedures Compiled by Arnold – UREA Page for Cheese
Samples Dairy Products Technology Center, California Polytechnic State
University, San Luis Obispo, CA.
Banks, J.M., (2007) How is Cheese Yield Defined? In: Cheese Problems Solved edited
by McSweeney, P.L.H., CRC press, Boca Raton, FL, USA. pp 102 – 105.
Retrieved from http://books.google.com/books?id=gKijAgAAQBAJ&pg=
PA107&lpg=PA107&dq#v=onepage&q&f=false May 2014
Banville, V., Morin, P., Pouliot, Y., and Britten, M., (2013) Physical Properties of Pizza
Mozzarella Cheese Manufactured under Different Cheese Making Conditions. J.
Dairy Sci. 96: 4804-4815.
Barbano D.M., (1987) Impact of Seasonal Variation in Milk Composition on Cheese
Yields and Composition. Dairy Field October: 46 – 50.
113
Barbano, D., and Wojciechowski, K., (2012) Issues Related to Sampling and Analysis of
Milk. Tri-State Dairy Nutrition Conference, 33-41.
Barbano, D.M., (1994) Reference and Routine Methods for Measurement of Nitrogen
Fractions. In Protein Definition. International Dairy Federation Publication
S.1.19403, Brussels, Belgium, pp 50 -54.
Barbano, D.M., Verdi, R., and Rasmusse, R., (1987a). Milk Quality Influences Cheese
Yields. Dairy Field November: 22-25.
Bernabucci, U., Lacetera, N., Ronchi, B., and Nardone A., (2002) Effects of the Hot
Season on Milk Protein Fractions in Holstein Cows. Anim. Res. 51: 25–33.
Bertocchi, L., Vitali, A.,. Lacetera ,N.,. Nardone, A., Varisco, G., and Bernabucci, U.,
(2014) Seasonal Variations in the Composition of Holstein Cow’s Milk and
Temperature–Humidity Index Relationship. Animal 8(4): 667–674.
Bruhn, J. C., and Franke, A. A., (1977) Monthly Variations in Gross Composition in
California Herd Milks. J. Dairy Sci. 60: 696-700.
Bruhn, J. C., and Franke, A. A., (1991) Raw Milk Composition and Cheese Yields in
California: 1987 and 1988. J. Dairy Sci. 74(3): 1108-1114.
Callaghan, D.J.O. and Guinee, T.P., (2004) Rheology and Texture of Cheese. In:
Chemistry, Physics and Microbiology (Volume 1) edited by Fox P.F.,
McSweeney P.L.H, Cogan T.M and Guinee T.P., 3rd edition. Elsevier Academic
Press, California, USA. pp: 205 - 259 .
CFR 133.155 to 133.158. Retrieved from http://www.access.gpo.gov/nara/cfr
/waisidx_06/21cfr133_06.html from May 2014
114
Chen, C.M., (2003) Final report: Development and Application of Cheese Shred/Texture
Map Delineated by Cheese Rheological, Sensory and Chemical Analysis.
Wisconsin Center for Dairy Research Annual Report FY 2003.
Childs, J.L., Daubertr, C.R., Stefanski, L., and Foegeding, E.A., (2007) Factors
Regulating Cheese Shreddability. J. Dairy Sci. 90: 2163-2174.
Creamer L.K., (1976) Casein Proteolysis in Mozzarella Type Cheese, N.Z.J. Dairy Sci.
Technol. 11: 131–132.
DeLaval Cell Counter DCC Manual. Retrieved from http://www.delaval.com/en/-
/Product-Information1/Milking/Products/Milk-test--treatment/DeLaval-Cell-
Counter-DCC/DCC/ September 2014.
DePeters, E.J., and Ferguson, J.D., (1992) Non-protein Nitrogen and Protein Distribution
in the Milk of Cows. J. Dairy Sci. 75: 3192-3209.
Dohoo, I.R., and Meek, A.H., (1982) Somatic Cell Counts in Bovine milk. Can. vet. J.
23: 119-125.
Feeney, E.P., Foe, P.F., Guinee, T.P., (2001) Effect of Ripening Temperature of the
Quality of Low Moisture Mozzarella Cheese: 1. Composition and Proteolysis,
Lait 81: 463-474.
Fox P.F. and Cogan T.M., (2004) Factors that Affect Cheese Quality. In: Cheese:
Chemistry, Physics and Microbiology (Volume 1) edited by Fox P.F.,
McSweeney P.L.H, Cogan T.M and Guinee T.P. 3rd edition. Elsevier Academic
Press. pp: 583 – 609.
Fox P.F., (1989) Proteolysis during Cheese Manufacture and Ripening. J. Dairy Sci. 72:
1389–1410.
115
Fox, P.F., and McSweeneyP.L.H. (1998) Dairy Chemistry and Biochemistry. In:
Chemistry and Biochemistry of Cheese and Fermented Milks. Academic and
Professional Press, London, UK. pp: 379 – 424.
Fox, P.F., and McSweeneyP.L.H., (1998) Dairy Chemistry and Biochemistry. Production
and Utilization. Composition and Variability of Milk. Blackie Academic and
Professional Press, London, UK. pp: 1-20.
Fox, P.F., Guinee, T.P., Cogan, T.M., andMcSweeney, P.L.H., (2000) Cheese Rheology
and Texture. In Fundamentals of Cheese Science. Aspen Publishers, Maryland,
USA. pp: 305 -340.
Franke, A. A., Bruhn, J. C., and Lawerence, C.M., (1988) Distribution of Protein in
California in 1983. J. of Dairy Sci. 71: 2373-2383.
Frost, J., (2013) How to Interpret Regression Analysis Results: P-values and Coefficients.
http://blog.minitab.com/blog/adventures-in-statistics/how-to-interpret-regression-
analysis-results-p-values-and-coefficients. Retrieved on May 2014.
Glantz , M., Lindmark Månsson H.,. Stålhammar, H., Bårström, L.O., Fröjelin, M.,
Knutsson, A., Telu , C., and Paulsson M., (2009) Effects of Animal Selection on
Milk Composition and Processability J. Dairy Sci. 92: 4589–4603. A
Goff, H.D., (2009) Factors Affecting Milk Composition. Retrieved from
www.uoguelph.ca/foodscience/ cheese-making-technology/section-c-milk/raw-
milk-quality/factors-affecting-gross-milk-composition, May 2014.
Guinee, T. P., Kennedy, B. T. O. and Kelly, P. M., (2006) Effect of Milk Protein
Standardization Using Different Methods on the Composition and Yields of
Cheddar Cheese. J. Dairy Sci. 89:468–482.
116
Guinee, T.P. (2002) The Functionality of Cheese as an Ingredient: A review. Aust. J.
Dairy Technol. 57: 79–91.
Guinee, T.P., and Fox, P.F., (2004) Salt in Cheese: Physical, Chemical and Biological
Aspects. In: Cheese: Chemistry, Physics and Microbiology (Volume 1) edited by
Fox P.F., McSweeney P.L.H, Cogan T.M and Guinee T.P. 3rd edition. Elsevier
Academic Press. pp: 207 – 269.
Guinee, T.P., Feeney, E.P., Auty M.A.E., and Fox P.F., (2002) Effect of pH and Calcium
Concentration on Some Texture Properties of Mozzarella Cheese. J. Dairy Sci.
85, 1655-1669.
Gunasekeran, S. and Ak, M.M. (2000) Cheese Rheology and Texture. CRC Public Press,
USA. pp. 308 – 328.
Gunasekeran, S. and Ak, M.M. (2000a) Cheese Rheology and Texture. CRC Public
Press, USA. pp. 388 -405.
Halmos, A.L., (2000) Relationships Between Instrumental Texture Measurements and
Sensory Attributes in Hydrocolloids-Part 2,edited by Nishinari, K., Elseiver Press,
Amsterdam. pp: 431-444.
Heck, J. M. L., van Valenberg, H. J. F., Dijkstra, J., and van Hooijdonk, A. C. M., (2009)
Seasonal variation in the Dutch Bovine Raw Milk Composition. J. Dairy Sci. 92:
4745–4755.
Heinrichs, J., Jones, C., and Bailey, K., (2005). Retrieved from http://extension.psu.edu/
animals/dairy/ nutrition/nutrition-and-feeding/diet-formulation-and-
evaluation/milk-components -understanding-the-causes-and-importance-of-milk-
fat-and-protein-variation-in-your-dairy-herd May, 2014.
117
http://www.ilri.org/InfoServ/Webpub/fulldocs/ilca_manual4/Factors.htm. Data retrieved
from this website May 2014
Huppertz, T. and Kelly, A.L., (2009) Properties and Constituents of Cows Milk. In: Milk
Processing and Quality Management edited by Tamime A.Y., John Wiley &
Sons., UK. pp: 23 -44.
Jana, A.H. and Mandal, P.K., (2011) Manufacturing and Quality of Mozzarella Cheese:
A review. Int. J. Dairy Sci. 6(4):199-226.
Jones G.M., (2011) US Recovery Helps Mozzarella Make-up Lost Ground. Retrieved
from http://www. dairyreporter.com/arkets/US-recovery-helps-Mozzarella-make-
up-lost-ground. May 2014
Joshi, N.S., Muthukumarappan, K., and Dave, R.I., (2004) Effect of Calcium on
Microstructure and Meltability of Part Skim Mozzarella Cheese. J. Dairy Sci. 87,
(7): 1975-1985.
Kelly, A.L., (2007b) What are Milk Salts and How Do They Affect the Properties of
Cheese? In: Cheese Problems Solved edited by McSweeney, P.L.H., CRC press,
Boca Raton, FL. pp: 7-8. Retrieved from http://books.google.com/books?id=
gKijAgAAQBAJ&pg= PA107&lpg= PA107&dq#v=onepage&q&f=false, May
2014
Kelly, A.L., (2007a) What is Typical Composition of Cow’s Milk and What Milk
Constituents Favor Cheesemaking? In: Cheese Problems Solved edited by
McSweeney, P.L.H., CRC press, Boca Raton, FL. pp: 3-4. Retrieved from
http://books.google.com/books?id= gKijAgAAQBAJ&pg= PA107&lpg=
PA107&dq#v=onepage&q&f=false, May 2014
118
Kimura, T., Sagara, Y., Fukushima, M., and Taneya, S., (1992) Effect of pH on
Submicroscopic Structure of String Cheese. Milchwissenschaft. 47:547–552.
Kindstedt, P. S., M. Rowney, and P. Roupas. (1999) Technology, Biochemistry and
Functionality of Pasta Filata/Pizza Cheese. In: Technology of Cheesemaking,
Sheffield Press, Shielflied. pp: 193 – 221.
Kindstedt, P.S., (1999) Mozzarella and Pizza Cheese. In: Cheese: Chemistry Physics and
Microbiology (Volume 2) edited by Fox, P.F., Aspen Publishers, Maryland, USA.
pp: 259-271.
Kindstedt, P.S., Caric, M., Milanovic, S., (2004) Pasta-Filata cheese. In: Cheese:
Chemistry, Physics and Microbiology (Volume2) edited by Fox P.F., McSweeney
P.L.H, Cogan T.M. and Guinee T.P., 3rd edition. Elsevier Academic Press, USA.
pp: 251 – 277.
Kindstedt, P.S., Guo, M.R., (1997) Recent Developments in the Science and Technology
of Pizza Cheese. Review Aust. J. Dairy Technol. 52: 41 -43.
Kuchroo C.N., Fox P.F. (1982). Fractionation of the Water-Soluble-Nitrogen from
Cheddar Cheese: Chemical Methods. Milchwissenschaft, 37: 651–653
Laben, R.C., (1963) Factors Responsible for Variation in Milk Composition. J.Dairy Sci.
46, (11) : 1293–1301.
Lacroix, C., Verret, P., and Paquin, P., (1996) Regional and Seasonal variations of
Nitrogen fractions in commingled Milk. Int. Dairy Journal 6: 947-961.
Larsen, M. K., Nielsen, J. H., Butler, G., Leifert, C., Slots, T., Kristiansen, G. H., and A.
H Gustafsson,A A. H., (2010) Milk Quality as Affected by Feeding Regimens in a
Country with Climatic Variation. J. Dairy Sci. 93: 2863–2873.
119
Looper, M., Factors Affecting Milk Composition of Lactating Cows. Agriculture and
Natural Resources, Divison of Agriculture Research & Extension, University of
Arkansas. Retrieved from http://www.uaex.edu/publications/pdf/fsa-4014.pdf
September 2014.
Lucey, J.A., Johnson, M. E., and Horne, D. S., (2003) Invited Review: Perspectives on
the Basis of the Rheology and Texture Properties of Cheese. J. Dairy Sci. 86:
2725–2743.
McMahon, D.J., Oberg, C.J. (2011) Pasta-Filata Cheeses: Low-Moisture Part-Skim
Mozzarella (Pizza Cheese)Encyclopedia of Dairy Sciences, pp 737-744.
Metzger, L.E., Barbano, D.M., Rudan, M. A. and Kindstedt, P.S., (2000a). Effect of Milk
Pre-acidification on Low Fat Mozzarella Cheese: I. Composition and Yield. J.
Dairy Sci. 83:648-658.
Metzger, L.E., Barbano, D.M., Rudan, M. A. and Kindstedt, P.S., (2000b). Effect of Milk
Pre-acidification on Low Fat Mozzarella Cheese: III. Composition and Yield. J.
Dairy Sci. 84:1357-1366.
Neil (2010) N.E.M Business Solutions. Retrieved from http://www.cip.ukcentre
.com/cheese.htm. May, 2014.
Nelson James Cholride Analyser M 925 Manual. Taken from the California Polyetechnic
State University- Dairy Center Lab.
Nickerson, S.C., (1999) Milk production: Factors Affecting Milk Composition. In: Milk
Quality by Frank Harding. Aspen publishers, USA, pp 16 – 20.
Nickerson, T.A. (1960). Chemical Composition of Milk. J. Dairy Sci. 43:598-606
120
O’Mahony, F., (1998) Rural Dairy Technology, Experience in Ethiopia. Retrieved from
http://www.ilri.org/InfoServ/Webpub/fulldocs/ilca_manual4/Factors.htm#TopOfP
age May, 2014.
Ozrenk, E., and Selcuk, S., (2008) The Effect of Seasonal Variation on the Composition
of Cow Milk in Van Province. Pakistan J. Nutrition 7 (1): 161-164.
Pavel, E. R., Gavan, C., (2011) Seasonal changes in Bulk Tank Milk Composition of
Dairy Cows. Animal Science and Biotechnologies, 44 (2): 444-449.
Peck, R., and Devore, J., (2008) Simple Linear regression and Correlation: Inferential
Methods In: Statistics-The Exploration and Analysis of Data. Duxbury, an imprint
of Thomson Brooks/Cole.USA. pp 571-580.
Peck, R., and Devore, J., (2008) Summarizing Bivaraite Data - Correlation. In: Statistics-
The Exploration and Analysis of Data. Duxbury, an imprint of Thomson
Brooks/Cole.USA. pp 190-201.
R.J. FitzGerald, R.J., Walsh, D., Guinee, T.P., Murphy, J.J., Mehra, R., Harrington D.,
Connoly, J.F., (2004) Genetic Variants of Milk Proteins and Their Association
with Milk Production and Processing Properties. The Dairy Products Research
Centre, Morrepark, Cork. pp 1 -11.
Rankin, S.A., Chen, C.M., and Sommer, D., (2006) Mozzarella and Scamorza Chesse.
Handbook of Food Science, Technology and Engineering, Volume 4 edited by
Hui, Y.H., CRC Press, Taylor and Francis Group, Boca Raton, FL. pp: 150-1 to
150-11.
121
Ratner, B., The Coefficient Correlation: Determination Retrieved from
http://www.dmstat1.com/res/TheCorrelationCoefficientDefined.html September
2014.
Schroeder, J.W., (2012) Dairy Cow Nutrition Affects Milk Composition. NDSU
Extension Service.
Taneya, S., Izutsu, T., Kimura, T., and Shioya, T., (1991). Structure and Rheology of
String Cheese. Food Structure. 11: 61-71.
Tremblay, L., Laporte, F.M., Leonil, J., Dupont, D. and Paquin P. (2003) Quantification
of Protein in Milk Products. Fox, P.F. and McSweeney P.L.H. (eds) Advanced
dairy chemistry –I. proteins, 3rd Edition, Kluwer Academic Publishers, New
York. pp: 49 -119.
TTC Texture technologies website (2009) http://128.121.92.221/texture_profile
_analysis.html. Accessed May, 2014.
Verdi, R.J., Barbano, D.M., Dellavalle, M.E., and Senyk, G.F., (1987) Variability in True
Protein, Casein, Non-protein Nitrogen, and Proteolysis in High and Low Somatic
Cell Milks. J. Dairy Sci. 70: 230 – 242.
Walstra, P., Geurts, T.J., Noomen, A., Jellema, A., Van Boekel, M.A.J.S., (1999)
Composition, Structure and Properties. In: Dairy Technology: Principles of Milk
Properties. CRC Press, Boca Raton, FL. pp: 3 – 27.
Walstra, P., Wouters, J.T.M, and Geurts, T.J., (2006a) Milk: Main Characteristics. In:
Dairy Science and Technology 2nd edition CRC Press, Boca Raton, FL. pp 1 –
13.
122
Walstra, P., Wouters, J.T.M, and Geurts, T.J., (2006b) Principles of Cheese making. In:
Dairy Science and Technology 2nd edition CRC Press, Boca Raton, FL.pp 571 -
582.
Walstra, P., Wouters, J.T.M, and Geurts, T.J., (2006c) Proteins. In: Dairy Science and
Technology 2nd edition CRC Press, Boca Raton, FL. pp 63 – 83.
Weather data for 2008 and 2009 is taken from www. weathersource.com.. Data retrieved
from August 21st 2014 to obtain weather report .
Wedholm, A., (2008) Variation in Milk Protein Composition and its Importance for the
Quality of Cheese Milk – Doctoral Thesis in Swedish University of Agricultural
Sciences, Uppsala. Retrieved from http://pub.epsilon.slu.se/1701/1/
AWKappa.pdf, May 2014
Wehr, H.M. and Frank, J.F. (2004) Standard Methods for the Examination of Dairy
Products, 17th ed. American Public Health Association. Washington, D.C. pp:
414 -418.
Wendorff, B., and Paulus. K., (2011) Impact of Breed on the Cheese Making Potential of
Milk; Volume vs Content. Dairy Pipeline. 23(1): 1-8
Yun J.J., Barbano D.M., Kindstedt P.S., (1993a). Mozzarella cheese: Impact of milling
pH on chemical composition and proteolysis, J. Dairy Sci. 76: 3629–3638.
Yun J.J., Kiely L.J., Barbano D.M., Kindstedt P.S., (1993b). Mozzarella cheese: Impact
of cooking temperature on chemical composition, proteolysis and functional
properties, J. Dairy Sci. 76: 3664–3673.
123
Yun J.J., Kiely L.J., Barbano D.M., Kindstedt P.S., (1993c). Mozzarella cheese: Impact
of coagulant type on chemical composition, proteolysis, J. Dairy Sci. 76: 3648–
3654.
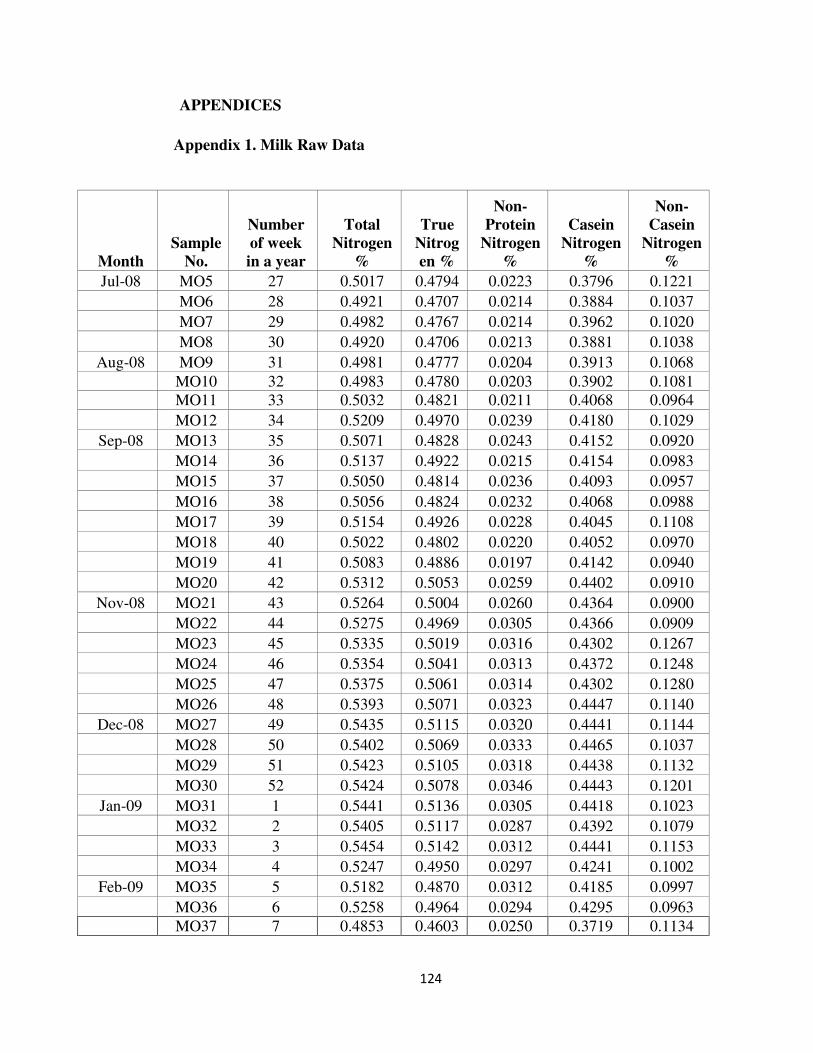
124
APPENDICES
Appendix 1. Milk Raw Data
Month
Sample
No.
Number
of week
in a year
Total
Nitrogen
%
True
Nitrog
en %
Non-
Protein
Nitrogen
%
Casein
Nitrogen
%
Non-
Casein
Nitrogen
%
Jul-08 MO5 27 0.5017 0.4794 0.0223 0.3796 0.1221
MO6 28 0.4921 0.4707 0.0214 0.3884 0.1037
MO7 29 0.4982 0.4767 0.0214 0.3962 0.1020
MO8 30 0.4920 0.4706 0.0213 0.3881 0.1038
Aug-08 MO9 31 0.4981 0.4777 0.0204 0.3913 0.1068
MO10 32 0.4983 0.4780 0.0203 0.3902 0.1081 MO11 33 0.5032 0.4821 0.0211 0.4068 0.0964
MO12 34 0.5209 0.4970 0.0239 0.4180 0.1029
Sep-08 MO13 35 0.5071 0.4828 0.0243 0.4152 0.0920
MO14 36 0.5137 0.4922 0.0215 0.4154 0.0983
MO15 37 0.5050 0.4814 0.0236 0.4093 0.0957
MO16 38 0.5056 0.4824 0.0232 0.4068 0.0988
MO17 39 0.5154 0.4926 0.0228 0.4045 0.1108
MO18 40 0.5022 0.4802 0.0220 0.4052 0.0970
MO19 41 0.5083 0.4886 0.0197 0.4142 0.0940
MO20 42 0.5312 0.5053 0.0259 0.4402 0.0910
Nov-08 MO21 43 0.5264 0.5004 0.0260 0.4364 0.0900
MO22 44 0.5275 0.4969 0.0305 0.4366 0.0909
MO23 45 0.5335 0.5019 0.0316 0.4302 0.1267
MO24 46 0.5354 0.5041 0.0313 0.4372 0.1248
MO25 47 0.5375 0.5061 0.0314 0.4302 0.1280
MO26 48 0.5393 0.5071 0.0323 0.4447 0.1140
Dec-08 MO27 49 0.5435 0.5115 0.0320 0.4441 0.1144
MO28 50 0.5402 0.5069 0.0333 0.4465 0.1037
MO29 51 0.5423 0.5105 0.0318 0.4438 0.1132
MO30 52 0.5424 0.5078 0.0346 0.4443 0.1201
Jan-09 MO31 1 0.5441 0.5136 0.0305 0.4418 0.1023
MO32 2 0.5405 0.5117 0.0287 0.4392 0.1079
MO33 3 0.5454 0.5142 0.0312 0.4441 0.1153
MO34 4 0.5247 0.4950 0.0297 0.4241 0.1002
Feb-09 MO35 5 0.5182 0.4870 0.0312 0.4185 0.0997
MO36 6 0.5258 0.4964 0.0294 0.4295 0.0963
MO37 7 0.4853 0.4603 0.0250 0.3719 0.1134
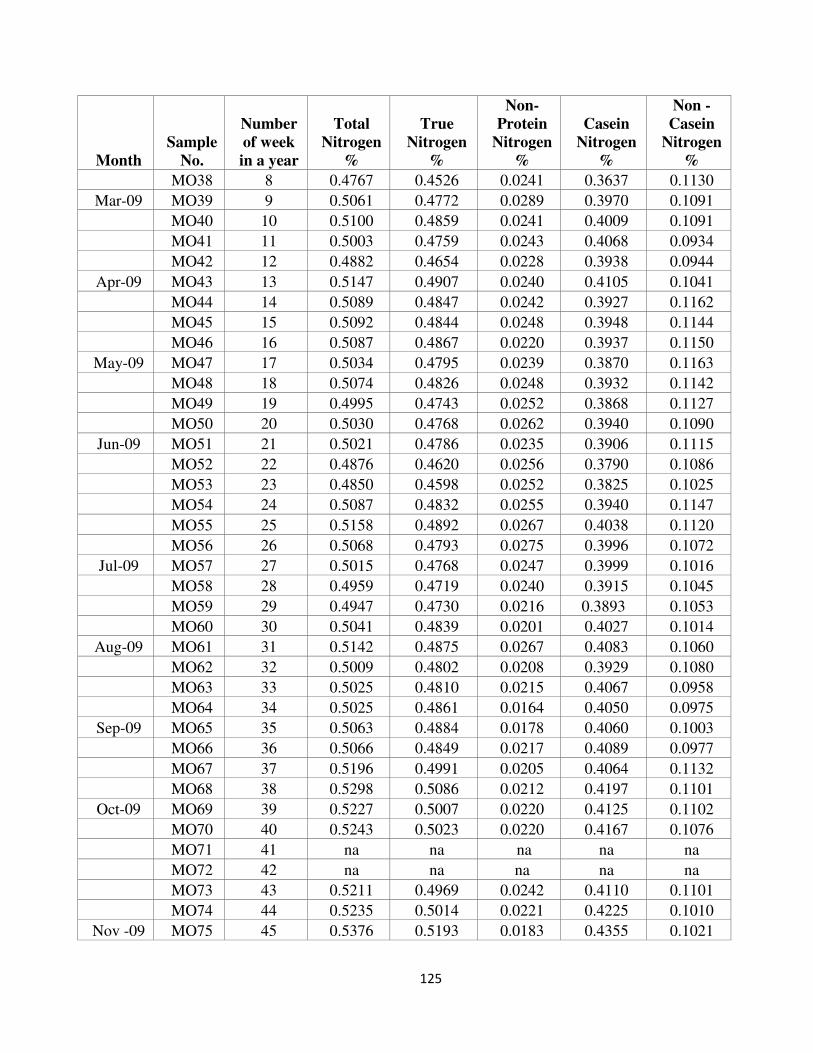
125
Month
Sample
No.
Number
of week
in a year
Total
Nitrogen
%
True
Nitrogen
%
Non-
Protein
Nitrogen
%
Casein
Nitrogen
%
Non -
Casein
Nitrogen
%
MO38 8 0.4767 0.4526 0.0241 0.3637 0.1130
Mar-09 MO39 9 0.5061 0.4772 0.0289 0.3970 0.1091
MO40 10 0.5100 0.4859 0.0241 0.4009 0.1091
MO41 11 0.5003 0.4759 0.0243 0.4068 0.0934
MO42 12 0.4882 0.4654 0.0228 0.3938 0.0944
Apr-09 MO43 13 0.5147 0.4907 0.0240 0.4105 0.1041
MO44 14 0.5089 0.4847 0.0242 0.3927 0.1162
MO45 15 0.5092 0.4844 0.0248 0.3948 0.1144
MO46 16 0.5087 0.4867 0.0220 0.3937 0.1150
May-09 MO47 17 0.5034 0.4795 0.0239 0.3870 0.1163
MO48 18 0.5074 0.4826 0.0248 0.3932 0.1142
MO49 19 0.4995 0.4743 0.0252 0.3868 0.1127
MO50 20 0.5030 0.4768 0.0262 0.3940 0.1090
Jun-09 MO51 21 0.5021 0.4786 0.0235 0.3906 0.1115
MO52 22 0.4876 0.4620 0.0256 0.3790 0.1086
MO53 23 0.4850 0.4598 0.0252 0.3825 0.1025
MO54 24 0.5087 0.4832 0.0255 0.3940 0.1147
MO55 25 0.5158 0.4892 0.0267 0.4038 0.1120
MO56 26 0.5068 0.4793 0.0275 0.3996 0.1072
Jul-09 MO57 27 0.5015 0.4768 0.0247 0.3999 0.1016
MO58 28 0.4959 0.4719 0.0240 0.3915 0.1045
MO59 29 0.4947 0.4730 0.0216 0.3893 0.1053
MO60 30 0.5041 0.4839 0.0201 0.4027 0.1014
Aug-09 MO61 31 0.5142 0.4875 0.0267 0.4083 0.1060
MO62 32 0.5009 0.4802 0.0208 0.3929 0.1080
MO63 33 0.5025 0.4810 0.0215 0.4067 0.0958
MO64 34 0.5025 0.4861 0.0164 0.4050 0.0975
Sep-09 MO65 35 0.5063 0.4884 0.0178 0.4060 0.1003
MO66 36 0.5066 0.4849 0.0217 0.4089 0.0977
MO67 37 0.5196 0.4991 0.0205 0.4064 0.1132
MO68 38 0.5298 0.5086 0.0212 0.4197 0.1101
Oct-09 MO69 39 0.5227 0.5007 0.0220 0.4125 0.1102
MO70 40 0.5243 0.5023 0.0220 0.4167 0.1076
MO71 41 na na na na na
MO72 42 na na na na na
MO73 43 0.5211 0.4969 0.0242 0.4110 0.1101
MO74 44 0.5235 0.5014 0.0221 0.4225 0.1010
Nov -09 MO75 45 0.5376 0.5193 0.0183 0.4355 0.1021
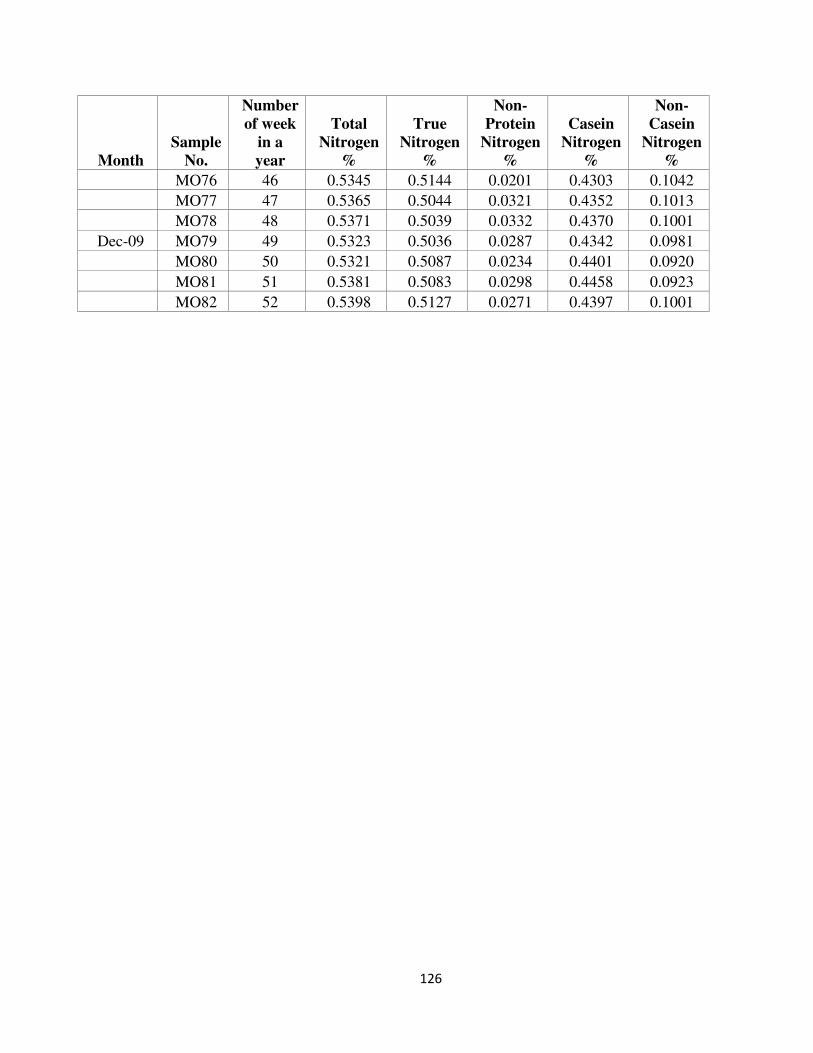
126
Month
Sample
No.
Number
of week
in a
year
Total
Nitrogen
%
True
Nitrogen
%
Non-
Protein
Nitrogen
%
Casein
Nitrogen
%
Non-
Casein
Nitrogen
%
MO76 46 0.5345 0.5144 0.0201 0.4303 0.1042
MO77 47 0.5365 0.5044 0.0321 0.4352 0.1013
MO78 48 0.5371 0.5039 0.0332 0.4370 0.1001
Dec-09 MO79 49 0.5323 0.5036 0.0287 0.4342 0.0981
MO80 50 0.5321 0.5087 0.0234 0.4401 0.0920
MO81 51 0.5381 0.5083 0.0298 0.4458 0.0923
MO82 52 0.5398 0.5127 0.0271 0.4397 0.1001
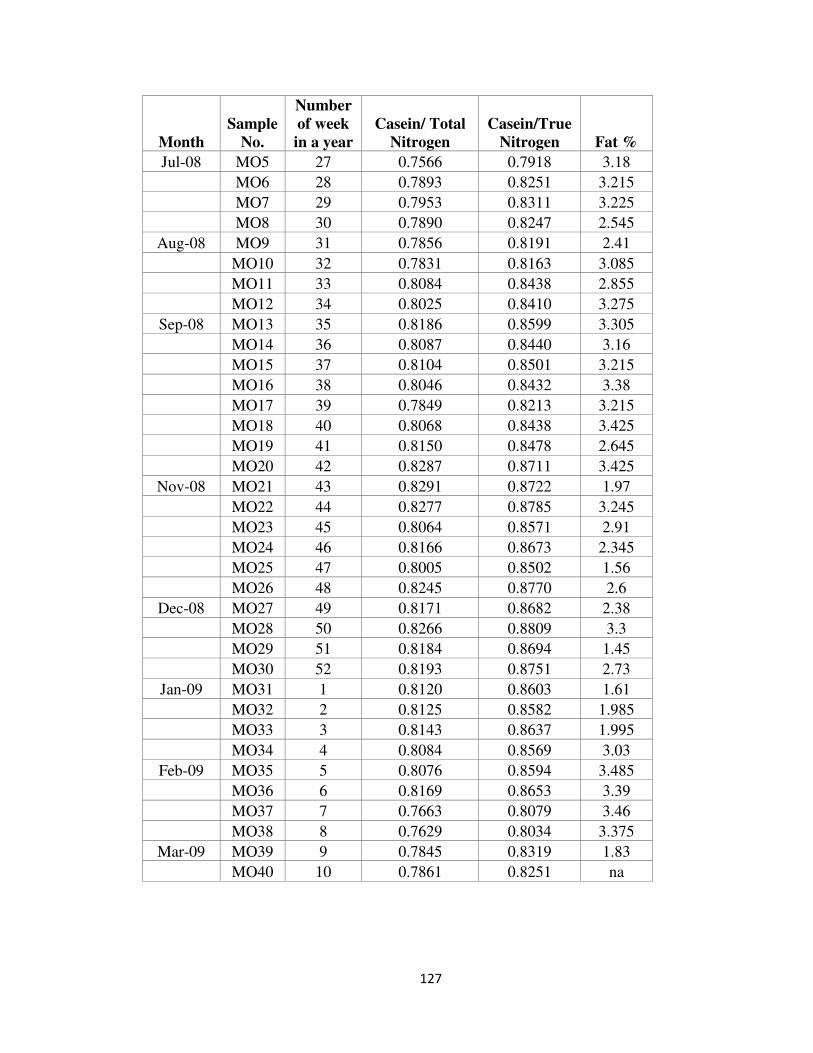
127
Month
Sample
No.
Number
of week
in a year
Casein/ Total
Nitrogen
Casein/True
Nitrogen Fat %
Jul-08 MO5 27 0.7566 0.7918 3.18
MO6 28 0.7893 0.8251 3.215
MO7 29 0.7953 0.8311 3.225
MO8 30 0.7890 0.8247 2.545
Aug-08 MO9 31 0.7856 0.8191 2.41
MO10 32 0.7831 0.8163 3.085
MO11 33 0.8084 0.8438 2.855
MO12 34 0.8025 0.8410 3.275
Sep-08 MO13 35 0.8186 0.8599 3.305
MO14 36 0.8087 0.8440 3.16
MO15 37 0.8104 0.8501 3.215
MO16 38 0.8046 0.8432 3.38
MO17 39 0.7849 0.8213 3.215
MO18 40 0.8068 0.8438 3.425
MO19 41 0.8150 0.8478 2.645
MO20 42 0.8287 0.8711 3.425
Nov-08 MO21 43 0.8291 0.8722 1.97
MO22 44 0.8277 0.8785 3.245
MO23 45 0.8064 0.8571 2.91
MO24 46 0.8166 0.8673 2.345
MO25 47 0.8005 0.8502 1.56
MO26 48 0.8245 0.8770 2.6
Dec-08 MO27 49 0.8171 0.8682 2.38
MO28 50 0.8266 0.8809 3.3
MO29 51 0.8184 0.8694 1.45
MO30 52 0.8193 0.8751 2.73
Jan-09 MO31 1 0.8120 0.8603 1.61
MO32 2 0.8125 0.8582 1.985
MO33 3 0.8143 0.8637 1.995
MO34 4 0.8084 0.8569 3.03
Feb-09 MO35 5 0.8076 0.8594 3.485
MO36 6 0.8169 0.8653 3.39
MO37 7 0.7663 0.8079 3.46
MO38 8 0.7629 0.8034 3.375
Mar-09 MO39 9 0.7845 0.8319 1.83
MO40 10 0.7861 0.8251 na
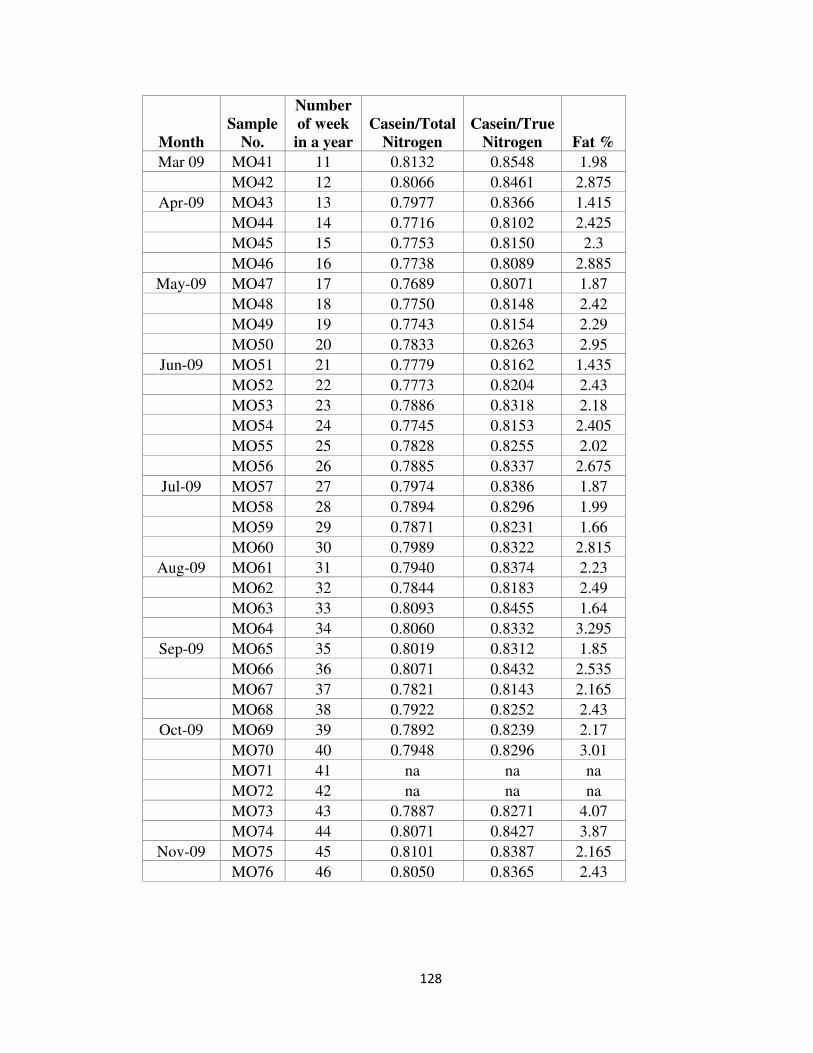
128
Month
Sample
No.
Number
of week
in a year
Casein/Total
Nitrogen
Casein/True
Nitrogen Fat %
Mar 09 MO41 11 0.8132 0.8548 1.98
MO42 12 0.8066 0.8461 2.875
Apr-09 MO43 13 0.7977 0.8366 1.415
MO44 14 0.7716 0.8102 2.425
MO45 15 0.7753 0.8150 2.3
MO46 16 0.7738 0.8089 2.885
May-09 MO47 17 0.7689 0.8071 1.87
MO48 18 0.7750 0.8148 2.42
MO49 19 0.7743 0.8154 2.29
MO50 20 0.7833 0.8263 2.95
Jun-09 MO51 21 0.7779 0.8162 1.435
MO52 22 0.7773 0.8204 2.43
MO53 23 0.7886 0.8318 2.18
MO54 24 0.7745 0.8153 2.405
MO55 25 0.7828 0.8255 2.02
MO56 26 0.7885 0.8337 2.675
Jul-09 MO57 27 0.7974 0.8386 1.87
MO58 28 0.7894 0.8296 1.99
MO59 29 0.7871 0.8231 1.66
MO60 30 0.7989 0.8322 2.815
Aug-09 MO61 31 0.7940 0.8374 2.23
MO62 32 0.7844 0.8183 2.49
MO63 33 0.8093 0.8455 1.64
MO64 34 0.8060 0.8332 3.295
Sep-09 MO65 35 0.8019 0.8312 1.85
MO66 36 0.8071 0.8432 2.535
MO67 37 0.7821 0.8143 2.165
MO68 38 0.7922 0.8252 2.43
Oct-09 MO69 39 0.7892 0.8239 2.17
MO70 40 0.7948 0.8296 3.01
MO71 41 na na na
MO72 42 na na na
MO73 43 0.7887 0.8271 4.07
MO74 44 0.8071 0.8427 3.87
Nov-09 MO75 45 0.8101 0.8387 2.165
MO76 46 0.8050 0.8365 2.43
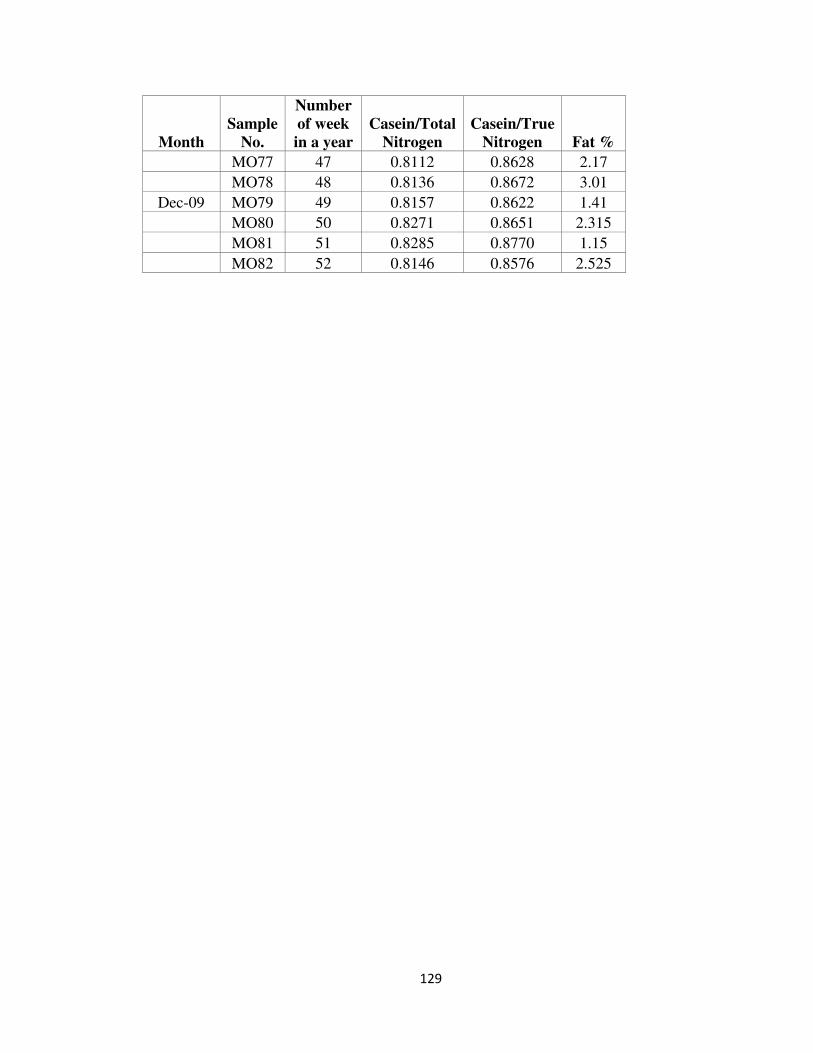
129
Month
Sample
No.
Number
of week
in a year
Casein/Total
Nitrogen
Casein/True
Nitrogen Fat %
MO77 47 0.8112 0.8628 2.17
MO78 48 0.8136 0.8672 3.01
Dec-09 MO79 49 0.8157 0.8622 1.41
MO80 50 0.8271 0.8651 2.315
MO81 51 0.8285 0.8770 1.15
MO82 52 0.8146 0.8576 2.525
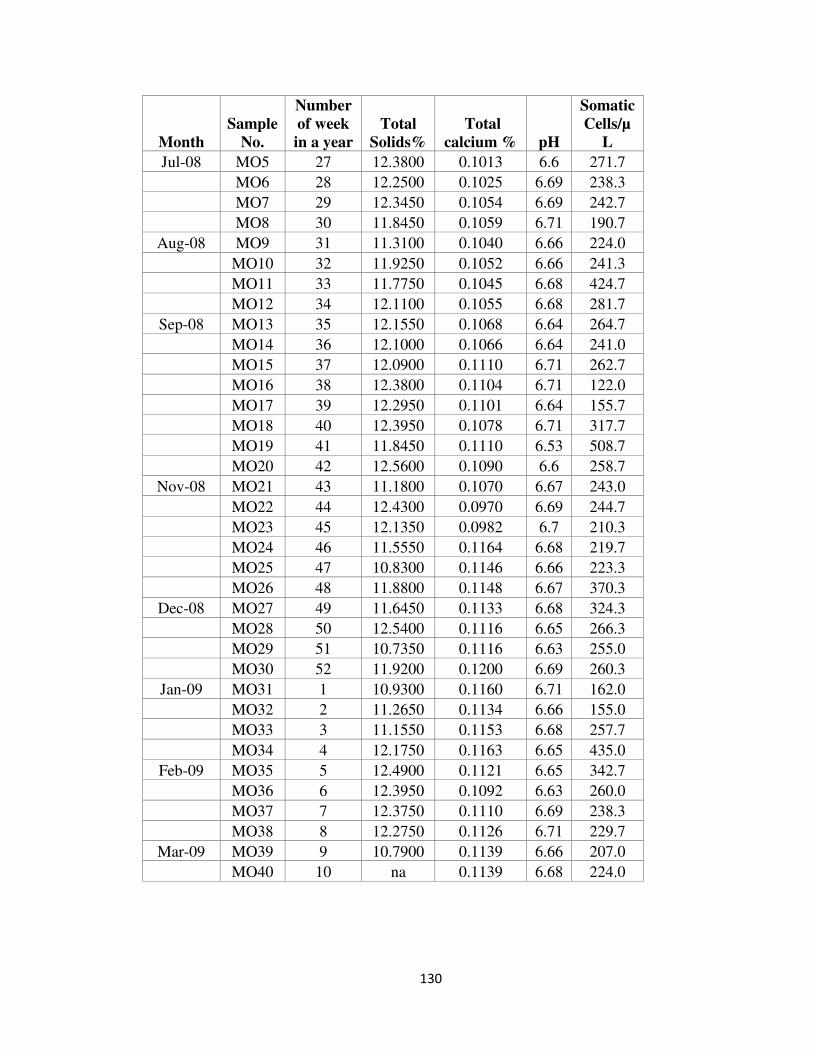
130
Month
Sample
No.
Number
of week
in a year
Total
Solids%
Total
calcium % pH
Somatic
Cells/µ
L
Jul-08 MO5 27 12.3800 0.1013 6.6 271.7
MO6 28 12.2500 0.1025 6.69 238.3
MO7 29 12.3450 0.1054 6.69 242.7
MO8 30 11.8450 0.1059 6.71 190.7
Aug-08 MO9 31 11.3100 0.1040 6.66 224.0
MO10 32 11.9250 0.1052 6.66 241.3
MO11 33 11.7750 0.1045 6.68 424.7
MO12 34 12.1100 0.1055 6.68 281.7
Sep-08 MO13 35 12.1550 0.1068 6.64 264.7
MO14 36 12.1000 0.1066 6.64 241.0
MO15 37 12.0900 0.1110 6.71 262.7
MO16 38 12.3800 0.1104 6.71 122.0
MO17 39 12.2950 0.1101 6.64 155.7
MO18 40 12.3950 0.1078 6.71 317.7
MO19 41 11.8450 0.1110 6.53 508.7
MO20 42 12.5600 0.1090 6.6 258.7
Nov-08 MO21 43 11.1800 0.1070 6.67 243.0
MO22 44 12.4300 0.0970 6.69 244.7
MO23 45 12.1350 0.0982 6.7 210.3
MO24 46 11.5550 0.1164 6.68 219.7
MO25 47 10.8300 0.1146 6.66 223.3
MO26 48 11.8800 0.1148 6.67 370.3
Dec-08 MO27 49 11.6450 0.1133 6.68 324.3
MO28 50 12.5400 0.1116 6.65 266.3
MO29 51 10.7350 0.1116 6.63 255.0
MO30 52 11.9200 0.1200 6.69 260.3
Jan-09 MO31 1 10.9300 0.1160 6.71 162.0
MO32 2 11.2650 0.1134 6.66 155.0
MO33 3 11.1550 0.1153 6.68 257.7
MO34 4 12.1750 0.1163 6.65 435.0
Feb-09 MO35 5 12.4900 0.1121 6.65 342.7
MO36 6 12.3950 0.1092 6.63 260.0
MO37 7 12.3750 0.1110 6.69 238.3
MO38 8 12.2750 0.1126 6.71 229.7
Mar-09 MO39 9 10.7900 0.1139 6.66 207.0
MO40 10 na 0.1139 6.68 224.0
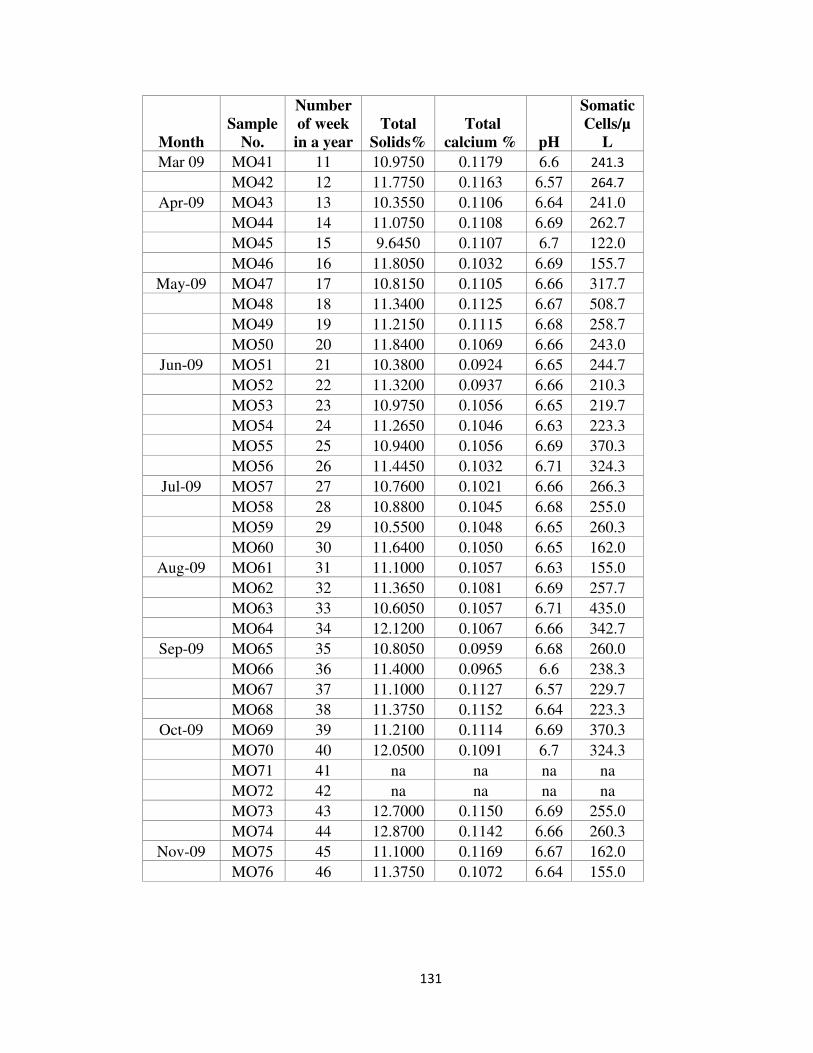
131
Month
Sample
No.
Number
of week
in a year
Total
Solids%
Total
calcium % pH
Somatic
Cells/µ
L
Mar 09 MO41 11 10.9750 0.1179 6.6 241.3
MO42 12 11.7750 0.1163 6.57 264.7
Apr-09 MO43 13 10.3550 0.1106 6.64 241.0
MO44 14 11.0750 0.1108 6.69 262.7
MO45 15 9.6450 0.1107 6.7 122.0
MO46 16 11.8050 0.1032 6.69 155.7
May-09 MO47 17 10.8150 0.1105 6.66 317.7
MO48 18 11.3400 0.1125 6.67 508.7
MO49 19 11.2150 0.1115 6.68 258.7
MO50 20 11.8400 0.1069 6.66 243.0
Jun-09 MO51 21 10.3800 0.0924 6.65 244.7
MO52 22 11.3200 0.0937 6.66 210.3
MO53 23 10.9750 0.1056 6.65 219.7
MO54 24 11.2650 0.1046 6.63 223.3
MO55 25 10.9400 0.1056 6.69 370.3
MO56 26 11.4450 0.1032 6.71 324.3
Jul-09 MO57 27 10.7600 0.1021 6.66 266.3
MO58 28 10.8800 0.1045 6.68 255.0
MO59 29 10.5500 0.1048 6.65 260.3
MO60 30 11.6400 0.1050 6.65 162.0
Aug-09 MO61 31 11.1000 0.1057 6.63 155.0
MO62 32 11.3650 0.1081 6.69 257.7
MO63 33 10.6050 0.1057 6.71 435.0
MO64 34 12.1200 0.1067 6.66 342.7
Sep-09 MO65 35 10.8050 0.0959 6.68 260.0
MO66 36 11.4000 0.0965 6.6 238.3
MO67 37 11.1000 0.1127 6.57 229.7
MO68 38 11.3750 0.1152 6.64 223.3
Oct-09 MO69 39 11.2100 0.1114 6.69 370.3
MO70 40 12.0500 0.1091 6.7 324.3
MO71 41 na na na na
MO72 42 na na na na
MO73 43 12.7000 0.1150 6.69 255.0
MO74 44 12.8700 0.1142 6.66 260.3
Nov-09 MO75 45 11.1000 0.1169 6.67 162.0
MO76 46 11.3750 0.1072 6.64 155.0

132
Month
Sample
No.
Number
of week
in a year
Total
Solids%
Total
calcium % pH
Somatic
Cells/µL
MO77 47 11.2100 0.1056 6.71 257.7
MO78 48 12.0500 0.1112 6.53 435.0
Dec-09 MO79 49 10.5500 0.1132 6.6 342.7
MO80 50 11.4150 0.1168 6.67 260.0
MO81 51 10.2950 0.1124 6.68 238.3
MO82 52 11.6100 0.1123 6.65 229.7
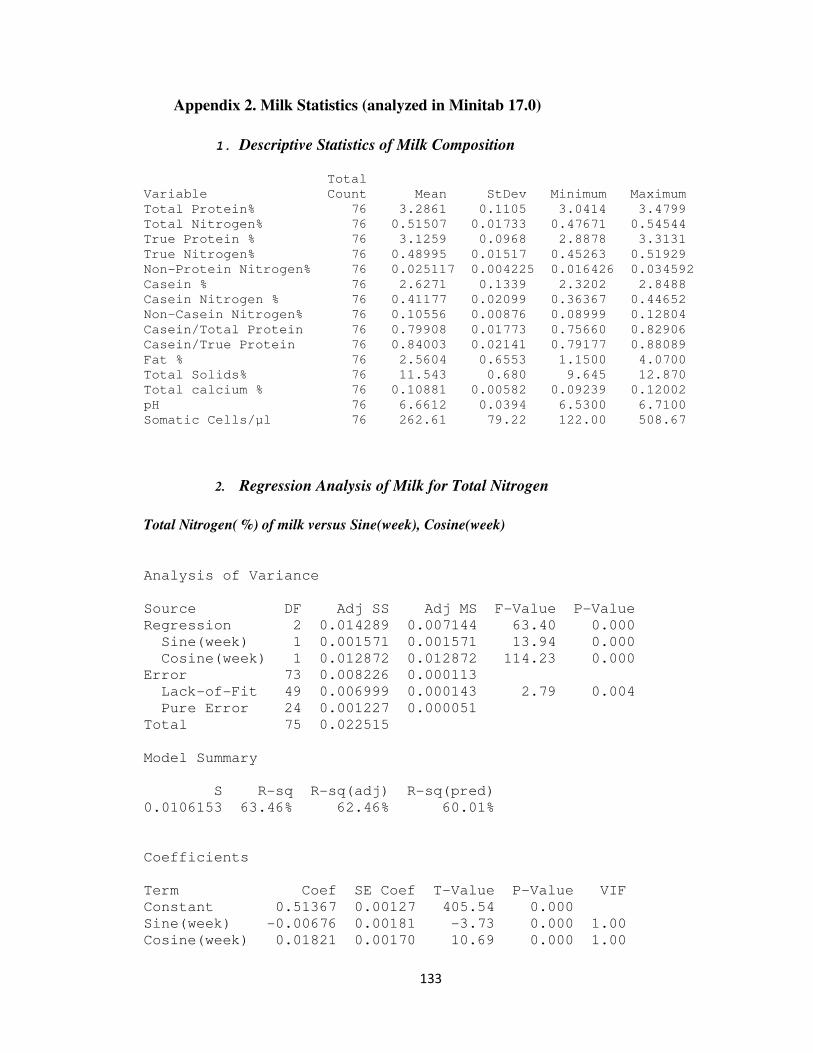
133
Appendix 2. Milk Statistics (analyzed in Minitab 17.0)
1. Descriptive Statistics of Milk Composition
Total
Variable Count Mean StDev Minimum Maximum
Total Protein% 76 3.2861 0.1105 3.0414 3.4799
Total Nitrogen% 76 0.51507 0.01733 0.47671 0.54544
True Protein % 76 3.1259 0.0968 2.8878 3.3131
True Nitrogen% 76 0.48995 0.01517 0.45263 0.51929
Non-Protein Nitrogen% 76 0.025117 0.004225 0.016426 0.034592
Casein % 76 2.6271 0.1339 2.3202 2.8488
Casein Nitrogen % 76 0.41177 0.02099 0.36367 0.44652
Non-Casein Nitrogen% 76 0.10556 0.00876 0.08999 0.12804
Casein/Total Protein 76 0.79908 0.01773 0.75660 0.82906
Casein/True Protein 76 0.84003 0.02141 0.79177 0.88089
Fat % 76 2.5604 0.6553 1.1500 4.0700
Total Solids% 76 11.543 0.680 9.645 12.870
Total calcium % 76 0.10881 0.00582 0.09239 0.12002
pH 76 6.6612 0.0394 6.5300 6.7100
Somatic Cells/µl 76 262.61 79.22 122.00 508.67
2. Regression Analysis of Milk for Total Nitrogen
Total Nitrogen( %) of milk versus Sine(week), Cosine(week)
Analysis of Variance
Source DF Adj SS Adj MS F-Value P-Value
Regression 2 0.014289 0.007144 63.40 0.000
Sine(week) 1 0.001571 0.001571 13.94 0.000
Cosine(week) 1 0.012872 0.012872 114.23 0.000
Error 73 0.008226 0.000113
Lack-of-Fit 49 0.006999 0.000143 2.79 0.004
Pure Error 24 0.001227 0.000051
Total 75 0.022515
Model Summary
S R-sq R-sq(adj) R-sq(pred)
0.0106153 63.46% 62.46% 60.01%
Coefficients
Term Coef SE Coef T-Value P-Value VIF
Constant 0.51367 0.00127 405.54 0.000
Sine(week) -0.00676 0.00181 -3.73 0.000 1.00
Cosine(week) 0.01821 0.00170 10.69 0.000 1.00
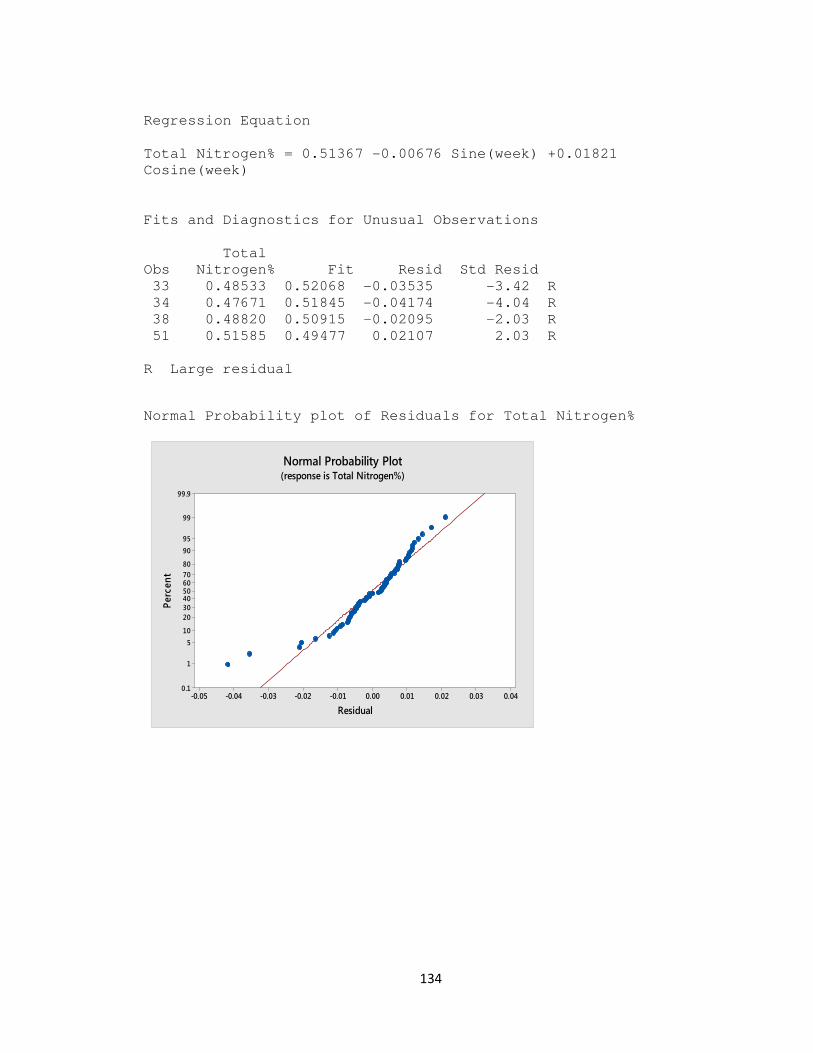
134
Regression Equation
Total Nitrogen% = 0.51367 -0.00676 Sine(week) +0.01821
Cosine(week)
Fits and Diagnostics for Unusual Observations
Total
Obs Nitrogen% Fit Resid Std Resid
33 0.48533 0.52068 -0.03535 -3.42 R
34 0.47671 0.51845 -0.04174 -4.04 R
38 0.48820 0.50915 -0.02095 -2.03 R
51 0.51585 0.49477 0.02107 2.03 R
R Large residual
Normal Probability plot of Residuals for Total Nitrogen%
0.040.030.020.010.00-0.01-0.02-0.03-0.04-0.05
99.9
99
95
90
80
7060504030
20
10
5
1
0.1
Residual
Perc
ent
Normal Probability Plot(response is Total Nitrogen%)
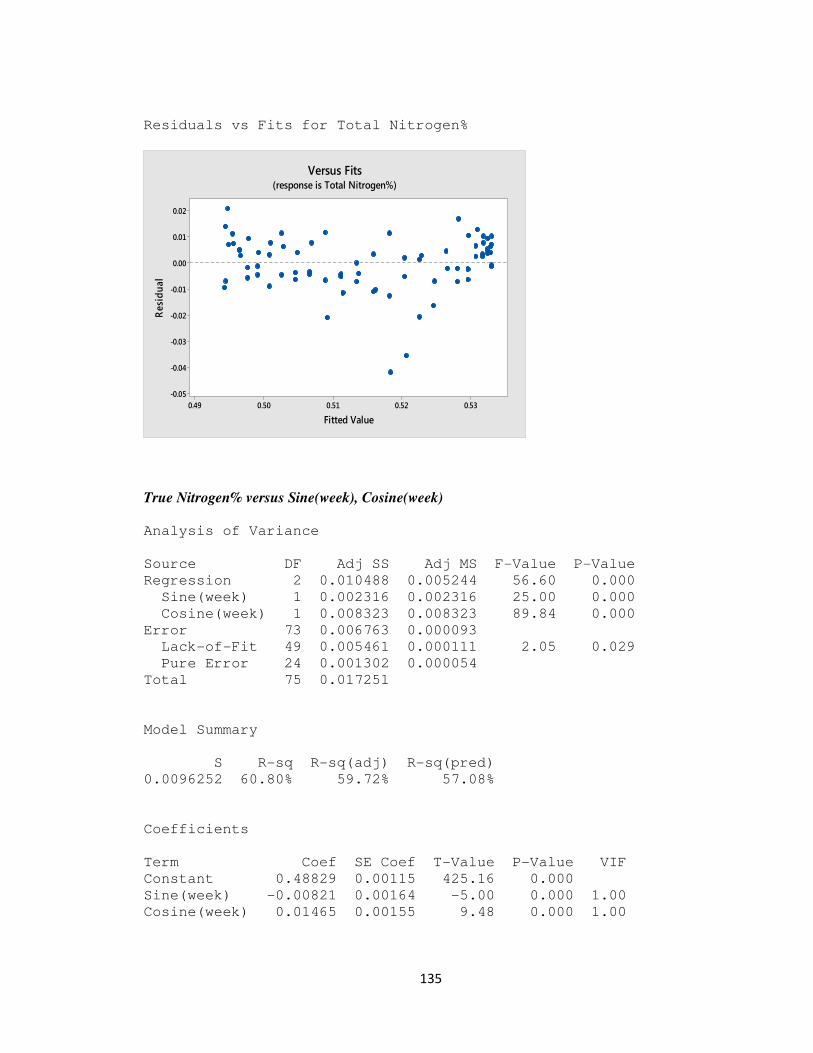
135
Residuals vs Fits for Total Nitrogen%
True Nitrogen% versus Sine(week), Cosine(week)
Analysis of Variance
Source DF Adj SS Adj MS F-Value P-Value
Regression 2 0.010488 0.005244 56.60 0.000
Sine(week) 1 0.002316 0.002316 25.00 0.000
Cosine(week) 1 0.008323 0.008323 89.84 0.000
Error 73 0.006763 0.000093
Lack-of-Fit 49 0.005461 0.000111 2.05 0.029
Pure Error 24 0.001302 0.000054
Total 75 0.017251
Model Summary
S R-sq R-sq(adj) R-sq(pred)
0.0096252 60.80% 59.72% 57.08%
Coefficients
Term Coef SE Coef T-Value P-Value VIF
Constant 0.48829 0.00115 425.16 0.000
Sine(week) -0.00821 0.00164 -5.00 0.000 1.00
Cosine(week) 0.01465 0.00155 9.48 0.000 1.00
0.530.520.510.500.49
0.02
0.01
0.00
-0.01
-0.02
-0.03
-0.04
-0.05
Fitted Value
Resi
dual
Versus Fits(response is Total Nitrogen%)
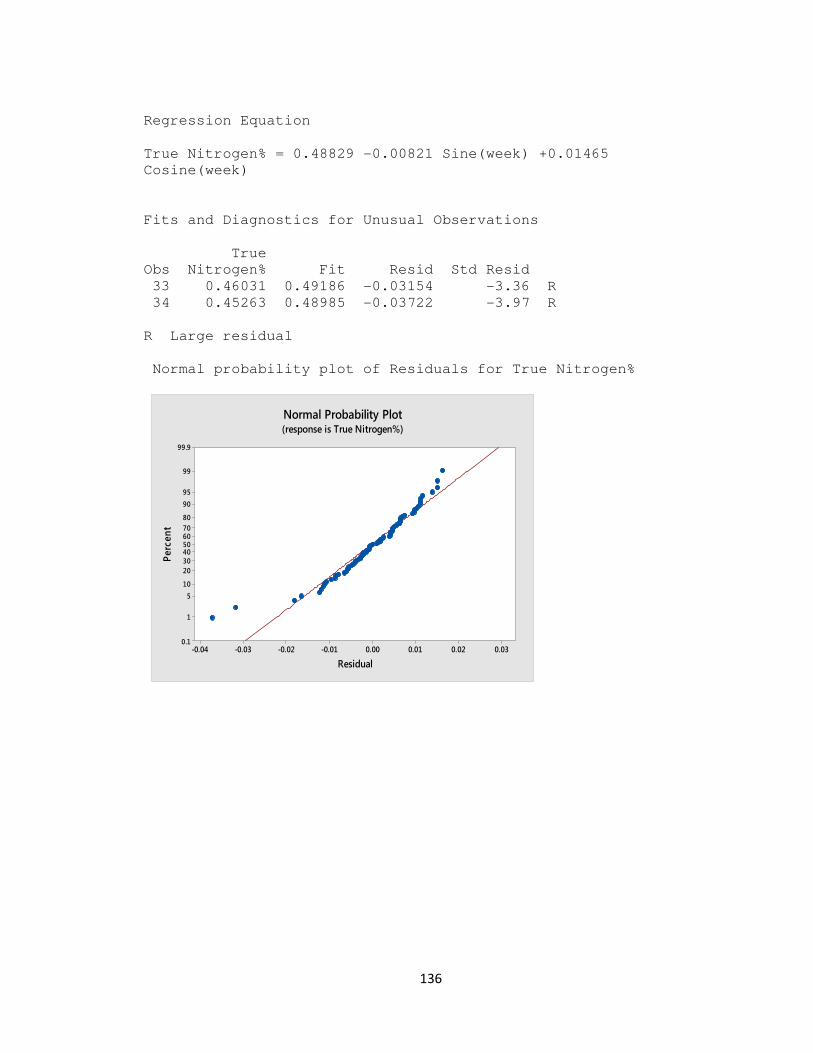
136
Regression Equation
True Nitrogen% = 0.48829 -0.00821 Sine(week) +0.01465
Cosine(week)
Fits and Diagnostics for Unusual Observations
True
Obs Nitrogen% Fit Resid Std Resid
33 0.46031 0.49186 -0.03154 -3.36 R
34 0.45263 0.48985 -0.03722 -3.97 R
R Large residual
Normal probability plot of Residuals for True Nitrogen%
0.030.020.010.00-0.01-0.02-0.03-0.04
99.9
99
95
90
80
7060504030
20
10
5
1
0.1
Residual
Perc
ent
Normal Probability Plot(response is True Nitrogen%)

137
Residuals vs Fits for True Nitrogen%
Casein Nitrogen % versus Sine(week), Cosine(week)
Analysis of Variance
Source DF Adj SS Adj MS F-Value P-Value
Regression 2 0.023255 0.011628 86.71 0.000
Sine(week) 1 0.004134 0.004134 30.83 0.000
Cosine(week) 1 0.019429 0.019429 144.88 0.000
Error 73 0.009789 0.000134
Lack-of-Fit 49 0.008384 0.000171 2.92 0.003
Pure Error 24 0.001406 0.000059
Total 75 0.033045
Model Summary
S R-sq R-sq(adj) R-sq(pred)
0.0115803 70.38% 69.56% 67.60%
Coefficients
Term Coef SE Coef T-Value P-Value VIF
Constant 0.40954 0.00138 296.39 0.000
Sine(week) -0.01097 0.00198 -5.55 0.000 1.00
Cosine(week) 0.02238 0.00186 12.04 0.000 1.00
0.510.500.490.480.47
0.02
0.01
0.00
-0.01
-0.02
-0.03
-0.04
Fitted Value
Residual
Versus Fits(response is True Nitrogen%)
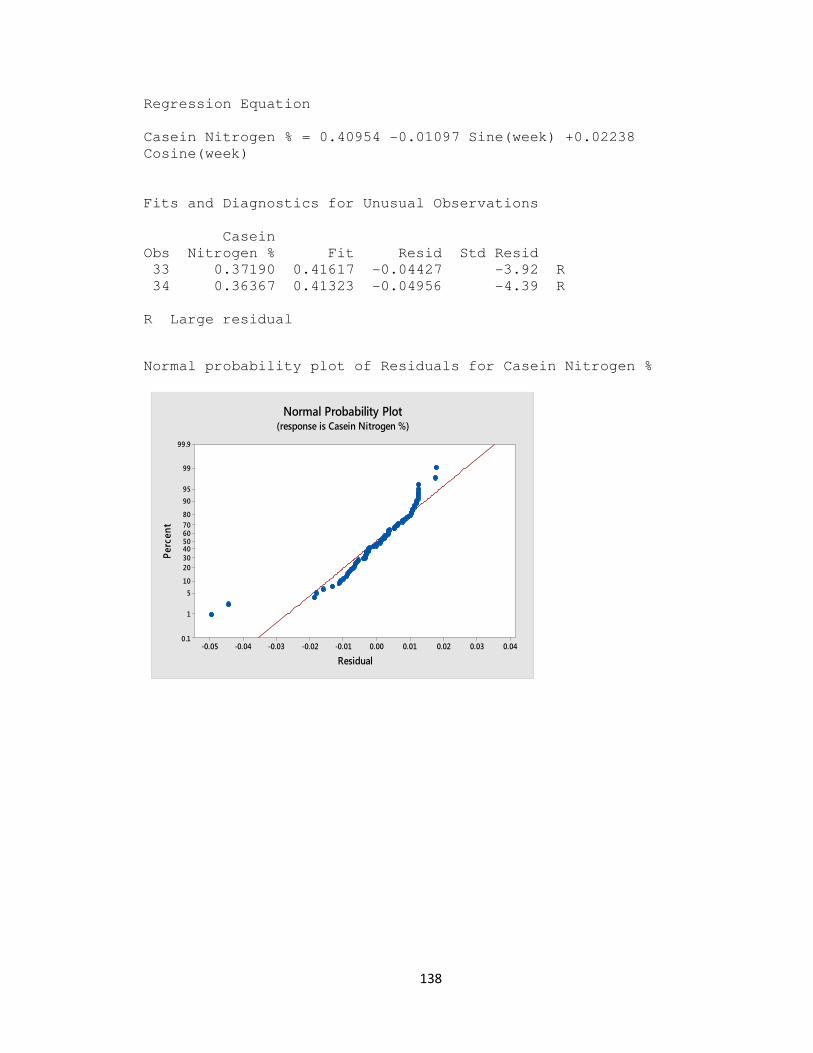
138
Regression Equation
Casein Nitrogen % = 0.40954 -0.01097 Sine(week) +0.02238
Cosine(week)
Fits and Diagnostics for Unusual Observations
Casein
Obs Nitrogen % Fit Resid Std Resid
33 0.37190 0.41617 -0.04427 -3.92 R
34 0.36367 0.41323 -0.04956 -4.39 R
R Large residual
Normal probability plot of Residuals for Casein Nitrogen %
0.040.030.020.010.00-0.01-0.02-0.03-0.04-0.05
99.9
99
95
90
80
7060504030
20
10
5
1
0.1
Residual
Perc
ent
Normal Probability Plot(response is Casein Nitrogen %)
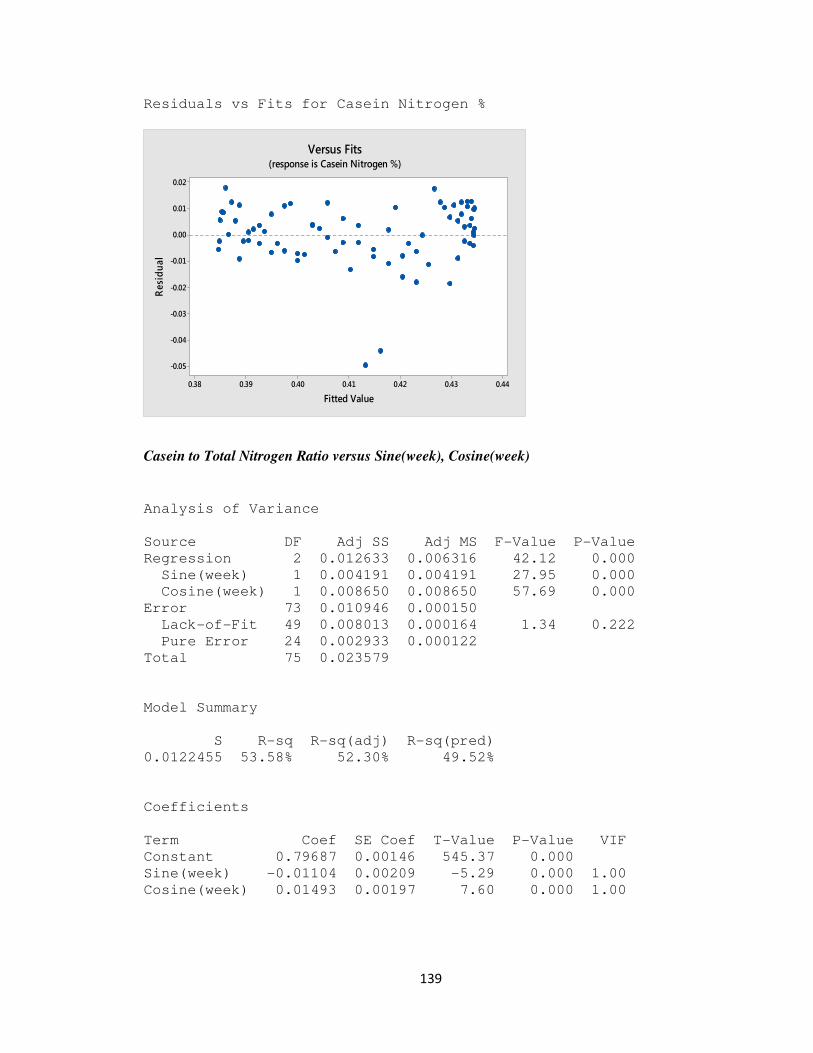
139
Residuals vs Fits for Casein Nitrogen %
Casein to Total Nitrogen Ratio versus Sine(week), Cosine(week)
Analysis of Variance
Source DF Adj SS Adj MS F-Value P-Value
Regression 2 0.012633 0.006316 42.12 0.000
Sine(week) 1 0.004191 0.004191 27.95 0.000
Cosine(week) 1 0.008650 0.008650 57.69 0.000
Error 73 0.010946 0.000150
Lack-of-Fit 49 0.008013 0.000164 1.34 0.222
Pure Error 24 0.002933 0.000122
Total 75 0.023579
Model Summary
S R-sq R-sq(adj) R-sq(pred)
0.0122455 53.58% 52.30% 49.52%
Coefficients
Term Coef SE Coef T-Value P-Value VIF
Constant 0.79687 0.00146 545.37 0.000
Sine(week) -0.01104 0.00209 -5.29 0.000 1.00
Cosine(week) 0.01493 0.00197 7.60 0.000 1.00
0.440.430.420.410.400.390.38
0.02
0.01
0.00
-0.01
-0.02
-0.03
-0.04
-0.05
Fitted Value
Resi
dual
Versus Fits(response is Casein Nitrogen %)
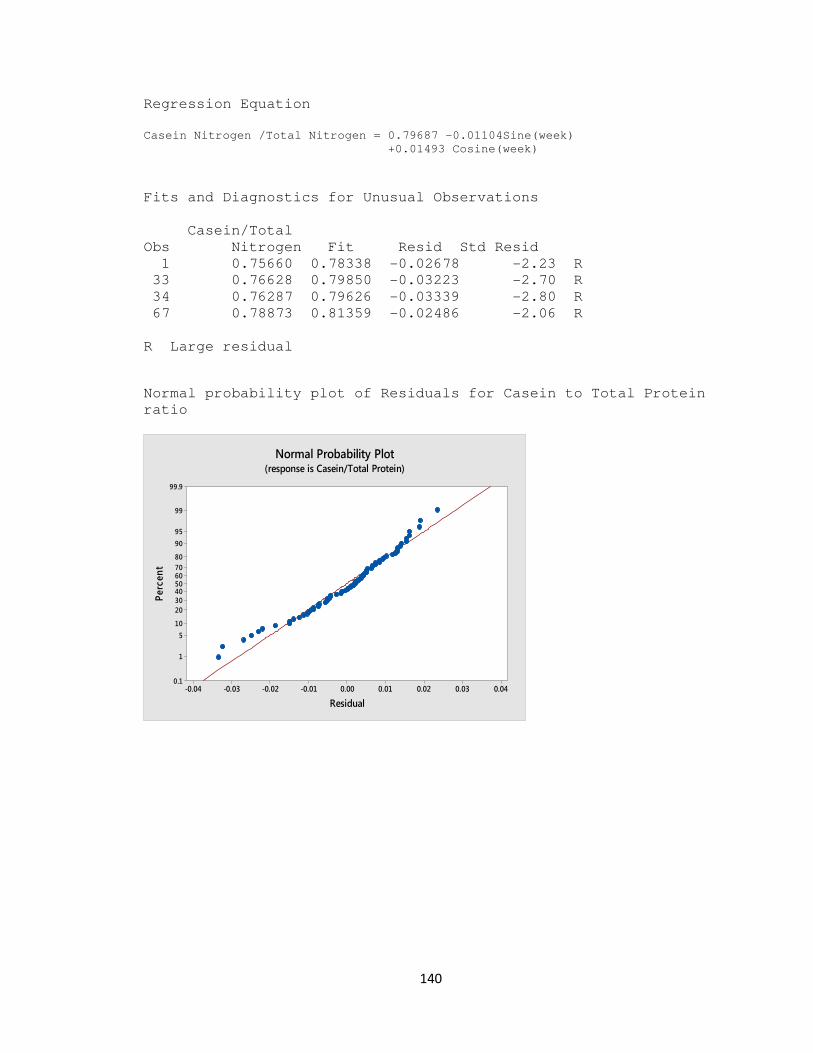
140
Regression Equation
Casein Nitrogen /Total Nitrogen = 0.79687 -0.01104Sine(week)
+0.01493 Cosine(week)
Fits and Diagnostics for Unusual Observations
Casein/Total
Obs Nitrogen Fit Resid Std Resid
1 0.75660 0.78338 -0.02678 -2.23 R
33 0.76628 0.79850 -0.03223 -2.70 R
34 0.76287 0.79626 -0.03339 -2.80 R
67 0.78873 0.81359 -0.02486 -2.06 R
R Large residual
Normal probability plot of Residuals for Casein to Total Protein
ratio
0.040.030.020.010.00-0.01-0.02-0.03-0.04
99.9
99
95
90
80
7060504030
20
10
5
1
0.1
Residual
Perc
ent
Normal Probability Plot(response is Casein/Total Protein)
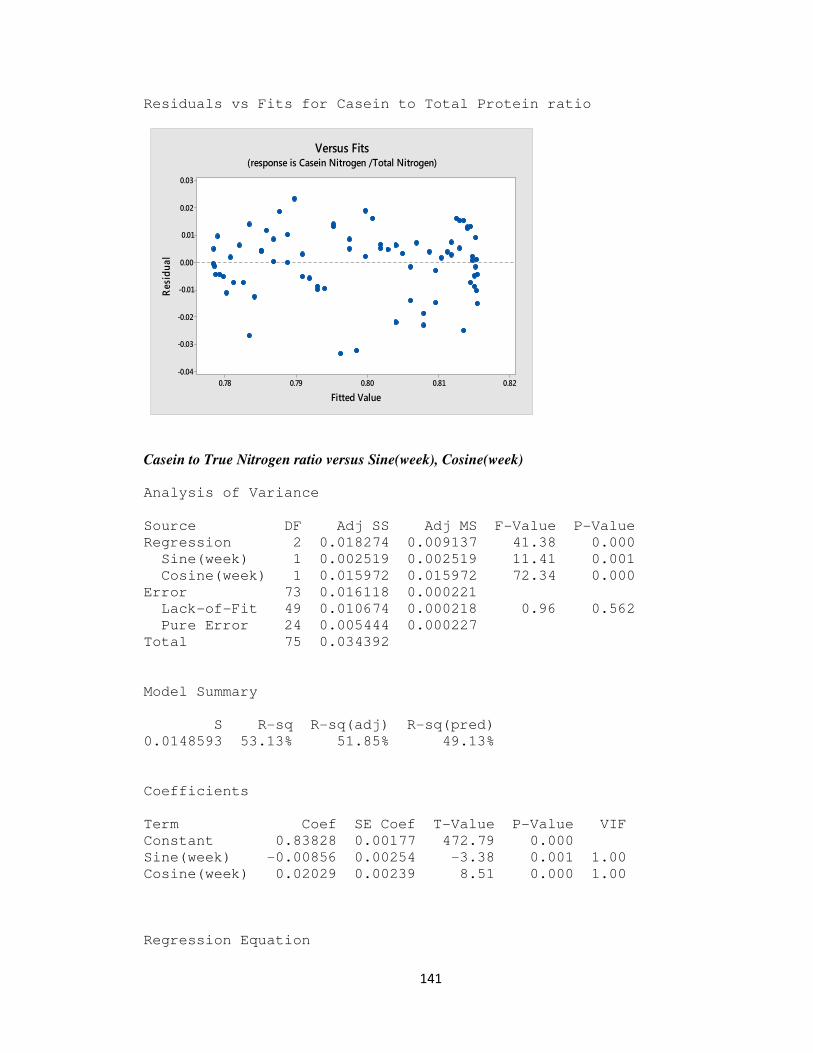
141
Residuals vs Fits for Casein to Total Protein ratio
Casein to True Nitrogen ratio versus Sine(week), Cosine(week)
Analysis of Variance
Source DF Adj SS Adj MS F-Value P-Value
Regression 2 0.018274 0.009137 41.38 0.000
Sine(week) 1 0.002519 0.002519 11.41 0.001
Cosine(week) 1 0.015972 0.015972 72.34 0.000
Error 73 0.016118 0.000221
Lack-of-Fit 49 0.010674 0.000218 0.96 0.562
Pure Error 24 0.005444 0.000227
Total 75 0.034392
Model Summary
S R-sq R-sq(adj) R-sq(pred)
0.0148593 53.13% 51.85% 49.13%
Coefficients
Term Coef SE Coef T-Value P-Value VIF
Constant 0.83828 0.00177 472.79 0.000
Sine(week) -0.00856 0.00254 -3.38 0.001 1.00
Cosine(week) 0.02029 0.00239 8.51 0.000 1.00
Regression Equation
0.820.810.800.790.78
0.03
0.02
0.01
0.00
-0.01
-0.02
-0.03
-0.04
Fitted Value
Res
idual
Versus Fits(response is Casein Nitrogen /Total Nitrogen)

142
Casein/True Nitrogen = 0.83828 - 0.00856 Sine(week)
+ 0.02029 Cosine(week)
Fits and Diagnostics for Unusual Observations
Casein/True
Obs Nitrogen Fit Resid Std Resid
33 0.80792 0.84532 -0.03740 -2.58 R
34 0.80345 0.84276 -0.03931 -2.72 R
R Large residual
Normal Probability plot of Residuals for Casein/True Nitrogen
0.0500.0250.000-0.025-0.050
99.9
99
95
90
80
7060504030
20
10
5
1
0.1
Residual
Per
cen
t
Normal Probability Plot(response is Casein Nitrogen/True Nitrogen)
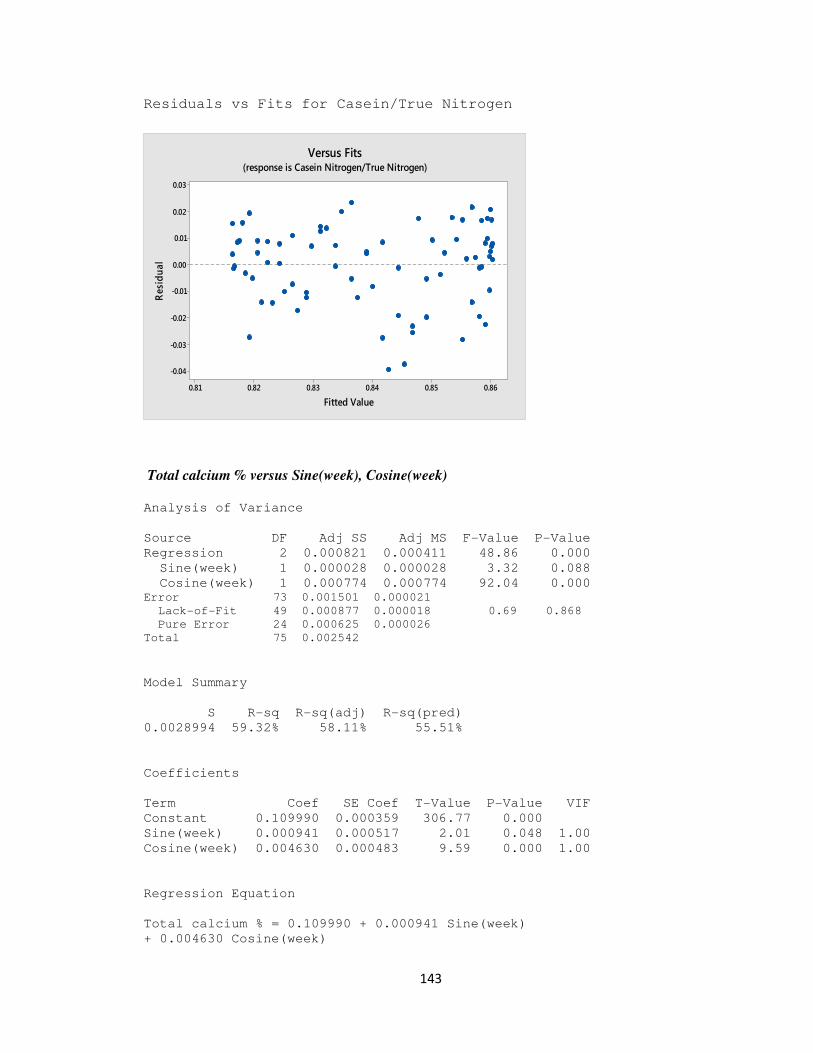
143
Residuals vs Fits for Casein/True Nitrogen
Total calcium % versus Sine(week), Cosine(week)
Analysis of Variance
Source DF Adj SS Adj MS F-Value P-Value
Regression 2 0.000821 0.000411 48.86 0.000
Sine(week) 1 0.000028 0.000028 3.32 0.088
Cosine(week) 1 0.000774 0.000774 92.04 0.000 Error 73 0.001501 0.000021
Lack-of-Fit 49 0.000877 0.000018 0.69 0.868
Pure Error 24 0.000625 0.000026
Total 75 0.002542
Model Summary
S R-sq R-sq(adj) R-sq(pred)
0.0028994 59.32% 58.11% 55.51%
Coefficients
Term Coef SE Coef T-Value P-Value VIF
Constant 0.109990 0.000359 306.77 0.000
Sine(week) 0.000941 0.000517 2.01 0.048 1.00
Cosine(week) 0.004630 0.000483 9.59 0.000 1.00
Regression Equation
Total calcium % = 0.109990 + 0.000941 Sine(week)
+ 0.004630 Cosine(week)
0.860.850.840.830.820.81
0.03
0.02
0.01
0.00
-0.01
-0.02
-0.03
-0.04
Fitted Value
Res
idual
Versus Fits(response is Casein Nitrogen/True Nitrogen)
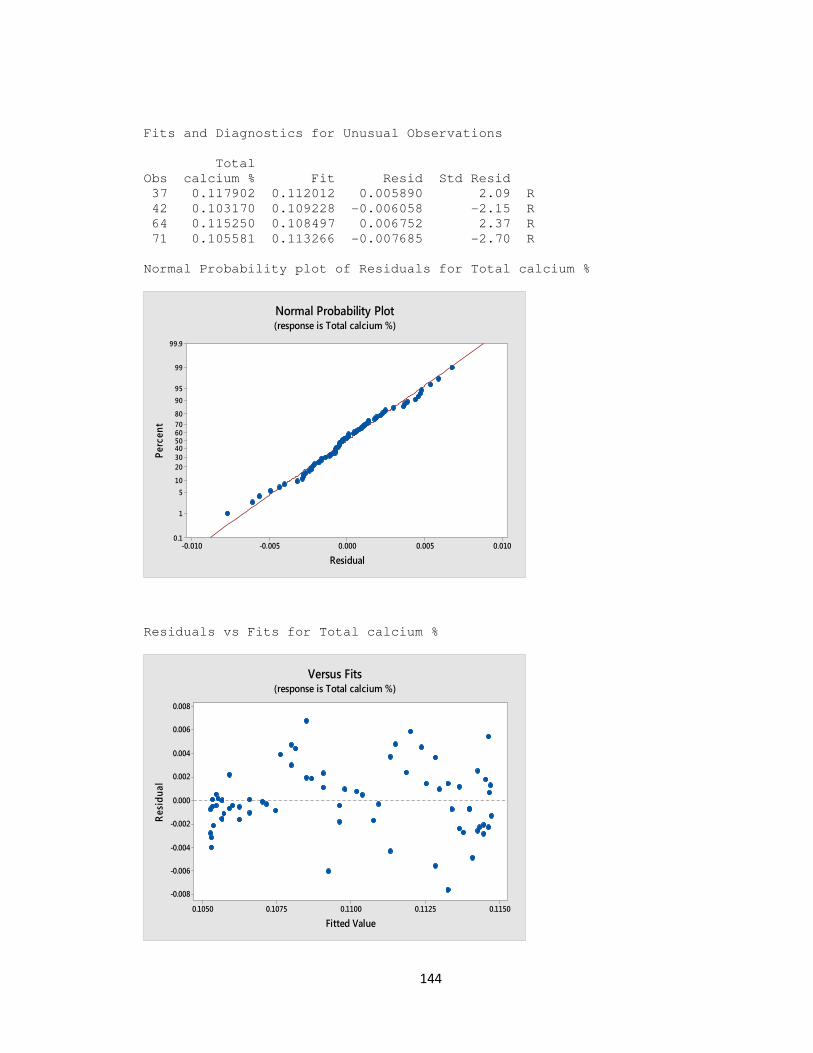
144
Fits and Diagnostics for Unusual Observations
Total
Obs calcium % Fit Resid Std Resid
37 0.117902 0.112012 0.005890 2.09 R
42 0.103170 0.109228 -0.006058 -2.15 R
64 0.115250 0.108497 0.006752 2.37 R
71 0.105581 0.113266 -0.007685 -2.70 R
Normal Probability plot of Residuals for Total calcium %
Residuals vs Fits for Total calcium %
0.0100.0050.000-0.005-0.010
99.9
99
95
90
80
7060504030
20
10
5
1
0.1
Residual
Perc
ent
Normal Probability Plot(response is Total calcium %)
0.11500.11250.11000.10750.1050
0.008
0.006
0.004
0.002
0.000
-0.002
-0.004
-0.006
-0.008
Fitted Value
Residual
Versus Fits(response is Total calcium %)
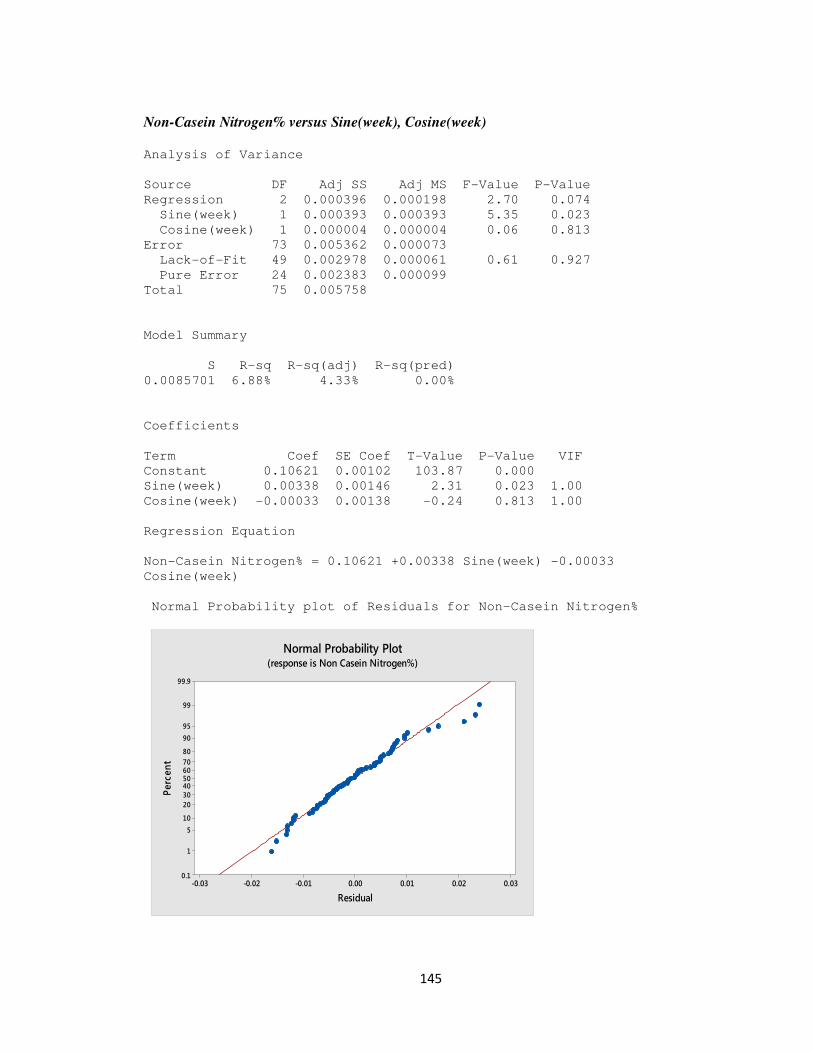
145
Non-Casein Nitrogen% versus Sine(week), Cosine(week)
Analysis of Variance
Source DF Adj SS Adj MS F-Value P-Value
Regression 2 0.000396 0.000198 2.70 0.074
Sine(week) 1 0.000393 0.000393 5.35 0.023
Cosine(week) 1 0.000004 0.000004 0.06 0.813
Error 73 0.005362 0.000073
Lack-of-Fit 49 0.002978 0.000061 0.61 0.927
Pure Error 24 0.002383 0.000099
Total 75 0.005758
Model Summary
S R-sq R-sq(adj) R-sq(pred)
0.0085701 6.88% 4.33% 0.00%
Coefficients
Term Coef SE Coef T-Value P-Value VIF
Constant 0.10621 0.00102 103.87 0.000
Sine(week) 0.00338 0.00146 2.31 0.023 1.00
Cosine(week) -0.00033 0.00138 -0.24 0.813 1.00
Regression Equation
Non-Casein Nitrogen% = 0.10621 +0.00338 Sine(week) -0.00033
Cosine(week)
Normal Probability plot of Residuals for Non-Casein Nitrogen%
0.030.020.010.00-0.01-0.02-0.03
99.9
99
95
90
80
7060504030
20
10
5
1
0.1
Residual
Perc
ent
Normal Probability Plot(response is Non Casein Nitrogen%)
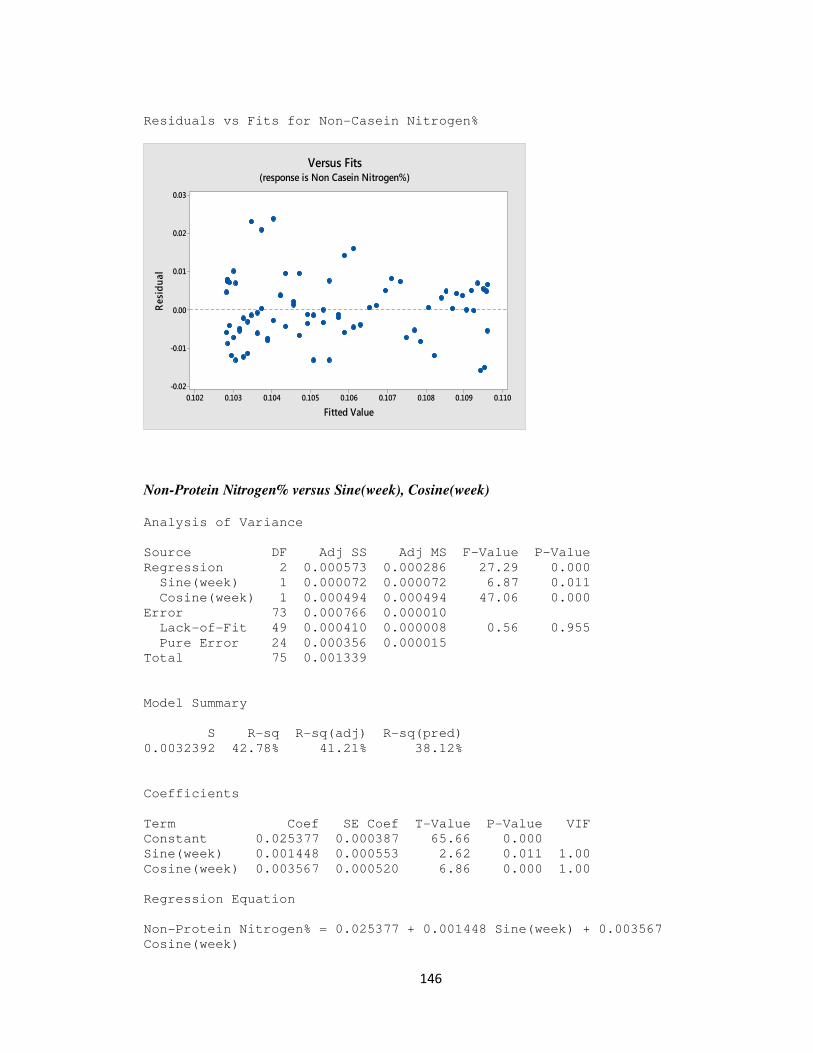
146
Residuals vs Fits for Non-Casein Nitrogen%
Non-Protein Nitrogen% versus Sine(week), Cosine(week)
Analysis of Variance
Source DF Adj SS Adj MS F-Value P-Value
Regression 2 0.000573 0.000286 27.29 0.000
Sine(week) 1 0.000072 0.000072 6.87 0.011
Cosine(week) 1 0.000494 0.000494 47.06 0.000
Error 73 0.000766 0.000010
Lack-of-Fit 49 0.000410 0.000008 0.56 0.955
Pure Error 24 0.000356 0.000015
Total 75 0.001339
Model Summary
S R-sq R-sq(adj) R-sq(pred)
0.0032392 42.78% 41.21% 38.12%
Coefficients
Term Coef SE Coef T-Value P-Value VIF
Constant 0.025377 0.000387 65.66 0.000
Sine(week) 0.001448 0.000553 2.62 0.011 1.00
Cosine(week) 0.003567 0.000520 6.86 0.000 1.00
Regression Equation
Non-Protein Nitrogen% = 0.025377 + 0.001448 Sine(week) + 0.003567
Cosine(week)
0.1100.1090.1080.1070.1060.1050.1040.1030.102
0.03
0.02
0.01
0.00
-0.01
-0.02
Fitted Value
Residual
Versus Fits(response is Non Casein Nitrogen%)

147
Normal Probability plot of Residuals for Non-Protein Nitrogen%
Residuals vs Fits for Non-Protein Nitrogen%
Fat % versus Sine(week), Cosine(week)
Analysis of Variance
Source DF Adj SS Adj MS F-Value P-Value
Regression 2 1.6008 0.80039 1.91 0.156
Sine(week) 1 1.5998 1.59975 3.82 0.055
Cosine(week) 1 0.0006 0.00056 0.00 0.971
Error 72 30.1730 0.41907
0.0100.0050.000-0.005-0.010
99.9
99
95
90
80
7060504030
20
10
5
1
0.1
Residual
Perc
ent
Normal Probability Plot(response is Non Protein Nitrogen%)
0.0300.0290.0280.0270.0260.0250.0240.0230.0220.021
0.0050
0.0025
0.0000
-0.0025
-0.0050
-0.0075
-0.0100
Fitted Value
Resi
dual
Versus Fits(response is Non Protein Nitrogen%)
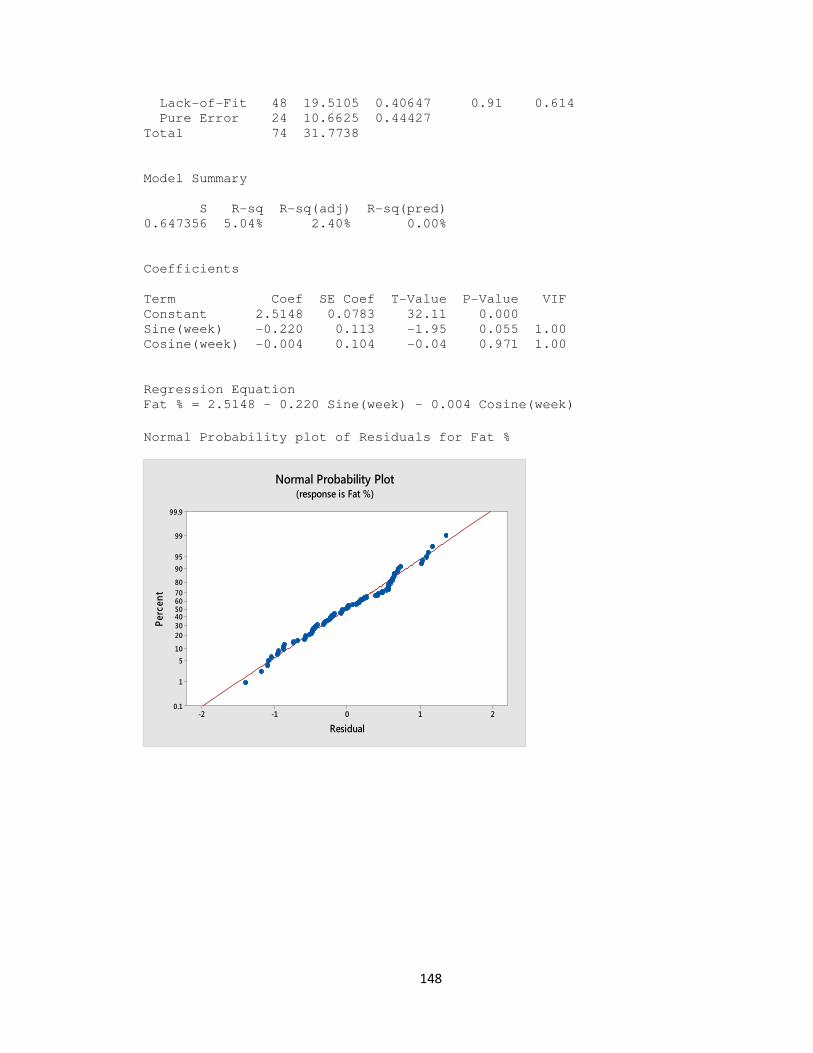
148
Lack-of-Fit 48 19.5105 0.40647 0.91 0.614
Pure Error 24 10.6625 0.44427
Total 74 31.7738
Model Summary
S R-sq R-sq(adj) R-sq(pred)
0.647356 5.04% 2.40% 0.00%
Coefficients
Term Coef SE Coef T-Value P-Value VIF
Constant 2.5148 0.0783 32.11 0.000
Sine(week) -0.220 0.113 -1.95 0.055 1.00
Cosine(week) -0.004 0.104 -0.04 0.971 1.00
Regression Equation
Fat % = 2.5148 - 0.220 Sine(week) - 0.004 Cosine(week)
Normal Probability plot of Residuals for Fat %
210-1-2
99.9
99
95
90
80
7060504030
20
10
5
1
0.1
Residual
Perc
ent
Normal Probability Plot(response is Fat %)
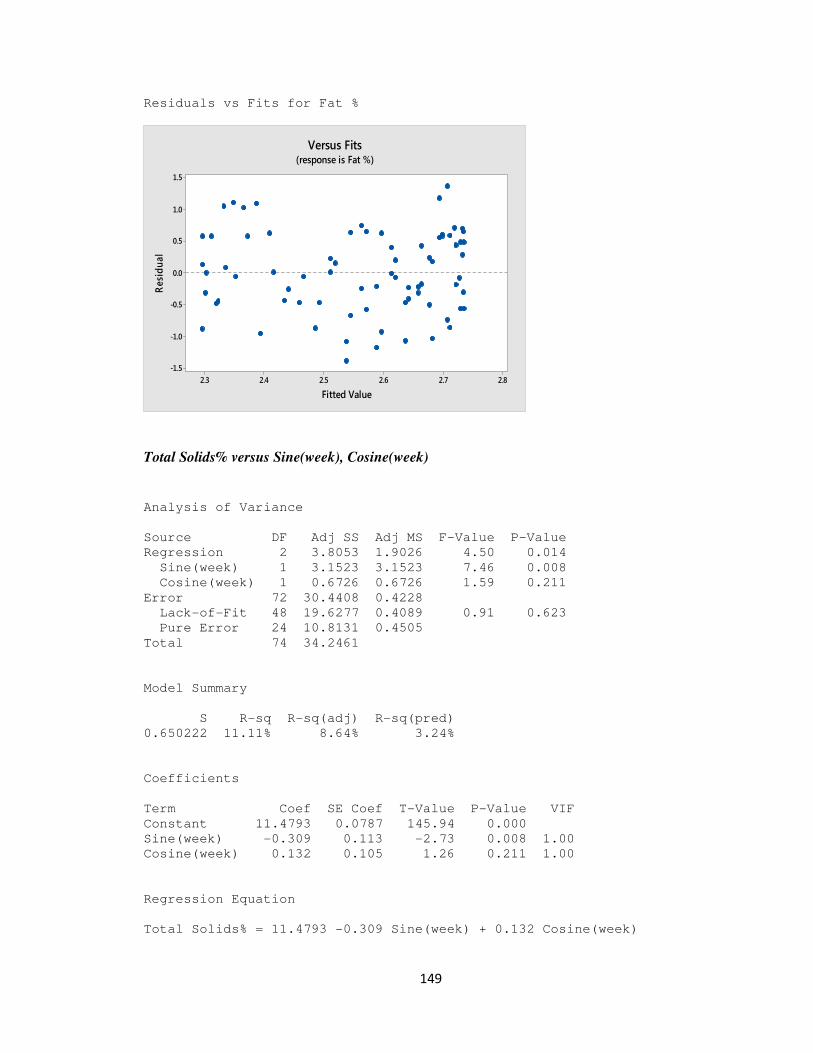
149
Residuals vs Fits for Fat %
Total Solids% versus Sine(week), Cosine(week)
Analysis of Variance
Source DF Adj SS Adj MS F-Value P-Value
Regression 2 3.8053 1.9026 4.50 0.014
Sine(week) 1 3.1523 3.1523 7.46 0.008
Cosine(week) 1 0.6726 0.6726 1.59 0.211
Error 72 30.4408 0.4228
Lack-of-Fit 48 19.6277 0.4089 0.91 0.623
Pure Error 24 10.8131 0.4505
Total 74 34.2461
Model Summary
S R-sq R-sq(adj) R-sq(pred)
0.650222 11.11% 8.64% 3.24%
Coefficients
Term Coef SE Coef T-Value P-Value VIF
Constant 11.4793 0.0787 145.94 0.000
Sine(week) -0.309 0.113 -2.73 0.008 1.00
Cosine(week) 0.132 0.105 1.26 0.211 1.00
Regression Equation
Total Solids% = 11.4793 -0.309 Sine(week) + 0.132 Cosine(week)
2.82.72.62.52.42.3
1.5
1.0
0.5
0.0
-0.5
-1.0
-1.5
Fitted Value
Residual
Versus Fits(response is Fat %)
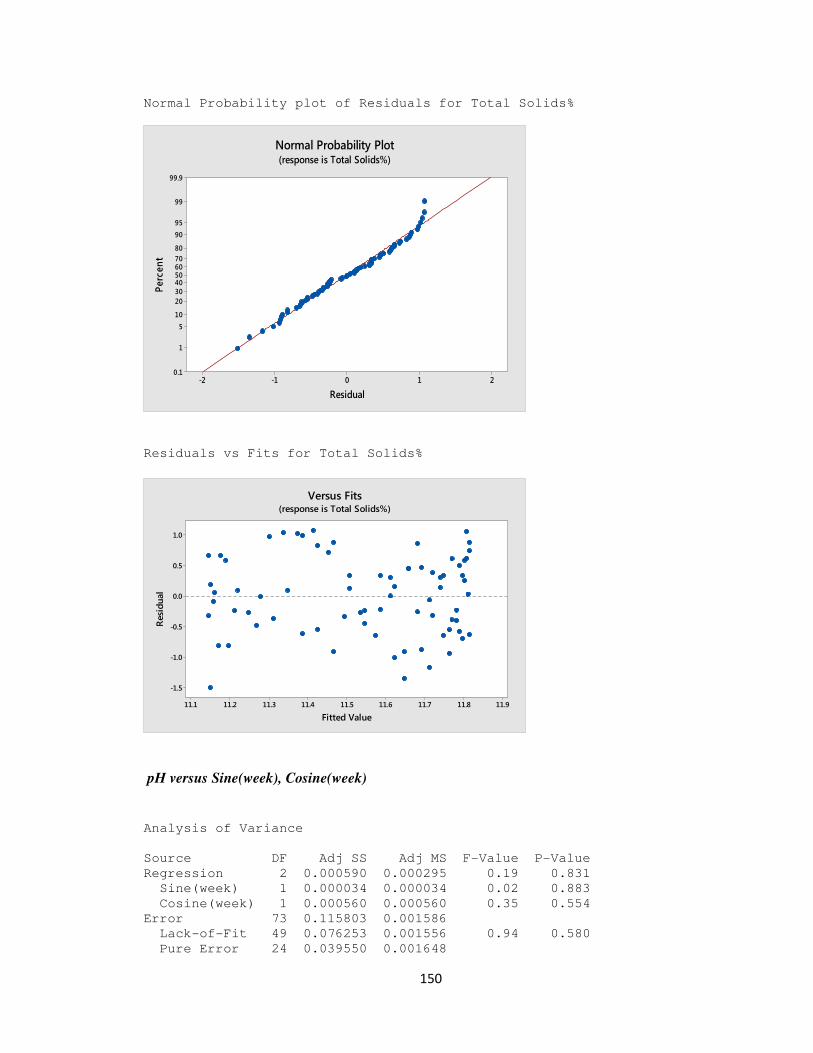
150
Normal Probability plot of Residuals for Total Solids%
Residuals vs Fits for Total Solids%
pH versus Sine(week), Cosine(week)
Analysis of Variance
Source DF Adj SS Adj MS F-Value P-Value
Regression 2 0.000590 0.000295 0.19 0.831
Sine(week) 1 0.000034 0.000034 0.02 0.883
Cosine(week) 1 0.000560 0.000560 0.35 0.554
Error 73 0.115803 0.001586
Lack-of-Fit 49 0.076253 0.001556 0.94 0.580
Pure Error 24 0.039550 0.001648
210-1-2
99.9
99
95
90
80
7060504030
20
10
5
1
0.1
Residual
Perc
ent
Normal Probability Plot(response is Total Solids%)
11.911.811.711.611.511.411.311.211.1
1.0
0.5
0.0
-0.5
-1.0
-1.5
Fitted Value
Residual
Versus Fits(response is Total Solids%)
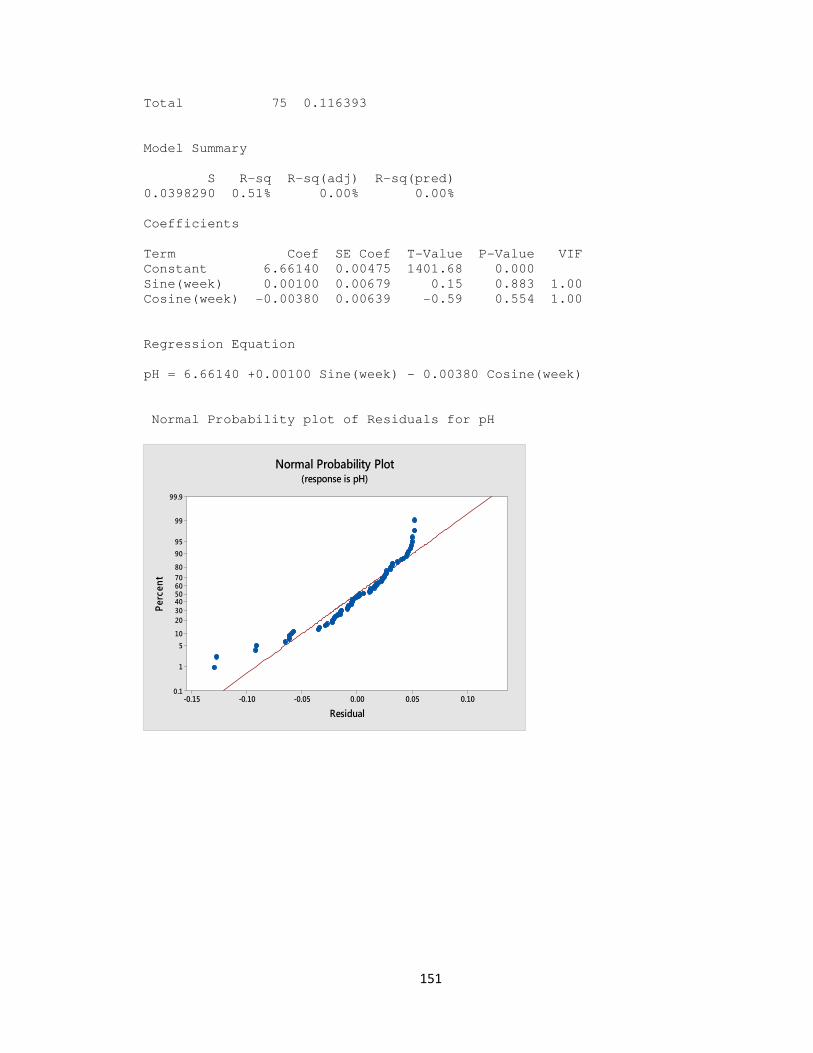
151
Total 75 0.116393
Model Summary
S R-sq R-sq(adj) R-sq(pred)
0.0398290 0.51% 0.00% 0.00%
Coefficients
Term Coef SE Coef T-Value P-Value VIF
Constant 6.66140 0.00475 1401.68 0.000
Sine(week) 0.00100 0.00679 0.15 0.883 1.00
Cosine(week) -0.00380 0.00639 -0.59 0.554 1.00
Regression Equation
pH = 6.66140 +0.00100 Sine(week) - 0.00380 Cosine(week)
Normal Probability plot of Residuals for pH
0.100.050.00-0.05-0.10-0.15
99.9
99
95
90
80
7060504030
20
10
5
1
0.1
Residual
Perc
ent
Normal Probability Plot(response is pH)
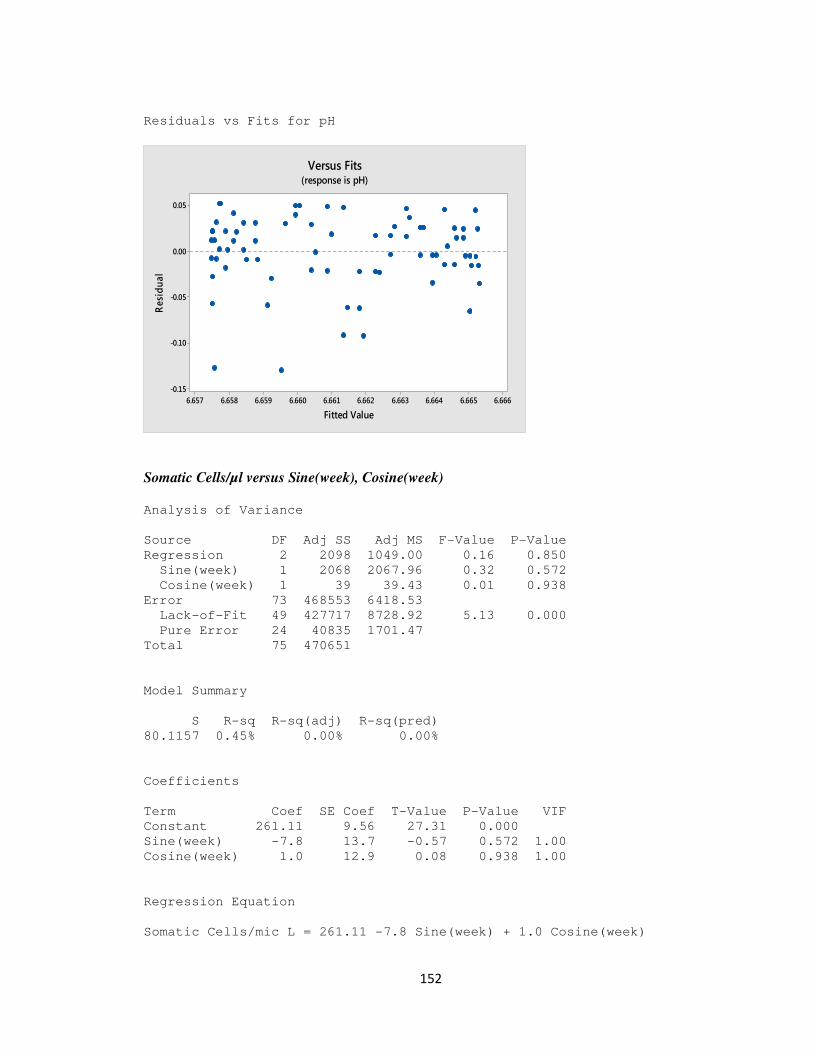
152
Residuals vs Fits for pH
Somatic Cells/µl versus Sine(week), Cosine(week)
Analysis of Variance
Source DF Adj SS Adj MS F-Value P-Value
Regression 2 2098 1049.00 0.16 0.850
Sine(week) 1 2068 2067.96 0.32 0.572
Cosine(week) 1 39 39.43 0.01 0.938
Error 73 468553 6418.53
Lack-of-Fit 49 427717 8728.92 5.13 0.000
Pure Error 24 40835 1701.47
Total 75 470651
Model Summary
S R-sq R-sq(adj) R-sq(pred)
80.1157 0.45% 0.00% 0.00%
Coefficients
Term Coef SE Coef T-Value P-Value VIF
Constant 261.11 9.56 27.31 0.000
Sine(week) -7.8 13.7 -0.57 0.572 1.00
Cosine(week) 1.0 12.9 0.08 0.938 1.00
Regression Equation
Somatic Cells/mic L = 261.11 -7.8 Sine(week) + 1.0 Cosine(week)
6.6666.6656.6646.6636.6626.6616.6606.6596.6586.657
0.05
0.00
-0.05
-0.10
-0.15
Fitted Value
Resi
dual
Versus Fits(response is pH)

153
Normal Probability plot of Residuals for Somatic Cells/ µl
Residuals vs Fits for Somatic Cells/µl
3002001000-100-200-300
99.9
99
95
90
80
7060504030
20
10
5
1
0.1
Residual
Perc
ent
Normal Probability Plot(response is Somatic Cells/mic L)
270265260255
300
200
100
0
-100
-200
Fitted Value
Residual
Versus Fits(response is Somatic Cells/mic L)
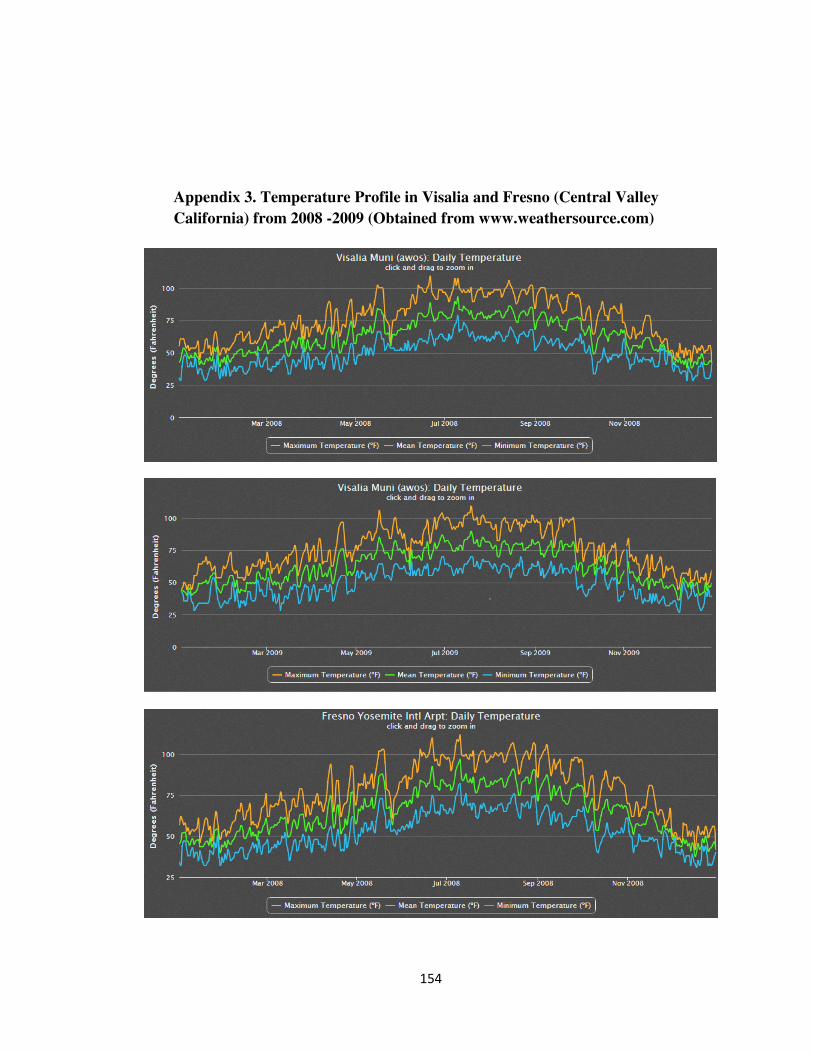
154
Appendix 3. Temperature Profile in Visalia and Fresno (Central Valley
California) from 2008 -2009 (Obtained from www.weathersource.com)
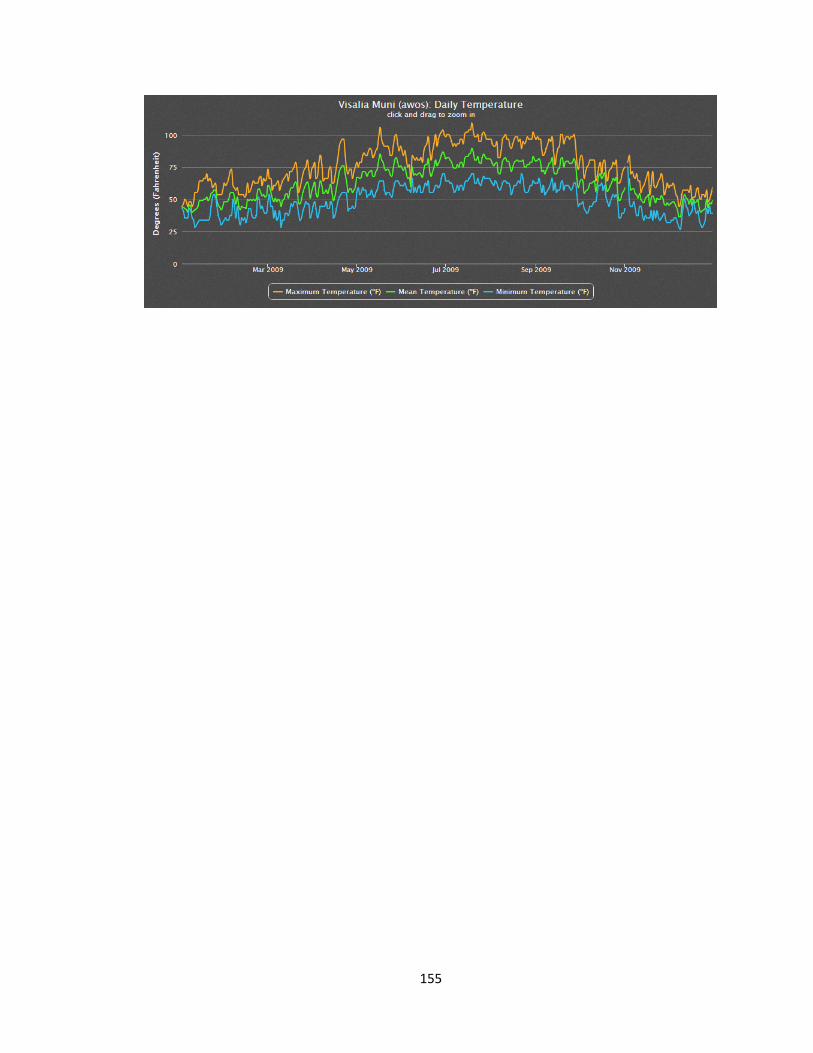
155
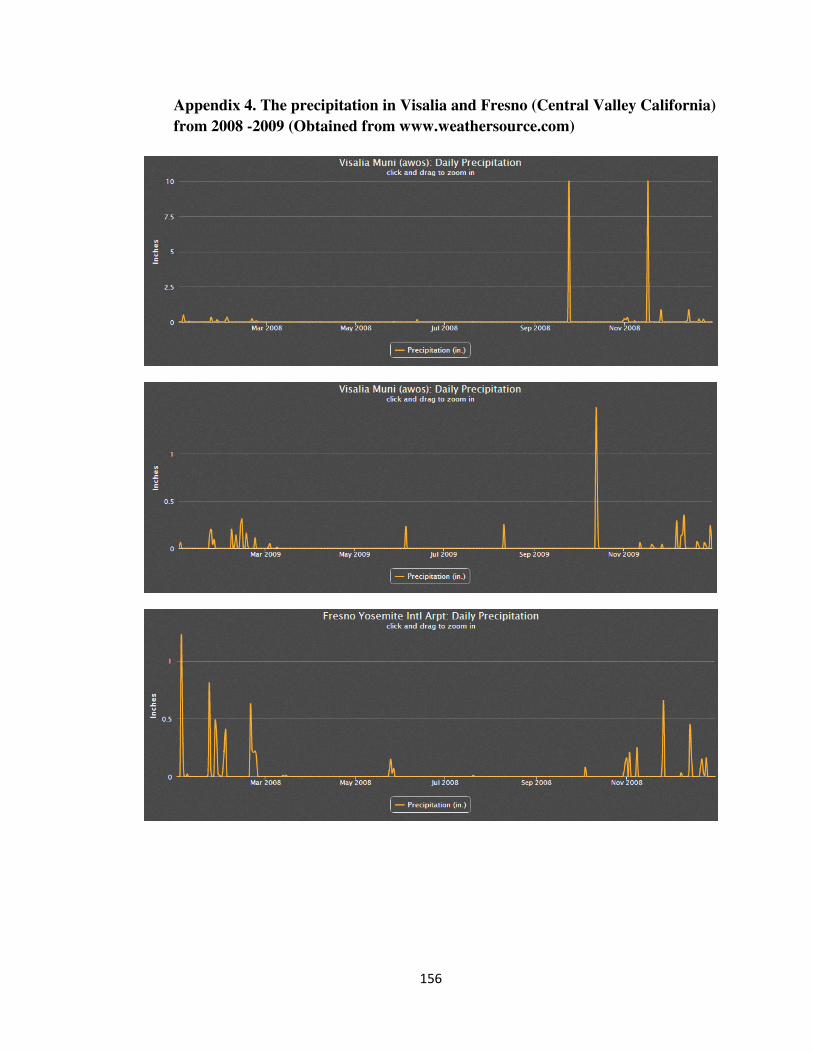
156
Appendix 4. The precipitation in Visalia and Fresno (Central Valley California)
from 2008 -2009 (Obtained from www.weathersource.com)
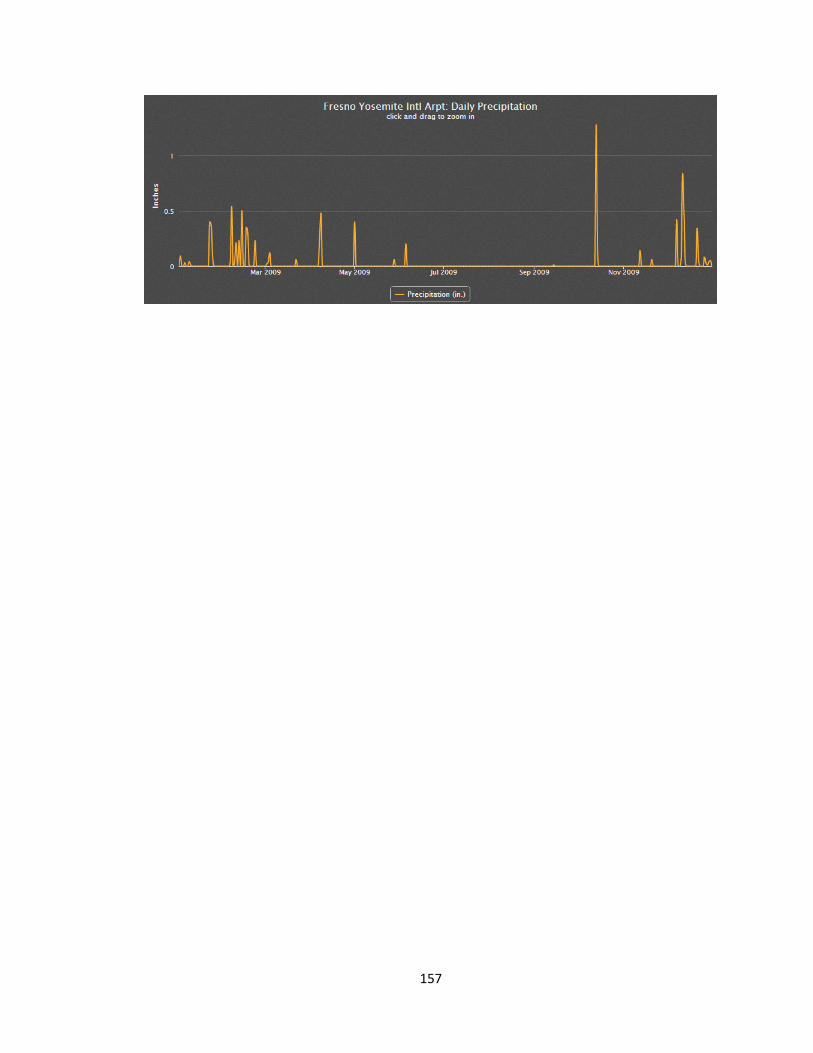
157
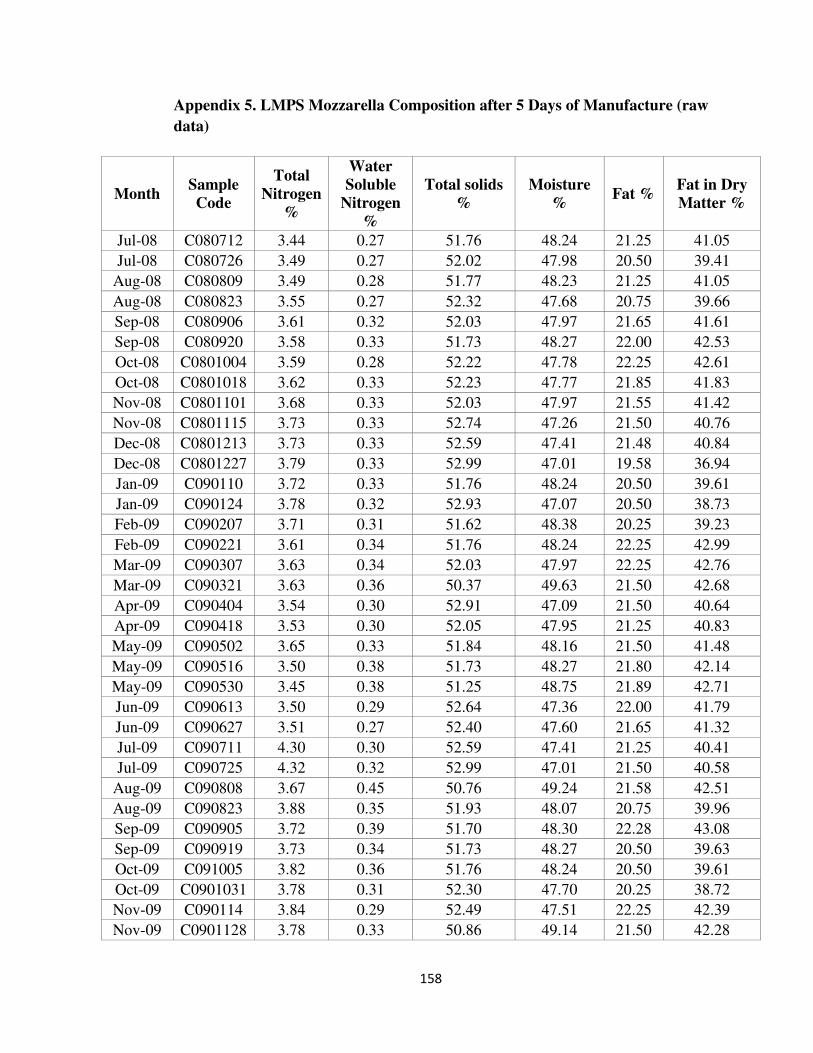
158
Appendix 5. LMPS Mozzarella Composition after 5 Days of Manufacture (raw
data)
Month Sample
Code
Total
Nitrogen
%
Water
Soluble
Nitrogen
%
Total solids
%
Moisture
% Fat %
Fat in Dry
Matter %
Jul-08 C080712 3.44 0.27 51.76 48.24 21.25 41.05
Jul-08 C080726 3.49 0.27 52.02 47.98 20.50 39.41
Aug-08 C080809 3.49 0.28 51.77 48.23 21.25 41.05
Aug-08 C080823 3.55 0.27 52.32 47.68 20.75 39.66
Sep-08 C080906 3.61 0.32 52.03 47.97 21.65 41.61
Sep-08 C080920 3.58 0.33 51.73 48.27 22.00 42.53
Oct-08 C0801004 3.59 0.28 52.22 47.78 22.25 42.61
Oct-08 C0801018 3.62 0.33 52.23 47.77 21.85 41.83
Nov-08 C0801101 3.68 0.33 52.03 47.97 21.55 41.42
Nov-08 C0801115 3.73 0.33 52.74 47.26 21.50 40.76
Dec-08 C0801213 3.73 0.33 52.59 47.41 21.48 40.84
Dec-08 C0801227 3.79 0.33 52.99 47.01 19.58 36.94
Jan-09 C090110 3.72 0.33 51.76 48.24 20.50 39.61
Jan-09 C090124 3.78 0.32 52.93 47.07 20.50 38.73
Feb-09 C090207 3.71 0.31 51.62 48.38 20.25 39.23
Feb-09 C090221 3.61 0.34 51.76 48.24 22.25 42.99
Mar-09 C090307 3.63 0.34 52.03 47.97 22.25 42.76
Mar-09 C090321 3.63 0.36 50.37 49.63 21.50 42.68
Apr-09 C090404 3.54 0.30 52.91 47.09 21.50 40.64
Apr-09 C090418 3.53 0.30 52.05 47.95 21.25 40.83
May-09 C090502 3.65 0.33 51.84 48.16 21.50 41.48
May-09 C090516 3.50 0.38 51.73 48.27 21.80 42.14
May-09 C090530 3.45 0.38 51.25 48.75 21.89 42.71
Jun-09 C090613 3.50 0.29 52.64 47.36 22.00 41.79
Jun-09 C090627 3.51 0.27 52.40 47.60 21.65 41.32
Jul-09 C090711 4.30 0.30 52.59 47.41 21.25 40.41
Jul-09 C090725 4.32 0.32 52.99 47.01 21.50 40.58
Aug-09 C090808 3.67 0.45 50.76 49.24 21.58 42.51
Aug-09 C090823 3.88 0.35 51.93 48.07 20.75 39.96
Sep-09 C090905 3.72 0.39 51.70 48.30 22.28 43.08
Sep-09 C090919 3.73 0.34 51.73 48.27 20.50 39.63
Oct-09 C091005 3.82 0.36 51.76 48.24 20.50 39.61
Oct-09 C0901031 3.78 0.31 52.30 47.70 20.25 38.72
Nov-09 C090114 3.84 0.29 52.49 47.51 22.25 42.39
Nov-09 C0901128 3.78 0.33 50.86 49.14 21.50 42.28
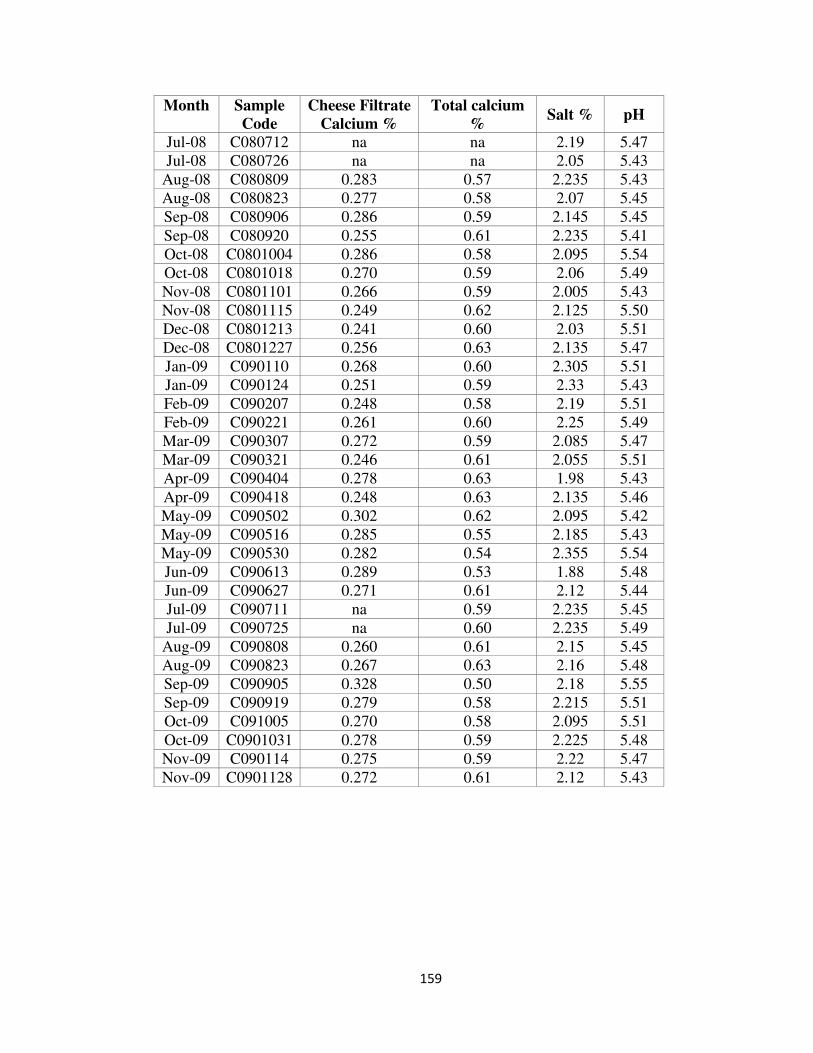
159
Month
Sample
Code
Cheese Filtrate
Calcium %
Total calcium
% Salt % pH
Jul-08 C080712 na na 2.19 5.47 Jul-08 C080726 na na 2.05 5.43
Aug-08 C080809 0.283 0.57 2.235 5.43 Aug-08 C080823 0.277 0.58 2.07 5.45 Sep-08 C080906 0.286 0.59 2.145 5.45
Sep-08 C080920 0.255 0.61 2.235 5.41 Oct-08 C0801004 0.286 0.58 2.095 5.54 Oct-08 C0801018 0.270 0.59 2.06 5.49 Nov-08 C0801101 0.266 0.59 2.005 5.43 Nov-08 C0801115 0.249 0.62 2.125 5.50 Dec-08 C0801213 0.241 0.60 2.03 5.51 Dec-08 C0801227 0.256 0.63 2.135 5.47 Jan-09 C090110 0.268 0.60 2.305 5.51 Jan-09 C090124 0.251 0.59 2.33 5.43 Feb-09 C090207 0.248 0.58 2.19 5.51 Feb-09 C090221 0.261 0.60 2.25 5.49 Mar-09 C090307 0.272 0.59 2.085 5.47 Mar-09 C090321 0.246 0.61 2.055 5.51 Apr-09 C090404 0.278 0.63 1.98 5.43
Apr-09 C090418 0.248 0.63 2.135 5.46 May-09 C090502 0.302 0.62 2.095 5.42 May-09 C090516 0.285 0.55 2.185 5.43 May-09 C090530 0.282 0.54 2.355 5.54 Jun-09 C090613 0.289 0.53 1.88 5.48 Jun-09 C090627 0.271 0.61 2.12 5.44 Jul-09 C090711 na 0.59 2.235 5.45 Jul-09 C090725 na 0.60 2.235 5.49
Aug-09 C090808 0.260 0.61 2.15 5.45 Aug-09 C090823 0.267 0.63 2.16 5.48 Sep-09 C090905 0.328 0.50 2.18 5.55 Sep-09 C090919 0.279 0.58 2.215 5.51 Oct-09 C091005 0.270 0.58 2.095 5.51
Oct-09 C0901031 0.278 0.59 2.225 5.48 Nov-09 C090114 0.275 0.59 2.22 5.47 Nov-09 C0901128 0.272 0.61 2.12 5.43
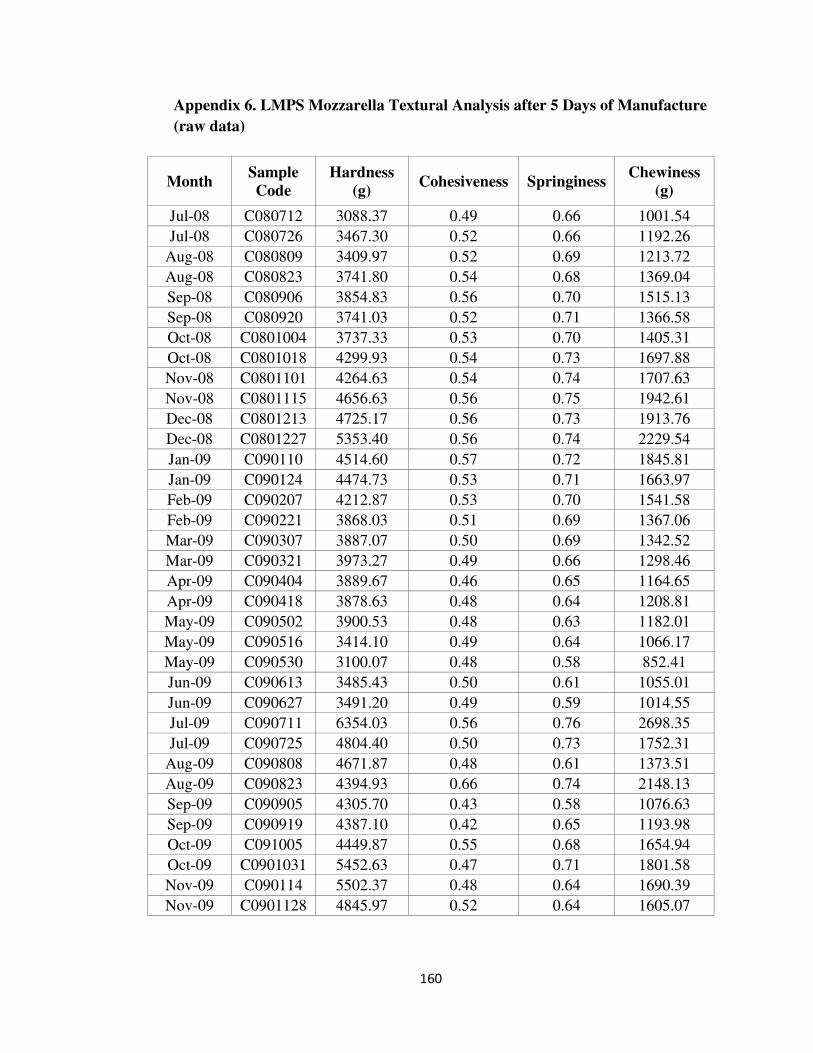
160
Appendix 6. LMPS Mozzarella Textural Analysis after 5 Days of Manufacture
(raw data)
Month Sample
Code
Hardness
(g) Cohesiveness Springiness
Chewiness
(g)
Jul-08 C080712 3088.37 0.49 0.66 1001.54
Jul-08 C080726 3467.30 0.52 0.66 1192.26
Aug-08 C080809 3409.97 0.52 0.69 1213.72
Aug-08 C080823 3741.80 0.54 0.68 1369.04
Sep-08 C080906 3854.83 0.56 0.70 1515.13
Sep-08 C080920 3741.03 0.52 0.71 1366.58
Oct-08 C0801004 3737.33 0.53 0.70 1405.31
Oct-08 C0801018 4299.93 0.54 0.73 1697.88
Nov-08 C0801101 4264.63 0.54 0.74 1707.63
Nov-08 C0801115 4656.63 0.56 0.75 1942.61
Dec-08 C0801213 4725.17 0.56 0.73 1913.76
Dec-08 C0801227 5353.40 0.56 0.74 2229.54
Jan-09 C090110 4514.60 0.57 0.72 1845.81
Jan-09 C090124 4474.73 0.53 0.71 1663.97
Feb-09 C090207 4212.87 0.53 0.70 1541.58
Feb-09 C090221 3868.03 0.51 0.69 1367.06
Mar-09 C090307 3887.07 0.50 0.69 1342.52
Mar-09 C090321 3973.27 0.49 0.66 1298.46
Apr-09 C090404 3889.67 0.46 0.65 1164.65
Apr-09 C090418 3878.63 0.48 0.64 1208.81
May-09 C090502 3900.53 0.48 0.63 1182.01
May-09 C090516 3414.10 0.49 0.64 1066.17
May-09 C090530 3100.07 0.48 0.58 852.41
Jun-09 C090613 3485.43 0.50 0.61 1055.01
Jun-09 C090627 3491.20 0.49 0.59 1014.55
Jul-09 C090711 6354.03 0.56 0.76 2698.35
Jul-09 C090725 4804.40 0.50 0.73 1752.31
Aug-09 C090808 4671.87 0.48 0.61 1373.51
Aug-09 C090823 4394.93 0.66 0.74 2148.13
Sep-09 C090905 4305.70 0.43 0.58 1076.63
Sep-09 C090919 4387.10 0.42 0.65 1193.98
Oct-09 C091005 4449.87 0.55 0.68 1654.94
Oct-09 C0901031 5452.63 0.47 0.71 1801.58
Nov-09 C090114 5502.37 0.48 0.64 1690.39
Nov-09 C0901128 4845.97 0.52 0.64 1605.07
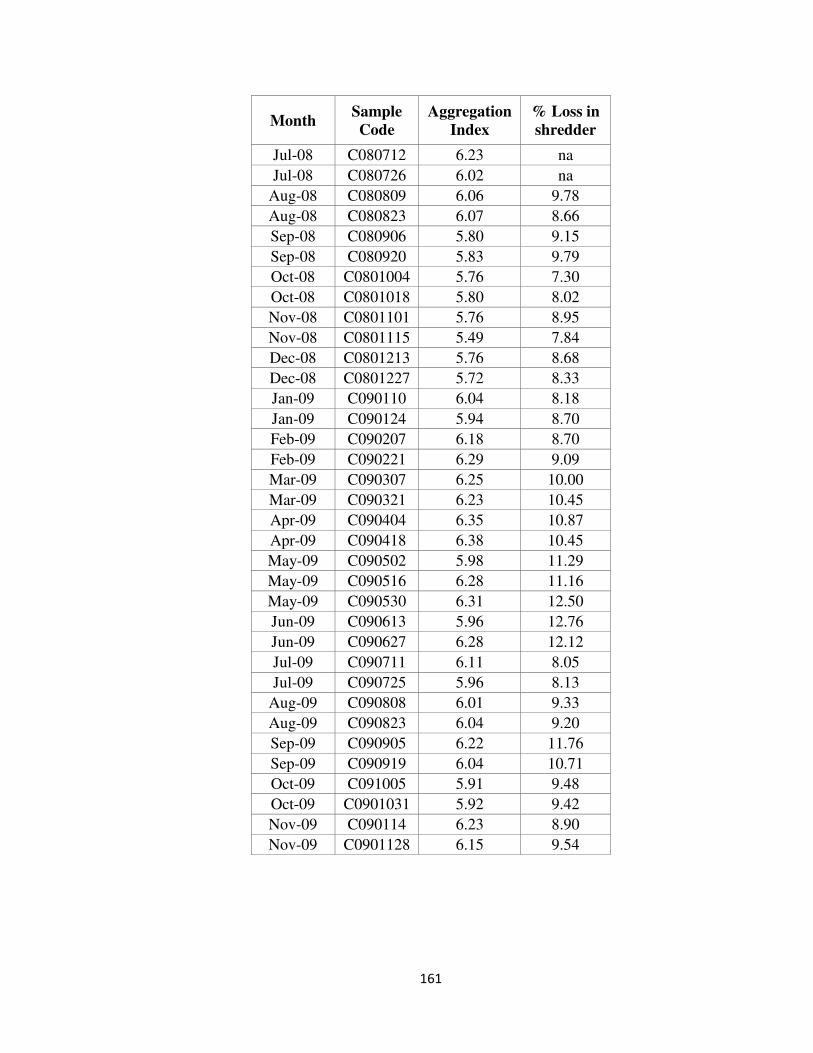
161
Month Sample
Code
Aggregation
Index
% Loss in
shredder
Jul-08 C080712 6.23 na
Jul-08 C080726 6.02 na
Aug-08 C080809 6.06 9.78
Aug-08 C080823 6.07 8.66
Sep-08 C080906 5.80 9.15
Sep-08 C080920 5.83 9.79
Oct-08 C0801004 5.76 7.30
Oct-08 C0801018 5.80 8.02
Nov-08 C0801101 5.76 8.95
Nov-08 C0801115 5.49 7.84
Dec-08 C0801213 5.76 8.68
Dec-08 C0801227 5.72 8.33
Jan-09 C090110 6.04 8.18
Jan-09 C090124 5.94 8.70
Feb-09 C090207 6.18 8.70
Feb-09 C090221 6.29 9.09
Mar-09 C090307 6.25 10.00
Mar-09 C090321 6.23 10.45
Apr-09 C090404 6.35 10.87
Apr-09 C090418 6.38 10.45
May-09 C090502 5.98 11.29
May-09 C090516 6.28 11.16
May-09 C090530 6.31 12.50
Jun-09 C090613 5.96 12.76
Jun-09 C090627 6.28 12.12
Jul-09 C090711 6.11 8.05
Jul-09 C090725 5.96 8.13
Aug-09 C090808 6.01 9.33
Aug-09 C090823 6.04 9.20
Sep-09 C090905 6.22 11.76
Sep-09 C090919 6.04 10.71
Oct-09 C091005 5.91 9.48
Oct-09 C0901031 5.92 9.42
Nov-09 C090114 6.23 8.90
Nov-09 C0901128 6.15 9.54
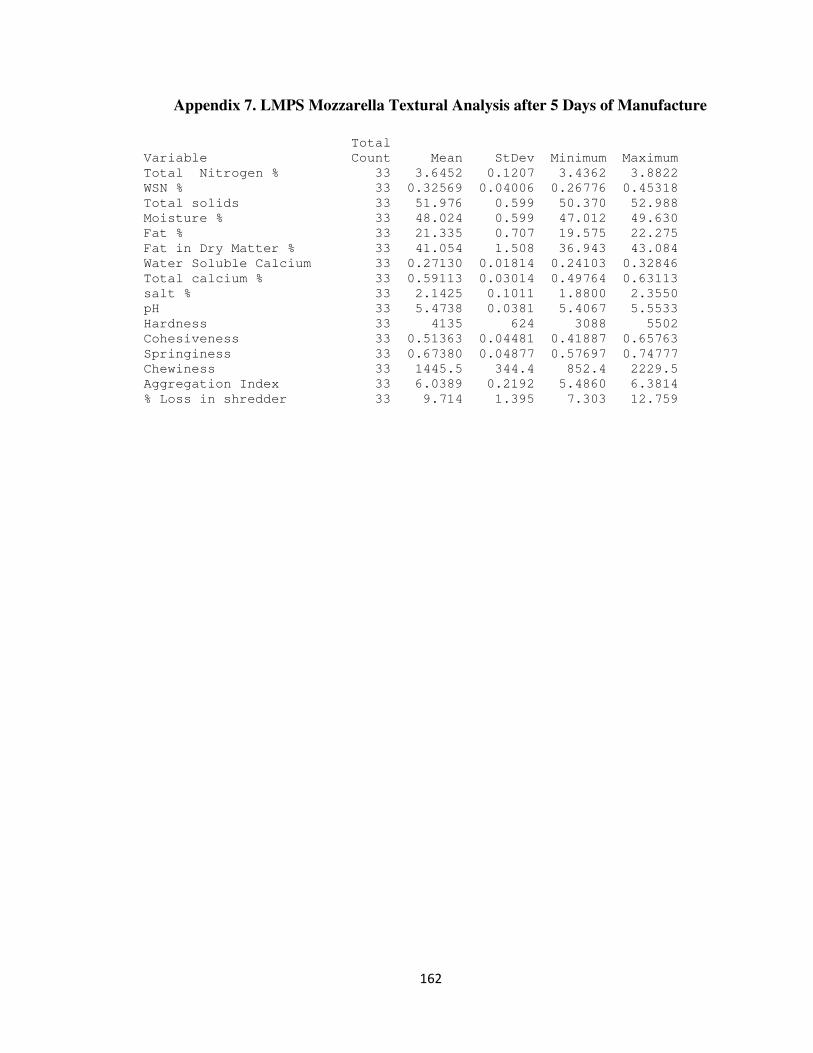
162
Appendix 7. LMPS Mozzarella Textural Analysis after 5 Days of Manufacture
Total
Variable Count Mean StDev Minimum Maximum
Total Nitrogen % 33 3.6452 0.1207 3.4362 3.8822
WSN % 33 0.32569 0.04006 0.26776 0.45318
Total solids 33 51.976 0.599 50.370 52.988
Moisture % 33 48.024 0.599 47.012 49.630
Fat % 33 21.335 0.707 19.575 22.275
Fat in Dry Matter % 33 41.054 1.508 36.943 43.084
Water Soluble Calcium 33 0.27130 0.01814 0.24103 0.32846
Total calcium % 33 0.59113 0.03014 0.49764 0.63113
salt % 33 2.1425 0.1011 1.8800 2.3550
pH 33 5.4738 0.0381 5.4067 5.5533
Hardness 33 4135 624 3088 5502
Cohesiveness 33 0.51363 0.04481 0.41887 0.65763
Springiness 33 0.67380 0.04877 0.57697 0.74777
Chewiness 33 1445.5 344.4 852.4 2229.5
Aggregation Index 33 6.0389 0.2192 5.4860 6.3814
% Loss in shredder 33 9.714 1.395 7.303 12.759

163
Appendix 8. LMPS Mozzarella Ripened at 3.30 C for 21 Days (raw data)
Month Sample
Code.
Hardness
(g) Cohesiveness Springiness Chewiness (g)
Jul-08 C080712 2671.27 0.46 0.61 741.97
Jul-08 C080726 3271.43 0.49 0.61 972.23
Aug-08 C080809 3254.07 0.46 0.61 919.85
Aug-08 C080823 3686.37 0.49 0.64 1157.54
Sep-08 C080906 3756.47 0.51 0.67 1293.32
Sep-08 C080920 3604.07 0.47 0.67 1148.78
Oct-08 C0801004 3566.23 0.49 0.67 1171.34
Oct-08 C0801018 3996.97 0.52 0.68 1408.84
Nov-08 C0801101 3762.07 0.51 0.68 1295.19
Nov-08 C0801115 4329.30 0.52 0.70 1595.41
Dec-08 C0801213 4687.43 0.52 0.68 1676.98
Dec-08 C0801227 4820.00 0.53 0.65 1645.23
Jan-09 C090110 4472.33 0.52 0.66 1553.94
Jan-09 C090124 3925.07 0.51 0.65 1304.44
Feb-09 C090207 4038.00 0.50 0.63 1266.62
Feb-09 C090221 3652.17 0.49 0.65 1167.38
Mar-09 C090307 3510.13 0.48 0.64 1066.60
Mar-09 C090321 3706.70 0.47 0.62 1083.97
Apr-09 C090404 3657.10 0.46 0.61 1023.16
Apr-09 C090418 3638.47 0.45 0.61 1008.85
May-09 C090502 3584.07 0.46 0.58 958.77
May-09 C090516 3182.30 0.47 0.61 900.63
May-09 C090530 2770.57 0.46 0.57 735.26
Jun-09 C090613 3270.23 0.49 0.56 900.84
Jun-09 C090627 3016.77 0.46 0.56 773.76
Jul-09 C090711 5355.60 0.47 0.69 1736.13
Jul-09 C090725 4600.87 0.46 0.68 1439.11
Aug-09 C090808 4257.33 0.46 0.61 1205.20
Aug-09 C090823 3790.33 0.42 0.58 926.94
Sep-09 C090905 3627.80 0.47 0.61 1029.67
Sep-09 C090919 3193.73 0.45 0.59 839.16
Oct-09 C091005 3902.07 0.48 0.64 1186.32
Oct-09 C0901031 4490.97 0.55 0.61 1487.22
Nov-09 C090114 4489.00 0.45 0.63 1258.65
Nov-09 C0901128 4589.00 0.46 0.63 1309.71
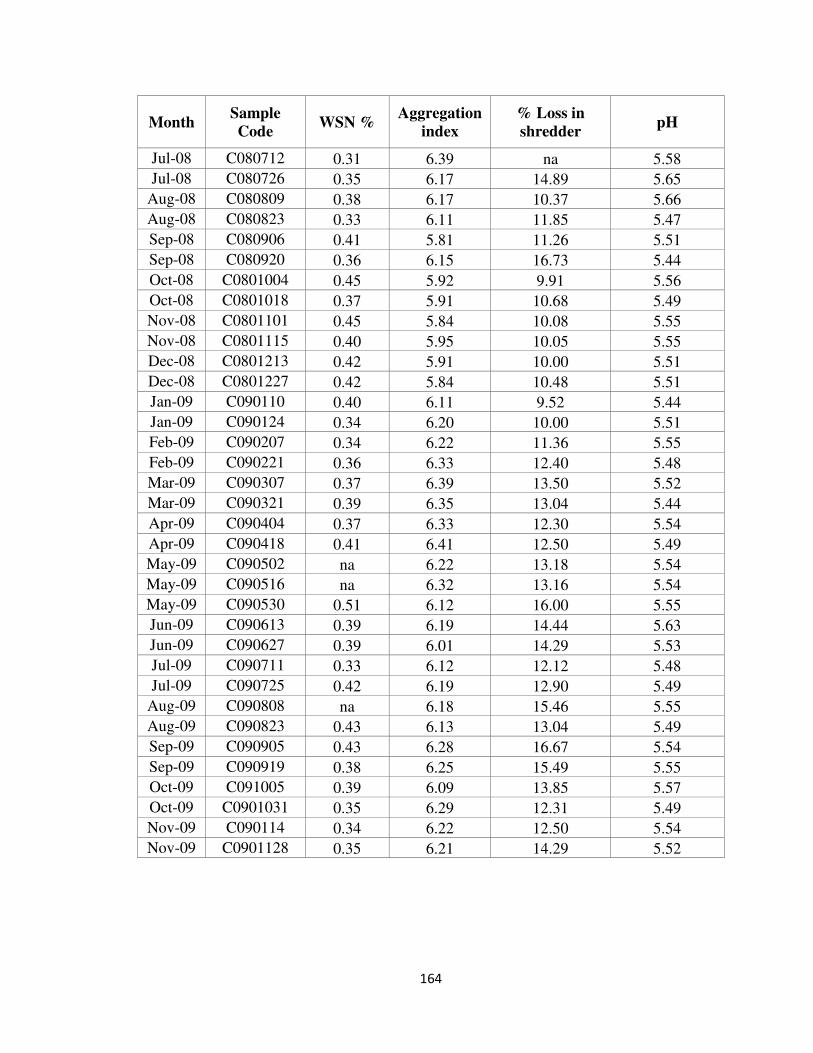
164
Month Sample
Code WSN %
Aggregation
index
% Loss in
shredder pH
Jul-08 C080712 0.31 6.39 na 5.58
Jul-08 C080726 0.35 6.17 14.89 5.65
Aug-08 C080809 0.38 6.17 10.37 5.66
Aug-08 C080823 0.33 6.11 11.85 5.47
Sep-08 C080906 0.41 5.81 11.26 5.51
Sep-08 C080920 0.36 6.15 16.73 5.44
Oct-08 C0801004 0.45 5.92 9.91 5.56
Oct-08 C0801018 0.37 5.91 10.68 5.49
Nov-08 C0801101 0.45 5.84 10.08 5.55
Nov-08 C0801115 0.40 5.95 10.05 5.55
Dec-08 C0801213 0.42 5.91 10.00 5.51
Dec-08 C0801227 0.42 5.84 10.48 5.51
Jan-09 C090110 0.40 6.11 9.52 5.44
Jan-09 C090124 0.34 6.20 10.00 5.51
Feb-09 C090207 0.34 6.22 11.36 5.55
Feb-09 C090221 0.36 6.33 12.40 5.48
Mar-09 C090307 0.37 6.39 13.50 5.52
Mar-09 C090321 0.39 6.35 13.04 5.44
Apr-09 C090404 0.37 6.33 12.30 5.54
Apr-09 C090418 0.41 6.41 12.50 5.49
May-09 C090502 na 6.22 13.18 5.54
May-09 C090516 na 6.32 13.16 5.54
May-09 C090530 0.51 6.12 16.00 5.55
Jun-09 C090613 0.39 6.19 14.44 5.63
Jun-09 C090627 0.39 6.01 14.29 5.53
Jul-09 C090711 0.33 6.12 12.12 5.48
Jul-09 C090725 0.42 6.19 12.90 5.49
Aug-09 C090808 na 6.18 15.46 5.55
Aug-09 C090823 0.43 6.13 13.04 5.49
Sep-09 C090905 0.43 6.28 16.67 5.54
Sep-09 C090919 0.38 6.25 15.49 5.55
Oct-09 C091005 0.39 6.09 13.85 5.57
Oct-09 C0901031 0.35 6.29 12.31 5.49
Nov-09 C090114 0.34 6.22 12.50 5.54
Nov-09 C0901128 0.35 6.21 14.29 5.52
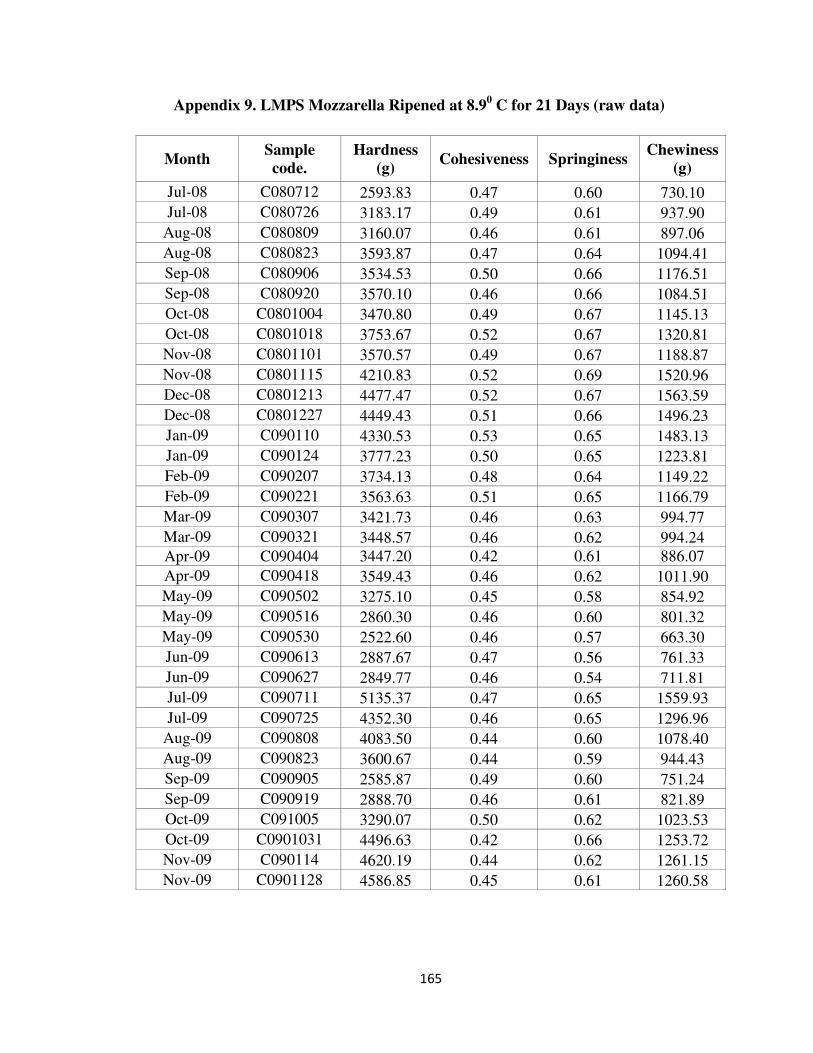
165
Appendix 9. LMPS Mozzarella Ripened at 8.90 C for 21 Days (raw data)
Month Sample
code.
Hardness
(g) Cohesiveness Springiness
Chewiness
(g)
Jul-08 C080712 2593.83 0.47 0.60 730.10
Jul-08 C080726 3183.17 0.49 0.61 937.90
Aug-08 C080809 3160.07 0.46 0.61 897.06
Aug-08 C080823 3593.87 0.47 0.64 1094.41
Sep-08 C080906 3534.53 0.50 0.66 1176.51
Sep-08 C080920 3570.10 0.46 0.66 1084.51
Oct-08 C0801004 3470.80 0.49 0.67 1145.13
Oct-08 C0801018 3753.67 0.52 0.67 1320.81
Nov-08 C0801101 3570.57 0.49 0.67 1188.87
Nov-08 C0801115 4210.83 0.52 0.69 1520.96
Dec-08 C0801213 4477.47 0.52 0.67 1563.59
Dec-08 C0801227 4449.43 0.51 0.66 1496.23
Jan-09 C090110 4330.53 0.53 0.65 1483.13
Jan-09 C090124 3777.23 0.50 0.65 1223.81
Feb-09 C090207 3734.13 0.48 0.64 1149.22
Feb-09 C090221 3563.63 0.51 0.65 1166.79
Mar-09 C090307 3421.73 0.46 0.63 994.77
Mar-09 C090321 3448.57 0.46 0.62 994.24 Apr-09 C090404 3447.20 0.42 0.61 886.07
Apr-09 C090418 3549.43 0.46 0.62 1011.90
May-09 C090502 3275.10 0.45 0.58 854.92
May-09 C090516 2860.30 0.46 0.60 801.32
May-09 C090530 2522.60 0.46 0.57 663.30
Jun-09 C090613 2887.67 0.47 0.56 761.33
Jun-09 C090627 2849.77 0.46 0.54 711.81
Jul-09 C090711 5135.37 0.47 0.65 1559.93
Jul-09 C090725 4352.30 0.46 0.65 1296.96
Aug-09 C090808 4083.50 0.44 0.60 1078.40
Aug-09 C090823 3600.67 0.44 0.59 944.43
Sep-09 C090905 2585.87 0.49 0.60 751.24
Sep-09 C090919 2888.70 0.46 0.61 821.89
Oct-09 C091005 3290.07 0.50 0.62 1023.53
Oct-09 C0901031 4496.63 0.42 0.66 1253.72
Nov-09 C090114 4620.19 0.44 0.62 1261.15
Nov-09 C0901128 4586.85 0.45 0.61 1260.58
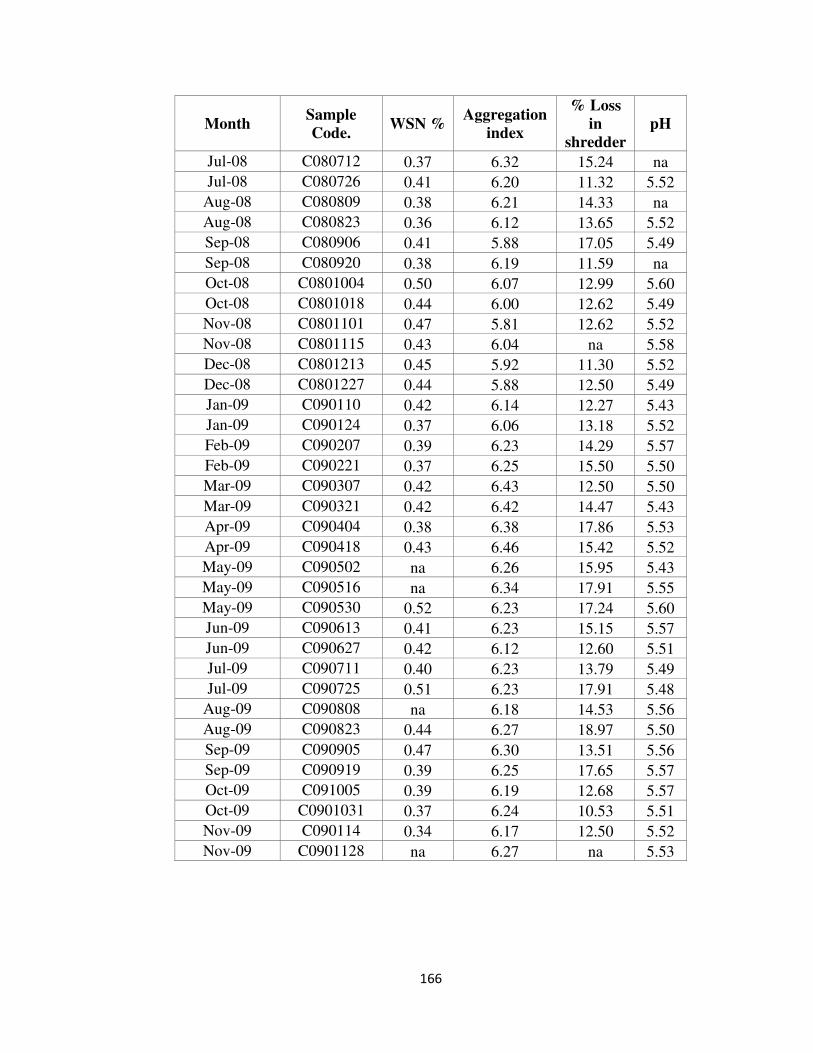
166
Month Sample
Code. WSN %
Aggregation
index
% Loss
in
shredder
pH
Jul-08 C080712 0.37 6.32 15.24 na
Jul-08 C080726 0.41 6.20 11.32 5.52
Aug-08 C080809 0.38 6.21 14.33 na
Aug-08 C080823 0.36 6.12 13.65 5.52
Sep-08 C080906 0.41 5.88 17.05 5.49
Sep-08 C080920 0.38 6.19 11.59 na
Oct-08 C0801004 0.50 6.07 12.99 5.60
Oct-08 C0801018 0.44 6.00 12.62 5.49
Nov-08 C0801101 0.47 5.81 12.62 5.52
Nov-08 C0801115 0.43 6.04 na 5.58
Dec-08 C0801213 0.45 5.92 11.30 5.52
Dec-08 C0801227 0.44 5.88 12.50 5.49
Jan-09 C090110 0.42 6.14 12.27 5.43
Jan-09 C090124 0.37 6.06 13.18 5.52
Feb-09 C090207 0.39 6.23 14.29 5.57
Feb-09 C090221 0.37 6.25 15.50 5.50
Mar-09 C090307 0.42 6.43 12.50 5.50
Mar-09 C090321 0.42 6.42 14.47 5.43
Apr-09 C090404 0.38 6.38 17.86 5.53
Apr-09 C090418 0.43 6.46 15.42 5.52
May-09 C090502 na 6.26 15.95 5.43
May-09 C090516 na 6.34 17.91 5.55
May-09 C090530 0.52 6.23 17.24 5.60
Jun-09 C090613 0.41 6.23 15.15 5.57
Jun-09 C090627 0.42 6.12 12.60 5.51
Jul-09 C090711 0.40 6.23 13.79 5.49
Jul-09 C090725 0.51 6.23 17.91 5.48
Aug-09 C090808 na 6.18 14.53 5.56
Aug-09 C090823 0.44 6.27 18.97 5.50
Sep-09 C090905 0.47 6.30 13.51 5.56
Sep-09 C090919 0.39 6.25 17.65 5.57
Oct-09 C091005 0.39 6.19 12.68 5.57
Oct-09 C0901031 0.37 6.24 10.53 5.51
Nov-09 C090114 0.34 6.17 12.50 5.52
Nov-09 C0901128 na 6.27 na 5.53
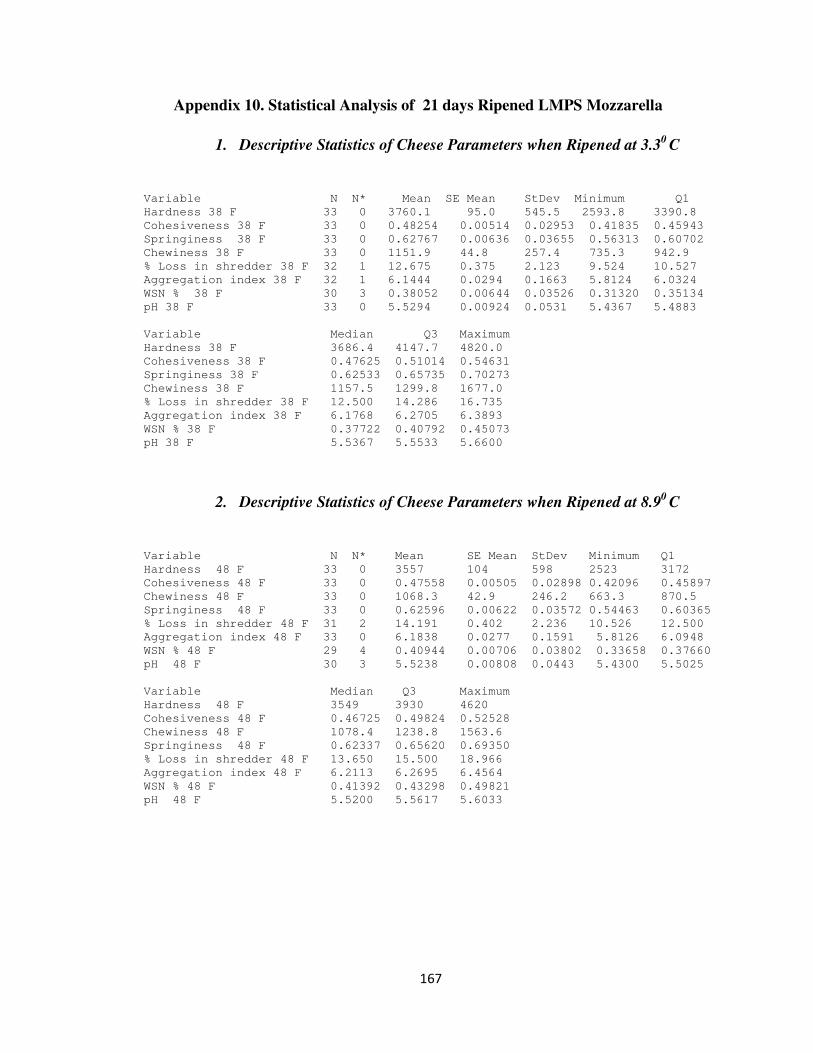
167
Appendix 10. Statistical Analysis of 21 days Ripened LMPS Mozzarella
1. Descriptive Statistics of Cheese Parameters when Ripened at 3.30
C
Variable N N* Mean SE Mean StDev Minimum Q1
Hardness 38 F 33 0 3760.1 95.0 545.5 2593.8 3390.8
Cohesiveness 38 F 33 0 0.48254 0.00514 0.02953 0.41835 0.45943
Springiness 38 F 33 0 0.62767 0.00636 0.03655 0.56313 0.60702
Chewiness 38 F 33 0 1151.9 44.8 257.4 735.3 942.9
% Loss in shredder 38 F 32 1 12.675 0.375 2.123 9.524 10.527
Aggregation index 38 F 32 1 6.1444 0.0294 0.1663 5.8124 6.0324
WSN % 38 F 30 3 0.38052 0.00644 0.03526 0.31320 0.35134
pH 38 F 33 0 5.5294 0.00924 0.0531 5.4367 5.4883
Variable Median Q3 Maximum
Hardness 38 F 3686.4 4147.7 4820.0
Cohesiveness 38 F 0.47625 0.51014 0.54631
Springiness 38 F 0.62533 0.65735 0.70273
Chewiness 38 F 1157.5 1299.8 1677.0
% Loss in shredder 38 F 12.500 14.286 16.735
Aggregation index 38 F 6.1768 6.2705 6.3893
WSN % 38 F 0.37722 0.40792 0.45073
pH 38 F 5.5367 5.5533 5.6600
2. Descriptive Statistics of Cheese Parameters when Ripened at 8.90
C
Variable N N* Mean SE Mean StDev Minimum Q1
Hardness 48 F 33 0 3557 104 598 2523 3172
Cohesiveness 48 F 33 0 0.47558 0.00505 0.02898 0.42096 0.45897
Chewiness 48 F 33 0 1068.3 42.9 246.2 663.3 870.5
Springiness 48 F 33 0 0.62596 0.00622 0.03572 0.54463 0.60365
% Loss in shredder 48 F 31 2 14.191 0.402 2.236 10.526 12.500
Aggregation index 48 F 33 0 6.1838 0.0277 0.1591 5.8126 6.0948
WSN % 48 F 29 4 0.40944 0.00706 0.03802 0.33658 0.37660
pH 48 F 30 3 5.5238 0.00808 0.0443 5.4300 5.5025
Variable Median Q3 Maximum
Hardness 48 F 3549 3930 4620
Cohesiveness 48 F 0.46725 0.49824 0.52528
Chewiness 48 F 1078.4 1238.8 1563.6
Springiness 48 F 0.62337 0.65620 0.69350
% Loss in shredder 48 F 13.650 15.500 18.966
Aggregation index 48 F 6.2113 6.2695 6.4564
WSN % 48 F 0.41392 0.43298 0.49821
pH 48 F 5.5200 5.5617 5.6033
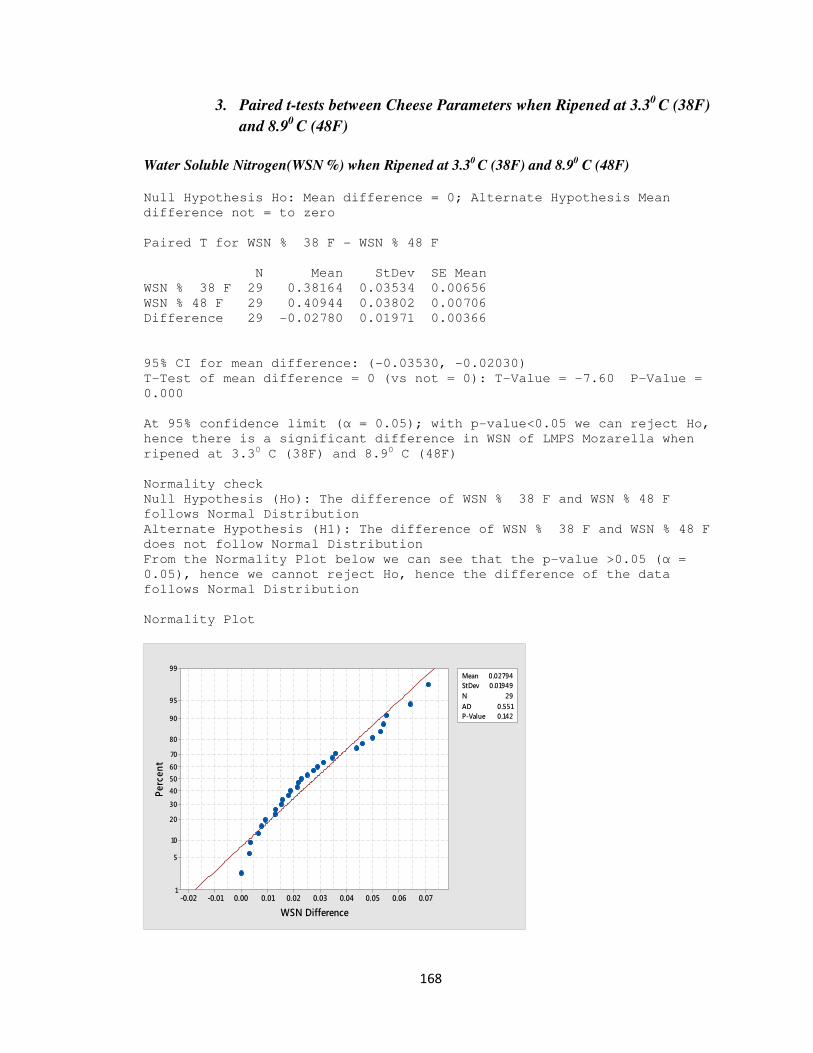
168
3. Paired t-tests between Cheese Parameters when Ripened at 3.30
C (38F)
and 8.90
C (48F)
Water Soluble Nitrogen(WSN %) when Ripened at 3.30 C (38F) and 8.9
0 C (48F)
Null Hypothesis Ho: Mean difference = 0; Alternate Hypothesis Mean
difference not = to zero
Paired T for WSN % 38 F - WSN % 48 F
N Mean StDev SE Mean
WSN % 38 F 29 0.38164 0.03534 0.00656
WSN % 48 F 29 0.40944 0.03802 0.00706
Difference 29 -0.02780 0.01971 0.00366
95% CI for mean difference: (-0.03530, -0.02030)
T-Test of mean difference = 0 (vs not = 0): T-Value = -7.60 P-Value =
0.000
At 95% confidence limit (α = 0.05); with p-value<0.05 we can reject Ho,
hence there is a significant difference in WSN of LMPS Mozarella when
ripened at 3.30 C (38F) and 8.90 C (48F)
Normality check
Null Hypothesis (Ho): The difference of WSN % 38 F and WSN % 48 F
follows Normal Distribution
Alternate Hypothesis (H1): The difference of WSN % 38 F and WSN % 48 F
does not follow Normal Distribution
From the Normality Plot below we can see that the p-value >0.05 (α =
0.05), hence we cannot reject Ho, hence the difference of the data
follows Normal Distribution
Normality Plot
0.070.060.050.040.030.020.010.00-0.01-0.02
99
95
90
80
70
60
50
40
30
20
10
5
1
Mean 0.02794
StDev 0.01949
N 29
AD 0.551
P-Value 0.142
WSN Difference
Perc
ent
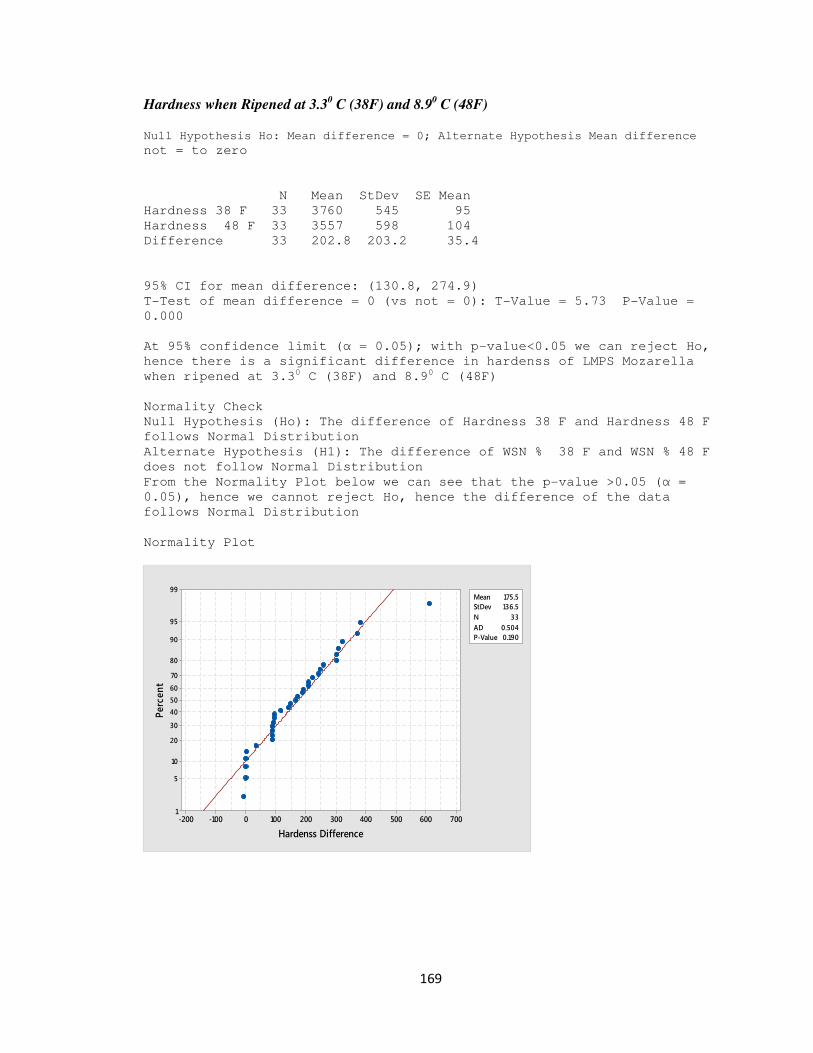
169
Hardness when Ripened at 3.30 C (38F) and 8.9
0 C (48F)
Null Hypothesis Ho: Mean difference = 0; Alternate Hypothesis Mean difference
not = to zero
N Mean StDev SE Mean
Hardness 38 F 33 3760 545 95
Hardness 48 F 33 3557 598 104
Difference 33 202.8 203.2 35.4
95% CI for mean difference: (130.8, 274.9)
T-Test of mean difference = 0 (vs not = 0): T-Value = 5.73 P-Value =
0.000
At 95% confidence limit (α = 0.05); with p-value<0.05 we can reject Ho,
hence there is a significant difference in hardenss of LMPS Mozarella
when ripened at 3.30 C (38F) and 8.90 C (48F)
Normality Check
Null Hypothesis (Ho): The difference of Hardness 38 F and Hardness 48 F
follows Normal Distribution
Alternate Hypothesis (H1): The difference of WSN % 38 F and WSN % 48 F
does not follow Normal Distribution
From the Normality Plot below we can see that the p-value >0.05 (α =
0.05), hence we cannot reject Ho, hence the difference of the data
follows Normal Distribution
Normality Plot
7006005004003002001000-100-200
99
95
90
80
70
60
50
40
30
20
10
5
1
Mean 175.5
StDev 136.5
N 33
AD 0.504
P-Value 0.190
Hardenss Difference
Perc
ent
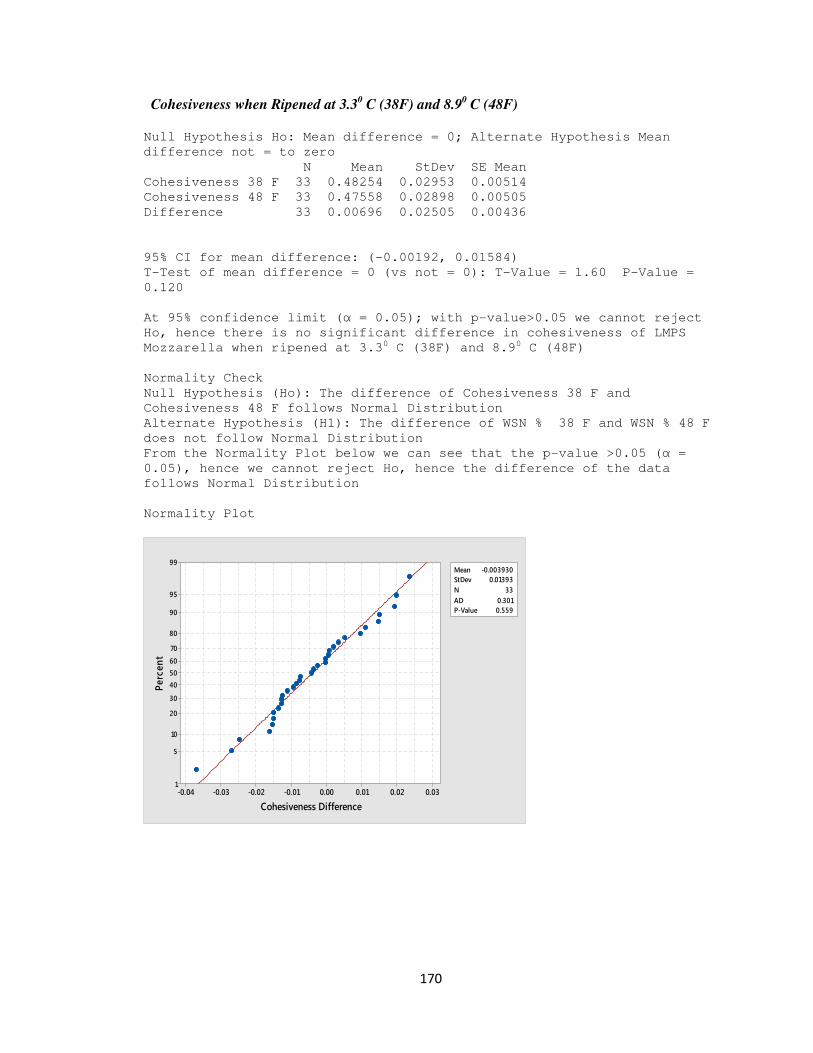
170
Cohesiveness when Ripened at 3.30 C (38F) and 8.9
0 C (48F)
Null Hypothesis Ho: Mean difference = 0; Alternate Hypothesis Mean
difference not = to zero
N Mean StDev SE Mean
Cohesiveness 38 F 33 0.48254 0.02953 0.00514
Cohesiveness 48 F 33 0.47558 0.02898 0.00505
Difference 33 0.00696 0.02505 0.00436
95% CI for mean difference: (-0.00192, 0.01584)
T-Test of mean difference = 0 (vs not = 0): T-Value = 1.60 P-Value =
0.120
At 95% confidence limit (α = 0.05); with p-value>0.05 we cannot reject
Ho, hence there is no significant difference in cohesiveness of LMPS
Mozzarella when ripened at 3.30 C (38F) and 8.90 C (48F)
Normality Check
Null Hypothesis (Ho): The difference of Cohesiveness 38 F and
Cohesiveness 48 F follows Normal Distribution
Alternate Hypothesis (H1): The difference of WSN % 38 F and WSN % 48 F
does not follow Normal Distribution
From the Normality Plot below we can see that the p-value >0.05 (α =
0.05), hence we cannot reject Ho, hence the difference of the data
follows Normal Distribution
Normality Plot
0.030.020.010.00-0.01-0.02-0.03-0.04
99
95
90
80
70
60
50
40
30
20
10
5
1
Mean -0.003930
StDev 0.01393
N 33
AD 0.301
P-Value 0.559
Cohesiveness Difference
Perc
ent
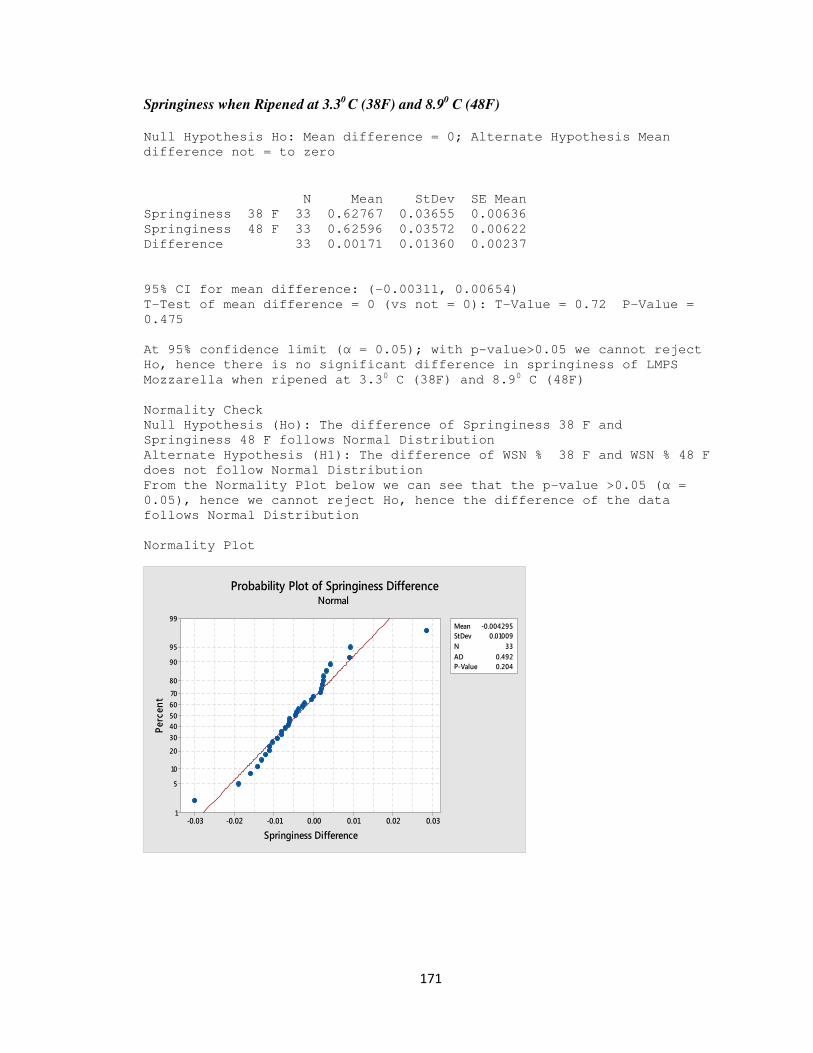
171
Springiness when Ripened at 3.30 C (38F) and 8.9
0 C (48F)
Null Hypothesis Ho: Mean difference = 0; Alternate Hypothesis Mean
difference not = to zero
N Mean StDev SE Mean
Springiness 38 F 33 0.62767 0.03655 0.00636
Springiness 48 F 33 0.62596 0.03572 0.00622
Difference 33 0.00171 0.01360 0.00237
95% CI for mean difference: (-0.00311, 0.00654)
T-Test of mean difference = 0 (vs not = 0): T-Value = 0.72 P-Value =
0.475
At 95% confidence limit (α = 0.05); with p-value>0.05 we cannot reject
Ho, hence there is no significant difference in springiness of LMPS
Mozzarella when ripened at 3.30 C (38F) and 8.90 C (48F)
Normality Check
Null Hypothesis (Ho): The difference of Springiness 38 F and
Springiness 48 F follows Normal Distribution
Alternate Hypothesis (H1): The difference of WSN % 38 F and WSN % 48 F
does not follow Normal Distribution
From the Normality Plot below we can see that the p-value >0.05 (α =
0.05), hence we cannot reject Ho, hence the difference of the data
follows Normal Distribution
Normality Plot
0.030.020.010.00-0.01-0.02-0.03
99
95
90
80
70
60
50
40
30
20
10
5
1
Mean -0.004295
StDev 0.01009
N 33
AD 0.492
P-Value 0.204
Springiness Difference
Per
cen
t
Probability Plot of Springiness DifferenceNormal
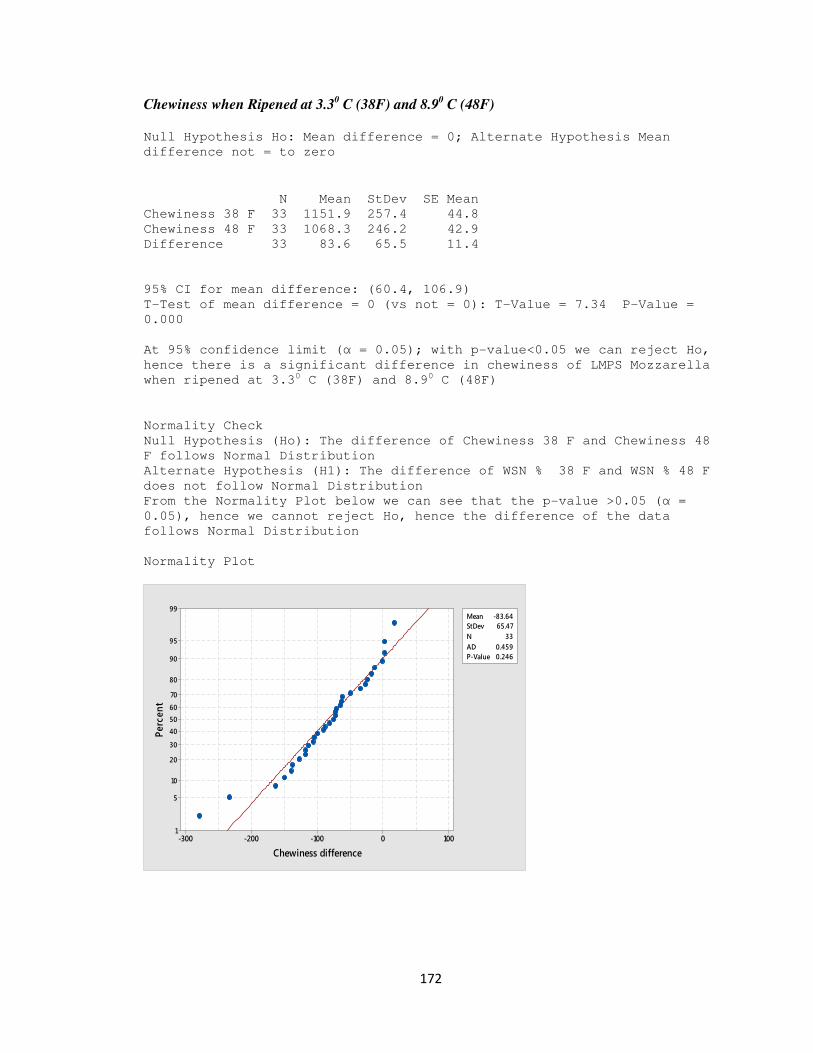
172
Chewiness when Ripened at 3.30 C (38F) and 8.9
0 C (48F)
Null Hypothesis Ho: Mean difference = 0; Alternate Hypothesis Mean
difference not = to zero
N Mean StDev SE Mean
Chewiness 38 F 33 1151.9 257.4 44.8
Chewiness 48 F 33 1068.3 246.2 42.9
Difference 33 83.6 65.5 11.4
95% CI for mean difference: (60.4, 106.9)
T-Test of mean difference = 0 (vs not = 0): T-Value = 7.34 P-Value =
0.000
At 95% confidence limit (α = 0.05); with p-value<0.05 we can reject Ho,
hence there is a significant difference in chewiness of LMPS Mozzarella
when ripened at 3.30 C (38F) and 8.90 C (48F)
Normality Check
Null Hypothesis (Ho): The difference of Chewiness 38 F and Chewiness 48
F follows Normal Distribution
Alternate Hypothesis (H1): The difference of WSN % 38 F and WSN % 48 F
does not follow Normal Distribution
From the Normality Plot below we can see that the p-value >0.05 (α =
0.05), hence we cannot reject Ho, hence the difference of the data
follows Normal Distribution
Normality Plot
1000-100-200-300
99
95
90
80
70
60
50
40
30
20
10
5
1
Mean -83.64
StDev 65.47
N 33
AD 0.459
P-Value 0.246
Chewiness difference
Perc
ent
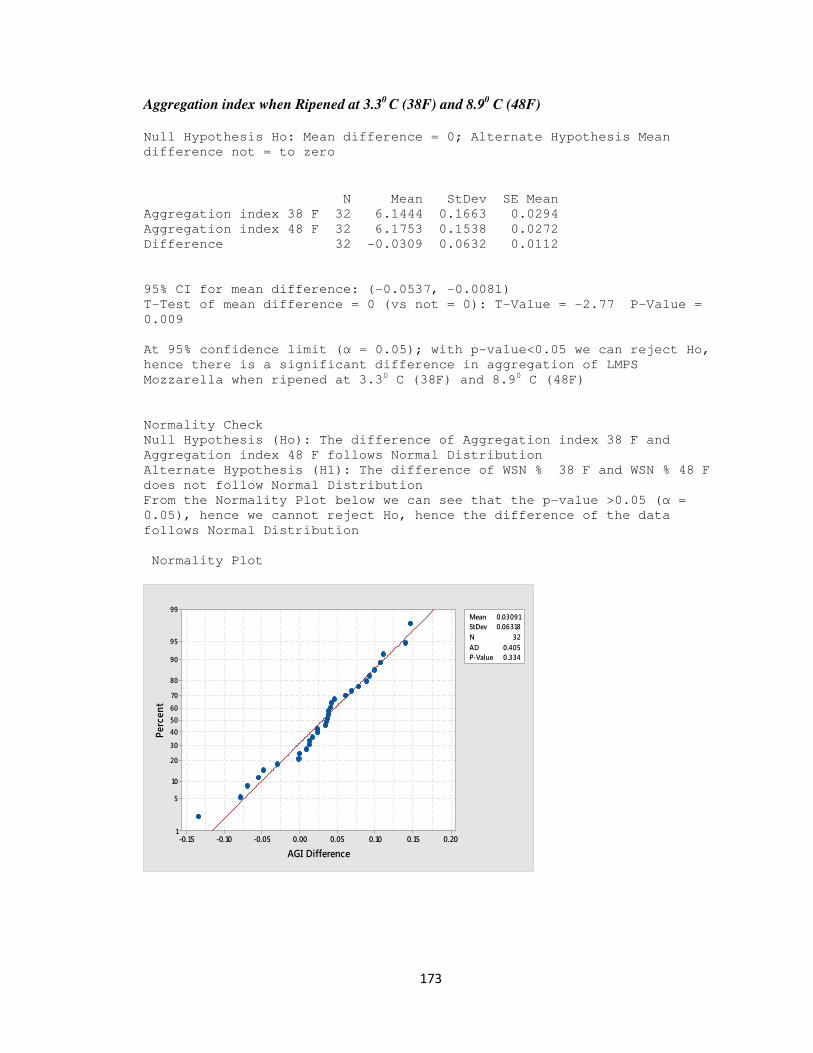
173
Aggregation index when Ripened at 3.30 C (38F) and 8.9
0 C (48F)
Null Hypothesis Ho: Mean difference = 0; Alternate Hypothesis Mean
difference not = to zero
N Mean StDev SE Mean
Aggregation index 38 F 32 6.1444 0.1663 0.0294
Aggregation index 48 F 32 6.1753 0.1538 0.0272
Difference 32 -0.0309 0.0632 0.0112
95% CI for mean difference: (-0.0537, -0.0081)
T-Test of mean difference = 0 (vs not = 0): T-Value = -2.77 P-Value =
0.009
At 95% confidence limit (α = 0.05); with p-value<0.05 we can reject Ho,
hence there is a significant difference in aggregation of LMPS
Mozzarella when ripened at 3.30 C (38F) and 8.90 C (48F)
Normality Check
Null Hypothesis (Ho): The difference of Aggregation index 38 F and
Aggregation index 48 F follows Normal Distribution
Alternate Hypothesis (H1): The difference of WSN % 38 F and WSN % 48 F
does not follow Normal Distribution
From the Normality Plot below we can see that the p-value >0.05 (α =
0.05), hence we cannot reject Ho, hence the difference of the data
follows Normal Distribution
Normality Plot
0.200.150.100.050.00-0.05-0.10-0.15
99
95
90
80
70
60
50
40
30
20
10
5
1
Mean 0.03091
StDev 0.06318
N 32
AD 0.405
P-Value 0.334
AGI Difference
Perc
ent
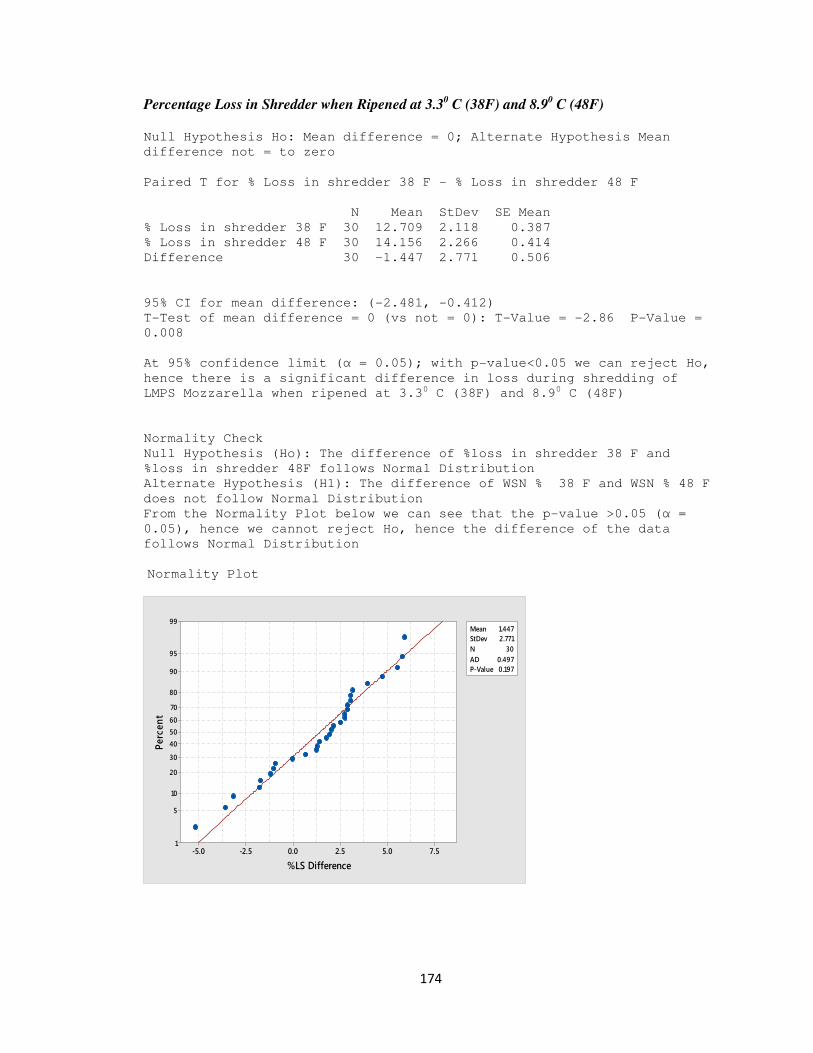
174
Percentage Loss in Shredder when Ripened at 3.30 C (38F) and 8.9
0 C (48F)
Null Hypothesis Ho: Mean difference = 0; Alternate Hypothesis Mean
difference not = to zero
Paired T for % Loss in shredder 38 F - % Loss in shredder 48 F
N Mean StDev SE Mean
% Loss in shredder 38 F 30 12.709 2.118 0.387
% Loss in shredder 48 F 30 14.156 2.266 0.414
Difference 30 -1.447 2.771 0.506
95% CI for mean difference: (-2.481, -0.412)
T-Test of mean difference = 0 (vs not = 0): T-Value = -2.86 P-Value =
0.008
At 95% confidence limit (α = 0.05); with p-value<0.05 we can reject Ho,
hence there is a significant difference in loss during shredding of
LMPS Mozzarella when ripened at 3.30 C (38F) and 8.90 C (48F)
Normality Check
Null Hypothesis (Ho): The difference of %loss in shredder 38 F and
%loss in shredder 48F follows Normal Distribution
Alternate Hypothesis (H1): The difference of WSN % 38 F and WSN % 48 F
does not follow Normal Distribution
From the Normality Plot below we can see that the p-value >0.05 (α =
0.05), hence we cannot reject Ho, hence the difference of the data
follows Normal Distribution
Normality Plot
7.55.02.50.0-2.5-5.0
99
95
90
80
70
60
50
40
30
20
10
5
1
Mean 1.447
StDev 2.771
N 30
AD 0.497
P-Value 0.197
%LS Difference
Perc
ent
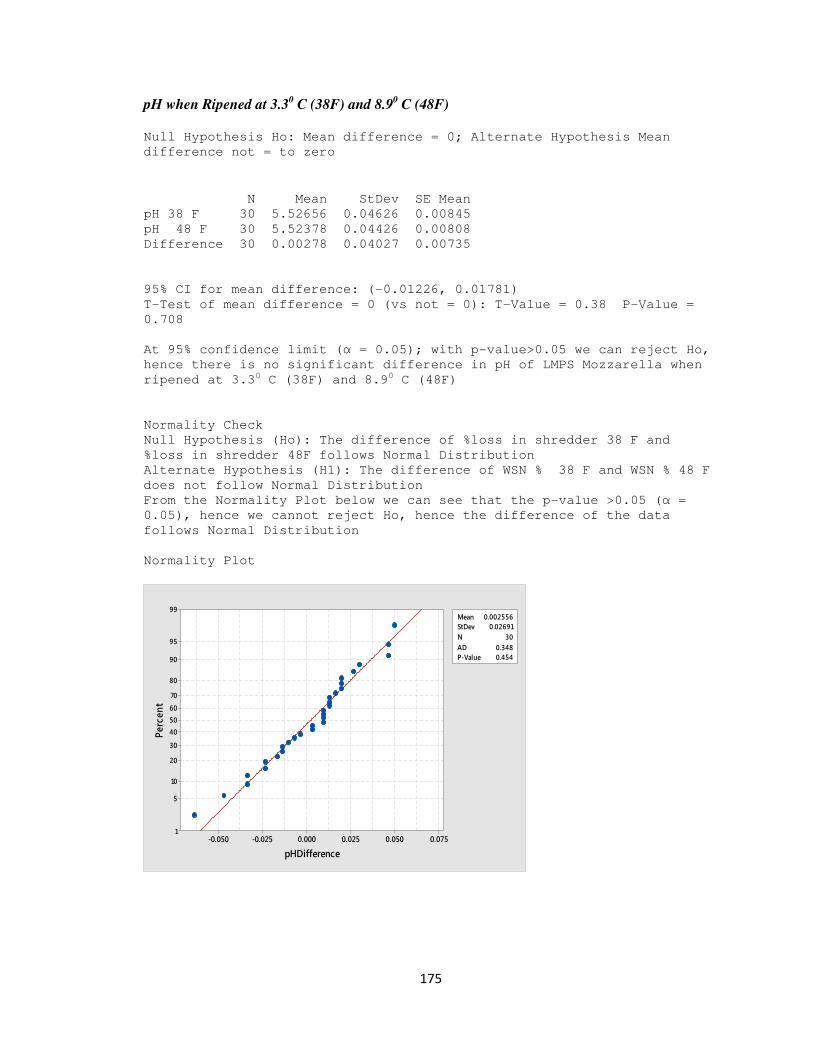
175
pH when Ripened at 3.30 C (38F) and 8.9
0 C (48F)
Null Hypothesis Ho: Mean difference = 0; Alternate Hypothesis Mean
difference not = to zero
N Mean StDev SE Mean
pH 38 F 30 5.52656 0.04626 0.00845
pH 48 F 30 5.52378 0.04426 0.00808
Difference 30 0.00278 0.04027 0.00735
95% CI for mean difference: (-0.01226, 0.01781)
T-Test of mean difference = 0 (vs not = 0): T-Value = 0.38 P-Value =
0.708
At 95% confidence limit (α = 0.05); with p-value>0.05 we can reject Ho,
hence there is no significant difference in pH of LMPS Mozzarella when
ripened at 3.30 C (38F) and 8.90 C (48F)
Normality Check
Null Hypothesis (Ho): The difference of %loss in shredder 38 F and
%loss in shredder 48F follows Normal Distribution
Alternate Hypothesis (H1): The difference of WSN % 38 F and WSN % 48 F
does not follow Normal Distribution
From the Normality Plot below we can see that the p-value >0.05 (α =
0.05), hence we cannot reject Ho, hence the difference of the data
follows Normal Distribution
Normality Plot
0.0750.0500.0250.000-0.025-0.050
99
95
90
80
70
60
50
40
30
20
10
5
1
Mean 0.002556
StDev 0.02691
N 30
AD 0.348
P-Value 0.454
pHDifference
Perc
ent
Related Documents