Verifying Interpretations of Soil Saturation using Hydrologic Measurements Mike Vepraskas Soil Science Dept. NCSU

Welcome message from author
This document is posted to help you gain knowledge. Please leave a comment to let me know what you think about it! Share it to your friends and learn new things together.
Transcript

Verifying Interpretations of Soil Saturation using
Hydrologic Measurements
Mike VepraskasSoil Science Dept.
NCSU

Seasonal High Water Tables
Depth to seasonally-saturated soil layers determines whether soil is:
• Suitable for a home site• A jurisdictional wetland

Determining Depth to Seasonal Saturation
• Find depth to Low Chroma or gray soil colors
• These colors mark the top of the seasonal high water table (SHWT)
Depth of seasonal
high water table

Problems with Using Soil Color to Detect Seasonal Saturation
• Colors are not reliable indicators when soils have been drained.
• We don’t know how often or how long a soil is saturated at a given depth from color alone.

Problems cont’d:New Needs
Land-use assessments may require information on frequency and duration of saturation--over the long term (40+ yrs)

Examples
• Wetlands--must be saturated for 5% of growing season for >5 out of 10 years
• Soils using septic systems-- must not be saturated for >14 d in 7 out of 10 years

Objectives
1. Review a method that calibrates percentages of redox. features (gray colors) to long-term saturation frequency and duration.2. Review applications of results.

Background Chemistry
Redoximorphic features form when:
• Soils are saturated and Fereduction occurs.
Gray color is natural color of soil minerals w/o Fe oxide coatings.

Methods
How to get 40 yrs of daily water table data

4-Step Approach
Calibratemodel to predict water table level
from rainfall
Compute 40 yr of daily
water table levels
Estimate how often soil saturates for critical period/yr
Correlate saturationestimates to soil color
percentages

Basic Idea
Calibrate percentages of redximorphic features to long-term water table data

Soils
• Two sites studied in NC Coastal Plain
• Hillslopes at each site contained plots in well, moderately well, and poorly drained soils (Kandiudults to Paleaquults)

GoldsboroLynchburg: fine-loamyLenoir: fine
Rains: fine-loamyLeaf: fine
Soil Series at Two Sites

Soils cont’d.• Measured the following in 22 soil
plots : daily water table levels, rainfall, and redox potential
• Percentages of redoximorphicfeatures were estimated by eye

Hydrologic Modeling
• DRAINMOD was calibrated for each soil plot
• Calibrated models were used to compute daily water table levels for 40-yr period for each soil plot

Saturation Parameters
• Minimum Duration of Saturation: lag between start of saturation and Fe reduction
• Saturation Frequency: how often the Minimum Duration of Saturation occurs over time
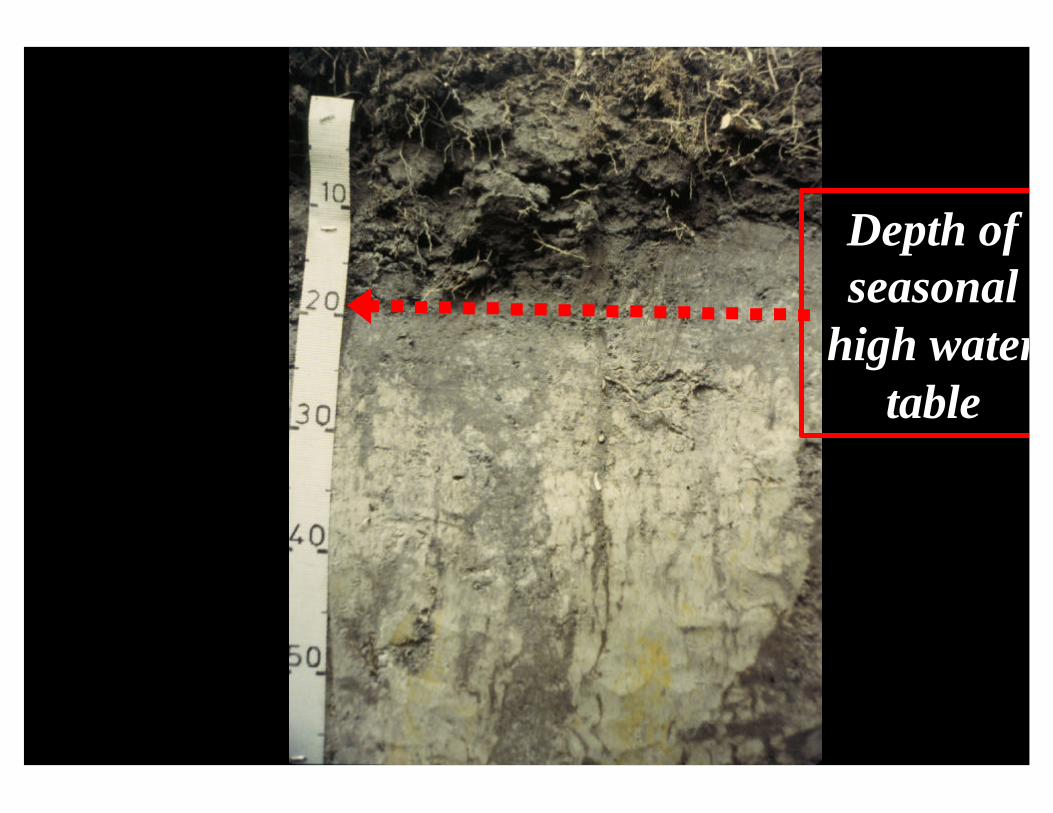
Estimating Minimum Saturation Durations needed to Reduce Fe
• Redox potential was measured to determine when soils were anaerobic and Fe-reduced
• We assumed the dominant Fe mineral was goethite

Dec
Eh
(mv)
Jan
525
Saturation
Fe reduction occurs after 4
weeks
(60 cm)
Aerobic
Reduced
4 wks
Finding Minimum Duration of Saturation
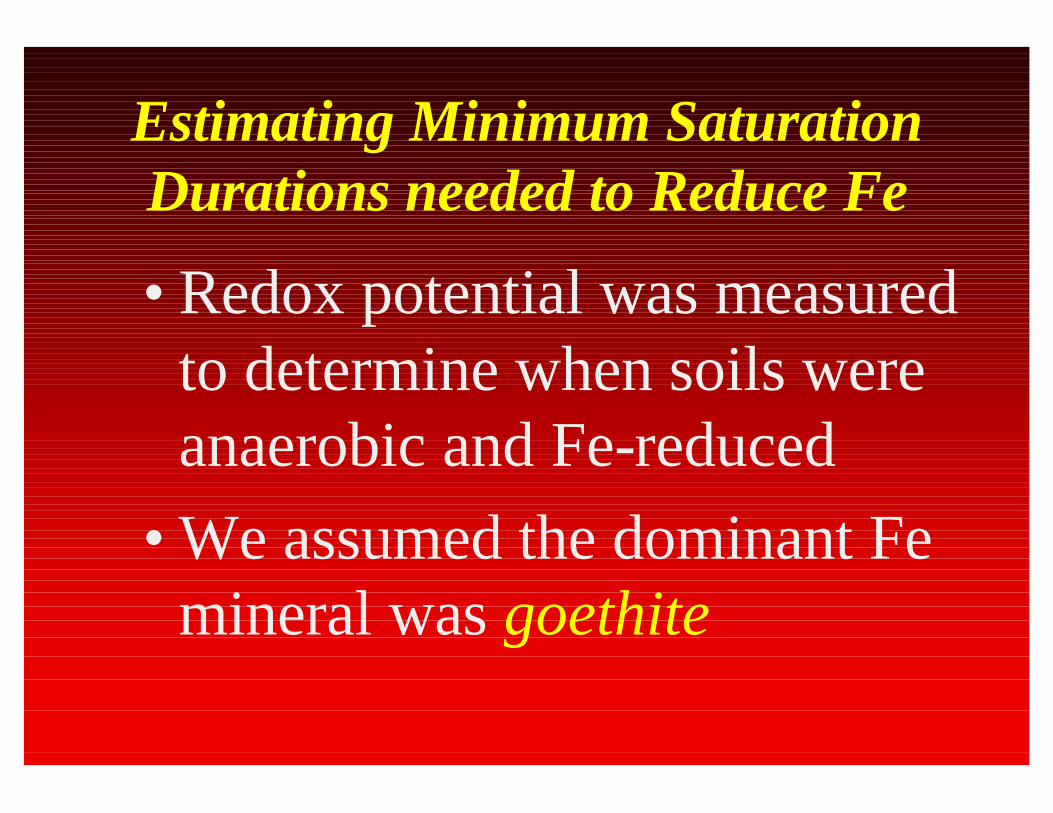
Minimum Durations of Saturation needed for Fe Reduction to Occur
Depth Site 1 Site 2 cm -------------------days-----------------
15 6 4530 21 560 35 21
Mean 21 24

Minimum Durations of Saturation and Fe Reduction
• Vary with depth for a given site
• Average minimum was 21 days (winter)• Shorter durations of saturation may
occur in summer, and where organic matter contents are greater.

0
10
20
30
Jan Aug
Average Daily Soil Temp.
So
il T
emp
(C
0 )
Biological
Zero
Saturation Events
• Needed a single variable that combined saturation frequency and duration
• Variable used was: Saturation Event Index (SE)

Saturation Event Formula
For saturation periods > 21 days:• T= no. of times saturation
occurs/year• D= longest period of saturation
SE= (T-1) + (D/21 d)

Simulation Data for Site 1, Plot 9, 70 cm
Year Frequency Duration SEdays
1959 1 25 11960 1 74 3
--- --- --- ---1998 2 31 2
Mean -- -- 2.2/yr

Example
If a soil at 60 cm had a saturationevent index of 2, then on average over 40 years it might saturate:
• once per year for 42 to 62 days, or • twice per year for 21 to 41 days

Assumption
A long period of saturation and reduction produces the same percentage of gray color as two shorter periods in a soil horizon.

Saturation Events
• Computed by plot for depths of 15, 30, 45, 60, 75, and 90 cm.
• Computed for each year from 1959 to 1998

Saturation Events cont’d.
• Computed for periods: During the growing seasonOutside the growing seasonEntire year
• Mean values (40-yr.) used in regressions

Regression Analyses
Basic equations:• SE = slope x (% redox depletions)
• SE = (A) x (% redox depletions) +(B) x (% redox conc.)

ResultsHow accurate were the
modeling results?

Model Simulation Results
Predicted and measured water table levels differed by
<15 cm for most plotsat both sites over a 3-yr. period

Regression Analyses
Initial data plots showed relationships between SE and Color for a site were:
• Linear• Depth dependent• Soil independent

Regression Results (r2) for Relationship between SaturationEvents and % Redox Depletions
Depth Site 1 Site 2
30 cm ----- 0.98
60 cm 0.94 0.94
90 cm 0.86 0.91

0
5
10
15
20
25
30
0 0.5 1 1.5 2
45cm60cm75cm90cm
Site 1
Satur. Events during growing season
Red
oxde
plet
ions
(%
)

0
5
10
15
20
25
30
0 0.5 1 1.5 2
45cm60cm75cm90cm
Site 1
Satur. Events during growing season
Red
oxde
plet
ions
(%
)

Soil at 75 cmContains 60%
redox depletions,
Has aSaturation
Event Index of 2,and
is saturated for: 42 to 62 d each year

0
5
10
15
20
25
30
0 0.5 1 1.5 2
Satur. Events during growing season
Red
oxde
plet
ions
(%
)
Saturation doesn’t occur each yr

When Saturation Events < 1
Soil saturates for >21 d less often than every year.
• If SE is 0.5, soil saturates every other year.
• If SE is 0.1, soil saturates once in 10 years

0
5
10
15
20
25
30
0 0.5 1 1.5 2
45cm
60cm
75cm
90cm
R2 = 0.95
R2 = 0.92
R2 = 0.82
R2 = 0.80
Sites 1 and 2
Saturation Events per year
Red
ox d
eple
tion
s %

Why Do Lines Have Different Slopes?
Hypothesis: Slopes are related to length of time needed for a saturated soil to become reduced at depth of interest.

0
5
10
15
20
25
30
0 0.5 1 1.5 2
Satur. Events during growing season
Red
oxde
plet
ions
(%
)
Needs 28 dto become reduced
Needs >60 dto become reduced

Objectives
1. Review calibration of gray colors to long-term saturationfrequency and duration.2. Review applications of results.

Relating Hydrographs to SHWT
You may be asked by a judge to verify your predictions of SHWT.This can be done using daily water table measurements during the wet period of a year of normal rainfall.

Water Table Depths
-100
-80
-60
-40
-20
0
0 15 30 45 60 75 90 105 120Julian Days
Dep
th (
cm)
Where do low chroma colors occur?

Find the "21-day Saturation Depth"
-100
-80
-60
-40
-20
0
0 15 30 45 60 75 90 105 120
Julian Days
Dep
th (c
m)

Depth to SHWT is 40 cm
-100
-80
-60
-40
-20
0
0 15 30 45 60 75 90 105 120
Julian Days
Dep
th (c
m)
Gray colors beginat 40 cm

Wetlands
Identified on the basis of three parameters:
•Hydrology
•Soils
•Vegetation

Hydric Soils• Must have been saturated and
anaerobic for part of the growing season
• Identified by color characteristics that are rigidly defined (field indicators)

Relationship of Hydric Soil Field Indicators and Wetland Hydrology
Depleted Matrix field indicator:• A layer of soil within 25 cm of
surface, with >60% redox depletions and > 2% redox conc.


Hydrology needed for a Depleted Matrix
• At site 2, layers with a depleted matrix had a SE index of 1.
• These layers saturate each year during growing season for 21 to 41 days.

Conclusions
• Percentages of redoximorphicfeatures can be calibrated to soil hydrology.
• Relationships vary among soils (sites) with different minimum saturation: Fe reductionrelationships.

Conclusions cont’d.
• Depth to “Seasonal High Water Table” was point where soil wassaturated for “21” consecutive days.

Conclusions cont’d.
• At site 2, the depleted matrixfield indicator could be used to identify soils meeting thewetland hydrology requirement.

The End

Conclusions cont’d.
The “21-day” Technical Standard was accepted in principle by a judge in NC, but modified to 14-days of saturation.

Technical Standard
System for measuring hydrologic, climatic, and soil chemicalproperties to verify morphological interpretations for regulatorypurposes.
Measurements1. Water table levels--daily
preferred for modeling2. Rainfall-daily, onsite3. Redox potential-weekly
(needed for some applications)

Water Table Depths
-100
-80
-60
-40
-20
0
0 15 30 45 60 75 90 105 120Julian Days
Dep
th (
cm)

Duration of Measurements
• Ideal: Long-term preferred (e.g. 40 yrs.) to establish scientific basis for technical standard
• Practical: One wet season

4-Step Approach
For a hillslope of soils:• Calibrated a hydrologic model• Computed water table levels for
40-yr. period

Approach cont’d.
• Computed annual saturation parameters (frequency of critical durations)
• Correlated saturation data to percentages of gray and red soil colors

Goal for Research
• Determine relationships between long-term water table measurements and percentages of redox. features.
• Develop a technical standard to find equivalent depth to SHWT from a hydrograph.

Soils Textures
• At site 1 soil textures were sand, sandy loam, and sandy clay loam
• At site 2 soil textures were silt, silt loam, and silty clay loam.

0
5
10
15
20
25
30
0 0.5 1 1.5 2
45cm60cm75cm90cm
Site 1
Satur. Events during growing season
Red
oxde
plet
ions
(%
)


0
5
10
15
20
25
30
35
40
0 0.5 1 1.5 2
Saturation Events within Growing Season
Site 2
15cm30cm45cm60cm75cm90cm
Red
oxde
plet
ions
(%)
Related Documents