Seasonal Patterns of Body Temperature Daily Rhythms in Group-Living Cape Ground Squirrels Xerus inauris Michael Scantlebury 1,2 *, Marine Danek-Gontard 2 , Philip W. Bateman 1 , Nigel C. Bennett 1 , Mary- Beth Manjerovic 3 , Kenneth E. Joubert 4 , Jane M. Waterman 3,5 1 Mammal Research Institute, Department of Zoology and Entomology, University of Pretoria, Pretoria, South Africa, 2 School of Biological Sciences, Queen’s University Belfast, Belfast, Northern Ireland, United Kingdom, 3 Department of Biology, University of Central Florida, Orlando, Florida, United States of America, 4 Section Pharmacology, Department of Paraclinical Sciences, Faculty of Veterinary Science, University of Pretoria, Pretoria, South Africa, 5 Department of Biological Sciences, University of Manitoba, Winnipeg, Manitoba, Canada Abstract Organisms respond to cyclical environmental conditions by entraining their endogenous biological rhythms. Such physiological responses are expected to be substantial for species inhabiting arid environments which incur large variations in daily and seasonal ambient temperature (T a ). We measured core body temperature (T b ) daily rhythms of Cape ground squirrels Xerus inauris inhabiting an area of Kalahari grassland for six months from the Austral winter through to the summer. Squirrels inhabited two different areas: an exposed flood plain and a nearby wooded, shady area, and occurred in different social group sizes, defined by the number of individuals that shared a sleeping burrow. Of a suite of environmental variables measured, maximal daily T a provided the greatest explanatory power for mean T b whereas sunrise had greatest power for T b acrophase. There were significant changes in mean T b and T b acrophase over time with mean T b increasing and T b acrophase becoming earlier as the season progressed. Squirrels also emerged from their burrows earlier and returned to them later over the measurement period. Greater increases in T b , sometimes in excess of 5uC, were noted during the first hour post emergence, after which T b remained relatively constant. This is consistent with observations that squirrels entered their burrows during the day to ‘offload’ heat. In addition, greater T b amplitude values were noted in individuals inhabiting the flood plain compared with the woodland suggesting that squirrels dealt with increased environmental variability by attempting to reduce their T a -T b gradient. Finally, there were significant effects of age and group size on T b with a lower and less variable T b in younger individuals and those from larger group sizes. These data indicate that Cape ground squirrels have a labile T b which is sensitive to a number of abiotic and biotic factors and which enables them to be active in a harsh and variable environment. Citation: Scantlebury M, Danek-Gontard M, Bateman PW, Bennett NC, Manjerovic M-B, et al. (2012) Seasonal Patterns of Body Temperature Daily Rhythms in Group-Living Cape Ground Squirrels Xerus inauris. PLoS ONE 7(4): e36053. doi:10.1371/journal.pone.0036053 Editor: Mark Briffa, University of Plymouth, United Kingdom Received December 30, 2011; Accepted March 26, 2012; Published April 27, 2012 Copyright: ß 2012 Scantlebury et al. This is an open-access article distributed under the terms of the Creative Commons Attribution License, which permits unrestricted use, distribution, and reproduction in any medium, provided the original author and source are credited. Funding: This research was funded by a National Research Foundation Grant IBN0130600 and a Natural Science and Engineering Research Council of Canada Discovery Grant to JMW, a National Research Foundation-SAR Chair to NCB and a University of Pretoria PDRF to MS. The funders had no role in study design, data collection and analysis, decision to publish, or preparation of the manuscript. Competing Interests: The authors have declared that no competing interests exist. * E-mail: [email protected] Introduction Organisms respond to cyclical variation in environmental conditions by entraining their endogenous biological rhythms [1,2]. One such rhythm in endothermic species is that of body temperature (T b ), which is considered to be a consequence of the balance between heat production and heat dissipation [3]. In many taxa, T b daily rhythms are influenced by diel and seasonal changes in photoperiod and ambient temperature (T a ) [4–9]. Indeed, the primary cues for seasonal acclimatization of the thermoregulatory system, which include changes in T b daily rhythms, are photoperiod and temperature [10,11]. Interestingly, little is known about which selective pressures may affect the evolution of heterothermy in endotherms. Indeed, it is unclear whether one should examine the effects of environmental variation on raw T b data or use some index which can be comparable across species (e.g. ‘Heterothermy Index’, ‘HI’ [12]). Angilletta et al. (2010) [13] suggest that future empirical work should examine the potential ‘‘selective pressures imposed by regional and temporal heterothermy’’. They identify several potential candidates which might cause T b variations to evolve which include food and water availability, T a and social huddling. For example, restricted food and water supplies and low T a values should favor energy-saving reductions in T b and temporal heterothermy. Implicit in their arguments is the fact that extremes of variation in T a and in particular cyclical variations in T a may result in adaptive variation in T b daily rhythms [13–16]. For group-living animals, behaviors such as social huddling may be one mechanism to conserve water and energy [17,18]. Minimization of thermoregulatory costs and water loss are thus seen as a possible selective pressure for aggregation [19–21]. For instance, huddling in newborn rabbit (Oryctolagus cuniculus) pups not only saves energy but also affects T b daily rhythms [22]. Hence, T b daily rhythms are likely to be affected by group size in social animals. The open thorn scrub savannah ecosystem of southern Africa is subject to wide diel and annual variations in temperature across seasons, often reaching above 40uC during the summer and below freezing during the winter [23]. In this habitat, large open areas PLoS ONE | www.plosone.org 1 April 2012 | Volume 7 | Issue 4 | e36053

Welcome message from author
This document is posted to help you gain knowledge. Please leave a comment to let me know what you think about it! Share it to your friends and learn new things together.
Transcript
Seasonal Patterns of Body Temperature Daily Rhythms inGroup-Living Cape Ground Squirrels Xerus inaurisMichael Scantlebury1,2*, Marine Danek-Gontard2, Philip W. Bateman1, Nigel C. Bennett1, Mary-
Beth Manjerovic3, Kenneth E. Joubert4, Jane M. Waterman3,5
1 Mammal Research Institute, Department of Zoology and Entomology, University of Pretoria, Pretoria, South Africa, 2 School of Biological Sciences, Queen’s University
Belfast, Belfast, Northern Ireland, United Kingdom, 3 Department of Biology, University of Central Florida, Orlando, Florida, United States of America, 4 Section
Pharmacology, Department of Paraclinical Sciences, Faculty of Veterinary Science, University of Pretoria, Pretoria, South Africa, 5 Department of Biological Sciences,
University of Manitoba, Winnipeg, Manitoba, Canada
Abstract
Organisms respond to cyclical environmental conditions by entraining their endogenous biological rhythms. Suchphysiological responses are expected to be substantial for species inhabiting arid environments which incur large variationsin daily and seasonal ambient temperature (Ta). We measured core body temperature (Tb) daily rhythms of Cape groundsquirrels Xerus inauris inhabiting an area of Kalahari grassland for six months from the Austral winter through to thesummer. Squirrels inhabited two different areas: an exposed flood plain and a nearby wooded, shady area, and occurred indifferent social group sizes, defined by the number of individuals that shared a sleeping burrow. Of a suite of environmentalvariables measured, maximal daily Ta provided the greatest explanatory power for mean Tb whereas sunrise had greatestpower for Tb acrophase. There were significant changes in mean Tb and Tb acrophase over time with mean Tb increasingand Tb acrophase becoming earlier as the season progressed. Squirrels also emerged from their burrows earlier andreturned to them later over the measurement period. Greater increases in Tb, sometimes in excess of 5uC, were noted duringthe first hour post emergence, after which Tb remained relatively constant. This is consistent with observations that squirrelsentered their burrows during the day to ‘offload’ heat. In addition, greater Tb amplitude values were noted in individualsinhabiting the flood plain compared with the woodland suggesting that squirrels dealt with increased environmentalvariability by attempting to reduce their Ta-Tb gradient. Finally, there were significant effects of age and group size on Tb
with a lower and less variable Tb in younger individuals and those from larger group sizes. These data indicate that Capeground squirrels have a labile Tb which is sensitive to a number of abiotic and biotic factors and which enables them to beactive in a harsh and variable environment.
Citation: Scantlebury M, Danek-Gontard M, Bateman PW, Bennett NC, Manjerovic M-B, et al. (2012) Seasonal Patterns of Body Temperature Daily Rhythms inGroup-Living Cape Ground Squirrels Xerus inauris. PLoS ONE 7(4): e36053. doi:10.1371/journal.pone.0036053
Editor: Mark Briffa, University of Plymouth, United Kingdom
Received December 30, 2011; Accepted March 26, 2012; Published April 27, 2012
Copyright: � 2012 Scantlebury et al. This is an open-access article distributed under the terms of the Creative Commons Attribution License, which permitsunrestricted use, distribution, and reproduction in any medium, provided the original author and source are credited.
Funding: This research was funded by a National Research Foundation Grant IBN0130600 and a Natural Science and Engineering Research Council of CanadaDiscovery Grant to JMW, a National Research Foundation-SAR Chair to NCB and a University of Pretoria PDRF to MS. The funders had no role in study design, datacollection and analysis, decision to publish, or preparation of the manuscript.
Competing Interests: The authors have declared that no competing interests exist.
* E-mail: [email protected]
Introduction
Organisms respond to cyclical variation in environmental
conditions by entraining their endogenous biological rhythms
[1,2]. One such rhythm in endothermic species is that of body
temperature (Tb), which is considered to be a consequence of the
balance between heat production and heat dissipation [3]. In
many taxa, Tb daily rhythms are influenced by diel and seasonal
changes in photoperiod and ambient temperature (Ta) [4–9].
Indeed, the primary cues for seasonal acclimatization of the
thermoregulatory system, which include changes in Tb daily
rhythms, are photoperiod and temperature [10,11]. Interestingly,
little is known about which selective pressures may affect the
evolution of heterothermy in endotherms. Indeed, it is unclear
whether one should examine the effects of environmental variation
on raw Tb data or use some index which can be comparable across
species (e.g. ‘Heterothermy Index’, ‘HI’ [12]). Angilletta et al.
(2010) [13] suggest that future empirical work should examine the
potential ‘‘selective pressures imposed by regional and temporal
heterothermy’’. They identify several potential candidates which
might cause Tb variations to evolve which include food and water
availability, Ta and social huddling. For example, restricted food
and water supplies and low Ta values should favor energy-saving
reductions in Tb and temporal heterothermy. Implicit in their
arguments is the fact that extremes of variation in Ta and in
particular cyclical variations in Ta may result in adaptive variation
in Tb daily rhythms [13–16]. For group-living animals, behaviors
such as social huddling may be one mechanism to conserve water
and energy [17,18]. Minimization of thermoregulatory costs and
water loss are thus seen as a possible selective pressure for
aggregation [19–21]. For instance, huddling in newborn rabbit
(Oryctolagus cuniculus) pups not only saves energy but also affects Tb
daily rhythms [22]. Hence, Tb daily rhythms are likely to be
affected by group size in social animals.
The open thorn scrub savannah ecosystem of southern Africa is
subject to wide diel and annual variations in temperature across
seasons, often reaching above 40uC during the summer and below
freezing during the winter [23]. In this habitat, large open areas
PLoS ONE | www.plosone.org 1 April 2012 | Volume 7 | Issue 4 | e36053
are interspersed with occasional stands of trees and bushes that
generally concentrate in depressions around pans and dry river
beds [24]. These areas are likely to present different microclimatic
conditions due in part to differences in exposure to solar radiation
[25]. Small mammals that inhabit this region, such as the Cape
ground squirrel (Xerus inauris), exhibit typical arid adaptations
including a low resting metabolic rate, a high thermal conductance
and a concentrated urine [26,27]. They are active year-round and
forage during the heat of the day. It has been suggested that they
use both behavioral and physiological means to deal with the
extremes of Ta they encounter [28–30]. For example, they may be
active during hot summer days because they periodically dissipate
body heat by retreating to cooler burrows [31]. Therefore, it is
likely that their Tb will vary considerably, both on a daily and a
yearly basis, as a physiological adaptation to reduce the Ta-Tb
gradient [5,32,33]. However, it is unknown how this is related to
microhabitat and behavior, such as the time animals emerge in the
morning and how they may interact socially with one another.
Here we investigated the role of Tb daily rhythms as a response
to seasonal and diel changes in Ta in Cape ground squirrels that
inhabit a habitat mosaic exposed to large daily and annual
temperature fluctuations. Our hypotheses were related to the
middle (mesor); the amplitude and the acrophase (time of the peak)
of Tb daily rhythms [34]. We predicted that: (a) seasonal
differences in Tb daily rhythms would be apparent with higher
mesor values and later acrophase times during the spring and
summer; (b) rapid changes in Tb would be apparent in the early
mornings (after emergence) and a Tb would be maintained at a
constant level throughout the daylight hours because animals will
move into and out of cooler locations such as their burrows as part
of their thermoregulatory behavior; (c) lower mesor and amplitude
values of Tb would be observed in a shaded compared with an
open habitat; and (d) winter mesor values would be higher in
animals from larger group sizes because of the thermoregulatory
benefits gained from huddling at night. In addition, we examined
the potential seasonal variation in HI values from individuals
inhabiting different locations and from different group sizes to
gauge whether or not relationships that emerge when analyzing Tb
data are also manifest when using this index.
Materials and Methods
Ethics statementPermission was granted from South Africa Northwest Parks and
Tourism to conduct the field research. The protocol was approved
by committee on the ethics of animal experiments of the
Universities of Central Florida and Pretoria (permit number
UCF IACUC #07-43W). The study was performed in accordance
with the recommendations in the Guide for the Care and Use of
Laboratory Animals of the National Institutes of Health.
Animals and study siteCape ground squirrels are small (,600 g), non-hibernating,
diurnal, social rodents that inhabit arid regions of sub-Saharan
Africa [35–37]. They are cooperative breeders with low
reproductive skew and a high operational sex ratio. Groups
typically consist of 1–6 related females and their sub adult and
juvenile offspring, which share a burrow cluster [35,38]. The study
took place at S. A. Lombard Nature Reserve (3,660 ha, 18 km
north west of Bloemhof, South Africa, 27u359S, 25u239E) as part of
an on-going study where squirrels have been studied since 2002.
The site comprises Cymbopogon-Themeda veld and Kalahari
grasslands, and is situated on a flood plain [24]. Mean annual
precipitation is 500 mm [39]. Animals were trapped from groups
at two locations: an open unshaded area – ‘‘the flood plain’’ – and
a habitat containing Acacia karoo and A. erioloba stands – ‘‘the
woodland’’, which was approximately 2 km away [40]. Toma-
hawk wire-mesh traps (15615650 cm) baited with peanut butter
were used to catch animals, after which they were freeze-marked
for unique identification (Quick Freeze, Miller-Stephenson
Chemical Co., Danbury, CT [41]) and implanted with transpon-
ders (PIT tags, AVID Inc., Norco, CA). The sides of animals were
also painted with various shapes using black hair dye (Rodol D,
Lowenstein & Sons Inc., New York, NY) so their identities could
be seen at a distance. Body mass was recorded along with the size
of the social groups to which animals belonged. Trapping took
place for two one-week periods during May and October. Age was
assessed by knowing dates of first emergence from the natal
burrow [35,42]. Behavioral observations, including times of
emergence and immergence from burrows were obtained as
outlined in Waterman [37]. Briefly, this involved recording time
budgets of individual animals by focal sampling in which all-
occurrence data were recorded for periods of up to 20 minutes
whereas the activities of all the individuals within a group were
recorded every five minutes by scan sampling [43]. We were
interested in many different aspects, but in particular movement
and foraging activities as well as aggressive, reproductive and
social/dominance interactions between individuals.
Acquisition of body temperature (Tb) dataTen squirrels (five sub adults and five adults) were obtained
from the flood plain and 10 (also five adults and five sub adults)
from the woodland. Sub adults are defined as animals between six
months after first emergence from the natal burrow and sexual
maturity (around eight months for males and nine months for
females); adults are individuals which have reached sexual
maturity [38]. Miniature temperature recording iButtonH data-
loggers (DS1922L60.0625uC; Thermochron, Dallas Semiconduc-
tors, Maxim Integrated Products, Inc., Sunnyvale, CA) were
surgically implanted into the peritoneal cavity of each individual
under anaesthesia (see below). Prior to surgery, devices were
calibrated using an APPA 51 digital thermometer in a water bath.
They were set to record every 60 min providing 23 weeks of
continuous recordings. Dataloggers were then coated with medical
grade surgical wax (ELVAX) [44] and sterilized with formalde-
hyde vapor. Measurements of Tb were recorded between May 17th
and October 28th 2006.
Squirrels were anaesthetized with medetomidine (Domitor,
Pfizer Laboratories (PTY) Ltd, Sandton) (67.669.2 mg/kg),
ketamine (Anaket V, Centaur Laboratories (PTY) Ltd, Isando)
(13.661.9 mg/kg) and buprenorphine (Temgesic, Ricketts Labo-
ratories, Isando) (0.560.06 mg/kg) [45]. Anesthesia was induced
after 3.161.4 minutes. The abdomen was surgically prepared with
a chlorhexidine scrub (Hibiscrub, ICL Laboratories), then with
chlorhexidine and alcohol (Hibitane, ICI Laboratories). A midline
celiotomy was performed for insertion of the dataloggers. The
linea alba was closed with 4/0 polydioxanone (PDS, Ethicon,
Midrand) and the skin was closed with an intercuticular suture
pattern with 4/0 polydioxanone. The procedure for each
individual lasted approximately 20 minutes. At the end of the
surgical procedure, anesthesia was reversed with atipamezole
(Antisedan, Pfizer Laboratories) (232692 mg/kg). Recovery oc-
curred within 3.562.2 minutes. This procedure was followed for
removal of dataloggers for the case of five animals that were
recaptured. Three other recaptured animals were euthanized with
an overdose of halothane upon recapture as part of a different
study [46]. Only eight of the total 20 animals implanted were
recaptured. After removal of dataloggers, Tb data were down-
Body Temperature Daily Rhythms in Squirrels
PLoS ONE | www.plosone.org 2 April 2012 | Volume 7 | Issue 4 | e36053
loaded using iButtonH-TMEX software version 3.21 (2004 Dallas
Semiconductor MAXIM Corporation). All animals were observed
overnight after implantation and removal of dataloggers and
returned to their capture site the following morning. No animal
died due to surgical procedures during this period.
Ambient temperature and daylight measurementsAmbient air temperature (Ta) was determined using two
methods. We set dataloggers to record every hour for the first
84 days (12 weeks) of the sampling period. One datalogger was
used per study site. Dataloggers were placed inside Stevenson
screens located 90 cm above the ground. To obtain data over a
longer time period, we used daily minimum, maximum and mean
ambient temperatures recorded at Bloemhof 27.65 S, 25.60 E,
GMT +2 (South African Weather Bureau, Pretoria) for the entire
23 weeks of the sampling period; mean hours of sunlight as well as
the times of sunrise (civil dawn) and sunset (civil dusk) were also
noted. In an attempt to measure underground temperatures, we
also placed two dataloggers inside what we thought were disused
squirrel burrows. However, these devices did not provide useful
information because the burrows were not vacant; squirrels
removed them from the burrows and they were found in spoil
heaps on the surface.
Data analysesCosinor analysis was used to determine the Tb daily rhythms of
the individuals measured [34,47]. The mean mesor, amplitude
and acrophase values of the Tb daily rhythms were calculated for
every individual for each of the 23 weeks of the study period
(‘Tbmesor’, ‘Tbamplitude’ and ‘Tbacrophase’, respectively). The
significances of the fitted curves were tested against the null
hypothesis that the amplitude was zero [48]. The variability in the
data that could be accounted for by the fitted curve (percentage
rhythm) was calculated. In addition, we calculated the HI values
for each animal for each week of the study and assessed whether
there were any relationships between HI and season, age or group
size. Statistical analyses were performed using SPSS 17 (SPSS Inc.,
Chicago, IL, U.S.A.). Mean values are reported 6 standard
deviations.
(1) Seasonal variation in Tb daily rhythms. Linear mixed
models were used to examine the variation in Tb cosinor
parameters (mesor, amplitude, acrophase) as a function of time
(over the 23 week period). Each dependent variable was analyzed
separately. ‘Individual ID’ was included as a random factor to
avoid pseudoreplication and to correct for repeated
measurements. ‘Week’ was included as fixed covariate. As
several explanatory terms and their interactions were
investigated, models were selected in a stepwise backward
fashion, removing the least significant explanatory terms until
the most parsimonious model was obtained, determined by
Akaike’s information criterion (AIC). Interaction terms were only
included when they were significant.
(2) Effect of light and ambient temperature (Ta) on body
temperature (Tb) daily rhythms. Linear Mixed Models were
used to examine the effects of light and Ta on the mean weekly
cosinor parameters. First, we obtained several measures of Ta: the
daily minimum (Tamin), the daily maximum (Tamax) and the
daily mean value (Tamean) (South African Weather Bureau). We
then calculated weekly averages of Tamin, Tamax and Tamean
and included each of these in a model with individual identity as a
random factor and week as a fixed effect. This corrected for
repeated measurements and differences in mean values between
individuals. All potential interactions between temperature
variables were included. Models were selected by removing the
least significant explanatory terms sequentially until the most
parsimonious model was obtained using AIC. Each dependent
cosinor variable was analyzed separately. Second, we assessed the
effects of various ‘light’ variables on the cosinor variable. The light
variables we used were: the weekly average time of sunrise, the
weekly average time of sunset and the weekly average length of the
photophase. As before, models were selected using AIC by
removing least significant explanatory terms sequentially. Finally,
for each of the dependent cosinor variables, combined models
were undertaken which included the factors with most explanatory
power from both the individual Ta models and the individual light
models. Again, for each analysis the best model was obtained using
AIC.
(3) Relationship between emergence and immergence
times and Tb daily rhythms. Emergence and immergence
times for the two habitats were calculated as the mean observed
emergence and immergence time of groups of squirrels inhabiting
both areas [35]. Data were collected over seven months of detailed
observation time recording when individual squirrel groups from
the two habitats emerged or immerged. An average of 8.160.65
squirrels from different groups were observed every week to
calculate emergence times and 5.760.81 squirrels from different
groups were observed every week to calculate immergence times.
Temporal variation in mean emergence and immergence times
was investigated using linear regressions. In order to determine
how daily variations in Tb were related to the times of emergence
and whether this differed throughout the year, we computed, for
each day, the mean Tb of each individual one hour before the time
of emergence and the mean Tb one hour after the time of
emergence. The difference in Tb between these two values was
then calculated as a percent of the maximum amplitude difference
in Tb for that individual for that day. The mean percent Tb
change for each individual was then calculated for each week, after
which the mean change for all individuals was calculated for the
23 weeks.
(4) Effect of habitat on Ta and Tb daily rhythms. To
examine whether mean daily Ta differed between the flood plain
and the woodland we conducted linear mixed models with habitat
as a fixed factor, week as time and Ta measured at both study sites
as the dependent variable. To determine whether high values of
Ta obtained during the day or low values obtained during the
night differed between the two habitats we included day/night as
an additional fixed factor. The hourly Ta obtained at both study
sites were considered as being ‘daytime’ Ta if the measurement
was taken between the sunrise and sunset of a given day, and
‘night-time’ Ta if the measure was taken between sunset and
sunrise time between two consecutive days. An average Ta was
then determined for each daytime and each night-time period for
the 84 days (12 weeks) of the sampling period. To examine the
effect of habitat on mean weekly Tb values and cosinor
parameters, we included ‘habitat’ and ‘day/night’ as a fixed
factors, ‘individual’ as random variable and ‘week’ as factor.
(5) Effect of age and group size on Tb daily
rhythms. Effects of age and group size on Tbmean, Tbmesor,
Tbamplitude, Tbacrophase and HI were conducted using linear
mixed models with ‘individual’ as a random variable and ‘week’ as
factor. Models were selected in a stepwise manner using AIC as
described previously. Age (adult/sub adult) was included as a
categorical factor and group size as a continuous variable.
Results
Of the 20 individuals originally implanted with dataloggers,
eight were recaptured; six from the flood plain (two adults, four
Body Temperature Daily Rhythms in Squirrels
PLoS ONE | www.plosone.org 3 April 2012 | Volume 7 | Issue 4 | e36053
sub adults) and two from the woodland (two adults). Group sizes
(i.e. the sizes of groups in which the eight animals lived) ranged
from one to nine individuals. The implanted animals were
regularly observed during the two weeks following implantation
and no mortality or immigration was observed. We observed no
signs of different behavior of the implanted squirrels compared to
the others. There were significant daily rhythms of Tb in all of the
eight individuals measured (Table 1, Fig. 1) with mean 6SD
values of the mesor, amplitude and acrophase for the 23 week
measurement period of 37.5160.15uC, 1.1360.08uC and
12:3362 min, respectively.
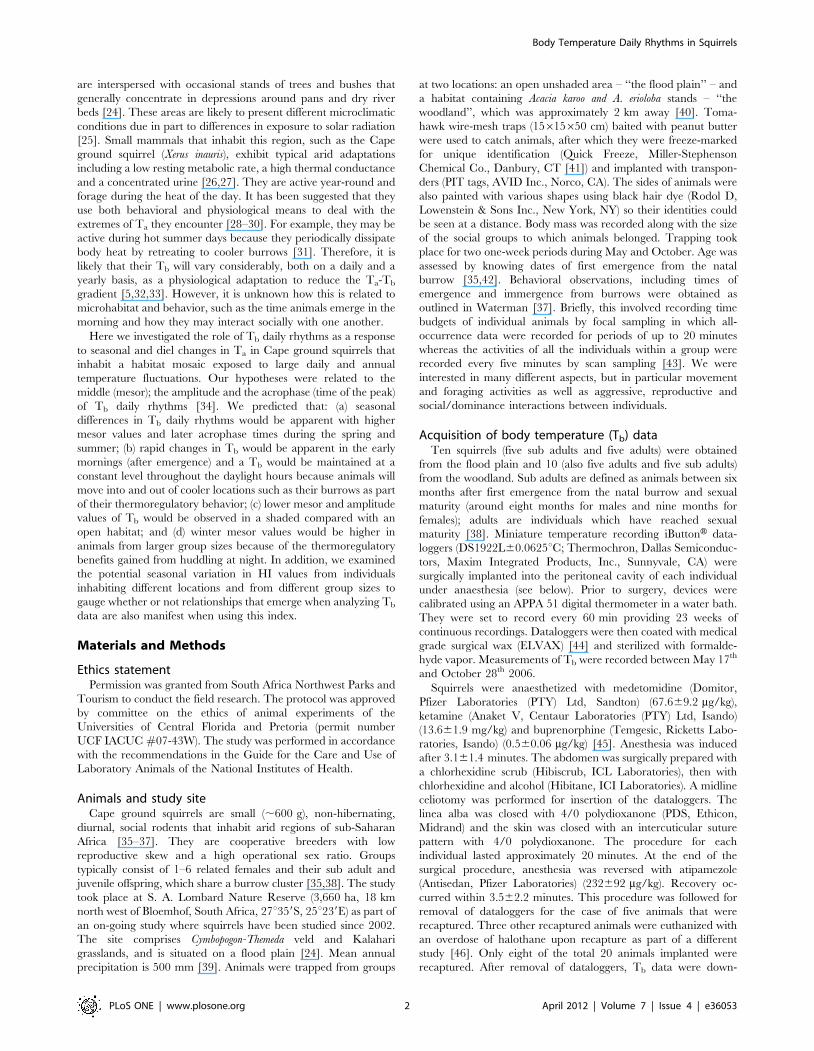
(1) Seasonal variation in Tb daily rhythmsThere were significant effects of both ‘week’ and ‘individual’ on
Tbmesor and Tbacrophase (F1,175 = 35.86, p,0.001 and
F7,175 = 8.51, p,0.001 respectively; Fig. 2A, 2C) indicating that
mesor values increased significantly and acrophase values became
earlier over the time period, and that these values differed between
individuals. There was also a significant interaction between
individual and week on Tbamplitude (F7,168 = 2.60, p,0.05;
Fig. 2B) indicating that changes in amplitude differed between
individuals over time.
(2) Effect of light and Ta on Tb daily rhythmsMean Ta values ranged from 7.061.4uC during the first week to
21.160.43uC during the last with daily minimum and maximum
values of 23uC and 22uC, and 9uC and 36uC respectively
(Fig. 2D). By comparison, mean Tb ranged from 37.3760.11uCduring the first week to 37.7060.12uC during the last. This
corresponded to minimum and maximum Tb values of 34.28 and
40.11uC, and 35.64uC and 41.23uC, respectively (Fig. 2A).
When the effects of ambient conditions on Tb were examined
the only ‘temperature’ variable (of Tamin, Tamean and Tamax)
that significantly influenced Tbmesor was Tamax (F1,60 = 23.87,
p,0.001). Similarly, the only ‘light’ variable that significantly
affected Tbmesor was the time of sunset (F1,99 = 23.72, p,0.001).
When both explanatory terms were included into the same model,
neither had a significant effect (p.0.1 in both cases). In contrast,
although Tamax had a significant effect on Tbamplitude
(F1,53 = 12.43, p,0.01), Tamean and sunrise were the factors that
significantly affected Tbacrophase (F1,64 = 29.80, p,0.001 and
F1,78 = 42.05, p,0.001 respectively), with sunrise being the most
important factor in the combined model (F1,45 = 10.90, p,0.01).
(3) Relationships between emergence and immergencetimes and Tb daily rhythms
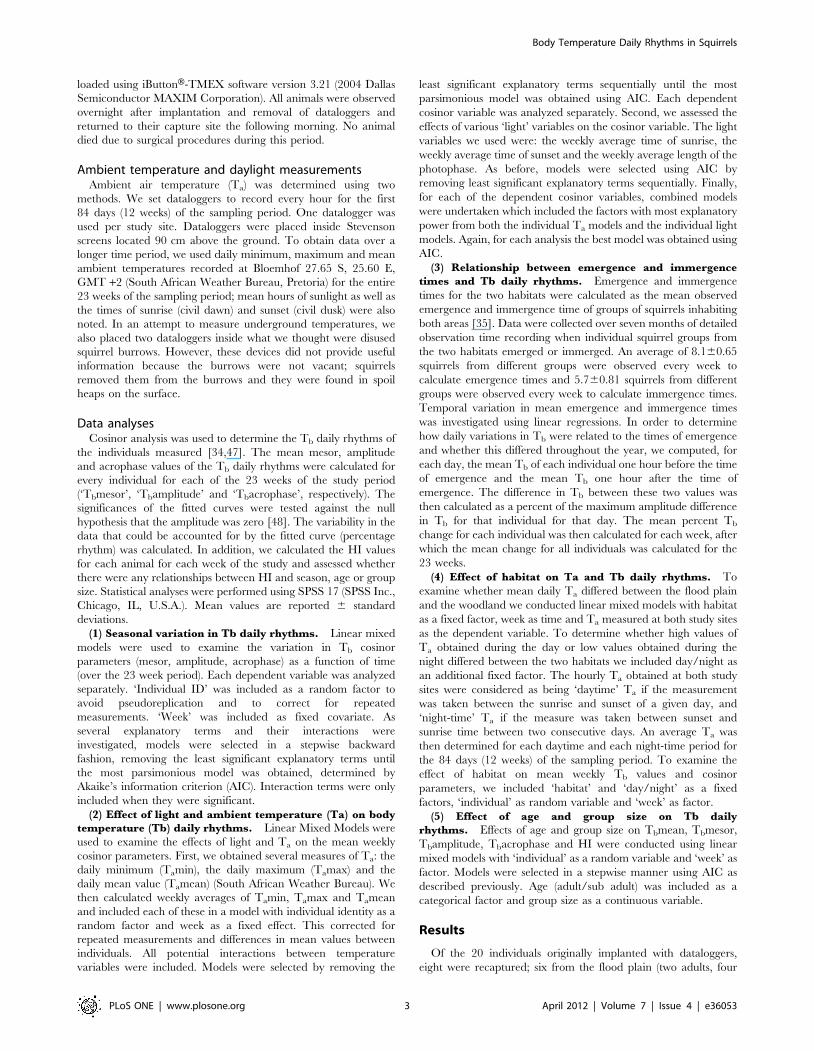
Animals emerged later in the day at the beginning of the
measurement period (07:44) (May), than at the end (October)
(06:40) (least-squares regression, F1,46 = 63.25, r2 = 0.579,
p,0.001). In contrast, immergence times occurred earlier in the
day at the beginning of the measurement period (17:24) than at the
end (18:17) (F1,45 = 103.02, r2 = 0.696, p,0.001)(Fig. 3). There
were no differences in emergence and immergence times between
animals that inhabited the flood plain and the woodland
(emergence: F1,46 = 0.19, p = 0.662; immergence: F1,45 = 0.17,
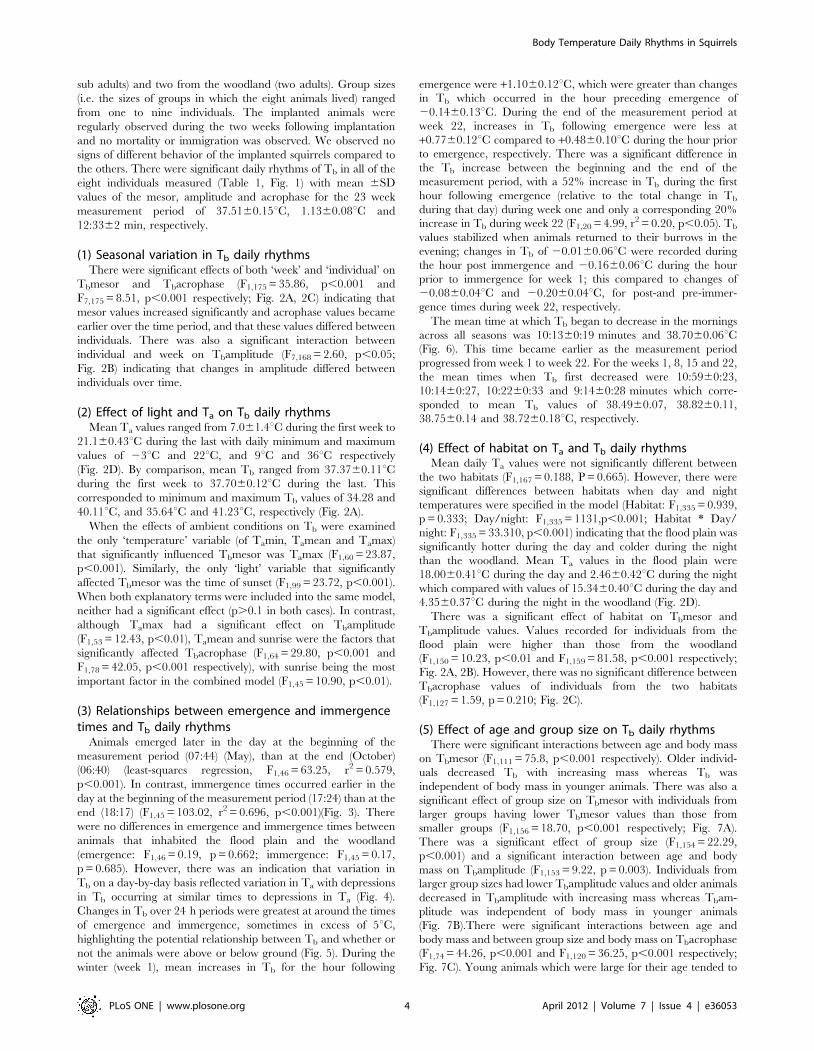
p = 0.685). However, there was an indication that variation in
Tb on a day-by-day basis reflected variation in Ta with depressions
in Tb occurring at similar times to depressions in Ta (Fig. 4).
Changes in Tb over 24 h periods were greatest at around the times
of emergence and immergence, sometimes in excess of 5uC,
highlighting the potential relationship between Tb and whether or
not the animals were above or below ground (Fig. 5). During the
winter (week 1), mean increases in Tb for the hour following
emergence were +1.1060.12uC, which were greater than changes
in Tb which occurred in the hour preceding emergence of
20.1460.13uC. During the end of the measurement period at
week 22, increases in Tb following emergence were less at
+0.7760.12uC compared to +0.4860.10uC during the hour prior
to emergence, respectively. There was a significant difference in
the Tb increase between the beginning and the end of the
measurement period, with a 52% increase in Tb during the first
hour following emergence (relative to the total change in Tb
during that day) during week one and only a corresponding 20%
increase in Tb during week 22 (F1,20 = 4.99, r2 = 0.20, p,0.05). Tb
values stabilized when animals returned to their burrows in the
evening; changes in Tb of 20.0160.06uC were recorded during
the hour post immergence and 20.1660.06uC during the hour
prior to immergence for week 1; this compared to changes of
20.0860.04uC and 20.2060.04uC, for post-and pre-immer-
gence times during week 22, respectively.
The mean time at which Tb began to decrease in the mornings
across all seasons was 10:1360:19 minutes and 38.7060.06uC(Fig. 6). This time became earlier as the measurement period
progressed from week 1 to week 22. For the weeks 1, 8, 15 and 22,
the mean times when Tb first decreased were 10:5960:23,
10:1460:27, 10:2260:33 and 9:1460:28 minutes which corre-
sponded to mean Tb values of 38.4960.07, 38.8260.11,
38.7560.14 and 38.7260.18uC, respectively.
(4) Effect of habitat on Ta and Tb daily rhythmsMean daily Ta values were not significantly different between
the two habitats (F1,167 = 0.188, P = 0.665). However, there were
significant differences between habitats when day and night
temperatures were specified in the model (Habitat: F1,335 = 0.939,
p = 0.333; Day/night: F1,335 = 1131,p,0.001; Habitat * Day/
night: F1,335 = 33.310, p,0.001) indicating that the flood plain was
significantly hotter during the day and colder during the night
than the woodland. Mean Ta values in the flood plain were
18.0060.41uC during the day and 2.4660.42uC during the night
which compared with values of 15.3460.40uC during the day and
4.3560.37uC during the night in the woodland (Fig. 2D).
There was a significant effect of habitat on Tbmesor and
Tbamplitude values. Values recorded for individuals from the
flood plain were higher than those from the woodland
(F1,150 = 10.23, p,0.01 and F1,159 = 81.58, p,0.001 respectively;
Fig. 2A, 2B). However, there was no significant difference between
Tbacrophase values of individuals from the two habitats
(F1,127 = 1.59, p = 0.210; Fig. 2C).
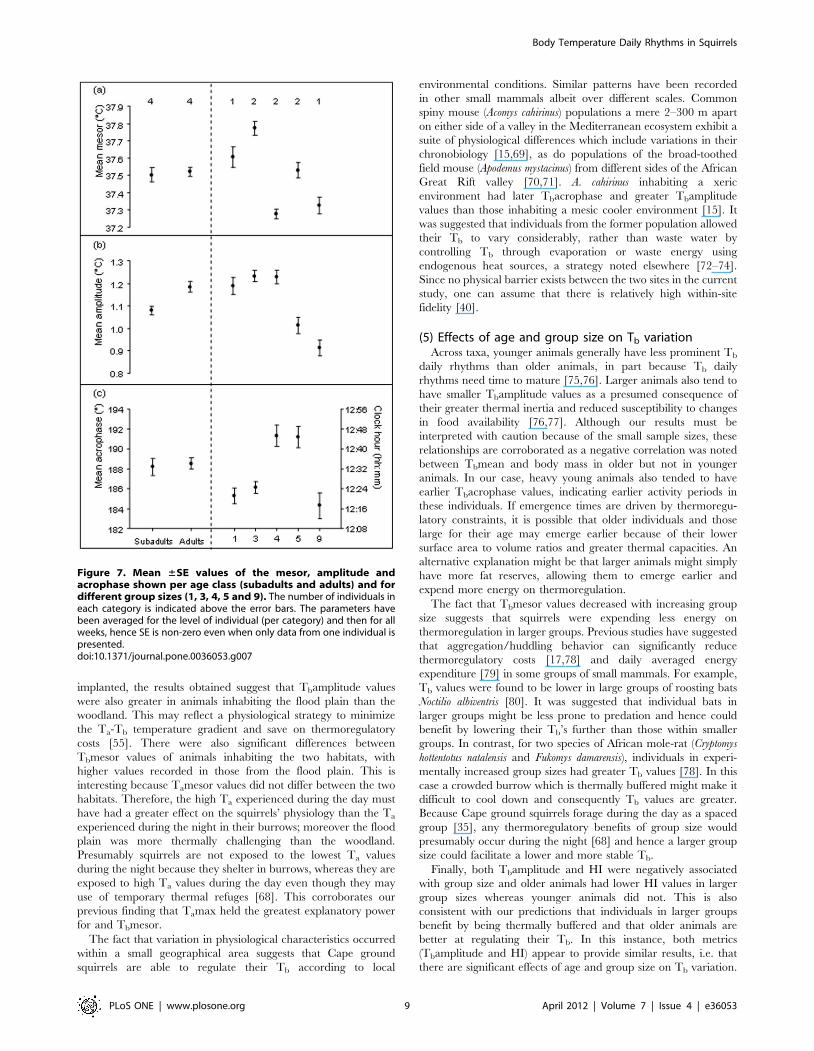
(5) Effect of age and group size on Tb daily rhythmsThere were significant interactions between age and body mass
on Tbmesor (F1,111 = 75.8, p,0.001 respectively). Older individ-
uals decreased Tb with increasing mass whereas Tb was
independent of body mass in younger animals. There was also a
significant effect of group size on Tbmesor with individuals from
larger groups having lower Tbmesor values than those from
smaller groups (F1,156 = 18.70, p,0.001 respectively; Fig. 7A).
There was a significant effect of group size (F1,154 = 22.29,
p,0.001) and a significant interaction between age and body
mass on Tbamplitude (F1,153 = 9.22, p = 0.003). Individuals from
larger group sizes had lower Tbamplitude values and older animals
decreased in Tbamplitude with increasing mass whereas Tbam-
plitude was independent of body mass in younger animals
(Fig. 7B).There were significant interactions between age and
body mass and between group size and body mass on Tbacrophase
(F1,74 = 44.26, p,0.001 and F1,120 = 36.25, p,0.001 respectively;
Fig. 7C). Young animals which were large for their age tended to
Body Temperature Daily Rhythms in Squirrels
PLoS ONE | www.plosone.org 4 April 2012 | Volume 7 | Issue 4 | e36053
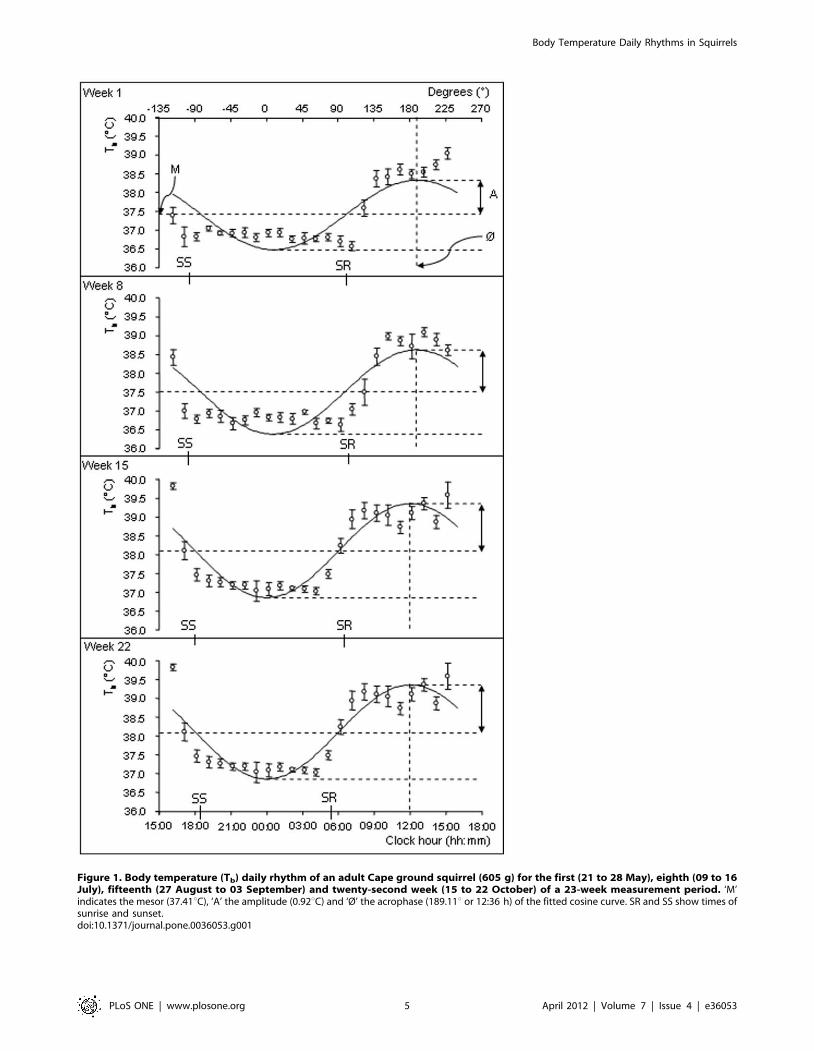
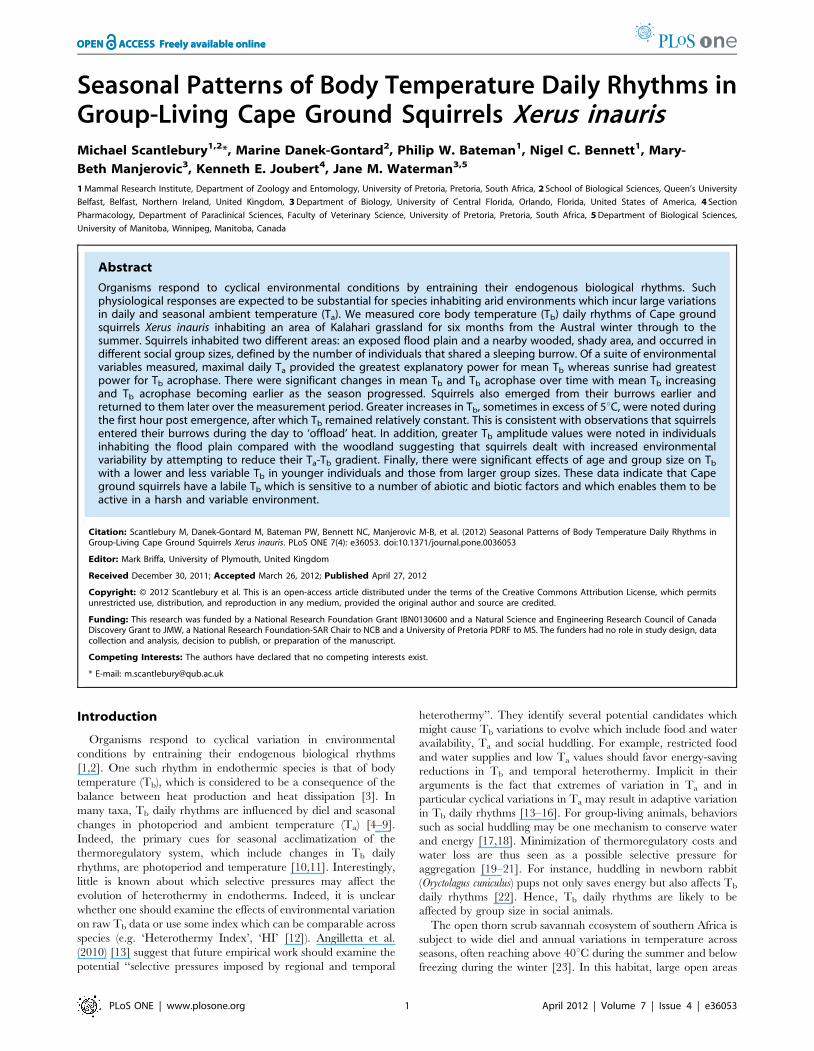
Figure 1. Body temperature (Tb) daily rhythm of an adult Cape ground squirrel (605 g) for the first (21 to 28 May), eighth (09 to 16July), fifteenth (27 August to 03 September) and twenty-second week (15 to 22 October) of a 23-week measurement period. ‘M’indicates the mesor (37.41uC), ‘A’ the amplitude (0.92uC) and ‘Ø’ the acrophase (189.11u or 12:36 h) of the fitted cosine curve. SR and SS show times ofsunrise and sunset.doi:10.1371/journal.pone.0036053.g001
Body Temperature Daily Rhythms in Squirrels
PLoS ONE | www.plosone.org 5 April 2012 | Volume 7 | Issue 4 | e36053
have Tbacrophase values which occurred earlier in the day
whereas larger adults had Tbacrophase values which occurred
later. Finally, Tbacrophase values tended to occur later in the day
as group size increased but was earliest for a group size of nine.
(6) Effect of season, age and group size on theheterothermy index (HI)
Mean HI value across all individuals was 1.2360.29uC and
ranged from 0.68 to 2.32uC. While there were significant
differences in HI values between individuals, there was no
significant effect of ‘week’ (F7,175 = 22.91, p,0.001 and
F1,175 = 1.15, p = 0.286). However, individuals from larger group
sizes had lower HI values (least squares regression F1,182 = 20.33,
p,0.001) and there was a significant interaction between age and
group size on HI (F1,180 = 15.03, p,0.001); older animals
decreased in HI with increasing group size whereas for young
animals HI was independent of group size.
Discussion
Living in hot arid environments can be stressful for small
diurnal mammals since the availability of free water necessary to
reduce body heat by evaporation is limited [49]. Consequently,
evaporative cooling is often accompanied by behavioral and
physiological mechanisms to dissipate heat such as the use of a
thermal refuge or substrate [50] or heterothermy [13,51–53]. In
the current study, Cape ground squirrels were exposed to a wide
seasonal and daily range of Ta and the Tbmesor of all individuals
increased significantly as the season progressed. This indicates that
Tb values, including both maximal and minimal Tb’s were higher
on average when Ta values were higher. This will presumably
serve to conserve their water and energy as a reduced Ta-Tb
temperature gradient minimizes the need to keep cool by
evaporation [15,54,55]. In addition, acrophase values became
earlier over the measurement period, indicating that activity
periods also became earlier [28,56]. Ground squirrels in general
have labile Tb’s [2,5,57–61], Tbamplitudes of different species may
vary by 4–5uC and be accompanied by bouts of torpor or
hibernation. This compares with Tb amplitude values of up to
4.1uC in Arabian oryx (Oryx leucoryx) [51] and 2.6uC in Arabian
sand gazelles (Gazella subgutturosa marica) [52]. We found no
evidence of torpor and recorded daily variation in Tb, of 5–6uC,
which is greater than that noted in most other species and greater
than noted by Wilson et al. (2010) [33] for Cape ground squirrels
in a more mesic area (3.8uC amplitude); hence this probably
reflects adaptation to an environment with high Ta values and
large daily variations in Ta.
(3) Relationship between Tb daily rhythms, Ta anddaylight
Peak ambient temperature (Tamax) was the primary factor that
explained both Tbmean and Tbamplitude, which suggests that this
is the most thermally challenging period of the day. By
comparison, sunrise provided the greatest explanatory power
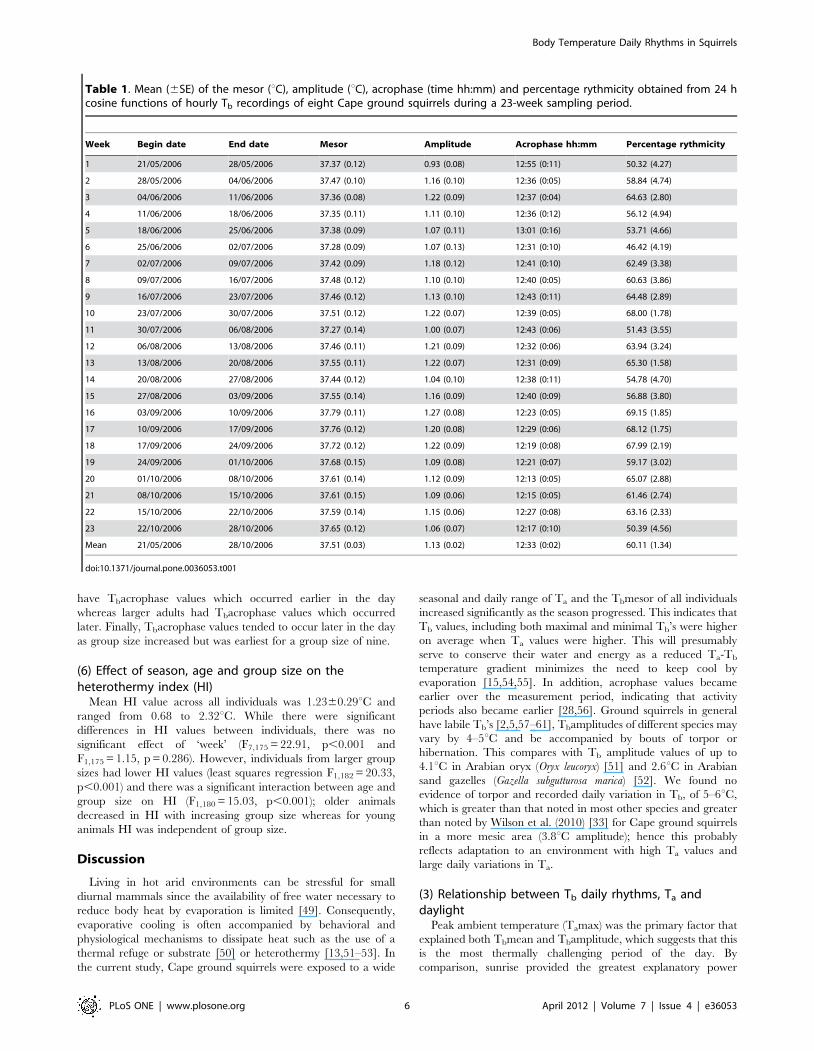
Table 1. Mean (6SE) of the mesor (uC), amplitude (uC), acrophase (time hh:mm) and percentage rythmicity obtained from 24 hcosine functions of hourly Tb recordings of eight Cape ground squirrels during a 23-week sampling period.
Week Begin date End date Mesor Amplitude Acrophase hh:mm Percentage rythmicity
1 21/05/2006 28/05/2006 37.37 (0.12) 0.93 (0.08) 12:55 (0:11) 50.32 (4.27)
2 28/05/2006 04/06/2006 37.47 (0.10) 1.16 (0.10) 12:36 (0:05) 58.84 (4.74)
3 04/06/2006 11/06/2006 37.36 (0.08) 1.22 (0.09) 12:37 (0:04) 64.63 (2.80)
4 11/06/2006 18/06/2006 37.35 (0.11) 1.11 (0.10) 12:36 (0:12) 56.12 (4.94)
5 18/06/2006 25/06/2006 37.38 (0.09) 1.07 (0.11) 13:01 (0:16) 53.71 (4.66)
6 25/06/2006 02/07/2006 37.28 (0.09) 1.07 (0.13) 12:31 (0:10) 46.42 (4.19)
7 02/07/2006 09/07/2006 37.42 (0.09) 1.18 (0.12) 12:41 (0:10) 62.49 (3.38)
8 09/07/2006 16/07/2006 37.48 (0.12) 1.10 (0.10) 12:40 (0:05) 60.63 (3.86)
9 16/07/2006 23/07/2006 37.46 (0.12) 1.13 (0.10) 12:43 (0:11) 64.48 (2.89)
10 23/07/2006 30/07/2006 37.51 (0.12) 1.22 (0.07) 12:39 (0:05) 68.00 (1.78)
11 30/07/2006 06/08/2006 37.27 (0.14) 1.00 (0.07) 12:43 (0:06) 51.43 (3.55)
12 06/08/2006 13/08/2006 37.46 (0.11) 1.21 (0.09) 12:32 (0:06) 63.94 (3.24)
13 13/08/2006 20/08/2006 37.55 (0.11) 1.22 (0.07) 12:31 (0:09) 65.30 (1.58)
14 20/08/2006 27/08/2006 37.44 (0.12) 1.04 (0.10) 12:38 (0:11) 54.78 (4.70)
15 27/08/2006 03/09/2006 37.55 (0.14) 1.16 (0.09) 12:40 (0:09) 56.88 (3.80)
16 03/09/2006 10/09/2006 37.79 (0.11) 1.27 (0.08) 12:23 (0:05) 69.15 (1.85)
17 10/09/2006 17/09/2006 37.76 (0.12) 1.20 (0.08) 12:29 (0:06) 68.12 (1.75)
18 17/09/2006 24/09/2006 37.72 (0.12) 1.22 (0.09) 12:19 (0:08) 67.99 (2.19)
19 24/09/2006 01/10/2006 37.68 (0.15) 1.09 (0.08) 12:21 (0:07) 59.17 (3.02)
20 01/10/2006 08/10/2006 37.61 (0.14) 1.12 (0.09) 12:13 (0:05) 65.07 (2.88)
21 08/10/2006 15/10/2006 37.61 (0.15) 1.09 (0.06) 12:15 (0:05) 61.46 (2.74)
22 15/10/2006 22/10/2006 37.59 (0.14) 1.15 (0.06) 12:27 (0:08) 63.16 (2.33)
23 22/10/2006 28/10/2006 37.65 (0.12) 1.06 (0.07) 12:17 (0:10) 50.39 (4.56)
Mean 21/05/2006 28/10/2006 37.51 (0.03) 1.13 (0.02) 12:33 (0:02) 60.11 (1.34)
doi:10.1371/journal.pone.0036053.t001
Body Temperature Daily Rhythms in Squirrels
PLoS ONE | www.plosone.org 6 April 2012 | Volume 7 | Issue 4 | e36053
defining Tbacrophase which may suggest that sunrise acted to
temporally entrain the thermoregulatory system [62]. Indeed
Tbmean increased rapidly (4–5uC) post-emergence. The sensitivity
of organisms to the timing of first light is exemplified by the fact
that light ‘pollution’ during the dark phase can alter the seasonal
acclimation of thermoregulatory, reproductive and immune
systems of small mammals [63,64]. Interestingly, increases in Tb
during the first hour post-emergence were faster and greater
earlier in the measurement period, indicating that animals gained
thermal energy more rapidly during the winter. This indicates that
as well as endogenous rhythms, mechanisms such as sun-basking
might also be important in raising Tb [28,31,65,66]. Whether or
not squirrels preferentially orientate themselves to maximize heat
uptake whilst basking, for example as in Raccoon dogs (Nyctereutes
procyonoides) [67], remains unclear. By comparison, after initial
increases, the time at which Tb stabilized in the mid-morning is
likely to be indicative of another regulatory behavior: seeking
shelter in burrows or in shade [31,68]. This effect also became
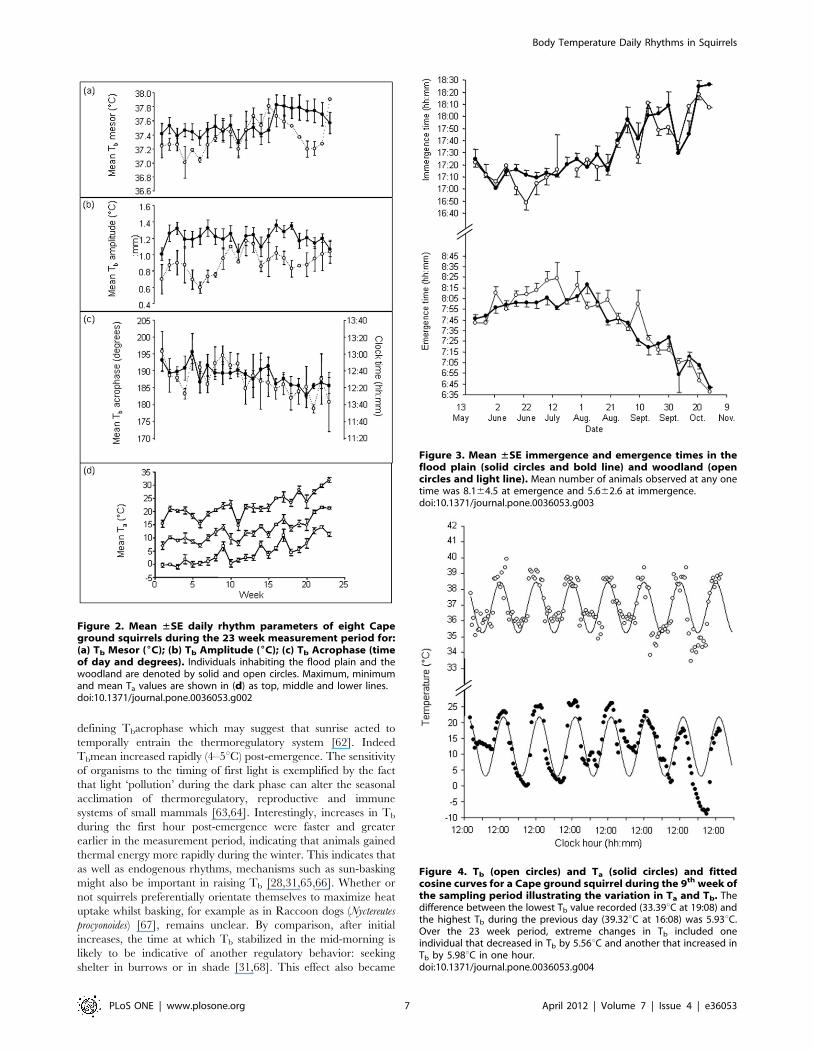
Figure 2. Mean ±SE daily rhythm parameters of eight Capeground squirrels during the 23 week measurement period for:(a) Tb Mesor (6C); (b) Tb Amplitude (6C); (c) Tb Acrophase (timeof day and degrees). Individuals inhabiting the flood plain and thewoodland are denoted by solid and open circles. Maximum, minimumand mean Ta values are shown in (d) as top, middle and lower lines.doi:10.1371/journal.pone.0036053.g002
Figure 3. Mean ±SE immergence and emergence times in theflood plain (solid circles and bold line) and woodland (opencircles and light line). Mean number of animals observed at any onetime was 8.164.5 at emergence and 5.662.6 at immergence.doi:10.1371/journal.pone.0036053.g003
Figure 4. Tb (open circles) and Ta (solid circles) and fittedcosine curves for a Cape ground squirrel during the 9th week ofthe sampling period illustrating the variation in Ta and Tb. Thedifference between the lowest Tb value recorded (33.39uC at 19:08) andthe highest Tb during the previous day (39.32uC at 16:08) was 5.93uC.Over the 23 week period, extreme changes in Tb included oneindividual that decreased in Tb by 5.56uC and another that increased inTb by 5.98uC in one hour.doi:10.1371/journal.pone.0036053.g004
Body Temperature Daily Rhythms in Squirrels
PLoS ONE | www.plosone.org 7 April 2012 | Volume 7 | Issue 4 | e36053
earlier as the season progressed (Fig. 7) suggesting that animals
were using thermal refuges to offload heat earlier, allowing
periodic bouts of foraging. There was also an indication that Tb
tracked Ta (Fig. 4) highlighting the thermal lability of these
animals. It is likely that Cape ground squirrels were allowing their
Tb to vary to defend both water loss and energy expenditure as the
greatest amplitudes of variation were noted during the winter.
Alpine ibex (Capra ibex ibex) also show the greatest amplitude of
variation of Tb during the winter which the authors suggested
promoted a ‘thrifty’ use of body reserves [9]. By comparison,
desert ungulates showed the greatest daily variation in Tb during
the summer (2.660.8uC in Arabian sand gazelles and 4.161.7uCin Arabian oryx); this is the season that is most stressful for them
when they benefit most by minimizing evaporative water loss
[51,52]. It is noteworthy that Tbmean decreased just before
evening immergence and remained steady once the squirrels were
within their burrows. It seems that the major stimulus to enter
burrows could be the prevention of a further decrease in Tb or an
increase in energy expenditure due to increased thermoregulation,
rather than other possible cues, such as light intensity.
(4) Influence of habitat on Tb daily rhythmsAs expected, Ta was more variable in the flood plain than in the
woodland, with the former habitat exhibiting both colder nights
and hotter days. Although the sample size was reduced because we
were not able to capture many of the individuals that were
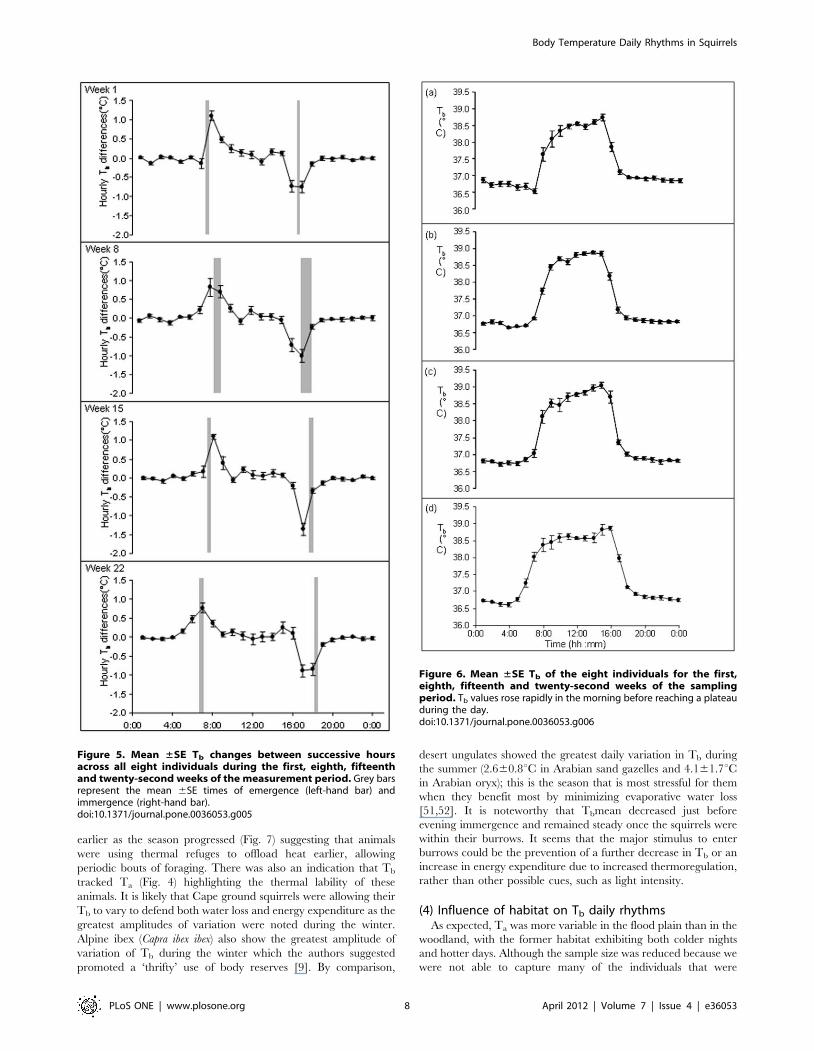
Figure 5. Mean ±SE Tb changes between successive hoursacross all eight individuals during the first, eighth, fifteenthand twenty-second weeks of the measurement period. Grey barsrepresent the mean 6SE times of emergence (left-hand bar) andimmergence (right-hand bar).doi:10.1371/journal.pone.0036053.g005
Figure 6. Mean ±SE Tb of the eight individuals for the first,eighth, fifteenth and twenty-second weeks of the samplingperiod. Tb values rose rapidly in the morning before reaching a plateauduring the day.doi:10.1371/journal.pone.0036053.g006
Body Temperature Daily Rhythms in Squirrels
PLoS ONE | www.plosone.org 8 April 2012 | Volume 7 | Issue 4 | e36053
implanted, the results obtained suggest that Tbamplitude values
were also greater in animals inhabiting the flood plain than the
woodland. This may reflect a physiological strategy to minimize
the Ta-Tb temperature gradient and save on thermoregulatory
costs [55]. There were also significant differences between
Tbmesor values of animals inhabiting the two habitats, with
higher values recorded in those from the flood plain. This is
interesting because Tamesor values did not differ between the two
habitats. Therefore, the high Ta experienced during the day must
have had a greater effect on the squirrels’ physiology than the Ta
experienced during the night in their burrows; moreover the flood
plain was more thermally challenging than the woodland.
Presumably squirrels are not exposed to the lowest Ta values
during the night because they shelter in burrows, whereas they are
exposed to high Ta values during the day even though they may
use of temporary thermal refuges [68]. This corroborates our
previous finding that Tamax held the greatest explanatory power
for and Tbmesor.
The fact that variation in physiological characteristics occurred
within a small geographical area suggests that Cape ground
squirrels are able to regulate their Tb according to local
environmental conditions. Similar patterns have been recorded
in other small mammals albeit over different scales. Common
spiny mouse (Acomys cahirinus) populations a mere 2–300 m apart
on either side of a valley in the Mediterranean ecosystem exhibit a
suite of physiological differences which include variations in their
chronobiology [15,69], as do populations of the broad-toothed
field mouse (Apodemus mystacinus) from different sides of the African
Great Rift valley [70,71]. A. cahirinus inhabiting a xeric
environment had later Tbacrophase and greater Tbamplitude
values than those inhabiting a mesic cooler environment [15]. It
was suggested that individuals from the former population allowed
their Tb to vary considerably, rather than waste water by
controlling Tb through evaporation or waste energy using
endogenous heat sources, a strategy noted elsewhere [72–74].
Since no physical barrier exists between the two sites in the current
study, one can assume that there is relatively high within-site
fidelity [40].
(5) Effects of age and group size on Tb variationAcross taxa, younger animals generally have less prominent Tb
daily rhythms than older animals, in part because Tb daily
rhythms need time to mature [75,76]. Larger animals also tend to
have smaller Tbamplitude values as a presumed consequence of
their greater thermal inertia and reduced susceptibility to changes
in food availability [76,77]. Although our results must be
interpreted with caution because of the small sample sizes, these
relationships are corroborated as a negative correlation was noted
between Tbmean and body mass in older but not in younger
animals. In our case, heavy young animals also tended to have
earlier Tbacrophase values, indicating earlier activity periods in
these individuals. If emergence times are driven by thermoregu-
latory constraints, it is possible that older individuals and those
large for their age may emerge earlier because of their lower
surface area to volume ratios and greater thermal capacities. An
alternative explanation might be that larger animals might simply
have more fat reserves, allowing them to emerge earlier and
expend more energy on thermoregulation.
The fact that Tbmesor values decreased with increasing group
size suggests that squirrels were expending less energy on
thermoregulation in larger groups. Previous studies have suggested
that aggregation/huddling behavior can significantly reduce
thermoregulatory costs [17,78] and daily averaged energy
expenditure [79] in some groups of small mammals. For example,
Tb values were found to be lower in large groups of roosting bats
Noctilio albiventris [80]. It was suggested that individual bats in
larger groups might be less prone to predation and hence could
benefit by lowering their Tb’s further than those within smaller
groups. In contrast, for two species of African mole-rat (Cryptomys
hottentotus natalensis and Fukomys damarensis), individuals in experi-
mentally increased group sizes had greater Tb values [78]. In this
case a crowded burrow which is thermally buffered might make it
difficult to cool down and consequently Tb values are greater.
Because Cape ground squirrels forage during the day as a spaced
group [35], any thermoregulatory benefits of group size would
presumably occur during the night [68] and hence a larger group
size could facilitate a lower and more stable Tb.
Finally, both Tbamplitude and HI were negatively associated
with group size and older animals had lower HI values in larger
group sizes whereas younger animals did not. This is also
consistent with our predictions that individuals in larger groups
benefit by being thermally buffered and that older animals are
better at regulating their Tb. In this instance, both metrics
(Tbamplitude and HI) appear to provide similar results, i.e. that
there are significant effects of age and group size on Tb variation.
Figure 7. Mean ±SE values of the mesor, amplitude andacrophase shown per age class (subadults and adults) and fordifferent group sizes (1, 3, 4, 5 and 9). The number of individuals ineach category is indicated above the error bars. The parameters havebeen averaged for the level of individual (per category) and then for allweeks, hence SE is non-zero even when only data from one individual ispresented.doi:10.1371/journal.pone.0036053.g007
Body Temperature Daily Rhythms in Squirrels
PLoS ONE | www.plosone.org 9 April 2012 | Volume 7 | Issue 4 | e36053
Overall, these data confirm that the thermal physiology of Cape
ground squirrels is sensitive to changes both in the abiotic and
biotic environment. Many factors are observed to affect their Tb,
which can be modified, enabling them to survive in arid, hostile
environments.
Acknowledgments
We would like to thank Northwest Parks and Tourism and the staff of S.A.
Lombard Nature Reserve for their help and permission to conduct this
research. We would also like to thank Prof. J.W. Ferguson for helpful
discussions and providing programs to analyse Tb data as well as Justin
Boyles and an anonymous reviewer for valuable comments on an earlier
draft of the manuscript. Tania Serfontein helped with surgical procedures
whilst Lydia Belton, Johannie Caldo, Melissa Hillegass, Tambudzani
Mulaudzi, Joe Osbourne and Beth Pettitt provided valuable assistance in
the field.
Author Contributions
Conceived and designed the experiments: MS. Performed the experiments:
MS MBM KEJ. Analyzed the data: MS MDG. Contributed reagents/
materials/analysis tools: NCB JMW. Wrote the paper: MS MDG PWB
NCB MBM KEJ JMW.
References
1. Kenagy GJ, Vleck D (1982) Daily temporal organization of metabolism in small
mammals: adaptation and diversity. In: Aschoff J, Dean S, Groos G, eds.
Vertebrate Circadian Systems. Berlin: Springer.
2. Refinetti R (1999) Amplitude of the daily rhythm of body temperature in eleven
mammalian species. J Therm Biol 24: 477–481.
3. Aschoff J (1982) The circadian rhythms of body temperature as a function of
body size. In: Taylor CR, Johanson K, Bolis L, eds. A Companion to Animal
Physiology. Cambridge: Cambridge University Press. pp 173–188.
4. Haim A, Rubal A (1994) Seasonal acclimatization of daily rhythms of body
temperature in two rodent species of different origins inhabiting Mediterranean
woodland. Pol Ecol Stud 20: 357–363.
5. Golightly RT, Jr., Ohmart RD (1978) Heterothermy in free ranging Albert’s
squirrels (Sciurus aberti). Ecology 59: 897–909.
6. Wollnik F, Schmidt B (1995) Seasonal and daily rhythms of body temperature in
the European hamster (Cricetus cricetus) under semi-natural conditions. J Comp
Physiol B 165: 171–182.
7. Kenagy GJ, Nespolo RF, Vasquez RA, Bozinovic F (2002) Daily and seasonal
limits of time and temperature to activity of degus. Rev Chil Hist Nat 75:
567–581.
8. Yerushalmi S, Green RM (2009) Evidence for the adaptive significance of
circadian rhythms. Ecol Lett 12: 970–981.
9. Signer C, Ruf T, Arnold W (2011) Hypometabolism and basking: the strategies
of Alpine ibex to endure harsh over-wintering conditions. Funct Ecol 25:
537–547.
10. Heldmaier G, Steinlechner S, Ruf T, Wiesinger H, Klingenspor M (1989)
Photoperiod and thermoregulation in vertabrates: body temperature rhythms
and thermogenic acclimation. J Biol Rhythm 4: 251–256.
11. Haim A (1996) Food and energy intake, non-shivering thermogenesis and daily
rhythm of body temperature in the bushy-tailed gerbil Sekeetamys calurus: the role
of photoperiod manipulations. J Therm Biol 21: 37–42.
12. Boyles JG, Smit B, McKechnie AE (2010) A new metric for estimating
heterothermy in endotherms. Physiol Biochem Zool 84: 115–123.
13. Angilletta MJ, Cooper BS, Schuler MS, Boyles JG (2010) The evolution of
thermal physiology in endotherms. Frontiers in Bioscience E2: 861–881.
14. Haim A, Levi G (1990) Role of body temperature in seasonal acclimatization:
Photoperiod-induced rhythms and heat production in Meriones crassus. J Exp Zool
256: 237–241.
15. Shanas U, Afik D, Scantlebury M, Haim A (2002) The effects of season and
dietary salt content on body temperature daily rhythms of common spiny mice
from different micro-habitats. Comp Biochem Physiol A 132: 287–295.
16. Levy O, Dayan T, Kronfeld-Schor N (2011) Adaptive thermoregulation in
golden spiny mice: the influence of season and food availability on body
temperature. Physiol Biochem Zool 84: 175–184.
17. Hayes JP, Speakman JR, Racey PA (1992) The Contributions of local heating
and reducing exposed surface area to the energetic benefits of huddling by short-
tailed field voles (Microtus agrestis). Physiol Zool 65: 742–762.
18. Kaufman AS, Paul MJ, Butler MP, Zucker I (2003) Huddling, locomotor, and
nest-building behaviors of furred and furless Siberian hamsters. Physiol Behav
79: 247–256.
19. Madison DM, FitzGerald RW, McShea WJ (1984) Dynamics of social nesting in
overwintering meadow voles (Microtus pennsylvanicus): possible consequences for
population cycling. Behav Ecol Sociobiol 15: 9–17.
20. Berteaux D, Bergeron J-M, Thomas DW, Lapierre H (1996) Solitude versus
gregariousness: do physical benefits drive the choice in overwintering meadow
voles? OIKOS 76: 330–336.
21. Canals M, Rosenmann M, Novoa FF, Bozinovic F (1998) Modulating factors of
the energetic effectiveness of huddling in small mammals. Acta Theriol 43:
337–348.
22. Gilbert C, Blanc S, Giroud S, Trabalon M, Le Maho Y, et al. (2007) Role of
huddling on the energetic of growth in a newborn altricial mammal. Am J Physiol
293: R867–R876.
23. Cowling RM, Richardson DM, Pierce SM (2004) Vegetation of Southern
Africa. Cambridge: Cambridge University Press.
24. van Zyl JHM (1965) The vegetation of the S. A. Lombard nature reserve and its
utilisation by certain antelope. Zool Afr 1: 55–71.
25. Pavlıcek T, Sharon D, Kravchenko V, Saaroni H, Nevo E (2003) Microclimatic
interslope differences underlying biodiversity contrasts in ‘‘Evolution Canyon’’,
Mt. Carmel, Israel. Israel J Earth Sci 52: 1–9.
26. Haim A, Skinner JD, Robinson TJ (1987) Bioenergetics, thermoregulation and
urine analysis of squirrels of the genus Xerus from an arid environment.
S Afr J Zool 22: 45–49.
27. van Heerden J, Dauth J (1987) Aspects of adaptation to an arid environment in
free-living ground squirrels Xerus inauris. J Arid Environ 13: 83–89.
28. Herzig-Straschil B (1978) On the biology of Xerus inauris (Zimmermann, 1780)
(Rodentia, Sciuridae). Z Saugetierkunde 43: 262–278.
29. Bennett AF, Huey RB, John-Alder H, Nagy KA (1984) The parasol tail and
thermoregulatory behavior of the Cape ground squirrel Xerus inauris. Physiol
Zool 57: 57–62.
30. Huey RB, Bennett AF (1990) Physiological adjustments to fluctuating thermal
environments: An ecological and evolutionary perspective. In: Morimoto R,
Tissieres A, Georgopoulos C, eds. Stress Proteins in Biology and Medicine. New
York: Cold Spring Harbour Press. pp 37–59.
31. Fick LG, Kicio TA, Fuller A, Matthee A, Mitchell D (2009) The relative roles of
the parasol-like tail and burrow shuttling in thermoregulation of free-ranging
Cape ground squirrels, Xerus inauris. Comp Biochem Physiol A 152: 334–340.
32. Wooden KM, Walsberg GE (2002) Effect of environmental temperature on
body temperature and metabolic heat production in a heterothermic rodent,
Spermophilus tereticaudus. J Exp Biol 205: 2099–2105.
33. Wilson WA, O’Riain MJ, Hetem RS, Fuller A, Fick L (2010) Winter body
temperature patterns in free-ranging Cape ground squirrel, Xerus inauris: no
evidence for torpor. J Comp Physiol B 180: 1099–1110.
34. Halberg F, Johnson EA, Nelson W, Kunge W, Sothen RB (1972) Auto-
rhythmometry procedures for physiological self measurements and their analysis.
Physiol Teach 1: 1–11.
35. Waterman JM (1995) The social organization of the Cape ground squirrel (Xerus
inauris; Rodentia: Sciuridae). Ethology 101: 130–47.
36. Waterman JM (1997) Why do male Cape ground squirrels live in groups? Anim
Behav 56: 459–66.
37. Waterman JM (1998) Mating tactics of male Cape ground squirrels, Xerus inauris:
consequences of year-round breeding. Anim Behav 56: 459–466.
38. Hillegass MA, Waterman JM, Roth JD (2008) The influence of sex and sociality
on parasite loads in an African ground squirrel. Behav Ecol 19: 1006–1011.
39. Pettitt BA, Waterman JM, Wheaton CJ (2008) Assessing the effects of resource
availability and parity on reproduction in female Cape ground squirrels:
resources do not matter. J Zool Lond 276: 291–298.
40. Unck CE, Waterman JM, Verburgt L, Bateman PW (2009) Quantity versus
quality: How does level of predation threat affect Cape ground squirrel
vigilance? Anim Behav 78: 625–632.
41. Rood JP, Nellis D (1980) Freeze-marking mongooses. J Wildl Manag 44:
500–502.
42. Waterman JM (1996) Reproductive biology of a tropical, non-hibernating
ground squirrel. J Mamm 77: 134–146.
43. Altmann J (1974) Observational study of behavior: sampling methods.
Behaviour 49: 227–267.
44. Lovegrove BG (2009) Modification and miniaturization of Thermochron
iButtons for surgical implantation into small animals. J Comp Physiol B 179:
451–458.
45. Joubert KE, Serfontein T, Scantlebury M, Manjerovic MB, Bateman PW, et al.
(2011) Determination of an optimal dose of medetomidine-ketamine-buprenor-
phine for anaesthesia in the Cape ground squirrel (Xerus inauris). J S Afr Ves Ass
82: 94–96.
46. Manjerovic MB (2010) The influence of sexual selection on behavioral and
physiological mechanisms underlying reproductive success in male Cape ground
squirrels (Xerus inauris). PhD Dissertation. Orlando, FL: University of Central
Florida.
47. Nelson W, Tong YL, Lee J-K, Halberg F (1979) Methods for cosinor
rhythmicity. Chronobiologia 6: 305–23.
48. Minors DS, Waterhouse JM (1989) Analysis of biological time series. In:
Minors DS, Waterhouse JM, eds. Biological Rhythms in Clinical Practice.
London: Wright. pp 272–284.
Body Temperature Daily Rhythms in Squirrels
PLoS ONE | www.plosone.org 10 April 2012 | Volume 7 | Issue 4 | e36053
49. Walsberg GE (2000) Small mammal in hot deserts: some generalisations
revisited. Bioscience 50: 109–120.
50. Turk A, Arnold W (1988) Thermoregulation as a limit to habitat use in alpine
marmots (Marmota marmota). Oecologia 76: 544–548.
51. Ostrowski S, Williams JB, Ismael K (2003) Heterothermy and the water
economy of free-living Arabian oryx (Oryx leucoryx). J Exp Biol 206: 1471–1478.
52. Ostrowski S, Williams JB (2006) Heterothermy of free-living Arabian sand
gazelles (Gazella subgutturosa marica) in a desert environment. J Exp Biol 209:
1421–1429.
53. Hetem RS, Strauss WM, Fick LG, Maloney SK, Meyer LCR, et al. (2010)
Variation in the daily rhythm of body temperature of free-living Arabian oryx
(Oryx leucoryx): does water limitation drive heterothermy? J Comp Physiol B 180:
1111–1119.
54. Lovegrove BG, Heldmaier G, Knight M (1991) Seasonal and circadian energetic
patterns in an arboreal rodent, Thallomys paedulcus, and a burrow-dwelling
rodent, Aethomys namaquensis, from the Kalahari desert. J Therm Biol 16:
199–209.
55. Lovegrove BG, Heldmaier G (1994) The amplitude of circadian body
temperature rhythms in three rodents along an arboreal-subterranean gradient.
Austral J Zool 42: 65–78.
56. Refinetti R, Menaker M (1992) The circadian rhythm of body temperature.
Physiol Behav 51: 613–637.
57. Hudson JW, Deavers DR, Bradley SR (1972) A comparative study of
temperature regulation in ground squirrels with special reference to desert
species. Symp Zool Soc Lond 31: 191–213.
58. Long RA, Martin TJ, Barnes BM (2005) Body temperature and activity patterns
in free-living arctic ground squirrels. J Mamm 86: 314–322.
59. Sharpe PB, Van Horne B (1999) Relationships between the thermal
environment and activity of Piute ground squirrels (Spermophilus mollis). J Therm
Biol 24: 265–278.
60. Wooden KM, Walsberg GE (2004) Body temperature and locomotor capacity in
a heterothermic rodent. J Exp Biol 207: 41–46.
61. Gur H, Gur MK (2010) Analtolian ground squirrels (Spermophilus xanthoprymnus):
Hibernation and geographic variation of body size in a species of old World
ground squirrels. Hacettepe J Biol & Chem 38: 247–253.
62. Morgan E (2004) Ecological significance of biological clocks. Biol Rhythm Res
35: 3–12.
63. Haim A, Shanas U, Zubidad AE, Scantlebury M (2005) Seasonality and seasons
out of time - The thermoregulatory effects of light interference. Chronobiol Int
22: 59–66.
64. Schwimmer H, Mursu N, Haim A (2010) Effects of light and melatonin
treatment on body temperature and melatonin secretion daily rhythms in a
diurnal rodent, the fat sand rat. Chronobiol Int 27: 1401–1419.
65. Straschil B (1975) Sandbathing and marking in Xerus inauris. (Zimmerman,
1870)(Rodentia, Sciuridae). S Afr J Sci 71: 215–216.66. Scantlebury M, Krackow S, Pillay N, Bennett NC, Schradin C (2010) Basking is
affected by season and influences oxygen consumption in desert-living striped
mice. J Zool Lond 281: 132–139.67. Harri M, Korhonen H (1988) Thermoregulatory significance of basking
behaviour in the raccoon dog (Nyctereutes procyonoides). J Therm Biol 13: 169–174.68. Herzig-Straschil B (1979) Xerus inauris (Rodentia, Sciuridae) - an inhabitant of the
arid regions of Southern Africa. Folia Zool 28: 119–124.
69. Scantlebury M, Shanas U, Speakman JR, Kupshtein H, Afik D, et al. (2003)Energetics and water economy of common spiny mice Acomys cahirinus from
north- and south-facing slopes of a Mediterranean valley. Funct Ecol 17:178–185.
70. Spiegel M, Haim A (2004) Daily rhythms of nonshivering thermogenesis andresponses to photoperiod manipulations in Apodemus mystacinus from two different
ecosystems. J Therm Biol 29: 635–640.
71. Scantlebury M, Shanas U, Or-Chen K, Haim A (2009) Osmoregulatory traits ofbroad-toothed field mouse (Apodemus mystacinus) populations from different
habitats. Comp Biochem Physiol A 154: 551–556.72. Scantlebury M, Lovegrove BG, Jackson CR, Bennett NC, Lutermann H (2008)
Hibernation and non-shivering thermogenesis in the Hottentot golden mole
(Amblysomus hottentottus longiceps). J Comp Physiol B 178: 887–897.73. Warnecke L, Turner JM, Geiser F (2008) Torpor and basking in a small arid
zone marsupial. Naturwissenschaften 95: 73–78.74. Jackson CR, Setsaas TH, Robertson MP, Scantlebury N, Bennett NC (2009)
Insights into torpor and behavioural thermoregulation of the endangeredJuliana’s golden mole. J Zool Lond 278: 299–307.
75. Piccione G, Caola G, Refinetti R (2002) Maturation of the daily body
temperature rhythm in sheep and horse. J Therm Biol 27: 333–336.76. Piccione G, Fazio F, Giudice E, Refinetti R (2009) Body size and the daily
rhythm of body temperature in dogs. J Therm Biol 34: 171–175.77. Kinahan AA, Kotze A, Bateman PW, Scantlebury M (2007) Daily body
temperature rhythms in the African savanna elephant, Loxodonta africana. Physiol
Behav 92: 560–565.44. Lovegrove BG (2009) Modification and miniaturizationof Thermochron iButtons for surgical implantation into small animals. J Comp
Physiol B 179: 451–458.78. Kotze J, Bennett NC, Scantlebury M (2008) The energetics of huddling in two
species of mole-rat (Rodentia: Bathyergidae). Physiol Behav 93: 215–221.79. Scantlebury M, Bennett NC, Speakman JR, Pillay N, Schradin C (2006)
Huddling in groups leads to daily energy savings in free-living African four-
striped grass mice, Rhabdomys pumilio. Funct Ecol 20: 166–173.80. Roverud RC, Chapell MA (1991) Energetic and thermoregulatory aspects of
clustering behavior in the neotropical bat Noctilio albiventris. Physiol Zool 64:1527–1541.
Body Temperature Daily Rhythms in Squirrels
PLoS ONE | www.plosone.org 11 April 2012 | Volume 7 | Issue 4 | e36053
Related Documents