1 2 Seasonal occurrence and removal of pharmaceutical products in 3 municipal wastewaters 4 Manuel Ferna ´ ndez Q1 a , Mo ´ nica Ferna ´ ndez b , Amanda Laca c , Adriana Laca a , Mario Dı ´az a, * 5 a Department of Chemical Engineering and Environmental Technology, University of Oviedo, C/Julia ´n Claverı´a s/n. 33071 Oviedo, Spain 6 b Anes Innovacio ´n S.L. Avenida de Galicia, 31. 33005 Oviedo, Spain 7 c Scientist-Technical Services, University of Oviedo, C/Fernando Bonguera s/n. 33071 Oviedo, Spain 8 9 Introduction 10 Pharmaceutical and personal care products (PPCPs) and their 11 metabolites are contaminants extensively found in the aquatic 12 environment [1]. These emerging environmental pollutants deserve 13 special attention due to the fact that some of them may cause 14 ecological and health harm [2–4]. Increasing numbers of water 15 samples obtained from lakes, streams, aquifers and municipal 16 supplies across the world have been found to be contaminated by 17 trace quantities of such residues [5]. These compounds might be 18 excreted by patients or be improperly disposed by users and end up 19 in municipal wastewaters. One of the major sources of PPCPs in the 20 aquatic environment is the effluent discharge from wastewater 21 treatment plants (WWTPs) [1,6]. Current municipal wastewater 22 treatment processes are insufficient at degrading many PPCPs and 23 removal rates vary depending on the treatment technology used and 24 the compound considered. Hence, variable amounts of PPCPs are 25 continuously released into surface, ground and coastal waters [7]. 26 The concentration of pollutants in influents and effluents of 27 WWTPs are routinely monitored in many countries [5]. Despite of 28 the fact that little attention has been paid to seasonal variation of 29 PPCPs, results of different studies showed that the concentrations 30 of PPCPs in municipal wastewater and their treated effluents may 31 vary along the year [8–11]. Furthermore, diurnal variation patters 32 in specific PPCPs that correlates with daily drug administration 33 have also been identified in some cases [12]. 34 The goal of this work was to assess the occurrence and removal 35 of selected pharmaceutical products from municipal wastewaters 36 in the North of Spain. As far as we know, this is the first study of this 37 kind carried out in this region. With this aim, samples from two 38 WWTPs were collected and analyzed along the four seasons in one 39 year. Additionally, local hospital effluents were also analyzed. 40 Moreover the seasonal variability in PPCPs occurrence and removal 41 was also investigated. 42 Materials and methods 43 Selected PPCPs 44 The PPCPs considered in this study include: paracetamol, 45 ibuprofen, naproxen, diclofenac, caffeine and carbamazepine. Journal of Environmental Chemical Engineering xxx (2014) xxx–xxx A R T I C L E I N F O Article history: Received 11 November 2013 Accepted 30 January 2014 Keywords: Seasonal Wastewater PPCPs Treatment WWTP A B S T R A C T The occurrence in municipal wastewaters of six pharmaceutical products, paracetamol, ibuprofen, naproxen, diclofenac, caffeine and carbamazepine, which belong to different therapeutic classes (analgesic drugs, anti-inflammatory, antiepileptic and stimulant compounds), have been investigated. Influent and effluent water samples from two conventional wastewater treatment plants (WWTPs) of the North of Spain were collected at different seasons and analyzed. Ranges of PPCPs concentrations were similar to levels reported in other studies worldwide. Influent concentrations ranges were 2.3–42 mg/L for ibuprofen and naproxen, 0.04–7.8 mg/L for caffeine and paracetamol, and 0.03–0.4 mg/L for carbamazepine and diclofenac. The highest concentrations were found for ibuprofen in the untreated municipal wastewaters. Effluent concentrations were always below 5.7 mg/L. Diclofenac and carbamazepine persisted in WWTP effluents, whereas paracetamol, ibuprofen, naproxen and caffeine showed removal efficiencies between 75% and 99%. Considering first-order kinetics for the biodegradation of these compounds, apparent kinetic constants were calculated and similar values were obtained for both WWTPs, although one of them resulted to be more sensitive to temperature changes. ß 2014 Published by Elsevier Ltd. * Corresponding author. Q2 Tel.: +34 985103439; fax: +34 985103434. E-mail addresses: [email protected], [email protected] (M. Dı ´az). G Model JECE 272 1–8 Please cite this article in press as: M. Ferna ´ ndez, et al., Seasonal occurrence and removal of pharmaceutical products in municipal wastewaters, J. Environ. Chem. Eng. (2014), http://dx.doi.org/10.1016/j.jece.2014.01.023 Contents lists available at ScienceDirect Journal of Environmental Chemical Engineering jou r n al h o mep ag e: w ww .elsevier .co m /loc ate/jec e http://dx.doi.org/10.1016/j.jece.2014.01.023 2213-3437/ß 2014 Published by Elsevier Ltd.

Welcome message from author
This document is posted to help you gain knowledge. Please leave a comment to let me know what you think about it! Share it to your friends and learn new things together.
Transcript

1
2
3
4 Q1
567
89
10
11
12
13
14
15
16
17
18
19
20
21
22
23
24
25
Journal of Environmental Chemical Engineering xxx (2014) xxx–xxx
Q2
G Model
JECE 272 1–8
Seasonal occurrence and removal of pharmaceutical products inmunicipal wastewaters
Manuel Fernandez a, Monica Fernandez b, Amanda Laca c, Adriana Laca a, Mario Dıaz a,*a Department of Chemical Engineering and Environmental Technology, University of Oviedo, C/Julian Claverıa s/n. 33071 Oviedo, Spainb Anes Innovacion S.L. Avenida de Galicia, 31. 33005 Oviedo, Spainc Scientist-Technical Services, University of Oviedo, C/Fernando Bonguera s/n. 33071 Oviedo, Spain
A R T I C L E I N F O
Article history:
Received 11 November 2013
Accepted 30 January 2014
Keywords:
Seasonal
Wastewater
PPCPs
Treatment
WWTP
A B S T R A C T
The occurrence in municipal wastewaters of six pharmaceutical products, paracetamol, ibuprofen,
naproxen, diclofenac, caffeine and carbamazepine, which belong to different therapeutic classes (analgesic
drugs, anti-inflammatory, antiepileptic and stimulant compounds), have been investigated. Influent and
effluent water samples from two conventional wastewater treatment plants (WWTPs) of the North of Spain
were collected at different seasons and analyzed. Ranges of PPCPs concentrations were similar to levels
reported in other studies worldwide. Influent concentrations ranges were 2.3–42 mg/L for ibuprofen and
naproxen, 0.04–7.8 mg/L for caffeine and paracetamol, and 0.03–0.4 mg/L for carbamazepine and
diclofenac. The highest concentrations were found for ibuprofen in the untreated municipal wastewaters.
Effluent concentrations were always below 5.7 mg/L. Diclofenac and carbamazepine persisted in WWTP
effluents, whereas paracetamol, ibuprofen, naproxen and caffeine showed removal efficiencies between
75% and 99%. Considering first-order kinetics for the biodegradation of these compounds, apparent kinetic
constants were calculated and similar values were obtained for both WWTPs, although one of them
resulted to be more sensitive to temperature changes.
� 2014 Published by Elsevier Ltd.
Contents lists available at ScienceDirect
Journal of Environmental Chemical Engineering
jou r n al h o mep ag e: w ww .e lsev ier . co m / loc ate / jec e
26272829303132333435363738394041
42
Introduction
Pharmaceutical and personal care products (PPCPs) and theirmetabolites are contaminants extensively found in the aquaticenvironment [1]. These emerging environmental pollutants deservespecial attention due to the fact that some of them may causeecological and health harm [2–4]. Increasing numbers of watersamples obtained from lakes, streams, aquifers and municipalsupplies across the world have been found to be contaminated bytrace quantities of such residues [5]. These compounds might beexcreted by patients or be improperly disposed by users and end upin municipal wastewaters. One of the major sources of PPCPs in theaquatic environment is the effluent discharge from wastewatertreatment plants (WWTPs) [1,6]. Current municipal wastewatertreatment processes are insufficient at degrading many PPCPs andremoval rates vary depending on the treatment technology used andthe compound considered. Hence, variable amounts of PPCPs arecontinuously released into surface, ground and coastal waters [7].
43
4445
* Corresponding author. Tel.: +34 985103439; fax: +34 985103434.
E-mail addresses: [email protected], [email protected] (M. Dıaz).
Please cite this article in press as: M. Fernandez, et al., Seasonal ocwastewaters, J. Environ. Chem. Eng. (2014), http://dx.doi.org/10.101
http://dx.doi.org/10.1016/j.jece.2014.01.023
2213-3437/� 2014 Published by Elsevier Ltd.
The concentration of pollutants in influents and effluents ofWWTPs are routinely monitored in many countries [5]. Despite ofthe fact that little attention has been paid to seasonal variation ofPPCPs, results of different studies showed that the concentrationsof PPCPs in municipal wastewater and their treated effluents mayvary along the year [8–11]. Furthermore, diurnal variation pattersin specific PPCPs that correlates with daily drug administrationhave also been identified in some cases [12].
The goal of this work was to assess the occurrence and removalof selected pharmaceutical products from municipal wastewatersin the North of Spain. As far as we know, this is the first study of thiskind carried out in this region. With this aim, samples from twoWWTPs were collected and analyzed along the four seasons in oneyear. Additionally, local hospital effluents were also analyzed.Moreover the seasonal variability in PPCPs occurrence and removalwas also investigated.
Materials and methods
Selected PPCPs
The PPCPs considered in this study include: paracetamol,ibuprofen, naproxen, diclofenac, caffeine and carbamazepine.
currence and removal of pharmaceutical products in municipal6/j.jece.2014.01.023

46 Th47 ph48 sy49 an50 de51 di52 ph53 to
54 Sa
55
56 tw57 th58 ha59 pu60 re61 au62 de63 co64 tr65 w66 st
67 De
68
69 re70 ac71 co72 se73 pl74 zo75 w76 af77
78 re79 an80 bi81 w82 th83 re84 cl85
86 2
87 th88 W89 m90 w
919293949596979899100101102103104105106107
108109110111112113114
115116117118
119
120121122123124125126127128129130131132133134135136137138139140141142143144145146147148149150
Table 1Sampling details.
Date Week day Sampling time Average day
temperature
(8C)
Average day
precipitations
(mm)
20/12/2010 Monday �8:30 (WWTP1)
�10:00 (WWTP2)
�11:00 (Hospital)
�9 0.2
22/02/2011 Tuesday �8:30 (WWTP1)
�10:00 (WWTP2)
�11:00 (Hospital)
�12 3.6
19/05/2011 Thursday �8:30 (WWTP1)
�10:00 (WWTP2)
�11:00 (Hospital)
�15 0.6
25/07/2011 Monday �8:30 (WWTP1)
�10:00 (WWTP2)
�11:00 (Hospital)
�19 0.4
M. Fernandez et al. / Journal of Environmental Chemical Engineering xxx (2014) xxx–xxx2
G Model
JECE 272 1–8
ese compounds were chosen to represent different groups ofarmaceutical products widely reported to occur in aquaticstems, specifically: analgesic, anti-inflammatory, antiepilepticd stimulant drugs. Caffeine is among the 30 most frequentlytected organic wastewater pollutants and carbamazepine,clofenac and ibuprofen are among the top 10 high priorityarmaceuticals identified in a European assessment of PPCPs due
their high consumption [4,7].
mple collection
Wastewater was sampled from influent and effluent flows ofo local water utilities (WWTP1 and WWTP2) and effluents from
e University Central Hospital of Asturias (HUCA). This hospitals 1324 beds and the wastewater is directly discharged into theblic sewage system. All facilities were located in Asturias, a
gion sited in the North of Spain. Grab samples were collected intumn, winter, spring and summer (see Table 1) using a samplevice consisting in a plastic bottle attached to a stick. Afterllection, samples were transferred to 2.5 L glass bottles and
ansported to laboratory. The same day of collection, samplesere adjusted to pH 2.00 � 0.10 using hydrochloric acid 3.5 M andored at 4 8C in the dark until extraction (maximum 12 h).
scription of treatment plants
The treatment in WWTP1 consists of screening, grit and greasemoval, primary clarification, activated sludge treatment tohieve removal of biochemical oxygen demanding organicmpounds (BOD), nitrogen and phosphorus and, finally, acondary clarification (Fig. 1). The biological degradation takesace in a ‘‘channel type’’ bioreactor with anaerobic/anoxic/aerobicnes and an average retention time of 8 h. The influent samplesere taken after screening and the effluent samples were takenter secondary clarification.
The treatment in WWTP2 consists of screening, grit and greasemoval, activated sludge treatment to achieve removal of BODd nitrogen and, finally, secondary clarification (Fig. 1). Theological degradation takes place in a ‘‘carrousel type’’ bioreactorith anoxic/aerobic zones and an average retention time of 10 h. Inis case, the influent samples were taken after sand and greasemoval and the effluent samples were taken after secondaryarification.
Both facilities receive a day contaminant charge between 1 andkgCOD/m3d, being the BOD5/COD relationship upon 0.4–0.9, soese are middle or easily biodegradable wastewaters. However,WTP1 receives a 25% of industrial wastewater and 75%unicipal wastewater, whereas WWTP2 receives only municipalastewater that includes several hospital effluents (around 3% of
Please cite this article in press as: M. Fernandez, et al., Seasonal owastewaters, J. Environ. Chem. Eng. (2014), http://dx.doi.org/10.10
the total wastewater that arrives to WWTP2 comes fromhospitals). WWTP1 and WWTP2 serve a population equivalentof 260,000 and 20,000 respectively.
Removal of micropollutants within activated sludge systemscan be associated to three main mechanisms: volatilization to air,sorption to the sludge and biological conversion. Models referringto pharmaceutical compounds usually did not include volatiliza-tion because it is not considered a significant removal mechanismfor this family. Additionally, sorption mechanism is complex andstill remains not sufficiently documented [13]. In this work, onlydegradation in the biological reactors was considered to determineapparent kinetic constants. Large municipal wastewater treatmentplants could be represented as plug flow or ideally mixed tank inseries [14]. Equations for biodegradation modeling usuallyconsider the degradation of dissolved micropollutant concentra-tion following a first-order kinetic [13]. Plug flow and first-ordertransformation kinetics were assumed in this case:
lnCi
Ce¼ ku (1)
where Ci is the pollutant influent concentration, Ce the pollutanteffluent concentration, k is the apparent kinetic constant forcontaminant removal and u is the hydraulic retention time of thebiological reactor.
In order to calculate apparent activation energy, an Arrheniustype equation was employed:
k ¼ k0e�Ea=RT (2)
where k0 is the pre-exponential factor, Ea is the apparent activationenergy, T is the absolute temperature and R is the universal gasconstant.
Analytical methodology
As first step, wastewater samples underwent vacuum filtrationtwice (20–25 mm Whatman filter paper and 0.45 mm AlbetLabscience nitrocellulose filter). Solid-phase extraction (SPE)method was employed to concentrate the analytes from theaqueous samples; MCX 3cc/60 mg, 60 mm (Waters Oasis) car-tridges were used and 0.5 L of influent samples and 1 L of effluentsamples were loaded. Recovery values for MCX extraction arereported in Table 2. The volumes of sample to be filtered wereselected considering previous works [15,16] and the cartridgemanufacturer’s instructions. After SPE, cartridges were dried for1 h, the analytes were eluted (3 mL of ethyl acetate, 3 mL of 50/50ethyl acetate/acetone and 3 mL of 48/48/2 ethyl acetate/acetone/ammonium hydroxide) and extracts were evaporated to drynessunder a nitrogen stream. Ethyl acetate (�99.8%, Sigma–Aldrich)(1.5 mL) was used for reconstitution and the reconstituted sampleswere filtered (0.20 mm Whatman nylon filter) [15]. All compounds,except caffeine, were analyzed after a derivatization step with N-Methyl-N-(trimethylsilyl)trifluoroacetamide (MSTFA) (Sigma–Aldrich). For this purpose, 100 mL of MSTFA were added to 100 mLof the reconstituted sample and this mixture was kept for 35 minin an oven at 65 8C. Amber autosampler vials were employed.
Finally, samples were injected onto a GC/MS (Agilent Technol-ogies; 6890 N Network GC System, 5975 inert Mass SelectiveDetector, 7683B Series injector, 7683 series Autosampler) fittedwith a column HP-5MS (30 m � 0.25 mm id � 0.25 mm, 19091S-433, Agilent Technologies). The carrier gas was ultrapure helium ata constant flow of 1.3 mL/min. The oven temperature was held at50 8C for 30 s, and then programmed at 10 8C/min to 250 8C withthe final temperature being held for 5 min. A sample volume of1 mL was injected in the splitless mode. The transfer line and ionsource were set at 280 8C and 230 8C, respectively. Each compound
ccurrence and removal of pharmaceutical products in municipal16/j.jece.2014.01.023
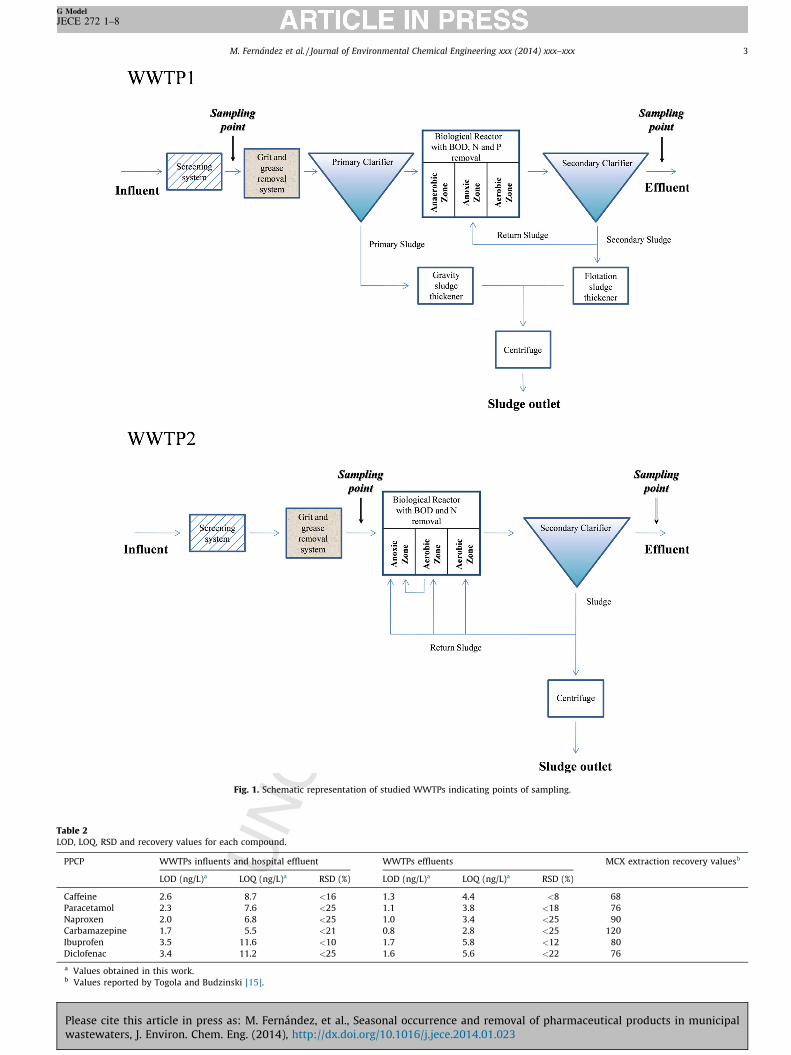
Fig. 1. Schematic representation of studied WWTPs indicating points of sampling.
Table 2LOD, LOQ, RSD and recovery values for each compound.
PPCP WWTPs influents and hospital effluent WWTPs effluents MCX extraction recovery valuesb
LOD (ng/L)a LOQ (ng/L)a RSD (%) LOD (ng/L)a LOQ (ng/L)a RSD (%)
Caffeine 2.6 8.7 <16 1.3 4.4 <8 68
Paracetamol 2.3 7.6 <25 1.1 3.8 <18 76
Naproxen 2.0 6.8 <25 1.0 3.4 <25 90
Carbamazepine 1.7 5.5 <21 0.8 2.8 <25 120
Ibuprofen 3.5 11.6 <10 1.7 5.8 <12 80
Diclofenac 3.4 11.2 <25 1.6 5.6 <22 76
a Values obtained in this work.b Values reported by Togola and Budzinski [15].
M. Fernandez et al. / Journal of Environmental Chemical Engineering xxx (2014) xxx–xxx 3
G Model
JECE 272 1–8
Please cite this article in press as: M. Fernandez, et al., Seasonal occurrence and removal of pharmaceutical products in municipalwastewaters, J. Environ. Chem. Eng. (2014), http://dx.doi.org/10.1016/j.jece.2014.01.023
151 w152 id153 an154
155 Al156 an157 co158 of
159 Re
160 PP
161
162 hi163 th164 an165 pa166 ov167 al168 pr169 as170
171 av172 ca173 W174 to175 fo176 w177 va178 on179 re180 co181 co182 co
183184185186187188189190191192193194195196197198199200201202203204205206207208209210211212213214215216217
Table 3Levels of PPCPs in the WWTPs 1 and 2 (average concentrations � SD and minimal and maximum values) compared with values reported by other authors. Average concentrations
were obtained by employing all the concentrations measured during the year.
PPCP Average concentrations (mg/L) � SD Concentration range (minimum–maximum) (mg/L)
WWTP1 WWTP2 This work Literature
Influent Effluent Influent Effluent Influent Effluent Influent References Effluent References
Caffeine 2.3 � 1.7 0.02 � 0.01 5.4 � 2.6 0.05 � 0.05 0.8–7.8 n.d.-0.1 0.2–63 [17,21,29] 0.002–9.9 [15,17,21,29]
Paracetamol 0.35 � 0.60 0.01 � 0.00 2.3 � 1.2 0.03 � 0.04 0.04–4.0 0.004–0.1 0.07–26 [26,30] n.d.-5.9 [26,30]
Naproxen 3.5 � 1.1 0.71 � 0.33 11.6 � 1.9 0.57 � 0.68 2.3–14 0.1–1.6 1.1–53 [3,17,31] 0.2–6.2 [3,15,17,31]
Carbamazepine 0.10 � 0.10 0.16 � 0.13 0.13 � 0.07 0.19 � 0.10 0.03–0.3 0.08–0.4 n.d.-3.7 [3,5,17,21,29] n.d.-6.2 [3,5,17,21,29]
Ibuprofen 11.2 � 4.0 1.6 � 2.8 30.5 � 10.0 0.91 � 1.04 6.5–42 0.03–5.7 8.8–168 [31,33] n.d.-3.8 [15,31–33]
Diclofenac 0.16 � 0.06 0.55 � 0.41 0.30 � 0.11 0.39 � 0.18 0.08–0.4 0.2–1.1 n.d.-5.0 [3,17,31,33] n.d.-2.5 [3,15,17,31–33]
n.d.: not detected.
TaLe
an
co
the
P
C
P
N
C
I
D
n.d
M. Fernandez et al. / Journal of Environmental Chemical Engineering xxx (2014) xxx–xxx4
G Model
JECE 272 1–8
as firstly characterized individually in scan mode in order toentify the main ions (m/z ratio) constituting the mass spectrumd to choose the ions for quantification.PPCP GC grade reference standards were supplied by Sigma–
drich. The recovery values, the RSD (Relative Standard Deviation)d the limits of detection (LOD) and quantification (LOQ) werempound dependent (see Table 2). The correlation coefficient (r2)
the calibration curves was always higher than 0.990.
sults and discussion
CP occurrence
As can be seen in Tables 3 and 4, the compounds with theghest concentrations in the influents in both WWTPs and also ine hospital wastewaters were ibuprofen, paracetamol, naproxend caffeine. This is not surprising given that ibuprofen,racetamol and naproxen are painkillers found in numerouser-the-counter medications commonly used in hospitals but
so in households. Additionally to its use in pharmaceuticaloducts, caffeine is frequently employed in beverages and foods
a stimulant.It should be also pointed out that, as it is shown in Table 3,
erage parameter values are much higher (excepting forrbamazepine, in two-fold concentration or even more) inWTP2 than in WWTP1. When the amount of PPCPs that arrived
the WWTPs per capita was calculated, similar values were foundr both facilities in the case of carbamazepine and diclofenac,hereas four-fold values were found for paracetamol and two-foldlues were found for the rest of the compounds. WWTP2 receivesly municipal and hospital wastewaters, whereas WWTP1ceives municipal wastewaters but also wastewaters frommmercial and industrial parks. Obviously, the wastewatersming from commercial and industrial facilities would notntribute much to the pharmaceutical loads. Surprisingly, and
218219220221222223224225
226
227228229230231
ble 4vels of PPCPs in hospital wastewaters (average concentrations � SD and minimal
d maximum values) compared with values reported by other authors. Average
ncentrations were obtained by employing all the concentrations measured during
year.
PCP Concentrations
(mg/L) � SD
Concentration range
(minimum–maximum) (mg/L)
This work Literature References
affeine 24.0 � 22.7 8.5–50.0 12.3–42.0 [22]
aracetamol 0.92 � 1.01 0.1–2.1 3.1–21.2 [22]
aproxen 1.3 � 0.4 0.9–1.6 n.d.–21.8 [22,34]
arbamazepine 0.06 � 0.11 n.d.–0.19 n.d.–2.0 [15,22,34]
buprofen 13.1 � 8.6 4.5–21.7 1.5–151 [15,22,34]
iclofenac 0.12 � 0.07 0.04–0.2 n.d.–6.9 [15,22,34]
.: not detected.
Please cite this article in press as: M. Fernandez, et al., Seasonal owastewaters, J. Environ. Chem. Eng. (2014), http://dx.doi.org/10.10
excepting for caffeine, in general, hospital values were on the sameorder of magnitude as those obtained for both WWTPs (Table 4).Therefore, in this case hospital effluents could not be considered asresponsible for increasing the concentration of these pharmaceu-ticals in the untreated wastewaters.
The ranges of PPCPs concentrations detected in the influents ofboth WWTPs were comparable to concentrations reported in otherstudies worldwide (see Table 3). Particularly, caffeine, carbamaze-pine, and naproxen concentrations were similar to average valuesobserved by Santos et al. [17] (4.9–7.4 mg/L, 0.4–0.5 mg/L and 4.3–8.1 mg/L respectively) in different WWTPs located in the south ofSpain, whereas ibuprofen and diclofenac influent concentrationswere similar to those reported by Hijosa-Valsero et al. [18] (8.4–24.2 mg/L and 0.4–0.8 mg/L respectively) in WWTPs located in thecenter of Spain. Regarding WWTPs effluents, caffeine, carbamaze-pine, ibuprofen and naproxen, concentration levels were in generallower than those reported for several WWTPs located in theSpanish south (0.2–2.4 mg/L, 0.2–0.7 mg/L, 0.06–10.2 mg/L and0.8–4.4 mg/L respectively) [17,19], whereas most of diclofenacconcentrations were slightly higher than average values reportedby these authors (n.d.–0.24 mg/L).
Table 4 compares the PPCPs levels observed here in the hospitalwastewater with those found in the literature. With the exceptionof caffeine, our results were slightly lower. However, ibuprofen andcarbamazepine mean value concentrations were comparable tothose reported by Gomez et al. [20] (19.8 mg/L and 0.04 mg/Lrespectively) in wastewaters from a private healthcare centerlocated in the southeast of Spain.
PPCPs concentrations in municipal effluents depend on differ-ent factors, such as influent composition, removal efficacies,WWTP performance, season or localization. In general, theoutcoming concentrations measured here were within the rangefound in literature for WWTPs worldwide (see Table 3). As it can beseen, maximum values were lower than the upper values reportedby other authors, excepting for ibuprofen. Minimum values wereslightly higher, with the exception of naproxen. Considering onlystudies carried out in Spanish WWTPs, concentrations rangesfound in this work were included in the range described by Santoset al. [17] and Hijosa-Valsero et al. [18] for caffeine (0.17–12.8 mg/L), naproxen (0.05–5.1 mg/L), carbamazepine (<0.02–1.29 mg/L)and ibuprofen (0.002–55.0 mg/L), whereas diclofenac maximumvalue was higher than those reported by these authors (0.14–0.66 mg/L).
Removal efficiencies
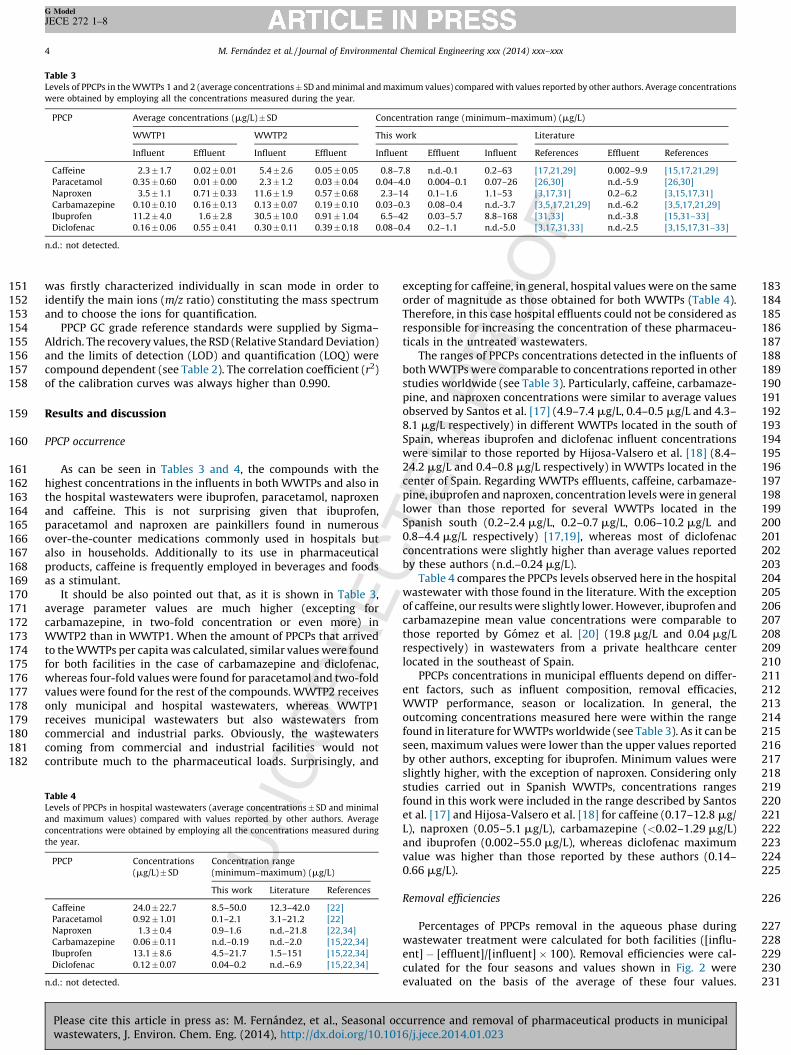
Percentages of PPCPs removal in the aqueous phase duringwastewater treatment were calculated for both facilities ([influ-ent] � [effluent]/[influent] � 100). Removal efficiencies were cal-culated for the four seasons and values shown in Fig. 2 wereevaluated on the basis of the average of these four values.
ccurrence and removal of pharmaceutical products in municipal16/j.jece.2014.01.023
232
233
234
235
236237238239240241242243244245246247248249250251252253254255256257
Fig. 2. Average removal efficiency for paracetamol, ibuprofen, naproxen and
caffeine in both WWTPs. Bars indicate SD.
M. Fernandez et al. / Journal of Environmental Chemical Engineering xxx (2014) xxx–xxx 5
G Model
JECE 272 1–8
Therefore, it was considered the removal of PPCPs by degradation,but also by absorption phenomena.
Diclofenac and carbamazepine persisted in WWTP effluentswith similar or even slightly higher concentrations than those
0
10
20
30
40
50
60
Autumn Winter Spring Summer
Con
cent
ratio
n (µ
g/L
)
Caffeine
0,0
0,5
1,0
1,5
2,0
2,5
3,0
3,5
4,0
4,5
Autumn Winter Spring Summer
Con
cent
ratio
n (µ
g/L
)
Paracetamol
0
2
4
6
8
10
12
14
16
Autumn Winter Spring Summer
Con
cent
ratio
n (µ
g/L
)
Naproxen
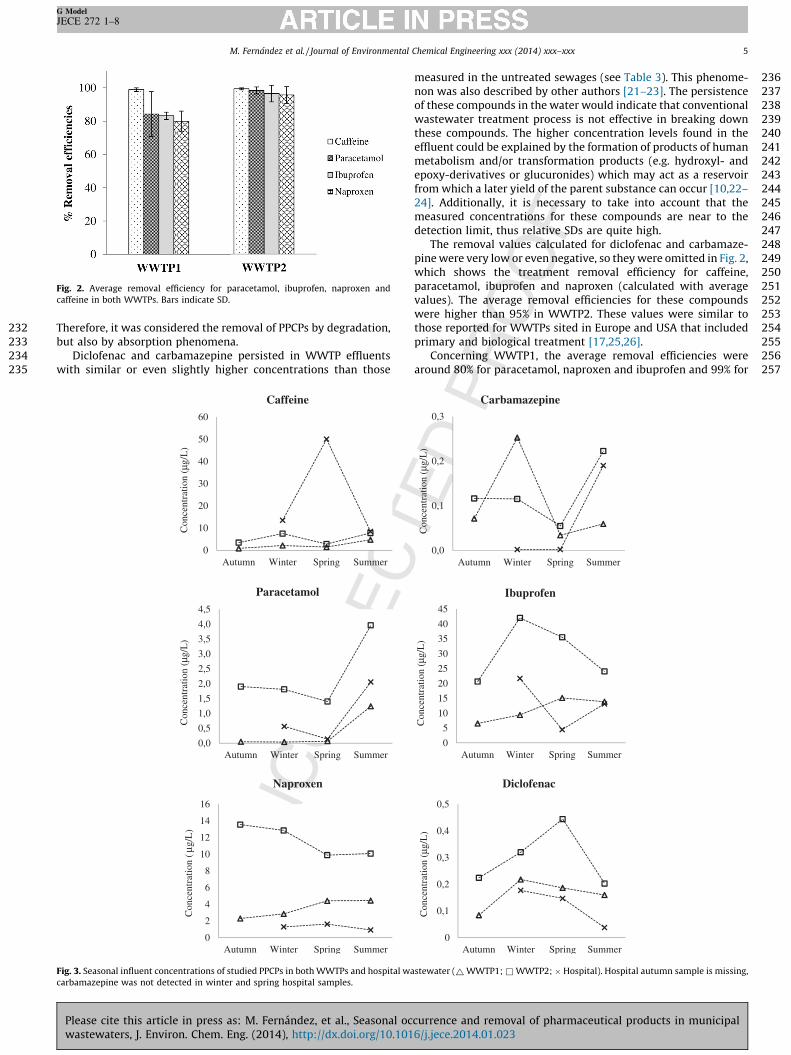
Fig. 3. Seasonal influent concentrations of studied PPCPs in both WWTPs and hospital wa
carbamazepine was not detected in winter and spring hospital samples.
Please cite this article in press as: M. Fernandez, et al., Seasonal ocwastewaters, J. Environ. Chem. Eng. (2014), http://dx.doi.org/10.101
measured in the untreated sewages (see Table 3). This phenome-non was also described by other authors [21–23]. The persistenceof these compounds in the water would indicate that conventionalwastewater treatment process is not effective in breaking downthese compounds. The higher concentration levels found in theeffluent could be explained by the formation of products of humanmetabolism and/or transformation products (e.g. hydroxyl- andepoxy-derivatives or glucuronides) which may act as a reservoirfrom which a later yield of the parent substance can occur [10,22–24]. Additionally, it is necessary to take into account that themeasured concentrations for these compounds are near to thedetection limit, thus relative SDs are quite high.
The removal values calculated for diclofenac and carbamaze-pine were very low or even negative, so they were omitted in Fig. 2,which shows the treatment removal efficiency for caffeine,paracetamol, ibuprofen and naproxen (calculated with averagevalues). The average removal efficiencies for these compoundswere higher than 95% in WWTP2. These values were similar tothose reported for WWTPs sited in Europe and USA that includedprimary and biological treatment [17,25,26].
Concerning WWTP1, the average removal efficiencies werearound 80% for paracetamol, naproxen and ibuprofen and 99% for
0
5
10
15
20
25
30
35
40
45
Autumn Winter Spring Summer
Con
cent
ratio
n (µ
g/L
)
Ibuprofen
0
0,1
0,2
0,3
0,4
0,5
Autumn Winter Spring Summer
Con
cent
ratio
n (µ
g/L
)
Diclofenac
0,0
0,1
0,2
0,3
Autumn Winter Spring Summer
Con
cent
ratio
n (µ
g/L
)
Carbamazepine
stewater (~ WWTP1; & WWTP2; � Hospital). Hospital autumn sample is missing,
currence and removal of pharmaceutical products in municipal6/j.jece.2014.01.023
258 ca259 ib260 by261 W262 tr263
264 av265 an266 re267 hy268 W269 pr270 in271 ra272 pr273 an274 re
275 Se
276
277 co278 (F279 w280 w281 ob282 an283 Th
284285286287288289290291292293294295296297298299300301302303304305306307308309310311
FigW
M. Fernandez et al. / Journal of Environmental Chemical Engineering xxx (2014) xxx–xxx6
G Model
JECE 272 1–8
ffeine. Despite of being less efficient than WWTP2, naproxen anduprofen removal values were still slightly higher than those cited
Blair et al. [27] (73% and 88% respectively) for North AmericanWTPs that included preliminary, primary and biological
eatment and chlorine disinfection.Regarding removal efficiencies for BOD5 and nitrogen, again the
erage values are slightly higher in WWTP2 than in WWTP1 (99%d 80%, 98% and 68%, respectively). The higher efficiencymovals observed in WWTP2 could be explained because thedraulic retention time of the biologic reactor was higher inWTP2 than in WWTP1 (10 and 8 h, respectively). Besides, theesence of pollutants coming from industrial wastewaters mayterfere in the elimination process, decreasing biodegradationtes in WWTP1. Finally, it is important to point out that theimary clarification previous to biological treatment and theaerobic step in WWTP1 did not contribute to improve the PPCPsmoval efficiencies.
asonality
Samples taken in autumn, winter, spring and summer werempared to examine seasonal trends in PPCPs concentrationig. 3). Excepting for the increase detected in spring in hospitalastewater, the seasonal variation of caffeine in WWTP influentsas minimal. Regarding carbamazepine, the highest value wasserved in winter in WWTP1 influent and in summer in WWTP2d hospital wastewater (0.25, 022 and 0.19 mg/L, respectively).e increase of the concentration observed in WWTP2 coincided
312313
0
100
200
300
400
500
600
SummerSpringWinterAutumn
Con
cent
ratio
n (m
g/L
)
BOD 5
0
10
20
30
40
50
60
SummerSpringWinterAutumn
Con
cent
ratio
n (m
g/L
)
Total N
. 4. Seasonal influent concentrations of water parameters in both WWTPs (~WTP1; & WWTP2) (data from the ‘‘Consorcio de Aguas de Asturias’’).
Please cite this article in press as: M. Fernandez, et al., Seasonal owastewaters, J. Environ. Chem. Eng. (2014), http://dx.doi.org/10.10
with an increase in hospital wastewater which is understandableas this hospital wastewater is treated in WWTP2. Paracetamolincreased notably in all effluents in summer, while ibuprofen had amaximum in winter in WWTP2 and hospital wastewaters.Variations in naproxen were minimal for hospital wastewaters,whereas in WWTP1, the concentrations measured in spring andsummer were double than those obtained in autumn and winter.On the opposite, the highest values for WWTP2 were found inautumn and winter. Minimum values of diclofenac were found inautumn and summer for both WWTPs and hospital wastewaters,observing a maximum in spring for WWTP2. Considering all thesedata, tendencies in the PPCPs concentrations of the untreatedwastewaters could not be established, depending the followedpattern on the compound and specific water. It is necessary to takein mind that several factors are involved to determine thecomposition of these wastewaters, mainly the amount of PPCPsreleased and the abundance of rainfall that dilute the contamina-tion (there is no separation between rainwater and sewage).
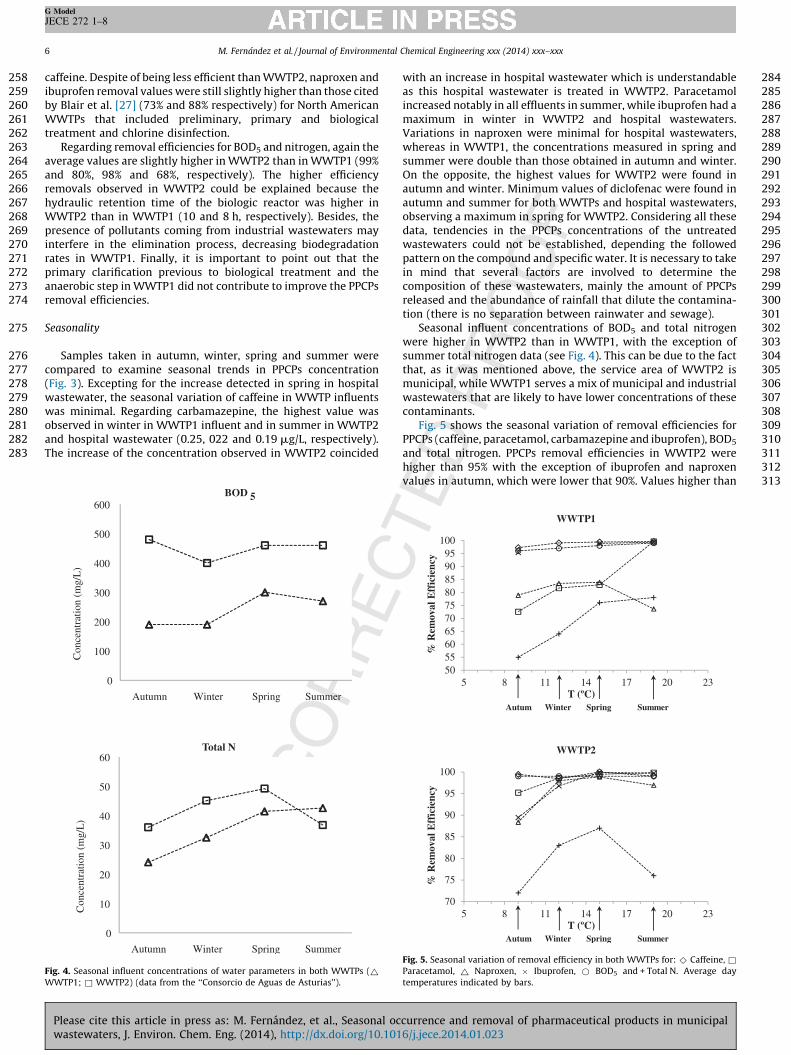
Seasonal influent concentrations of BOD5 and total nitrogenwere higher in WWTP2 than in WWTP1, with the exception ofsummer total nitrogen data (see Fig. 4). This can be due to the factthat, as it was mentioned above, the service area of WWTP2 ismunicipal, while WWTP1 serves a mix of municipal and industrialwastewaters that are likely to have lower concentrations of thesecontaminants.
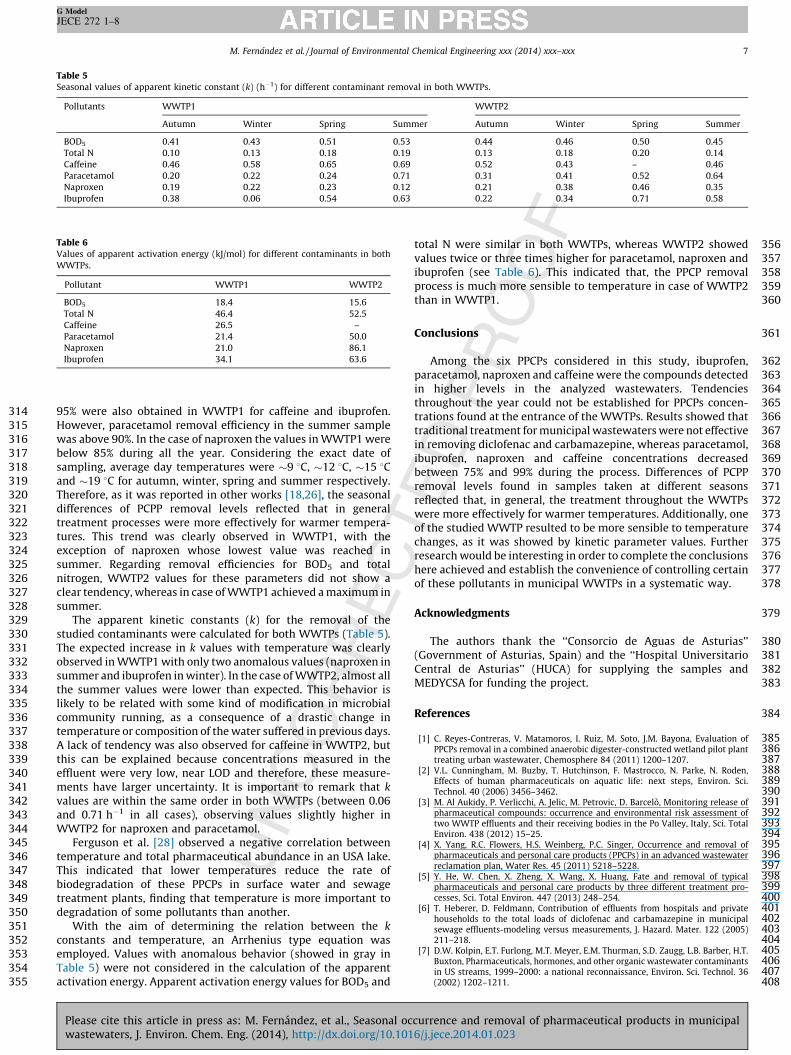
Fig. 5 shows the seasonal variation of removal efficiencies forPPCPs (caffeine, paracetamol, carbamazepine and ibuprofen), BOD5
and total nitrogen. PPCPs removal efficiencies in WWTP2 werehigher than 95% with the exception of ibuprofen and naproxenvalues in autumn, which were lower that 90%. Values higher than
50556065707580859095
100
5 8 11 14 17 20 23
% R
emov
al E
ffic
ienc
y
WWTP1
T (ºC)Autum Wi nter Sp ring Summ er
70
75
80
85
90
95
100
5 8 11 14 17 20 23
% R
emov
al E
ffic
ienc
y
WWTP2
T (ºC)Autum Wi nter Sp ring Summ er
Fig. 5. Seasonal variation of removal efficiency in both WWTPs for: ^ Caffeine, &Paracetamol, ~ Naproxen, � Ibuprofen, * BOD5 and + Total N. Average day
temperatures indicated by bars.
ccurrence and removal of pharmaceutical products in municipal16/j.jece.2014.01.023
314
315
316
317
318
319
320
321
322
323
324
325
326
327
328
329
330
331
332
333
334
335
336
337
338
339
340
341
342
343
344
345
346
347
348
349
350
351
352
353
354
355
356357358359360
361
362363364365366367368369370371372373374375376377378
379
380381382383
384
385386387388389390391392393394395396397398399400401402403404405406407408
Table 5Seasonal values of apparent kinetic constant (k) (h�1) for different contaminant removal in both WWTPs.
Pollutants WWTP1 WWTP2
Autumn Winter Spring Summer Autumn Winter Spring Summer
BOD5 0.41 0.43 0.51 0.53 0.44 0.46 0.50 0.45
Total N 0.10 0.13 0.18 0.19 0.13 0.18 0.20 0.14
Caffeine 0.46 0.58 0.65 0.69 0.52 0.43 – 0.46
Paracetamol 0.20 0.22 0.24 0.71 0.31 0.41 0.52 0.64
Naproxen 0.19 0.22 0.23 0.12 0.21 0.38 0.46 0.35
Ibuprofen 0.38 0.06 0.54 0.63 0.22 0.34 0.71 0.58
Table 6Values of apparent activation energy (kJ/mol) for different contaminants in both
WWTPs.
Pollutant WWTP1 WWTP2
BOD5 18.4 15.6
Total N 46.4 52.5
Caffeine 26.5 –
Paracetamol 21.4 50.0
Naproxen 21.0 86.1
Ibuprofen 34.1 63.6
M. Fernandez et al. / Journal of Environmental Chemical Engineering xxx (2014) xxx–xxx 7
G Model
JECE 272 1–8
95% were also obtained in WWTP1 for caffeine and ibuprofen.However, paracetamol removal efficiency in the summer samplewas above 90%. In the case of naproxen the values in WWTP1 werebelow 85% during all the year. Considering the exact date ofsampling, average day temperatures were �9 8C, �12 8C, �15 8Cand �19 8C for autumn, winter, spring and summer respectively.Therefore, as it was reported in other works [18,26], the seasonaldifferences of PCPP removal levels reflected that in generaltreatment processes were more effectively for warmer tempera-tures. This trend was clearly observed in WWTP1, with theexception of naproxen whose lowest value was reached insummer. Regarding removal efficiencies for BOD5 and totalnitrogen, WWTP2 values for these parameters did not show aclear tendency, whereas in case of WWTP1 achieved a maximum insummer.
The apparent kinetic constants (k) for the removal of thestudied contaminants were calculated for both WWTPs (Table 5).The expected increase in k values with temperature was clearlyobserved in WWTP1 with only two anomalous values (naproxen insummer and ibuprofen in winter). In the case of WWTP2, almost allthe summer values were lower than expected. This behavior islikely to be related with some kind of modification in microbialcommunity running, as a consequence of a drastic change intemperature or composition of the water suffered in previous days.A lack of tendency was also observed for caffeine in WWTP2, butthis can be explained because concentrations measured in theeffluent were very low, near LOD and therefore, these measure-ments have larger uncertainty. It is important to remark that k
values are within the same order in both WWTPs (between 0.06and 0.71 h�1 in all cases), observing values slightly higher inWWTP2 for naproxen and paracetamol.
Ferguson et al. [28] observed a negative correlation betweentemperature and total pharmaceutical abundance in an USA lake.This indicated that lower temperatures reduce the rate ofbiodegradation of these PPCPs in surface water and sewagetreatment plants, finding that temperature is more important todegradation of some pollutants than another.
With the aim of determining the relation between the k
constants and temperature, an Arrhenius type equation wasemployed. Values with anomalous behavior (showed in gray inTable 5) were not considered in the calculation of the apparentactivation energy. Apparent activation energy values for BOD5 and
Please cite this article in press as: M. Fernandez, et al., Seasonal ocwastewaters, J. Environ. Chem. Eng. (2014), http://dx.doi.org/10.101
total N were similar in both WWTPs, whereas WWTP2 showedvalues twice or three times higher for paracetamol, naproxen andibuprofen (see Table 6). This indicated that, the PPCP removalprocess is much more sensible to temperature in case of WWTP2than in WWTP1.
Conclusions
Among the six PPCPs considered in this study, ibuprofen,paracetamol, naproxen and caffeine were the compounds detectedin higher levels in the analyzed wastewaters. Tendenciesthroughout the year could not be established for PPCPs concen-trations found at the entrance of the WWTPs. Results showed thattraditional treatment for municipal wastewaters were not effectivein removing diclofenac and carbamazepine, whereas paracetamol,ibuprofen, naproxen and caffeine concentrations decreasedbetween 75% and 99% during the process. Differences of PCPPremoval levels found in samples taken at different seasonsreflected that, in general, the treatment throughout the WWTPswere more effectively for warmer temperatures. Additionally, oneof the studied WWTP resulted to be more sensible to temperaturechanges, as it was showed by kinetic parameter values. Furtherresearch would be interesting in order to complete the conclusionshere achieved and establish the convenience of controlling certainof these pollutants in municipal WWTPs in a systematic way.
Acknowledgments
The authors thank the ‘‘Consorcio de Aguas de Asturias’’(Government of Asturias, Spain) and the ‘‘Hospital UniversitarioCentral de Asturias’’ (HUCA) for supplying the samples andMEDYCSA for funding the project.
References
[1] C. Reyes-Contreras, V. Matamoros, I. Ruiz, M. Soto, J.M. Bayona, Evaluation ofPPCPs removal in a combined anaerobic digester-constructed wetland pilot planttreating urban wastewater, Chemosphere 84 (2011) 1200–1207.
[2] V.L. Cunningham, M. Buzby, T. Hutchinson, F. Mastrocco, N. Parke, N. Roden,Effects of human pharmaceuticals on aquatic life: next steps, Environ. Sci.Technol. 40 (2006) 3456–3462.
[3] M. Al Aukidy, P. Verlicchi, A. Jelic, M. Petrovic, D. Barcelo, Monitoring release ofpharmaceutical compounds: occurrence and environmental risk assessment oftwo WWTP effluents and their receiving bodies in the Po Valley, Italy, Sci. TotalEnviron. 438 (2012) 15–25.
[4] X. Yang, R.C. Flowers, H.S. Weinberg, P.C. Singer, Occurrence and removal ofpharmaceuticals and personal care products (PPCPs) in an advanced wastewaterreclamation plan, Water Res. 45 (2011) 5218–5228.
[5] Y. He, W. Chen, X. Zheng, X. Wang, X. Huang, Fate and removal of typicalpharmaceuticals and personal care products by three different treatment pro-cesses, Sci. Total Environ. 447 (2013) 248–254.
[6] T. Heberer, D. Feldmann, Contribution of effluents from hospitals and privatehouseholds to the total loads of diclofenac and carbamazepine in municipalsewage effluents-modeling versus measurements, J. Hazard. Mater. 122 (2005)211–218.
[7] D.W. Kolpin, E.T. Furlong, M.T. Meyer, E.M. Thurman, S.D. Zaugg, L.B. Barber, H.T.Buxton, Pharmaceuticals, hormones, and other organic wastewater contaminantsin US streams, 1999–2000: a national reconnaissance, Environ. Sci. Technol. 36(2002) 1202–1211.
currence and removal of pharmaceutical products in municipal6/j.jece.2014.01.023
409 [8410
411
412 [9413
414
415 [10416
417
418 [11419
420
421 [12422
423
424 [13425
426
427 [14428
429
430 [15431
432 [16433
434
435 [17436
437
438 [18439
440
441 [19442
443
444 [20445
446
447 Q3
448449450451452453454455456457458459460461462463464465466467468469470471472473474475476477478479480481482483484485486
M. Fernandez et al. / Journal of Environmental Chemical Engineering xxx (2014) xxx–xxx8
G Model
JECE 272 1–8
] N.M. Vieno, T. Tuhkanen, L. Kronberg, Seasonal variation in the occurrence ofpharmaceutical sin effluents from a sewage treatment plant and in the recipientwater, Environ. Sci. Technol. 39 (2005) 8220–8226.
] G.A. Loraine, M.E. Pettigrove, Seasonal variations in concentrations of pharma-ceuticals and personal care products in drinking water and reclaimed wastewaterin southern California, Environ. Sci. Technol. 40 (2006) 687–695.
] Q. Sui, J. Huang, S. Deng, G. Yu, Q. Fan, Occurrence and removal of pharmaceu-ticals, caffeine and DEET in wastewater treatment plants of Beijing, China, WaterRes. 44 (2010) 417–426.
] P. Verlicchi, M. Al Aukidy, A. Galletti, M. Petrovic, D. Barcelo, Hospital effluent:investigation of the concentrations and distribution of pharmaceuticals andenvironmental risk assessment, Sci. Total Environ. 430 (2012) 109–118.
] B. Gy Plosz, H. Leknes, H. Liltved, K.V. Thomas, Diurnal variations in the occur-rence and the fate of hormones and antibiotics in activated sludge wastewatertreatment in Oslo, Norway, Sci. Total Environ. 408 (2010) 1915–1924.
] M. Pomies, J.M. Choubert, C. Wisniewski, M. Coquery, Modelling of micropollutantremoval in biological wastewater treatments: a review, Sci. Total Environ. 443(2013) 733–748.
] M. Novak, P. Horvat, Mathematical modelling and optimisation of a waste watertreatment plant by combined oxygen electrode and biological waste watertreatment model, Appl. Math. Model. 36 (2012) 3813–3825.
] A. Togola, H. Budzinski, Multi-residue analysis of pharmaceutical compounds inaqueous samples, J. Chromatogr. A 1177 (2008) 150–158.
] S.S. Verenitch, C.J. Lowe, A. Mazumder, Determination of acidic drugs and caffeinein municipal wastewaters and receiving waters by gas chromatography-ion traptandem mass spectrometry, J. Chromatogr. A 1116 (2006) 193–203.
] J. Santos, I. Aparicio, M. Callejon, E. Alonso, Occurrence of pharmaceutically activecompounds during 1-year period in wastewaters from four wastewater treatmentplants in Seville (Spain), J. Hazard. Mater. 164 (2009) 1509–1516.
] M. Hijosa-Valsero, V. Matamoros, J. Martın-Villacorta, E. Becares, J. Bayona,Assessment of full-scale natural systems for the removal of PPCPs from waste-water in small communities, Water Res. 44 (2010) 1429–1439.
] M.D. Camacho-Munoz, J.L. Santos, I. Aparicio, E. Alonso, Presence of pharmaceu-tically active compounds in Donana Park (Spain) main watersheds, J. Hazard.Mater. 177 (2010) 1159–1162.
] M. Gomez, M. Patrovic, A. Fernandez-Alba, D. Barcelo, Determination of pharma-ceuticals of various therapeutic classes by solid-phase extraction and liquidchromatography-tandem mass spectrometry analysis in hospital effluent waste-waters, J. Chromatogr. 1114 (2006) 224–233.
Please cite this article in press as: M. Fernandez, et al., Seasonal owastewaters, J. Environ. Chem. Eng. (2014), http://dx.doi.org/10.10
[21] A. Spongberg, J. Witter, Pharmaceutical compounds in the wastewater processstream in Northwest Ohio, Sci. Total Environ. 397 (2008) 148–157.
[22] C. Kosma, D. Lambropoulou, T. Albanis, Occurrence and removal of PPCPs in munici-pal and hospital wastewaters in Greece, J. Hazard. Mater. 179 (2010) 804–817.
[23] A. Jelic, M. Gros, A. Ginebreda, R. Cespedes-Sanchez, F. Ventura, M. Petrovic, D.Barcelo, Occurrence, partition and removal of pharmaceuticals in sewage waterand sludge during wastewater treatment, Water Res. 45 (2011) 1165–1176.
[24] T. Rauch-Williams, C. Hoppe-Jones, J. Drewes, The role of organic matter in theremoval of emerging trace organic chemicals during managed aquifer recharge,Water Res. 44 (2010) 449–460.
[25] S. Zorita, L. Martensson, L. Mathiasson, Occurrence and removal of pharmaceu-ticals in a municipal sewage treatment system in the south of Sweden, Sci. TotalEnviron. 407 (2009) 2760–2770.
[26] J.T. Yu, E.J. Bouwer, M. Coelthan, Occurrence and biodegradability studies ofselected pharmaceuticals and personal care products in sewage effluent, Agric.Water Manage. 86 (2006) 72–80.
[27] B.D. Blair, J.P. Crago, C.J. Hedman, R.J.F. Treguer, C. Magruder, L.S. Royer, R.D. Klaper,Evaluation of a model for the removal of pharmaceuticals, personal care products,and hormones from wastewater, Sci. Total Environ. 444 (2013) 515–521.
[28] P.J. Ferguson, M.J. Bernot, J.C. Doll, T.E. Lauer, Detection of pharmaceuticals andpersonal care products (PPCPs) in near-shore habitats of southern Lake Michigan,Sci. Total Environ. 458–460 (458) (2013) 187–190.
[29] A.Y.C. Lin, T.H. Yu, S.K. Lateef, Removal of pharmaceuticals in secondary waste-water treatment processes in Taiwan, J. Hazard. Mater. 167 (2009) 1163–1169.
[30] P.H. Roberts, K.V. Thomas, The occurrence of selected pharmaceuticals in waste-water effluent and surface waters of the lower Tyne catchment, Sci. Total Environ.356 (2006) 143–153.
[31] L. Lishman, S.A. Smyth, K. Sarafin, S. Kleywegt, J. Toito, T. Peart, B. Lee, M. Servos,M. Beland, P. Seto, Occurrence and reductions of pharmaceuticals and personalcare products and estrogens by municipal wastewater treatment plants inOntario, Canada, Sci. Total Environ. 367 (2006) 544–558.
[32] T. Ternes, Occurrence of drugs in German sewage treatment plants and rivers,Water Res. 32 (1998) 3245–3260.
[33] K. Fent, A.A. Weston, D. Caminada, Ecotoxicology of human pharmaceuticals,Aquat. Toxicol. 76 (2006) 122–159.
[34] L.H.M.L.M. Santos, M. Gros, S. Rodriguez-Mozaz, C. Delerue-Matos, A. Pena, D.Barcelo, M.C.B.S.M. Montenegro, Contribution of hospital effluents to the load ofpharmaceuticals in urban wastewaters: identification of ecologically relevantpharmaceuticals, Sci. Total Environ. 461–462 (461) (2013) 302–310.
ccurrence and removal of pharmaceutical products in municipal16/j.jece.2014.01.023
Related Documents