Page 1 Issue 1, February 2000 CONTENTS Tidal dynamics of the Canning River ............ 2 Water quality is monitored weekly ....... 3 Nitrogen and phospho- rus are the nutrients of most concern ......... 3 Nutrients in the Canning come from diverse sources .......... 3 Pathways… what happens to the nutrients once they enter the estuary? ...... 4 The role of sediments ................... 4 Phytoplankton and macrophytes in the Canning ...................... 5 Seasonal nutrient patterns in the Canning ...................... 5 Summary of nutrient dynamics in the Canning ...................... 9 Symbol glossary ...... 11 Addressing nutrient problems in the Canning .................... 11 Conclusion ............... 11 Glossary ................... 12 Acknowledgments .... 12 For more information ............... 12 Kent Street Weir on the Canning River The Canning River joins with the lower reaches of the Swan River at Melville Water to form the Swan- Canning estuary. The Canning is relatively shallow, ranging from 1 to 6 metres deep. It drains a heavily populated subcatchment that incorporates diverse residential, commercial, industrial and agricultural land uses. Upstream pumping by local water users, releases from upstream dams and the downstream Kent Street Weir regulate river flow. There is considerable seasonal variability in flow, with high flows during the winter months and almost negligible flow in summer. The Kent Street Weir was built and rebuilt several times during the early 20th century to maintain freshwater conditions for irrigation and domestic water supply. Weir boards are put in place in September or October corresponding to reduced river flow. They are then removed with the onset of the first winter rains, usually in April or May. When the weir boards are in place, the freshwater section upstream of the weir is impounded in a pool with minimal flow and low levels of oxygen. Seasonal Nutrient Dynamics in the Canning River and Estuary, 1995–98 Issue 9, October 2002 9

Welcome message from author
This document is posted to help you gain knowledge. Please leave a comment to let me know what you think about it! Share it to your friends and learn new things together.
Transcript
River ScienceOctober 2002
Page 1
Issue 1, February 2000
CONTENTS
Tidal dynamics of theCanning River ............ 2
Water quality ismonitored weekly ....... 3
Nitrogen and phospho-rus are the nutrientsof most concern ......... 3
Nutrients in theCanning come fromdiverse sources .......... 3
Pathways… whathappens to thenutrients once theyenter the estuary? ...... 4
The role ofsediments ................... 4
Phytoplankton andmacrophytes in theCanning ...................... 5
Seasonal nutrientpatterns in theCanning ...................... 5
Summary of nutrientdynamics in theCanning ...................... 9
Symbol glossary ...... 11
Addressing nutrientproblems in theCanning .................... 11
Conclusion ............... 11
Glossary ................... 12
Acknowledgments .... 12
For moreinformation ............... 12
Kent Street Weir on the Canning River
The Canning River joins with the lower reaches of
the Swan River at Melville Water to form the Swan-Canning estuary. The Canning is relatively shallow,
ranging from 1 to 6 metres deep. It drains a heavily
populated subcatchment that incorporates diverseresidential, commercial, industrial and agricultural
land uses. Upstream pumping by local water users,
releases from upstream dams and the downstreamKent Street Weir regulate river flow. There is
considerable seasonal variability in flow, with high
flows during the winter months and almost negligibleflow in summer.
The Kent Street Weir was built and rebuilt several
times during the early 20th century to maintainfreshwater conditions for irrigation and domestic
water supply. Weir boards are put in place in
September or October corresponding to reducedriver flow. They are then removed with the onset of
the first winter rains, usually in April or May. When
the weir boards are in place, the freshwater sectionupstream of the weir is impounded in a pool with
minimal flow and low levels of oxygen.
Seasonal Nutrient Dynamics in theCanning River and Estuary, 1995–98
Issue 9, October 2002
9
River ScienceOctober 2002
Page 2
High nutrient loading from the catchment andsediment nutrient release, coupled with negligible
flow and high temperatures, make the Canning an
ideal environment for plant and algal growth duringsummer. Above the Kent Street Weir, proliferation
of macrophytes in early summer has in recent years
often been followed by blooms of potentially toxicblue-green algae. These blooms can be responsible
for significant water quality and human health
threats. The development of remediation techniquesaimed at reducing the occurrence of harmful algal
blooms in the upper Canning (see River Science 13-
14 and 17-18) has centred on an evolvingunderstanding of nutrient processes in the river.
This document provides a background analysis of
the seasonal nutrient patterns in the Canning Riverprior to current remediation efforts, to explain the
major causes of the algal bloom problem.
Note that all technical terms highlighted in blue aredefined in the glossary.
Tidal dynamics of theCanning RiverTidal influence in the Canning is mostly limited tothe lower reaches by Kent Street Weir. The lower
Canning (the area below the weir to the junction
with Melville water) experiences tidal flow yearround. The upper Canning (above Kent Street Weir)
is influenced by tidal movement when the weir
boards are removed, but during this time is usuallyflushed with fresh water from catchment inflows.
Salt water can move upstream above the Kent Street
Weir when the weir boards are removed (figure 1a),but this does not happen every year and depends on
river flow.
Salt wedge and stratification
The Mediterranean climate of Perth is reflected in
seasonal patterns in the water quality of the Swan-
Canning Estuary. When river flow reduces towardsthe end of winter, tidal movement causes salt water
to move progressively up the estuary. Since the
more saline water is denser it tends to travel upstreamalong the bottom and the lighter fresh water flows
downstream on top. This layering is referred to as
stratification. The saltwater layer pushing its wayupstream underneath a surface layer of fresh water
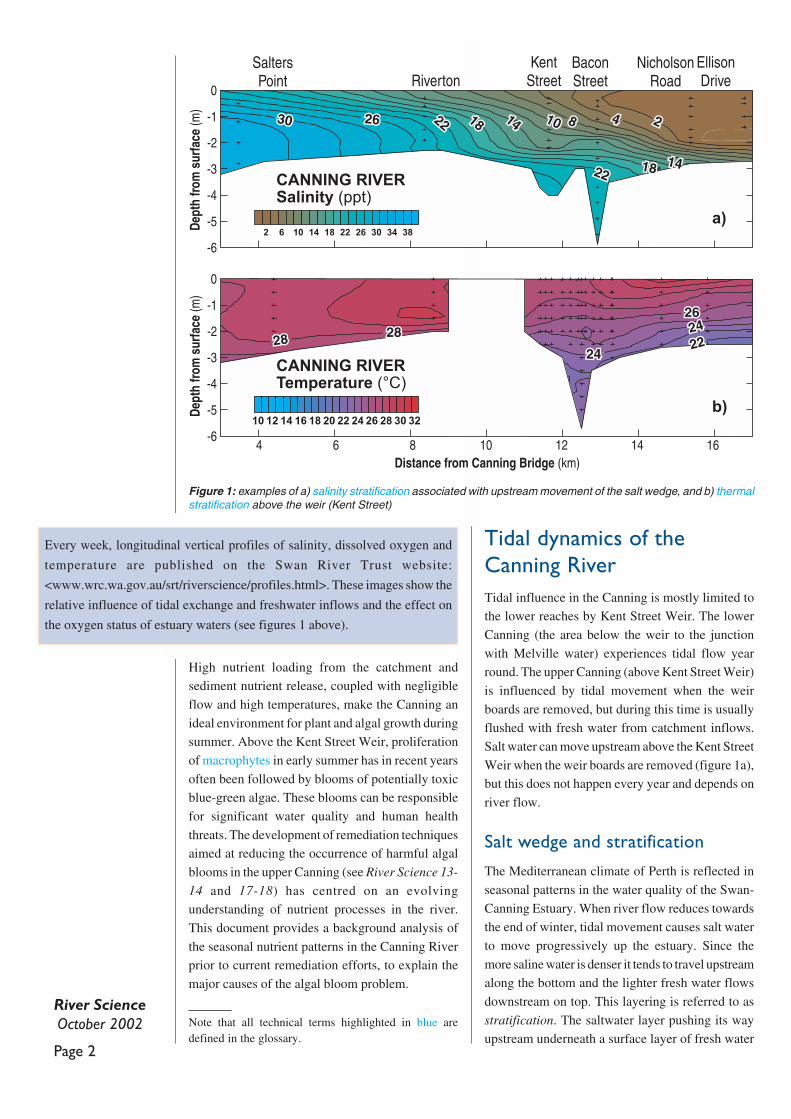
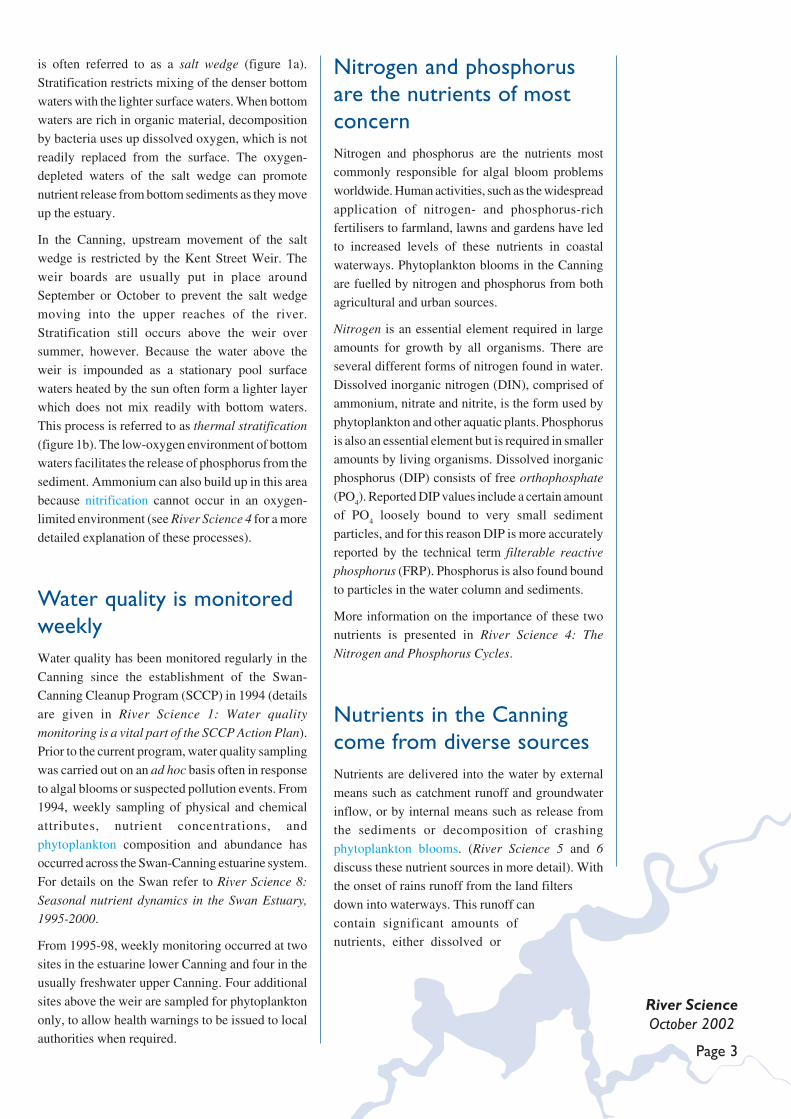
Every week, longitudinal vertical profiles of salinity, dissolved oxygen and
temperature are published on the Swan River Trust website:
<www.wrc.wa.gov.au/srt/riverscience/profiles.html>. These images show the
relative influence of tidal exchange and freshwater inflows and the effect on
the oxygen status of estuary waters (see figures 1 above).
Figure 1: examples of a) salinity stratification associated with upstream movement of the salt wedge, and b) thermalstratification above the weir (Kent Street)
-6
-5
-4
-3
-2
-1
0
-6
-5
-4
-3
-2
-1
0
CANNING RIVERSalinity (ppt)
2626
28282828 2222
2222
2222
2626
2424
2424
22
1818
1818 88
1414
1414 4410103030
Distance from Canning Bridge (km)
2 6 10 14 18 22 26 30 34 38
10 12 14 16 18 20 22 24 26 28 30 32
a)
b)Dept
h fro
m s
urfa
ce(m
)De
pth
from
sur
face
(m)
4 6 8 10 12 14 16
CANNING RIVERTemperature (°C)
EllisonDrive
KentStreet
NicholsonRoadRiverton
BaconStreet
SaltersPoint
River ScienceOctober 2002
Page 3
is often referred to as a salt wedge (figure 1a).
Stratification restricts mixing of the denser bottom
waters with the lighter surface waters. When bottomwaters are rich in organic material, decomposition
by bacteria uses up dissolved oxygen, which is not
readily replaced from the surface. The oxygen-depleted waters of the salt wedge can promote
nutrient release from bottom sediments as they move
up the estuary.
In the Canning, upstream movement of the salt
wedge is restricted by the Kent Street Weir. The
weir boards are usually put in place aroundSeptember or October to prevent the salt wedge
moving into the upper reaches of the river.
Stratification still occurs above the weir oversummer, however. Because the water above the
weir is impounded as a stationary pool surface
waters heated by the sun often form a lighter layerwhich does not mix readily with bottom waters.
This process is referred to as thermal stratification
(figure 1b). The low-oxygen environment of bottomwaters facilitates the release of phosphorus from the
sediment. Ammonium can also build up in this area
because nitrification cannot occur in an oxygen-limited environment (see River Science 4 for a more
detailed explanation of these processes).
Water quality is monitoredweeklyWater quality has been monitored regularly in the
Canning since the establishment of the Swan-Canning Cleanup Program (SCCP) in 1994 (details
are given in River Science 1: Water quality
monitoring is a vital part of the SCCP Action Plan).Prior to the current program, water quality sampling
was carried out on an ad hoc basis often in response
to algal blooms or suspected pollution events. From1994, weekly sampling of physical and chemical
attributes, nutrient concentrations, and
phytoplankton composition and abundance hasoccurred across the Swan-Canning estuarine system.
For details on the Swan refer to River Science 8:
Seasonal nutrient dynamics in the Swan Estuary,
1995-2000.
From 1995-98, weekly monitoring occurred at two
sites in the estuarine lower Canning and four in theusually freshwater upper Canning. Four additional
sites above the weir are sampled for phytoplankton
only, to allow health warnings to be issued to localauthorities when required.
Nitrogen and phosphorusare the nutrients of mostconcernNitrogen and phosphorus are the nutrients mostcommonly responsible for algal bloom problems
worldwide. Human activities, such as the widespread
application of nitrogen- and phosphorus-richfertilisers to farmland, lawns and gardens have led
to increased levels of these nutrients in coastal
waterways. Phytoplankton blooms in the Canningare fuelled by nitrogen and phosphorus from both
agricultural and urban sources.
Nitrogen is an essential element required in largeamounts for growth by all organisms. There are
several different forms of nitrogen found in water.
Dissolved inorganic nitrogen (DIN), comprised ofammonium, nitrate and nitrite, is the form used by
phytoplankton and other aquatic plants. Phosphorus
is also an essential element but is required in smalleramounts by living organisms. Dissolved inorganic
phosphorus (DIP) consists of free orthophosphate
(PO4). Reported DIP values include a certain amount
of PO4 loosely bound to very small sediment
particles, and for this reason DIP is more accurately
reported by the technical term filterable reactive
phosphorus (FRP). Phosphorus is also found bound
to particles in the water column and sediments.
More information on the importance of these twonutrients is presented in River Science 4: The
Nitrogen and Phosphorus Cycles.
Nutrients in the Canningcome from diverse sourcesNutrients are delivered into the water by external
means such as catchment runoff and groundwater
inflow, or by internal means such as release fromthe sediments or decomposition of crashing
phytoplankton blooms. (River Science 5 and 6
discuss these nutrient sources in more detail). Withthe onset of rains runoff from the land filters
down into waterways. This runoff can
contain significant amounts ofnutrients, either dissolved or
River ScienceOctober 2002
Page 4
attached to soil particles. Increases in agriculture,
intensive livestock operations and the spread of
residential and commercial areas (leading to‘leakage’ of sewage, fertilisers and detergents) have
greatly increased nutrient loads in the rivers and
estuary.
Unlike the Swan River, which receives the majority
of runoff from the huge inland catchment of the
Avon River, the Canning has a small coastalcatchment originating in the Darling Range. As it
traverses through southern metropolitan Perth it is
joined by the Southern River and a number of minortributaries and drains. The Canning catchment
includes significant rural (broadacre agriculture,
horticulture, intensive livestock operations, turffarms), urban, industrial and commercial land uses.
These land uses represent a diversity of nutrient
sources to the Canning River. All of the majorsubcatchments of the Canning were recognised as
‘major nutrient contributors’ to the Swan-Canning
estuary in the Swan-Canning Cleanup ProgramAction Plan.
Urban drains are at times a significant source of
nutrients and other contaminants such ashydrocarbons, to the Canning. Many drains are not
monitored regularly and few flow throughout theyear. Compared to other catchment runoff, drains
contribute very little flow volume to the Swan-
Canning system; however, water quality within thedrains is often poor. During summer, when there is
little flow from the catchment, relatively small
rainfall events can cause drains to discharge into theriver and estuary.
Groundwater can also be a nutrient source to the
system. Groundwater movement occurs readilythrough the sandy soils of the Swan Coastal Plain,
and groundwater in the area has been shown to be
high in dissolved nutrients. Knowledge of theparticulars of groundwater nutrient inputs is sketchy,
but it is likely to be important at some sites,
particularly when other nutrient sources are small.
Pathways… what happensto the nutrients once theyenter the estuary?Nutrients entering the lower reaches of the CanningRiver can be transformed and transported within the
system, or exported to Melville Water (and then
potentially flushed out to sea). Organic and
particulate nutrients can sink and accumulate in the
sediments. Some of the soluble phosphorus entering
from the catchment attaches (adsorbs) to suspendedparticles and settles out onto the sediment. The
sediments can become a source of bioavailable
nutrients (especially phosphate and ammonium)under certain conditions – notably low-oxygen
conditions at the sediment surface. Dissolved
inorganic nutrients are taken up by phytoplanktonand aquatic plants and converted to organic forms.
Death and decay of organisms leads to re-release of
bioavailable nutrients.
The fate of nutrients entering an estuary is discussedin more detail in River Science 4: The nitrogen andphosphorus cycles.
The role of sedimentsSediments in the upper Canning are generally rich
in nitrogen and phosphorus compared to otherAustralian and overseas estuaries. The sediments
are highly variable – both from site to site, and also
with depth in the river. High nutrient concentrationsare mainly associated with certain sediment types,
most notably fine silts and muddy silts with high
organic matter content. These sediments areabundant at several of the monitoring sites in the
Canning, particularly in shallower depositional
zones. The iron content of Canning sediments isalso high, and most sediment phosphorus is thought
to be bound to iron compounds. However,
bioavailable phosphorus can be released into thewater column if the sediment surface becomes
anoxic.
Nutrients are known to be released from thesesediments into bottom waters over summer, though
thermal stratification tends to restrict nutrient
movement into surface waters. Even during bloomevents only a fraction of what is released is taken up
by phytoplankton, which are usually unable to access
the large store of nutrients below the thermocline.Nevertheless, bottom water nutrients may still
become available to phytoplankton through periodic
deepening of the wind-mixed surface layer. Inaddition the capacity of phytoplankton for luxury
uptake of nutrients when they are available may be
sufficient to maintain growth, even when surfacenutrient concentrations are low.
The surface sediments represent the largest pool of
nutrients in the upper Canning, and are important asa nutrient source for macrophytes, phytoplankton
River ScienceOctober 2002
Page 5
and bacteria. For this reason, remediation efforts
over the past five years have focussed on reducing
sediment nutrient release (readers should refer toRiver Science 13-14 and 17-18 for more
information).
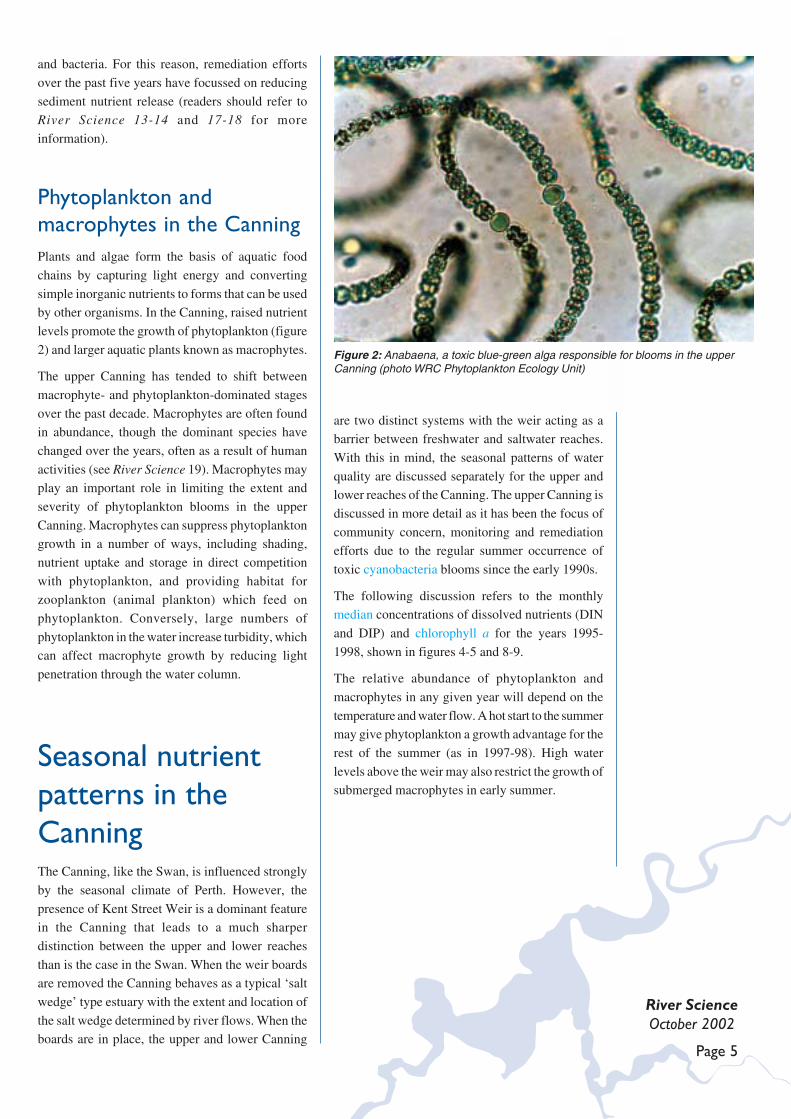
Phytoplankton andmacrophytes in the CanningPlants and algae form the basis of aquatic food
chains by capturing light energy and converting
simple inorganic nutrients to forms that can be usedby other organisms. In the Canning, raised nutrient
levels promote the growth of phytoplankton (figure
2) and larger aquatic plants known as macrophytes.
The upper Canning has tended to shift between
macrophyte- and phytoplankton-dominated stages
over the past decade. Macrophytes are often foundin abundance, though the dominant species have
changed over the years, often as a result of human
activities (see River Science 19). Macrophytes mayplay an important role in limiting the extent and
severity of phytoplankton blooms in the upper
Canning. Macrophytes can suppress phytoplanktongrowth in a number of ways, including shading,
nutrient uptake and storage in direct competition
with phytoplankton, and providing habitat forzooplankton (animal plankton) which feed on
phytoplankton. Conversely, large numbers of
phytoplankton in the water increase turbidity, whichcan affect macrophyte growth by reducing light
penetration through the water column.
Seasonal nutrientpatterns in theCanningThe Canning, like the Swan, is influenced strongly
by the seasonal climate of Perth. However, the
presence of Kent Street Weir is a dominant featurein the Canning that leads to a much sharper
distinction between the upper and lower reaches
than is the case in the Swan. When the weir boardsare removed the Canning behaves as a typical ‘salt
wedge’ type estuary with the extent and location of
the salt wedge determined by river flows. When theboards are in place, the upper and lower Canning
are two distinct systems with the weir acting as abarrier between freshwater and saltwater reaches.
With this in mind, the seasonal patterns of water
quality are discussed separately for the upper andlower reaches of the Canning. The upper Canning is
discussed in more detail as it has been the focus of
community concern, monitoring and remediationefforts due to the regular summer occurrence of
toxic cyanobacteria blooms since the early 1990s.
The following discussion refers to the monthlymedian concentrations of dissolved nutrients (DIN
and DIP) and chlorophyll a for the years 1995-
1998, shown in figures 4-5 and 8-9.
The relative abundance of phytoplankton and
macrophytes in any given year will depend on the
temperature and water flow. A hot start to the summermay give phytoplankton a growth advantage for the
rest of the summer (as in 1997-98). High water
levels above the weir may also restrict the growth ofsubmerged macrophytes in early summer.
Figure 2: Anabaena, a toxic blue-green alga responsible for blooms in the upperCanning (photo WRC Phytoplankton Ecology Unit)
River ScienceOctober 2002
Page 6
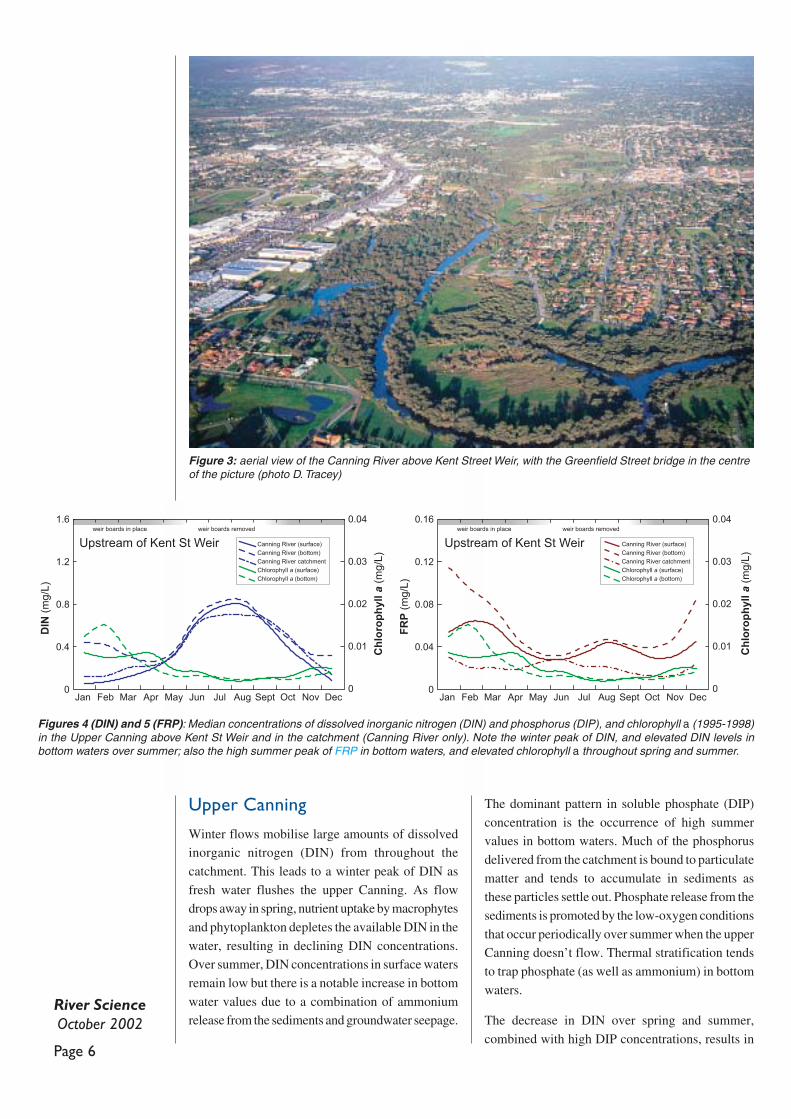
Upper Canning
Winter flows mobilise large amounts of dissolvedinorganic nitrogen (DIN) from throughout the
catchment. This leads to a winter peak of DIN as
fresh water flushes the upper Canning. As flowdrops away in spring, nutrient uptake by macrophytes
and phytoplankton depletes the available DIN in the
water, resulting in declining DIN concentrations.Over summer, DIN concentrations in surface waters
remain low but there is a notable increase in bottom
water values due to a combination of ammoniumrelease from the sediments and groundwater seepage.
The dominant pattern in soluble phosphate (DIP)
concentration is the occurrence of high summervalues in bottom waters. Much of the phosphorus
delivered from the catchment is bound to particulate
matter and tends to accumulate in sediments asthese particles settle out. Phosphate release from the
sediments is promoted by the low-oxygen conditions
that occur periodically over summer when the upperCanning doesn’t flow. Thermal stratification tends
to trap phosphate (as well as ammonium) in bottom
waters.
The decrease in DIN over spring and summer,
combined with high DIP concentrations, results in
Figure 3: aerial view of the Canning River above Kent Street Weir, with the Greenfield Street bridge in the centreof the picture (photo D. Tracey)
Figures 4 (DIN) and 5 (FRP): Median concentrations of dissolved inorganic nitrogen (DIN) and phosphorus (DIP), and chlorophyll a (1995-1998)in the Upper Canning above Kent St Weir and in the catchment (Canning River only). Note the winter peak of DIN, and elevated DIN levels inbottom waters over summer; also the high summer peak of FRP in bottom waters, and elevated chlorophyll a throughout spring and summer.
weir boards in place weir boards removed
0
0.4
0.8
1.2
1.6
0
0.01
0.02
0.03
0.04
Jan Feb
Ch
loro
ph
yll
a (
mg
/L)
DIN
(m
g/L
)
FR
P (
mg
/L)
Ch
loro
ph
yll
a (
mg
/L)
Mar Apr May Jun Jul Aug Sept Oct Nov Dec
Upstream of Kent St Weir Upstream of Kent St WeirCanning River (surface)
Canning River (bottom)
Canning River catchment
Chlorophyll a (surface)
Chlorophyll a (bottom)
weir boards in place weir boards removed
0
0.04
0.08
0.12
0.16
0
0.01
0.02
0.03
0.04
Jan Feb Mar Apr May Jun Jul Aug Sept Oct Nov Dec
Canning River (surface)
Canning River (bottom)
Canning River catchment
Chlorophyll a (surface)
Chlorophyll a (bottom)
River ScienceOctober 2002
Page 7
an increasing ratio of dissolved phosphorus tonitrogen over this period. This encourages the growth
of certain cyanobacteria (blue-green algae) whichare able to supplement their nitrogen supply by
‘fixing’ atmospheric nitrogen.
Chlorophyll a concentration (which measures thedensity of phytoplankton cells in the water) shows a
distinct seasonal pattern in the upper Canning –
with relatively high median values over summerand autumn and low values over winter.
Phytoplankton growth in winter is limited by low
light levels, low temperatures and short day lengths,and as a result most phytoplankton are flushed from
the system before they can reach bloom proportions.
When the weir boards are put in place, the lack offlow along with increasing temperatures and
increased light penetration makes the upper Canning
conducive to phytoplankton growth. Indeed, medianchlorophyll a values in the upper Canning are at
their highest over summer. It is interesting to note
that values are higher in bottom waters than surfacewaters for much of this time. Unlike in the upper
Swan where phytoplankton (e.g. dinoflagellates)
are thought to migrate to bottom waters to accessnutrients it is unlikely that the much smaller
cyanobacteria in the upper Canning could do this.
The higher bottom water values may result fromphysical conditions (intense light at the water surface,
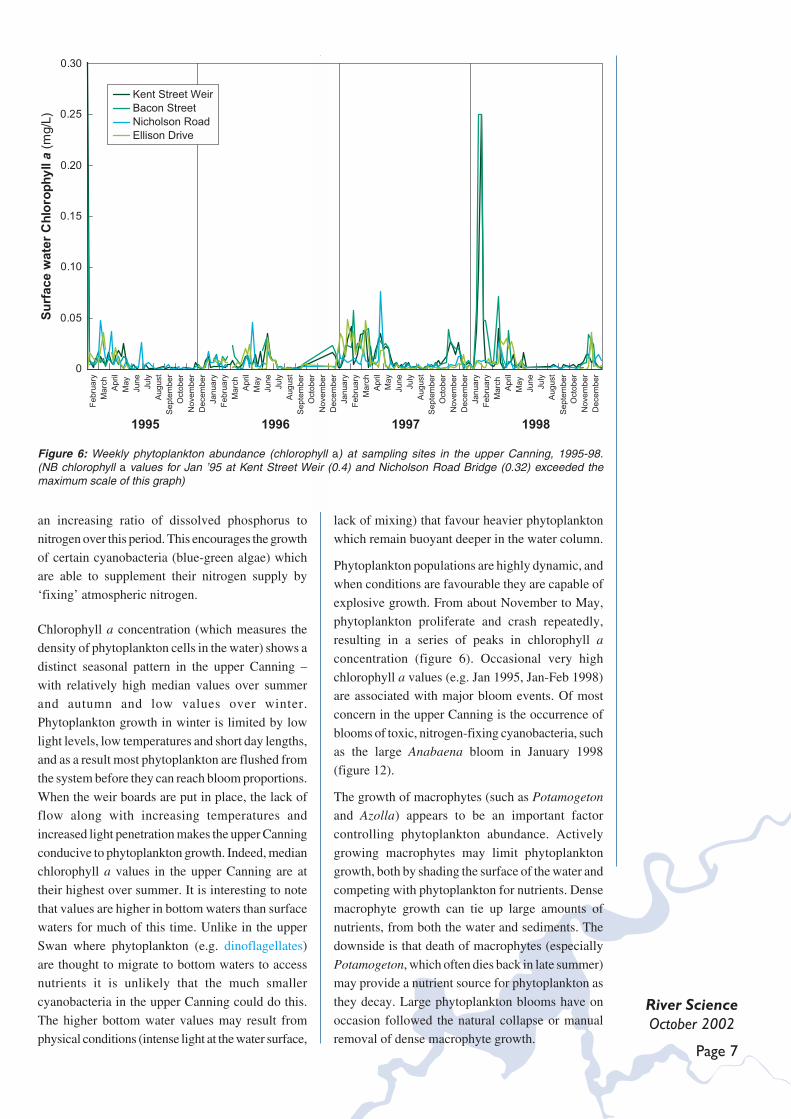
Figure 6: Weekly phytoplankton abundance (chlorophyll a) at sampling sites in the upper Canning, 1995-98.(NB chlorophyll a values for Jan ’95 at Kent Street Weir (0.4) and Nicholson Road Bridge (0.32) exceeded themaximum scale of this graph)
lack of mixing) that favour heavier phytoplanktonwhich remain buoyant deeper in the water column.
Phytoplankton populations are highly dynamic, andwhen conditions are favourable they are capable of
explosive growth. From about November to May,
phytoplankton proliferate and crash repeatedly,resulting in a series of peaks in chlorophyll a
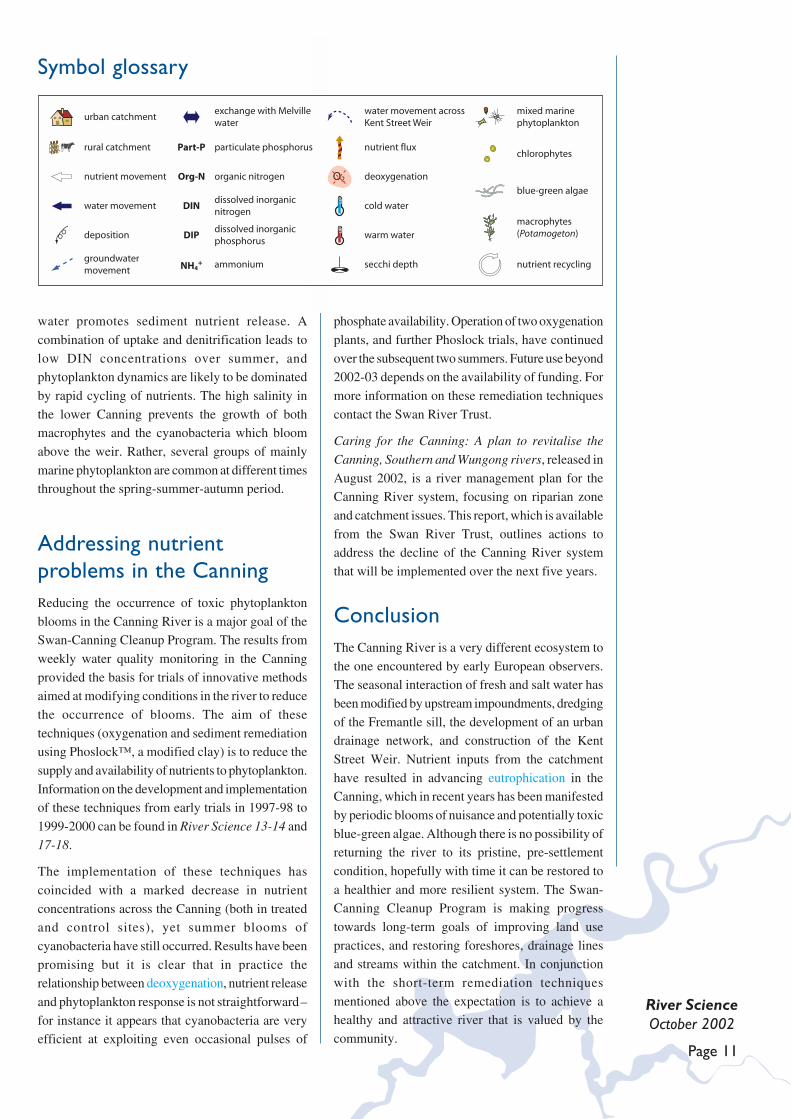
concentration (figure 6). Occasional very high
chlorophyll a values (e.g. Jan 1995, Jan-Feb 1998)are associated with major bloom events. Of most
concern in the upper Canning is the occurrence of
blooms of toxic, nitrogen-fixing cyanobacteria, suchas the large Anabaena bloom in January 1998
(figure 12).
The growth of macrophytes (such as Potamogeton
and Azolla) appears to be an important factor
controlling phytoplankton abundance. Actively
growing macrophytes may limit phytoplanktongrowth, both by shading the surface of the water and
competing with phytoplankton for nutrients. Dense
macrophyte growth can tie up large amounts ofnutrients, from both the water and sediments. The
downside is that death of macrophytes (especially
Potamogeton, which often dies back in late summer)may provide a nutrient source for phytoplankton as
they decay. Large phytoplankton blooms have on
occasion followed the natural collapse or manualremoval of dense macrophyte growth.
0
0.05
0.10
0.15
0.20
0.25
0.30
Su
rfa
ce
wa
ter
Ch
loro
ph
yll a
(m
g/L
)
Febru
ary
Marc
h
April
May
June
July
August
Septe
mber
Octo
ber
Novem
ber
Decem
ber
January
Febru
ary
Marc
h
April
May
June
July
August
Septe
mber
Octo
ber
Novem
ber
Decem
ber
January
Febru
ary
Marc
h
April
May
June
July
August
Septe
mber
Octo
ber
Novem
ber
Decem
ber
January
Febru
ary
Marc
h
April
May
June
July
August
Septe
mber
Octo
ber
Novem
ber
Decem
ber
1995 1996 1997 1998
Kent Street Weir
Bacon Street
Nicholson Road
Ellison Drive
River ScienceOctober 2002
Page 8
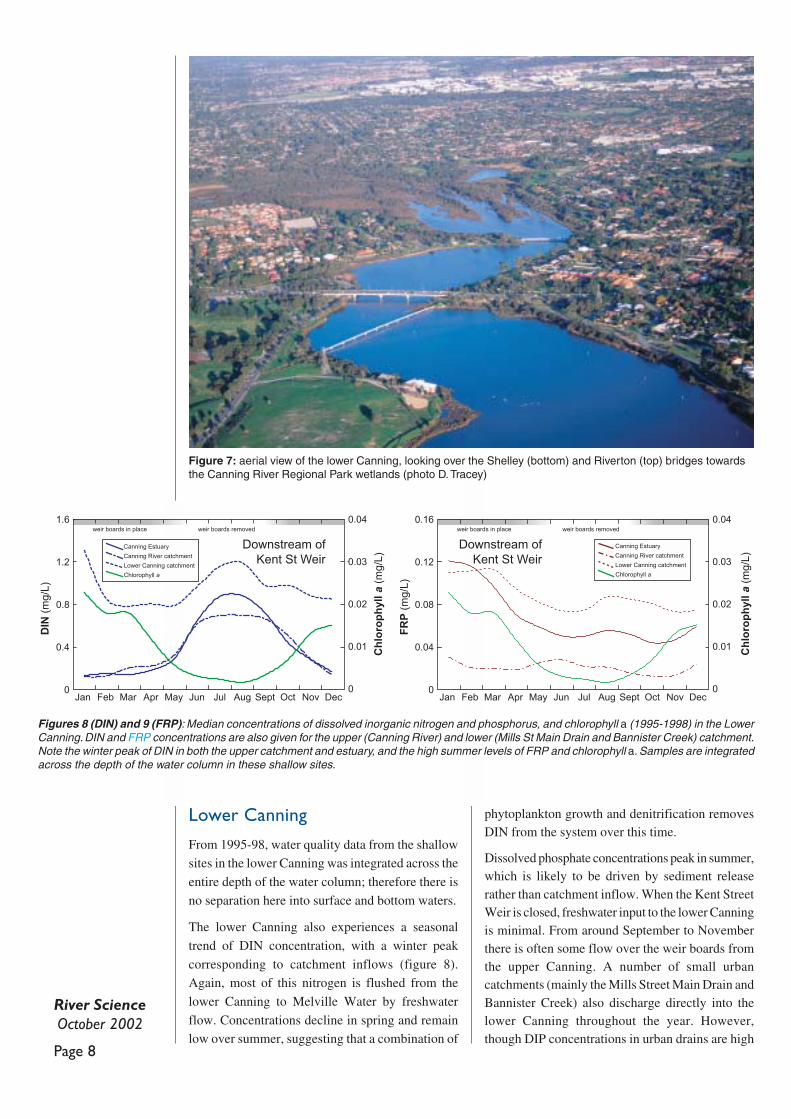
Lower Canning
From 1995-98, water quality data from the shallowsites in the lower Canning was integrated across the
entire depth of the water column; therefore there is
no separation here into surface and bottom waters.
The lower Canning also experiences a seasonal
trend of DIN concentration, with a winter peak
corresponding to catchment inflows (figure 8).Again, most of this nitrogen is flushed from the
lower Canning to Melville Water by freshwater
flow. Concentrations decline in spring and remainlow over summer, suggesting that a combination of
phytoplankton growth and denitrification removesDIN from the system over this time.
Dissolved phosphate concentrations peak in summer,which is likely to be driven by sediment releaserather than catchment inflow. When the Kent StreetWeir is closed, freshwater input to the lower Canningis minimal. From around September to Novemberthere is often some flow over the weir boards fromthe upper Canning. A number of small urbancatchments (mainly the Mills Street Main Drain andBannister Creek) also discharge directly into thelower Canning throughout the year. However,though DIP concentrations in urban drains are high
Figure 7: aerial view of the lower Canning, looking over the Shelley (bottom) and Riverton (top) bridges towardsthe Canning River Regional Park wetlands (photo D. Tracey)
Figures 8 (DIN) and 9 (FRP): Median concentrations of dissolved inorganic nitrogen and phosphorus, and chlorophyll a (1995-1998) in the LowerCanning. DIN and FRP concentrations are also given for the upper (Canning River) and lower (Mills St Main Drain and Bannister Creek) catchment.Note the winter peak of DIN in both the upper catchment and estuary, and the high summer levels of FRP and chlorophyll a. Samples are integratedacross the depth of the water column in these shallow sites.
weir boards in place weir boards removed
Canning Estuary
Canning River catchment
Chlorophyll a
Lower Canning catchment
weir boards in place weir boards removed
Canning Estuary
Canning River catchment
Chlorophyll a
Lower Canning catchment
0
0.4
0.8
1.2
1.6
0
0.01
0.02
0.03
0.04
Jan Feb
Ch
loro
ph
yll
a (
mg
/L)
DIN
(m
g/L
)
FR
P (
mg
/L)
Ch
loro
ph
yll
a (
mg
/L)
Mar Apr May Jun Jul Aug Sept Oct Nov Dec0
0.04
0.08
0.12
0.16
0
0.01
0.02
0.03
0.04
Downstream of
Kent St Weir
Downstream of
Kent St Weir
Jan Feb Mar Apr May Jun Jul Aug Sept Oct Nov Dec
River ScienceOctober 2002
Page 9
(figure 9), the volumes discharged are insufficient
to explain the high DIP concentrations in the lower
estuary.
As in the upper Swan and Canning estuaries (but
distinct from the lower Swan), phytoplankton density
in the lower Canning is highest throughout summerand autumn when physical conditions are optimal
for growth. Median chlorophyll a values are actually
slightly higher than in the upper Canning. Factorslikely to favour phytoplankton growth in the lower
Canning could include the shallowness of the sites,
and lack of competition from macrophytes. Highsalinity prevents the sort of toxic blue-green blooms
evident in the upper Canning. Phytoplankton
dynamics in the lower Canning are more similar tothose of the upper Swan. The spring-summer-autumn
blooms involve several groups of phytoplankton in
a succession related to changes in salinity andsediment nutrient release.
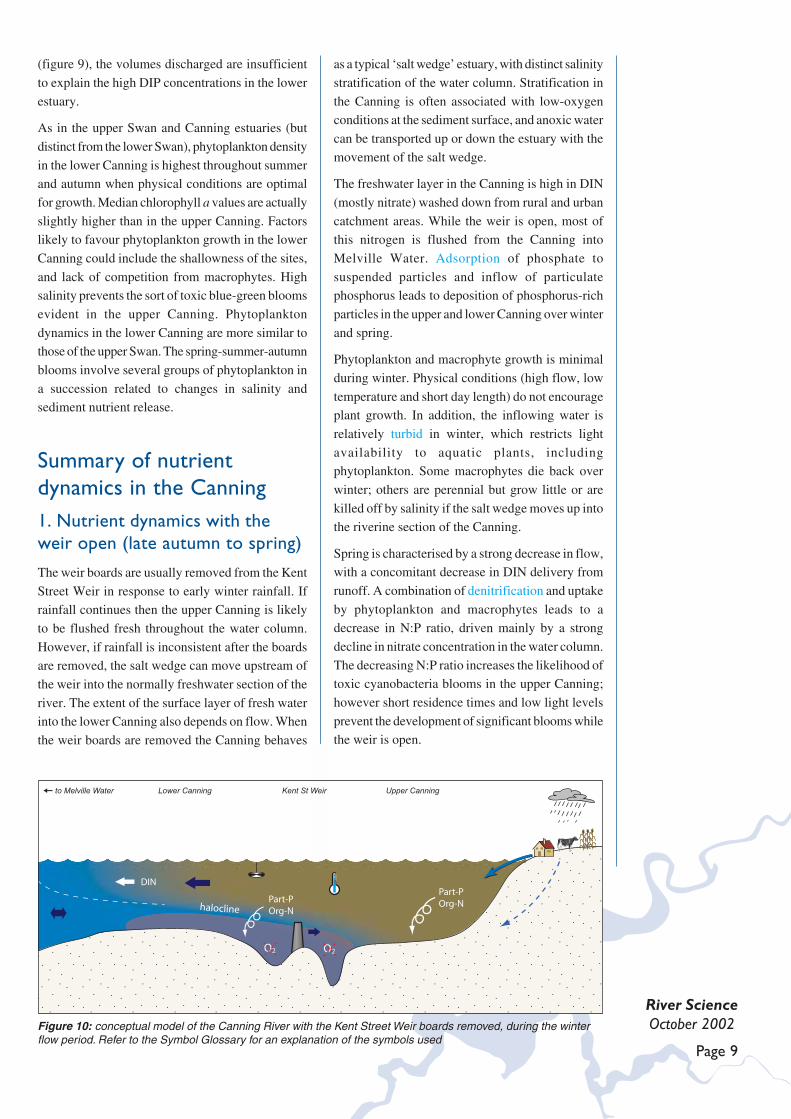
Summary of nutrientdynamics in the Canning1. Nutrient dynamics with theweir open (late autumn to spring)
The weir boards are usually removed from the Kent
Street Weir in response to early winter rainfall. Ifrainfall continues then the upper Canning is likely
to be flushed fresh throughout the water column.
However, if rainfall is inconsistent after the boardsare removed, the salt wedge can move upstream of
the weir into the normally freshwater section of the
river. The extent of the surface layer of fresh waterinto the lower Canning also depends on flow. When
the weir boards are removed the Canning behaves
as a typical ‘salt wedge’ estuary, with distinct salinity
stratification of the water column. Stratification in
the Canning is often associated with low-oxygenconditions at the sediment surface, and anoxic water
can be transported up or down the estuary with the
movement of the salt wedge.
The freshwater layer in the Canning is high in DIN
(mostly nitrate) washed down from rural and urban
catchment areas. While the weir is open, most ofthis nitrogen is flushed from the Canning into
Melville Water. Adsorption of phosphate to
suspended particles and inflow of particulatephosphorus leads to deposition of phosphorus-rich
particles in the upper and lower Canning over winter
and spring.
Phytoplankton and macrophyte growth is minimal
during winter. Physical conditions (high flow, low
temperature and short day length) do not encourageplant growth. In addition, the inflowing water is
relatively turbid in winter, which restricts light
availability to aquatic plants, includingphytoplankton. Some macrophytes die back over
winter; others are perennial but grow little or are
killed off by salinity if the salt wedge moves up intothe riverine section of the Canning.
Spring is characterised by a strong decrease in flow,with a concomitant decrease in DIN delivery from
runoff. A combination of denitrification and uptake
by phytoplankton and macrophytes leads to adecrease in N:P ratio, driven mainly by a strong
decline in nitrate concentration in the water column.
The decreasing N:P ratio increases the likelihood oftoxic cyanobacteria blooms in the upper Canning;
however short residence times and low light levels
prevent the development of significant blooms whilethe weir is open.
Figure 10: conceptual model of the Canning River with the Kent Street Weir boards removed, during the winterflow period. Refer to the Symbol Glossary for an explanation of the symbols used
halocline
Part-POrg-N
DIN
O2O2
Part-POrg-N
to Melville Water Kent St WeirLower Canning Upper Canning
River ScienceOctober 2002
Page 10
Figure 12: This dense bloom of blue-green algae(Anabaena) occurred in January-February 1998(photo K. McMahon)
River ScienceOctober 2002
Page 10
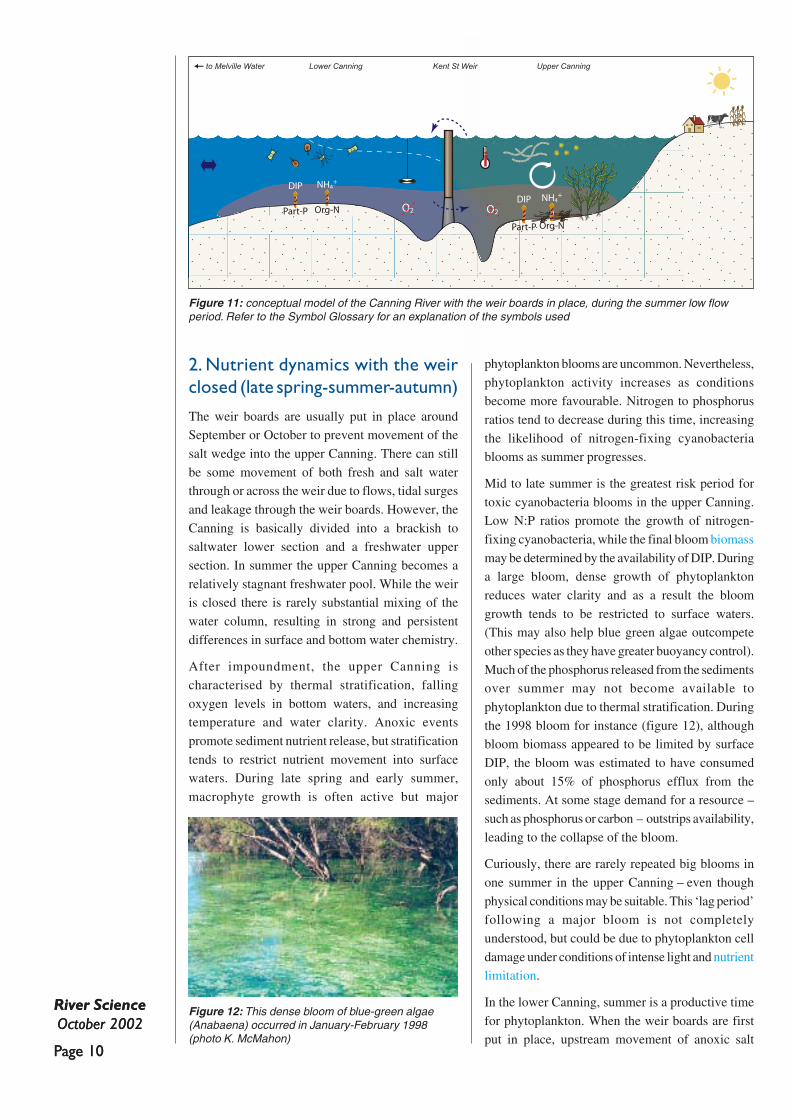
2. Nutrient dynamics with the weirclosed (late spring-summer-autumn)
The weir boards are usually put in place aroundSeptember or October to prevent movement of the
salt wedge into the upper Canning. There can still
be some movement of both fresh and salt waterthrough or across the weir due to flows, tidal surges
and leakage through the weir boards. However, the
Canning is basically divided into a brackish tosaltwater lower section and a freshwater upper
section. In summer the upper Canning becomes a
relatively stagnant freshwater pool. While the weiris closed there is rarely substantial mixing of the
water column, resulting in strong and persistent
differences in surface and bottom water chemistry.
After impoundment, the upper Canning is
characterised by thermal stratification, falling
oxygen levels in bottom waters, and increasingtemperature and water clarity. Anoxic events
promote sediment nutrient release, but stratification
tends to restrict nutrient movement into surfacewaters. During late spring and early summer,
macrophyte growth is often active but major
phytoplankton blooms are uncommon. Nevertheless,
phytoplankton activity increases as conditionsbecome more favourable. Nitrogen to phosphorus
ratios tend to decrease during this time, increasing
the likelihood of nitrogen-fixing cyanobacteriablooms as summer progresses.
Mid to late summer is the greatest risk period for
toxic cyanobacteria blooms in the upper Canning.Low N:P ratios promote the growth of nitrogen-
fixing cyanobacteria, while the final bloom biomass
may be determined by the availability of DIP. Duringa large bloom, dense growth of phytoplankton
reduces water clarity and as a result the bloom
growth tends to be restricted to surface waters.(This may also help blue green algae outcompete
other species as they have greater buoyancy control).
Much of the phosphorus released from the sedimentsover summer may not become available to
phytoplankton due to thermal stratification. During
the 1998 bloom for instance (figure 12), althoughbloom biomass appeared to be limited by surface
DIP, the bloom was estimated to have consumed
only about 15% of phosphorus efflux from thesediments. At some stage demand for a resource –
such as phosphorus or carbon – outstrips availability,
leading to the collapse of the bloom.
Curiously, there are rarely repeated big blooms in
one summer in the upper Canning – even though
physical conditions may be suitable. This ‘lag period’following a major bloom is not completely
understood, but could be due to phytoplankton cell
damage under conditions of intense light and nutrientlimitation.
In the lower Canning, summer is a productive time
for phytoplankton. When the weir boards are firstput in place, upstream movement of anoxic salt
Figure 11: conceptual model of the Canning River with the weir boards in place, during the summer low flowperiod. Refer to the Symbol Glossary for an explanation of the symbols used
Part-P
DIP
Org-N
NH4+
O2O2Part-P
DIP
Org-N
NH4+
to Melville Water Kent St WeirLower Canning Upper Canning
River ScienceOctober 2002
Page 11
water promotes sediment nutrient release. A
combination of uptake and denitrification leads to
low DIN concentrations over summer, andphytoplankton dynamics are likely to be dominated
by rapid cycling of nutrients. The high salinity in
the lower Canning prevents the growth of bothmacrophytes and the cyanobacteria which bloom
above the weir. Rather, several groups of mainly
marine phytoplankton are common at different timesthroughout the spring-summer-autumn period.
Addressing nutrientproblems in the CanningReducing the occurrence of toxic phytoplankton
blooms in the Canning River is a major goal of theSwan-Canning Cleanup Program. The results from
weekly water quality monitoring in the Canning
provided the basis for trials of innovative methodsaimed at modifying conditions in the river to reduce
the occurrence of blooms. The aim of these
techniques (oxygenation and sediment remediationusing Phoslock™, a modified clay) is to reduce the
supply and availability of nutrients to phytoplankton.
Information on the development and implementationof these techniques from early trials in 1997-98 to
1999-2000 can be found in River Science 13-14 and
17-18.
The implementation of these techniques has
coincided with a marked decrease in nutrient
concentrations across the Canning (both in treatedand control sites), yet summer blooms of
cyanobacteria have still occurred. Results have been
promising but it is clear that in practice therelationship between deoxygenation, nutrient release
and phytoplankton response is not straightforward–
for instance it appears that cyanobacteria are veryefficient at exploiting even occasional pulses of
phosphate availability. Operation of two oxygenation
plants, and further Phoslock trials, have continued
over the subsequent two summers. Future use beyond2002-03 depends on the availability of funding. For
more information on these remediation techniques
contact the Swan River Trust.
Caring for the Canning: A plan to revitalise the
Canning, Southern and Wungong rivers, released in
August 2002, is a river management plan for theCanning River system, focusing on riparian zone
and catchment issues. This report, which is available
from the Swan River Trust, outlines actions toaddress the decline of the Canning River system
that will be implemented over the next five years.
ConclusionThe Canning River is a very different ecosystem to
the one encountered by early European observers.The seasonal interaction of fresh and salt water has
been modified by upstream impoundments, dredging
of the Fremantle sill, the development of an urbandrainage network, and construction of the Kent
Street Weir. Nutrient inputs from the catchment
have resulted in advancing eutrophication in theCanning, which in recent years has been manifested
by periodic blooms of nuisance and potentially toxic
blue-green algae. Although there is no possibility ofreturning the river to its pristine, pre-settlement
condition, hopefully with time it can be restored to
a healthier and more resilient system. The Swan-Canning Cleanup Program is making progress
towards long-term goals of improving land use
practices, and restoring foreshores, drainage linesand streams within the catchment. In conjunction
with the short-term remediation techniques
mentioned above the expectation is to achieve ahealthy and attractive river that is valued by the
community.
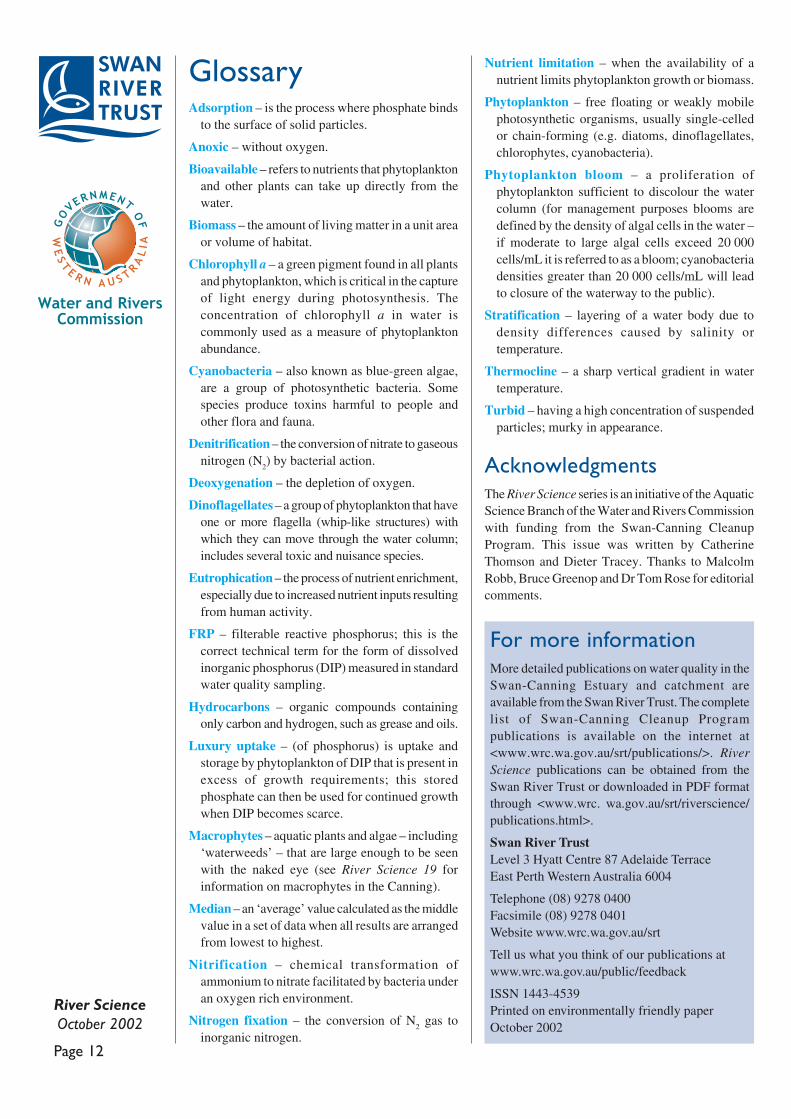
Symbol glossary
O2
Part-P
Org-N
DIN
DIP
NH4+
nutrient flux
macrophytes(Potamogeton)
exchange with Melvillewater
deoxygenation
deposition
particulate phosphorus
organic nitrogen
dissolved inorganic nitrogen
dissolved inorganic phosphorus
ammonium
water movement
nutrient movement
groundwater movement
urban catchment
rural catchment
mixed marine phytoplankton
chlorophytes
nutrient recyclingsecchi depth
warm water
cold water
blue-green algae
water movement acrossKent Street Weir
River ScienceOctober 2002
Page 12
GlossaryAdsorption – is the process where phosphate binds
to the surface of solid particles.
Anoxic – without oxygen.
Bioavailable – refers to nutrients that phytoplanktonand other plants can take up directly from thewater.
Biomass – the amount of living matter in a unit areaor volume of habitat.
Chlorophyll a – a green pigment found in all plantsand phytoplankton, which is critical in the captureof light energy during photosynthesis. Theconcentration of chlorophyll a in water iscommonly used as a measure of phytoplanktonabundance.
Cyanobacteria – also known as blue-green algae,are a group of photosynthetic bacteria. Somespecies produce toxins harmful to people andother flora and fauna.
Denitrification – the conversion of nitrate to gaseousnitrogen (N
2) by bacterial action.
Deoxygenation – the depletion of oxygen.
Dinoflagellates – a group of phytoplankton that haveone or more flagella (whip-like structures) withwhich they can move through the water column;includes several toxic and nuisance species.
Eutrophication – the process of nutrient enrichment,especially due to increased nutrient inputs resultingfrom human activity.
FRP – filterable reactive phosphorus; this is thecorrect technical term for the form of dissolvedinorganic phosphorus (DIP) measured in standardwater quality sampling.
Hydrocarbons – organic compounds containingonly carbon and hydrogen, such as grease and oils.
Luxury uptake – (of phosphorus) is uptake andstorage by phytoplankton of DIP that is present inexcess of growth requirements; this storedphosphate can then be used for continued growthwhen DIP becomes scarce.
Macrophytes – aquatic plants and algae – including‘waterweeds’ – that are large enough to be seenwith the naked eye (see River Science 19 forinformation on macrophytes in the Canning).
Median – an ‘average’ value calculated as the middlevalue in a set of data when all results are arrangedfrom lowest to highest.
Nitrification – chemical transformation ofammonium to nitrate facilitated by bacteria underan oxygen rich environment.
Nitrogen fixation – the conversion of N2 gas to
inorganic nitrogen.
Nutrient limitation – when the availability of anutrient limits phytoplankton growth or biomass.
Phytoplankton – free floating or weakly mobilephotosynthetic organisms, usually single-celledor chain-forming (e.g. diatoms, dinoflagellates,chlorophytes, cyanobacteria).
Phytoplankton bloom – a proliferation ofphytoplankton sufficient to discolour the watercolumn (for management purposes blooms aredefined by the density of algal cells in the water –if moderate to large algal cells exceed 20 000cells/mL it is referred to as a bloom; cyanobacteriadensities greater than 20 000 cells/mL will leadto closure of the waterway to the public).
Stratification – layering of a water body due todensity differences caused by salinity ortemperature.
Thermocline – a sharp vertical gradient in watertemperature.
Turbid – having a high concentration of suspendedparticles; murky in appearance.
AcknowledgmentsThe River Science series is an initiative of the AquaticScience Branch of the Water and Rivers Commissionwith funding from the Swan-Canning CleanupProgram. This issue was written by CatherineThomson and Dieter Tracey. Thanks to MalcolmRobb, Bruce Greenop and Dr Tom Rose for editorialcomments.
For more informationMore detailed publications on water quality in theSwan-Canning Estuary and catchment areavailable from the Swan River Trust. The completelist of Swan-Canning Cleanup Programpublications is available on the internet at<www.wrc.wa.gov.au/srt/publications/>. RiverScience publications can be obtained from theSwan River Trust or downloaded in PDF formatthrough <www.wrc. wa.gov.au/srt/riverscience/publications.html>.
Swan River TrustLevel 3 Hyatt Centre 87 Adelaide TerraceEast Perth Western Australia 6004
Telephone (08) 9278 0400Facsimile (08) 9278 0401Website www.wrc.wa.gov.au/srt
Tell us what you think of our publications atwww.wrc.wa.gov.au/public/feedback
ISSN 1443-4539Printed on environmentally friendly paperOctober 2002
Related Documents