PLEASE SCROLL DOWN FOR ARTICLE This article was downloaded by: [Us Geological Survey] On: 20 July 2009 Access details: Access Details: [subscription number 907835083] Publisher Routledge Informa Ltd Registered in England and Wales Registered Number: 1072954 Registered office: Mortimer House, 37-41 Mortimer Street, London W1T 3JH, UK Annals of the Association of American Geographers Publication details, including instructions for authors and subscription information: http://www.informaworld.com/smpp/title~content=t788352614 Seasonal Land-Cover Regions of the United States Thomas R. Loveland a ; James W. Merchant b ; Jesslyn F. Brown c ; Donald O. Ohlen c ; Bradley C. Reed c ; Paul Olson c ; John Hutchinson c a U.S. Geological Survey, EROS Data Center. b Institute of Agriculture and Natural Resources, University of Nebraska. c Hughes STX Corporation, EROS Data Center. Online Publication Date: 01 June 1995 To cite this Article Loveland, Thomas R., Merchant, James W., Brown, Jesslyn F., Ohlen, Donald O., Reed, Bradley C., Olson, Paul and Hutchinson, John(1995)'Seasonal Land-Cover Regions of the United States',Annals of the Association of American Geographers,85:2,339 — 355 To link to this Article: DOI: 10.1111/j.1467-8306.1995.tb01798.x URL: http://dx.doi.org/10.1111/j.1467-8306.1995.tb01798.x Full terms and conditions of use: http://www.informaworld.com/terms-and-conditions-of-access.pdf This article may be used for research, teaching and private study purposes. Any substantial or systematic reproduction, re-distribution, re-selling, loan or sub-licensing, systematic supply or distribution in any form to anyone is expressly forbidden. The publisher does not give any warranty express or implied or make any representation that the contents will be complete or accurate or up to date. The accuracy of any instructions, formulae and drug doses should be independently verified with primary sources. The publisher shall not be liable for any loss, actions, claims, proceedings, demand or costs or damages whatsoever or howsoever caused arising directly or indirectly in connection with or arising out of the use of this material.

Welcome message from author
This document is posted to help you gain knowledge. Please leave a comment to let me know what you think about it! Share it to your friends and learn new things together.
Transcript

PLEASE SCROLL DOWN FOR ARTICLE
This article was downloaded by: [Us Geological Survey]On: 20 July 2009Access details: Access Details: [subscription number 907835083]Publisher RoutledgeInforma Ltd Registered in England and Wales Registered Number: 1072954 Registered office: Mortimer House,37-41 Mortimer Street, London W1T 3JH, UK
Annals of the Association of American GeographersPublication details, including instructions for authors and subscription information:http://www.informaworld.com/smpp/title~content=t788352614
Seasonal Land-Cover Regions of the United StatesThomas R. Loveland a; James W. Merchant b; Jesslyn F. Brown c; Donald O. Ohlen c; Bradley C. Reed c; PaulOlson c; John Hutchinson c
a U.S. Geological Survey, EROS Data Center. b Institute of Agriculture and Natural Resources, University ofNebraska. c Hughes STX Corporation, EROS Data Center.
Online Publication Date: 01 June 1995
To cite this Article Loveland, Thomas R., Merchant, James W., Brown, Jesslyn F., Ohlen, Donald O., Reed, Bradley C., Olson, Pauland Hutchinson, John(1995)'Seasonal Land-Cover Regions of the United States',Annals of the Association of AmericanGeographers,85:2,339 — 355
To link to this Article: DOI: 10.1111/j.1467-8306.1995.tb01798.x
URL: http://dx.doi.org/10.1111/j.1467-8306.1995.tb01798.x
Full terms and conditions of use: http://www.informaworld.com/terms-and-conditions-of-access.pdf
This article may be used for research, teaching and private study purposes. Any substantial orsystematic reproduction, re-distribution, re-selling, loan or sub-licensing, systematic supply ordistribution in any form to anyone is expressly forbidden.
The publisher does not give any warranty express or implied or make any representation that the contentswill be complete or accurate or up to date. The accuracy of any instructions, formulae and drug dosesshould be independently verified with primary sources. The publisher shall not be liable for any loss,actions, claims, proceedings, demand or costs or damages whatsoever or howsoever caused arising directlyor indirectly in connection with or arising out of the use of this material.
-
Map Supplement
Seasonal Land-Cover Regions of the United States
Thomas R. Loveland,* James W. Merchant, ** Jesslyn F. Brown,*** Donald 0. Ohlen,*** Bradley C. Reed,*** Paul Olson,*** and John Hutchinson***
*U.S. Geological Survey, EROS Data Center **Institute o f Agriculture and Natural Resources, University of Nebraska
***Hughes STX Corporation, EROS Data Center
Regionalization, an important and classic method of geographical research, requires new refine- ments and innovative applications for use in ana- lyzing global change. (Mather and Sdasyuk 1991 :I 52)
esearch on global change has been hin- dered by deficiencies in the availability R and quality o f land-cover data (Mather
and Sdasyuk 1991; Townshend 1992). To ad- dress this deficiency, the U.S. Geological Sur- vey (USCS) and the University of Nebraska- Lincoln have collaborated in developing a method o f land-cover characterization that is suitable for research on global change and on regional patterns o f land cover (Loveland et al. 1991; Brown et al. 1993). This methodology is based upon statistical analysis o f multidate, me- teorological satellite imagery acquired by the National Oceanic and Atmospheric Admini- stration's (NOAA) Advanced Very High Reso- lution Radiometer (AVHRR) sensor comple- mented by ancillary spatial data. The product o f this analysis-a multi-level, digital, geo- graphically referenced land-cover database (hereafter referred to as the database) covering the coterminous United States-serves as a prototype for a global land-cover database which is currently under development.
The study of global change requires im- proved regional frameworks (for example, Turner, Moss, and Skole 1993; Mather and Sdasyuk 1991). The land-cover charac- terization strategy developed in this study is based upon regionalization o f the seasonal ex- pression of vegetative development. This ap-
proach is well-suited for global-change re- search because o f the explicit manner in which critical biophysical conditions are used to de- fine and characterize land-cover regions. Moreover, the regionalization process pre- sented here has the advantages of replicability, computational manageability, flexibility, and global applicability.
The USGS-Nebraska study was undertaken in order to generate digital maps for climatic, hydrologic, and ecologic modeling and other applications in which land-cover data are re- quired (Steyaert et al. 1994). This paper draws upon that digital database in constructing maps o f selected land-cover characteristics o f the continental United States. These maps are illus- trative of the variety of maps that can be pro- duced from the digital database. The paper de- scribes the methods used to prepare the data- base, presents an experimental map supple- ment portraying seasonal land-cover regions o f the U.S. based on the analysis of multitemporal AVHRR and ancillary spatial data, and provides guidance for prospective users o f the digital database.
The maps in this paper represent a few o f the cartographic products that might be de- rived from the database. Many others are pos- sible, however, because our approach affords users the opportunity for customizing products to specific needs. Because no single map or set o f maps can convey fully the richness of the database, visualization tools such as those commonly found in geographic information systems (CIS) as well as new specialized car-
Annals of the Associalion of American Geographers, 85(2), 1995, pp. 339-355 0 1 995 by Association 01 American Geographers Published by Blackwell Publishers, 238 Main Street, Cambridge, MA 02142, and 108 Cowley Road, Oxford, OX4 1IF. UK
Downloaded By: [Us Geological Survey] At: 18:25 20 July 2009
340 Loveland et al.
tographic software provide appropriate means for exploiting the database (for example, Egbert and Slocum 1992).
Global land-Cover Requirements for Biophysical Modeling
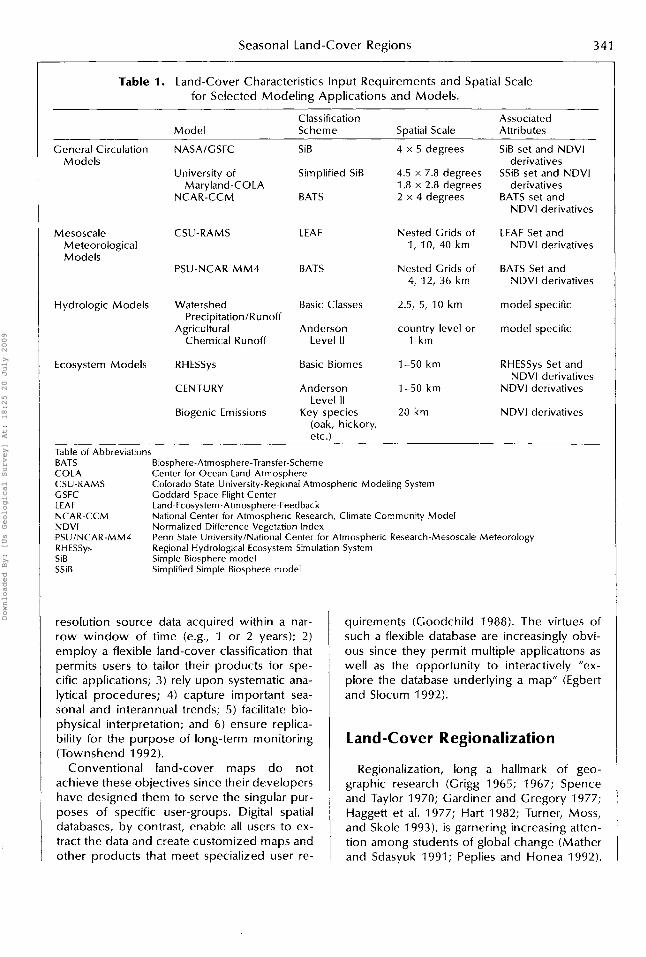
Because o f the wide variety of scales, classi- fication schemes, and derived land-cover pa- rameters that are employed by students of global change, current global land-cover data- bases (UNESCO 1973; Olson and Watts 1982; Matthews 1983) are unable to fill many emerg- ing research needs. Consequently, the selec- tion o f a land-cover framework usually de- pends more on data availability than on the suitability of that framework for the problem at hand. Equally problematic is the wide range and variety of global-change applications which require land-cover data. These include such different applications as atmospheric mesoscale and general circulation modeling, water-resources assessment, and ecological modeling (for more extensive reviews, see Baker 1989; Henderson-Sellers and McGuffie 1987; Sklar and Costanza 1990; and Goodchild et al. 1993). Accordingly, land-cover typologies and their spatial resolutions will vary both within and between applications. Table 1 sum- marizes the land-cover inputs (classification schemes, attributes, and spatial scale) required b y ten selected models.
In the case o f atmospheric models, clima- tologists and meteorologists construct meso- scale and general circulation models (GCMs) to estimate a range o f future weather or climate conditions. Mesoscale models operate in a re- gional context with typical spatial resolutions of 1 to 40 kilometers; GCM’s are global in scale and require resolutions on the order of 2 x 4 degrees latitude/longitude or greater. Models at both scales use land-surface parameteriza- tion schemes to determine land/atmosphere interactions. For example, the Biosphere Atmo- sphere Transfer Scheme (BATS) (Dickinson et al. 1986) and the Simple Biosphere Mode l (SIB) (Sellers et al. 1986; Xue et al. 1991) link data on land cover wi th measures of fractional land cover, roughness, albedo, and other land characteristics for calculating water and en- ergy-exchange fluxes for grid cells. Note,
however, that the land-cover types used in BATS and SiB differ in the number o f classes (there are 18 BATS versus 1 3 SIB classes in the U.S.), the definitions of classes, and the variety of attributes that describe land-cover prop- erties.
Similarly, hydrological models typically re- quire information on land cover, soils, and ter- rain for the purpose o f defining homogeneous hydrologic-response units (HRUs) for their computations. HRUs typically are defined by relatively simple land-cover classes, e g , bare soil, grasses, bushes/shrubs, and trees, and for multiple grids, e.g., 2.5-, 5-, and 10-km grid cells or variously sized polygons associated with watershed basin characteristics.
Ecosystem models meanwhile use land- cover data for estimating a range o f measures o f ecosystem functions and dynamics, e.g., pri- mary productivity, biogeochemical cycling, and biogenic emissions. The ecosystem model CENTURY simulates the temporal dynamics of soil organic matter and plant production in grazed grasslands (Parton et al. 1987; Burke et al. 1991) using land-cover (particularly land- use) and monthly climate data as key inputs. The specific land-cover classes used in the CENTURY model vary, however, according to the application. The Regional Hydrological Eco- system Simulation System (RHESSys) model re- quires, by contrast, broad land-cover data at the biome scale, i.e., grasses, shrubs, conifer- ous, and deciduous forests, at 1 - to 60-km grid cell sizes. This model uses land-cover attrib- utes for each cover class in combination with satellite-derived estimates of leaf area and daily weather data in order to calculate water, en- ergy, and trace-gas fluxes (Running 1990).
Optimal Global land-Cover Data for Global-Change Research
Existing land-cover maps o f the continents and the globe are uniformly small in scale, coarse in spatial resolution, variable in quality and reliability, and ill-suited for alternative mod- eling applications (Townshend 1992; Hender- son-Sellers and Pitman 1992; Townshend et al. 1991 ). Accordingly, the design o f an optimal land-cover data set for global-change research should overcome these deficiencies. It should: 1) derive from a single set of relatively high-
Downloaded By: [Us Geological Survey] At: 18:25 20 July 2009
Seasonal Land-Cover Regions 341
Table 1 . Land-Cover Characteristics Input Requirements and Spatial Scale for Selected Modeling Applications and Models.
General Circulation Models
Mesoscale Meteorological Models
Hydrologic Models
Ecosystem Models
Classification Model Scheme Spatial Scale
NASA/GSFC
University of Maryland-COLA
NCAR-CCM
CSU-RAMS
PSU-NCAR M M 4
Watershed
Agricultural PrecipitationlRunoff
Chemical Runoff
RHESSys
CENTURY
Biogenic Emissions
SiB 4 x 5 degrees
Simplified SiB
BATS 2 x 4 degrees
4.5 x 7.8 degrees 1.8 x 2.8 degrees
LEAF Nested Grids of 1, 10, 40 k m
BATS Nested Grids of 4, 12, 36 k m
Basic Classes
Anderson country level or
2.5, 5, 10 k m
Level II 1 k m
Basic Biornes 1-50 k m
Anderson 1-50 k m
Key species 20 krn Level I I
(oak, hickory, etc.)
Associated Attributes
SiB set and NDVl derivatives
SSiB set and NDVl derivatives
BATS set and NDVl derivatives
LEAF Set and NDVl derivatives
BATS Set and NDVl derivatives
model specific
model specific
RHESSys Set and
NDVl derivatives NDVl derivatives
NDVl derivatives
Table of Abbreviations BATS Biosphere-Atmosphere-Transfer-Scheme COLA Center for Ocean-Land-Atmosphere CSU-RAMS GSFC Goddard Space Flight Center LEAF Land-Ecosystem-Atmosphere-Feedback NCAR-CCM NDVl Normalized Difference Vegetation Index PSU/NCAR-MM4 RHESSys SiB Simple Biosphere model SSiB Simplified Simple Biosphere model
Colorado State University-Regional Atmospheric Modeling System
National Center for Atmospheric Research, Climate Community Model
Penn State UniversitylNational Center for Atmospheric Research-Mesoscale Meteorology Regional Hydrological Ecosystem Simulation System
resolution source data acquired within a nar- row window of time (eg , 1 or 2 years); 2) employ a flexible land-cover classification that permits users to tailor their products for spe- cific applications; 3) rely upon systematic ana- lytical procedures; 4) capture important sea- sonal and interannual trends; 5) facilitate bio- physical interpretation; and 6) ensure replica- bility for the purpose of long-term monitoring (Townshend 1992).
Conventional land-cover maps do not achieve these objectives since their developers have designed them to serve the singular pur- poses of specific user-groups. Digital spatial databases, by contrast, enable all users to ex- tract the data and create customized maps and other products that meet specialized user re-
quirements (Goodchild 1988). The virtues of such a flexible database are increasingly obvi- ous since they permit multiple applications as well as the opportunity to interactively "ex- plore the database underlying a map" (Egbert and Slocum 1992).
land-Cover Regionalization
Regionalization, long a hallmark of geo- graphic research (Grigg 1965; 1967; Spence and Taylor 1970; Gardiner and Gregory 1977; Haggett et al. 1977; Hart 1982; Turner, Moss, and Skole 1993), is garnering increasing atten- tion among students of global change (Mather and Sdasyuk 1991; Peplies and Honea 1992).
Downloaded By: [Us Geological Survey] At: 18:25 20 July 2009
342 Loveland et al.
The latter have realized that regions can serve as units of analysis that capture important as- pects of landscape variability over large areas. In addition, regions offer an efficient and flex- ible spatial framework for summarizing the often complex ecosystem parameters that are required in environmental modeling (Omernik and Gallant 1990).
The rich and extensive literature on region- alization is, of course, well-known to geogra- phers (for example, Grigg 1967; Haggett et al. 1977; Hart 1982). For purposes of this paper, we employ a method of land-cover regionali- zation which defines uniform regions based upon seasonal characteristics of land cover augmented by other descriptive attributes. Re- gionalization, in this regard, represents a spe- cial form of classification (Grigg 1967). Classifi- cations of landscape regions may be based on one variable (monothetic) or many (polythetic) (Spence and Taylor 1970; Gardiner and Greg- o r y 1977). Examples of monothetic or univari- ate regionalization include Kuchler’s map of the potential vegetation of the United States and Anderson‘s depiction of land-use and land-cover regions for that same nation (Kuchler 1964; U.S. Geological Survey 1970). Polythetic or multivariate regionalization (Spence and Taylor 1970) is illustrated by the maps of ecoregions (produced by Omernik 1987; and Bailey 1980; 1983) which are de- fined as multivariate associations of climate, ge- ology, terrain, soils, and vegetation.
Our classification of land-cover charac- teristics for the United States is most closely related to the polythetic regionalization model. This decision signals a departure from the norm of land-cover regionalizations derived from remote sensing which employ a mono- thetic approach. In these cases, image analysts assign each pixel to one, and only one, cate- gory in a land-cover classification system (such as, for example, Anderson et al. 1976; o r Jen- nings 1993). While the monothetic approach may produce land-cover maps that are well- suited for certain types of land-management activities (e.g., wildlife-habitat evaluation or soil-erosion hazard assessment), the method lacks the flexibility that is required for many environmental models (Omernik and Gallant 1990). T h e fact that monothetic mapping is often designed for a specific need for land- cover data means that this procedure is usually ill-suited for other applications (Peplies and
Honea 1992). For optimal flexibility of usage, a land-cover database should accommodate a broad range of temporal, spatial, and categori- cal aggregations that are suited to variable ap- plications requirements (Peer 1990; Reed et al. 199413). Achieving such flexibility is the main purpose for which the US. land-cover data- base has been designed.
Sources of Land-Cover Data: Satellite Remote Sensing
Earth-observing satellites (e.g., Landsat, SPOT) have been collecting data for more than 20 years. These data are routinely used for land-cover assessment, although several prac- tical issues have limited their usefulness for land-cover mapping over subcontinental or larger areas (Goward 1990). The large volume of data (number of scenes and number of pix- els) required to cover even a single continent and the complexity of data acquisition and analysis have made such analyses prohibitively expensive (see Woodwell et al. 1984). More- over, the revisit period (e.g., 16 days for Land- sat) of the current earth-observing satellites is such that, in most instances, the generation of a cloud-free high-quality set of images entails assembling scenes acquired over several years and many seasons.
Because of such difficulties in using earth-ob- serving satellites for large-area land-cover as- sessments, attention in recent years has shifted to the potential application of meteorological satellite data for such ventures. Most efforts have focused on the Advanced Very High Resolution Radiometer (AVHRR), a sensor car- ried on the National Oceanic and Atmospheric Administration’s (NOAA) series of polar-orbit- ing meteorological satellites. The AVHRR pro- vides low-cost daily global coverage at 1.1 by 1 .I kilometer spatial resolution (note that we resampled the 1 .I -km2 AVHRR data to a nomi- nal 1 -km resolution for this study; hence, sub- sequent references are to the 1 -km data). The high frequency of observation affords many opportunities for acquisition of cloud-free data over relatively short periods of time ( e g , a growing season) and facilitates the compilation of information on seasonal changes in land-sur- face characteristics. Moreover, the 1 -km spatial resolution produces a manageable volume of
Downloaded By: [Us Geological Survey] At: 18:25 20 July 2009

Seasonal Land-Cover Regions 343
data even for the global scale (Townshend 1992).
Although designed mainly for atmospheric rather than earth observation, the AVHRR sen- sor is also useful for land-cover assessment. In most instances, data from AVHRR channels 1 (reflected red light-0.58 to 0.68 micrometers) and 2 (reflected near infrared-0.725 to 1.10 micrometers) are used to compute an index of vegetation “greenness” (the normalized differ- ence vegetation index or NDVI) for each 1 -km pixel (Eidenshink 1992). This index of “green- ness” is broadly correlated in turn with several biophysical parameters such as levels of photo- synthetic activity, primary production, leaf area, and C O z flux (see Box et al. 1989; Goward and Huemmirch 1992; Ludeke et al. 1991; Spanner et al. 1990; and Tucker et al. 1983).
Cloud-free greenness maps o f the earth’s surface are assembled from multidate compos- ite images. The USGS EROS Data Center, for example, produces a 14-day composite green- ness image for the coterminous US. (available on CD-ROM; Eidenshink 1992). The EROS composite images are constructed by assigning each pixel the highest NDVI recorded in that pixel during the 14-day period. This process tends to eliminate clouds except in areas where there are no cloud-free pixels during the 14-day period. A time series of these compos- ite ”greenness” images depicts phenological events, most notably the annual progression from Spring greenup (“green wave”) when the northern hemisphere‘s deciduous trees de- velop leaves and crops emerge and develop to the ensuing Fall’s retrogression (“brown wave”) when trees drop their leaves and crops reach senescence and are harvested (Goward et al. 1985; Coward 1989). With data such as these w e are able to define regions having distinctive seasonal characteristics.
The graph in Figure 1 provides an example of a greenness (NDVI) profile for Iowa. The graph describes the characteristic increase in greenness (”onset”) starting in May as the row crops (e.g., corn and soybeans) emerge and develop, the peaking of greenness in early Au- gust as crops reach their maximum develop- ment, and the decrease o f greenness in early Fall associated with senescence and harvest. Iowa’s profile o f greenness advance, peak, and retreat is quite different, however, from other areas with different cover types. The US. data-
156
- 2 142 z n al - 8 128 u)
114
Peak \
100 1 1 Jan Mar May Jun Aug Sep Oct Dec
Biweekly Period
Figure 1. Sample temporal profile for the central Corn Belt showing the relationships between NDVl and the timing of the onset and peak of greenness and the duration of the green period in 1990.
base project takes advantage of this variability in sequencing which enables land cover in a given region to be characterized by the annual multitemporal trajectory of greenness associ- ated with that region.
The utilization of AVHRR data for large-area, land-cover assessment extends back nearly 15 years (Townshend et al. 1991). Most of this research uses AVHRR data resampled to 4-km2 or 16-km2 pixels. For example, AVHRR data at a resolution o f 4-km2 has been used for defin- ing major biomes and observing phenological change over the African continent for a 19- month period in 1982 and 1983 (Tucker, Townshend, and Goff 1985), and for classifying land cover in South America (Townshend, Jus- tice, and Kalb 1987). Moreover, seasonal NDVl patterns have been used to test associations with major land-cover regions of North Amer- ica and to document major phenological events (Goward, Tucker, and Dye 1985). World biomes have been mapped using a su- pervised binary decision tree classification o f multidate AVHRR data (Lloyd 1991 ), and global phytoclimatological conditions have been ex- amined using biweekly AVHRR data (Gallo and Brown 1990).
The use o f finer-resolution AVHRR data for land-cover assessment is less common be- cause the data generally are not available over large areas o f the globe (Ehrlich, Estes, and Singh 1994). Studies that have employed 1 -km AVHRR data have usually focused on small ar-
Downloaded By: [Us Geological Survey] At: 18:25 20 July 2009
344 Loveland et al.
eas (see Tucker, Gatlin and Schneider 1984; Gervin et al. 1985). Recently, however, several studies have used I - k m AVHRR data for large area land-cover studies. Using 1 -km AVHRR data, Zhu and Evans (1994) mapped forest types and forest density for the coterminous United States, and Stone et al. (1994) con- structed a general land-cover map of South America (largely from I - k m AVHRR data). One-kilometer AVHRR data also have been used for mapping general land-cover patterns of Canada as part o f a national atlas project (Palko 1990). Promising as well is a collabora- tive effort aimed at providing data needed for a range of global-change research initiatives. In this case, a consortium o f the USGS, National Aeronautics and Space Administration (NASA), NOAA, the European Space Agency, and the International Geosphere Biosphere Pro- gramme is developing a global time series of 1 -km AVHRR data for the period April 1992 to Septem ber 1994.
Producing the U.S. Land-Cover Database
The production of the U.S. 1 -km land-cover database began with assemblage o f a national coregistered 1 -km dataset consisting o f a set of eight monthly maximum NDVl composite im- ages covering the period March-October 1990 along with data on elevation, climate, ecoregions, and related attributes (Loveland et al. 1991; Brown et al. 1993). The eight NDVl images were statistically clustered using the lsoclass clustering algorithm, a per-pixel algo- rithm which has no contiguity constraints. The algorithm yielded 70 spectral-temporal (”sea- sonally-distinct”) classes (regions). These re- gions were then collated with Landsat imagery, existing vegetation map observations, and other reference materials in order to develop a preliminary description o f land cover in each of the 70 regions. These land-cover descrip- tions were then refined using a postclassifica- tion sorting procedure (Brown et al. 1993). Classes with similar seasonal NDVl profiles, but different vegetative components, were subdi- vided into internally homogeneous land-cover regions. This resulted in a database containing 159 seasonal land-cover regions and their cor- responding descriptions.
The 159 land-cover regions were then cross- tabulated with elevation, climate, ecoregions, land use, land cover, and ancillary data sets. This cross tabulation enables database users to determine the topographic and climatic char- acteristics of a given land-cover region. Tables linking the AVHRR-derived database and other commonly used land-cover classification sys- tems (e.g., Anderson’s USGS scheme, BATS, and SiB) were created to facilitate translations between the systems. Finally, parameters such as the timing of vegetative onset and peak greenness and the duration of the green period were derived from AVHRR data for january- December 1990. The entire US. database-in- cluding source data, classification, derived and ancillary data, tabular data, and documenta- tion-is available on CD-ROM (USGS EROS Data Center, Sioux Falls, SD 57198) (Table 2).l
Preparing the Map Supplement
We then turned to the cartographic repre- sentation o f these data. A n experimental map portraying the land-cover regions and selected seasonal characteristics was produced. This 1:7,500,000-scale map depicted the 159 sea- sonal land-cover regions grouped into major cover types. The legend listed typical vegeta- tion or land-cover types found in each region. In some cases, two or more classes were indi- cated as having the same land-cover types. In these cases, the several regions share common land-cover attributes, but differ in the seasonal characteristics o f vegetative development or in the relative levels o f vegetative productivity.
The presentation o f the 159 seasonal land- cover regions at this small a scale constituted a major challenge. Because of the fine spatial resolution o f the database and because some of the regions are very small, techniques such as pattern overlays or region labeling (as used on Kuchler’s map of potential natural vegeta- tion) were not feasible. W e developed instead a technique that designated a distinct hue for each group of cover types. The selection of hues was based on standard cartographic con- ventions for color representation of vegetation types, i.e., green for forests and yellow for grasslands. Within each cover-type group, darker hues represent increasing relative levels of annual primary production (estimated from annual total NDVI). For example, w e divided
Downloaded By: [Us Geological Survey] At: 18:25 20 July 2009
Seasonal Land-Cover Regions 345
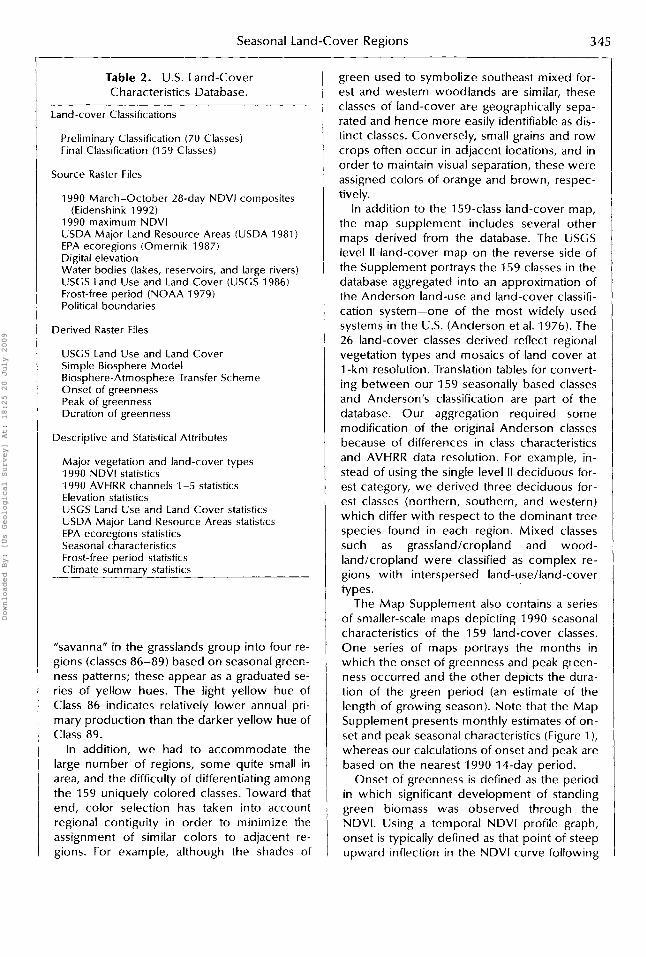
Table 2. U S . Land-Cover Characteristics Database.
Land-cover Classifications
Preliminary Classification (70 Classes) Final Classification (1 59 Classes)
Source Raster Files
1990 March-October 28-day NDVl composites (Eidenshink 1992)
1990 maximum NDVl USDA Major Land Resource Areas (USDA 1981) EPA ecoregions (Omernik 1987) Digital elevation Water bodies (lakes, reservoirs, and large rivers) USGS Land Use and Land Cover (USCS 1986) Frost-free period (NOAA 1979) Political boundaries
Derived Raster Files
USGS Land Use and Land Cover Simple Biosphere Mode l Biosphere-Atmosphere Transfer Scheme Onset of greenness Peak of greenness Duration of greenness
Descriptive and Statistical Attributes
Major vegetation and land-cover types 1990 NDVl statistics 1990 AVHRR channels 1-5 statistics Elevation statistics USCS Land Use and Land Cover statistics USDA Major Land Resource Areas statistics EPA ecoregions statistics Seasonal characteristics Frost-free period statistics Climate summarv statistics
"savanna" in the grasslands group into four re- gions (classes 86-89) based on seasonal green- ness patterns; these appear as a graduated se- ries of yellow hues. The light yellow hue of Class 86 indicates relatively lower annual pri- mary production than the darker yellow hue of Class 89.
In addition, w e had to accommodate the large number o f regions, some quite small in area, and the difficulty o f differentiating among the 159 uniquely colored classes. Toward that end, color selection has taken into account regional contiguity in order to minimize the assignment of similar colors to adjacent re- gions. For example, although the shades of
green used to symbolize southeast mixed for- est and western woodlands are similar, these classes o f land-cover are geographically sepa- rated and hence more easily identifiable as dis- tinct classes. Conversely, small grains and row crops often occur in adjacent locations, and in order to maintain visual separation, these were assigned colors of orange and brown, respec- tively.
In addition to the 159-class land-cover map, the map supplement includes several other maps derived from the database. The USGS level I1 land-cover map on the reverse side o f the Supplement portrays the 159 classes in the database aggregated into an approximation of the Anderson land-use and land-cover classifi- cation system-one of the most widely used systems in the US. (Anderson et al. 1976). The 26 land-cover classes derived reflect regional vegetation types and mosaics o f land cover at 1 -km resolution. Translation tables for convert- ing between our 159 seasonally based classes and Anderson's classification are part o f the database. Our aggregation required some modification of the original Anderson classes because of differences in class characteristics and AVHRR data resolution. For example, in- stead o f using the single level I I deciduous for- est category, w e derived three deciduous for- est classes (northern, southern, and western) which differ with respect to the dominant tree species found in each region. Mixed classes such as grassland/cropland and wood- land/cropland were classified as complex re- gions with interspersed land-use/land-cover types.
The M a p Supplement also contains a series o f smaller-scale maps depicting 1990 seasonal characteristics of the 159 land-cover classes. One series of maps portrays the months in which the onset o f greenness and peak green- ness occurred and the other depicts the dura- tion of the green period (an estimate o f the length o f growing season). Note that the Map Supplement presents monthly estimates o f on- set and peak seasonal characteristics (Figure 1 ), whereas our calculations of onset and peak are based on the nearest 1990 14-day period.
Onset of greenness is defined as the period in which significant development of standing green biomass was observed through the NDVI. Using a temporal NDVl profile graph, onset is typically defined as that point of steep upward inflection in the NDVl curve following
Downloaded By: [Us Geological Survey] At: 18:25 20 July 2009
346 Loveland et al.
t h e dormant season. Interpretation o f this point is somewhat subjective, however, and the search for an objective quantitative means for detecting seasonal events from NDVl is under- way (Reed et al. 1994a).
The maps portraying peak-greenness months are based upon the biweekly period wh ich reported the highest level o f greenness (NDVI) in 1990, i.e., the time period o f maxi- m u m NDVl mean value for each o f the 159 classes. Lastly, the map of the Length o f Green Period shows the duration o f greenness-de- fined as the number of days between onset and end of greenness (Figure 1). The end of the green period w e defined as the biweekly period in which the NDVl dropped to a sea- sonal low corresponding to the NDVl level at the onset of greenness. The interval between the onset and the end o f greenness thus equals the duration o f the green period (expressed as number o f days).
Interpreting the U.S. Land-Cover Map
The 159-region maps are based upon a re- motely-sensed dataset collected over a single year. These maps have several advantages: 1) their resolution (1 km) is substantially finer than most comparable products; 2) the large num- ber o f regional classes exceeds those o f similar maps (for example, US. Geological Survey 1970; Kuchler 1964; Omernik 1987; Bailey 1980); and 3) the 159 regional classes incorpo- rate seasonality and productivity as well as land cover. Whereas comparable maps present a single set of regions labeled "wheat," w e dis- cern several wheat regions with varying crop calendars (i.e., planting/harvesting dates) that correspond to higher latitude and/or elevation or climatic gradients. Moreover, because the land-cover data are registered to other data- bases (e.g., elevation, climate, ecoregions), us- ers can explore relationships between the sev- eral datasets and construct products designed for their specialized needs.
Because the original AVHRR data have a resolution of approximately 1 -km, mixtures o f land-cover are commonly integrated within the AVHRR pixel. Even in areas largely devoted to crops, a 1 -km pixel will usually contain tracts o f woodland, grass, and other cover types that
exhibit phenologies different from crops. This is particularly evident in areas such as the Mid- dle Atlantic states, where land cover is both diverse and highly fragmented into small par- cels.
A t first glance, the spatial complexity o f the 159-class map may seem disconcerting, even noisy. While cartographers are still debating the merits, role, and procedures for data classifica- tion and presentation-generality versus de- tail-(Dent 1993; Egbert and Slocum 1992; Tobler 1973), our map aims to convey the overall pattern o f land cover in a single year and to provide a realistic depiction o f the spa- tial patterns o f land cover. The I - k m spatial resolution enables us to portray the fragmen- tation and patchiness o f land cover which are not usually apparent in more generalized maps. In addition, by revealing the fuzzy na- ture of ecotones separating major landscape regions, the map underlines the role o f eco- tones as transition zones (Clarke et al. 1991).
The Map Supplement portrays many familiar patterns among the seasonal land-cover re- gions. Note, for example, the distinctive and relatively homogeneous land cover of the Corn Belt, the Ozark Uplands, the Palouse o f Wash- ington and the Flint Hills o f Kansas. The map also captures the differences in the spatial structure o f land cover across the nation. The highly fragmented depiction o f the interior western landscapes o f the basin and range province, for example, reflect the often dra- matic variation in relief, elevation, and micro- climate over relatively short 'distances in this region. The expression o f underlying physical geography is evident elsewhere as well-on the eastern fall zone, the ridges and valleys of the southern Appalachian Mountains, along the Willamette valley of Oregon, amidst the Nebraska Sand Hills, and within the Black Hills of South Dakota.
Patterns on the derivative maps are, per- haps, less familiar because they have been in- frequently (if ever) mapped at the spatial and temporal resolution of our database. Compari- sons between the seasonal land-cover regions map and the derivative maps o f onset, dura- tion, and peak of greenness are informative and, at times, expose surprising relationships. For example, the late date o f the onset of greenness in the croplands o f the Mississippi floodplain (downstream from Cairo, Illinois) does not correspond with the seasonal char-
Downloaded By: [Us Geological Survey] At: 18:25 20 July 2009
Seasonal Land-Cover Regions 347
acteristics of the surrounding region. Given a moderate climate, one might expect that crops there would be planted and mature to their peak greenness quite early by comparison to crops at more northerly latitudes. The maps show that this was not the case in 1990. The maps thus lead us to explore this apparent anomaly. Anecdotal evidence suggests that high water tables and abundant precipitation in the spring may have resulted in saturated fields which delayed planting in this region; the mat- ter clearly deserves more thorough research. Doubtless examination o f the maps will reveal other anomalous areal relationships between land cover and regional seasonality. Some of these may reflect the specific meteorological conditions that existed in 1990, while others may suggest more durable anomalies that merit investigation.
Note that the 159-class map portrays season- ally distinct land cover and not land use (Campbell 1983). As a consequence, urban- ized areas are represented by their constituent land-cover types (e.g., grassland, woodland, barren). Moreover, because class labeling has been optimized at the national level, urban mosaics o f roads, buildings, and parks may ap- pear as "desert shrubland" since their spectral and temporal characteristics often resemble that cover type. Persons interested in urban areas should be aware of the causes o f this apparent mislabeling and may wish to assign more appropriate labels to areas of interest. Ancillary data sources can, o f course, be used to identify urban areas as demonstrated in our USGS Level I1 Land-Cover map. In this case, urban areas were derived from the Digital Chart of the World and overlaid into the AVHRR-derived general land-cover map in or- der to provide map readers with a portrayal of the spatial extent o f urban areas as well as an example o f complementary use of data from different sources (Danko 1992).
Understanding Seasonal land-Cover Characterization
To facilitate interpretation of the seasonality inherent in the land-cover database, we pre- sent a brief analysis o f some representative land-cover classes. The temporal greenness profiles in Figures 2-5 depict the average NDVl
for each of eight classes over the twenty-two 14-day intervals in 1990. Similar profiles for all other classes can be extracted from the data- base.
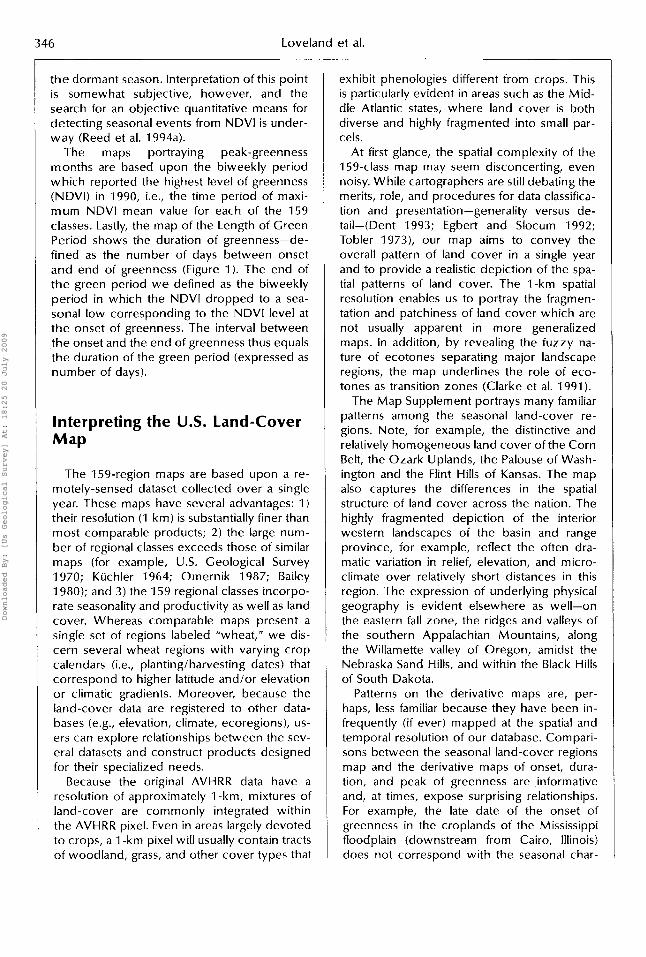
Figure 2 displays 1990 NDVl profiles for two agricultural regions: 1) Class 9, found in the southern Great Plains and eastern Washington, is cropland planted primarily in winter wheat; and 2) Class 17, found in the midwest corn belt, is cropland planted primarily in feed grains, especially corn and soybeans. Both NDVl profiles exhibit steep increases and de- creases in greenness corresponding to crop development, senescence, and harvest. In the corn-soybeans region, greenness begins its in- crease in May as crops emerge, peaks in mid- August as these crops reach their maximum biomass and photosynthetic activity, and de- creases in September as senescence and har- vest set in. In the winter wheat region, by con- trast, greenness increases in March as fall-sown winter wheat emerges in early spring, peaks in late-April, and decreases in early summer as crops are harvested.
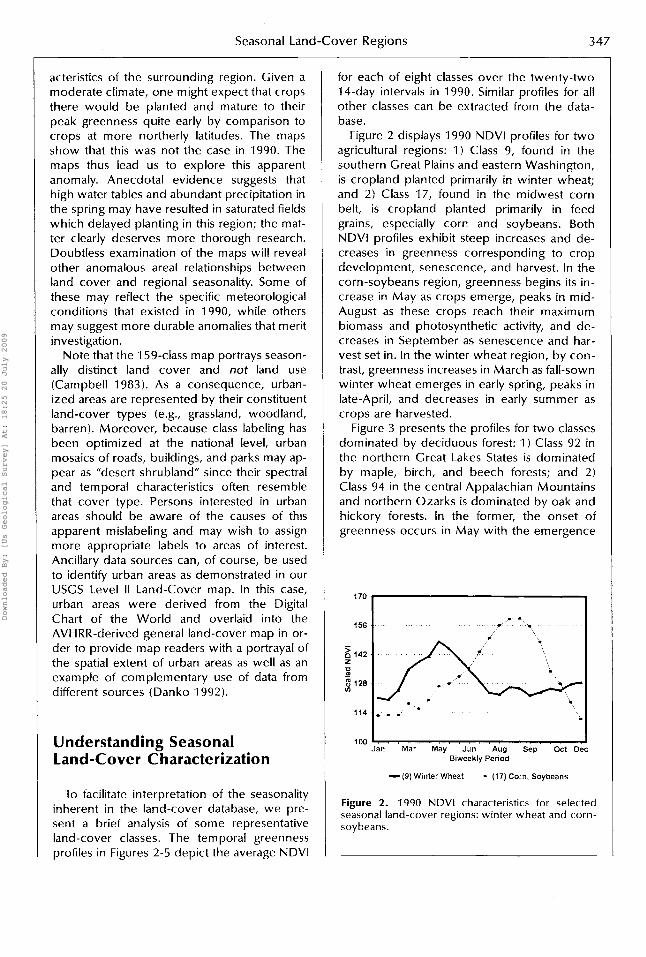
Figure 3 presents the profiles for two classes dominated by deciduous forest: 1) Class 92 in the northern Great Lakes States is dominated by maple, birch, and beech forests; and 2) Class 94 in the central Appalachian Mountains and northern Ozarks is dominated by oak and hickory forests. In the former, the onset o f greenness occurs in May with the emergence
114 . . I 100 1 , . , , , , , , , , , , I I I I
Jan Mar May Jun Aug Sep Oct Dec Biweekly Period
-(9) Winter Wheat - (17) Corn, Soybeans
Figure 2. 1990 NDVl characteristics for selected seasonal land-cover regions: winter wheat and corn- soybeans.
Downloaded By: [Us Geological Survey] At: 18:25 20 July 2009
348 Loveland et al.
3,veekly F'criOd
- j jZsVd, . c BirLh - (94)Odk Hickory
Figure 3. 1990 NDVl characteristics for selected seasonal land-cover regions. maple-birch and oak- hickory
of leaves, is followed by a steep increase in the NDVl from spring to the summer period of maximum photosynthesis, and then by a rapid decline in NDVl levels in September as leaves change color and defoliate. In the latter, the shape of the greenness profile is similar to that of t h e northern hardwoods region, but the on- set of greenness (April) is earlier because of the more southerly latitude. In addition, the longer growing season occasions later defoliation (late-October).
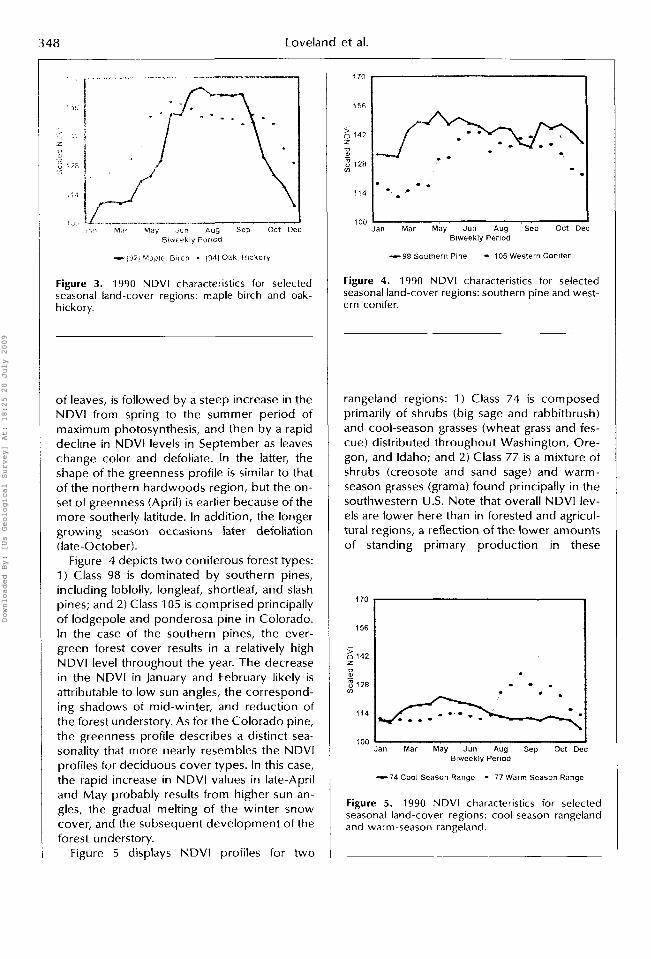
Figure 4 depicts two coniferous forest types: 1) Class 98 is dominated by southern pines, including loblolly, longleaf, shortleaf, and slash pines; and 2) Class 105 is comprised principally of lodgepole and ponderosa pine in Colorado. In the case of the southern pines, the ever- green forest cover results in a relatively high NDVl level throughout the year. The decrease in the NDVl in January and February likely is attributable to low sun angles, t h e correspond- ing shadows of mid-winter, and reduction of the forest understory. As for the Colorado pine, the greenness profile describes a distinct sea- sonality that more nearly resembles the NDVl profiles for deciduous cover types. In this case, the rapid increase in NDVl values in late-April and May probably results from higher sun an- gles, the gradual melting of the winter snow cover, and the subsequent development of the forest understory.
Figure 5 displays NDVl profiles for two
156
2 142 z 0 m - E 128 In
114 .
100 I Jan Mar May Jun Aug Sep Oct Dec
Biweekly Period
-9n Southern Pine - 105 Western Conifei
Figure 4. 1990 NDVl characteristics for selectt seasonal land-cover regions: southern pine and we! ern conifer.
rangeland regions: 1) Class 74 is composed primarily of shrubs (big sage and rabbitbrush) and cool-season grasses (wheat grass and fes- cue) distributed throughout Washington, Ore- gon, and Idaho; and 2) Class 77 is a mixture of shrubs (creosote and sand sage) and warm- season grasses (grama) found principally in the southwestern U.S. Note that overall NDVl lev- els are lower here than in forested and agricul- tural regions, a reflection of the lower amounts of standing primary production in these
100 1 Jan Mar May Jun Aug Sep Oct Dec
Biweekly Period
-74 Cool-Season Range * 77 Warm Season Range
Figure 5. 1990 NDVl characteristics for selected seasonal land-cover regions: cool-season rangeland and warm-season rangeland.
Downloaded By: [Us Geological Survey] At: 18:25 20 July 2009
Seasonal Land-Cover Regions 349
120
100
Lc, 80 e 60
5 40
20
0
- c
0 0
t-
10 74 - Cool-Season Rangeland
8
6
0 1 2 3 4 5 6 7 8 9 1 0 1 1 1 2
Month I MinfMeanlMax Temp-Preclprtatlon
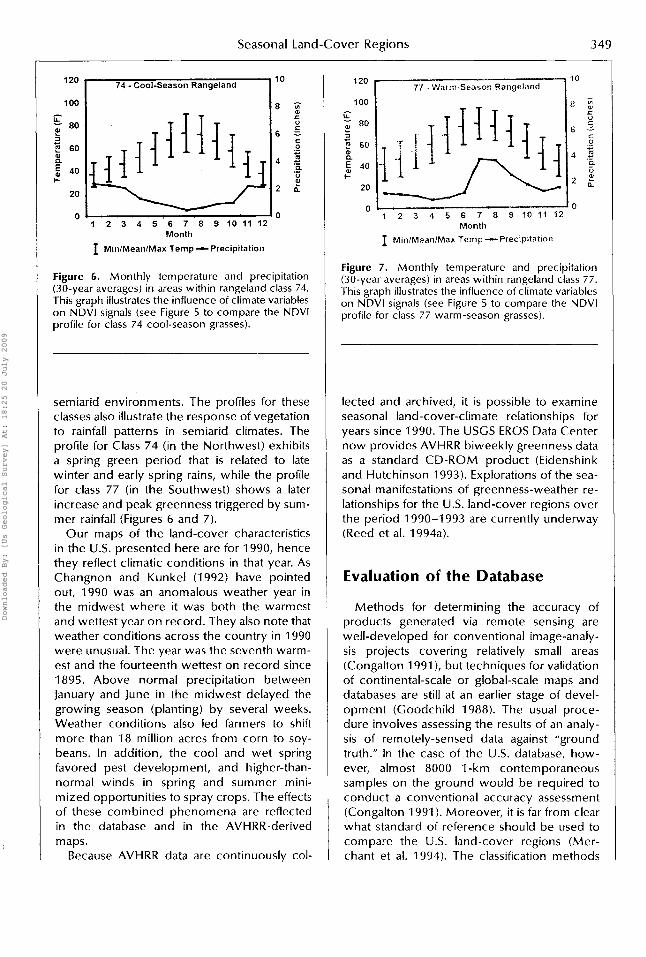
Figure 6. Monthly temperature and precipitation (30-year averages) in areas within rangeland class 74. This graph illustrates the influence of climate variables o n NDVl signals (see Figure 5 to compare the NDVl profile for class 74 cool-season grasses).
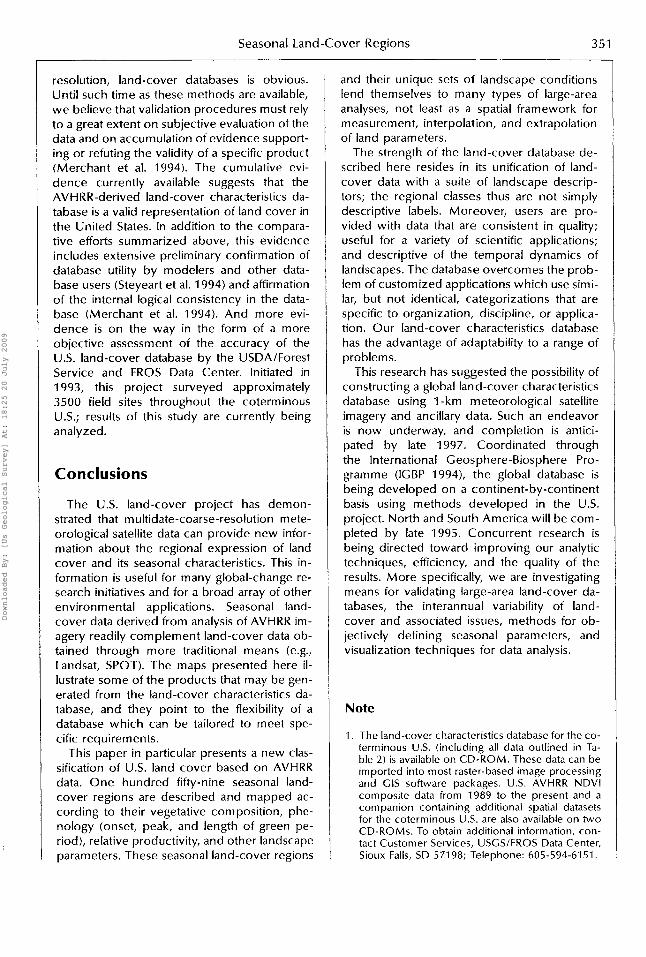
semiarid environments. The profiles for these classes also illustrate the response o f vegetation to rainfall patterns in semiarid climates. The profile for Class 74 (in the Northwest) exhibits a spring green period that is related to late winter and early spring rains, while the profile for class 77 (in the Southwest) shows a later increase and peak greenness triggered by sum- mer rainfall (Figures 6 and 7).
Our maps of the land-cover characteristics in the U.S. presented here are for 1990, hence they reflect climatic conditions in that year. As Changnon and Kunkel (1992) have pointed out, 1990 was an anomalous weather year in the midwest where it was both the warmest and wettest year on record. They also note that weather conditions across the country in 1990 were unusual. The year was the seventh warm- est and the fourteenth wettest on record since 1895. Above normal precipitation between january and June in the midwest delayed the growing season (planting) by several weeks. Weather conditions also led farmers to shift more than 18 million acres from corn to soy- beans. In addition, the cool and wet spring favored pest development, and higher-than- normal winds in spring and summer mini- mized opportunities to spray crops. The effects o f these combined phenomena are reflected in the database and in the AVHRR-derived maps.
Because AVHRR data are continuously col-
10 lZo ~ % a r m - S e a s o n Rangeland 1 100
tL, 80 E m 60
40
20
- c
m
I-
1 2 3 4 5 6 7 8 9 1 0 1 1 1 2 Month
I Min:Mean/Max Temp - Preclpltatlon
Figure 7. Monthly temperature and precipitation (30-year averages) in areas within rangeland class 77. This graph illustrates the influence of climate variables on NDVl signals (see Figure 5 to compare the NDVl profile for class 77 warm-season grasses).
lected and archived, it is possible to examine seasonal land-cover-climate relationships for years since 1990. The USGS EROS Data Center now provides AVHRR biweekly greenness data as a standard CD-ROM product (Eidenshink and Hutchinson 1993). Explorations of the sea- sonal manifestations o f greenness-weather re- lationships for the U.S. land-cover regions over the period 1990-1 993 are currently underway (Reed et al. 1994a).
Evaluation of the Database
Methods for determining the accuracy of products generated via remote sensing are well-developed for conventional image-analy- sis projects covering relatively small areas (Congalton 1991 ), but techniques for validation o f continental-scale or global-scale maps and databases are still at an earlier stage o f devel- opment (Goodchild 1988). The usual proce- dure involves assessing the results o f an analy- sis of remotely-sensed data against "ground truth." In the case o f the U.S. database, how- ever, almost 8000 l -km contemporaneous samples on the ground would be required to conduct a conventional accuracy assessment (Congalton 1991 ). Moreover, it is far from clear what standard of reference should be used to compare the U.S. land-cover regions (Mer- chant et al. 1994). The classification methods
Downloaded By: [Us Geological Survey] At: 18:25 20 July 2009

350 Loveland et al.
and the data used, the number and types of categories mapped, and the spatial resolution o f the U.S. database project differ considerably from those employed in conventional land- cover mapping efforts. Consequently, no rig- orous accuracy assessment o f the US. data- base has as yet been completed.
Nevertheless, a number o f preliminary stud- ies indicate that the database offers a reason- able depiction of U.S land cover. D. P. Turner et al. (1993), evaluating an early version of the database, compared forested areas in the 1990 U.S. database with the 1987 forest inventory data of the U.S. Forest Service (USFS). Their state-, regional-, and national-level areal assess- ments in states having large contiguous tracts o f forest cover report close agreement be- tween the USFS data and the AVHRR-derived estimates of forest. At the national level, the USFS and AVHRR estimates o f forested land differed by only about 4 percent. Similar esti- mates for county forest cover in the north- eastern portion of the US. indicate that the two sources compare very favorably (Lathrop and Bogner 1994), subject however to the caveat that validation is difficult because o f the differ- ences between the classification schemes used by the USFS and the AVHRR database.
Similar agreement has been found by Mer- chant et al. (1994) w h o compared portions of the U.S. database to several independently de- veloped state land-cover maps (Tables 3 and 4). When AVHRR-derived data for Nebraska were compared to USGS land-use and land- cover (USGS/LULC) maps derived from inter- pretation of high-altitude aerial photography and to the U.S. Department of Agriculture (USDA) areal land-use data, they found the croplandlgrassland estimates within 3 percent (USGS/LULC) and 8.3 percent (USDA), crop- land only estimates within 1 percent (USDA only), rangeland only estimates within 8 per- cent (USGS/LULC) and 10 percent (USDA), and forest estimates within 0.7 percent (USCS/LULC) and 1.0 percent (USDA). The AVHRR-derived land-cover data and USDA land-use data were also compared to a SPOT land-cover classification for South Carolina (Ta- ble 4) and, in this case, agreement was within 2 percent (SPOT) and 0.4 percent (USDA) for agriculture and grassland, and within 2 percent (SPOT) and 0.6 percent (USDA) for forests. Differences between the estimates are related to the coarse resolution of the AVHRR, time
Table 3. Land-Cover Estimates for Nebraska, Based on Data for the AVHRR Land Cover, USDA Land Use, and USGS
Land-Use/Land Cover (LU/LC).
AVHRR USCS/LULC USDA (percent) (percent) (percent)
Cropland or 99.3 96.3 91 .o grassland
Cropland 40.0 Not available 41.0 Rangeland 32.0 40.0 42.0 Forest 0.5 1.2 1.5
differences between the datasets, and so on. Forest cover in Nebraska, for instance, is prob- ably underestimated by the AVHRR because this type o f land cover tends to occur in small parcels relative to the 1 -km sensor resolution.
A t the national level, Merchant et al. (1994) compared the AVHRR land-cover database to USDA/National Agricultural Statistical Service (NASS) county-level data on cropped area. That comparison indicated that the estimates of absolute cropped area in the two datasets were significantly and positively correlated (r=.825, r2=.680). A similar association was ob- served for the proportion of each county in cropland. The authors also concluded that pre- liminary efforts to validate the AVHRR-derived US. land-cover characteristics database, though generally positive, have not been con- clusive because: 1) they have been based on areal rather than site-specific comparisons; and 2) the accuracies o f the "benchmark" data are not well documented.
The need for improved methods for the quantitative validation o f large-area, coarse-
Table 4. Land-Cover Estimates for South Carolina, Based on Data for the AVHRR Land Cover, USDA Land Use, and SPOT Satellite
Image Classification.
USDA AVHRR SPOT (percent) (percent) (percent)
Agriculture or 19 21 18.6
Forest 64 66 63.4 grassland
Downloaded By: [Us Geological Survey] At: 18:25 20 July 2009
Seasonal Land-Cover Regions 351
resolution, land-cover databases is obvious. Until such time as these methods are available, w e believe that validation procedures must rely to a great extent on subjective evaluation of the data and on accumulation o f evidence support- ing or refuting the validity o f a specific product (Merchant et al. 1994). The cumulative evi- dence currently available suggests that the AVHRR-derived land-cover characteristics da- tabase is a valid representation o f land cover in the United States. In addition to the compara- tive efforts summarized above, this evidence includes extensive preliminary confirmation of database utility by modelers and other data- base users (Steyeart et al. 1994) and affirmation o f the internal logical consistency in the data- base (Merchant et al. 1994). And more evi- dence is on the way in the form o f a more objective assessment o f the accuracy of the U.S. land-cover database by the USDA/Forest Service and EROS Data Center. Initiated in 1993, this project surveyed approximately 3500 field sites throughout the coterminous U.S.; results o f this study are currently being analyzed.
Conclusions
The US. land-cover project has demon- strated that multidate-coarse-resolution mete- orological satellite data can provide new infor- mation about the regional expression of land cover and its seasonal characteristics. This in- formation is useful for many global-change re- search initiatives and for a broad array o f other environmental applications. Seasonal land- cover data derived from analysis o f AVHRR im- agery readily complement land-cover data ob- tained through more traditional means (e.g., Landsat, SPOT). The maps presented here il- lustrate some o f the products that may be gen- erated from the land-cover characteristics da- tabase, and they point to the flexibility of a database which can be tailored to meet spe- cific requirements.
This paper in particular presents a new clas- sification o f US. land cover based on AVHRR data. O n e hundred fifty-nine seasonal land- cover regions are described and mapped ac- cording to their vegetative composition, phe- nology (onset, peak, and length of green pe- riod), relative productivity, and other landscape parameters. These seasonal land-cover regions
and their unique sets of landscape conditions lend themselves to many types o f large-area analyses, not least as a spatial framework for measurement, interpolation, and extrapolation of land parameters.
The strength o f the land-cover database de- scribed here resides in its unification of land- cover data with a suite o f landscape descrip- tors; the regional classes thus are not simply descriptive labels. Moreover, users are pro- vided with data that are consistent in quality; useful for a variety of scientific applications; and descriptive of the temporal dynamics o f landscapes. The database overcomes the prob- lem o f customized applications which use simi- lar, but not identical, categorizations that are specific to organization, discipline, or applica- tion. Our land-cover characteristics database has the advantage o f adaptability to a range o f problems.
This research has suggested the possibility o f constructing a global land-cover characteristics database using 1 -km meteorological satellite imagery and ancillary data. Such an endeavor is now underway, and completion i s antici- pated by late 1997. Coordinated through the International Geosphere-Biosphere Pro- gramme (IGBP 1994), the global database is being developed on a continent-by-continent basis using methods developed in the U.S. project. North and South America will be com- pleted by late 1995. Concurrent research is being directed toward improving our analytic techniques, efficiency, and the quality of the results. More specifically, w e are investigating means for validating large-area land-cover da- tabases, the interannual variability o f land- cover and associated issues, methods for ob- jectively defining seasonal parameters, and visualization techniques for data analysis.
Note
1. The land-cover characteristics database for the co- terminous US. (including all data outlined in Ta- ble 2) is available on CD-ROM. These data can be imported into most raster-based image processing and CIS software packages. US. AVHRR NDVl composite data from 1989 to the present and a companion containing additional spatial datasets for the coterminous U.S. are also available on t w o CD-ROMs. To obtain additional information, con- tact Customer Services, USCS/EROS Data Center, Sioux Falls, SD 571 98; Telephone: 605-594-61 51.
Downloaded By: [Us Geological Survey] At: 18:25 20 July 2009
352 Loveland et al.
Acknowledgments
The U.S. Geological Survey has provided all fund- ing for production and printing of the Map Supple- ment. Hughes STX Corporation performed their work under U.S. Geological Survey contract 1434- 92-C-40004. Research support for participating Uni- versity of Nebraska-Lincoln (UNL) staff was provided by the U.S. Environmental Protection Agency (Grant XOO7526-Ol ), the U S . Geological Survey, and the UNL Conservation and Survey Division.
References
Anderson, J. R., Hardy, E. E., Roach J. T., and Witmer, R. E. 1976. A Land Use and Land Cover Classi- fication System for Use with Remote Sensor Data. U.S. Geological Survey Professional Paper 964. Reston, Virginia: U.S. Geological Survey.
Bailey, R. G. 1980. Description o f the Ecoregions o f the United States. USDA/Forest Service Miscel- laneous Publication 1391. Washington, D.C.: US. Department of Agriculture, Forest Service.
. 1983. Delineation of Ecosystem Regions. En- vironmental Management 7:365-373.
Baker, W. L. 1989. A Review of Models of Land- scape Change. Landscape Ecology 2:111-133.
Box, E. O., Holben, B. N., and Kalb, V. 1989. Accu- racy of the AVHRR Vegetation Index as a Predic- tor of Biomass, Primary Productivity, and Net CO2 Flux. Vegetatio 30:71-89.
Brown, 1. F., Loveland, T. R., Merchant, J. W., Reed, B. C., and Ohlen, D. 0. 1993. Using Multi- source Data in Global Land Cover Charac- terization: Concepts, Requirements and Meth- ods. Photogrammetric Engineering and Remote Sensing 59:977-987.
Burke, I. C., Kittel, T. G., Lauenroth, W. K., Snook, P., Yonker, C. M., and Parton, W. J. 1991. Regional Analysis of the Central Great Plains: Sensitivity to Climate Variability. Bioscience 41 :685-689.
Campbell, J. B. 1983. Mapping the Land: Aerial Im- agery for Land Use Information. Washington, D.C.: Association of American Geographers.
Changnon, S. A., and Kunkel, K. E. 1992. Assessing Impacts of a Climatologically Unique Year (1990) in the Midwest. Physical Geography 13:180- 190.
Clarke, S. E., White, D., and Schaedel, A. L. 1991. Oregon, USA, Ecological Regions and Subregions for Water Quality Management. Environmental Management 1 5:847-856.
Congalton, R. G. 1991. A Review of Assessing the Accuracy of Classifications of Remotely Sensed Data. Remote Sensing of Environment 37:35-46.
Danko, D. M. 1992. The Digital Chart of the World. GeoInfo Systems 2:29-36.
Dent, B. D. 1993. Cartography: Thematic Map De- sign. Dubuque, Iowa: w. C. Brown Publishers.
Dickinson, R. E., Henderson-Sellers, A., Kennedy, P. J., and Wilson, M. F. 1986. Biosphere-Atmo- sphere Transfer Scheme (BATS) for the NCAR Community Climate Model. NCAR Technical Note, NCAR/TN-275+STR. Boulder, Colorado: National Center for Atmospheric Research.
Egbert, S. L., and Slocum, T. A. 1992. EXPLORE- MAP: An Exploration System for Choropleth Maps. Annals o f the Association o f American Geographers 82:275-288.
Ehrlich, D., Estes, J. E., and Singh, A. 1994. Applica- tions of NOAA-AVHRR 1 km Data for Environ- mental Monitoring. International Journal o f Re- mote Sensing 15:145-161.
Eidenshink, J. C. 1992. The 1990 Conterminous U.S. AVHRR Data Set. Photogrammetric Engineering and Remote Sensing 58:809-813.
Eidenshink, 1. C., and Hutchinson, J. A. 1993. AVHRR Data Set for the Conterminous United States. Research and Exploration, Water Issue, ed. A. de Souza. 9:86-97.
Gallo, K. P., and Brown, 1. F. 1990. Satellite-Derived Indices for Monitoring Global Phytoclimatology. In Proceedings of the International Geoscience and Remote Sensing Symposium, pp. 261 -264, Piscataway, New Jersey. Institute of Electrical and Electronics Engineers.
Gardiner, V., and Gregory, K. 1. 1977. Progress in Portraying the Physical Landscape. Progress in Physical Geography 1 :I -22.
Gervin, J. C., Kerber, A. C., Witt, R. G., Lu, Y. C., and Sekhon, R. 1985. Comparison of Level 1 Land Cover Classification Accuracy for M S S and AVHRR Data. lnternational Journal o f Remote Sensing 6:47-57.
Goodchild, M. F. 1988. The Issue of Accuracy in Global Databases. In Building Databases for Global Science, ed. H. Mounsey and R. F. Tom- linson, pp. 31 -48. London: Taylor and Francis.
Goodchild, M. F., Parks, B. O., and Steyaert, L. T. 1993. Environmental Modeling with Geo- graphic lnformation Systems. New York: Oxford University Press.
Coward, S. N. 1989. Satellite Bioclimatology. Journal o f Climate 2:710-720.
-. 1990. Experiences and Perspectives in Compiling Long-Term Remote Sensing Data Sets on Landscapes and Biospheric Processes. Geo- Journal 20:107-114.
Coward, S. N., and Huemmirch, K. F. 1992. Vegeta- tion Canopy PAR Absorptance and the Normal- ized Difference Vegetation Index: An Assess- ment using the SAIL Model. Remote Sensing o f Environment 39:119-140.
Coward, S. N., Tucker, C. I., and Dye, D. G. 1985. North American Vegetation Pat- terns Observed with the NOAA-7 Advanced Very High Resolution Radiometer. Vegetatio 64:3-I 4.
Grigg, D. 1965. The Logic of Regional Systems. An-
Downloaded By: [Us Geological Survey] At: 18:25 20 July 2009

Seasonal Land-Cover Regions 353
nals o f the Association of American Geographers 55:465-491. . 1967. Regions, Models and Classes. In lnte-
grated Models in Geography: Parts l and l V o f Models in Geography, ed. R. J. Chorley and P. Haggett, pp. 461 -509. London: Methuen.
Haggett, P., Cliff, A., and Frey, A. 1977. Locational Analysis in Human Geography. London: Edward Arnold.
Hart, J. F. 1982. The Highest Form of the Geogra- phers Art. Annals of the Association of American Geographers 72:l-29.
Henderson-Sellers, A,, and McGuffie, K. 1987. A Climate Modell ing Primer. New York: John Wiley.
Henderson-Sellers, A., and Pitman, A. J. 1992. Land- Surface Schemes for Future Climate Models: Specification, Aggregation and Heterogeneity. Journal of Geophysical Research 97:2687-2696.
International Geosphere-Biosphere Programme. 1994. lGBP Global Model ing and Data Activities 799441998. IGBP Report No. 30. Stockholm, Sweden: The International Geosphere-Bio- sphere Programme.
Jennings, M. D. 1993. Natural Terrestrial Cover Clas- sification: Assumptions and Definitions. Gap Analysis Technical Bulletin 2. Moscow, Idaho: US. Fish and Wildlife Service.
Kuchler, A. W. .1964. Potential Natural Vegetation o f the Conterminous United States. Special Publica- tion 36. New York: American Geographical So- ciety.
Lathrop, R. G., Jr., and Bognar, J. A. 1994. Develop- ment and Validation of AVHRR-Derived Regional Forest Cover Data for the North-Eastern U.S. ln- ternational Journal of Remote Sensing 15:2695- 2702.
Lloyd, D. 1991. A Phenological Classification of Ter- restrial Vegetation Using Shortwave Vegetation Index Imagery. lnternational Journal of Remote Sensing 11 :2269-2279.
Loveland, T. R., Merchant, J. W., Ohlen, D. O., and Brown, J. F. 1991. Development of a Land- Cover Characteristics Database for the Conter- minous U.S. Photogrammetric Engineering and Remote Sensing 57:1453-1463.
Ludeke, M., Janecek, A., and Kohlmaier, G. H. 1991. Modelling the Seasonal C 0 2 Uptake by Land Vegetation using the Global Vegetation Index. Jellus 43B:188-I 96.
Mather, J. R., and Sdasyuk, G. V., eds. 1991. Global Change: Geographical Approaches. Tucson: Uni- versity of Arizona Press.
Matthews, E. 1983. Global Vegetation and Land Use: New High Resolution Data Bases for Limited Studies. Journal of Climatology and Applied M e - teorology 22:474-487.
Merchant, J. W., Yang, L., and Yang, W. 1994. Vali- dation of Continental-Scale Land Cover Data Bases Developed from AVHRR Data. In Proceed- ings of the Pecora 72 Symposium, pp. 63-72.
Bethesda, Maryland: American Society for Pho- togrammetry and Remote Sensing.
National Oceanic and Atmospheric Administra- tion. 1979. Climate Atlas of the United States. Asheville, North Carolina: Environmental Data Services.
Olson, J. S., and Watts, J. A. 1982. Major World Eco- system Complex Map. Oak Ridge, Tennessee: Oak Ridge National Laboratory.
Omernik, J. M. 1987. Ecoregions of the Contermi- nous United States. Annals of the Association of American Geographers 77:118-125.
Omernik, J. M., and Gallant, A. L. 1990. Defining Regions for Evaluating Environmental Resources. In Proceedings of the lnternational Conference on Global Natural Resource Monitoring and Assessments: Preparing for the 21st Century, Vol. 2, pp. 936-947. Bethesda, Maryland: Ameri- can Society for Photogrammetry and Remote Sensing.
Palko, S. 1990. NOAA Satellite Imagery and the Na- tional Atlas CIS. Proceedings, Second National GIS Conference, pp. 79-83. Ottawa: Canadian Institute of Surveying and Mapping.
Parton, W. J., Schimel, D. S., Cole, C. V., and Ojima, D. S. 1987. Analysis of Factors Controlling Soil Organic Levels in Great Plains Grasslands. Soil Science Society of America 51 :I1 73-11 79.
Peer, R. L. 1990. A n Overview of Climate lnforma- tion Needs for Ecological Effects Models. Re- search Triangle Park, North Carolina: U.S. Envi- ronmental Protection Agency.
Peplies, R. W., and Honea, R. 6. 1992. Some Classic Regional Models in Relation to Global Change Studies. Paper presented at the 88th Annual Meeting, Association of American Geographers.
Reed, 6. C., Brown, J. F., VanderZee, D., Loveland, T. R., Merchant, J. W., and Ohlen, D. 0. 1994a. Measuring Phenological Variability from Satellite Imagery. Journal of Vegetation Science 5:703- 71 4.
Reed, 6. C., Loveland, T. R., Steyaert, L. T., Brown, J. F., Merchant, J. W., and Ohlen, D. 0. 199413. Designing Global Land Cover Databases to Maxi- mize Utility: The US. Prototype. In Environ- mental lnformation Management and Analysis: Ecosystem to Global Scales, ed. W. K. Michener, J. W. Brunt and S. G. Stafford, pp. 299-314. Lon- don: Taylor and Francis.
Running, S. W. 1990. Estimating Terrestrial Primary Productivity by Combining Remote Sensing and Ecosystem Simulation. In Remote Sensing of Bio- sphere Functioning, ed. R. J. Hobbs and H. A. Mooney, pp. 65-86. New York: Springer-Verlag.
Sellers, P. I., Mintz, Y., Sud, Y. C., and Dalcher, A. 1986. A Simple Biosphere Model (SiB) for Use within General Circulation Models. Journal of Atmospheric Science 43:505-531.
Sklar, F. H., and Costanza, R. 1990. The Develop- ment of Dynamic Spatial Models for Landscape
Downloaded By: [Us Geological Survey] At: 18:25 20 July 2009
354 Loveland et al.
Ecology: A Review and Prognosis. In Quantitative Methods in Landscape Ecology, ed. M. G. Turner and R. H. Gardner, pp. 239-288. New York: Springer-Verlag.
Spanner, M. A., Pierce, L. L., Running, S. W., and Pe- terson, D. L. 1990. The Seasonality of AVHRR Data of Temperate Coniferous Forests: Relation- ship with Leaf Area Index. Remote Sensing o f Environment 33:97-112.
Spence, N. A., and Taylor, P. J. 1970. Quantitative Methods in Regional Taxonomy. Progress in Ge- ography 2:l-64.
Steyaert, L., Loveland, T. R., Brown, J. F., and Reed, B. C. 1994. Integration of Environmental Simu- lation Models with Satellite Remote Sensing and Geographic Information Systems Technologies: Case Studies. In Proceedings o f the Pecora 12 Symposium, pp. 407-417. Bethesda, Maryland: American Society for Photogrammetry and Re- mote Sensing.
Stone, T. A, Schlesinger, P., Houghton, R. A., and Woodwell, G. M. 1994. A Map of Vegetation of South America Based on Satellite Imagery. Pho- togrammetric Engineering and Remote Sensing 60:541-552.
Tobler, W. R. 1973. Choropleth Maps without Class Intervals? Geographical Analysis 5:262-265.
Townshend, J. R. G., ed. 1992. Improved Global Data for Land Applications. IGBP Report No. 20. Stockholm, Sweden: The International Geosphere-Biosphere Programme.
Townshend, J. R. G., Justice, C. O., and Kalb, V. 1987. Characterization and Classification of South American Land Cover Types. International Journal of Remote Sensing 8:1189-I 207.
Townshend, J. R. G., Justice, C. O., Li, W., Gurney, C., and McManus, J. 1991. Global Land Cover Classification by Remote Sensing: Present Capa- bilities and Future Possibilities. Remote Sensing o f Environment 8:243-256.
Tucker, C. I., Gatlin, J. A,, and Schneider, S. R. 1984. Monitoring Vegetation in the Nile Delta with NOAA-6 and NOAA-7 AVHRR Imagery. Photo- grammetric Engineering and Remote Sensing
Tucker, C. I., Townshend, J. R. G., and Goff, T. E. 1985. African Land-Cover Classification us- ing Satellite Data. Science 227:369-375.
50:53-61.
Tucker, C. J., Vanpraet, C., Boerwinkel, E., and Gas- ton, A. 1983. Satellite Remote Sensing of Total Dry Matter Production in the Senegalese Sahel. Remote Sensing o f Environment 13:461-474.
Turner, B. L., Moss, R. H., and Skole, D. L., eds. 1993. Relating Land Use and Global Land-Cover Change: A Proposal for an IGBP-HDP Core Proj- ect. IGBP Report No. 24. Stockholm, Sweden: The International Geosphere-Biosphere Pro- gramme.
Turner, D. P., Koerper, G., Gucinski, H., Peterson, C., and Dixon, R. K. 1993. Monitoring Global Change: Comparison of Forest Cover Estimates using Remote Sensing and Inventory Ap- proaches. Environmental Monitoring and As- sessment 26:295-305.
UNESCO. 1973. lnternational Classification and Mapping of Vegetation. Paris, France: UNESCO.
US. Department of Agriculture. Soil Conservation Service. 1981. Land Resource Regions and Ma- jor Land Resource Regions of the United States. Agricultural Handbook 296. Washington, D.C.: US. Government Printing Office.
US. Geological Survey. 1970. Major Land Uses (map). In The National Atlas o f the United States o f America. Reston, Virginia: US. Geological Sur- vey.
-. 1986. Land Use and Land Cover Data from 1:250,000- and 1:100,000-Scale Maps. US. Geo- logical Survey Data Users Guide Number 4. Res- ton, Virginia: US. Geological Survey.
Woodwell, G. M., Hobbie, J. E., Houghton, R. A., Melillo, J. M., Moore, B., Park, A. B., Peterson, B. I., and Shaver, G. R. 1984. Measurement of Changes in the Vegetation of the Earth by Satel- lite Imagery. In The Role o f Terrestrial Vegetation in the Global Carbon Cycle: Measurement by Remote Sensing, ed. G. M. Woodwell, pp. 221 - 240. New York: John Wiley.
Xue, Y., Sellers, P. I., Kinter, J. L., and Shukla, J. 1991. A Simplified Biosphere Model for Global Climate Studies. journaf o f Climate 4:345-364.
Zhu, Z., and Evans, D. L. 1994. US. Forest Types and Predicted Forest Cover from AVHRR Data. Photogrammetric Engineering and Remote Sens- ing 60:525-532.
Submitted 12/93, Revised 7/94, Accepted 10/94.
Loveland, Thomas R., Merchant, James W., Brown, Jesslyn F., Ohlen, Donald O., Reed, Bradley C., Olson, Paul, and Hutchinson, John. 1995. Seasonal Land-Cover Regions of the United States. Annals o f the Association o f American Geographers 85(2):339-355. Abstract.
Global-change investigations have been hindered by deficiencies in the availability and quality ot land-cover data. The U.S. Geological Survey and the Urlivelsity of Nebraska-Lincoln have collaborated on the development of a new approach to land-cover characterization that attempts
Downloaded By: [Us Geological Survey] At: 18:25 20 July 2009

Seasonal Land-Cover Regions 355
to address requirements of the global-change research community and others interested in regional patterns of land cover. An experimental 1 -kilometer-resolution database of land-cover characteristics for the coterminous U.S. has been prepared to test and evaluate the approach. Using multidate Advanced Very High Resolution Radiometer (AVHRR) satellite data comple- mented by elevation, climate, ecoregions, and other digital spatial datasets, the authors define 152, seasonal land-cover regions. The regionalization is based on a taxonomy of areas with respect to data on land cover, seasonality or phenology, and relative levels of primary production. The resulting database consists of descriptions of the vegetation, land cover, and seasonal, spectral, and site characteristics for each region. These data are used in the construction of an illustrative 1 :7,500,000-scaIe map of the seasonal land-cover regions as well as of smaller-scale maps portraying general land cover and seasonality. The seasonal land-cover characteristics database can also be tailored to provide a broad range of other landscape parameters useful in national and global-scale environmental modeling and assessment. Key Words: global change, land cover, phenology, remote sensing.
Correspondence: U.S. Geological Survey, EROS Data Center, Sioux Falls, South Dakota, 571 98 (Loveland); Center for Advanced Land Management Information Technologies, Conservation and Survey Division, Institute of Agriculture and Natural Resources, University of Nebraska, Lincoln, Nebraska, 68588 (Merchant); Hughes STX Corporation, EROS Data Center, Sioux Falls, South Dakota, 57198 (Brown, Ohlen, Reed, Olson, and Hutchinson).
Downloaded By: [Us Geological Survey] At: 18:25 20 July 2009
Related Documents