Atmos. Chem. Phys., 15, 223–240, 2015 www.atmos-chem-phys.net/15/223/2015/ doi:10.5194/acp-15-223-2015 © Author(s) 2015. CC Attribution 3.0 License. Seasonal in situ observations of glyoxal and methylglyoxal over the temperate oceans of the Southern Hemisphere S. J. Lawson 1 , P. W. Selleck 1 , I. E. Galbally 1 , M. D. Keywood 1 , M. J. Harvey 2 , C. Lerot 3 , D. Helmig 4 , and Z. Ristovski 5 1 Commonwealth Scientific and Industrial Research Organisation, Oceans and Atmosphere Flagship, Aspendale, Australia 2 National Institute of Water and Atmospheric Research, Wellington, New Zealand 3 Belgian Institute for Space Aeronomy, Brussels, Belgium 4 Institute of Arctic and Alpine Research, University of Colorado, Boulder, USA 5 International Laboratory for Air Quality & Health, Queensland University of Technology, Brisbane, Australia Correspondence to: S. J. Lawson ([email protected]) Received: 8 August 2014 – Published in Atmos. Chem. Phys. Discuss.: 25 August 2014 Revised: 16 November 2014 – Accepted: 25 November 2014 – Published: 12 January 2015 Abstract. The dicarbonyls glyoxal and methylglyoxal have been measured with 2,4-dinitrophenylhydrazine (2,4-DNPH) cartridges and high-performance liquid chromatography (HPLC), optimised for dicarbonyl detection, in clean marine air over the temperate Southern Hemisphere (SH) oceans. Measurements of a range of dicarbonyl precursors (volatile organic compounds, VOCs) were made in parallel. These are the first in situ measurements of glyoxal and methylglyoxal over the remote temperate oceans. Six 24 h samples were col- lected in summer (February–March) over the Chatham Rise in the south-west Pacific Ocean during the Surface Ocean Aerosol Production (SOAP) voyage in 2012, while 34 24 h samples were collected at Cape Grim Baseline Air Pollution Station in the late winter (August–September) of 2011. Av- erage glyoxal mixing ratios in clean marine air were 7 ppt at Cape Grim and 23ppt over Chatham Rise. Average methyl- glyoxal mixing ratios in clean marine air were 28 ppt at Cape Grim and 10 ppt over Chatham Rise. The mixing ratios of glyoxal at Cape Grim are the lowest observed over the remote oceans, while mixing ratios over Chatham Rise are in good agreement with other temperate and tropical observations, in- cluding concurrent Multi-Axis Differential Optical Absorp- tion Spectroscopy (MAX-DOAS) observations. Methylgly- oxal mixing ratios at both sites are comparable to the only other marine methylglyoxal observations available over the tropical Northern Hemisphere (NH) ocean. Ratios of gly- oxal : methylglyoxal > 1 over Chatham Rise but < 1 at Cape Grim suggest that a different formation and/or loss processes or rates dominate at each site. Dicarbonyl precursor VOCs, including isoprene and monoterpenes, are used to calculate an upper-estimate yield of glyoxal and methylglyoxal in the remote marine boundary layer and explain at most 1–3 ppt of dicarbonyls observed, corresponding to 10 % and 17 % of the observed glyoxal and 29 and 10 % of the methylgly- oxal at Chatham Rise and Cape Grim, respectively, high- lighting a significant but as yet unknown production mech- anism. Surface-level glyoxal observations from both sites were converted to vertical columns and compared to aver- age vertical column densities (VCDs) from GOME-2 satel- lite retrievals. Both satellite columns and in situ observations are higher in summer than winter; however, satellite vertical column densities exceeded the surface observations by more than 1.5 × 10 14 molecules cm -2 at both sites. This discrep- ancy may be due to the incorrect assumption that all glyoxal observed by satellite is within the boundary layer, or it may be due to challenges retrieving low VCDs of glyoxal over the oceans due to interferences by liquid water absorption or the use of an inappropriate normalisation reference value in the retrieval algorithm. This study provides much-needed data to verify the presence of these short-lived gases over the remote ocean and provide further evidence of an as yet unidentified source of both glyoxal and also methylglyoxal over the re- mote oceans. Published by Copernicus Publications on behalf of the European Geosciences Union.

Welcome message from author
This document is posted to help you gain knowledge. Please leave a comment to let me know what you think about it! Share it to your friends and learn new things together.
Transcript
Atmos. Chem. Phys., 15, 223–240, 2015
www.atmos-chem-phys.net/15/223/2015/
doi:10.5194/acp-15-223-2015
© Author(s) 2015. CC Attribution 3.0 License.
Seasonal in situ observations of glyoxal and methylglyoxal over the
temperate oceans of the Southern Hemisphere
S. J. Lawson1, P. W. Selleck1, I. E. Galbally1, M. D. Keywood1, M. J. Harvey2, C. Lerot3, D. Helmig4, and Z. Ristovski5
1Commonwealth Scientific and Industrial Research Organisation, Oceans and Atmosphere Flagship,
Aspendale, Australia2National Institute of Water and Atmospheric Research, Wellington, New Zealand3Belgian Institute for Space Aeronomy, Brussels, Belgium4Institute of Arctic and Alpine Research, University of Colorado, Boulder, USA5International Laboratory for Air Quality & Health, Queensland University of Technology,
Brisbane, Australia
Correspondence to: S. J. Lawson ([email protected])
Received: 8 August 2014 – Published in Atmos. Chem. Phys. Discuss.: 25 August 2014
Revised: 16 November 2014 – Accepted: 25 November 2014 – Published: 12 January 2015
Abstract. The dicarbonyls glyoxal and methylglyoxal have
been measured with 2,4-dinitrophenylhydrazine (2,4-DNPH)
cartridges and high-performance liquid chromatography
(HPLC), optimised for dicarbonyl detection, in clean marine
air over the temperate Southern Hemisphere (SH) oceans.
Measurements of a range of dicarbonyl precursors (volatile
organic compounds, VOCs) were made in parallel. These are
the first in situ measurements of glyoxal and methylglyoxal
over the remote temperate oceans. Six 24 h samples were col-
lected in summer (February–March) over the Chatham Rise
in the south-west Pacific Ocean during the Surface Ocean
Aerosol Production (SOAP) voyage in 2012, while 34 24 h
samples were collected at Cape Grim Baseline Air Pollution
Station in the late winter (August–September) of 2011. Av-
erage glyoxal mixing ratios in clean marine air were 7 ppt at
Cape Grim and 23 ppt over Chatham Rise. Average methyl-
glyoxal mixing ratios in clean marine air were 28 ppt at Cape
Grim and 10 ppt over Chatham Rise. The mixing ratios of
glyoxal at Cape Grim are the lowest observed over the remote
oceans, while mixing ratios over Chatham Rise are in good
agreement with other temperate and tropical observations, in-
cluding concurrent Multi-Axis Differential Optical Absorp-
tion Spectroscopy (MAX-DOAS) observations. Methylgly-
oxal mixing ratios at both sites are comparable to the only
other marine methylglyoxal observations available over the
tropical Northern Hemisphere (NH) ocean. Ratios of gly-
oxal : methylglyoxal > 1 over Chatham Rise but < 1 at Cape
Grim suggest that a different formation and/or loss processes
or rates dominate at each site. Dicarbonyl precursor VOCs,
including isoprene and monoterpenes, are used to calculate
an upper-estimate yield of glyoxal and methylglyoxal in the
remote marine boundary layer and explain at most 1–3 ppt
of dicarbonyls observed, corresponding to 10 % and 17 %
of the observed glyoxal and 29 and 10 % of the methylgly-
oxal at Chatham Rise and Cape Grim, respectively, high-
lighting a significant but as yet unknown production mech-
anism. Surface-level glyoxal observations from both sites
were converted to vertical columns and compared to aver-
age vertical column densities (VCDs) from GOME-2 satel-
lite retrievals. Both satellite columns and in situ observations
are higher in summer than winter; however, satellite vertical
column densities exceeded the surface observations by more
than 1.5× 10¹⁴ molecules cm−2 at both sites. This discrep-
ancy may be due to the incorrect assumption that all glyoxal
observed by satellite is within the boundary layer, or it may
be due to challenges retrieving low VCDs of glyoxal over the
oceans due to interferences by liquid water absorption or the
use of an inappropriate normalisation reference value in the
retrieval algorithm. This study provides much-needed data to
verify the presence of these short-lived gases over the remote
ocean and provide further evidence of an as yet unidentified
source of both glyoxal and also methylglyoxal over the re-
mote oceans.
Published by Copernicus Publications on behalf of the European Geosciences Union.

224 S. J. Lawson et al.: Seasonal in situ observations of glyoxal and methylglyoxal
1 Introduction
Natural aerosols, including sea spray and secondary aerosols
originating from marine dimethyl sulfide (DMS), have been
shown to strongly affect the uncertainty of cloud radia-
tive forcing in global climate models, highlighting a need
to understand the composition and microphysical proper-
ties of marine aerosol in very pristine marine environments
(Carslaw et al., 2013). While primary emissions, including
wind-blown sea salt, make a large contribution to aerosol
mass in the remote marine boundary layer (MBL), organic
carbon can make a significant contribution to the mass
of submicron marine aerosol in the more biologically ac-
tive summer months (O’Dowd et al., 2004; Facchini et al.,
2008a; Sciare et al., 2009; Ovadnevaite et al., 2011b). This
organic carbon may be primary organic matter, including
polymer microgels, viruses, bacteria, colloids and organic
detritus, directly transferred from bulk water and the sea
surface microlayer (SML) of the ocean to the atmosphere
during bubble burst (Orellana et al., 2011; Facchini et al.,
2008b). The organic carbon may also comprise secondary
aerosol, formed from the oxidation of gas phase ocean-
derived volatile organic compounds (VOCs) such as DMS,
isoprene and monoterpenes (Shaw et al., 2010).
The organic component of marine aerosol is chemically
complex and requires multiple state-of-the-art techniques to
elucidate (Fu et al., 2011, 2013; Decesari et al., 2011; Ri-
naldi et al., 2010; Claeys et al., 2010). A further challenge is
the more recent blurring of distinction between primary and
secondary organics, in which oxidative ageing and evapora-
tion of semivolatile primary organic aerosol (POA) leads to
the production of gas phase, volatile, low molecular-weight
products, which may then go to form secondary organic
aerosol (SOA) (Donahue et al., 2014). The resulting photo-
chemically processed POA may have similar chemical prop-
erties to, and is sometimes loosely classified as, SOA. (Ri-
naldi et al., 2010; Decesari et al., 2011; Ovadnevaite et al.,
2011b). This interrelatedness of primary and secondary or-
ganics adds considerable complexity to understanding the
formation and chemical processing of organic aerosols in the
MBL.
The influence of organics on cloud condensation nu-
clei (CCN) activity of marine aerosol in general appears
to be highly variable, and investigations have mostly fo-
cused on primary organic aerosol (Ovadnevaite et al., 2011a;
Meskhidze et al., 2011; Orellana et al., 2011; Westervelt et
al., 2012; Topping et al., 2013). The contribution of DMS
oxidation products to the CCN population over the remote
Southern Ocean has been well established (Korhonen et al.,
2008; Ayers and Gras, 1991); however, an understanding of
the contribution of other secondary aerosol species, such as
isoprene and monoterpene-derived SOA, to the CCN activity
of marine aerosol is still emerging. Meskhidze and Nenes et
al. (2006) suggested a link between isoprene-derived SOA
over a phytoplankton bloom site and cloud microphysical
and radiative properties in the Southern Ocean, while Lana et
al. (2012) found a correlation between modelled secondary
sulfur and organic aerosols and the variability of cloud mi-
crophysics derived from satellite observations over the re-
mote mid- and high-latitude ocean.
The α-dicarbonyl glyoxal (CHOCHO) is an important
SOA aerosol precursor, which in recent years has been found
to be widespread in the marine boundary layer (MBL), both
via column measurements (Lerot et al., 2010; Vrekoussis
et al., 2009; Mahajan et al., 2014; Wittrock et al., 2006)
and in situ measurements (Coburn et al., 2014). The domi-
nant source of glyoxal is the oxidation of parent VOCs, with
isoprene globally the most important precursor (explaining
47 % of glyoxal formation) (Fu et al., 2008). Glyoxal has a
global average lifetime of about 3 h (Fu et al., 2008; Myrioke-
falitakis et al., 2008; Stavrakou et al., 2009) and is highly
water soluble and so can diffuse into aerosol or cloud wa-
ter, where it is converted to SOA through the formation of
low-volatility products such as organic acids and oligomers
(Ervens et al., 2011; Kampf et al., 2013; Sedehi et al., 2013;
Lee et al., 2011; Lim et al., 2013). α-dicarbonyl methylgly-
oxal (CHOCCH3O), a close relative of glyoxal, also forms
low-volatility products in the aqueous phase (Tan et al., 2012;
Sedehi et al., 2013; Lim et al., 2013), has a short global life-
time of 1.6 h and is produced by oxidation of gas phase parent
compounds, predominantly isoprene (Fu et al., 2008). The
destruction of both dicarbonyls is mainly via photolysis, fol-
lowed by reaction with OH (Myriokefalitakis et al., 2008; Fu
et al., 2008). The global sources of glyoxal and methylgly-
oxal are significant (45 Tg C a−1 and 140 Tg a−1 globally),
and their SOA yield, which occurs mainly in clouds, is com-
parable in magnitude to SOA formation from other oxidation
products of biogenic VOCs and aromatics (Fu et al., 2008).
Major oxidation products of glyoxal and methylglyoxal at
in-cloud relevant concentrations are oxalic and pyruvic acids
(Lim et al., 2013).
There is considerable evidence that the dicarbonyls, and
particularly glyoxal, make an important contribution to the
organic component of marine aerosol over the remote oceans.
Both dicarbonyls have been found in marine aerosols over
the Atlantic Ocean (van Pinxteren and Herrmann, 2013) and
Pacific Ocean (Bikkina et al., 2014), with dicarbonyl mass
positively correlated to organic acids (including oxalic acid)
and ocean biological activity. Oxalic acid has been consis-
tently found in pristine marine aerosol from remote sites, in-
cluding Amsterdam Island (Claeys et al., 2010), Mace Head
(Rinaldi et al., 2010), Cape Verde (Muller et al., 2010) and
Cape Grim (unpublished data), with highest concentrations
during the biologically active summer months, coinciding
with maximum concentrations of the DMS oxidation prod-
ucts methanesulfonic acid (MSA) and non-sea-salt sulfate.
Rinaldi et al. (2011) reported that oxalic acid in submi-
cron marine aerosol from Mace Head and Amsterdam Island
showed a similar seasonal cycle to SCIAMACHY glyoxal
Atmos. Chem. Phys., 15, 223–240, 2015 www.atmos-chem-phys.net/15/223/2015/
S. J. Lawson et al.: Seasonal in situ observations of glyoxal and methylglyoxal 225
columns, and a chemical box model was able to explain the
observed oxalate using the glyoxal columns.
However, significant unknowns remain. There are cur-
rently insufficient methylglyoxal observations to confirm its
presence and importance to SOA formation over the remote
oceans, and understanding the source of the observed gly-
oxal in the MBL has proven challenging. If the production
of glyoxal is indeed due only to the oxidation of precur-
sor VOCs, calculating the expected yield of glyoxal should
be straightforward in this relatively simple and well-mixed
chemical matrix over the remote ocean. However, there has
been the consistent suggestion that glyoxal concentrations in
the MBL are in excess of the yields expected from its pre-
cursors. Wittrock et al. (2006) reported enhanced concentra-
tions of formaldehyde and glyoxal from SCIAMACHY satel-
lite retrievals over tropical oceans but were unable to repro-
duce observations using a global model. More detailed global
modelling studies by Fu et al. (2008) and Myriokefalitakis et
al. (2008) were also unable to reproduce SCIAMACHY gly-
oxal column retrievals over the tropical oceans, highlighting
the possibility of unknown biogenic marine sources. Later
satellite retrievals of glyoxal from SCIAMACHY (Vrekous-
sis et al., 2009), GOME-2 (Lerot et al., 2010) and recently
from Ozone Monitoring Instrument (OMI) (Miller et al.,
2014) have provided further evidence of the widespread pres-
ence and seasonal modulation of glyoxal over biologically
active oceans, although in some regions, such as the temper-
ate SH oceans, the columns are close to satellite detection
limits.
Glyoxal and methylglyoxal were first observed in the at-
mosphere and seawater in the Caribbean and Sargasso seas
as early as 1989 (Zhou and Mopper, 1990), where concentra-
tions of glyoxal and methylglyoxal in seawater were 4 and
2 orders of magnitude too low to explain the atmospheric
concentrations. MAX-DOAS retrievals observed hundreds of
parts per trillion (ppt) glyoxal in the Gulf of Maine (Sinre-
ich et al., 2007) and an average of 63 ppt glyoxal over the
remote tropical Pacific (Sinreich et al., 2010). The Sinreich
et al. (2010) measurements were sufficiently far from land
that the glyoxal observed was either from unrealistically high
mixing ratios of long-lived terrestrial precursors or, more
likely, a substantial unknown source, possibly of marine ori-
gin, in support of earlier modelling and satellite studies. The
widespread presence of glyoxal over the remote oceans was
recently confirmed by Mahajan et al. (2014), who reported
MAX-DOAS and long-path DOAS differential slant column
densities from 10 field campaigns in both hemispheres in
tropical and temperate regions. A global average value of
about 25 ppt was reported, with an upper limit of 40 ppt;
however, over the Southern Hemisphere oceans, particularly
in subtropical and temperate regions, glyoxal mixing ratios
were mostly below instrument detection limits.
In 2014 an additional source of glyoxal in the MBL was
identified in laboratory studies (Zhou et al., 2014), when
oxidation of the sea surface microlayer (SML) led to the
emission of low molecular-weight oxygenated compounds,
including glyoxal. However, the atmospheric yields of gly-
oxal were low, attributed to the fast irreversible hydrolysis
of glyoxal, which prevents the transfer of glyoxal to the at-
mosphere. Van Pinxteren and Herrmann (2013) observed a
glyoxal enrichment factor of 4 in SML compared to the bulk
ocean, but the concentration observed was several orders of
magnitude too low to explain the mixing ratios of 10 s of ppt
typically seen in the MBL (Sinreich et al., 2010). The first
eddy-covariance flux measurements of glyoxal were recently
made over the oceans, using an in situ Fast Light Emit-
ting Diode Cavity Enhanced Differential Optical Absorption
Spectroscopy (LED-CE-DOAS instrument) (Coburn et al.,
2014). Negative flux (glyoxal transfer into the ocean) was
observed in both hemispheres during the day and a positive
flux from the ocean in the SH at night. However, despite this
first evidence of a direct oceanic source of glyoxal to the at-
mosphere, the positive flux at night could explain only 4 ppt
of the glyoxal observed in the overlying atmosphere (some
30 % of the overnight increase), implying the contribution of
another night-time production mechanism.
Despite these recent advances in our understanding of gly-
oxal production processes, our current inability to reconcile
the presence of these short-lived gases over the remote ocean
suggests we have not identified a significant source of gly-
oxal. It is likely that this unidentified source also contributes
to the glyoxal production in polluted terrestrial environments
but is masked by a large contribution from anthropogenic
precursors such as acetylene. The production of glyoxal from
the photochemical processing of organic aerosol is a possible
contributor (Vrekoussis et al., 2009; Stavrakou et al., 2009;
Bates et al., 2012) though this remains unconfirmed. An ad-
ditional source may be the entrainment of glyoxal and its pre-
cursors from the free troposphere into the MBL, particularly
in light of recent observations of non-negligible mixing ratios
of glyoxal in the free troposphere (Volkamer, 2014).
A more in-depth understanding is currently hindered by
a lack of dicarbonyl observations in the MBL. While recent
studies have contributed substantial additional observations
of glyoxal over the remote oceans (Coburn et al., 2014; Ma-
hajan et al., 2014), there have been no studies which have
made parallel measurements of gas phase precursors, and so
expected yields of glyoxal are only estimates. No in situ ob-
servations of glyoxal have been reported over the temperate
oceans of either hemisphere, and there is only one previous
study reporting methylglyoxal observations over the world’s
oceans (in the tropical Northern Hemisphere, NH) (Zhou and
Mopper, 1990). With the exception of the Caribbean and
Sargasso Sea measurements (Zhou and Mopper, 1990), all
column and in situ observations of glyoxal over the remote
oceans have used optical measurement techniques (Mahajan
et al., 2014; Sinreich et al., 2007, 2010; Coburn et al., 2014).
Finally, given the challenges in retrieving low VCDs (vertical
column densities) of glyoxal over the ocean from satellite ob-
www.atmos-chem-phys.net/15/223/2015/ Atmos. Chem. Phys., 15, 223–240, 2015
226 S. J. Lawson et al.: Seasonal in situ observations of glyoxal and methylglyoxal
10°10°
20°20°
30°30°
40°
40°
110° 120° 130° 140° 150° 160° 170° 180° 190°
120° 130° 140° 150° 160° 170°
Cape Grim
Chatham Rise
Figure 1. Cape Grim and Chatham Rise sampling locations.
servations (Lerot et al., 2010; Vrekoussis et al., 2009; Miller
et al., 2014), more ground-based measurements are required.
We provide much-needed in situ glyoxal and methylgly-
oxal data from the very sparsely measured temperate oceans
of the Southern Hemisphere. Observations have been made
using the derivatisation of dicarbonyls on 2,4-DNPH car-
tridges and analysis with HPLC, which is an alternative mea-
surement technique to the optical techniques used widely
for oceanic glyoxal observations to date. Measurements have
been made in two seasons – summer and winter – and aux-
iliary measurements, including carbon dioxide, radon and
particles, have been used to conclusively remove the possi-
bility of any terrestrial influence on the dicarbonyl observa-
tions. This is the first study to concurrently measure a range
of dicarbonyl precursors (VOCs) so that the yield of dicar-
bonyls from its gas phase precursors can be conclusively de-
termined. Finally, we provide the first methylglyoxal obser-
vations over the temperate remote ocean.
2 Methods
2.1 Sampling locations
Dicarbonyl in situ observations were made at the Cape Grim
Baseline Air Pollution Station (CGBAPS) and during a voy-
age over the Chatham Rise in the south-west Pacific Ocean
during the Surface Ocean Aerosol Production (SOAP) study
(see Fig. 1).
2.1.1 Cape Grim Baseline Air Pollution Station
The CGBAPS is located on the north-west tip of the is-
land state of Tasmania, Australia (40.683◦ S 144.689◦ E).
CGBAPS is a World Meteorological Organisation (WMO)
Global Atmosphere Watch (GAW) Global Station and hosts
a wide variety of long-term measurements including green-
house gases, ozone-depleting substances, aerosols, radon and
reactive gases. The station is situated on a cliff 94 m above
sea level, and when the wind blows from the south-westerly
“baseline” sector the air that arrives at the station has trav-
elled over the Southern Ocean several days previously, with
no terrestrial influence (see Sect. 2.2.2.)
A total of 33 samples were collected from the 26 August
to 29 September in 2011 (late winter–early spring). Each
24 h sample consisted of approximately 2000 L of air drawn
through a 2,4-DNPH S10 Cartridge (Supelco) at a flow rate
of 1.8 L min−1.
Ambient air was sampled down a 150 mm diameter stain-
less steel inlet stack which extends 10 m above the roof
deck and is 104 m a.s.l. The flow rate of the intake was
235 L min−1 to ensure laminar flow was maintained. The
DNPH cartridges were loaded in a custom-designed “se-
quencer” which allows up to 16 cartridges to be automati-
cally sampled for a predefined time and sequence. The se-
quencer drew air via a 3 m length of 1/4 inch PFA tubing,
which was extended into the centre of the stainless steel in-
take stack. Samples were collected in all wind directions and
an ozone scrubber (KI-impregnated filter) was placed in front
of the cartridges. Chlorophyll a, a measure of ocean biolog-
ical activity, is low in the Southern Ocean in winter, with
typical values of 0.1–0.2 mgm−3 (Bowie et al., 2011). Air
temperatures throughout the sampling period ranged from 7
to 13 ◦C, with an average of 10 ◦C, and total rainfall during
the sample period at the station was 90 mm. The average rel-
ative humidity was 78 %.
Data collected from concurrent and continuous carbon
dioxide, particle count and radon measurements at Cape
Grim have been included in this work as indicators of clean
marine air (see Sect. 2.2.2). VOC data from canister samples
collected at Cape Grim for the NOAA Halocarbon and other
Atmospheric Trace Species (HATS) group and the Carbon
Cycle Network have been used to calculate dicarbonyl yields
(see Sect. 2.2.3)
2.1.2 Surface Ocean Aerosol Production (SOAP)
voyage
The Surface Ocean-Lower Atmosphere Study (SOLAS)-
endorsed Surface Ocean Aerosol Production study in 2012
investigated links between ocean biogeochemistry, air–sea
exchange of trace gases and particles, and the composi-
tion of the overlying atmosphere (Landwehr et al., 2014).
Measurements were made on board the RV Tangaroa over
Chatham Rise, located over the biologically productive sub-
tropical oceanic front. Six dicarbonyl samples were collected
from the 29 February to 6 March 2012 (late summer). Each
24 h sample consisted of approximately 1400 L of air drawn
through a 2,4-DNPH S10 Cartridge (Supelco) at a flow rate
of 1.3 L min−1. Cartridges were loaded in the sequencer
which drew air off a 25m 3/8 inch PFA inlet line with a flow
rate of 10 L min−1. Inlet losses were determined to be < 2 %
for isoprene, monoterpenes, methanol and dimethyl sulfide;
however, losses were not specifically tested for dicarbonyls
Atmos. Chem. Phys., 15, 223–240, 2015 www.atmos-chem-phys.net/15/223/2015/
S. J. Lawson et al.: Seasonal in situ observations of glyoxal and methylglyoxal 227
due to the absence of a gaseous calibration standard. The
sample inlet line pulled air from the crow’s nest of the ves-
sel above the bridge, some 28 m a.s.l. To avoid ship exhaust
from aft of the inlet being drawn into the PFA inlet line and
sampled on to the cartridges, a baseline switch was devel-
oped and deployed using a CR3000 micrologger control sys-
tem (Campbell Scientific, Logan UH). The switch used 1 Hz
wind data from the vessel’s port/starboard pair of WindOb-
server anemometers (Gill Instruments, Lymington, UK) and
was configured to switch pumps off within 1 s of detecting
non-baseline conditions. The baseline was defined as a 5-
second running average relative wind speed > 3 m s−1 and
a 5 s vector-averaged relative wind direction outside the aft
(135◦ to 225◦ relative degrees) wind direction, with a mete-
orological convention of 0◦ at the bow. A 5-minute duration
under accepted wind speed and direction was required be-
fore turning on the instrument. During experimentation and
for much of the “steaming” transit legs, the vessel was ori-
ented into the wind for as much of the time as possible in
addition to dedicated periods of steaming into the wind. This
resulted in a high frequency (∼ 75 %) of baseline conditions
throughout the voyage.
During the voyage, three distinct phytoplankton blooms
were sampled, and dicarbonyl samples reported in this work
were taken over the third bloom during the last 6 days of the
voyage. Underway chlorophyll a during this period ranged
between 0.3 and 0.9 mgm−3 (10–90th percentile) with a me-
dian of 0.5 mg m−3 (calibrated against discrete data with
data corresponding to sky irradiance > 50 Wm2 removed, i.e.
to exclude daytime data affected by photoquenching). The
bloom consisted of a mixed phytoplankton population of coc-
colithophores, small flagellates and dinoflagellates and had a
deep cold mixed layer characteristic of subantarctic waters.
During the 6 days of sampling, the vessel moved between
44.928◦ S and 41.261◦ S and 172.768◦ E and 175.168◦ E, in-
cluding transiting to Lyttelton Port on the east coast of the
South Island of New Zealand for several hours on the 1st
March to exchange staff. However, due to south-westerly
winds during this period and high wind speeds (average of
13 m s−1 and max of 29 m s−1), air was predominantly of
marine origin. Air temperatures during the sampling period
ranged from 10–18 ◦C with an average of 13 ◦C, and total
rainfall during the 6-day sample period was 3.0 mm. The av-
erage relative humidity was 80 % during the voyage.
Parallel measurements also made during the SOAP voy-
age, which have been utilised in this work, include online
VOCs via proton transfer reaction mass spectrometry (PTR-
MS) (see Sect. 2.2.3) and carbon dioxide and particle con-
centrations (Sect. 2.2.2).
2.2 In situ measurements
2.2.1 DNPH cartridges and HPLC analysis
During sampling, carbonyls and dicarbonyls were trapped on
S10 Supelco cartridges, containing high-purity silica adsor-
bent coated with 2,4-dinitrophenylhydrazine (2,4-DNPH),
where they were converted to the hydrazone derivatives.
Samples were refrigerated immediately after sampling un-
til analysis. The derivatives were extracted from the car-
tridge in 2.5 mL of acetonitrile and analysed by a high-
performance liquid chromatography (HPLC) system con-
sisting of a Dionex GP40 gradient pump, a Waters 717
autosampler, a Shimadzu System controller SCL-10A VP,
a Shimadzu diode array detector (DAD) SPD-M10A VP,
a Shimadzu Column Oven CTO-10AS VP and Shimadzu
CLASS-VP chromatography software. The compound sep-
aration was performed with two Supelco Supelcosil LC-18
columns in series (5 µm, 4.6 mm ID× 250 mm in length, Part
No 58298). The chromatographic conditions include a flow
rate of 1.6 mL min−1 and an injection volume of 25 µL, and
the DAD was operated in the 220 nm to 520 nm wavelength
range. The peaks were separated by gradient elution with an
initial mobile phase of 64 % acetonitrile and 36 % deionised
water for 10 min, followed by a linear gradient to 100 % ace-
tonitrile for 20 min and with a column temperature of 30 ◦C.
The deionised water used for analysis was 18.2 M�cm grade
produced from a Millipore Milli-Q Advantage 10 system and
HPLC-grade acetonitrile was purchased from Merck.
Standards for glyoxal and methylglyoxal were prepared
by making hydrazone crystals from glyoxal (40 % wt in
H2O), methylglyoxal (40 % wt in H2O) and derivatisation
reagent 2,4-DNPH (all from Sigma-Aldrich). The crystals
were weighed and dissolved in acetonitrile to produce a stock
standard for the glyoxal and methyglyoxal derivatives, which
was used to make up a range of standards from 0.125 to
1.000 µg mL−1 which gave a linear response with a corre-
lation coefficient of 0.999 for both derivatives.
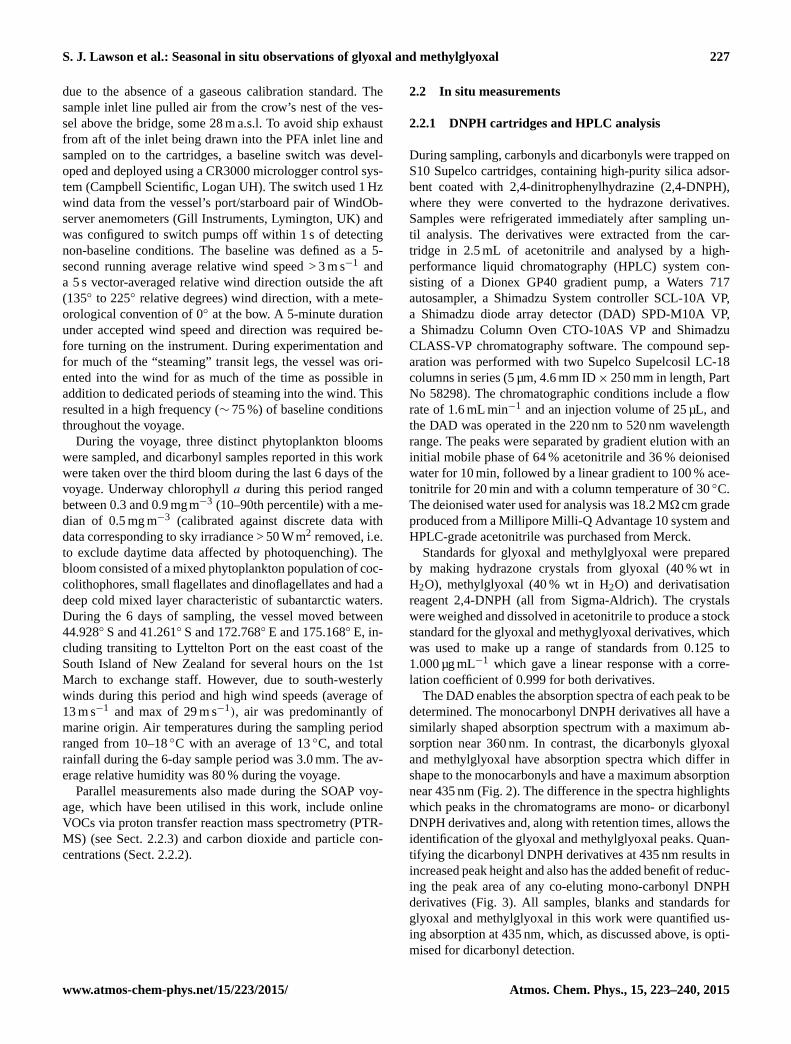
The DAD enables the absorption spectra of each peak to be
determined. The monocarbonyl DNPH derivatives all have a
similarly shaped absorption spectrum with a maximum ab-
sorption near 360 nm. In contrast, the dicarbonyls glyoxal
and methylglyoxal have absorption spectra which differ in
shape to the monocarbonyls and have a maximum absorption
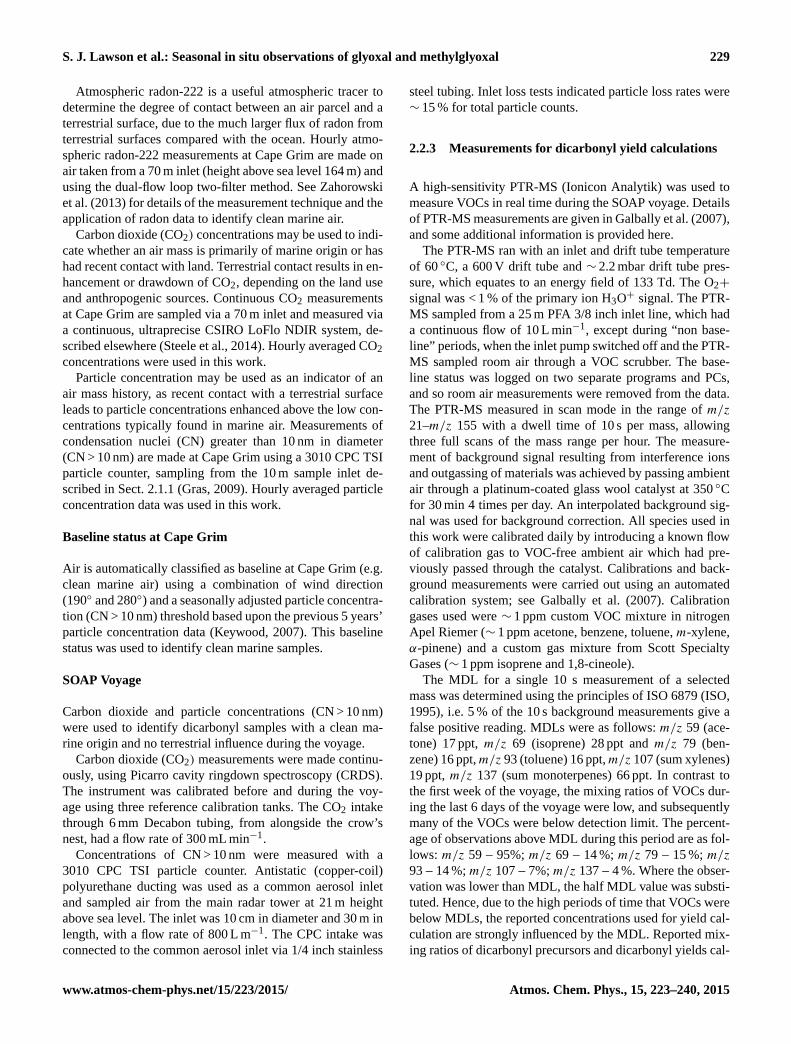
near 435 nm (Fig. 2). The difference in the spectra highlights
which peaks in the chromatograms are mono- or dicarbonyl
DNPH derivatives and, along with retention times, allows the
identification of the glyoxal and methylglyoxal peaks. Quan-
tifying the dicarbonyl DNPH derivatives at 435 nm results in
increased peak height and also has the added benefit of reduc-
ing the peak area of any co-eluting mono-carbonyl DNPH
derivatives (Fig. 3). All samples, blanks and standards for
glyoxal and methylglyoxal in this work were quantified us-
ing absorption at 435 nm, which, as discussed above, is opti-
mised for dicarbonyl detection.
www.atmos-chem-phys.net/15/223/2015/ Atmos. Chem. Phys., 15, 223–240, 2015
228 S. J. Lawson et al.: Seasonal in situ observations of glyoxal and methylglyoxal
Overlaid Spectra
nm 260 340 420 500
DNPH Formaldehyde
bis DNPH Glyoxal
bis DNPH methyl Glyoxal
Figure 2. Absorption spectra for monocarbonyl formaldehyde
(green), dicarbonyls glyoxal (blue line) and methylglyoxal (red
line).
Minutes 15.0 16.0 17.0 18.0
0.0
0.2
0.4
0.6
0.8
1.0
1.2
1.4
1.6
1.8
2.0
2.2
2.4
2.6
Glyoxal
Methyl Glyoxal
435 nm
360 nm
Figure 3. Example of sample chromatogram from Chatham Rise,
using absorption at 360 nm (pink line) and 435 nm (black line).
Sample recovery was determined by spiking 1 µg of gly-
oxal and methylglyoxal onto DNPH cartridges – recover-
ies were 96± 0.3 % for glyoxal and 111± 8 % for methyl-
glyoxal. The degree of derivatisation was examined in these
spiked cartridges to ensure both carbonyl groups in the gly-
oxal and methylglyoxal molecules had reacted with the 2,4-
DNPH (Wang et al., 2009; Olsen et al., 2007). Analysis of
samples that had been extracted within the last 24 h showed a
second smaller peak, indicating that∼ 5 % of the glyoxal had
reacted to form mono-derivatives rather than bis-derivatives
(e.g. only one carbonyl group had reacted). However analysis
of samples that were held for > 24 h after extraction showed
all of the mono-derivative had been converted into the bis-
derivative. As all samples were extracted and then held for
at least 24 h before analysis; complete derivatisation to the
bis-derivative is expected. For methylglyoxal there was no
evidence of any mono-derivatives. The total mass of car-
bonyls and dicarbonyls sampled on the DNPH cartridges was
at most 7 % of the cartridge capacity, and collection efficien-
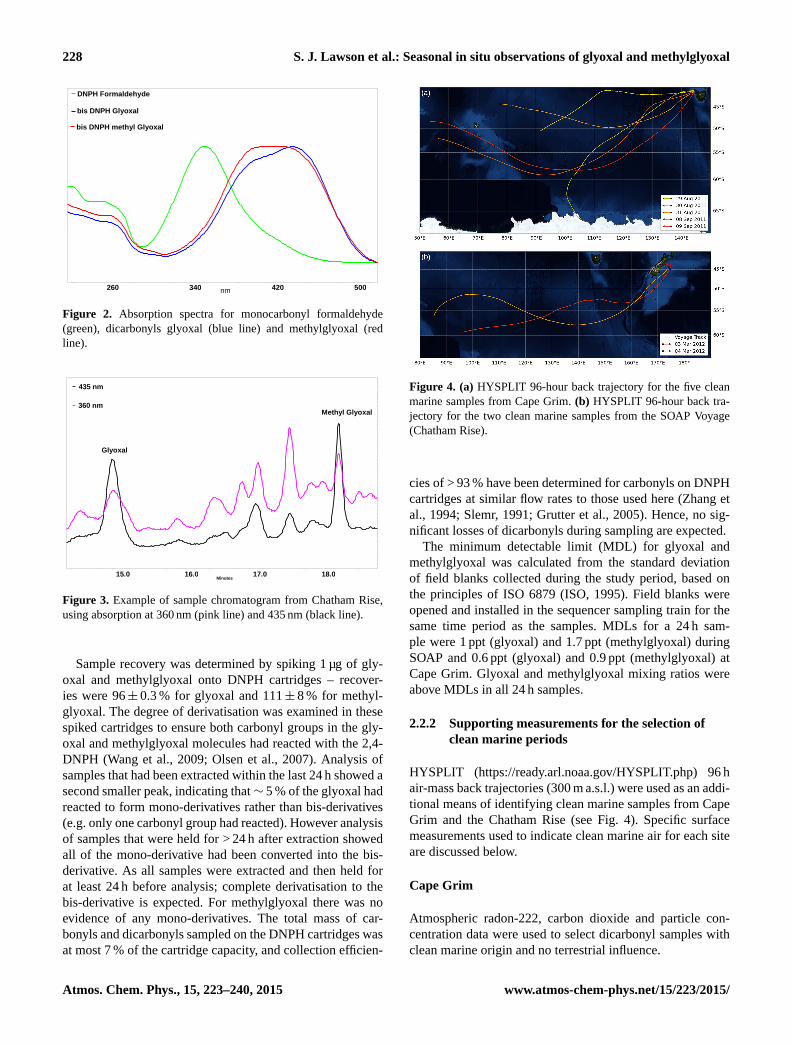
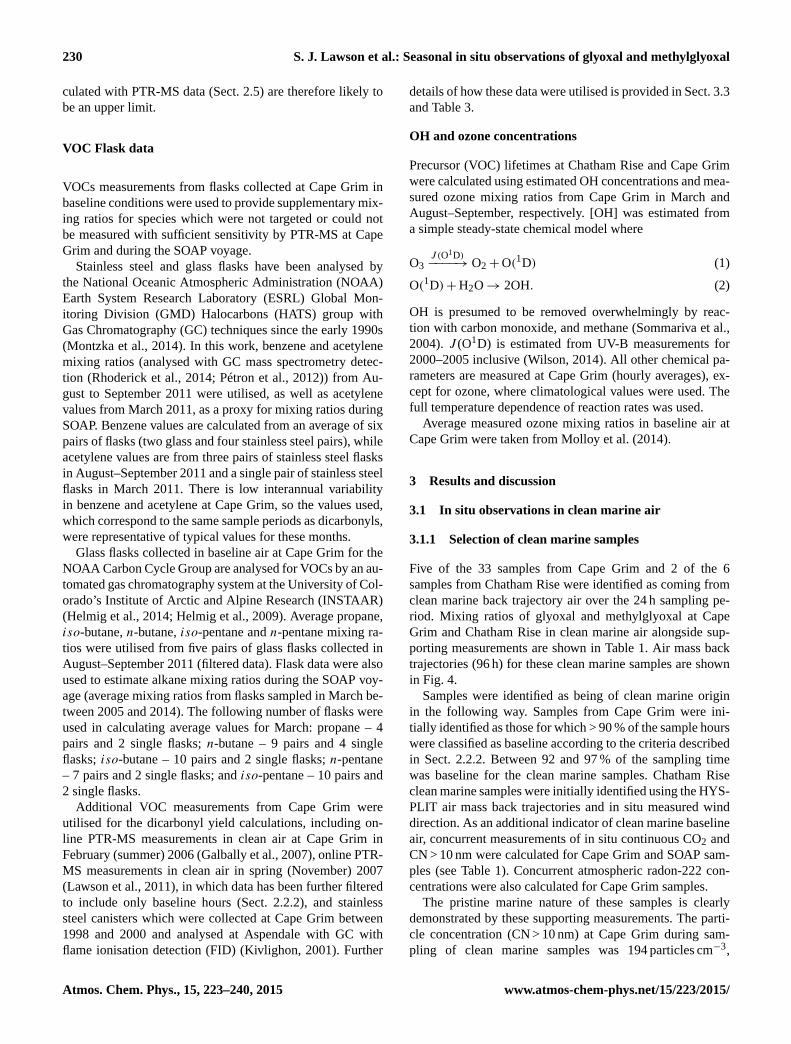
Figure 4. (a) HYSPLIT 96-hour back trajectory for the five clean
marine samples from Cape Grim. (b) HYSPLIT 96-hour back tra-
jectory for the two clean marine samples from the SOAP Voyage
(Chatham Rise).
cies of > 93 % have been determined for carbonyls on DNPH
cartridges at similar flow rates to those used here (Zhang et
al., 1994; Slemr, 1991; Grutter et al., 2005). Hence, no sig-
nificant losses of dicarbonyls during sampling are expected.
The minimum detectable limit (MDL) for glyoxal and
methylglyoxal was calculated from the standard deviation
of field blanks collected during the study period, based on
the principles of ISO 6879 (ISO, 1995). Field blanks were
opened and installed in the sequencer sampling train for the
same time period as the samples. MDLs for a 24 h sam-
ple were 1 ppt (glyoxal) and 1.7 ppt (methylglyoxal) during
SOAP and 0.6 ppt (glyoxal) and 0.9 ppt (methylglyoxal) at
Cape Grim. Glyoxal and methylglyoxal mixing ratios were
above MDLs in all 24 h samples.
2.2.2 Supporting measurements for the selection of
clean marine periods
HYSPLIT (https://ready.arl.noaa.gov/HYSPLIT.php) 96 h
air-mass back trajectories (300 m a.s.l.) were used as an addi-
tional means of identifying clean marine samples from Cape
Grim and the Chatham Rise (see Fig. 4). Specific surface
measurements used to indicate clean marine air for each site
are discussed below.
Cape Grim
Atmospheric radon-222, carbon dioxide and particle con-
centration data were used to select dicarbonyl samples with
clean marine origin and no terrestrial influence.
Atmos. Chem. Phys., 15, 223–240, 2015 www.atmos-chem-phys.net/15/223/2015/
S. J. Lawson et al.: Seasonal in situ observations of glyoxal and methylglyoxal 229
Atmospheric radon-222 is a useful atmospheric tracer to
determine the degree of contact between an air parcel and a
terrestrial surface, due to the much larger flux of radon from
terrestrial surfaces compared with the ocean. Hourly atmo-
spheric radon-222 measurements at Cape Grim are made on
air taken from a 70 m inlet (height above sea level 164 m) and
using the dual-flow loop two-filter method. See Zahorowski
et al. (2013) for details of the measurement technique and the
application of radon data to identify clean marine air.
Carbon dioxide (CO2) concentrations may be used to indi-
cate whether an air mass is primarily of marine origin or has
had recent contact with land. Terrestrial contact results in en-
hancement or drawdown of CO2, depending on the land use
and anthropogenic sources. Continuous CO2 measurements
at Cape Grim are sampled via a 70 m inlet and measured via
a continuous, ultraprecise CSIRO LoFlo NDIR system, de-
scribed elsewhere (Steele et al., 2014). Hourly averaged CO2
concentrations were used in this work.
Particle concentration may be used as an indicator of an
air mass history, as recent contact with a terrestrial surface
leads to particle concentrations enhanced above the low con-
centrations typically found in marine air. Measurements of
condensation nuclei (CN) greater than 10 nm in diameter
(CN > 10 nm) are made at Cape Grim using a 3010 CPC TSI
particle counter, sampling from the 10 m sample inlet de-
scribed in Sect. 2.1.1 (Gras, 2009). Hourly averaged particle
concentration data was used in this work.
Baseline status at Cape Grim
Air is automatically classified as baseline at Cape Grim (e.g.
clean marine air) using a combination of wind direction
(190◦ and 280◦) and a seasonally adjusted particle concentra-
tion (CN > 10 nm) threshold based upon the previous 5 years’
particle concentration data (Keywood, 2007). This baseline
status was used to identify clean marine samples.
SOAP Voyage
Carbon dioxide and particle concentrations (CN > 10 nm)
were used to identify dicarbonyl samples with a clean ma-
rine origin and no terrestrial influence during the voyage.
Carbon dioxide (CO2) measurements were made continu-
ously, using Picarro cavity ringdown spectroscopy (CRDS).
The instrument was calibrated before and during the voy-
age using three reference calibration tanks. The CO2 intake
through 6 mm Decabon tubing, from alongside the crow’s
nest, had a flow rate of 300 mL min−1.
Concentrations of CN > 10 nm were measured with a
3010 CPC TSI particle counter. Antistatic (copper-coil)
polyurethane ducting was used as a common aerosol inlet
and sampled air from the main radar tower at 21 m height
above sea level. The inlet was 10 cm in diameter and 30 m in
length, with a flow rate of 800 L m−1. The CPC intake was
connected to the common aerosol inlet via 1/4 inch stainless
steel tubing. Inlet loss tests indicated particle loss rates were
∼ 15 % for total particle counts.
2.2.3 Measurements for dicarbonyl yield calculations
A high-sensitivity PTR-MS (Ionicon Analytik) was used to
measure VOCs in real time during the SOAP voyage. Details
of PTR-MS measurements are given in Galbally et al. (2007),
and some additional information is provided here.
The PTR-MS ran with an inlet and drift tube temperature
of 60 ◦C, a 600 V drift tube and ∼ 2.2 mbar drift tube pres-
sure, which equates to an energy field of 133 Td. The O2+
signal was < 1 % of the primary ion H3O+ signal. The PTR-
MS sampled from a 25 m PFA 3/8 inch inlet line, which had
a continuous flow of 10 L min−1, except during “non base-
line” periods, when the inlet pump switched off and the PTR-
MS sampled room air through a VOC scrubber. The base-
line status was logged on two separate programs and PCs,
and so room air measurements were removed from the data.
The PTR-MS measured in scan mode in the range of m/z
21–m/z 155 with a dwell time of 10 s per mass, allowing
three full scans of the mass range per hour. The measure-
ment of background signal resulting from interference ions
and outgassing of materials was achieved by passing ambient
air through a platinum-coated glass wool catalyst at 350 ◦C
for 30 min 4 times per day. An interpolated background sig-
nal was used for background correction. All species used in
this work were calibrated daily by introducing a known flow
of calibration gas to VOC-free ambient air which had pre-
viously passed through the catalyst. Calibrations and back-
ground measurements were carried out using an automated
calibration system; see Galbally et al. (2007). Calibration
gases used were ∼ 1 ppm custom VOC mixture in nitrogen
Apel Riemer (∼ 1 ppm acetone, benzene, toluene, m-xylene,
α-pinene) and a custom gas mixture from Scott Specialty
Gases (∼ 1 ppm isoprene and 1,8-cineole).
The MDL for a single 10 s measurement of a selected
mass was determined using the principles of ISO 6879 (ISO,
1995), i.e. 5 % of the 10 s background measurements give a
false positive reading. MDLs were as follows: m/z 59 (ace-
tone) 17 ppt, m/z 69 (isoprene) 28 ppt and m/z 79 (ben-
zene) 16 ppt,m/z 93 (toluene) 16 ppt,m/z 107 (sum xylenes)
19 ppt, m/z 137 (sum monoterpenes) 66 ppt. In contrast to
the first week of the voyage, the mixing ratios of VOCs dur-
ing the last 6 days of the voyage were low, and subsequently
many of the VOCs were below detection limit. The percent-
age of observations above MDL during this period are as fol-
lows: m/z 59 – 95%; m/z 69 – 14 %; m/z 79 – 15 %; m/z
93 – 14 %; m/z 107 – 7%; m/z 137 – 4 %. Where the obser-
vation was lower than MDL, the half MDL value was substi-
tuted. Hence, due to the high periods of time that VOCs were
below MDLs, the reported concentrations used for yield cal-
culation are strongly influenced by the MDL. Reported mix-
ing ratios of dicarbonyl precursors and dicarbonyl yields cal-
www.atmos-chem-phys.net/15/223/2015/ Atmos. Chem. Phys., 15, 223–240, 2015
230 S. J. Lawson et al.: Seasonal in situ observations of glyoxal and methylglyoxal
culated with PTR-MS data (Sect. 2.5) are therefore likely to
be an upper limit.
VOC Flask data
VOCs measurements from flasks collected at Cape Grim in
baseline conditions were used to provide supplementary mix-
ing ratios for species which were not targeted or could not
be measured with sufficient sensitivity by PTR-MS at Cape
Grim and during the SOAP voyage.
Stainless steel and glass flasks have been analysed by
the National Oceanic Atmospheric Administration (NOAA)
Earth System Research Laboratory (ESRL) Global Mon-
itoring Division (GMD) Halocarbons (HATS) group with
Gas Chromatography (GC) techniques since the early 1990s
(Montzka et al., 2014). In this work, benzene and acetylene
mixing ratios (analysed with GC mass spectrometry detec-
tion (Rhoderick et al., 2014; Pétron et al., 2012)) from Au-
gust to September 2011 were utilised, as well as acetylene
values from March 2011, as a proxy for mixing ratios during
SOAP. Benzene values are calculated from an average of six
pairs of flasks (two glass and four stainless steel pairs), while
acetylene values are from three pairs of stainless steel flasks
in August–September 2011 and a single pair of stainless steel
flasks in March 2011. There is low interannual variability
in benzene and acetylene at Cape Grim, so the values used,
which correspond to the same sample periods as dicarbonyls,
were representative of typical values for these months.
Glass flasks collected in baseline air at Cape Grim for the
NOAA Carbon Cycle Group are analysed for VOCs by an au-
tomated gas chromatography system at the University of Col-
orado’s Institute of Arctic and Alpine Research (INSTAAR)
(Helmig et al., 2014; Helmig et al., 2009). Average propane,
iso-butane, n-butane, iso-pentane and n-pentane mixing ra-
tios were utilised from five pairs of glass flasks collected in
August–September 2011 (filtered data). Flask data were also
used to estimate alkane mixing ratios during the SOAP voy-
age (average mixing ratios from flasks sampled in March be-
tween 2005 and 2014). The following number of flasks were
used in calculating average values for March: propane – 4
pairs and 2 single flasks; n-butane – 9 pairs and 4 single
flasks; iso-butane – 10 pairs and 2 single flasks; n-pentane
– 7 pairs and 2 single flasks; and iso-pentane – 10 pairs and
2 single flasks.
Additional VOC measurements from Cape Grim were
utilised for the dicarbonyl yield calculations, including on-
line PTR-MS measurements in clean air at Cape Grim in
February (summer) 2006 (Galbally et al., 2007), online PTR-
MS measurements in clean air in spring (November) 2007
(Lawson et al., 2011), in which data has been further filtered
to include only baseline hours (Sect. 2.2.2), and stainless
steel canisters which were collected at Cape Grim between
1998 and 2000 and analysed at Aspendale with GC with
flame ionisation detection (FID) (Kivlighon, 2001). Further
details of how these data were utilised is provided in Sect. 3.3
and Table 3.
OH and ozone concentrations
Precursor (VOC) lifetimes at Chatham Rise and Cape Grim
were calculated using estimated OH concentrations and mea-
sured ozone mixing ratios from Cape Grim in March and
August–September, respectively. [OH] was estimated from
a simple steady-state chemical model where
O3J (O1D)−−−−→ O2+O(1D) (1)
O(1D)+H2O→ 2OH. (2)
OH is presumed to be removed overwhelmingly by reac-
tion with carbon monoxide, and methane (Sommariva et al.,
2004). J (O1D) is estimated from UV-B measurements for
2000–2005 inclusive (Wilson, 2014). All other chemical pa-
rameters are measured at Cape Grim (hourly averages), ex-
cept for ozone, where climatological values were used. The
full temperature dependence of reaction rates was used.
Average measured ozone mixing ratios in baseline air at
Cape Grim were taken from Molloy et al. (2014).
3 Results and discussion
3.1 In situ observations in clean marine air
3.1.1 Selection of clean marine samples
Five of the 33 samples from Cape Grim and 2 of the 6
samples from Chatham Rise were identified as coming from
clean marine back trajectory air over the 24 h sampling pe-
riod. Mixing ratios of glyoxal and methylglyoxal at Cape
Grim and Chatham Rise in clean marine air alongside sup-
porting measurements are shown in Table 1. Air mass back
trajectories (96 h) for these clean marine samples are shown
in Fig. 4.
Samples were identified as being of clean marine origin
in the following way. Samples from Cape Grim were ini-
tially identified as those for which > 90 % of the sample hours
were classified as baseline according to the criteria described
in Sect. 2.2.2. Between 92 and 97 % of the sampling time
was baseline for the clean marine samples. Chatham Rise
clean marine samples were initially identified using the HYS-
PLIT air mass back trajectories and in situ measured wind
direction. As an additional indicator of clean marine baseline
air, concurrent measurements of in situ continuous CO2 and
CN > 10 nm were calculated for Cape Grim and SOAP sam-
ples (see Table 1). Concurrent atmospheric radon-222 con-
centrations were also calculated for Cape Grim samples.
The pristine marine nature of these samples is clearly
demonstrated by these supporting measurements. The parti-
cle concentration (CN > 10 nm) at Cape Grim during sam-
pling of clean marine samples was 194 particles cm−3,
Atmos. Chem. Phys., 15, 223–240, 2015 www.atmos-chem-phys.net/15/223/2015/
S. J. Lawson et al.: Seasonal in situ observations of glyoxal and methylglyoxal 231
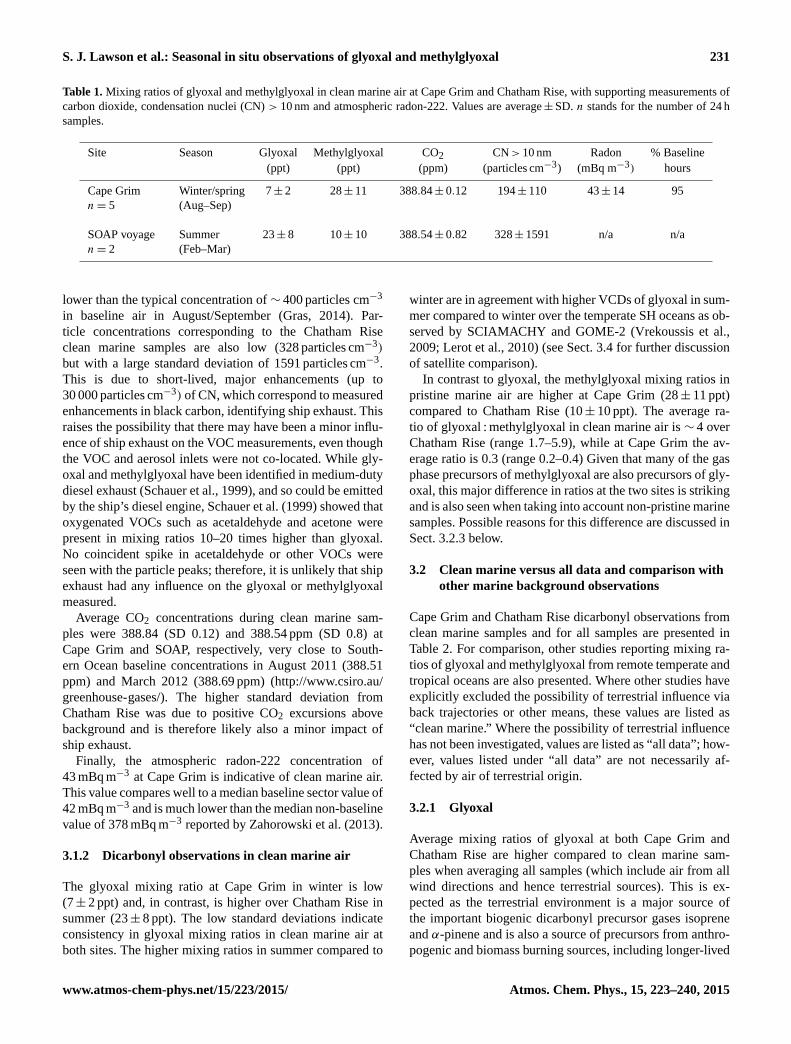
Table 1. Mixing ratios of glyoxal and methylglyoxal in clean marine air at Cape Grim and Chatham Rise, with supporting measurements of
carbon dioxide, condensation nuclei (CN) > 10 nm and atmospheric radon-222. Values are average±SD. n stands for the number of 24 h
samples.
Site Season Glyoxal Methylglyoxal CO2 CN> 10 nm Radon % Baseline
(ppt) (ppt) (ppm) (particles cm−3) (mBq m−3) hours
Cape Grim
n= 5
Winter/spring
(Aug–Sep)
7± 2 28± 11 388.84± 0.12 194± 110 43± 14 95
SOAP voyage
n= 2
Summer
(Feb–Mar)
23± 8 10± 10 388.54± 0.82 328± 1591 n/a n/a
lower than the typical concentration of ∼ 400 particles cm−3
in baseline air in August/September (Gras, 2014). Par-
ticle concentrations corresponding to the Chatham Rise
clean marine samples are also low (328 particles cm−3)
but with a large standard deviation of 1591 particles cm−3.
This is due to short-lived, major enhancements (up to
30 000 particles cm−3) of CN, which correspond to measured
enhancements in black carbon, identifying ship exhaust. This
raises the possibility that there may have been a minor influ-
ence of ship exhaust on the VOC measurements, even though
the VOC and aerosol inlets were not co-located. While gly-
oxal and methylglyoxal have been identified in medium-duty
diesel exhaust (Schauer et al., 1999), and so could be emitted
by the ship’s diesel engine, Schauer et al. (1999) showed that
oxygenated VOCs such as acetaldehyde and acetone were
present in mixing ratios 10–20 times higher than glyoxal.
No coincident spike in acetaldehyde or other VOCs were
seen with the particle peaks; therefore, it is unlikely that ship
exhaust had any influence on the glyoxal or methylglyoxal
measured.
Average CO2 concentrations during clean marine sam-
ples were 388.84 (SD 0.12) and 388.54 ppm (SD 0.8) at
Cape Grim and SOAP, respectively, very close to South-
ern Ocean baseline concentrations in August 2011 (388.51
ppm) and March 2012 (388.69 ppm) (http://www.csiro.au/
greenhouse-gases/). The higher standard deviation from
Chatham Rise was due to positive CO2 excursions above
background and is therefore likely also a minor impact of
ship exhaust.
Finally, the atmospheric radon-222 concentration of
43 mBq m−3 at Cape Grim is indicative of clean marine air.
This value compares well to a median baseline sector value of
42 mBq m−3 and is much lower than the median non-baseline
value of 378 mBq m−3 reported by Zahorowski et al. (2013).
3.1.2 Dicarbonyl observations in clean marine air
The glyoxal mixing ratio at Cape Grim in winter is low
(7± 2 ppt) and, in contrast, is higher over Chatham Rise in
summer (23± 8 ppt). The low standard deviations indicate
consistency in glyoxal mixing ratios in clean marine air at
both sites. The higher mixing ratios in summer compared to
winter are in agreement with higher VCDs of glyoxal in sum-
mer compared to winter over the temperate SH oceans as ob-
served by SCIAMACHY and GOME-2 (Vrekoussis et al.,
2009; Lerot et al., 2010) (see Sect. 3.4 for further discussion
of satellite comparison).
In contrast to glyoxal, the methylglyoxal mixing ratios in
pristine marine air are higher at Cape Grim (28± 11 ppt)
compared to Chatham Rise (10± 10 ppt). The average ra-
tio of glyoxal : methylglyoxal in clean marine air is ∼ 4 over
Chatham Rise (range 1.7–5.9), while at Cape Grim the av-
erage ratio is 0.3 (range 0.2–0.4) Given that many of the gas
phase precursors of methylglyoxal are also precursors of gly-
oxal, this major difference in ratios at the two sites is striking
and is also seen when taking into account non-pristine marine
samples. Possible reasons for this difference are discussed in
Sect. 3.2.3 below.
3.2 Clean marine versus all data and comparison with
other marine background observations
Cape Grim and Chatham Rise dicarbonyl observations from
clean marine samples and for all samples are presented in
Table 2. For comparison, other studies reporting mixing ra-
tios of glyoxal and methylglyoxal from remote temperate and
tropical oceans are also presented. Where other studies have
explicitly excluded the possibility of terrestrial influence via
back trajectories or other means, these values are listed as
“clean marine.” Where the possibility of terrestrial influence
has not been investigated, values are listed as “all data”; how-
ever, values listed under “all data” are not necessarily af-
fected by air of terrestrial origin.
3.2.1 Glyoxal
Average mixing ratios of glyoxal at both Cape Grim and
Chatham Rise are higher compared to clean marine sam-
ples when averaging all samples (which include air from all
wind directions and hence terrestrial sources). This is ex-
pected as the terrestrial environment is a major source of
the important biogenic dicarbonyl precursor gases isoprene
and α-pinene and is also a source of precursors from anthro-
pogenic and biomass burning sources, including longer-lived
www.atmos-chem-phys.net/15/223/2015/ Atmos. Chem. Phys., 15, 223–240, 2015

232 S. J. Lawson et al.: Seasonal in situ observations of glyoxal and methylglyoxal
Table 2. Glyoxal and methylglyoxal compared to dicarbonyl measurements from other remote oceanic sites. Data is listed as being of clean
marine origin where the study explicitly excludes terrestrial influence. All concentrations are in ppt. Values are mean±SD; SH stands for
Southern Hemisphere; NH stands for Northern Hemisphere.
Temperate ocean Tropical ocean
Southern
Ocean
(Cape
Grim)
This work
South-west
Pacific
(Chatham
Rise)
This work
South-west
Pacific
(Chatham
Rise)a
North
Pacific and
Atlantica
Tropical
Pacific
and Atlantica
Eastern
Tropical
Pacificb
Tropical
PacificcCaribbean
and
Sargasso
Sead
Glyoxal clean marine
origin
7± 2 23± 8 – – – 43± 9 (SH)
32± 6 (NH)
63± 21 –
all data 10± 6 30± 12 23± 10 25± 13 24± 12 (SH)
26± 15 (NH)
– – 80
Methyl-
glyoxal
clean marine
origin
28± 11 10± 10 – – – – – –
all data 57± 32 19± 14 – – – – – ∼ 10
a Majahan et al. (2014) (only data above MDL has been included in average).b Coburn et al. (2014).c Sinreich et al. (2010).d Zhou and Mopper (1990).
gases such as acetylene, benzene, acetone, alkanes and > C2
alkenes, which can travel long distances before being oxi-
dised. Higher standard deviations in all samples compared to
clean marine samples likely reflect a greater variation in con-
centrations of precursor gases resulting from differing wind
directions. Interestingly, at Cape Grim, the average enhance-
ment in glyoxal when including data from all wind direction
is only 3 ppt, even though a further 28 samples have been in-
cluded. This suggests terrestrial sources have a minimal con-
tribution to glyoxal mixing ratios at Cape Grim in winter.
The glyoxal mixing ratio from Cape Grim of 7 ppt in clean
marine conditions and 10 ppt in all conditions is the lowest
mixing ratio that has been reported over the world’s oceans
to date. This low mixing ratio is supported in part by the
study by Mahajan et al. (2014), in which many of the ob-
servations over the temperate SH oceans were below de-
tection limits. The glyoxal mixing ratio from all Chatham
Rise data (30± 12 ppt) compares well to the mixing ratio de-
rived from MAX-DOAS measurements during the same voy-
age (23± 10 ppt) (Mahajan et al., 2014). Despite the tech-
niques employing different approaches (in situ derivatised
samples versus column measurement), this suggests good
agreement between these techniques at these low mixing
ratios. Recent intercomparisons of dicarbonyl measurement
techniques have examined the relationship between optical
and derivatisation techniques, but with a focus on a wider
range of mixing ratios than observed over the remote ocean
(Thalman et al., 2014; Pang et al., 2014).
The glyoxal mixing ratios from Chatham Rise also com-
pare well to those observed by Mahajan et al. (2014) over the
North Pacific and Atlantic (25± 13 ppt) and tropical Pacific
and Atlantic (24± 12 ppt SH, 26± 15 ppt NH). It should be
noted that the Mahajan et al. (2014) values were calculated
only from data above the instrument detection limit and so
contain a positive bias and are upper estimates. Chatham Rise
mixing ratios are also similar to the eastern tropical Pacific
NH average (32± 6 ppt) (Coburn et al., 2014) but somewhat
lower than those observed in the SH eastern tropical Pacific
(43± 9 ppt) (Coburn et al., 2014) and over the tropical Pa-
cific (63± 21 ppt) (Sinreich et al., 2010). The Caribbean Sea
value of 80 ppt is the highest average mixing ratio reported
over the oceans and substantially higher than mixing ratios
observed in this study, although the variation of this value is
not given (Zhou and Mopper, 1990). Overall, the synthesis
of glyoxal observations from this and other studies provides
compelling evidence for the widespread presence of glyoxal,
in non-negligible mixing ratios, in the atmosphere over the
remote oceans.
3.2.2 Methylglyoxal
Mixing ratios of methylglyoxal at Cape Grim and Chatham
Rise are higher when considering all data and have greater
variation, reflecting substantial influence of terrestrial pre-
cursors. In particular, mixing ratios of methylglyoxal at Cape
Grim in all samples are approximately twice the mixing ra-
tios of clean marine samples. This significant enhancement at
Cape Grim in all data is likely due to substantial terrestrial in-
fluence at Cape Grim when considering all wind directions.
The station is bounded by farmland to the east and south-
east, and mainland Australia and the city of Melbourne are
∼ 300 km north across Bass Straight. The greater enhance-
ment of methylglyoxal compared to glyoxal in all data from
Cape Grim may be due to the much higher yield of methyl-
glyoxal from isoprene and monoterpenes compared to gly-
Atmos. Chem. Phys., 15, 223–240, 2015 www.atmos-chem-phys.net/15/223/2015/
S. J. Lawson et al.: Seasonal in situ observations of glyoxal and methylglyoxal 233
oxal and the rich source of methylglyoxal precursors from
urban regions including alkenes and alkanes > C2 (Fu et al.,
2008).
The only other observations of methylglyoxal over the
world’s oceans come from the Caribbean Sea (Zhou and
Mopper, 1990), with an approximate value of ∼ 10 ppt,
which is somewhat lower than that observed at Cape Grim,
but in agreement with Chatham Rise mixing ratios in this
study.
3.2.3 Differences between dicarbonyl ratios at Cape
Grim and Chatham Rise
The average ratio of glyoxal : methylglyoxal is 3.8 over
Chatham Rise (range 1.7–5.9) in clean marine air and 2.3
in all samples (range 1.2–5.9). At Cape Grim the average ra-
tio is 0.3 (range 0.2–0.4) in clean marine air and 0.2 in all
samples (range 0.1–0.4). The dominance of methylglyoxal at
Cape Grim and glyoxal at Chatham Rise points to a major
difference between sites and warrants further investigation.
The back trajectories of air in clean marine samples at both
Cape Grim and Chatham Rise indicate that the air sampled
at both sites originated from the Southern Ocean, from a lati-
tude of 55–65◦ S 96 h previously (Fig. 4). A major difference
between the back trajectories of the two sites is the longitude,
with Cape Grim back trajectories covering 50–140◦ E and
the trajectories from the more easterly located Chatham Rise
covering 90–175◦ E. The 3-D trajectory altitude (not shown)
suggests that air from all clean oceanic samples at both sites
travelled in the lower 750 m of the troposphere for 24 h previ-
ously and had originated at a height of between 500–1500 m
(Chatham Rise) and 300–1200 m (Cape Grim) up to 48 h pre-
viously. No clear differences in vertical back trajectories be-
tween sites or relationship between height and mixing ratios
were evident.
Because glyoxal and methylglyoxal are so short-lived,
their observed mixing ratios are due to an equilibrium be-
tween local production and loss. Therefore, the difference in
ratios between sites indicates a major difference or differ-
ences in production or loss rates.
If differences in ratios are due to differing rates of produc-
tion of dicarbonyls, this could be due to (a) varying concen-
trations of precursor gases, (b) different emission rates of di-
carbonyls from the SML or (c) other unconfirmed production
mechanisms. Methylglyoxal and glyoxal have a number of
overlapping gas phase precursors, and while there are precur-
sors specific to each (e.g. acetylene, acetone and benzene for
glyoxal and higher alkanes and alkenes for methylglyoxal)
(Fu et al., 2008), in clean marine conditions precursor mixing
ratios are unlikely to differ significantly between sites. The
calculated yield of dicarbonyls from parallel or best-estimate
precursor mixing ratios at both sites is low (see Sect. 3.3),
and so other production mechanisms must be dominating at
these sites.
Emission of glyoxal from the SML has only very recently
been reported for the first time (Zhou et al., 2014), and there
is no evidence as yet of direct emission of methylglyoxal
from the oceans. It is likely that methylglyoxal is emitted
from the oceans: it has been measured alongside glyoxal in
the SML in concentrations which are enhanced above the
bulk water, indicating its production in the SML (van Pinx-
teren and Herrmann, 2013; Zhou and Mopper, 1990). How-
ever, the relative abundance of methylglyoxal in the SML
compared to glyoxal is highly uncertain, but the studies that
have investigated this have found higher concentrations of
glyoxal compared to methylglyoxal by a factor of 3 (van
Pinxteren and Herrmann, 2013) and 5 (Zhou and Mopper,
1990). Meanwhile, a laboratory study which detected gly-
oxal from oxidation of the SML did not find evidence for
methylglyoxal production (Zhou et al., 2014). It is therefore
possible that the ratio of glyoxal : methylglyoxal is higher at
Chatham Rise compared to Cape Grim due to enhanced di-
rect emission of glyoxal from biologically productive waters,
which were targeted over Chatham Rise, in contrast to Cape
Grim, which in winter samples air which has passed over wa-
ters of low biological productivity. The likelihood of SML as
a major source of glyoxal is uncertain given the modest at-
mospheric yields of glyoxal in laboratory studies (Zhou et al.,
2014) and modest positive fluxes of glyoxal from the tropical
ocean (Coburn et al., 2014). However, the emission of dicar-
bonyls from the temperate oceans has not been studied, and
so the temperate SML, as a source of dicarbonyls particularly
in biologically active regions such as Chatham Rise, cannot
be discounted.
It is also possible that the difference in dicarbonyl ratios
between the two sites is due in part to differences in loss rates
between glyoxal and methylglyoxal. The major sink for both
dicarbonyls is photolysis, which is unlikely to explain the
difference in observed ratios. Other sinks include oxidation
by OH, irreversible uptake into cloud droplets and particles
followed by conversion to SOA, or wet or dry deposition (Fu
et al., 2008). Satellite imagery shows both sites had partial
cloud cover during the sampling periods; however, a major
difference was the amount of rainfall that occurred at Cape
Grim (90 mm over 33 days) compared to during dicarbonyl
sampling over Chatham Rise (3 mm over 6 days). Specifi-
cally, during sampling of the Cape Grim clean marine sam-
ples, 1–7 mm of rain fell each day (a total of 14.0 mm for five
samples), while during clean marine Chatham Rise samples,
0–0.4 mm fell each day (a total of 0.57 mm for two samples).
It is possible that due to the higher Henry’s law constant of
glyoxal compared to methylglyoxal (Kroll et al., 2005; Zhou
and Mopper, 1990; Betterton and Hoffmann, 1988), glyoxal
was more efficiently removed from the atmosphere via wet
deposition at Cape Grim due to its more rapid uptake into
aqueous particles. While wet deposition is a globally mi-
nor sink, it is likely to be important at night in the absence
of other major sinks (Fu et al., 2008). However, the reason
for this difference cannot be determined conclusively. The
www.atmos-chem-phys.net/15/223/2015/ Atmos. Chem. Phys., 15, 223–240, 2015
234 S. J. Lawson et al.: Seasonal in situ observations of glyoxal and methylglyoxal
only other observations of glyoxal and methyglyoxal over the
open ocean for comparison were made in the tropics (Zhou
and Mopper, 1990) and show an average glyoxal mixing ra-
tio far in excess of the methylglyoxal mixing ratio. This is in
direct contrast to Cape Grim and in partial agreement with
the Chatham Rise results. Production and loss processes at
each site could be explored with chemical modelling.
3.3 Calculation of expected glyoxal and methylglyoxal
yields from measured VOC precursors in clean
marine air
Expected yields of glyoxal and methylglyoxal were calcu-
lated, based, where possible, on parallel precursor VOC mea-
surements over Chatham Rise and Cape Grim (Table 3).
Where a concurrent measurement of a precursor was not
available, an estimate was made. All estimated precursor
mixing ratios are identified, and the source of the estimate
is given in Table 3. Where no observations of the precursor
at the site were available (e.g. toluene and xylene in win-
ter at Cape Grim) but observations of a similar compound
class were available (e.g. benzene), the mixing ratio of ben-
zene was used as a reliable upper estimate for shorter-lived
toluene and xylenes. Where no observations of the precur-
sor were available and no measurements of compounds from
a similar class were available, mixing ratios were based on
the same precursor species at a different site (e.g. summer
Cape Grim acetylene, alkene and alkane observations were
used for Chatham Rise). In other cases, in situ observations
from the site in the same season were used but based on mea-
surements several years earlier (e.g. Cape Grim ethene and
propene). Where observations from the specific season were
not available, e.g. winter isoprene, acetone and monoterpenes
at Cape Grim, a spring or summer value was used, which
for isoprene and monoterpenes is likely to be an upper esti-
mate. Three dicarbonyl precursors – glycoaldehyde, methyl
butenol and hydroxyacetone – were excluded from the calcu-
lation as all are emitted from terrestrial processes (biomass
burning and biogenic emission), and all are short-lived and
so are unlikely to contribute to dicarbonyl production over
the remote ocean.
The expected mixing ratios of dicarbonyls that could be
explained by the oxidation of each precursor were calculated
according to the following equation:
MRdicarbonyl =MRprecursor×Ydicarbonyl
τprecursor
× τdicarbonyl. (3)
Where MRdicarbonyl is the mixing ratio of dicarbonyl,
MRprecursor is the mixing ratio of precursor, Ydicarbonyl is the
yield of dicarbonyl, τprec is the lifetime of precursor and
τdicarbonyl is the lifetime of dicarbonyl.
Global annual mean molar yields of glyoxal and
methylglyoxal from precursor gases were taken from Fu
et al. (2008). Lifetimes of all precursors were calcu-
lated based on average daytime concentrations of [OH]
of 8.7× 10⁵ molecules cm−3 at Chatham Rise in March
and 3.7× 10⁵ molecules cm−3 at Cape Grim in August–
September, except for monoterpenes (proxy for α-pinene),
isoprene and propene lifetimes, which were based on the
[OH] stated above and [ozone] of 4.9× 10¹¹ molecules cm−3
at Chatham Rise and 8.0× 10¹¹ molecules cm−3 at Cape
Grim (see Sect. 2.2.3). Global average lifetimes of glyoxal
(2.9 h) and methylglyoxal (1.6 h) were used (Fu et al., 2008).
Table 3. shows that the small proportion of glyoxal and
methylglyoxal production accounted for is largely driven
by isoprene and monoterpenes. The precursors can explain
at most 1–3 ppt of glyoxal and methylglyoxal at these two
sites, which equates to only 17 % and 10 % of glyoxal
and 10 % and 29 % of methylglyoxal over Cape Grim and
Chatham Rise, respectively. By dividing the difference be-
tween the measured and calculated mixing ratios by the av-
erage global lifetime of glyoxal and methylglyoxal, the pro-
duction rate in the boundary layer required to reconcile the
measured and calculated dicarbonyl mixing ratios can be
determined. For glyoxal, the additional production rate re-
quired is 48 ppt day−1 (97 ppt C day−1) and 172 ppt day−1
(343 ppt day−1), while for methylglyoxal the additional pro-
duction rate required is 378 ppt day−1 (1135 ppt C day−1)
and 106 ppt day−1 (318 ppt C day−1) at Cape Grim and
Chatham Rise.
As mentioned in Sect. 2.2.3, the isoprene and monoterpene
mixing ratios over Chatham Rise were below the instrument
detection much of the time, and substitution of half MDLs
may result in an upper estimate of mixing ratios for these
species. Regardless, this is the first study which has used con-
current measurements of these important precursors to con-
strain the yields of glyoxal and methylglyoxal. As parallel
isoprene and monoterpene mixing ratios were not available
at Cape Grim, the yield calculation used summer and spring
isoprene and monoterpene mixing ratios which are likely to
result in an upper estimate of dicarbonyl mixing ratios result-
ing from precursor oxidation. Conversely, using the global
average lifetimes of glyoxal and methylglyoxal is likely to
lead to an underestimate of the mixing ratio of dicarbonyls at
Cape Grim as actual dicarbonyl lifetimes in winter at Cape
Grim are likely to be longer than the global average. The
calculation also does not take into account diurnal variation
in production and loss rates. However, Coburn et al. (2014)
showed that, while glyoxal over the eastern tropical Pacific
varied by approximately 15 ppt (∼ 30 %) between night and
day, it did not decrease below 30 ppt at night (average of both
hemispheres). The approach used here should therefore give
a good approximation of the 24 h dicarbonyl mixing ratio ex-
pected from the oxidation of precursors. The absence of pho-
tolytic destruction and OH oxidation of dicarbonyls at night
(the dominant known sinks), coupled with an absence of di-
carbonyl production through OH oxidation of precursors at
night (the dominant known source), likely contributes to the
relatively constant mixing ratios between day and night.
Atmos. Chem. Phys., 15, 223–240, 2015 www.atmos-chem-phys.net/15/223/2015/
S. J. Lawson et al.: Seasonal in situ observations of glyoxal and methylglyoxal 235
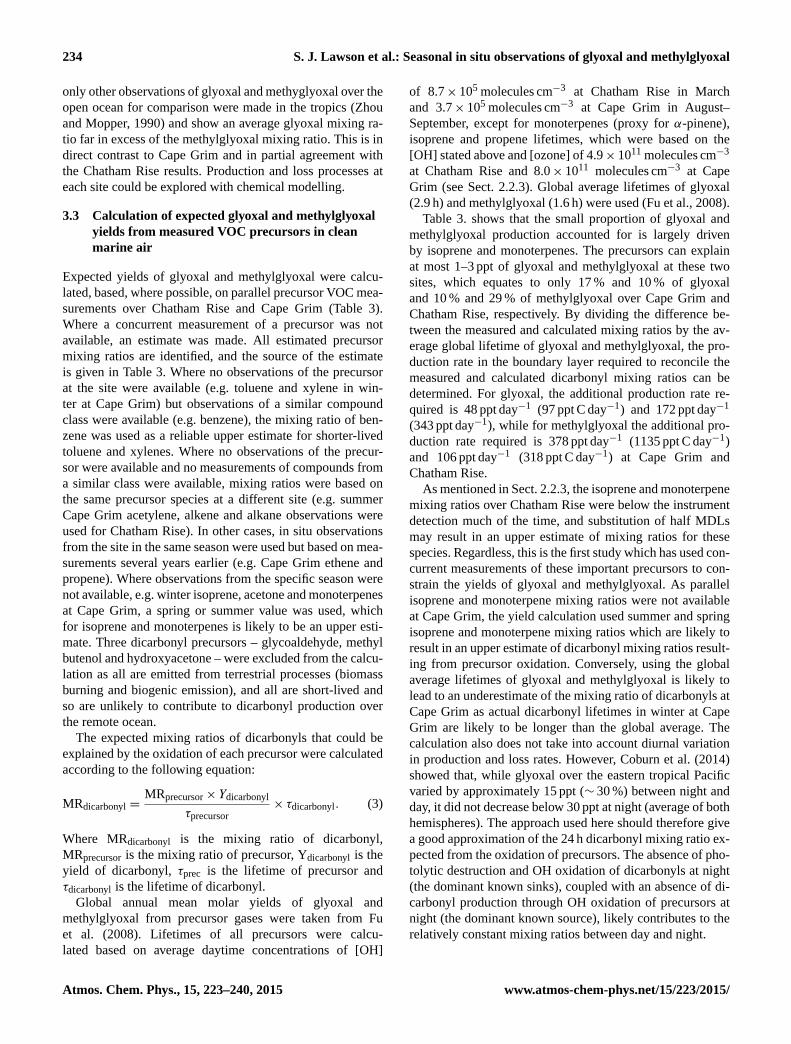
Table 3. Calculated dicarbonyl yields based on precursor data from Cape Grim and Chatham Rise. Yields and dicarbonyl lifetimes based on
Fu et al. (2008).
Precursor Precursor mixing ratios (ppt) Glyoxal yield (ppt) Methylglyoxal yield (ppt)
Chatham Rise Cape Grim Chatham Rise Cape Grim Chatham Rise Cape Grim
Acetylene 3a 39a 0.02 0.08 n/a n/a
Ethene 51b 31b 0.22 0.06 n/a n/a
Propene 17b 8b n/a n/a 0.04 0.03
Propane 33c 35c n/a n/a 0.02 0.02
Alkanes>Cf3
54 52c n/a n/a 0.02 0.02
Isoprene 14 14d 0.85 0.43 1.89 1.97
Benzene 8 9a 0.02 0.01 n/a n/a
Toluene 9 9g 0.08 0.03 0.03 0.03
Xylenes sum 10 9g 0.27 0.10 0.22 0.19
Monoterpenes 32 17e 0.83 0.44 0.69 0.48
Acetone 89 118d n/a n/a 0.01 0.02
Sum yield (ppt) 2.3 1.2 2.9 2.8
% Explained 10 17 29 10
Where supplementary (e.g. non-parallel) measurements were used, these are denoted as follows:a Cape Grim flasks (NOAA HATS analysis).b Kivlighon (2001).c Cape Grim flasks (INSTAAR analysis).d Galbally et al. (2007) (upper estimate Cape Grim summer).e Lawson et al. (2011) (Cape Grim baseline spring data, see text for explanation).f Sum of C4 and C5.g Upper estimate based on benzene.
The low proportion of dicarbonyl mixing ratios that can be
explained by the oxidation of precursors calculated here sup-
ports previous claims that there are unlikely to be sufficient
levels of VOC precursors over the remote oceans to explain
the non-negligible levels of glyoxal observed (Coburn et al.,
2014; Sinreich et al., 2010). For the first time, we show that
the same applies to methylglyoxal over the ocean.
The large proportion of glyoxal and methylglyoxal which
cannot be explained by the precursor mixing ratios confirms
the importance of other production mechanisms. As dis-
cussed previously, it is unclear whether positive SML fluxes
are sufficiently large to explain the unaccounted for portion
of these gases at Cape Grim and Chatham Rise. Kwan et
al. (2006) estimated that OH oxidation of organic aerosol
(OA) may result in a production rate of up to 70 ppt C day−1
of Oxygenated volatile organic compounds (OVOCs) in the
FT and a production rate of up to ∼ 500 ppt C day−1 OVOCs
in the lower continental troposphere in the summertime.
The combined boundary layer production rate of glyoxal
and methylglyoxal at Chatham Rise needed to reconcile the
measured and calculated mixing ratios is 661 ppt C day−1,
in reasonable agreement with the Kwan et al. (2006) esti-
mate, while the Cape Grim glyoxal and methylglyoxal flux
(1232 ppt C day−1) is a factor of 2–3 times higher. Whilst the
Kwan et al. (2006) estimates contained significant uncertain-
ties and used continental measurements, they do suggest that
oxidation of OA may make a non-negligible contribution to
the dicarbonyl mixing ratios.
Another possible production mechanism is the oxidation
of as yet unidentified gas phase precursors.
3.4 Comparison of glyoxal surface observations with
satellite vertical columns
In situ glyoxal mixing ratios from Cape Grim and Chatham
Rise were converted into vertical column densities (VCDs)
and compared with glyoxal VCDs from GOME-2 on
Metop-A.
Mixing ratios were converted to VCDs, assuming that all
glyoxal observed was well mixed within the boundary layer
and assuming standard conditions of temperature (25 ◦C) and
pressure (1 atm) throughout the boundary layer. Boundary
layer heights of 850 m were used for both Chatham Rise (av-
erage of daytime and nocturnal radiosonde flights) and an
average modelled value for Cape Grim in all wind directions
(unpublished data; see Zahorowski et al., 2013 for model
details). Chatham Rise surface observations were compared
to an average GOME-2 column for March 2012 in the re-
gion 40–50◦ S and 170–180◦ E, while Cape Grim surface ob-
servations were compared to GOME-2 columns taken from
August–September 2011 in the region 39–42◦ S and 143–
147◦ E.
In the austral summer, GOME-2 glyoxal columns over the
temperate oceans in the SH are low but somewhat higher
than in other remote regions, while in winter the columns
are among the lowest observed globally (Lerot et al., 2010).
There is low interannual variability in the GOME-2 glyoxal
www.atmos-chem-phys.net/15/223/2015/ Atmos. Chem. Phys., 15, 223–240, 2015

236 S. J. Lawson et al.: Seasonal in situ observations of glyoxal and methylglyoxal
Figure 5. Seasonal glyoxal VCDs retrieved from GOME-2 and cal-
culated from surface-based observations at Cape Grim and Chatham
Rise. GOME-2 values are for all data averaged between 2007 and
2012, for regions encompassing Cape Grim and Chatham Rise. Er-
ror bars for surface-based VCDs are insignificant on this scale and
are not shown (see text for details).
VCDs in both the regions encompassing Cape Grim and
Chatham Rise but a clear seasonal cycle, with a maximum
VCD in the summer months (December–February) and a
minimum in the autumn–winter months (May–August). The
2007–2012 average seasonal variability of GOME-2 glyoxal
VCDs from the sites above is shown in Fig. 5. In June, VCDs
cannot be calculated due to insufficient satellite sensitivity,
resulting from observation geometry (low angle of the sun).
Cape Grim VCDs calculated from in situ observa-
tions are 2.1× 10¹³ molecules cm−2 (standard error of
mean 2.1× 10¹²), while Chatham Rise calculated VCDs
are 6.3× 10¹³ molecules cm−2 (standard error of mean
1.0× 10¹³). In comparison, satellite-retrieved VCDs are
1.8× 10¹⁴ molecules cm−2 for the Cape Grim region and
2.4× 10¹⁴ molecules cm−2 for the Chatham Rise region
(both with an uncertainty of± 1.3× 10¹⁴ molecules cm−2)
(Fig. 5). While both satellite columns and in situ columns ob-
serve higher VCD over Chatham Rise in summer than Cape
Grim in winter, the satellite VCDs exceed in situ VCDs at
both sites by > 1.5× 10¹⁴ molecules cm−2. There are several
possible factors that may be contributing to the higher satel-
lite VCD. The first may be due to the assumption that all
of the glyoxal observed by the satellites is in the boundary
layer. Aircraft measurements made as part of the TORERO
campaign (Tropical Ocean Troposphere Exchange of Reac-
tive Halogens and OVOCs) have confirmed the widespread
presence of glyoxal in the free troposphere (Volkamer, 2014).
If glyoxal is also present in the free troposphere over the tem-
perate SH oceans, the satellite, which is sensitive to the entire
troposphere, would indeed observe glyoxal VCD larger than
VCD calculated from in situ measurements, which represent
only the boundary layer. If glyoxal is widespread in the free
troposphere, this clearly has important implications for the
interpretation of satellite column data. Another reason may
be due to the significant challenges in retrieving low VCDs
of glyoxal over the oceans, due to interferences by liquid wa-
ter absorption, discussed elsewhere (Vrekoussis et al., 2009;
Lerot et al., 2010). Also, the satellite glyoxal retrieval algo-
rithm includes a normalisation procedure comparing actual
retrieved columns to a reference value taken in a reference
sector. As discussed in Miller et al. (2014), this reference
value might be too large. Another possible reason is that the
satellite VCDs are measured only once per day, during the
satellite overpass at 9:45am, whereas the in situ observations
reported here are 24-hour averages. If there is a diurnal varia-
tion in glyoxal mixing ratios at these sites, as was shown over
the tropical Pacific Ocean (Coburn et al., 2014), the satellite
VCD may not be representative of the 24-hour average.
Difficulty reconciling satellite VCDs and in situ observa-
tions over the ocean has recently been noted elsewhere, in-
cluding the tendency of satellite VCDs to exceed in situ mea-
surements, particularly in regions with low VCDs which are
at the limits of satellite sensitivity (Coburn et al., 2014; Ma-
hajan et al., 2014). Further comparisons between in situ and
satellite observations over the oceans are needed, including
characterisation of the vertical distribution of glyoxal.
4 Conclusions
This work confirms the presence of short-lived dicarbonyl
glyoxal over the remote temperate oceans, even in winter in
very pristine air over biologically unproductive waters. We
provide the first observations of methylglyoxal over temper-
ate oceans and confirm its presence alongside glyoxal. These
observations support the likely widespread contribution from
these dicarbonyls to SOA formation over the ocean.
Glyoxal mixing ratios at Cape Grim in winter are the low-
est measured over the ocean, while glyoxal at Chatham Rise
is similar to other temperate mixing ratios and similar to or
at the lower end of tropical observations. Methylglyoxal ob-
servations at Cape Grim and Chatham Rise are comparable
to the only other observations available (tropical Northern
Hemisphere ocean).
Chatham Rise glyoxal observations from this study agree
well with observations made via MAX-DOAS on the same
voyage, suggesting a good agreement between the technique
used in this work (DNPH derivatisation with HPLC analy-
sis optimised for dicarbonyl detection) and the optical tech-
nique.
Different ratios of glyoxal : methylglyoxal were observed
at the two locations, with an average ratio in clean marine air
of ∼ 4 over Chatham Rise (range 1.7–5.9) and 0.3 at Cape
Grim (range 0.2–0.4). The reasons for this are unexplained
but may be due to a larger positive flux of glyoxal from bio-
logically active waters over Chatham Rise and/or to preferen-
Atmos. Chem. Phys., 15, 223–240, 2015 www.atmos-chem-phys.net/15/223/2015/
S. J. Lawson et al.: Seasonal in situ observations of glyoxal and methylglyoxal 237
tial loss of glyoxal over methylglyoxal by wet deposition at
Cape Grim. Chemical modelling is suggested to better con-
strain the production and loss mechanisms.
Expected yields of glyoxal and methylglyoxal were cal-
culated based on parallel measurements of precursor VOCs,
including isoprene and monoterpenes. At most, 1–3 ppt of
the glyoxal and methylglyoxal observed in clean marine air
can be explained from the oxidation of these precursors, con-
firming a significant contribution from another source over
the ocean. While the SML has recently been confirmed as
a direct source of glyoxal both in the field and in labora-
tory studies, it seems unlikely that this positive flux is suf-
ficiently large to explain the atmospheric concentrations ob-
served. Other possible but unconfirmed sources may include
the oxidation of as yet unidentified gas precursors or atmo-
spheric oxidation of organic aerosol.
Glyoxal observations were converted to VCDs and com-
pared with GOME-2 satellite VCDs. While in situ and satel-
lite observations both observe a higher glyoxal VCD in sum-
mer, the satellite VCD exceeds the surface observations by
more than 1.5× 10¹⁴ molecules cm−2. Recent observations
of glyoxal in the free troposphere suggest that this discrep-
ancy is least in part due to the incorrect assumption that all
glyoxal observed over the ocean by satellites is in the MBL.
Other reasons for the discrepancy may be due to challenges
in retrieving low VCDs of glyoxal over the oceans, including
accounting for interference by liquid water absorption and
the selection of an appropriate normalisation reference value
in the retrieval algorithm. Further comparisons are needed,
including the characterisation of the vertical distribution of
glyoxal.
Acknowledgements. We thank Rob Gillett and Min Cheng
(CSIRO), Nigel Somerville, Jeremy Ward and Sam Cleland (Cape
Grim BAPS), and Nick Talbot (NIWA) for assistance with sampling
and analysis and James Harnwell (CSIRO) for the design and con-
struction of the sequencer sampling unit. We thank Cliff Law for
excellent leadership during the SOAP voyage and the officers and
crew of the RV Tangaroa and NIWA Vessels for logistics support.
Radon data and boundary layer heights are courtesy of Alas-
tair Williams, Scott Chambers and Alan Griffiths (ANSTO); carbon
dioxide Cape Grim data are courtesy of Paul Krummel and Paul
Steele, CSIRO and CGBAPS. Benzene and acetylene data from
GCMS analysis of NOAA HATS flasks were collected at Cape Grim
courtesy of Steve Montzka (NOAA). OH concentration data from
Cape Grim were provided by Stephen Wilson (University of Wol-
longong). Chatham Rise carbon dioxide data were provided by John
McGregor (NIWA), and chlorophyll a data were provided by Cliff
Law (NIWA).
Sarah Lawson would like to acknowledge the NIWA Visiting
Scientist Scheme and CSIRO’s Capability Development Fund
for providing financial support for her participation in the SOAP
voyage.
Edited by: P. Quinn
References
Ayers, G. P. and Gras, J. L.: Seasonal relationship between cloud
condensation nuclei and aerosol methanesulfonate in marine air,
Nature, 353, 834–835, 1991.
Bates, T. S., Quinn, P. K., Frossard, A. A., Russell, L. M., Hakala, J.,
Petäjä, T., Kulmala, M., Covert, D. S., Cappa, C. D., Li, S. M.,
Hayden, K. L., Nuaaman, I., McLaren, R., Massoli, P., Cana-
garatna, M. R., Onasch, T. B., Sueper, D., Worsnop, D. R.,
and Keene, W. C.: Measurements of ocean derived aerosol off
the coast of California, J. Geophys. Res.-Atmos., 117, D00V15,
doi:10.1029/2012JD017588, 2012.
Betterton, E. A. and Hoffmann, M. R.: Henry’s law constants of
some environmentally important aldehydes, Environ. Sci. Tech-
nol., 22, 1415–1418, doi:10.1021/es00177a004, 1988.
Bikkina, S., Kawamura, K., Miyazaki, Y., and Fu, P.: High abun-
dances of oxalic, azelaic, and glyoxylic acids and methylglyoxal
in the open ocean with high biological activity: implication for
secondary OA formation from isoprene, Geophys. Res. Lett., 41,
2014GL059913, doi:10.1002/2014GL059913, 2014.
Bowie, A. R., Brian Griffiths, F., Dehairs, F., and Trull, T. W.:
Oceanography of the subantarctic and Polar Frontal
Zones south of Australia during summer: setting for the
SAZ-Sense study, Deep-Sea Res. Pt. II, 58, 2059–2070,
doi:10.1016/j.dsr2.2011.05.033, 2011.
Carslaw, K. S., Lee, L. A., Reddington, C. L., Pringle, K. J., Rap, A.,
Forster, P. M., Mann, G. W., Spracklen, D. V., Woodhouse, M. T.,
Regayre, L. A., and Pierce, J. R.: Large contribution of natural
aerosols to uncertainty in indirect forcing, Nature, 503, 67–71,
doi:10.1038/nature12674, 2013.
Claeys, M., Wang, W., Vermeylen, R., Kourtchev, I., Chi, X. G.,
Farhat, Y., Surratt, J. D., Gomez-Gonzalez, Y., Sciare, J., and
Maenhaut, W.: Chemical characterisation of marine aerosol at
Amsterdam Island during the austral summer of 2006–2007, J.
Aerosol. Sci., 41, 13–22, doi:10.1016/j.jaerosci.2009.08.003,
2010.
Coburn, S., Ortega, I., Thalman, R., Blomquist, B., Fairall, C. W.,
and Volkamer, R.: Measurements of diurnal variations and Eddy
Covariance (EC) fluxes of glyoxal in the tropical marine bound-
ary layer: description of the Fast LED-CE-DOAS instrument, At-
mos. Meas. Tech. Discuss., 7, 6245–6285, doi:10.5194/amtd-7-
6245-2014, 2014.
Decesari, S., Finessi, E., Rinaldi, M., Paglione, M., Fuzzi, S.,
Stephanou, E. G., Tziaras, T., Spyros, A., Ceburnis, D.,
O’Dowd, C., Dall’Osto, M., Harrison, R. M., Allan, J.,
Coe, H., and Facchini, M. C.: Primary and secondary ma-
rine organic aerosols over the North Atlantic Ocean during
the MAP experiment, J. Geophys. Res.-Atmos., 116, D22210,
doi:10.1029/2011jd016204, 2011.
Donahue, N. M., Robinson, A. L., Trump, E. R., Riipinen, I.,
and Kroll, J. H.: Volatility and aging of atmospheric organic
aerosol, in: Atmospheric and Aerosol Chemistry, edited by: Mc-
Neill, V. F. and Ariya, P. A., Topics in Current Chemistry,
Springer-Verlag, Berlin Heidelberg, 97–143, 2014.
Ervens, B., Turpin, B. J., and Weber, R. J.: Secondary or-
ganic aerosol formation in cloud droplets and aqueous parti-
cles (aqSOA): a review of laboratory, field and model stud-
ies, Atmos. Chem. Phys., 11, 11069–11102, doi:10.5194/acp-11-
11069-2011, 2011.
www.atmos-chem-phys.net/15/223/2015/ Atmos. Chem. Phys., 15, 223–240, 2015
238 S. J. Lawson et al.: Seasonal in situ observations of glyoxal and methylglyoxal
Facchini, M. C., Decesari, S., Rinaldi, M., Carbone, C., Finessi, E.,
Mircea, M., Fuzzi, S., Moretti, F., Tagliavini, E., Ceburnis, D.,
and O’Dowd, C. D.: Important source of marine secondary or-
ganic aerosol from biogenic amines, Environ. Sci. Technol., 42,
9116–9121, doi:10.1021/es8018385, 2008a.
Facchini, M. C., Rinaldi, M., Decesari, S., Carbone, C., Finessi, E.,
Mircea, M., Fuzzi, S., Ceburnis, D., Flanagan, R., Nilsson, E. D.,
de Leeuw, G., Martino, M., Woeltjen, J., and O’Dowd, C. D.:
Primary submicron marine aerosol dominated by insoluble or-
ganic colloids and aggregates, Geophys. Res. Lett., 35, L17814,
doi:10.1029/2008GL034210, 2008b.
Fu, P. Q., Kawamura, K., and Miura, K.: Molecular character-
ization of marine organic aerosols collected during a round-
the-world cruise, J. Geophys. Res.-Atmos., 116, D13302,
doi:10.1029/2011jd015604, 2011.
Fu, P. Q., Kawamura, K., Chen, J., Charrière, B., and Sempéré, R.:
Organic molecular composition of marine aerosols over the
Arctic Ocean in summer: contributions of primary emission
and secondary aerosol formation, Biogeosciences, 10, 653–667,
doi:10.5194/bg-10-653-2013, 2013.
Fu, T. M., Jacob, D. J., Wittrock, F., Burrows, J. P., Vrekous-
sis, M., and Henze, D. K.: Global budgets of atmospheric gly-
oxal and methylglyoxal, and implications for formation of sec-
ondary organic aerosols, J. Geophys. Res.-Atmos., 113, D15303,
doi:10.1029/2007jd009505, 2008.
Galbally, I. E., Lawson, S. J., Weeks, I. A., Bentley, S. T.,
Gillett, R. W., Meyer, M., and Goldstein, A. H.: Volatile or-
ganic compounds in marine air at Cape Grim, Australia, Environ.
Chem., 4, 178–182, doi:10.1071/en07024, 2007.
Gras, J. L.: Postfrontal nanoparticles at Cape Grim: impact
on cloud nuclei concentrations, Environ. Chem., 6, 515–523,
doi:10.1071/en09076, 2009.
Gras, J. L.: Particles Program Report, Baseline Atmospheric Pro-
gram (Australia) 2009–2010, edited by: Derek, N., Krum-
mel, P. B., and Cleland, S. J., Australian Bureau of Meteorology
and CSIRO Marine and Atmospheric Research, Melbourne, 73–
75, available at: http://www.bom.gov.au/inside/cgbaps/baseline/
Baseline_2009-2010.pdf, 2014.
Grutter, M., Flores, E., Andraca-Ayala, G., and Báez, A.: Formalde-
hyde levels in downtown Mexico City during 2003, Atmos. Envi-
ron., 39, 1027–1034, doi:10.1016/j.atmosenv.2004.10.031, 2005.
Helmig, D., Bottenheim, J., Galbally, I. E., Lewis, A., Mil-
ton, M. J. T., Penkett, S., Plass-Duelmer, C., Reimann, S.,
Tans, P., and Thiel, S.: Volatile organic compounds in the
global atmosphere, EOS T. Am. Geophys. Un., 90, 513–514,
doi:10.1029/2009EO520001, 2009.
Helmig, D., Petrenko, V., Martinerie, P., Witrant, E., Röck-
mann, T., Zuiderweg, A., Holzinger, R., Hueber, J., Thomp-
son, C., White, J. W. C., Sturges, W., Baker, A., Blunier, T.,
Etheridge, D., Rubino, M., and Tans, P.: Reconstruction of North-
ern Hemisphere 1950–2010 atmospheric non-methane hydrocar-
bons, Atmos. Chem. Phys., 14, 1463–1483, doi:10.5194/acp-14-
1463-2014, 2014.
ISO: ISO 6879: Air Quality, Performance Characteristics and Re-
lated Concepts for Air Quality Measuring Methods, International
Organisation for Standardisation, Geneva, Switzerland, 1995.
Kampf, C. J., Waxman, E. M., Slowik, J. G., Dommen, J.,
Pfaffenberger, L., Praplan, A. P., Prevot, A. S. H., Bal-
tensperger, U., Hoffmann, T., and Volkamer, R.: Effective
Henry’s Law partitioning and the salting constant of glyoxal in
aerosols containing sulfate, Environ. Sci. Technol., 47, 4236–
4244, doi:10.1021/es400083d, 2013.
Keywood, M. D.: Aerosol composition at Cape Grim : an evalua-
tion of PM10 sampling program and baseline event switches, in:
Baseline Atmospheric Program Australia 2005–2006, edited by:
Cainey, J. M., Derek, N., and Krummel, P. B., Australian Bureau
of Meteorology and CSIRO Marine and Atmospheric Research,
Melbourne, 31–36, available at: http://www.bom.gov.au/inside/
cgbaps/baseline/Baseline_2005-2006.pdf, 2007.
Kivlighon, L. M.: Tropospheric non-methane hydrocarbons at Cape
Grim, Masters Thesis, Department of Chemistry, La Trobe Uni-
versity, Melbourne, Australia, 2001.
Korhonen, H., Carslaw, K. S., Spracklen, D. V., Mann, G. W.,
and Woodhouse, M. T.: Influence of oceanic dimethyl sul-
fide emissions on cloud condensation nuclei concentrations
and seasonality over the remote Southern Hemisphere oceans:
a global model study, J. Geophys. Res.-Atmos., 113, D15204,
doi:10.1029/2007jd009718, 2008.
Kroll, J. H., Ng, N. L., Murphy, S. M., Varutbangkul, V., Fla-
gan, R. C., and Seinfeld, J. H.: Chamber studies of sec-
ondary organic aerosol growth by reactive uptake of simple
carbonyl compounds, J. Geophys. Res.-Atmos., 110, D23207,
doi:10.1029/2005jd006004, 2005.
Kwan, A. J., Crounse, J. D., Clarke, A. D., Shinozuka, Y., Ander-
son, B. E., Crawford, J. H., Avery, M. A., McNaughton, C. S.,
Brune, W. H., Singh, H. B., and Wennberg, P. O.: On the flux
of oxygenated volatile organic compounds from organic aerosol
oxidation, Geophys. Res. Lett., 33, doi:10.1029/2006gl026144,
2006.
Lana, A., Simó, R., Vallina, S. M., and Dachs, J.: Potential for a
biogenic influence on cloud microphysics over the ocean: a cor-
relation study with satellite-derived data, Atmos. Chem. Phys.,
12, 7977–7993, doi:10.5194/acp-12-7977-2012, 2012.
Landwehr, S., Miller, S. D., Smith, M. J., Saltzman, E. S., and
Ward, B.: Analysis of the PKT correction for direct CO2 flux
measurements over the ocean, Atmos. Chem. Phys., 14, 3361–
3372, doi:10.5194/acp-14-3361-2014, 2014.
Lawson, S. J., Galbally, I. E., Gras, J. L., and Dunne, E.:
Measurement of VOCs in Marine Air at Cape Grim using
PTR-MS, Baseline Atmospheric Program 2007–2008, edited
by: Derek, N., and Krummel, P. B., Australian Bureau of
Meteorology and CSIRO Marine and Atmospheric Research,
Melbourne, available at: http://www.bom.gov.au/inside/cgbaps/
baseline/Baseline_2007-2008.pdf (last access: 22 August 2014),
2011.
Lee, A. K. Y., Herckes, P., Leaitch, W. R., Macdonald, A. M.,
and Abbatt, J. P. D.: Aqueous OH oxidation of ambi-
ent organic aerosol and cloud water organics: formation of
highly oxidized products, Geophys. Res. Lett., 38, L11805,
doi:10.1029/2011gl047439, 2011.
Lerot, C., Stavrakou, T., De Smedt, I., Müller, J.-F., and
Van Roozendael, M.: Glyoxal vertical columns from GOME-2
backscattered light measurements and comparisons with a global
model, Atmos. Chem. Phys., 10, 12059–12072, doi:10.5194/acp-
10-12059-2010, 2010.
Lim, Y. B., Tan, Y., and Turpin, B. J.: Chemical insights, explicit
chemistry, and yields of secondary organic aerosol from OH radi-
cal oxidation of methylglyoxal and glyoxal in the aqueous phase,
Atmos. Chem. Phys., 15, 223–240, 2015 www.atmos-chem-phys.net/15/223/2015/
S. J. Lawson et al.: Seasonal in situ observations of glyoxal and methylglyoxal 239
Atmos. Chem. Phys., 13, 8651–8667, doi:10.5194/acp-13-8651-
2013, 2013.
Mahajan, A. S., Prados-Roman, C., Hay, T. D., Lampel, J., Pöh-
ler, D., Großmann, K., Tschritter, J., Frieß, U., Platt, U., John-
ston, P., Kreher, K., Wittrock, F., Burrows, J. P., Plane, J. M. C.,
and Saiz-Lopez, A.: Glyoxal observations in the global marine
boundary layer, J. Geophys. Res.-Atmos., 119, 2013JD021388,
doi:10.1002/2013JD021388, 2014.
Meskhidze, N. and Nenes, A.: Phytoplankton and cloudi-
ness in the Southern Ocean, Science, 314, 1419–1423,
doi:10.1126/science.1131779, 2006.
Meskhidze, N., Xu, J., Gantt, B., Zhang, Y., Nenes, A., Ghan, S. J.,
Liu, X., Easter, R., and Zaveri, R.: Global distribution and cli-
mate forcing of marine organic aerosol: 1. Model improve-
ments and evaluation, Atmos. Chem. Phys., 11, 11689–11705,
doi:10.5194/acp-11-11689-2011, 2011.
Miller, C. C., Abad, G. G., Wang, H., Liu, X., Kurosu, T., Ja-
cob, D. J., and Chance, K.: Glyoxal retrieval from the Ozone
Monitoring Instrument, Atmos. Meas. Tech. Discuss., 7, 6065–
6112, doi:10.5194/amtd-7-6065-2014, 2014.
Molloy, S. B. and Galbally, I. E.: Analysis and identification
of a suitable Baseline definition for tropospheric ozone at
Cape Grim, Tasmania, Baseline Atmospheric Program (Aus-
tralia) 2009–2010, edited by: Derek, N., Krummel, P. B.,
and Cleland, S. J., Australian Bureau of Meteorology and
CSIRO Marine and Atmospheric Research, Melbourne, 7–
16, available at: http://www.bom.gov.au/inside/cgbaps/baseline/
Baseline_2009-2010.pdf, last access: 22 August 2014.
Montzka, S. A., Siso, C., Mondeel, D., Miller, B. R., Hall,
B., Elkins, J. W., and Butler, J. H.: Flask Measurements at
Cape Grim Baseline Air Pollution Station by the HATS group
of NOAA/ESRL/GMD, Baseline Atmospheric Program (Aus-
tralia) 2009–2010, edited by: Derek, N., Krummel, P. B.,
and Cleland, S. J., Australian Bureau of Meteorology and
CSIRO Marine and Atmospheric Research, Melbourne, 51–
55, available at: http://www.bom.gov.au/inside/cgbaps/baseline/
Baseline_2009-2010.pdf, last access: 22 August 2014.
Müller, K., Lehmann, S., van Pinxteren, D., Gnauk, T., Nieder-
meier, N., Wiedensohler, A., and Herrmann, H.: Particle charac-
terization at the Cape Verde atmospheric observatory during the
2007 RHaMBLe intensive, Atmos. Chem. Phys., 10, 2709–2721,
doi:10.5194/acp-10-2709-2010, 2010.
Myriokefalitakis, S., Vrekoussis, M., Tsigaridis, K., Wittrock, F.,
Richter, A., Brühl, C., Volkamer, R., Burrows, J. P., and Kanaki-
dou, M.: The influence of natural and anthropogenic secondary
sources on the glyoxal global distribution, Atmos. Chem. Phys.,
8, 4965–4981, doi:10.5194/acp-8-4965-2008, 2008.
O’Dowd, C. D., Facchini, M. C., Cavalli, F., Ceburnis, D.,
Mircea, M., Decesari, S., Fuzzi, S., Yoon, Y. J., and Putaud, J. P.:
Biogenically driven organic contribution to marine aerosol, Na-
ture, 431, 676–680, doi:10.1038/nature02959, 2004.
Olsen, R., Thorud, S., Hersson, M., Ovrebo, S., Lundanes, E.,
Greibrokk, T., Ellingsen, D. G., Thomassen, Y., and Molan-
der, P.: Determination of the dialdehyde glyoxal in workroom
air-development of personal sampling methodology, J. Environ.
Monitor., 9, 687–694, doi:10.1039/B700105N, 2007.
Orellana, M. V., Matrai, P. A., Leck, C., Rauschenberg, C. D.,
Lee, A. M., and Coz, E.: Marine microgels as a source of cloud
condensation nuclei in the high Arctic, P. Natl. Acad. Sci. USA,
108, 13612–13617, doi:10.1073/pnas.1102457108, 2011.
Ovadnevaite, J., Ceburnis, D., Martucci, G., Bialek, J., Mon-
ahan, C., Rinaldi, M., Facchini, M. C., Berresheim, H.,
Worsnop, D. R., and O’Dowd, C.: Primary marine or-
ganic aerosol: a dichotomy of low hygroscopicity and
high CCN activity, Geophys. Res. Lett., 38, L21806,
doi:10.1029/2011gl048869, 2011a.
Ovadnevaite, J., O’Dowd, C., Dall’Osto, M., Ceburnis, D.,
Worsnop, D. R., and Berresheim, H.: Detecting high contribu-
tions of primary organic matter to marine aerosol: a case study,
Geophys. Res. Lett., 38, L02807, doi:10.1029/2010gl046083,
2011b.
Pétron, G., Frost, G., Miller, B. R., Hirsch, A. I., Montzka, S. A.,
Karion, A., Trainer, M., Sweeney, C., Andrews, A. E., Miller, L.,
Kofler, J., Bar-Ilan, A., Dlugokencky, E. J., Patrick, L.,
Moore, C. T., Ryerson, T. B., Siso, C., Kolodzey, W., Lang, P. M.,
Conway, T., Novelli, P., Masarie, K., Hall, B., Guenther, D.,
Kitzis, D., Miller, J., Welsh, D., Wolfe, D., Neff, W., and Tans, P.:
Hydrocarbon emissions characterization in the Colorado Front
Range: a pilot study, J. Geophys. Res.-Atmos., 117, D04304,
doi:10.1029/2011JD016360, 2012.
Rhoderick, G. C., Duewer, D. L., Apel, E., Baldan, A., Hall, B.,
Harling, A., Helmig, D., Heo, G. S., Hueber, J., Kim, M. E.,
Kim, Y. D., Miller, B., Montzka, S., and Riemer, D.: International
comparison of a hydrocarbon gas standard at the picomol per
mol level, Anal. Chem., 86, 2580–2589, doi:10.1021/ac403761u,
2014.
Rinaldi, M., Decesari, S., Finessi, E., Giulianelli, L., Car-
bone, C., Fuzzi, S., O’Dowd, C., Ceburnis, D., and Fac-
chini, M. C.: Primary and secondary organic marine aerosol
and oceanic biological activity: recent results and new perspec-
tives for future studies, Advances in Meteorology, 2010, 310682,
doi:10.1155/2010/310682, 2010.
Rinaldi, M., Decesari, S., Carbone, C., Finessi, E., Fuzzi, S., Ce-
burnis, D., O’Dowd, C. D., Sciare, J., Burrows, J. P., Vrekous-
sis, M., Ervens, B., Tsigaridis, K., and Facchini, M. C.: Ev-
idence of a natural marine source of oxalic acid and a pos-
sible link to glyoxal, J. Geophys. Res.-Atmos., 116, D16204,
doi:10.1029/2011jd015659, 2011.
Schauer, J. J., Kleeman, M. J., Cass, G. R., and Simoneit, B. R. T.:
Measurement of emissions from air pollution sources. 2.
C1 through C30 organic compounds from medium duty
diesel trucks, Environ. Sci. Technol., 33, 1578–1587,
doi:10.1021/es980081n, 1999.
Sciare, J., Favez, O., Sarda-Esteve, R., Oikonomou, K., Cachier, H.,
and Kazan, V.: Long-term observations of carbonaceous aerosols
in the Austral Ocean atmosphere: evidence of a biogenic ma-
rine organic source, J. Geophys. Res.-Atmos., 114, D15302,
doi:10.1029/2009jd011998, 2009.
Sedehi, N., Takano, H., Blasic, V. A., Sullivan, K. A., and De
Haan, D. O.: Temperature- and pH-dependent aqueous-phase ki-
netics of the reactions of glyoxal and methylglyoxal with at-
mospheric amines and ammonium sulfate, Atmos. Environ., 77,
656–663, doi:10.1016/j.atmosenv.2013.05.070, 2013.
Shaw, S., Gantt, B., and Meskhidze, N.: Production and emission of
marine isoprene and monoterpenes: a review, Advances in Mete-
orology, 2010, 408696, doi:10.1155/2010/408696, 2010.
www.atmos-chem-phys.net/15/223/2015/ Atmos. Chem. Phys., 15, 223–240, 2015
240 S. J. Lawson et al.: Seasonal in situ observations of glyoxal and methylglyoxal
Sinreich, R., Volkamer, R., Filsinger, F., Frieß, U., Kern, C.,
Platt, U., Sebastián, O., and Wagner, T.: MAX-DOAS detection
of glyoxal during ICARTT 2004, Atmos. Chem. Phys., 7, 1293–
1303, doi:10.5194/acp-7-1293-2007, 2007.
Sinreich, R., Coburn, S., Dix, B., and Volkamer, R.: Ship-based
detection of glyoxal over the remote tropical Pacific Ocean,
Atmos. Chem. Phys., 10, 11359–11371, doi:10.5194/acp-10-
11359-2010, 2010.
Slemr, J.: Determination of volatile carbonyl compounds
in clean air, Fresenius J. Anal. Chem., 340, 672–677,
doi:10.1007/BF00321533, 1991.
Sommariva, R., Haggerstone, A.-L., Carpenter, L. J., Carslaw, N.,
Creasey, D. J., Heard, D. E., Lee, J. D., Lewis, A. C.,
Pilling, M. J., and Zádor, J.: OH and HO2 chemistry in clean
marine air during SOAPEX-2, Atmos. Chem. Phys., 4, 839–856,
doi:10.5194/acp-4-839-2004, 2004.
Stavrakou, T., Müller, J.-F., De Smedt, I., Van Roozendael, M.,
Kanakidou, M., Vrekoussis, M., Wittrock, F., Richter, A., and
Burrows, J. P.: The continental source of glyoxal estimated by the
synergistic use of spaceborne measurements and inverse mod-
elling, Atmos. Chem. Phys., 9, 8431–8446, doi:10.5194/acp-9-
8431-2009, 2009.
Steele, P., Krummel, P., van der Schoot, M. V., Spencer, D. A.,
Baly, S. B., Langenfelds, R. L., Howden, R. T., Ward, J.,
Somerville, N. T., and Cleland, S. J.: Baseline carbon
dioxide monitoring, Baseline Atmospheric Program (Aus-
tralia) 2009–2010, edited by: Derek, N., Krummel, P. B.,
and Cleland, S. J., Australian Bureau of Meteorology and
CSIRO Marine and Atmospheric Research, Melbourne, 39–
41, available at: http://www.bom.gov.au/inside/cgbaps/baseline/
Baseline_2009-2010.pdf, last access: 22 August 2014.
Tan, Y., Lim, Y. B., Altieri, K. E., Seitzinger, S. P., and Turpin, B. J.:
Mechanisms leading to oligomers and SOA through aqueous
photooxidation: insights from OH radical oxidation of acetic
acid and methylglyoxal, Atmos. Chem. Phys., 12, 801–813,
doi:10.5194/acp-12-801-2012, 2012.
Thalman, R., Baeza-Romero, M. T., Ball, S. M., Borrás, E., Daniels,
M. J. S., Goodall, I. C. A., Henry, S. B., Karl, T., Keutsch, F. N.,
Kim, S., Mak, J., Monks, P. S., Muñoz, A., Orlando, J., Peppe,
S., Rickard, A. R., Ródenas, M., Sánchez, P., Seco, R., Su, L.,
Tyndall, G., Vázquez, M., Vera, T., Waxman, E., and Volka-
mer, R.: Instrument inter-comparison of glyoxal, methyl glyoxal
and NO2 under simulated atmospheric conditions, Atmos. Meas.
Tech. Discuss., 7, 8581–8642, doi:10.5194/amtd-7-8581-2014,
2014.
Topping, D., Connolly, P., and McFiggans, G.: Cloud droplet
number enhanced by co-condensation of organic vapours, Nat.
Geosci., 6, 443–446, doi:10.1038/ngeo1809, 2013.
van Pinxteren, M. and Herrmann, H.: Glyoxal and methyl-
glyoxal in Atlantic seawater and marine aerosol particles:
method development and first application during the Polarstern
cruise ANT XXVII/4, Atmos. Chem. Phys., 13, 11791–11802,
doi:10.5194/acp-13-11791-2013, 2013.
Volkamer, R.: Measurements of Bromine Oxide, Iodine Oxide and
Oxygenated Hydrocarbons in the Tropical Free Troposphere
from Research Aircraft and Mountaintops, NOAA ESRL Global
Monitoring Annual Conference 2014, Boulder, Colorado, 2014.
Vrekoussis, M., Wittrock, F., Richter, A., and Burrows, J. P.: Tem-
poral and spatial variability of glyoxal as observed from space,
Atmos. Chem. Phys., 9, 4485–4504, doi:10.5194/acp-9-4485-
2009, 2009.
Wang, H.-L., Zhang, X., and Chen, Z.-M.: Development of
DNPH/HPLC method for the measurement of carbonyl com-
pounds in the aqueous phase: applications to laboratory sim-
ulation and field measurement, Environ. Chem., 6, 389–397,
doi:10.1071/EN09057, 2009.
Westervelt, D. M., Moore, R. H., Nenes, A., and Adams, P. J.: Ef-
fect of primary organic sea spray emissions on cloud conden-
sation nuclei concentrations, Atmos. Chem. Phys., 12, 89–101,
doi:10.5194/acp-12-89-2012, 2012.
Wilson, S. R.: Characterisation of J (O1D) at Cape Grim
2000–2005, Atmos. Chem. Phys. Discuss., 14, 18389–18419,
doi:10.5194/acpd-14-18389-2014, 2014.
Wittrock, F., Richter, A., Oetjen, H., Burrows, J. P., Kanakidou, M.,
Myriokefalitakis, S., Volkamer, R., Beirle, S., Platt, U., and
Wagner, T.: Simultaneous global observations of glyoxal and
formaldehyde from space, Geophys. Res. Lett., 33, L16804,
doi:10.1029/2006gl026310, 2006.
Zahorowski, W., Griffiths, A. D., Chambers, S. D., Williams, A. G.,
Law, R. M., Crawford, J., and Werczynski, S.: Constrain-
ing annual and seasonal radon-222 flux density from
the Southern Ocean using radon-222 concentrations in
the boundary layer at Cape Grim, Tellus B, 65, 19622,
doi:10.3402/tellusb.v65i0.19622, 2013.
Zhou, S., Gonzalez, L., Leithead, A., Finewax, Z., Thalman, R.,
Vlasenko, A., Vagle, S., Miller, L.A., Li, S.-M., Bureekul, S.,
Furutani, H., Uematsu, M., Volkamer, R., and Abbatt, J.: For-
mation of gas-phase carbonyls from heterogeneous oxidation of
polyunsaturated fatty acids at the air–water interface and of the
sea surface microlayer, Atmos. Chem. Phys., 14, 1371–1384,
doi:10.5194/acp-14-1371-2014, 2014.
Zhou, X. and Mopper, K.: Apparent partition coefficients of 15
carbonyl compounds between air and seawater and between air
and freshwater; implications for air–sea exchange, Environ. Sci.
Technol., 24, 1864–1869, doi:10.1021/es00082a013, 1990.
Atmos. Chem. Phys., 15, 223–240, 2015 www.atmos-chem-phys.net/15/223/2015/
Related Documents