ACPD 11, 6493–6530, 2011 Seasonal impact of natural and anthropogenic emissions on glacier J. Gabrieli et al. Title Page Abstract Introduction Conclusions References Tables Figures Back Close Full Screen / Esc Printer-friendly Version Interactive Discussion Discussion Paper | Discussion Paper | Discussion Paper | Discussion Paper | Atmos. Chem. Phys. Discuss., 11, 6493–6530, 2011 www.atmos-chem-phys-discuss.net/11/6493/2011/ doi:10.5194/acpd-11-6493-2011 © Author(s) 2011. CC Attribution 3.0 License. Atmospheric Chemistry and Physics Discussions This discussion paper is/has been under review for the journal Atmospheric Chemistry and Physics (ACP). Please refer to the corresponding final paper in ACP if available. Seasonal impact of natural and anthropogenic emissions on the highest glacier of the Eastern European Alps J. Gabrieli 1,2 , L. Carturan 3 , P. Gabrielli 4 , C. Turetta 2 , N. Kehrwald 2 , G. Cozzi 2 , H. Staffler 5 , R. Dinale 6 , R. Seppi 7 , G. dalla Fontana 3 , L. Thompson 4 , and C. Barbante 1,2 1 Institute for the Dynamics of Environmental Processes IDPA-CNR, University of Venice, Dorsoduro 2137, 30123 Venice, Italy 2 Department of Environmental Sciences, University Ca’ Foscari of Venice, Dorsoduro 2137, 30123 Venice, Italy 3 Department of Land, Environment, Agriculture and Forests, Agripolis, University of Padua, Viale dell’Universit ` a 16, 35020 Legnaro, Italy 4 School of Earth Sciences and Byrd Polar Research Center, The Ohio State University, 108 Scott Hall, 1090 Carmack Road, 43210 Columbus, USA 5 Ripartizione Protezione Antincendi e Civile – Provincia Autonoma di Bolzano, Viale Drusio 116, 39100 Bolzano, Italy 6493

Welcome message from author
This document is posted to help you gain knowledge. Please leave a comment to let me know what you think about it! Share it to your friends and learn new things together.
Transcript
ACPD11, 6493–6530, 2011
Seasonal impact ofnatural and
anthropogenicemissions on glacier
J. Gabrieli et al.
Title Page
Abstract Introduction
Conclusions References
Tables Figures
J I
J I
Back Close
Full Screen / Esc
Printer-friendly Version
Interactive Discussion
Discussion
Paper
|D
iscussionP
aper|
Discussion
Paper
|D
iscussionP
aper|
Atmos. Chem. Phys. Discuss., 11, 6493–6530, 2011www.atmos-chem-phys-discuss.net/11/6493/2011/doi:10.5194/acpd-11-6493-2011© Author(s) 2011. CC Attribution 3.0 License.
AtmosphericChemistry
and PhysicsDiscussions
This discussion paper is/has been under review for the journal Atmospheric Chemistryand Physics (ACP). Please refer to the corresponding final paper in ACP if available.
Seasonal impact of natural andanthropogenic emissions on the highestglacier of the Eastern European Alps
J. Gabrieli1,2, L. Carturan3, P. Gabrielli4, C. Turetta2, N. Kehrwald2, G. Cozzi2,H. Staffler5, R. Dinale6, R. Seppi7, G. dalla Fontana3, L. Thompson4, andC. Barbante1,2
1Institute for the Dynamics of Environmental Processes IDPA-CNR, University of Venice,Dorsoduro 2137, 30123 Venice, Italy2Department of Environmental Sciences, University Ca’ Foscari of Venice, Dorsoduro 2137,30123 Venice, Italy3Department of Land, Environment, Agriculture and Forests, Agripolis, University of Padua,Viale dell’Universita 16, 35020 Legnaro, Italy4School of Earth Sciences and Byrd Polar Research Center, The Ohio State University, 108Scott Hall, 1090 Carmack Road, 43210 Columbus, USA5Ripartizione Protezione Antincendi e Civile – Provincia Autonoma di Bolzano, Viale Drusio116, 39100 Bolzano, Italy
6493
ACPD11, 6493–6530, 2011
Seasonal impact ofnatural and
anthropogenicemissions on glacier
J. Gabrieli et al.
Title Page
Abstract Introduction
Conclusions References
Tables Figures
J I
J I
Back Close
Full Screen / Esc
Printer-friendly Version
Interactive Discussion
Discussion
Paper
|D
iscussionP
aper|
Discussion
Paper
|D
iscussionP
aper|
6Ripartizione Protezione Antincendi e Civile, Ufficio Idrografico – Provincia Autonoma diBolzano, Via Mendola 33, 39100 Bolzano, Italy7Earth Science Department, University of Pavia, Via Ferrata 1, 27100 Pavia, Italy
Received: 27 November 2010 – Accepted: 11 February 2011 – Published: 23 February 2011
Correspondence to: J. Gabrieli ([email protected])
Published by Copernicus Publications on behalf of the European Geosciences Union.
6494
ACPD11, 6493–6530, 2011
Seasonal impact ofnatural and
anthropogenicemissions on glacier
J. Gabrieli et al.
Title Page
Abstract Introduction
Conclusions References
Tables Figures
J I
J I
Back Close
Full Screen / Esc
Printer-friendly Version
Interactive Discussion
Discussion
Paper
|D
iscussionP
aper|
Discussion
Paper
|D
iscussionP
aper|
Abstract
In June 2009, we conducted the first extensive glaciological survey of Alto dell’Ortles,the uppermost glacier of Mt. Ortles which at 3905 meters above sea level (m a.s.l.)is the highest summit of the Eastern European Alps. We analyzed snow samplescollected from a 4.5 m snow-pit at 3830 m a.s.l. Here, we present a comprehensive5
data set including a large suite of trace elements and ionic compounds that comprisethe atmospheric depositions over the past few years.
Trace element concentrations measured in snow samples are extremely low withmean concentrations at pg g−1 level. Only Al and Fe present median values of 1.8 and3.3 ng g−1, with maximum concentrations of 21 and 25 ng g−1. The median EFc values10
for Be, Rb, Sr, Ba, U, Li, Al, Ca, Cr, Mn, Fe, Co, Ga and V are lower than 10 suggestingthat these elements originated mainly from soil and mineral aerosol. EFc higher than100 are reported for Zn (118), Ag (135), Bi (185), Sb (401) and Cd (514), demonstratingthe predominance of non-crustal depositions and suggesting an anthropogenic origin.
Our data show that the physical stratigraphy and the chemical signals of several15
species were well preserved in the uppermost snow of the Alto dell’Ortles glacier.A clear seasonality emerges from the data as the summer snow is more affected byanthropogenic and marine contributions while the winter aerosol flux is dominated bycrustal sources. For trace elements, the largest mean EFc seasonal variations aredisplayed by V (with a factor of 3.8), Sb (3.3), Cu (3.3), Pb (2.9), Bi (2.8), Cd (2.1),20
Zn (1.9), Ni (1.8), Ag (1.8), As (1.7) and Co (1.6).The chemical data are also discussed in light of the atmospheric stability and back-
trajectories analyses in order to explain the observed seasonal variability and howhuman activities impact the high altitude environment in the Eastern Alps. The originand behavior of air masses as inferred from the evaluation of 48-h back-trajectories25
show significant seasonal differences. However, the large changes in trace elementsconcentrations seem to be more related to the vertical structure of the troposphere ata regional scale rather than the synoptic weather patterns.
6495

ACPD11, 6493–6530, 2011
Seasonal impact ofnatural and
anthropogenicemissions on glacier
J. Gabrieli et al.
Title Page
Abstract Introduction
Conclusions References
Tables Figures
J I
J I
Back Close
Full Screen / Esc
Printer-friendly Version
Interactive Discussion
Discussion
Paper
|D
iscussionP
aper|
Discussion
Paper
|D
iscussionP
aper|
1 Introduction
Impurities trapped in snow and ice provide insight into past atmospheric compositionand environmental variations. In particular, the study of trace elements and ionic com-pounds contribute to the understanding of changes in past atmospheric circulation andto estimating the relative contribution of different sources. Trace element measure-5
ments in ice cores from around the globe are suited for the determination of naturalbackground concentrations and anthropogenic pollution (Barbante et al., 2009; Honget al., 2009; Kaspari et al., 2009; Shotyk et al., 2005). During the past few decades,several reconstructions of trace elements and heavy metals in polar ice-cores, espe-cially from Antarctica (Planchon et al., 2003) and Greenland (McConnell et al., 2002),10
demonstrate consistent anthropogenic pollution in recent snow samples. The Euro-pean Alpine glaciers are located near densely populated and industrialized areas andhave considerable potential to provide excellent archives for past air pollution. Theseglaciers may accurately document the environmental impact of anthropogenic emis-sions over the previous centuries as well as the efficacy of recent air pollution controls15
(Schwikowski, 2004).The first heavy metal concentrations in Alpine firn and ice samples were obtained
from the analysis of a 140 m snow/ice core drilled on the Col du Gouter, in the MontBlanc Massif (4304 m a.s.l.). Van de Velde et al. (1999) determined the seasonal vari-ations of several trace elements (Pb, Zn, Cu, Cd, Bi, Mn and Al) from 1960–1968. In20
addition, two other studies (Van de Velde et al., 1999, 2000) determined the concen-trations of Co, Cr, Mo, Sb, Au, Ag, Pt, Pd and Rh, in the same ice core covering the lasttwo centuries. Barbante et al. (2001) report the changes in post-World II uranium con-centrations. Concentrations of many heavy metals (Cr, Cd, Zn, Co, Ni, Mo, Rh, Pd, Ag,Cd, Sb, Bi, Pt, Au, U) were also determined in a 109 m ice core drilled in 1982 on Colle25
Gnifetti, Monte Rosa massif, since 1650 AD (Barbante et al., 2004). Schwikowski etal. (2004) analyzed the same samples for Pb concentration and isotopes. Surprisingly,little attention has been paid to the investigation of heavy metals in fresh snow and
6496
ACPD11, 6493–6530, 2011
Seasonal impact ofnatural and
anthropogenicemissions on glacier
J. Gabrieli et al.
Title Page
Abstract Introduction
Conclusions References
Tables Figures
J I
J I
Back Close
Full Screen / Esc
Printer-friendly Version
Interactive Discussion
Discussion
Paper
|D
iscussionP
aper|
Discussion
Paper
|D
iscussionP
aper|
seasonal snow-pack from high altitude European Alpine areas and only few reliabledata concerning winter snow have been published (Gabrielli et al., 2008; Veysseyre etal., 2001).
In contrast, ionic compounds have been extensively studied in Alpine snow and ice.The historical records of major ion deposition on high-altitude glaciers from the West-5
ern Alps were inferred from the following firn and ice cores: Col du Dome near MontBlanc (Preunkert et al., 1999), Colle Gnifetti (Sigl, 2009; Bolius, 2006) and Grenz-gletscher (Eichler et al., 2004) in the Monte Rosa Group; and Fiescherhorngletscherin the Bernese Alps (Eichler et al., 2004). Major ions were also determined in recentsnow from the Eastern Alps: Careser glacier (Novo and Rossi, 1998), Stubai glacier10
(Kuhn et al., 1998), Sonnblick glacier (Puxbaum and Tscherwenka, 1998) and in thesnowpack of mid-altitude sites (1500–2650 m a.s.l.) in the Dolomites (Gabrieli et al.,2008, 2010a).
A general prerequisite for the preservation of climatic and environmental informationin glaciers is the presence of sufficiently cold firn temperatures and the absence of15
significant meltwater percolation. Until now, these conditions were expected to occurabove 4000 m a.s.l. and 4300 m a.s.l. in the northern and southern sectors of theEuropean Alps, respectively (Schwikowski, 2004). Given this possible limitation, onlythe Mont Blanc region, the Monte Rosa Massif and a few locations in the BerneseOberland were previously considered as possible drilling sites.20
The highest peak of the Eastern Alps is Mt. Ortles (3905 m a.s.l.) located in theSouthern Rhaetian Alps, Italy. This area lies at the boundary between the centraland southern European climate regions (Davis et al., 2003) and therefore is subject toa continental precipitation regime with the lowest precipitation amounts of precipitationin the Alps which are lower by a factor of two to three from the Alpine average (Schwarb,25
2000). The region near Mt Ortles is often referred to as the inner dry Alpine zone (Freiand Schar, 1998). This low precipitation suggests that although Alto dell’Ortles hasa relatively low altitude for obtaining a conserved paleo-glaciological record, the glaciercould still contain ice up as old as several millennia. Supporting evidence for old ice
6497
ACPD11, 6493–6530, 2011
Seasonal impact ofnatural and
anthropogenicemissions on glacier
J. Gabrieli et al.
Title Page
Abstract Introduction
Conclusions References
Tables Figures
J I
J I
Back Close
Full Screen / Esc
Printer-friendly Version
Interactive Discussion
Discussion
Paper
|D
iscussionP
aper|
Discussion
Paper
|D
iscussionP
aper|
includes the discovery of the prehistoric Otztaler man (5200 BP) from the ablating iceat Similaun (3280 m a.s.l.), just 30 km west of the Alto dell’Ortles glacier (Baroni andOrombelli, 1996).
To evaluate the potential of Alto dell’Ortles glacier as a glacial archive for paleo-environmental studies, we conducted the first extensive glaciological survey in June5
2009 (Gabrielli et al., 2010). This survey included various glaciological measurements,a ground penetrating radar (GPR) survey, drilling a 10 m shallow core and samplinga 4.5 m snow-pit. Here, we present a new comprehensive dataset of a large suiteof trace elements and ionic compounds in snow sampled from the 4.5 m snow-pit at3830 m a.s.l., near the summit of Mt. Ortles. The data are discussed in light of the10
available meteorological and atmospheric circulation data including the boundary layerdepth, atmospheric stability and calculated back-trajectories. This compilation providesthe first data for the seasonal variability of trace species deposition in the Eastern Alpsand the impact of human activities on this high altitude environment.
2 Methods15
2.1 Study area
Mt. Ortles (46◦30′32′′ N, 10◦32′41′′ E) is located in the northern Ortles-Cevedale massifin the Southern Rhaetic Alps (Provincia Autonoma di Bolzano, Alto Adige South Tyrol,Italy), and is the highest peak in the Eastern European Alps (3905 m a.s.l.) (Fig. 1).This section of the Ortles-Cevedale massif is composed by sedimentary rocks such20
as stratified dolomites with interblended laminated and slab-shaped black limestone(Desio, 1967). The northwestern flank of Mt. Ortles is covered by the Alto dell’Ortlesglacier. The upper part of the glacier has a slope of 8–9 degrees which then flows tosteeper bedrock to form two major tongues. The glacier surface area is 1.04 km2 andranges in elevation from 3905 to 3018 m a.s.l (Gabrielli et al., 2010).25
6498

ACPD11, 6493–6530, 2011
Seasonal impact ofnatural and
anthropogenicemissions on glacier
J. Gabrieli et al.
Title Page
Abstract Introduction
Conclusions References
Tables Figures
J I
J I
Back Close
Full Screen / Esc
Printer-friendly Version
Interactive Discussion
Discussion
Paper
|D
iscussionP
aper|
Discussion
Paper
|D
iscussionP
aper|
2.2 Sampling procedure
Trace species concentrations in high altitude snow and ice samples are extremely low(ranging from ng g−1 to sub-pg g−1). Therefore we collected the samples using thesame stringent anti-contamination procedures used for collecting snow and firn in po-lar regions (Planchon et al., 2003). All sampling tools and low density polyethylene5
(LDPE) bottles were pre-cleaned with diluted ultra-pure HNO3 (Ultrapure grade, Romil,Cambridge, UK) and then rinsed several times with ultra-pure water (Purelab Ultra An-alytic, Elga Lab Water, High Wycombe, UK).
The scientists wore clean-room clothing and polyethylene gloves during the sam-pling. First, the wall of the snow-pit was scratched with a polyethylene bar, scraping10
away any exposed area that may have been potentially contaminated during digging.We sampled by plunging LDPE vials perpendicularly into the snow-pit wall with a spatialresolution of ∼ 5 cm down to a depth of 4.2 m. The collected mass was between 50–90 g, depending on the density of the sampled snow layer. The bottles were capped,packed in double LDPE bags and transported to our laboratories where samples re-15
mained frozen until analysis. The snowpack stratigraphy was identified and physicalparameters such as temperature, snow density, grain shape and size, hardness in-dexes (hand test and Swiss Rammesonde method) were measured (Cagnati, 2003).The form of the snow grains and their dimensions were established according to theInternational Association of Cryospheric Science classification (Fierz et al., 2009).20
2.3 Sample preparation and chemical analysis
The samples were melted at room temperature in the LDPE sampling vials in a class100 laminar flow clean bench. For the trace element analysis, 10 mL aliquots weretransferred to 12 mL ultra-clean LDPE vials and acidified with ultra-pure HNO3 to ob-tain 2% solutions (v/v). Other 40 mL aliquots were transferred in previously washed25
polycarbonate 50 mL vials for electrical conductibility, major ions, TOC (Total OrganicCarbon) and stable isotope analysis.
6499
ACPD11, 6493–6530, 2011
Seasonal impact ofnatural and
anthropogenicemissions on glacier
J. Gabrieli et al.
Title Page
Abstract Introduction
Conclusions References
Tables Figures
J I
J I
Back Close
Full Screen / Esc
Printer-friendly Version
Interactive Discussion
Discussion
Paper
|D
iscussionP
aper|
Discussion
Paper
|D
iscussionP
aper|
Concentrations of Li, Be, Al, Ti, V, Cr, Mn, Fe, Co, Ni, Cu, Zn, Ga, As, Rb, Sr, Ag,Cd, Sb, Ba, Tl, Pb, Bi and U were determined by Inductively Coupled Plasma Sec-tor Field Mass Spectrometry (ICP-SFMS; Element2, ThermoFischer, Bremen, Ger-many) equipped with a desolvation system (APEX IR, Elemental Scientific, Omaha,US). Working conditions and validation tests are described in detail in Gabrieli et5
al. (2010b). Anions (Cl−, NO−2 , NO−
3 , SO2−4 , PO3−
4 ) and cations (Ca2+, Mg2+, Na+, K+,NH+
4 ) were determined by two ion-chromatographic stations (ICS-1500, Dionex Corpo-ration, Sunnyvale, US). The eluent used was 0.3 mM NaHCO3 and 2.7 mM Na2CO3,eluent flow was conducted at 1.0 mL min−1 on a AG12A 200×40 mm column (Dionex).For cation analysis, the eluent used was methylsolfonic acid 20 mM at 1.5 mL min−1
10
rate on a CG12A 200×40 mm column (Dionex). The injection loop volume was set at125 µL. TOC was measured by a catalytic oxidation system coupled with an infrared de-tector (Perkin Elmer5000, Waltham, MA, USA). Stable isotopes ratios (δD, δ18O) weredetermined by mass spectrometry (Finnigan Mat Delta+, ThermoScientific, Bremen,Germay).15
3 Results and discussion
3.1 Character of the data
3.1.1 Trace elements concentrations and fluxes
The trace elements and ionic compounds show a pronounced variability in concentra-tions (Table 1). Trace element concentrations measured in snow samples are extremely20
low with mean concentrations at pg g−1 level. Only Al and Fe present median values of1.8 and 3.3 ng g−1, with maximum concentrations of 21 and 25 ng g−1, respectively. Ti,Mn, Zn, Sr and Ba include maximum values higher than 1.0 ng g−1 while median con-centrations are between 0.21 and 0.69 ng g−1. In Table 2, trace element concentrationsin the Alto dell’Ortles glacier snow are compared to those from the Colle Gnifetti firn/ice25
6500
ACPD11, 6493–6530, 2011
Seasonal impact ofnatural and
anthropogenicemissions on glacier
J. Gabrieli et al.
Title Page
Abstract Introduction
Conclusions References
Tables Figures
J I
J I
Back Close
Full Screen / Esc
Printer-friendly Version
Interactive Discussion
Discussion
Paper
|D
iscussionP
aper|
Discussion
Paper
|D
iscussionP
aper|
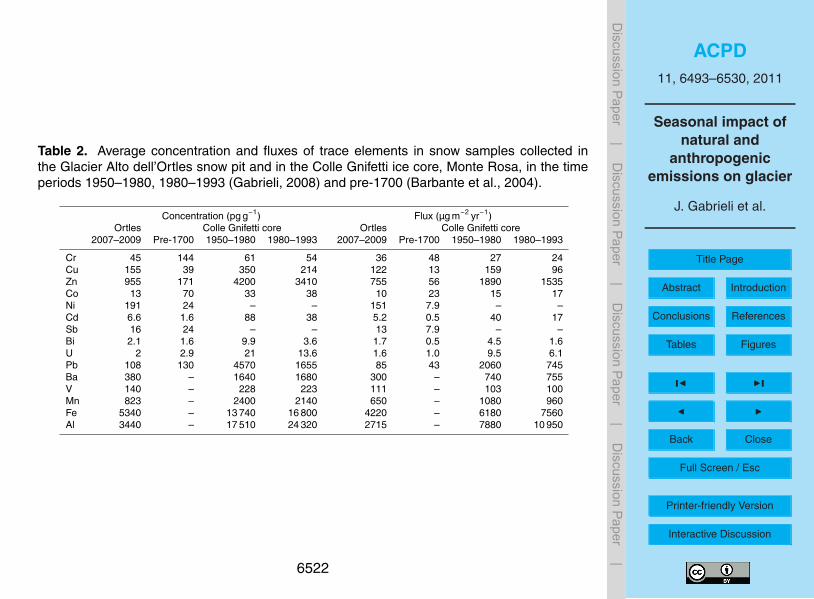
core in the Monte Rosa Group (Gabrieli, 2008; Barbante et al., 2004; Schwikowski etal., 2004). Although the magnitude is comparable, the trace elements concentrationsfrom the Alto dell’Ortles snow pit are generally lower than those determined in the re-cent Colle Gnifetti firn (1980–1993). For instance, Pb concentrations are 15 times lowerin Alto dell’Ortles while Ba, V, Mn, Zn, Fe and Al are about 3–5 times lower. This vari-5
ation in concentrations can be explained by differences in regional precipitation wherethe estimated snow accumulation on the Alto dell’Ortles glacier over the last 3 yearsranged from 550 to 1050 mm w.e. (Gabrielli et al., 2010) while at Colle Gnifetti accu-mulation ranged from 210 to 450 mm w.e. (Jenk et al., 2009; Doescher et al., 1995).As the concentrations may be dependent upon accumulation rates it is therefore more10
representative to calculate deposition fluxes of trace elements (Table 2). The fluxes ofBa, Mn, Fe and Al, which are major constituents of rock and soil, are 50–75% lowerat the Alto dell’Ortles with respect to those at Colle Gnifetti during the last 50 years,suggesting a lower crustal dust deposition on Mt. Ortles. The recent deposition oftrace elements, such as Cu, Pb, Zn and Cd, on the Alto dell’Ortles is about one order15
of magnitude higher than at Colle Gnifetti during pre-industrial time (before 1700), butlower than from 1950 to 1993 (the most recent available data). For instance, the Pbflux on the Alto dell’Ortles glacier is about 85 µg m−2 yr−1, which is double that of ColleGnifetti before the 18th Century (43 µg m−2 yr−1) but about 25 times lower than in thetime window from 1950 to 1983. Despite the distance between these two areas (about20
200 km), this might be consistent with a continuous decrease of heavy metals in Euro-pean emissions from anthropogenic sources during the last few decades (Pacyna andPacyna, 2001). The emission inventories of heavy metals in Italy (available at the web-site: http://webdab1.umweltbundesamt.at/scaled country year.html?cgiproxy skip=1)demonstrate a general reduction from 1990 to 2006 for Pb (−94%), Cr (−38%), Cd25
(−17%), Ni (−5%) and Cu (−4%). During this time period, As and Zn increase by 11%and 8%, respectively.
In order to evaluate the relative trace element contributions from rock and soil dustversus other sources such as anthropogenic emissions and sea-salt, we calculated the
6501
ACPD11, 6493–6530, 2011
Seasonal impact ofnatural and
anthropogenicemissions on glacier
J. Gabrieli et al.
Title Page
Abstract Introduction
Conclusions References
Tables Figures
J I
J I
Back Close
Full Screen / Esc
Printer-friendly Version
Interactive Discussion
Discussion
Paper
|D
iscussionP
aper|
Discussion
Paper
|D
iscussionP
aper|
crustal enrichment factors (EFc). EFc is defined as the concentration ratio of a givenmetal to that of a conservative element (in this work we use Ti) which derives mainlyfrom rock and soil dust, normalized to the same concentration ratio characteristic ofthe upper continental crust (Wedepohl, 1995). For instance, the EFc for Pb is:
EFc(Pb) = ([Pb]/[Ti])snow/([Pb]/[Ti])upper crust.5
The crustal dust is transported to the Alto dell’Ortles glacier from several areas (seeSect. 3.5), and therefore may be characterized by elemental compositions that aresignificantly different from the upper crustal mean. This mixing leads to a higher uncer-tainty in the determination of the EFc. For this reason we assume that only calculatedEFc values that are larger than 10 suggest a pronounced contribution from non-crustal10
sources. The median EFc values for Be, Rb, Sr, Ba, U, Li, Al, Ca, Cr, Mn, Fe, Co,Ga and V are lower than 10 suggesting that these elements originated mainly fromrock and soil dust. For Tl, Pb, Ni, and Cu, median EFc values are between 10 to 100,where a few samples contain an EFc lower than 10. This difference suggests that forthese elements the anthropogenic contribution is generally important even if it is not15
always predominant with respect to natural sources. EFc higher than 100 are reportedfor As (107), Zn (118), Ag (135), Bi (185), Sb (401) and Cd (514), demonstrating thepredominance of non-crustal depositions and suggesting an anthropogenic origin.
3.1.2 Possible anthropogenic sources of the trace elements
Stationary fossil fuel combustions contribute more than 85% to the total European an-20
thropogenic inputs of As, V, Mn, Ni and Tl while non-ferrous metal production is themajor source of Zn (Pacyna and Pacyna, 2001). Potential anthropogenic sources ofSb emission to the atmosphere are numerous and include coal combustion, Pb andCu smelting, refuse incineration, retardants for plastics and textiles, catalysts in PETproduction and are a constituent of automobile brake pads (Smichowski, 2008). The25
combustion of leaded gasoline is the major source of atmospheric Pb emission on theglobal scale even if its use rapidly decreased starting in the 80s (Schwikowski et al.,
6502
ACPD11, 6493–6530, 2011
Seasonal impact ofnatural and
anthropogenicemissions on glacier
J. Gabrieli et al.
Title Page
Abstract Introduction
Conclusions References
Tables Figures
J I
J I
Back Close
Full Screen / Esc
Printer-friendly Version
Interactive Discussion
Discussion
Paper
|D
iscussionP
aper|
Discussion
Paper
|D
iscussionP
aper|
2004). According to the calculated inventories of atmospheric emissions in Italy, in2006 the automobile source represents less than 2% of total Pb fallout while in 1990it accounts for 78%. Secondary sources of Pb are non-ferrous production, chemi-cal industry, steel, bullets and batteries making, coal burning, and refuse incineration(Shotyk et al., 2005). At the present time, the major atmospheric Pb sources are in-5
dustrial combustion processes (80%). Industrial combustion and smelting activitiescontribute 23% and 72% to the Zn emissions and 38% and 19% to the Cd emissions.The main As sources are industrial combustion (83%) and electricity production (9%).For Ni, 60% of the total emissions are related to combustion processes while maritimeactivities contribute up to 36%. Bi is emitted by fossil fuel combustion, refuse inciner-10
ation. Bi compounds are used for manufacturing alloys, solder, metallurgical additives,cosmetics, medicines, and recent new Pb-replacement alloy.
3.1.3 Ionic compounds concentrations and fluxes
The mean concentrations of ionic compounds in snow of Alto dell’Ortles are approxi-mately three orders of magnitude higher than those of the trace elements, with a range15
in means from 19 ng g−1 for K+ to over 377 ng g−1 for NO−3 (Table 1). The mean con-
centrations of SO2−4 and NO−
3 , and NH+4 are 297 ng g−1, 377 ng g−1 and 205 ng g−1,
respectively. These compounds are produced by the atmospheric oxidation of theirprecursor gaseous species, SO2, NOx and NH3, primarily emitted by anthropogenicsources and in particular the combustion of fossil fuels, high-temperature combustions20
and agriculture. In Table 3, the ionic compounds concentrations are compared withthose determined in other Alpine sites. The measured mean concentrations for SO2
4,(163–677 ng g−1 ), NO−
3 (151–1297 ng g−1) and NH+4 (41–259 ng g−1) are within the re-
ported ranges determined in other recent snow and ice samples in the European Alps(Gabrieli et al., 2008, 2010a; Novo and Rossi, 1998; Kuhn et al., 1998; Puxbaum25
and Tscherwenka, 1998).These recent concentrations are higher by several factors(3–10) than those observed in the Colle Gnifetti core in pre-industrial times (before
6503

ACPD11, 6493–6530, 2011
Seasonal impact ofnatural and
anthropogenicemissions on glacier
J. Gabrieli et al.
Title Page
Abstract Introduction
Conclusions References
Tables Figures
J I
J I
Back Close
Full Screen / Esc
Printer-friendly Version
Interactive Discussion
Discussion
Paper
|D
iscussionP
aper|
Discussion
Paper
|D
iscussionP
aper|
1700) (Sigl, 2009). The highest concentrations of ionic compounds are generally ob-served in snow samples from low-medium altitudes (1000–2500 m a.s.l.) in the EasternAlps (Dolomites, Sonnblick, and Careser). This can be explained considering that theDolomites and Careser represent the first geomorphologic barrier that may block thepollutants originating from the heavily populated and industrialized Po Valley (Weiss5
et al., 1999). In addition, these relatively low mountain areas are also affected by theconvective transport of local pollutants from the bottom of the valleys.
The high correlation between Cl− and Na+ (R2 = 0.90, 95% confidence) and theirmean mass ratio (1.43±0.21) is close to the marine ratio of 1.8, demonstrating a preva-lent marine origin of these two ions. The slight Na+ excess could be attributed to10
a minor contribution from crustal sources such as gypsum which is present in regionalclosed-basin lakes. This correlation is in accordance with results from other glaciologi-cal records in the Western Alps (Eichler et al., 2000; Schwikowski et al., 1999; Maupetitand Delmas, 1994) but not consistent with data from winter snow collected in the East-ern Alps at low-medium elevation (Gabrielli et al., 2008). In the Eastern Alpsa slight15
Cl− excess is attributed to a minor anthropogenic HCl contribution. As this excess andrange (5 to 291 ng g−1) is greater than ratios related to sea-salt deposition (Gabrielli etal., 2008). Using Cl− as the marine reference, we calculated the non sea sulfate (NSS)contribution to the total SO2
4 budget as:
[SO2−4 ]NSS = [SO2−
4 ]snow− [Cl−]snow · ([SO2−4 ]marine/[Cl−]marine)20
The marine contribution of SO2−4 is almost negligible, and accounts on average for 6%
of total.The ionic fluxes on Ortles are similar to those observed at Colle Gnifetti,
Careser and Stubai (330–1250 m w.e. yr−1) but much lower than at Col du Dome,Fiescherhorngletscher and Grenzgletscher, where the accumulation is higher25
(∼1400 to ∼2700 mm w.e. yr−1). For example, SO2−4 fluxes range from 220 to
360 mg m−2 yr−1 in sites with accumulation lower than 1250 mm w.e. yr−1 and from 510to 1040 mg m−2 yr−1 in others where the accumulation is higher than 1400 mm w.e. yr−1
6504
ACPD11, 6493–6530, 2011
Seasonal impact ofnatural and
anthropogenicemissions on glacier
J. Gabrieli et al.
Title Page
Abstract Introduction
Conclusions References
Tables Figures
J I
J I
Back Close
Full Screen / Esc
Printer-friendly Version
Interactive Discussion
Discussion
Paper
|D
iscussionP
aper|
Discussion
Paper
|D
iscussionP
aper|
(Table 3). This positive relationship between accumulation and ionic fluxes indicatesthat wet-deposition likely represents the most efficient scavenging process of SO2−
4 inhigh-altitude mountainous areas. The comparison between deposition on Mt. Ortlesand Careser is of particular interest because these two glaciers are only ∼15 km apartfrom each other and, for this reason, are likely to be comparable. The fluxes of NO−
35
(300 to 430 mg m−2 yr−1) and SO2−4 (240 to 360 mg m−2 yr−1) are up to ∼50% greater at
Careser, and for Cl− are up to 6 times greater ranging between 48 to 270 mg m−2 yr−1.This evidence is consistent with the southern position and lower altitude of Careserand the consequent major impact of pollutants and sea-salt transport from the south.
However, Ca2+ flux is one order of magnitude lower at Careser than Ortles. This de-10
crease indicates a significantly lower deposition of carbonate dust on Careser as Ca2+
is the prevailing crustal ion in the snowpack from the mountain areas dominated bycarbonate-rich bedrock. The detected fluxes are consistent with the geological char-acteristics of these two sites. The area near Careser is characterized by metamorphicrocks (mica-schist, gneiss, granites), while the Ortles group is comprised of sedimen-15
tary rocks including dolomite and black-banded limestone. This flux difference is con-sistent with the literature, where measured Ca2+ concentrations in Eastern Alpine win-ter snow differ between limestone (300–600 ng g−1) and metamorphic (80–220 ng g−1)bedrock (Gabrielli et al., 2008).
Very few Total Organic Carbon (TOC) data in snow and ice from high altitude Alpine20
sites are presented in the literature. In an ice core from Colle Gnifetti, the TOC con-centrations increased from 66 to over 614 ng g−1 in the time period between 1890and 1975 (Lavanchy et al., 1999). TOC concentrations in the Ortles samples rangefrom 180 to 1620 ng g−1, with a median value of 310 ng g−1 and a median TOC flux of245 mg m−2 yr−1.25
6505
ACPD11, 6493–6530, 2011
Seasonal impact ofnatural and
anthropogenicemissions on glacier
J. Gabrieli et al.
Title Page
Abstract Introduction
Conclusions References
Tables Figures
J I
J I
Back Close
Full Screen / Esc
Printer-friendly Version
Interactive Discussion
Discussion
Paper
|D
iscussionP
aper|
Discussion
Paper
|D
iscussionP
aper|
3.2 Stratigraphic and glaciological observations
Two main density transitions were detected at 240±30 cm and 360±30 cm of depthfrom twelve snow depth soundings carried out on the upper part of the Glacier Altodell’Ortles. A comparison of the physical and chemical profiles sampled in the snowpit is reported in Fig. 2. The vertical variations in grain shape and size, snow density5
and hardness index are compared to the vertical profiles of δ18O and NH+4 . The up-
per 60 cm of the snowpack are characterized by medium-size rounded particles, withthe presence of partially decomposed precipitation particles. The snow density rangedfrom 270 to 310 kg m−3, and the hardness index is approximately 250 N. These featuresare consistent with recently deposited dry snow subjected to destructive metamorphic10
processes. A visible weak dust horizon above a melt-freeze crust was recorded at60 cm. This layer represents the first clear stratigraphic discontinuity that differentiatesthe recent 2009 spring snow from the 2008/2009 winter snow. From 60 to 270 cm, thedensity increased from 300 kg m−3 to 400–440 kg m−3, and the hardness to from 250 Nto 1000–1500 N. In the layers between 60 to 90 cm, medium size rounded particles15
(0.8 mm), faceted rounded particles and solid faceted particles were recovered, indi-cating kinetic growth processes triggered by temperature gradients. From 90 to 140 cm,a succession of small/medium size (0.2–1.0 mm) rounded particles layers and thin icelenses formations(< 10 mm) were visible. Considering that no evidence of winter melt-ing was found, the origin of these mm-scale ice lenses is probably due to wind activity,20
which is particularly intense on the Alto dell’Ortles glacier during winter. The dust layerat 130 cm is probably due to a weak Saharan deposition occurring on the 1 and 2 April2009. This deposition can be inferred by considering the back-trajectories from Altodell’Ortles glacier (see Sect. 3.5) and the Saharan event recorded at the Jungfrau-joch (Collaud Coen et al., 2004) high alpine research station (2580 m a.s.l.; 46◦33′ N,25
07◦59′ E; Collaud Coen, personal communication). From 140 to 270, the snow layerswere characterized by large rounding-faceted crystals (1.5–3.0 mm), which are indica-tive of growth regime transition forms typical of the cold and dry snowpack.
6506

ACPD11, 6493–6530, 2011
Seasonal impact ofnatural and
anthropogenicemissions on glacier
J. Gabrieli et al.
Title Page
Abstract Introduction
Conclusions References
Tables Figures
J I
J I
Back Close
Full Screen / Esc
Printer-friendly Version
Interactive Discussion
Discussion
Paper
|D
iscussionP
aper|
Discussion
Paper
|D
iscussionP
aper|
The second strong stratigraphic discontinuity is constituted by the thick ice lens(about 5 cm) at 280 cm. Below this discontinuity, all of the crystals that are charac-teristic of a dry-snowpack disappear and melt forms were observed. The density andthe hardness index progressively increased up to 450–500 kg m−3 and 2000–2500 N,respectively. The grain shape was dominated by melt forms and, in particular, by large5
rounded polycrystals (3.0–3.5 mm) which are generally produced by sequential melt-freeze cycles in low water content conditions such as a pendular regime. Since theparticle size of the polycrystals increases as a function of the number of melt-freezecycles, these layers can be formed only during the summer ablation period at the highelevation of the Alto dell’Ortles glacier. The discontinuity at 275 cm likely represents10
the transition between the 2009 and the 2008 snow.Solid faceted particles were foundabove a thick melt-freeze crust at 60–65 cm and above the thick ice lens at 280 cm.This kinetic-growth form appears when the rounded particles are subjected to a largeincreasing vertical temperature gradient in the snow. This suggests that ice and melt-freeze layers act as an effective physical barrier, able to influence the small-scale ther-15
mal regime and, perhaps, the meltwater percolation and wet/dry migration processesof both particulate and soluble trace species trapped in the snow. At 395 cm we ob-served a dust layer in correspondence with a thick ice lens (2.0 cm) while the layersfrom 395 to 450 cm (the base of the snow-pit) were characterized by large roundedpolycrystals. This thick ice lens and associated dust layer could indicate the transition20
between the 2007/2008 snow but, since no other information could be inferred from thestratigraphy, is instead corroborated by additional chemical evidence (e.g. high Cu andCd concentrations, see below).
The δ18O profile which can be used as proxy of air temperature during precipitationconfirms the seasonal reconstruction inferred from the snow-pit stratigraphy, showing25
higher values during warm periods (between 0–60 and 260–345 cm) and lower duringcold periods (between 60–260 and 345–400 cm). We also verify a correspondencebetween the highest δ18O values and peaks in NH+
4 , which is an anthropogenic com-ponent that is mostly deposited in the summer (Gabrielli et al., 2010). The chemical
6507
ACPD11, 6493–6530, 2011
Seasonal impact ofnatural and
anthropogenicemissions on glacier
J. Gabrieli et al.
Title Page
Abstract Introduction
Conclusions References
Tables Figures
J I
J I
Back Close
Full Screen / Esc
Printer-friendly Version
Interactive Discussion
Discussion
Paper
|D
iscussionP
aper|
Discussion
Paper
|D
iscussionP
aper|
signature of the 2008/2007 snow transition appears less evident, and may be due to thesmoothing effect of meltwater percolation during the 2007 and 2008 summers. A vis-ible dust layer and a corresponding slight increase in NH+
4 were observed at 395 cmconcentrations was recorded, perhaps suggesting the presence of the 2007 summerlayer below 390–400 cm. The seasonal δ18O pattern is complicated and variations5
may be due to water percolation between the layers more than the advection historyof the wet air masses that deliver precipitation. In summary, the results of the snow-soundings and the physical and chemical stratigraphic observations indicate that thetransitions between the 2009/2008 and the 2008/2007 snow were at about 280 and385 cm, respectively.10
3.3 Principal Component Analysis (PCA)
A PCA has been applied to the entire dataset, of 82 snow samples where each samplewas analyzed for 22 trace elements, 8 major ions, δ18O and TOC to evaluate the ag-gregation between variables in light of different trace species provenance and sources.PCA is an statistical method in which linear combinations of the original variables are15
created that characterize maximum possible variance in the data (Scott et al., 2000).The PCA is a multivariate statistical technique often used for explore large and awk-ward datasets, and here this method has been applied to confirm the stratigraphicobservations.
Figure 3 shows the biplot graph which represents both the variables (vectors) and the20
cases (points) distribution. The first four principal components account for more than80% of the total variance in the dataset. The first component (PC1) which accounts for57% of the total variance has comparable negative loadings for all the trace elementsand major ions. The second PCA component (PC2) accounts for 12% of the totalvariance and has positive loadings for Mg2+, Ca2+, Li, Rb, Sr, Ba, Al, Ti, Fe, Ga, Mn,25
Co, U and negative loadings for δ18O, TOC, NO−3 , SO2−
4 , Cl−, Na+, NH+4 , As, Cd,
Sb, Pb, Bi, V, Ni, Cu, Zn, and therefore separates crustal materials from anthropicand marine variables.. Cr, Tl and K+ are not discriminated by PC2 indicating that
6508

ACPD11, 6493–6530, 2011
Seasonal impact ofnatural and
anthropogenicemissions on glacier
J. Gabrieli et al.
Title Page
Abstract Introduction
Conclusions References
Tables Figures
J I
J I
Back Close
Full Screen / Esc
Printer-friendly Version
Interactive Discussion
Discussion
Paper
|D
iscussionP
aper|
Discussion
Paper
|D
iscussionP
aper|
the sources of these elements are various. In particular, the K+ depositions may notonly be linked to marine sources but also with terrestrial emissions, such as biomassburning (Simoneit, 2002).
The association between δ18O and anthropogenic species indicates the predomi-nant seasonal pattern of the anthropogenic pollutant deposition. In contrast, the crustal5
element inputs do not appear to be seasonally dependent. All of the samples character-ized by negative scores in the PC2 correspond to summer layers, as inferred from thestratigraphic analysis. Interestingly, this seasonal separation is extremely well definedexcept for a few samples (summer samples at 55, 60, 260 and 305 cm and a wintersample at 120 cm).10
Despite having different sources, the concentrations of Cl− and Na+ the two majorproxies of sea-salt, and anthropogenic species are well correlated indicating a similarorigin area or transport pathway. This correlation is in contrast with results from anice-core from the Grenzgletscher glacier (Eichler et al., 2004), where sea-salt relatedspecies correlated with crustal dust elements. We suggest that the origin of the sea-15
salt aerosol deposited on the Eastern Alps is either the Adriatic Sea or it is injected intothe air masses during the transport over the Po Valley, whereas in Western Alps thesea-salt aerosol mainly arrives from the southwest.
3.4 Seasonality of the chemical variables
Profiles of selected ionic compounds and trace elements are reported in Fig. 4a and20
b. The δ18O record shows a well defined seasonal pattern, with maximum values ofup to −5.8‰ (summer) and minimum values of −24.1‰ (winter), which are typicalvalues for Alpine precipitation at high altitude sites (Schotterer et al., 1997). All of theanthropogenic ions (NO−
3 , NH+4 , SO2−
4 ) show a pronounced seasonal pattern with lowwinter concentrations which increase in spring and peak in summer. NO−
3 and NH+425
show the most pronounced seasonality with summer to winter mean concentrationsratios of 4.2 and 5.3, respectively. For SO2−
4 , the summer to winter ratio is 3.6 while the
6509
ACPD11, 6493–6530, 2011
Seasonal impact ofnatural and
anthropogenicemissions on glacier
J. Gabrieli et al.
Title Page
Abstract Introduction
Conclusions References
Tables Figures
J I
J I
Back Close
Full Screen / Esc
Printer-friendly Version
Interactive Discussion
Discussion
Paper
|D
iscussionP
aper|
Discussion
Paper
|D
iscussionP
aper|
sea salt contribution to SO2−4 does not show any evident seasonal variation but always
accounts for 10–20% of the total.The seasonal variations of K+, Mg2+ and Ca2+ are less pronounced, demonstrating
a quite constant deposition of crustal elements. Concentrations of the marine speciesCl− and Na+ follow a seasonal pattern comparable to those of NH+
4 and other anthro-5
pogenic species, except for a few large isolated peaks in winter. The Cl−/Na+ ratio fluc-tuates around the mean value of 1.4, close to the average sea salt value of 1.8, exceptin the snow pit section from 320 to 340 cm of depth, where this is ranging between 2.4and 3.0. According to the stratigraphy (Sect. 3.2), this layer is characterized by largerounded polycrystals (3.5 mm) produced as a consequence of subsequent melt-freeze10
cycles. The ionic compounds are leached from snow during melt post-depositional pro-cess with different efficiencies on the base of the atomic characteristics of the ions andtheir interaction with the ice crystal lattice. For instance, the elution sequence derivedboth from laboratory and field experiments demonstrate that Cl− is well preserved whileSO2−
4 and Na+ are strongly affected by meltwater (Eichler et al., 2001). The TOC profile15
records the highest concentrations from the surface to a depth 65 cm, correspondingto the beginning of the 2009 warm season, while displaying few seasonal variations inthe deeper sections of the snow pit. This behavior suggests a more efficient leachingby meltwater percolation than that of NH+
4 and other anthropogenic compounds.The EFc profiles of Cd, Sb, Zn, Cu and Pb correlate with each other where their20
respective concentrations peak in tandem (Fig. 4b). The largest mean EFc seasonalvariations for trace elements are displayed by V (by a factor of 3.8), Sb (3.3), Cu (3.3),Pb (2.9), Bi (2.8), Cd (2.1), Zn (1.9), Ni (1.8), Ag (1.8), As (1.7) and Co (1.6). Forelements which are most likely anthropogenic, EFc values increase during summerperiods by factors of 1.3 (Tl) to 3.8 (Cu) but, even during the winter season, their25
values remain largely higher than 10, indicating a predominant anthropogenic origin.As reported for the terrigenous ions K+, Mg2+ and Ca2+ the crustal trace elementsalso demonstrate limited EFc seasonal variations, ranging from factors of 1.0 (Ti, Be,Li, Al, Sr) to 1.4 (Ba, Rb, U). This diminished seasonality confirms that although the
6510
ACPD11, 6493–6530, 2011
Seasonal impact ofnatural and
anthropogenicemissions on glacier
J. Gabrieli et al.
Title Page
Abstract Introduction
Conclusions References
Tables Figures
J I
J I
Back Close
Full Screen / Esc
Printer-friendly Version
Interactive Discussion
Discussion
Paper
|D
iscussionP
aper|
Discussion
Paper
|D
iscussionP
aper|
magnitude of the crustal inputs is influenced by different sources, seasonal transportand deposition processes, the main anthropogenic and natural sources are commonduring all the seasons.
3.5 Meteorological and atmospheric conditions
In order to explain the observed differences in the seasonal deposition of trace species5
to the Alto dell’Ortles glacier we have investigated the atmospheric pathways fromthe source regions to the study area. We computed the daily back-trajectories fromAlto dell’Ortles glacier (at 3850 m a.s.l.) from 2007 to 2009, using the Hybird Single-Particle Lagrangian Integrated Trajectory Model (HYSPLIT 4.8), provided by the Na-tional Oceanic and Atmospheric Administration (NOAA), which is a tool to simulate air10
particles transport and deposition (Draxler and Rolph, 2010; Draxler, 2003). We usedthe global dataset archive (GDA) containing 29 meteorological single level variables(at the surface) and 6 upper levels variables (for a total of 23 vertical levels from 1000to 20 hPa) to calculate 48-h back-trajectories. For each day, we preformed two modelruns at 00:00 and 12:00 UTM. The model results are summarized in Fig. 5. Air masses15
from western quadrants (from SW to NW) represent more than 84% of the total duringsummer (JJA), and 63–73% in the other seasons. Northern trajectories (NW to NE) arelarger in autumn (SON), and fewer in winter (DJF), representing 28% and 14% of thewind sources, respectively. Southern air masses (SE to SW) characterize the 32% ofspring winds (MAM), 27% in autumn and about 21% in winter and summer. The longest20
48 h trajectories originate from the west and cover a mean distance of 2450 km, whilethe trajectories from the northern, southern and eastern quadrants are shorter (1710,1310 and 1220 km, respectively). These trajectories are generally longer in DJF andSON than in MAM and JJA. In DJF the mean trajectories lengths from W and SE are1270 and 3050 km, respectively, while in JJA they are 705 and 1955 km (about 40%25
shorter). The back-trajectories containing a predominant ascending behavior, whichare often associated to cyclonic fields, are more frequent in JJA where they comprise65% of the total and comprise 55% of the trajectories for all the other periods of the
6511
ACPD11, 6493–6530, 2011
Seasonal impact ofnatural and
anthropogenicemissions on glacier
J. Gabrieli et al.
Title Page
Abstract Introduction
Conclusions References
Tables Figures
J I
J I
Back Close
Full Screen / Esc
Printer-friendly Version
Interactive Discussion
Discussion
Paper
|D
iscussionP
aper|
Discussion
Paper
|D
iscussionP
aper|
year. Ascending air masses originate generally from the south and southeast (64–85%of the total) but in JJA ascending air mass trajectories from the east represent morethan 80% of total eastern fluxes.
Despite the significant seasonal differences in the origin and behavior of air masses,as inferred from the evaluation of 48-h back-trajectories, these origins hardly explain5
the large changes in concentrations that are observed in the snow pit chemical pro-files. In fact, a fundamental parameter that has to be taken into account to explainthe seasonal variation in concentrations is the vertical structure of the troposphereat a regional scale. In winter, the Alto dell’Ortles glacier lies within the free tropo-sphere because the vertical motions are inhibited by low-altitude thermal inversions10
with very stable atmospheric stratifications (Kappenberger and Kerkmann, 1997). InFig. 6, we summarize the averaged monthly variations in the maximum boundary layerdepth (BLD), at the meteorological station of Milano-Linate Airport (∼100 km SW of Mt.Ortles), obtained by analyzing the daily balloon data over 2007–2009. The BLD wasdeduced by analyzing the thermal profiles inferred from balloon launches (every day at15
00:00 and 12:00 UTM and, in case of particularly unstable meteorological conditions,also at 06:00, 09:00, 15:00, 18:00 and 21:00 UTM), and by identifying the daily max-imum altitude of the thermal inversion. The balloon data are available at the Univer-sity of Wyoming website: http://weather.uwyo.edu/upperair/europe.html. We choosethe Milano-Linate station because it is indicative of the tropospheric vertical structure20
of the Po Valley, the main anthropogenic area which affects the air quality over Alps(Seibert et al., 1998). The maximum daily boundary layer depth is much higher duringsummer than winter due to stronger insolation that enables more effective convection.In December and January, during only 15–20% of the days the boundary layer depth ishigher than 2000 m while during 52–57% of the days a very stable layer below 500 m25
caps the well-mixed boundary layer below 500 m. In these conditions, the pollutantsemitted at the bottom of the valley cannot be lifted by thermal convection and are con-fined in a relatively small volume. During the spring, the BLD rises rapidly and, fromApril to September, the maximum daily BLD was higher than 2000 m a.s.l. and remains
6512
ACPD11, 6493–6530, 2011
Seasonal impact ofnatural and
anthropogenicemissions on glacier
J. Gabrieli et al.
Title Page
Abstract Introduction
Conclusions References
Tables Figures
J I
J I
Back Close
Full Screen / Esc
Printer-friendly Version
Interactive Discussion
Discussion
Paper
|D
iscussionP
aper|
Discussion
Paper
|D
iscussionP
aper|
at this elevation for ∼ 70% of the days. With this rapid rise in the BLD, pollutants arelifted by a synoptically influenced flow, or directly injected to the free troposphere andthen transported horizontally by the synoptic flow and then are able to move acrossEurope.
Figure 8 summarizes the averaged monthly stability situations during the period5
2007/2009, according to the Pasquill classification (Pasquill, 1961) at the Milan Linateairport and over the Alto dell’Ortles glacier. This stability is estimated by using themeteorological data (GDA meteorological archive) from the open-source READY sys-tem (Real-Time Environmental Applications and Display sYstem), provided by the AirResources Laboratory of NOAA. In Milan about 60–80% of the days from October to10
February are characterized by stable or neutral atmospheric conditions, with 17–38%of days characterized by slightly unstable conditions and only 2–4% by moderately andextremely unstable conditions. From March to September, unstable meteorologicalsituations dominate, representing 70–80% of the total. At the Alto dell’Ortles glacier,stable meteorological conditions are rare when compared to Milan. In general we note15
a higher frequency of moderately and extremely unstable conditions during the entireyear with a particular increase from October to February when unstable conditionspredominate for about 20–25% of the total compared with only 2–4% of the time atMilan. From March to June even slightly stable situations are completely absent whileneutral conditions account for only 12–16% of the total days. In July, moderately and20
extremely unstable conditions represent more than 74% while 26% of the days areslightly unstable.
The pollutants emitted from the heavily industrialized and populated Po Valley dur-ing the winter season are thus trapped by the very stable low-altitude boundary layerproduced by the strong thermal inversion which therefore limits transfer to the free tro-25
posphere. Low velocity vertical winds are often not sufficient to penetrate the bound-ary layer and to lift polluted air from the lower to the upper tropospheric levels. Forthis reason during winter when the Alto dell’Ortles glacier almost permanently liesabove the boundary layer altitude, is likely uninfluenced by local/regional anthropogenic
6513

ACPD11, 6493–6530, 2011
Seasonal impact ofnatural and
anthropogenicemissions on glacier
J. Gabrieli et al.
Title Page
Abstract Introduction
Conclusions References
Tables Figures
J I
J I
Back Close
Full Screen / Esc
Printer-friendly Version
Interactive Discussion
Discussion
Paper
|D
iscussionP
aper|
Discussion
Paper
|D
iscussionP
aper|
emissions produced in the Southwestern Po Valley. The winter western atmosphericfluxes and depositions to the Alto dell’Ortles glacier likely represent continental air qual-ity background conditions at similar elevations, except during the rare unstable wintermeteorological conditions such as Foehn events. The Alpine Foehn, is a rain shadowwind which results from the subsequent adiabatic warming of air which has released5
most of its moisture on windward slope. The geographical position and altitude ofMt. Ortles suggests that it is directly affected by the northern upslope wind which caneffectively transport pollutants from the bottom valley areas of Austria and SouthernGermany.
During the rest of the year, the meteorology is characterized by vertical exchanges10
between the low level and free troposphere, allowing the mass transfer from local (ValVenosta in the north and Val di Sole in the south) and regional sources (Po Valley) tohigh elevations. Pollutants from the Po Valley are transferred vertically to the injectionlayer and then dragged by synoptically influenced flows to the Alpine barrier where theyare effectively lifted by upslope winds triggered during the daytime by the solar radia-15
tion. These vertical motions often produce shallow cumulus clouds above the crestsand linked small-scale convective precipitation allows wet deposition of transportedpollutants and trace species.
4 Conclusions
This work provides an initial insight into the occurrence of numerous trace elements20
and major ions in fresh snow from Alto dell’Ortles, the highest glacier in the EasternAlps. The fluxes of Ba, Mn, Fe and Al are 50–75% lower with respect those on ColleGnifetti during the last 50 years providing evidence for relatively low recent crustaldust deposition on Mt. Ortles. The ionic fluxes to Mt. Ortles are similar to those toColle Gnifetti, Careser and Stubai but much lower than to Col du Dome, Fiescherhorn-25
gletscher and Grenzgletscher. The PCA applied to the entire dataset provides a clearseparation between trace species originated from crustal, (Mg, Ca, Li, Rb, Sr, Ba, Al,
6514
ACPD11, 6493–6530, 2011
Seasonal impact ofnatural and
anthropogenicemissions on glacier
J. Gabrieli et al.
Title Page
Abstract Introduction
Conclusions References
Tables Figures
J I
J I
Back Close
Full Screen / Esc
Printer-friendly Version
Interactive Discussion
Discussion
Paper
|D
iscussionP
aper|
Discussion
Paper
|D
iscussionP
aper|
Ti, Fe, Ga, Mn, Co, U), anthropogenic (Organic Carbon, NO−3 , SO2−
4 , NH+4 , As, Cd,
Sb, Pb, Bi, V, Ni, Cu, Zn) and marine sources (Cl−, Na+). In addition, a pronouncedseasonality in deposition is apparent. Summer snow appears more affected by anthro-pogenic and marine contributions while the aerosol flux is dominated by crustal andterrigenous sources during the winter. All anthropogenic ions (NH+
4 , NO−3 , SO2−
4 ) and5
trace elements (Cd, Sb, Zn, Cu, Pb) demonstrate a pronounced seasonal pattern, withlow winter concentrations that increase in spring and peak in summer. Stable oxygenisotopes (δ18O) also demonstrate a defined seasonal pattern. The origin and behaviorof air, as inferred from the evaluation of 48 h back-trajectories, show significant sea-sonal differences. However, the large seasonal changes in major and trace element10
concentrations seem to be more related to the vertical structure of the troposphere ata regional scale rather than the synoptic weather patterns.
Acknowledgements. This work is a contribution to the Ortles project, a program supported bythe Fire protection and civil division of the Autonomous Province of Bolzano (Michela Munari)in collaboration with the Forest division of the Autonomous Province of Bolzano (Paul Pro-15
fanter, Barbara Folie) and the National Park of Stelvio (Wolfgang Platter). This is the Ortlesproject publication 2. For the field operations we thank: Volkmar Mair, (Geologic Office ofthe Autonomous Province of Bolzano), Reinhard Pinggera (Forest Division of the AutonomousProvince of Bolzano) Philipp Rastner (EURAC), Karl Krainer (University of Innsbruck) Paul Val-lelonga (Niels Bohr Institute, Copenhagen), Matteo Cattadori (Museo Tridentino di Scienze Nat-20
urali) and Toni Stocker (Alpine Guides of Solda). We also thank Anselmo Cagnati and AndreaCrepaz (Arabba Avalanche Centre, ARPAV), for the useful comments about the stratigraphicobservations. We are also grateful to Ping-Nan Lin (Byrd Polar Research Center, The OhioState University) for the stable isotopes analyses. Finally, the authors gratefully acknowledgethe NOAA Air Resources Laboratory (ARL) for the provision of the HYSPLIT transport and25
dispersion model and READY website (http://www.arl.noaa.gov/ready.php) used in this publi-cation.
6515
ACPD11, 6493–6530, 2011
Seasonal impact ofnatural and
anthropogenicemissions on glacier
J. Gabrieli et al.
Title Page
Abstract Introduction
Conclusions References
Tables Figures
J I
J I
Back Close
Full Screen / Esc
Printer-friendly Version
Interactive Discussion
Discussion
Paper
|D
iscussionP
aper|
Discussion
Paper
|D
iscussionP
aper|
References
Barbante, C., Van de Velde, K., Cozzi, G., Capodaglio, G., Cescon, P., Planchon, F., Hong, S.,Ferrari, C., and Boutron, C.: Post-world war II uranium changes in dated Mont Blanc ice andsnow, Environ. Sci. Technol., 35, 4026–4030, 2001.
Barbante, C., Schwikowski, M., Doring, T., Gaggeler, H. W., Schotterer, U., Tobler, L., Van5
de Velde, K., Ferrari, C., Cozzi, G., Turetta, A., Rosman, K., Bolshov, M., Capodaglio, G.,Cescon, P., and Boutron, C.: Historical record of European emissions of heavy metals to theatmosphere since the 1650s from Alpine snow/ice cores drilled near Monte Rosa, Environ.Sci. Technol., 38, 4085–4090, 2004.
Barbante, C., Gabrieli, J., Gabrielli, P., Vallelonga, P., Cozzi, G., Turetta, C., Hong, S., Ros-10
man, K., Boutron, C., and Cescon, P.: A historical record of heavy metal pollution in Alpinesnow and ice, in: Persistent Pollution – Past, Present, Future, edited by: Quante, M., Ebin-gaus, R., and Floser, G., Springer Verlag, Berlin, 2009.
Baroni, C. and Orombelli, G.: The Alpine “Iceman” and the Holocene climate change, Quater-nary Res., 46, 78–83, 1996.15
Bolius, D.: Paleo climate reconstruction based on ice cores from the Andes and the Alps, PhDthesis, Universitat Bern, Switzerland, 2006.
Cagnati, A. (Ed.): Strumenti di misura e metodi di osservazione nivometeorologici, AINEVA,Trento (Italy), 2003.
Collaud Coen, M., Weingartner, E., Schaub, D., Hueglin, C., Corrigan, C., Henning, S.,20
Schwikowski, M., and Baltensperger, U.: Saharan dust events at the Jungfraujoch: detec-tion by wavelength dependence of the single scattering albedo and first climatology analysis,Atmos. Chem. Phys., 4, 2465–2480, doi:10.5194/acp-4-2465-2004, 2004.
Davis, B. A. S., Brewer, S., Stevenson, A. C., Guiot, J., Data Contributors: The temperature ofEurope during the Holocene reconstructed from pollen data, Quat. Sci. Rev., 22, 1701–1716,25
2003.Desio, A. (Ed.): I ghiacciai del Gruppo Ortles-Cevedale, Comitato Glaciologico Italiano, Torino,
Italy, 1967.Doescher, A., Gaggeler, H., Schotterer, U., and Schwikowski, M.: A 130 years deposition record
of sulfate, nitrate and chloride from a high-altitude glacier, Water Air Soil Poll., 85, 603–609,30
1995.Draxler, R. R.: Evaluation of an ensemble dispersion model, J. Appl. Meteorol., 42, 308–317,
6516
ACPD11, 6493–6530, 2011
Seasonal impact ofnatural and
anthropogenicemissions on glacier
J. Gabrieli et al.
Title Page
Abstract Introduction
Conclusions References
Tables Figures
J I
J I
Back Close
Full Screen / Esc
Printer-friendly Version
Interactive Discussion
Discussion
Paper
|D
iscussionP
aper|
Discussion
Paper
|D
iscussionP
aper|
2003.Draxler, R. R. and Rolph, G. D. (Eds.): HYSPLIT (HYbrid Single-Particle Lagrangian Integrated
Trajectory) Model access via NOAA ARL READY, NOAA Air Resources Laboratory, SilverSpring, MD, available at: http://ready.arl.noaa.gov/HTSPLIT.php, 2010.
Eichler, A., Schwikowski, M., and Gaggeler, H.: An Alpine ice-core record of anthropogenic HF5
and HCl emissions, Geophys. Res. Lett., 27, 3225–3228, 2000.Eichler, A., Schwikowski, M., and Gaggeler, H.: Meltwater-induced relocation of chemical
species in Alpine firn, Tellus, 53, 192–203, 2001.Eichler, A., Schwikowski, M., Furger, M., Schotterer, U., and Gaggeler, H. W.: Sources and
distribution of trace species in Alpine precipitation inferred from two 60-year ice core paleo-10
records, Atmos. Chem. Phys. Discuss., 4, 71–108, doi:10.5194/acpd-4-71-2004, 2004.Fierz, C., Armstrong, R. L., Durand, Y., Etchevers, P., Greene, E., McClung, D. M.,
Nishimura, K., Satyawali, P. K., and Sokratov, S. A. (Eds.): The international classificationfor seasonal snow on the ground, IHP-VII technical documents in hydrology No. 83, IACSContribution No. 1, UNESCO-IHP, Paris, France, 2009.15
Frei, C. and Schar, C.: A precipitation climatology of the Alps from high-resolution rain-gaugeobservations, Int. J. Climatol., 18, 873–900, 1998.
Gabrieli, J.: Trace elements and polycyclic aromatic hydrocarbons (PAHs) in snow and icesampled at Colle gnifetti, Monte Rosa (4450 m), during the past 10 000 years: environmentaland climatic implications, PhD thesis, University Ca’ Foscari of Venice, Italy, 2008.20
Gabrieli, J., Decet, F., Luchetta, A., Valt, M., Barbante, C., and Pastore, P.: Occurence of PAHsin seasonal snowpack of Eastern Italian Alps, Environ. Pollut., 158, 3130–3137, 2010a.
Gabrieli, J., Vallelonga, P., Cairns, W., Cozzi, G., Spolaor, A., Sigl, M., Schwikowski, M.,Boutron, C. F., and Barbante, C.: A new melting system for high resolution trace elementsdetermination in alpine firn and ice cores, in preparation, 2010b.25
Gabrielli, P., Cozzi, G., Torcini, S., Cescon, P., and Barbante, C.: Trace elements in wintersnow of the Dolomites (Italy): a statistical study of natural and anthropogenic contributions,Chemosphere, 72, 1504–1509, 2008.
Gabrielli, P., Carturan, L., Gabrieli, J., Dinale, R., Krainer, K., Helmut, H., Davis, M., Zagar-odnov, V., Seppi, R., Barbante, C., Dalla Fontana, G., and Thompson, L. G.: Atmospheric30
warming threatens the untapped glacial archive of Mt. Ortles, South Tyrol, J. Glaciol., 56,843–853, 2010.
Hong, S., Lee, K., Hou, S., Hur, S. D., Ren, J., Burn, L. J., Rosman, K. J. R., Barbante, C.,
6517

ACPD11, 6493–6530, 2011
Seasonal impact ofnatural and
anthropogenicemissions on glacier
J. Gabrieli et al.
Title Page
Abstract Introduction
Conclusions References
Tables Figures
J I
J I
Back Close
Full Screen / Esc
Printer-friendly Version
Interactive Discussion
Discussion
Paper
|D
iscussionP
aper|
Discussion
Paper
|D
iscussionP
aper|
and Boutron, C. F.: An 800-year record of atmospheric As, Mo, Sn, and Sb in Central Asia inhigh-altitude ice cores from Mt. Qomolangma (Everest), Himalayas, Environ. Sci. Technol.,43, 8060–8065, 2009.
Jenk, T. M., Szidat, S., Bolius, D., Sigl, M., Gaggeler, H. W., Wacker, L., Ruff, M., Barbante, C.,Boutron, C. F., and Schwikowski, M.: A novel radiocarbon dating technique applied to an5
ice core from the Alps indicating late Pleistocene ages, J. Geophys. Res., 114, D14305,doi:10.1029/2009JD011860, 2009.
Kappenberger, G. and Kerkmann, J. (Eds.): Il Tempo in Montagna, Manuale di MeteorologiaAlpina, Zanichelli, Bologna, Italy, 1997.
Kaspari, S., Mayewski, P. A., Handley, M. J., Osterberg, E. C., Kang, S., Hou, S., and10
Qin, D.: Recent increase in atmospheric concentrations of Bi, U, Cs, Ca and S froma 350-year Mt. Everest ice core record, J. Geophys. Res., 114, D04302.1–D04302.14,doi:10.1029/2008JD011088, 2009.
Kuhn, M., Haslhofer, J., Nickus, U., and Schellander, H.: Seasonal development of ion concen-tration in a high alpine snow pack, Atmos. Environ., 32, 4041–4051, 1998.15
Lavanchy, V. M. H., Gaggeler, H. W., Schotterer, U., Schwikowski, M., and Baltensperger, U.:Historical record of carbonaceous particle concentrations from a European high-alpineglacier (Colle Gnifetti, Switzerland), J. Aerosol Sci., 30, S611–S612, 1999.
Maupetit, F. and Delmas, R. J.: Snow chemistry of high altitude glaciers in the French Alps,Tellus B, 46, 304–324, 1994.20
McConnell, J. R., Lamorey, G. W., and Hutterli, M.: A 250-year high-resolution record of Pb fluxand crustal enrichment in central Greenland, Geophys. Res. Lett., 29, 2130–2133, 2002.
Novo, A. and Rossi, G. C.: A four-year record (1990–94) of snow chemistry at two Glacier fieldsin the Italian Alps (Careser, 3090 m; Colle Vincent, 4086 m), Atmos. Environ., 32, 4061–4073,1998.25
Pacyna, J. M. and Pacyna, E. G.: An assesment of global and regional emissions of tracemetals to the atmosphere from anthropogenic sources worldwide, Environ. Rev., 9, 269–298, 2001.
Pasquill, F.: The estimation of the dispersion of windborne material, Meteorol. Mag., 90, 33–49,1961.30
Planchon, F., Van de Velde, K., Rosman, K. J. R., Wolf, C. F., Ferrari, C., and Boutron, C. F.:One houndred fifty-year record of lead isotopes in Antartic snow from Coats Land, Geochim.Cosmochim. Ac., 67, 693–708, 2003.
6518

ACPD11, 6493–6530, 2011
Seasonal impact ofnatural and
anthropogenicemissions on glacier
J. Gabrieli et al.
Title Page
Abstract Introduction
Conclusions References
Tables Figures
J I
J I
Back Close
Full Screen / Esc
Printer-friendly Version
Interactive Discussion
Discussion
Paper
|D
iscussionP
aper|
Discussion
Paper
|D
iscussionP
aper|
Preunkert, S., Wagenbach, D., Legrand, M., and Vincent, C.: Col du Dome (Mt. Blanc massif,French Alps) suitability for ice core studies in relation with past atmospheric chemistry overEurope, Tellus, 52, 993–1012, 1999.
Puxbaum, H. and Tscherwenka, W.: Relationships of major ions in snow fall and rime atsonnblick observatory (SBO, 3106 m) and implications for scavenging processes in mixed5
clouds, Atmos. Environ., 32, 4011–4020, 1998.Schotterer, U., Frohlich, K., Gaggeler, H. W., Sandjordj, S., and Stichler, W.: Isotopes records
from Mongolian and Alpine ice cores as climate indicators, Climatic Change, 36, 519–530,1997.
Schwarb, M.: The Alpine precipitation climate. Evaluation of a high-resolution analysis scheme10
using comprehensive rain-gauce data, PhD thesis, Naturwissenschaften ETH Zurich, 2000.Schwikowski, M.: Reconstruction of European air pollution from Alpine ice cores, in: Earth
Paleoenvironments: Records Preserved in Mid- and Low-Latitude Glaciers, edited by: Ce-cil, D. L., Green, J. R., and Thompson, L. G., Kluwer Academic Publisher, Dordrecht, Nether-lands, 95–119, 2004.15
Schwikowski, M., Doscher, A., Gaggeler, H., and Schotterer, U.: Anthropogenic versus naturalsources of atmospheric sulphate from an Alpine ice core, Tellus B, 51, 938–951, 1999.
Schwikowski, M., Barbante, C., Doering, T., Gaeggeler, H. W., Boutron, C., Schotterer, U.,Tobler, L., Van de Velde, K., Ferrari, C., Cozzi, G., Rosman, K., and Cescon, P.: Post-17th-century changes of European lead emissions recorded in High-Altitude Alpine snow and ice,20
Environ. Sci. Technol., 38, 957–964, 2004.Scott, A. and Clarke, R.: Multivariate Techniques, edited by: Clark, T., John Wiley and Sons,
New York, 2000.Seibert, P., Kromp-Kolb, H., Kasper, A., Kalina, M., Puxbaum, H., Jost, D. T., Schwikowski, M.,
and Baltensperger, U.: Transport of polluted boundary layer air from the Po Valley to high-25
alpine sites, Atmos. Environ., 32, 3953–3965, 1998.Shotyk, W., Zheng, J., Krachler, M., and Zdanowicz, C.: Predominance od industrial Pb in
recent snow (1994–2004) and ice (1842–1996) from Devon Island, Arctic Canada, Geophys.Res. Lett., 32, 21814.1–21814.4, 2005.
Sigl, M.: Ice core based reconstruction of past climate conditions from Colle Gnifetti, Swiss30
Alps, PhD thesis, Universitat Bern, Switzerland, 2009.Simoneit, B. R. T.: Biomass burnings – a review of organic tracers for smoke from incomplete
combustion, Appl. Geochem., 17, 129–162, 2002.
6519

ACPD11, 6493–6530, 2011
Seasonal impact ofnatural and
anthropogenicemissions on glacier
J. Gabrieli et al.
Title Page
Abstract Introduction
Conclusions References
Tables Figures
J I
J I
Back Close
Full Screen / Esc
Printer-friendly Version
Interactive Discussion
Discussion
Paper
|D
iscussionP
aper|
Discussion
Paper
|D
iscussionP
aper|
Smichowski, P.: Antimony in the environment as a global pollutant: a review on analyticalmethodologies for its determination in atmospheric aerosols, Talanta, 75, 2–14, 2008.
Van de Velde, K., Boutron, C., Ferrari, C., Bellomi, T., Barbante, C., Rudnev, S., and Bolshov, M.:Seasonal variations of heavy metals in the 1960s Alpine ice: sources versus meteorologicalfactors, Earth Planet. Sc. Lett., 164, 521–533, 1998.5
Veysseyre, A., Moutard, K., Ferrari, C., Velde, K. V. D., Barbante, C., Cozzi, G., Capodaglio, G.,and Boutron, C.: Heavy metals in fresh snow collected at different altitudes in the Chamonixand Maurienne valleys, French Alps: initial results, Atmos. Environ., 35, 415–425, 2001.
Wedepohl, K. H.: The composition of the continental crust, Geochim. Cosmochim. Ac., 59,1217–1232, 1995.10
Weiss, D., Shotyk, W., Appleby, P. G., Kramers, J. D., and Cheburkin, A. K.: Atmospheric Pbdeposition since the industrial revolution recorded by five swiss peat profiles: enrichmentfactors, fluxes, isotopic composition, and sources, Environ. Sci. Technol., 33, 1340–1352,1999.
6520

ACPD11, 6493–6530, 2011
Seasonal impact ofnatural and
anthropogenicemissions on glacier
J. Gabrieli et al.
Title Page
Abstract Introduction
Conclusions References
Tables Figures
J I
J I
Back Close
Full Screen / Esc
Printer-friendly Version
Interactive Discussion
Discussion
Paper
|D
iscussionP
aper|
Discussion
Paper
|D
iscussionP
aper|
Table 1. Main statistics of the species determined in the snow pit on the glacier Alto dell’Ortles.The concentrations of the trace elements are expressed in pg g−1 while the ionic compounds inng g−1.
Mean SD Median Min Max Max/Min
Li 19 13 15 4.9 74 15Be 1.8 1.6 1.1 0.47 9.3 20Al 3440 4290 1785 65 2.1E4 321Ti 450 240 440 11 1120 105V 140 180 77 7.5 790 105Cr 45 99 25 3.1 86 28Mn 825 1060 495 19 6850 356Fe 5340 5810 3290 95 2.5E4 257Co 13 13 9.0 1.0 81 80Ni 190 146 143 74 910 12Cu 155 142 122 18 730 41Zn 955 790 690 285 5610 20Ga 3.2 2.8 2.3 0.43 13 30As 19 14 15 3.7 91 25Rb 44 62 25 3.6 425 117Sr 680 1260 265 9.7 7300 755Ag 1.4 1.7 0.93 0.14 11 76Cd 6.6 5.3 5.0 1.2 28 23Sb 16 15 13 0.71 70 98Ba 380 460 214 8.5 2360 278Tl 5.3 2.9 4.7 1.6 20 13Pb 108 102 74 7.5 514 68Bi 2.1 1.8 1.7 0.18 8.0 45U 2.0 1.6 1.5 0.12 7.5 61
Cl− 60 61 42 5 291 58NO−
3 377 410 226 58 2210 38
SO2−4 297 410 150 16 1920 120
Na+ 44 44 23 5 214 43K+ 19 18 13 1.2 99 99Mg2+ 45 37 35 2.0 162 81Ca2+ 281 310 199 10 2040 204NH+
4 207 229 133 3.4 1170 390TOC 383 221 306 179 1630 9
6521
ACPD11, 6493–6530, 2011
Seasonal impact ofnatural and
anthropogenicemissions on glacier
J. Gabrieli et al.
Title Page
Abstract Introduction
Conclusions References
Tables Figures
J I
J I
Back Close
Full Screen / Esc
Printer-friendly Version
Interactive Discussion
Discussion
Paper
|D
iscussionP
aper|
Discussion
Paper
|D
iscussionP
aper|
Table 2. Average concentration and fluxes of trace elements in snow samples collected inthe Glacier Alto dell’Ortles snow pit and in the Colle Gnifetti ice core, Monte Rosa, in the timeperiods 1950–1980, 1980–1993 (Gabrieli, 2008) and pre-1700 (Barbante et al., 2004).
Concentration (pg g−1) Flux (µg m−2 yr−1)Ortles Colle Gnifetti core Ortles Colle Gnifetti core
2007–2009 Pre-1700 1950–1980 1980–1993 2007–2009 Pre-1700 1950–1980 1980–1993
Cr 45 144 61 54 36 48 27 24Cu 155 39 350 214 122 13 159 96Zn 955 171 4200 3410 755 56 1890 1535Co 13 70 33 38 10 23 15 17Ni 191 24 – – 151 7.9 – –Cd 6.6 1.6 88 38 5.2 0.5 40 17Sb 16 24 – – 13 7.9 – –Bi 2.1 1.6 9.9 3.6 1.7 0.5 4.5 1.6U 2 2.9 21 13.6 1.6 1.0 9.5 6.1Pb 108 130 4570 1655 85 43 2060 745Ba 380 – 1640 1680 300 – 740 755V 140 – 228 223 111 – 103 100Mn 823 – 2400 2140 650 – 1080 960Fe 5340 – 13 740 16 800 4220 – 6180 7560Al 3440 – 17 510 24 320 2715 – 7880 10 950
6522

ACPD11, 6493–6530, 2011
Seasonal impact ofnatural and
anthropogenicemissions on glacier
J. Gabrieli et al.
Title Page
Abstract Introduction
Conclusions References
Tables Figures
J I
J I
Back Close
Full Screen / Esc
Printer-friendly Version
Interactive Discussion
Discussion
Paper
|D
iscussionP
aper|
Discussion
Paper
|D
iscussionP
aper|
Table 3. Mean concentration and fluxes of major ions in snow and ice samples in differentAlpine sites: Glacier Alto dell’Ortles snow pit (mean accumulation ∼800 mm w.e.), Colle Gnifettifirn/ice core (Monte Rosa; mean accumulation 330 mm w.e.), Col du Dome firn/ice core (MontBlanc, mean accumulation 2450 mm w.e. yr−1), Fiesherhorngletscher firn/ice core (BerneseAlps; mean accumulation 1400 mm w.e. yr−1), Grenzgletscher firn/ice core (Monte Rosa; meanaccumulation 2700 mm w.e. yr−1), Careser (Ortles-Cevedale, Italian Eastern Alps; accumu-lation 1040 mm w.e. yr−1), Stubai (Austrian Tyrolean Alps; accumulation 1250 mm w.e. yr−1),Sonnblick (Austrian Tyrolean Alps), Dolomites (Eastern Italian Alps). The “w” associated withthe period indicates that only winter snow was sampled.
Site Altitude Period Mean concentration (ng g−1) Mean fluxes (mg m−2 yr−1)(m a.s.l.) NH+
4 Ca2+ SO2−4 NO−
3 Cl− NH+4 Ca2+ SO2−
4 NO−3 Cl−
Alto dell’Ortles snow-pit 3850 2005–2009 208 281 297 377 60 166 225 238 302 48ColleGnifettia,b 4450 1500–1700 38 104 100 87 40 13 34 33 29 13
a,b 4450 1950–1980 118 159 671 208 47 39 52 221 69 16a,b 4450 1980–1990 152 263 677 335 47 50 87 223 111 16a,b 4450 1990–2003 211 407 670 447 73 70 134 221 148 24
Col du Dome c 4250 1988–1993 97 46 400 280 30 238 113 980 686 74Fiescherhorngletscherd 3890 1945–1983 79 100 366 167 52 111 140 512 234 73Grenzgletscherd 4200 1945–1983 89 92 384 151 26 240 248 1037 408 70Caresere 3090 W–1994 73 24 345 412 260 76 25 359 428 270Stubaif 3106 1992–1995 41 42 163 329 39 51 53 204 411 49Sonnblick Glacier g 2950 1992–1995 (w) 259 64 336 763 96 – – – – –Trentino-Veneto h 1025–3040 1995 (w) – 510 530 900 162 – – – – –Dolomitesi 1610–2150 2005 (w) 172 712 462 1297 300 – – – – –
a Bolius,2007b Sigl, 2009c Preunkert et al., 1999d Eichler et al., 2004e Novo et al., 1998f Kuhn et al., 1998g Puxbaum et al., 1998h Gabrielli et al., 2008i Gabrieli et al., 2010
6523
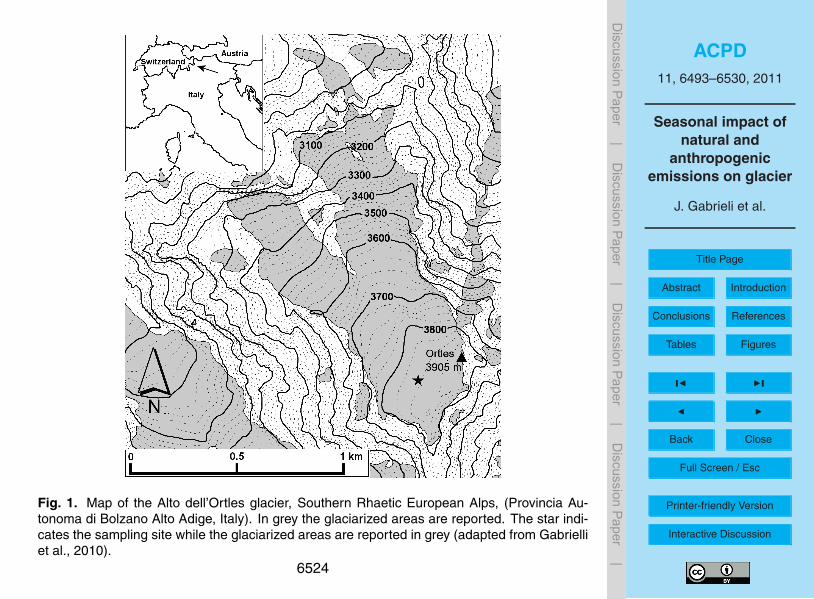
ACPD11, 6493–6530, 2011
Seasonal impact ofnatural and
anthropogenicemissions on glacier
J. Gabrieli et al.
Title Page
Abstract Introduction
Conclusions References
Tables Figures
J I
J I
Back Close
Full Screen / Esc
Printer-friendly Version
Interactive Discussion
Discussion
Paper
|D
iscussionP
aper|
Discussion
Paper
|D
iscussionP
aper|
Fig. 1. Map of the Alto dell’Ortles glacier, Southern Rhaetic European Alps, (Provincia Au-tonoma di Bolzano Alto Adige, Italy). In grey the glaciarized areas are reported. The star indi-cates the sampling site while the glaciarized areas are reported in grey (adapted from Gabrielliet al., 2010).
6524
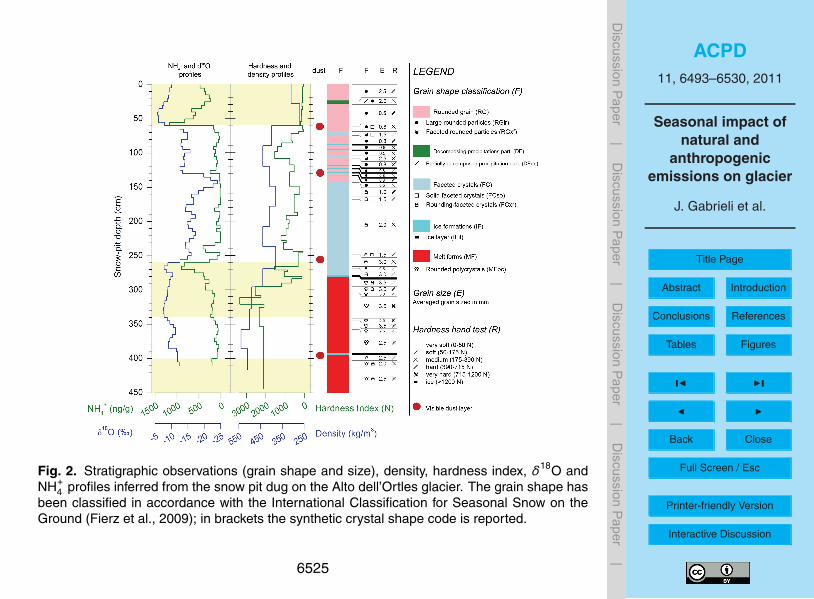
ACPD11, 6493–6530, 2011
Seasonal impact ofnatural and
anthropogenicemissions on glacier
J. Gabrieli et al.
Title Page
Abstract Introduction
Conclusions References
Tables Figures
J I
J I
Back Close
Full Screen / Esc
Printer-friendly Version
Interactive Discussion
Discussion
Paper
|D
iscussionP
aper|
Discussion
Paper
|D
iscussionP
aper|
Fig. 2. Stratigraphic observations (grain shape and size), density, hardness index, δ18O andNH+
4 profiles inferred from the snow pit dug on the Alto dell’Ortles glacier. The grain shape hasbeen classified in accordance with the International Classification for Seasonal Snow on theGround (Fierz et al., 2009); in brackets the synthetic crystal shape code is reported.
6525
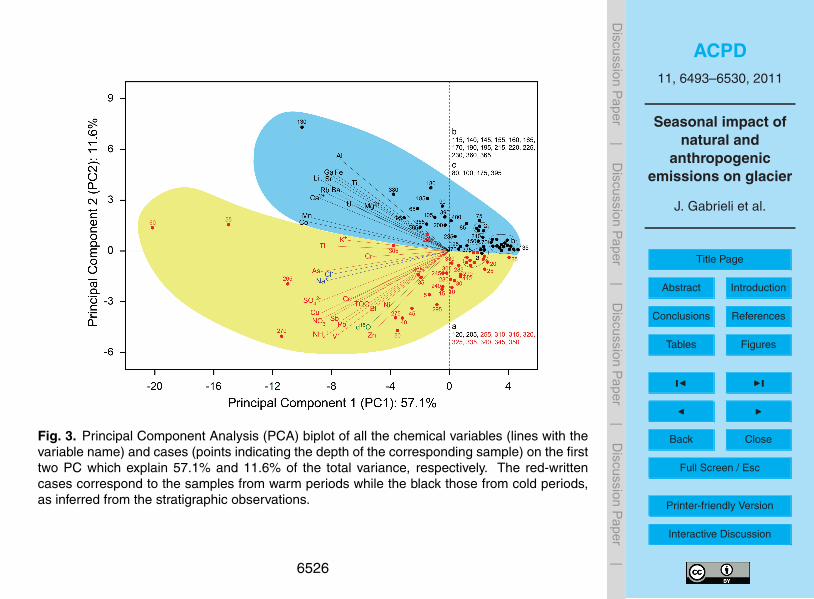
ACPD11, 6493–6530, 2011
Seasonal impact ofnatural and
anthropogenicemissions on glacier
J. Gabrieli et al.
Title Page
Abstract Introduction
Conclusions References
Tables Figures
J I
J I
Back Close
Full Screen / Esc
Printer-friendly Version
Interactive Discussion
Discussion
Paper
|D
iscussionP
aper|
Discussion
Paper
|D
iscussionP
aper|
Fig. 3. Principal Component Analysis (PCA) biplot of all the chemical variables (lines with thevariable name) and cases (points indicating the depth of the corresponding sample) on the firsttwo PC which explain 57.1% and 11.6% of the total variance, respectively. The red-writtencases correspond to the samples from warm periods while the black those from cold periods,as inferred from the stratigraphic observations.
6526
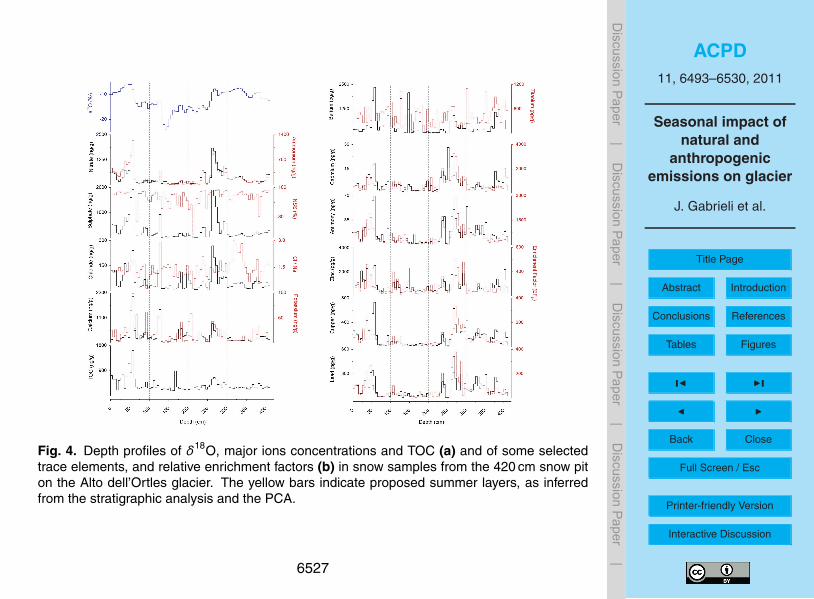
ACPD11, 6493–6530, 2011
Seasonal impact ofnatural and
anthropogenicemissions on glacier
J. Gabrieli et al.
Title Page
Abstract Introduction
Conclusions References
Tables Figures
J I
J I
Back Close
Full Screen / Esc
Printer-friendly Version
Interactive Discussion
Discussion
Paper
|D
iscussionP
aper|
Discussion
Paper
|D
iscussionP
aper|
Fig. 4. Depth profiles of δ18O, major ions concentrations and TOC (a) and of some selectedtrace elements, and relative enrichment factors (b) in snow samples from the 420 cm snow piton the Alto dell’Ortles glacier. The yellow bars indicate proposed summer layers, as inferredfrom the stratigraphic analysis and the PCA.
6527

ACPD11, 6493–6530, 2011
Seasonal impact ofnatural and
anthropogenicemissions on glacier
J. Gabrieli et al.
Title Page
Abstract Introduction
Conclusions References
Tables Figures
J I
J I
Back Close
Full Screen / Esc
Printer-friendly Version
Interactive Discussion
Discussion
Paper
|D
iscussionP
aper|
Discussion
Paper
|D
iscussionP
aper|
Fig. 5. Summary of seasonal behaviors of air mass back-trajectories, calculated using theNOAA HYSPLIT model, in the three years 2007–2009 time period.
6528
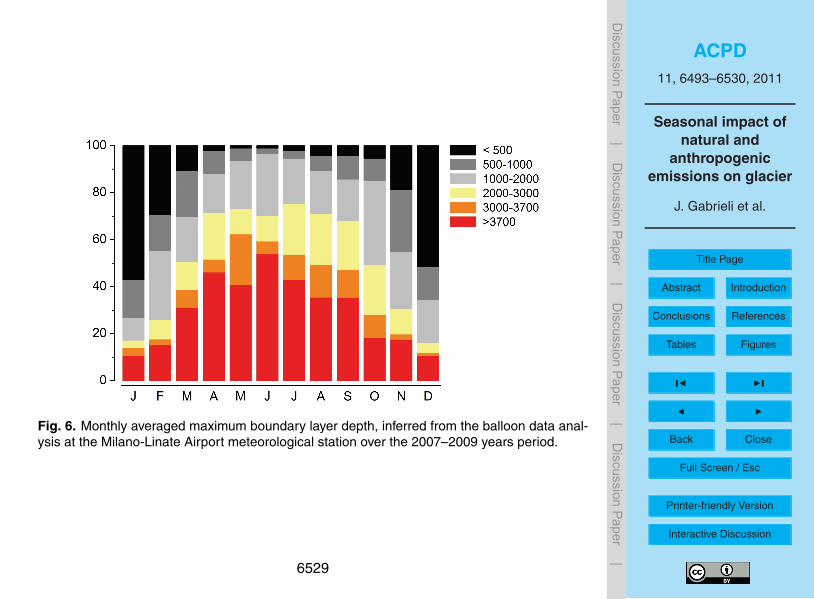
ACPD11, 6493–6530, 2011
Seasonal impact ofnatural and
anthropogenicemissions on glacier
J. Gabrieli et al.
Title Page
Abstract Introduction
Conclusions References
Tables Figures
J I
J I
Back Close
Full Screen / Esc
Printer-friendly Version
Interactive Discussion
Discussion
Paper
|D
iscussionP
aper|
Discussion
Paper
|D
iscussionP
aper|
Fig. 6. Monthly averaged maximum boundary layer depth, inferred from the balloon data anal-ysis at the Milano-Linate Airport meteorological station over the 2007–2009 years period.
6529

ACPD11, 6493–6530, 2011
Seasonal impact ofnatural and
anthropogenicemissions on glacier
J. Gabrieli et al.
Title Page
Abstract Introduction
Conclusions References
Tables Figures
J I
J I
Back Close
Full Screen / Esc
Printer-friendly Version
Interactive Discussion
Discussion
Paper
|D
iscussionP
aper|
Discussion
Paper
|D
iscussionP
aper|
Fig. 7. Monthly variations of the calculated Pasquill Stability Classes calculated at Milano-Linate Airport meteorological station and at the Alto dell’Ortles glacier, over the 2007–2009years period. The atmospheric turbulences are categorized into six stability classes from themost unstable to the most stable condition.
6530
Related Documents