This article appeared in a journal published by Elsevier. The attached copy is furnished to the author for internal non-commercial research and education use, including for instruction at the authors institution and sharing with colleagues. Other uses, including reproduction and distribution, or selling or licensing copies, or posting to personal, institutional or third party websites are prohibited. In most cases authors are permitted to post their version of the article (e.g. in Word or Tex form) to their personal website or institutional repository. Authors requiring further information regarding Elsevier’s archiving and manuscript policies are encouraged to visit: http://www.elsevier.com/copyright

Welcome message from author
This document is posted to help you gain knowledge. Please leave a comment to let me know what you think about it! Share it to your friends and learn new things together.
Transcript
This article appeared in a journal published by Elsevier. The attachedcopy is furnished to the author for internal non-commercial researchand education use, including for instruction at the authors institution
and sharing with colleagues.
Other uses, including reproduction and distribution, or selling orlicensing copies, or posting to personal, institutional or third party
websites are prohibited.
In most cases authors are permitted to post their version of thearticle (e.g. in Word or Tex form) to their personal website orinstitutional repository. Authors requiring further information
regarding Elsevier’s archiving and manuscript policies areencouraged to visit:
http://www.elsevier.com/copyright
Author's personal copy
Seasonal fatty acid profile analysis to trace origin of food sources of four commerciallyimportant bivalves
Daria Ezgeta-Balić a, Mirjana Najdek b, Melita Peharda a,⁎, Maria Blažina b
a Institute of Oceanography and Fisheries, 21 000 Split, Croatiab Institute “Ruđer Bošković”, Center for Marine Research, 52210 Rovinj, Croatia
a b s t r a c ta r t i c l e i n f o
Article history:Received 14 March 2011Received in revised form 21 December 2011Accepted 22 December 2011Available online 4 January 2012
Keywords:Arca noaeBivalve dietFatty acidModiolus barbatusMytilus galloprovincialisOstrea edulis
Knowledge of bivalve food sources has great importance in aquaculture areas where cultured species usuallyoccur at higher densities than in natural populations. Except phytoplankton,which is considered as their primaryfood sources, bivalves can use other food sources such as detritus, bacteria and zooplankton. The objective of thisstudywas to determine food sources of four commercially important bivalve species co-existing in theMali StonBay—most important aquaculture area of the eastern Adriatic Sea. Food sources were investigated by analyzingthe fatty acid profiles of digestive gland andmuscle tissues of the European flat oysterOstrea edulis and the blackmusselMytilus galloprovincialis, cultured in the water column, and the bearded horse musselModiolus barbatusand Noah's ark shell Arca noae from natural populations. Digestive gland fatty acid analysis revealed that duringthe period of higher plankton abundance in spring and summer, all species ingested mainly phytoplankton fol-lowed by zooplankton and detritus. During the low plankton abundance of the autumn–winter period zooplank-ton and/or detritus became more important in a bivalve diet. Fatty acid composition of muscles indicateddifferences in selective incorporation of polyunsaturated fatty acid (PUFA) from their diets. While A. noae andM. barbatus accumulated significantly PUFAs during all and O. edulis during spring–summer period, inM. galloprovincialis this tendency was not observed at all. This suggested better utilization of ingestedfood in bottom-dwelling species. Because all four species consumed similar food sources they were in competi-tion. However, as investigated species in Mali Ston Bay exist in high density, primary production plus the avail-ability of other food sources in this areawas probably sufficient to satisfy demands for all species. Aquaculture inthe study area dependswholly on natural spat. This suggests that larviphagy, observed for all species,might con-stitute a self-regulating restriction to natural populations and/or commercial aquaculture growth.
© 2011 Elsevier B.V. All rights reserved.
1. Introduction
Traditionally bivalves are considered to be herbivores and it is as-sumed that phytoplankton formed the main component of their diet(e.g. Cloern, 1982). However, several studies have showed that bivalvescan use other food sources such as detritus, bacteria, microzooplanktonand mesozooplankton (Davenport et al., 2000; Langdon and Newell,1990; Lehane and Davenport, 2002, 2006; Peharda et al., 2012). Severalmethods are used to determine a marine bivalves' diet: an analysis ofstomach contents (Alfaro, 2006; Davenport et al., 2000; Lehane andDavenport, 2002, 2006), feces and pseudofeces (Lehane andDavenport, 2004), stable isotopes (Compton et al., 2008; Xu and Yang,2007) and fatty acid composition (Allan et al., 2010; Bachok et al.,2003; Kharlamenko et al., 2001; Prato et al., 2010; Xu and Yang,2007). In contrast to stomach content analyses, which provide
information reflecting recent feeding activity (seconds–hours), assess-ment of fatty acids and stable isotopes reflects bivalves' food sources ata longer-term basis (weeks–months), as it measures nutrients assimilat-ed in their tissues. Such long term information is essential in understand-ing the trophic levels in marine food webs (Dalsgaard et al., 2003). Thefatty acid trophic marker concept in biochemical ecology is based onthe fact that each group of organisms (e.g. bacteria, diatoms, dinoflagel-lates, microzooplankton) has a specific suite of fatty acid markers(Table 1) that can be transferred conservatively, or can be recognized,in their predators' tissues as they move through the food web (Bergéand Barnathan, 2005; Dalsgaard et al., 2003). Studies dealing with sea-sonal changes in bivalve fatty acid composition exist (e.g. Abad et al.,1995; Beninger and Stephan, 1985; Pazos et al., 1996) but their resultswere not discussed in the context of potential food sources. Althoughin 1980s fatty acid trophic marker concept was still not developedBeninger and Stephan (1985) suggested that observed difference couldbe related to the differences in bivalve diet. In recent decades therehave been several studies of bivalve diets using fatty acid markers, butonly few have dealt with aquaculture (e.g. Alkanani et al., 2007; Pratoet al., 2010; Xu and Yang, 2007). These have either been conducted on
Aquaculture 334–337 (2012) 89–100
⁎ Corresponding author. Tel.: +385 21 408053; fax: +385 21 358650.E-mail addresses: [email protected] (D. Ezgeta-Balić), [email protected] (M. Najdek),
[email protected] (M. Peharda), [email protected] (M. Blažina).
0044-8486/$ – see front matter © 2011 Elsevier B.V. All rights reserved.doi:10.1016/j.aquaculture.2011.12.041
Contents lists available at SciVerse ScienceDirect
Aquaculture
j ourna l homepage: www.e lsev ie r .com/ locate /aqua-on l ine
Author's personal copy
single species, or have been based on one-time sampling, thus limitingthe understanding of species interactions.
The objective of this study was to determine differences in foodsources among four commercially important bivalve species co-existing in Mali Ston Bay — the most important bivalve aquaculturearea in the eastern Adriatic Sea. As carbon turnover rate may differdepending on tissues (Tieszen et al., 1983), digestive gland and ad-ductor muscle tissues were analyzed to obtain information on currentdiet and to get insight what kind of ingested food they incorporate intheir tissue. Of the studied species, the European flat oyster (Ostreaedulis Linnaeus, 1758) and the black mussel (Mytilus galloprovincialisLamarck, 1819) are cultured on lines suspended in the water column.The bearded horse mussel (Modiolus barbatus (Linnaeus, 1758)) andthe Noah's ark shell (Arca noae Linnaeus, 1758) are present in the
studied area in dense natural populations and are potential candi-dates for aquaculture.
2. Materials and methods
The studywas carried out inMali Ston Bay, south Adriatic (42°52′N;17°41′ E) (Fig. 1) from May 2009 to May 2010. M. galloprovincialis andO. edulis were collected from an aquaculture farm at depths rangingfrom 1 to 3 m and 3 to 7 m, respectively. M. barbatus and A. noae werecollected by SCUBA diving on the seabed at depths ranging from 2 to4 m around 100 m from the farm. Temperature and salinity were mea-sured using a YSI–Pro probe on the farm at a depth of 4 m.
2.1. Condition index analysis
For condition index (CI) analysis, 30 specimens of each specieswere collected monthly. Mean lengths of analyzed specimens were:A. noae 54.1±4.2 mm, M. barbatus 50.1±2.6 mm, M. galloprovincialis62.7±3.4 mm, and O. edulis 63.6±6.0 mm. In the laboratory, sam-ples were thawed and all epibionts carefully scraped from the shell.Specimens were cooked for 5 min in boiling water and soft tissue sep-arated from the shell, left to air dry and then weighed. CI was calcu-lated according to Davenport and Chen (1987) as the ratio betweenthe weights of cooked tissues and the sum of weights of cookedmeat and shell.
2.2. Fatty acid analysis
Every two months 15 specimens of each of the four species werecollected for fatty acid analysis. Within few hours after collection,specimens were dissected to separate digestive gland and adductormuscle tissues. Tissues from five animals were pooled in three repli-cate samples for each species and each organ. All samples wereweighed, homogenized and extracted following Bligh and Dyer
Table 1Summary of different sources FATM.
FATM Sources References
20:5(n-3)–EPA16:116:1(n-7)/16:0>122:6(n-3)/20:5(n-3)b1
Diatoms Budge and Parrish (1998),Dunstan et al. (1994),Dalsgaard et al. (2003)
22:6(n-3)/20:5(n-3)>116:018:5(n-3)18:4(n-3)22:6 (n-3)–DHA
Dinoflagellates Budge and Parrish (1998),Mansour et al. (1999),Dalsgaard et al. (2003)
18:1 (n-9)18:2 (n-6)20:4 (n-6)–ARA22:6 (n-3)–DHA
Zooplankton Kharlamenko et al. (2001),Zhukova and Kharlamenko(1999)
∑ Iso- and anteiso-C15 and C1718:1(n-7)
Detritus/Bacterial
Mayzaud et al. (1989), Najdeket al. (2002)
18:2(n-6)+18:3(n-3)>2.5 Terrestrialplant
Budge and Parrish (1998)
Fig. 1. Map of the study area with position of sampling station.
90 D. Ezgeta-Balić et al. / Aquaculture 334–337 (2012) 89–100
Author's personal copy
(1959). Layers were separated by addition of a salt solution at leastthree times to maximize lipid recovery and the organic phases werepooled and evaporated to dryness. Total extracts were saponified(1.2 M NaOH in methanol), acidified (6 M HCl), methylated (14%BF3 in methanol) and extracted in dichloromethane (Morrison andSmith, 1964). Fatty acid methyl esters (FAMEs) were analyzed byAgilent gas–liquid chromatography (GLC) 6890N GC Systemequipped with a 5973 Network Mass Selective Detector capillary col-umn (25m×0.3mm×0.25 μm; cross linked 5% phenylmethylsilox-ane) and ultra-high purity helium as the carrier gas. The GLCsettings were: programmed column temperature rise from 145 °Cby 4 °C/min up to 270 °C at a constant column pressure of 2.17 kPa.Retention times, peak areas and mass spectra were recorded withChemstation software. FAMEs were identified by mass spectral dataand a family plot of equivalent chain length data for GC standards forthe GC column used. FAMEs mix C18–C20, polyunsaturated fatty acidsstandards (PUFA1 and PUFA3), cod liver oil and various individualpure standards of FAME.
2.3. Statistical analysis
Levene's test for equal variances was performed on conditionindex data. One-way ANOVA was used to investigate significant dif-ferences in CI between sampling months when variances were homo-geneous; while for samples with unequal variances non-parametricKruskal–Wallis test was applied. A multivariate principal componentanalysis (PCA, Primer) was used to identify the prevailing foodsources of each species throughout the year. The analyses werebased on correlation matrices involving the normalization of all vari-ables due to their different scales.
3. Results
3.1. Hydrographic parameters
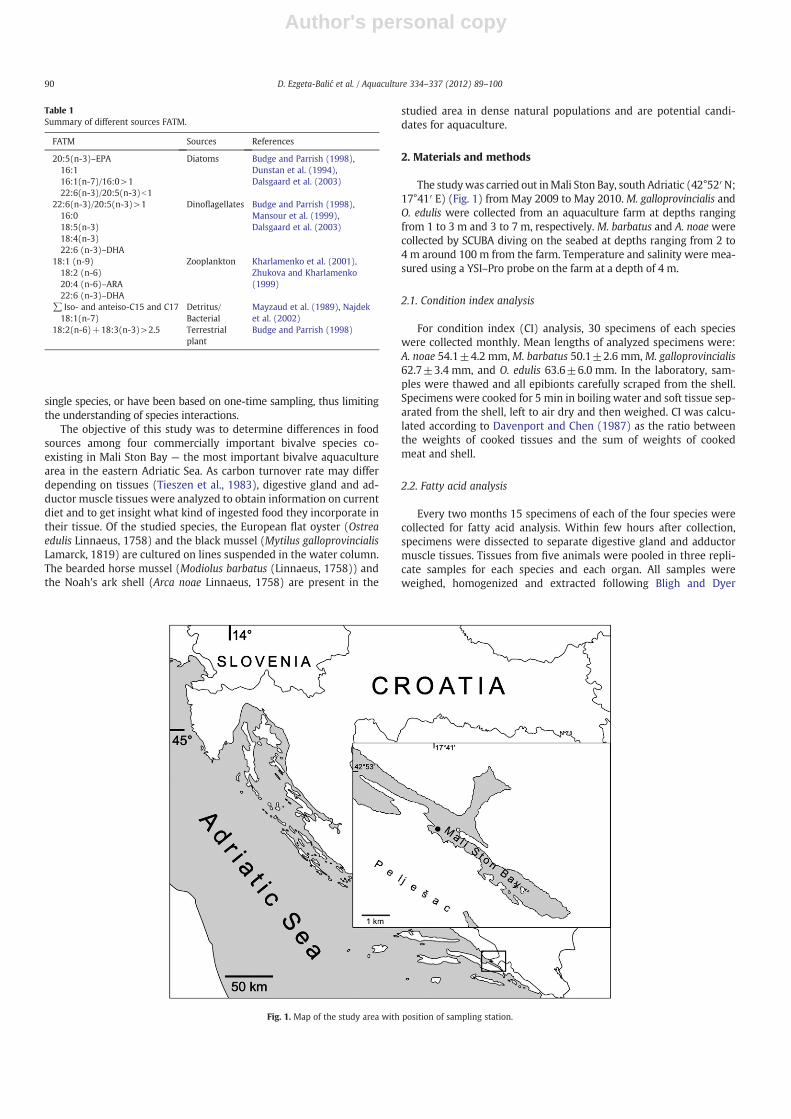
During the study period, temperature ranged from11.6 °C in February2010 to 24.2 °C in September 2009. Temperature remained b15 °C fromJanuary to May 2010 and >19 °C from July to October 2009. Salinityvaried from 33.9 (February and March 2009) to 39.15 in May 2010(Fig. 2).
3.2. Condition index
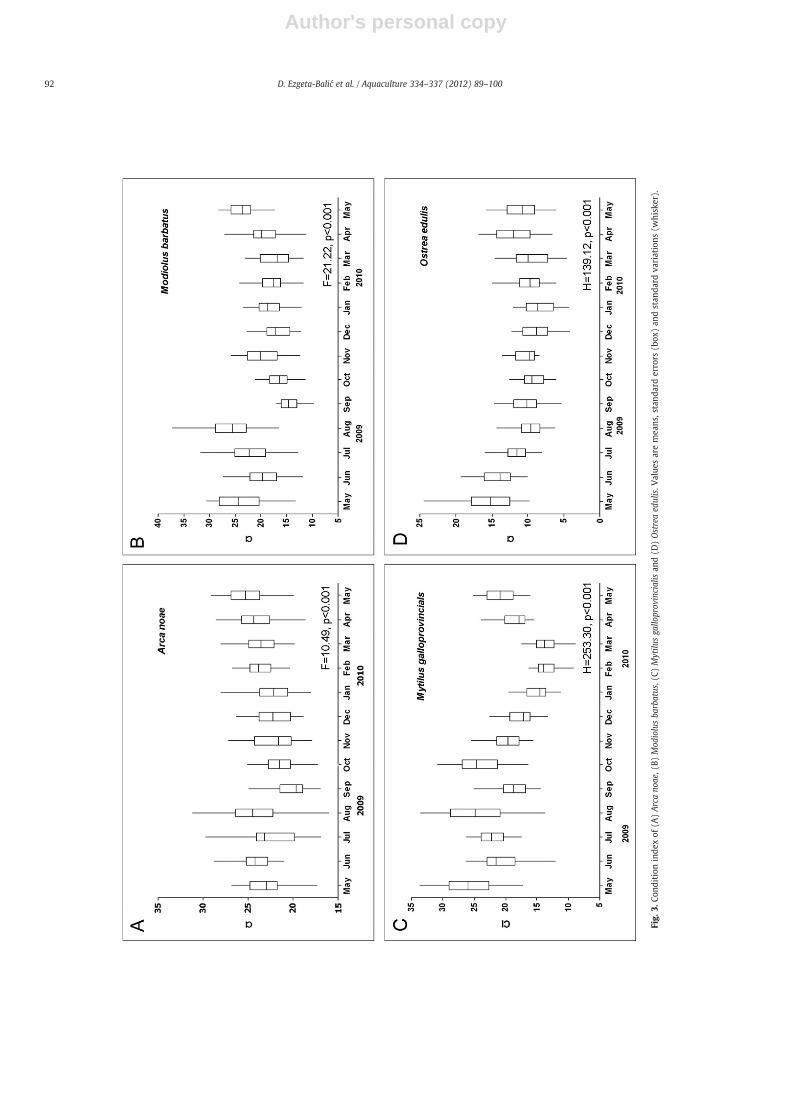
Condition index significantly varied for all species with respectto sampling month. In A. noae, CI decreased from August (mean±st. dev=24.34±3.18) to September 2009 (20.21±1.90) andthen slowly increased until May 2010 (25.12±2.23) (Fig. 3A).M. barbatus showed higher mean CI values during the warmermonths with maximal values in May (24.01±4.44) and August2009 (25.45±5.92). In September CI reached its lowest value(14.29±1.94) (Fig. 3B). CI in M. galloprovincialis peaked in May
(25.80±3.93), August (24.89±5.22) and October (24.31±3.68)and lowest values were recorded in February (13.68±1.91) andMarch (13.71±2.15) (Fig. 3C). The highest CI for O. edulis wasrecorded in May 2009 (15.24±3.66). From June to August, CI slow-ly decreased and remained low until March with a lowest value inJanuary (8.32±2.23) (Fig. 3D).
3.3. Fatty acid composition of digestive gland and adductor muscle
Fatty acid composition of the digestive gland and adductor muscleof A. noae, M. barbatus, M. galloprovincialis and O. edulis is shown inTables 2A, 2B, 2C, and 2D, respectively. In both organs of all species,palmitic acid C16:0, palmitoleic C16:1(n-7) and oleic C18:1(n-9)acids dominated among the saturated (SATs) and monounsaturatedfatty acids (MUFAs), respectively, while among the polyunsaturatedfatty acids (PUFAs), eicosapentaenoic–EPA C20:5(n-3) and docosa-hexaenoic–DHA C22:6(n-3) prevailed. PUFA varied in an oppositefashion to SAT being higher during the colder months in the digestiveglands of all species. As a consequence, the unsaturation degree(UND) showed an increasing trend after minima reached in Septem-ber. Similar trend of UND was observed in the muscles of A. noae andM. barbatus. In the muscles of these two species UNDs were 2 to 19and 2 to 5 times higher than in digestive glands, respectively. In con-trast, in the muscle of M. galloprovincialis UND decreased during au-tumn–winter period, being up to 9 times lower than in digestivegland. In O. edulis, variations of UND in digestive glands and muscleswere comparable. UNDs were higher and lower in the muscles thanin digestive glands during spring–summer and autumn–winter peri-od, respectively.
Changes of ARA, EPA and DHA in the digestive glands of all specieswere similar throughout the investigated period; decreasing fromMay to September and then increasing to March. ARA and DHA accu-mulated in the muscles of A. noae and M. barbatus over the entireyear, while accumulation of EPA occurred in September, November(A. noae) and in July (M. barbatus). In M. galloprovincialis adductormuscle EPA accumulated only in September while DHA not at all. InO. edulis both acids accumulated in period from May to September.Accumulation of ARA occurred only from May to September inM. galloprovincialis and in all months except November in O. edulis.The accumulation of ARA in these two species was far less than intwo bottom-dwelling species.
Generally, DHA/EPA ratios were lower in the spring–summer peri-od and higher during autumn–winter. DHA/EPA ratio varied in an op-posite way to the C16:1/C16:0 ratios. Consequently, the highestC16:1/C16:0 ratios were observed in either May or July and duringautumn and winter, ratios were lower. DHA predominated over EPAthroughout the entire year only in the adductor muscles of A. noae.In the other species, both acids were present in similar proportionsand varied only a little over course of the year. In O. edulis, this ratiowas reversed in favor of EPA during the colder months of the year.The ARA/EPA ratio in the digestive glands and adductor muscles ofA. noae, M. barbatus and O. edulis increased until autumn, being simi-lar during winter and decreased in both organs in March. The ARA/EPA ratio in the digestive gland of M. galloprovincialis increased inSeptember, and remained more or less constant until March. The ad-ductor muscle ratio was stable except for a decrease in November.
The contribution of non-methylene interrupted dienoic (NMID)fatty acids in all digestive glands was low and similar. NMIDs contrib-uted more in the adductor muscles of A. noae andM. barbatus, than inO. edulis and, especially, M. galloprovincialis. The inverse relationshipbetween digestive gland and adductor muscle NMID proportionswas observed for each species throughout the year. There was also anegative correlation between muscle NMID and digestive gland EFAfor each species.
Bacterial FAME (Mayzaud et al., 1989; Najdek et al., 2002) valueswere higher in the digestive glands of M. barbatus and A. noae thanFig. 2. Hydrographic parameters in Mali Ston Bay from May 2009 to May 2010.
91D. Ezgeta-Balić et al. / Aquaculture 334–337 (2012) 89–100
Author's personal copy
Fig.
3.Co
nditioninde
xof
(A)Arcano
ae,(B)
Mod
iolusba
rbatus,(C)
Mytilu
sga
lloprov
incialisan
d(D
)Ostreaed
ulis.V
alue
saremea
ns,stand
arderrors
(box
)an
dstan
dard
variations
(whisker).
92 D. Ezgeta-Balić et al. / Aquaculture 334–337 (2012) 89–100

Author's personal copy
in O. edulis and M. galloprovincialis. Bacterial FAME was generallyhigher in the digestive glands than in muscle tissues of M. barbatusand A. noae while in the muscle of M. galloprovincialis exceededthose in digestive gland throughout the year, but only during thecolder months in the muscle of O. edulis.
3.4. Food source: fatty acid relationships
To help to elucidate the relative importance of different foodsources in each species during the year, PCA was applied to the fattyacid proportions (C16:1, C16:0, ARA, EPA, DHA, C18:2(n-6), bacteri-al), ratios (DHA/EPA, ARA/EPA, C16:1/16:0) and unsaturation degree(UND) of the digestive glands. In addition to Table 1 which
summarizes FATM, bacterial fatty acids were used as indicator of par-ticle (detritus) feeding, ARA/EPA ratio and NMID were considered aspossible contribution of bivalves' larvae as food source. ARA/EPAand NMID were found to be higher in bivalves' larvae and eggs incomparison to other tissues or adult animals (Ahn et al., 2000;Labarta et al., 1999; Napolitano et al., 1988). PC1, PC2 and PC3 (eigen-values >1) explained 91.6%, 96.3%, 91.1% and 98% of such variationsin A. noae, M. barbatus, M. galloprovincialis and O. edulis, respectively.Fig. 4 (A–D) shows the plots for the first two component weights foreach species.
In May and July A. noae digestive glands were strongly positive toPC2 (16:1/16:0) but separated according to positive (EPA) and nega-tive (16:0) relation to PC1, respectively. High positive values of PC1
Table 2AFatty acids contribution (%) in tissues of Arca noae (tr indicate that fatty acid was found only in traces).
May 2009 July 2009 September 2009 November 2009 January 2010 March 2010
FAME Digestivegland
Adductormuscle
Digestivegland
Adductormuscle
Digestivegland
Adductormuscle
Digestivegland
Adductormuscle
Digestivegland
Adductormuscle
Digestivegland
Adductormuscle
C14:0 4.91±0.56
0.66±0.20
5.65±0.25
0.70±0.29
8.51±0.35
0.69±0.71
7.91±2.00
tr 3.91±1.06
tr 2.27±0.26
0.08±0.14
C16:0 17.21±1.61
8.49±0.72
31.22±5.15
15.71±3.39
40.65±2.41
19.42±2.07
32.05±8.27
5.00±0.60
17.96±3.91
5.06±0.61
11.64±0.71
4.67±0.14
C17:0 1.13±0.11
1.40±0.05
1.81±0.45
2.41±0.47
2.68±0.40
2.68±0.22
2.70±0.83
0.85±0.07
1.67±0.20
0.62±0.54
1.01±0.06
0.85±0.04
C18:0 4.45±0.36
4.07±0.17
7.60±1.94
7.15±1.51
9.34±1.27
8.11±1.00
7.76±2.00
2.22±0.37
4.85±0.73
2.86±0.27
3.48±0.20
2.55±0.16
SAT 28.46±2.57
15.52±0.69
46.79±7.70
26.75±5.36
62.16±4.01
31.15±2.81
51.94±13.18
8.07±0.98
29.93±6.07
8.53±0.33
19.64±0.56
8.35±0.08
C16:1(n-7) 7.59±0.37
1.63±0.18
10.88±1.38
1.42±0.55
6.77±2.16
0.92±1.08
6.30±1.54
0.42±0.38
5.85±1.15
tr 3.80±0.55
0.62±0.14
C18:1(n-7) 3.35±0.16
1.35±0.11
3.64±3.18
1.40±0.39
tr 0.94±0.86
3.39±0.86
1.98±1.96
3.95±0.42
1.03±0.45
2.79±0.09
1.21±0.55
C18:1(n-9) 3.83±1.06
2.76±0.11
3.78±0.70
1.95±0.29
3.07±0.73
2.39±0.50
5.38±1.28
2.05±0.89
5.36±0.75
2.56±0.25
3.23±0.12
2.00±0.29
C20:1(n-7) 0.67±0.06
0.62±0.04
tr 0.70±0.08
0.10±0.18
1.03±0.05
0.60±0.10
0.29±0.25
0.69±0.04
0.13±0.23
tr 0.35±0.08
C20:1(n-9) 0.18±0.00
1.73±0.16
1.74±1.76
1.41±0.08
0.98±0.59
2.06±0.09
1.46±0.34
tr 1.77±0.08
1.32±0.48
0.59±0.05
1.25±0.09
MUFA 15.85±1.40
10.96±0.54
20.05±2.56
9.25±0.44
10.92±3.33
9.23±1.91
17.13±4.11
6.86±1.12
17.70±2.01
6.78±0.86
10.68±0.64
7.94±0.58
C18:2(n-6) 2.93±0.16
2.59±0.15
1.65±0.30
2.05±0.15
1.63±0.28
2.64±0.22
2.36±0.60
3.88±1.71
3.00±0.20
3.40±2.03
2.35±0.13
4.60±2.07
C18:3(n-3) 2.72±0.88
0.56±0.12
1.65±1.61
0.20±0.18
4.43±1.01
tr 1.24±0.65
2.82±0.44
2.39±0.07
0.82±0.72
2.81±0.04
1.40±1.11
C18:4(n-3) 3.67±0.27
0.62±0.11
0.64±0.63
tr 0.22±0.39
tr 1.05±0.95
0.49±0.48
2.39±0.09
0.22±0.23
4.01±0.36
1.17±0.71
C20:5(n-3) 19.04±2.93
11.61±0.54
10.20±5.84
9.12±0.62
2.72±1.65
6.48±0.46
6.28±3.34
10.77±0.91
14.54±2.36
10.56±0.36
18.12±0.73
10.57±0.09
C20:4(n-6) 0.85±0.74
7.19±0.45
0.94±0.25
6.68±0.77
0.49±0.42
6.78±0.95
1.00±0.90
8.82±0.52
2.94±0.65
9.67±1.02
2.61±0.13
8.08±0.57
C22:2 (NMID1) 0.17±0.07
4.21±0.32
0.98±1.05
3.54±0.45
0.32±0.08
3.60±0.48
0.77±0.06
2.75±0.12
0.44±0.24
3.57±0.27
0.39±0.07
3.19±0.32
C22:2 (NMID2) 0.48±0.07
8.91±0.84
1.93±1.22
7.47±0.75
1.40±0.28
8.27±0.72
2.10±0.37
6.58±0.32
0.27±0.12
8.69±1.30
0.83±0.14
7.09±0.52
C22:6(n-3) 18.71±0.59
29.25±0.64
4.25±4.30
27.51±3.83
2.98±0.86
27.79±4.83
5.63±5.75
35.17±3.03
18.41±4.99
41.37±0.52
28.69±0.92
40.71±2.35
PUFA 52.19±4.21
73.30±0.75
27.30±7.21
63.75±5.40
17.37±2.63
59.66±3.35
23.90±12.52
84.50±0.45
48.15±8.23
84.37±0.83
65.64±0.80
82.79±1.28
UND* 9.41±1.45
21.58±0.84
2.96±1.67
11.45±3.09
1.27±0.32
9.02±1.50
2.50±2.00
48.29±7.75
8.72±3.00
47.23±1.43
17.02±0.71
47.35±0.86
16:1/16:0 0.44±0.02
0.19±0.01
0.36±0.10
0.09±0.01
0.17±0.06
0.05±0.05
0.21±0.09
0.08±0.07
0.33±0.02
0.00±0.00
0.32±0.03
0.13±0.03
DHA/EPA 1.00±0.13
2.52±0.07
0.33±0.29
3.01±0.27
1.90±2.07
4.33±0.99
0.71±0.62
3.27±0.28
1.25±0.15
3.92±0.09
1.59±0.10
3.85±0.20
ARA/EPA 0.05±0.04
0.62±0.07
0.10±0.03
0.73±0.06
0.14±0.12
1.05±0.12
0.13±0.12
0.82±0.05
0.20±0.02
0.91±0.08
0.14±0.01
0.76±0.05
DETRITAL** 5.35±0.28
3.65±0.04
6.10±3.17
4.59±0.06
3.79±0.57
3.87±0.88
7.73±0.46
2.83±2.00
7.00±0.93
1.65±0.78
4.63±0.23
2.06±0.53
EFA*** 38.60±3.21
48.05±0.73
15.39±10.33
43.31±5.12
7.19±1.08
41.05±4.82
12.90±9.93
54.76±3.54
35.89±7.97
61.60±1.71
49.43±0.88
59.36±2.73
*UND — unsaturation degree=[% monoenoic+2∙(% dienoic)+3∙(% trienoic)+4∙(% tetraenoic)+5∙(% pentaenoic)+6∙(% hexaenoic) /% total SAT] (Pirini et al., 2007).**DETRITAL fatty acids=[C15:0+C15iso+C15anteiso+C17:0+C17iso+C17anteiso+C18:1(n-7)] (Mayzaud et al., 1989; Najdek et al., 2002).***EFA — essential fatty acids=C20:4(n-6) [ARA]+C20:5(n-3) [EPA]+C22:6 (n-3) [DHA].
93D. Ezgeta-Balić et al. / Aquaculture 334–337 (2012) 89–100
Author's personal copy
weight (ARA, EPA, DHA, DHA/EPA) coincided with negative PC2(ARA/EPA) and grouped together glands from January and Marchseparating them from September and November due to most influen-tial parameters 16:0 and ARA/EPA negatively related to PC1 and PC2,respectively.
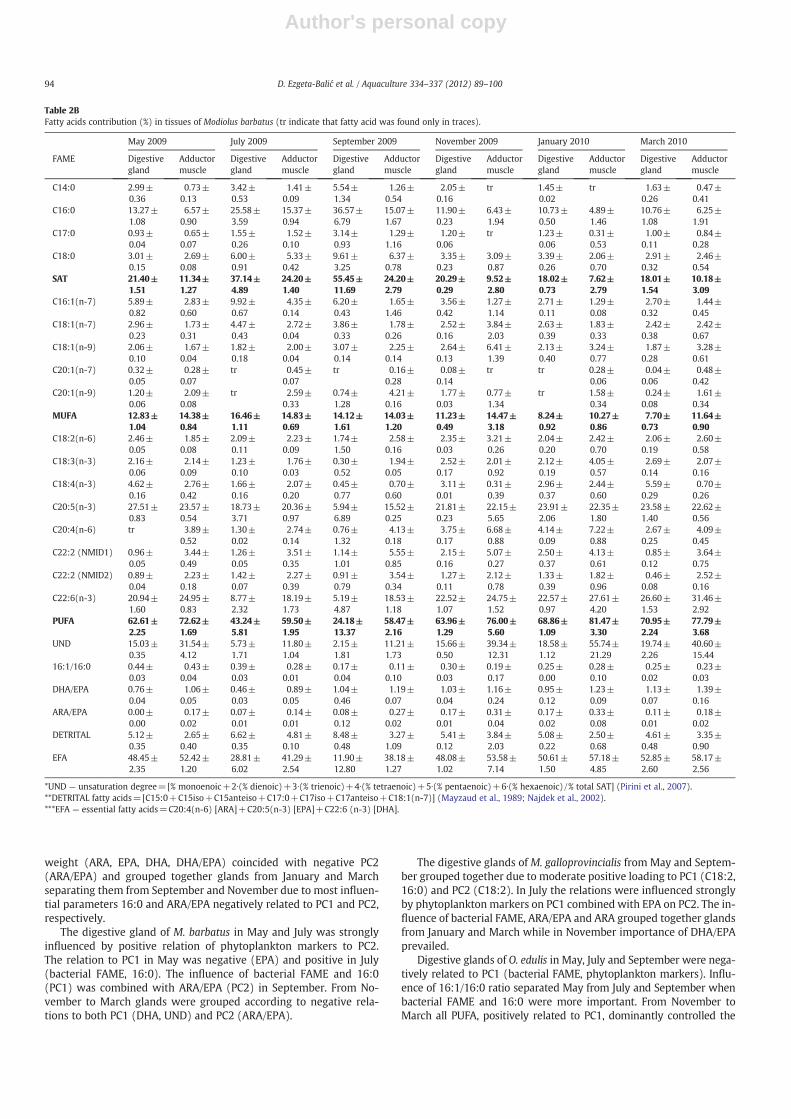
The digestive gland of M. barbatus in May and July was stronglyinfluenced by positive relation of phytoplankton markers to PC2.The relation to PC1 in May was negative (EPA) and positive in July(bacterial FAME, 16:0). The influence of bacterial FAME and 16:0(PC1) was combined with ARA/EPA (PC2) in September. From No-vember to March glands were grouped according to negative rela-tions to both PC1 (DHA, UND) and PC2 (ARA/EPA).
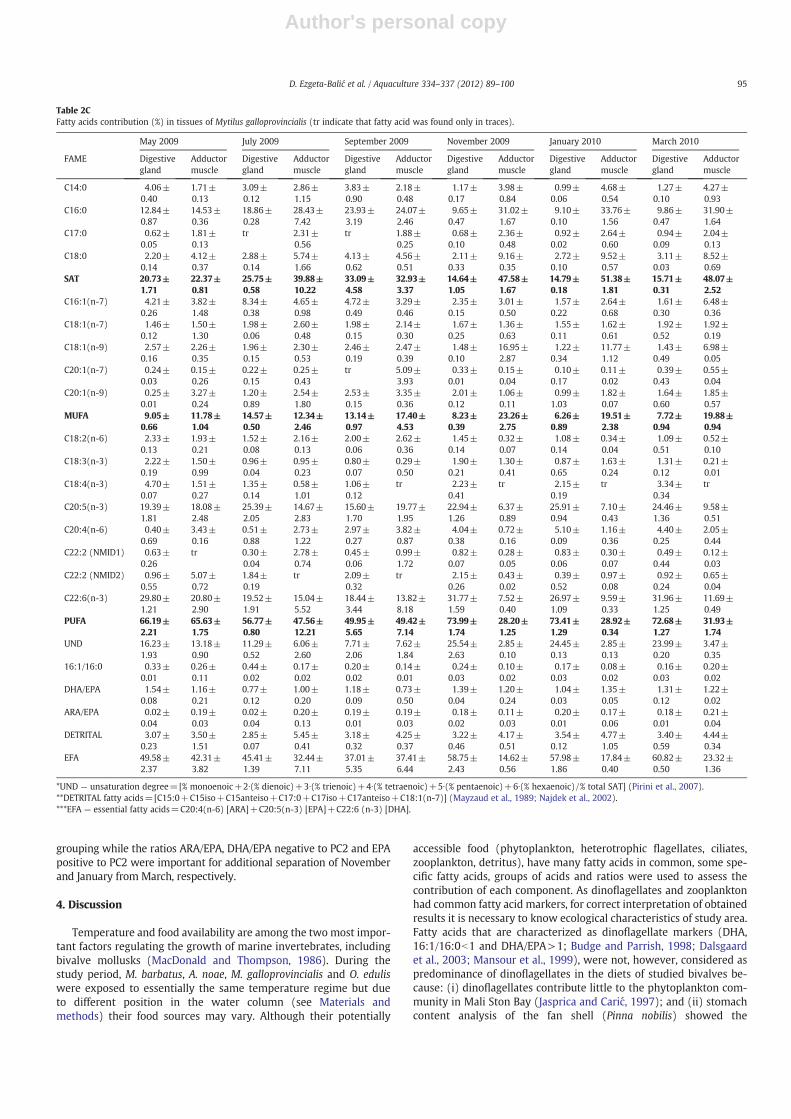
The digestive glands of M. galloprovincialis from May and Septem-ber grouped together due to moderate positive loading to PC1 (C18:2,16:0) and PC2 (C18:2). In July the relations were influenced stronglyby phytoplankton markers on PC1 combined with EPA on PC2. The in-fluence of bacterial FAME, ARA/EPA and ARA grouped together glandsfrom January and March while in November importance of DHA/EPAprevailed.
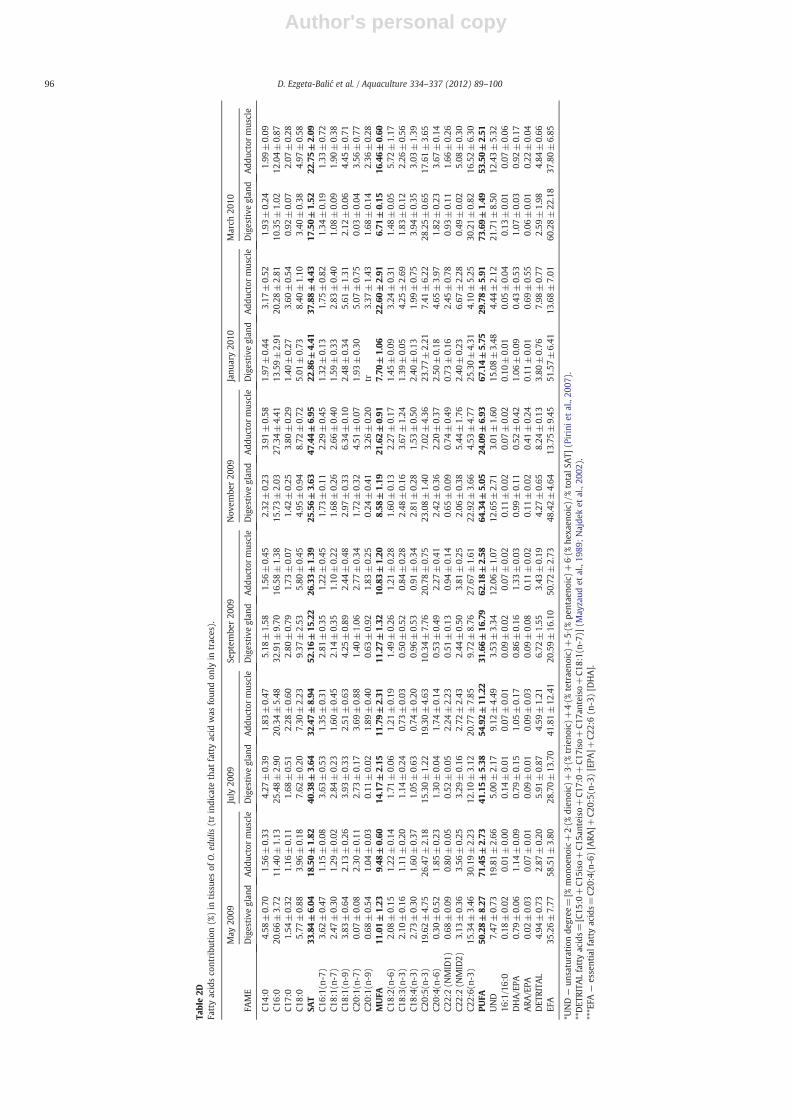
Digestive glands of O. edulis in May, July and September were nega-tively related to PC1 (bacterial FAME, phytoplankton markers). Influ-ence of 16:1/16:0 ratio separated May from July and September whenbacterial FAME and 16:0 were more important. From November toMarch all PUFA, positively related to PC1, dominantly controlled the
Table 2BFatty acids contribution (%) in tissues of Modiolus barbatus (tr indicate that fatty acid was found only in traces).
May 2009 July 2009 September 2009 November 2009 January 2010 March 2010
FAME Digestivegland
Adductormuscle
Digestivegland
Adductormuscle
Digestivegland
Adductormuscle
Digestivegland
Adductormuscle
Digestivegland
Adductormuscle
Digestivegland
Adductormuscle
C14:0 2.99±0.36
0.73±0.13
3.42±0.53
1.41±0.09
5.54±1.34
1.26±0.54
2.05±0.16
tr 1.45±0.02
tr 1.63±0.26
0.47±0.41
C16:0 13.27±1.08
6.57±0.90
25.58±3.59
15.37±0.94
36.57±6.79
15.07±1.67
11.90±0.23
6.43±1.94
10.73±0.50
4.89±1.46
10.76±1.08
6.25±1.91
C17:0 0.93±0.04
0.65±0.07
1.55±0.26
1.52±0.10
3.14±0.93
1.29±1.16
1.20±0.06
tr 1.23±0.06
0.31±0.53
1.00±0.11
0.84±0.28
C18:0 3.01±0.15
2.69±0.08
6.00±0.91
5.33±0.42
9.61±3.25
6.37±0.78
3.35±0.23
3.09±0.87
3.39±0.26
2.06±0.70
2.91±0.32
2.46±0.54
SAT 21.40±1.51
11.34±1.27
37.14±4.89
24.20±1.40
55.45±11.69
24.20±2.79
20.29±0.29
9.52±2.80
18.02±0.73
7.62±2.79
18.01±1.54
10.18±3.09
C16:1(n-7) 5.89±0.82
2.83±0.60
9.92±0.67
4.35±0.14
6.20±0.43
1.65±1.46
3.56±0.42
1.27±1.14
2.71±0.11
1.29±0.08
2.70±0.32
1.44±0.45
C18:1(n-7) 2.96±0.23
1.73±0.31
4.47±0.43
2.72±0.04
3.86±0.33
1.78±0.26
2.52±0.16
3.84±2.03
2.63±0.39
1.83±0.33
2.42±0.38
2.42±0.67
C18:1(n-9) 2.06±0.10
1.67±0.04
1.82±0.18
2.00±0.04
3.07±0.14
2.25±0.14
2.64±0.13
6.41±1.39
2.13±0.40
3.24±0.77
1.87±0.28
3.28±0.61
C20:1(n-7) 0.32±0.05
0.28±0.07
tr 0.45±0.07
tr 0.16±0.28
0.08±0.14
tr tr 0.28±0.06
0.04±0.06
0.48±0.42
C20:1(n-9) 1.20±0.06
2.09±0.08
tr 2.59±0.33
0.74±1.28
4.21±0.16
1.77±0.03
0.77±1.34
tr 1.58±0.34
0.24±0.08
1.61±0.34
MUFA 12.83±1.04
14.38±0.84
16.46±1.11
14.83±0.69
14.12±1.61
14.03±1.20
11.23±0.49
14.47±3.18
8.24±0.92
10.27±0.86
7.70±0.73
11.64±0.90
C18:2(n-6) 2.46±0.05
1.85±0.08
2.09±0.11
2.23±0.09
1.74±1.50
2.58±0.16
2.35±0.03
3.21±0.26
2.04±0.20
2.42±0.70
2.06±0.19
2.60±0.58
C18:3(n-3) 2.16±0.06
2.14±0.09
1.23±0.10
1.76±0.03
0.30±0.52
1.94±0.05
2.52±0.17
2.01±0.92
2.12±0.19
4.05±0.57
2.69±0.14
2.07±0.16
C18:4(n-3) 4.62±0.16
2.76±0.42
1.66±0.16
2.07±0.20
0.45±0.77
0.70±0.60
3.11±0.01
0.31±0.39
2.96±0.37
2.44±0.60
5.59±0.29
0.70±0.26
C20:5(n-3) 27.51±0.83
23.57±0.54
18.73±3.71
20.36±0.97
5.94±6.89
15.52±0.25
21.81±0.23
22.15±5.65
23.91±2.06
22.35±1.80
23.58±1.40
22.62±0.56
C20:4(n-6) tr 3.89±0.52
1.30±0.02
2.74±0.14
0.76±1.32
4.13±0.18
3.75±0.17
6.68±0.88
4.14±0.09
7.22±0.88
2.67±0.25
4.09±0.45
C22:2 (NMID1) 0.96±0.05
3.44±0.49
1.26±0.05
3.51±0.35
1.14±1.01
5.55±0.85
2.15±0.16
5.07±0.27
2.50±0.37
4.13±0.61
0.85±0.12
3.64±0.75
C22:2 (NMID2) 0.89±0.04
2.23±0.18
1.42±0.07
2.27±0.39
0.91±0.79
3.54±0.34
1.27±0.11
2.12±0.78
1.33±0.39
1.82±0.96
0.46±0.08
2.52±0.16
C22:6(n-3) 20.94±1.60
24.95±0.83
8.77±2.32
18.19±1.73
5.19±4.87
18.53±1.18
22.52±1.07
24.75±1.52
22.57±0.97
27.61±4.20
26.60±1.53
31.46±2.92
PUFA 62.61±2.25
72.62±1.69
43.24±5.81
59.50±1.95
24.18±13.37
58.47±2.16
63.96±1.29
76.00±5.60
68.86±1.09
81.47±3.30
70.95±2.24
77.79±3.68
UND 15.03±0.35
31.54±4.12
5.73±1.71
11.80±1.04
2.15±1.81
11.21±1.73
15.66±0.50
39.34±12.31
18.58±1.12
55.74±21.29
19.74±2.26
40.60±15.44
16:1/16:0 0.44±0.03
0.43±0.04
0.39±0.03
0.28±0.01
0.17±0.04
0.11±0.10
0.30±0.03
0.19±0.17
0.25±0.00
0.28±0.10
0.25±0.02
0.23±0.03
DHA/EPA 0.76±0.04
1.06±0.05
0.46±0.03
0.89±0.05
1.04±0.46
1.19±0.07
1.03±0.04
1.16±0.24
0.95±0.12
1.23±0.09
1.13±0.07
1.39±0.16
ARA/EPA 0.00±0.00
0.17±0.02
0.07±0.01
0.14±0.01
0.08±0.12
0.27±0.02
0.17±0.01
0.31±0.04
0.17±0.02
0.33±0.08
0.11±0.01
0.18±0.02
DETRITAL 5.12±0.35
2.65±0.40
6.62±0.35
4.81±0.10
8.48±0.48
3.27±1.09
5.41±0.12
3.84±2.03
5.08±0.22
2.50±0.68
4.61±0.48
3.35±0.90
EFA 48.45±2.35
52.42±1.20
28.81±6.02
41.29±2.54
11.90±12.80
38.18±1.27
48.08±1.02
53.58±7.14
50.61±1.50
57.18±4.85
52.85±2.60
58.17±2.56
*UND — unsaturation degree=[% monoenoic+2∙(% dienoic)+3∙(% trienoic)+4∙(% tetraenoic)+5∙(% pentaenoic)+6∙(% hexaenoic) /% total SAT] (Pirini et al., 2007).**DETRITAL fatty acids=[C15:0+C15iso+C15anteiso+C17:0+C17iso+C17anteiso+C18:1(n-7)] (Mayzaud et al., 1989; Najdek et al., 2002).***EFA — essential fatty acids=C20:4(n-6) [ARA]+C20:5(n-3) [EPA]+C22:6 (n-3) [DHA].
94 D. Ezgeta-Balić et al. / Aquaculture 334–337 (2012) 89–100
Author's personal copy
grouping while the ratios ARA/EPA, DHA/EPA negative to PC2 and EPApositive to PC2 were important for additional separation of Novemberand January from March, respectively.
4. Discussion
Temperature and food availability are among the two most impor-tant factors regulating the growth of marine invertebrates, includingbivalve mollusks (MacDonald and Thompson, 1986). During thestudy period, M. barbatus, A. noae, M. galloprovincialis and O. eduliswere exposed to essentially the same temperature regime but dueto different position in the water column (see Materials andmethods) their food sources may vary. Although their potentially
accessible food (phytoplankton, heterotrophic flagellates, ciliates,zooplankton, detritus), have many fatty acids in common, some spe-cific fatty acids, groups of acids and ratios were used to assess thecontribution of each component. As dinoflagellates and zooplanktonhad common fatty acid markers, for correct interpretation of obtainedresults it is necessary to know ecological characteristics of study area.Fatty acids that are characterized as dinoflagellate markers (DHA,16:1/16:0b1 and DHA/EPA>1; Budge and Parrish, 1998; Dalsgaardet al., 2003; Mansour et al., 1999), were not, however, considered aspredominance of dinoflagellates in the diets of studied bivalves be-cause: (i) dinoflagellates contribute little to the phytoplankton com-munity in Mali Ston Bay (Jasprica and Carić, 1997); and (ii) stomachcontent analysis of the fan shell (Pinna nobilis) showed the
Table 2CFatty acids contribution (%) in tissues of Mytilus galloprovincialis (tr indicate that fatty acid was found only in traces).
May 2009 July 2009 September 2009 November 2009 January 2010 March 2010
FAME Digestivegland
Adductormuscle
Digestivegland
Adductormuscle
Digestivegland
Adductormuscle
Digestivegland
Adductormuscle
Digestivegland
Adductormuscle
Digestivegland
Adductormuscle
C14:0 4.06±0.40
1.71±0.13
3.09±0.12
2.86±1.15
3.83±0.90
2.18±0.48
1.17±0.17
3.98±0.84
0.99±0.06
4.68±0.54
1.27±0.10
4.27±0.93
C16:0 12.84±0.87
14.53±0.36
18.86±0.28
28.43±7.42
23.93±3.19
24.07±2.46
9.65±0.47
31.02±1.67
9.10±0.10
33.76±1.56
9.86±0.47
31.90±1.64
C17:0 0.62±0.05
1.81±0.13
tr 2.31±0.56
tr 1.88±0.25
0.68±0.10
2.36±0.48
0.92±0.02
2.64±0.60
0.94±0.09
2.04±0.13
C18:0 2.20±0.14
4.12±0.37
2.88±0.14
5.74±1.66
4.13±0.62
4.56±0.51
2.11±0.33
9.16±0.35
2.72±0.10
9.52±0.57
3.11±0.03
8.52±0.69
SAT 20.73±1.71
22.37±0.81
25.75±0.58
39.88±10.22
33.09±4.58
32.93±3.37
14.64±1.05
47.58±1.67
14.79±0.18
51.38±1.81
15.71±0.31
48.07±2.52
C16:1(n-7) 4.21±0.26
3.82±1.48
8.34±0.38
4.65±0.98
4.72±0.49
3.29±0.46
2.35±0.15
3.01±0.50
1.57±0.22
2.64±0.68
1.61±0.30
6.48±0.36
C18:1(n-7) 1.46±0.12
1.50±1.30
1.98±0.06
2.60±0.48
1.98±0.15
2.14±0.30
1.67±0.25
1.36±0.63
1.55±0.11
1.62±0.61
1.92±0.52
1.92±0.19
C18:1(n-9) 2.57±0.16
2.26±0.35
1.96±0.15
2.30±0.53
2.46±0.19
2.47±0.39
1.48±0.10
16.95±2.87
1.22±0.34
11.77±1.12
1.43±0.49
6.98±0.05
C20:1(n-7) 0.24±0.03
0.15±0.26
0.22±0.15
0.25±0.43
tr 5.09±3.93
0.33±0.01
0.15±0.04
0.10±0.17
0.11±0.02
0.39±0.43
0.55±0.04
C20:1(n-9) 0.25±0.01
3.27±0.24
1.20±0.89
2.54±1.80
2.53±0.15
3.35±0.36
2.01±0.12
1.06±0.11
0.99±1.03
1.82±0.07
1.64±0.60
1.85±0.57
MUFA 9.05±0.66
11.78±1.04
14.57±0.50
12.34±2.46
13.14±0.97
17.40±4.53
8.23±0.39
23.26±2.75
6.26±0.89
19.51±2.38
7.72±0.94
19.88±0.94
C18:2(n-6) 2.33±0.13
1.93±0.21
1.52±0.08
2.16±0.13
2.00±0.06
2.62±0.36
1.45±0.14
0.32±0.07
1.08±0.14
0.34±0.04
1.09±0.51
0.52±0.10
C18:3(n-3) 2.22±0.19
1.50±0.99
0.96±0.04
0.95±0.23
0.80±0.07
0.29±0.50
1.90±0.21
1.30±0.41
0.87±0.65
1.63±0.24
1.31±0.12
0.21±0.01
C18:4(n-3) 4.70±0.07
1.51±0.27
1.35±0.14
0.58±1.01
1.06±0.12
tr 2.23±0.41
tr 2.15±0.19
tr 3.34±0.34
tr
C20:5(n-3) 19.39±1.81
18.08±2.48
25.39±2.05
14.67±2.83
15.60±1.70
19.77±1.95
22.94±1.26
6.37±0.89
25.91±0.94
7.10±0.43
24.46±1.36
9.58±0.51
C20:4(n-6) 0.40±0.69
3.43±0.16
0.51±0.88
2.73±1.22
2.97±0.27
3.82±0.87
4.04±0.38
0.72±0.16
5.10±0.09
1.16±0.36
4.40±0.25
2.05±0.44
C22:2 (NMID1) 0.63±0.26
tr 0.30±0.04
2.78±0.74
0.45±0.06
0.99±1.72
0.82±0.07
0.28±0.05
0.83±0.06
0.30±0.07
0.49±0.44
0.12±0.03
C22:2 (NMID2) 0.96±0.55
5.07±0.72
1.84±0.19
tr 2.09±0.32
tr 2.15±0.26
0.43±0.02
0.39±0.52
0.97±0.08
0.92±0.24
0.65±0.04
C22:6(n-3) 29.80±1.21
20.80±2.90
19.52±1.91
15.04±5.52
18.44±3.44
13.82±8.18
31.77±1.59
7.52±0.40
26.97±1.09
9.59±0.33
31.96±1.25
11.69±0.49
PUFA 66.19±2.21
65.63±1.75
56.77±0.80
47.56±12.21
49.95±5.65
49.42±7.14
73.99±1.74
28.20±1.25
73.41±1.29
28.92±0.34
72.68±1.27
31.93±1.74
UND 16.23±1.93
13.18±0.90
11.29±0.52
6.06±2.60
7.71±2.06
7.62±1.84
25.54±2.63
2.85±0.10
24.45±0.13
2.85±0.13
23.99±0.20
3.47±0.35
16:1/16:0 0.33±0.01
0.26±0.11
0.44±0.02
0.17±0.02
0.20±0.02
0.14±0.01
0.24±0.03
0.10±0.02
0.17±0.03
0.08±0.02
0.16±0.03
0.20±0.02
DHA/EPA 1.54±0.08
1.16±0.21
0.77±0.12
1.00±0.20
1.18±0.09
0.73±0.50
1.39±0.04
1.20±0.24
1.04±0.03
1.35±0.05
1.31±0.12
1.22±0.02
ARA/EPA 0.02±0.04
0.19±0.03
0.02±0.04
0.20±0.13
0.19±0.01
0.19±0.03
0.18±0.02
0.11±0.03
0.20±0.01
0.17±0.06
0.18±0.01
0.21±0.04
DETRITAL 3.07±0.23
3.50±1.51
2.85±0.07
5.45±0.41
3.18±0.32
4.25±0.37
3.22±0.46
4.17±0.51
3.54±0.12
4.77±1.05
3.40±0.59
4.44±0.34
EFA 49.58±2.37
42.31±3.82
45.41±1.39
32.44±7.11
37.01±5.35
37.41±6.44
58.75±2.43
14.62±0.56
57.98±1.86
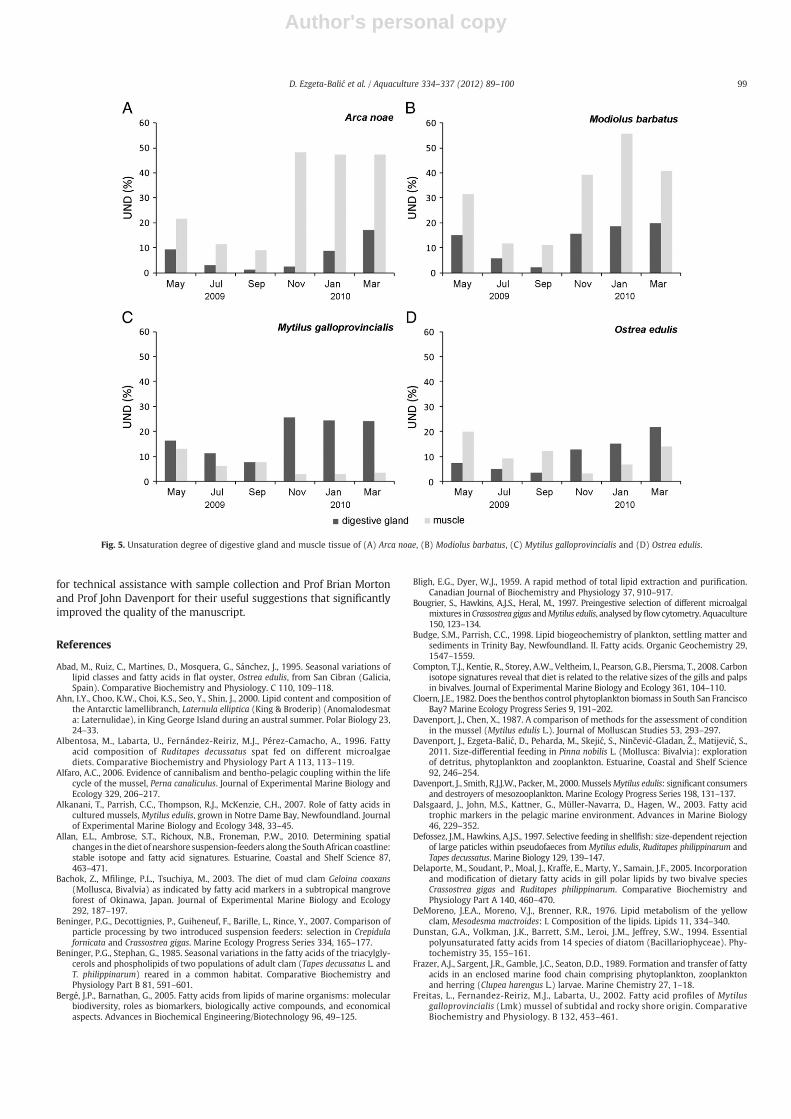
17.84±0.40
60.82±0.50
23.32±1.36
*UND — unsaturation degree=[% monoenoic+2∙(% dienoic)+3∙(% trienoic)+4∙(% tetraenoic)+5∙(% pentaenoic)+6∙(% hexaenoic) /% total SAT] (Pirini et al., 2007).**DETRITAL fatty acids=[C15:0+C15iso+C15anteiso+C17:0+C17iso+C17anteiso+C18:1(n-7)] (Mayzaud et al., 1989; Najdek et al., 2002).***EFA — essential fatty acids=C20:4(n-6) [ARA]+C20:5(n-3) [EPA]+C22:6 (n-3) [DHA].
95D. Ezgeta-Balić et al. / Aquaculture 334–337 (2012) 89–100
Author's personal copy
Table2D
Fattyacidsco
ntribu
tion
(%)in
tissue
sof
O.edu
lis(trindicate
that
fattyacid
was
foun
don
lyin
traces).
May
2009
July
2009
Septem
ber20
09Nov
embe
r20
09Janu
ary20
10March
2010
FAME
Digestive
glan
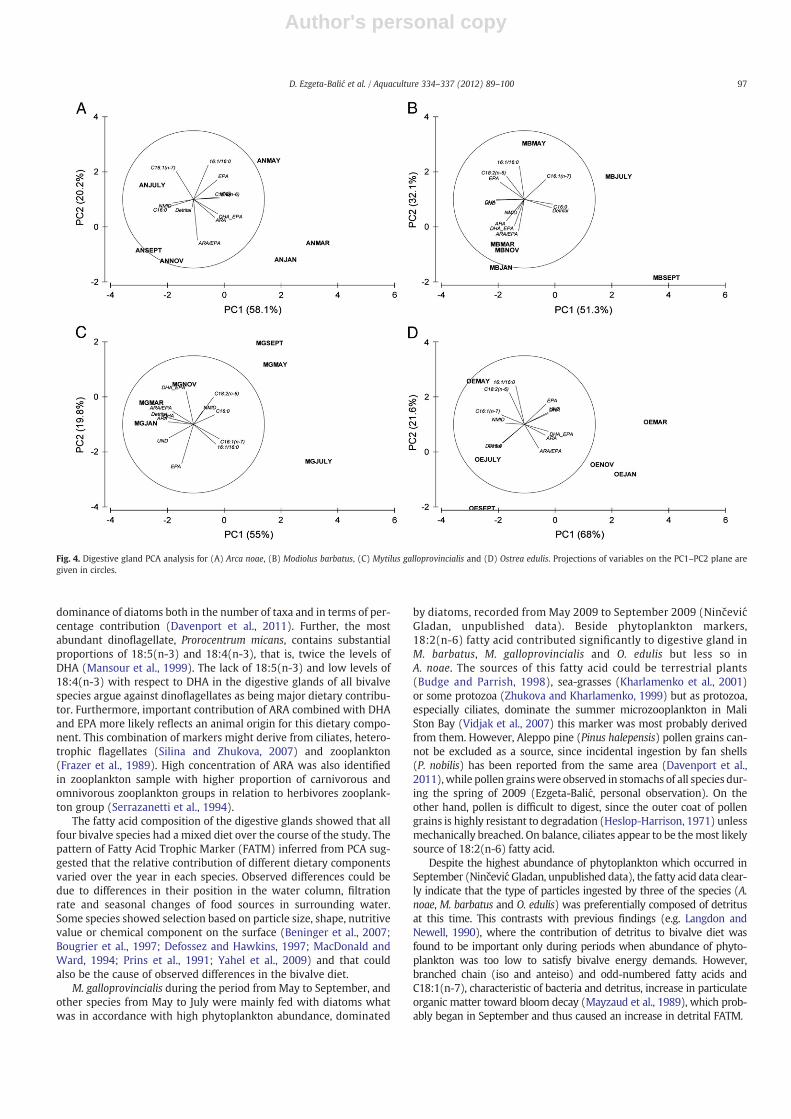
dAdd
uctormus
cle
Digestive
glan
dAdd
uctormus
cle
Digestive
glan
dAdd
uctormus
cle
Digestive
glan
dAdd
uctormus
cle
Digestive
glan
dAdd
uctormus
cle
Digestive
glan
dAdd
uctormus
cle
C14:0
4.58
±0.70
1.56
±0.33
4.27
±0.39
1.83
±0.47
5.18
±1.58
1.56
±0.45
2.32
±0.23
3.91
±0.58
1.97
±0.44
3.17
±0.52
1.93
±0.24
1.99
±0.09
C16:0
20.66±
3.72
11.40±
1.13
25.48±
2.90
20.34±
5.48
32.91±
9.70
16.58±
1.38
15.73±
2.03
27.34±
4.41
13.59±
2.91
20.28±
2.81
10.35±
1.02
12.04±
0.87
C17:0
1.54
±0.32
1.16
±0.11
1.68
±0.51
2.28
±0.60
2.80
±0.79
1.73
±0.07
1.42
±0.25
3.80
±0.29
1.40
±0.27
3.60
±0.54
0.92
±0.07
2.07
±0.28
C18:0
5.77
±0.88
3.96
±0.18
7.62
±0.20
7.30
±2.23
9.37
±2.53
5.80
±0.45
4.95
±0.94
8.72
±0.72
5.01
±0.73
8.40
±1.10
3.40
±0.38
4.97
±0.58
SAT
33.84±
6.04
18.50±
1.82
40.38±
3.64
32.47±
8.94
52.16±
15.22
26.33±
1.39
25.56±
3.63
47.44±
6.95
22.86±
4.41
37.88±
4.43
17.50±
1.52
22.75±
2.09
C16:1(
n-7)
3.62
±0.47
1.15
±0.08
3.63
±0.53
1.35
±0.31
2.81
±0.35
1.22
±0.45
1.73
±0.11
2.29
±0.45
1.32
±0.13
1.75
±0.82
1.34
±0.19
1.33
±0.72
C18:1(
n-7)
2.47
±0.30
1.29
±0.02
2.84
±0.23
1.60
±0.45
2.14
±0.35
1.10
±0.22
1.68
±0.26
2.66
±0.40
1.59
±0.33
2.83
±0.40
1.08
±0.09
1.90
±0.38
C18:1(
n-9)
3.83
±0.64
2.13
±0.26
3.93
±0.33
2.51
±0.63
4.25
±0.89
2.44
±0.48
2.97
±0.33
6.34
±0.10
2.48
±0.34
5.61
±1.31
2.12
±0.06
4.45
±0.71
C20:1(
n-7)
0.07
±0.08
2.30
±0.11
2.73
±0.17
3.69
±0.88
1.40
±1.06
2.77
±0.34
1.72
±0.32
4.51
±0.07
1.93
±0.30
5.07
±0.75
0.03
±0.04
3.56
±0.77
C20:1(
n-9)
0.68
±0.54
1.04
±0.03
0.11
±0.02
1.89
±0.40
0.63
±0.92
1.83
±0.25
0.24
±0.41
3.26
±0.20
tr3.37
±1.43
1.68
±0.14
2.36
±0.28
MUFA
11.01±
1.23
9.48
±0.60
14.17±
2.15
11.79±
2.31
11.27±
1.32
10.83±
1.20
8.58
±1.19
21.62±
0.91
7.70
±1.06
22.60±
2.91
6.71
±0.15
16.46±
0.60
C18:2(
n-6)
2.08
±0.15
1.22
±0.14
1.71
±0.06
1.21
±0.19
1.49
±0.26
1.21
±0.28
1.60
±0.13
2.27
±0.17
1.45
±0.09
3.24
±0.31
1.48
±0.05
5.72
±1.17
C18:3(
n-3)
2.10
±0.16
1.11
±0.20
1.14
±0.24
0.73
±0.03
0.50
±0.52
0.84
±0.28
2.48
±0.16
3.67
±1.24
1.39
±0.05
4.25
±2.69
1.83
±0.12
2.26
±0.56
C18:4(
n-3)
2.73
±0.30
1.60
±0.37
1.05
±0.63
0.74
±0.20
0.96
±0.53
0.91
±0.34
2.81
±0.28
1.53
±0.50
2.40
±0.13
1.99
±0.75
3.94
±0.35
3.03
±1.39
C20:5(
n-3)
19.62±
4.75
26.47±
2.18
15.30±
1.22
19.30±
4.63
10.34±
7.76
20.78±
0.75
23.08±
1.40
7.02
±4.36
23.77±
2.21
7.41
±6.22
28.25±
0.65
17.61±
3.65
C20:4(
n-6)
0.30
±0.52
1.85
±0.23
1.30
±0.04
1.74
±0.14
0.53
±0.49
2.27
±0.41
2.42
±0.36
2.20
±0.37
2.50
±0.18
4.65
±3.97
1.82
±0.23
3.67
±0.14
C22:2(N
MID
1)0.68
±0.09
0.80
±0.05
0.52
±0.05
2.24
±2.23
0.51
±0.13
0.94
±0.14
0.65
±0.09
0.74
±0.49
0.73
±0.16
2.45
±0.78
0.93
±0.11
1.66
±0.26
C22:2(N
MID
2)3.13
±0.36
3.56
±0.25
3.29
±0.16
2.72
±2.43
2.44
±0.50
3.81
±0.25
2.06
±0.38
5.44
±1.76
2.40
±0.23
6.67
±2.28
0.49
±0.02
5.08
±0.30
C22:6(
n-3)
15.34±
3.46
30.19±
2.23
12.10±
3.12
20.77±
7.85
9.72
±8.76
27.67±
1.61
22.92±
3.66
4.53
±4.77
25.30±
4.31
4.10
±5.25
30.21±
0.82
16.52±
6.30
PUFA
50.28±
8.27
71.45±
2.73
41.15±
5.38
54.92±
11.22
31.66±
16.79
62.18±
2.58
64.34±
5.05
24.09±
6.93
67.14±
5.75
29.78±
5.91
73.69±
1.49
53.50±
2.51
UND
7.47
±0.73
19.81±
2.66
5.00
±2.17
9.12
±4.49
3.53
±3.34
12.06±
1.07
12.65±
2.71
3.01
±1.60
15.08±
3.48
4.44
±2.12
21.71±
8.50
12.43±
5.32
16:1/16:0
0.18
±0.02
0.01
±0.00
0.14
±0.01
0.07
±0.01
0.09
±0.02
0.07
±0.02
0.11
±0.02
0.07
±0.02
0.10
±0.01
0.05
±0.04
0.13
±0.01
0.07
±0.06
DHA/EPA
0.79
±0.06
1.14
±0.09
0.79
±0.15
1.05
±0.17
0.86
±0.16
1.33
±0.03
0.99
±0.11
0.52
±0.42
1.06
±0.09
0.43
±0.53
1.07
±0.03
0.92
±0.17
ARA
/EPA
0.02
±0.03
0.07
±0.01
0.09
±0.01
0.09
±0.03
0.09
±0.08
0.11
±0.02
0.11
±0.02
0.41
±0.24
0.11
±0.01
0.69
±0.55
0.06
±0.01
0.22
±0.04
DET
RITA
L4.94
±0.73
2.87
±0.20
5.91
±0.87
4.59
±1.21
6.72
±1.55
3.43
±0.19
4.27
±0.65
8.24
±0.13
3.80
±0.76
7.98
±0.77
2.59
±1.98
4.84
±0.66
EFA
35.26±
7.77
58.51±
3.80
28.70±
13.70
41.81±
12.41
20.59±
16.10
50.72±
2.73
48.42±
4.64
13.75±
9.45
51.57±
6.41
13.68±
7.01
60.28±
22.18
37.80±
6.85
*UND
—un
saturation
degree
=[%
mon
oeno
ic+
2∙(%
dien
oic)
+3∙(%
trieno
ic)+
4∙(%
tetrae
noic)+
5∙(%
pentae
noic)+
6∙(%
hexa
enoic)
/%totalS
AT]
(Pirinie
tal.,20
07).
**DET
RITA
Lfattyacids=
[C15
:0+
C15iso
+C1
5anteiso
+C1
7:0+
C17iso
+C1
7anteiso
+C1
8:1(
n-7)
](M
ayzaud
etal.,19
89;Najde
ket
al.,20
02).
***EFA
—essentialfatty
acids=
C20:4(
n-6)
[ARA
]+C2
0:5(
n-3)
[EPA
]+C2
2:6(n
-3)[D
HA].
96 D. Ezgeta-Balić et al. / Aquaculture 334–337 (2012) 89–100
Author's personal copy
dominance of diatoms both in the number of taxa and in terms of per-centage contribution (Davenport et al., 2011). Further, the mostabundant dinoflagellate, Prorocentrum micans, contains substantialproportions of 18:5(n-3) and 18:4(n-3), that is, twice the levels ofDHA (Mansour et al., 1999). The lack of 18:5(n-3) and low levels of18:4(n-3) with respect to DHA in the digestive glands of all bivalvespecies argue against dinoflagellates as being major dietary contribu-tor. Furthermore, important contribution of ARA combined with DHAand EPA more likely reflects an animal origin for this dietary compo-nent. This combination of markers might derive from ciliates, hetero-trophic flagellates (Silina and Zhukova, 2007) and zooplankton(Frazer et al., 1989). High concentration of ARA was also identifiedin zooplankton sample with higher proportion of carnivorous andomnivorous zooplankton groups in relation to herbivores zooplank-ton group (Serrazanetti et al., 1994).
The fatty acid composition of the digestive glands showed that allfour bivalve species had a mixed diet over the course of the study. Thepattern of Fatty Acid Trophic Marker (FATM) inferred from PCA sug-gested that the relative contribution of different dietary componentsvaried over the year in each species. Observed differences could bedue to differences in their position in the water column, filtrationrate and seasonal changes of food sources in surrounding water.Some species showed selection based on particle size, shape, nutritivevalue or chemical component on the surface (Beninger et al., 2007;Bougrier et al., 1997; Defossez and Hawkins, 1997; MacDonald andWard, 1994; Prins et al., 1991; Yahel et al., 2009) and that couldalso be the cause of observed differences in the bivalve diet.
M. galloprovincialis during the period from May to September, andother species from May to July were mainly fed with diatoms whatwas in accordance with high phytoplankton abundance, dominated
by diatoms, recorded from May 2009 to September 2009 (NinčevićGladan, unpublished data). Beside phytoplankton markers,18:2(n-6) fatty acid contributed significantly to digestive gland inM. barbatus, M. galloprovincialis and O. edulis but less so inA. noae. The sources of this fatty acid could be terrestrial plants(Budge and Parrish, 1998), sea-grasses (Kharlamenko et al., 2001)or some protozoa (Zhukova and Kharlamenko, 1999) but as protozoa,especially ciliates, dominate the summer microzooplankton in MaliSton Bay (Vidjak et al., 2007) this marker was most probably derivedfrom them. However, Aleppo pine (Pinus halepensis) pollen grains can-not be excluded as a source, since incidental ingestion by fan shells(P. nobilis) has been reported from the same area (Davenport et al.,2011),while pollen grainswere observed in stomachs of all species dur-ing the spring of 2009 (Ezgeta-Balić, personal observation). On theother hand, pollen is difficult to digest, since the outer coat of pollengrains is highly resistant to degradation (Heslop-Harrison, 1971) unlessmechanically breached. On balance, ciliates appear to be themost likelysource of 18:2(n-6) fatty acid.
Despite the highest abundance of phytoplankton which occurred inSeptember (NinčevićGladan, unpublished data), the fatty acid data clear-ly indicate that the type of particles ingested by three of the species (A.noae, M. barbatus and O. edulis) was preferentially composed of detritusat this time. This contrasts with previous findings (e.g. Langdon andNewell, 1990), where the contribution of detritus to bivalve diet wasfound to be important only during periods when abundance of phyto-plankton was too low to satisfy bivalve energy demands. However,branched chain (iso and anteiso) and odd-numbered fatty acids andC18:1(n-7), characteristic of bacteria and detritus, increase in particulateorganic matter toward bloom decay (Mayzaud et al., 1989), which prob-ably began in September and thus caused an increase in detrital FATM.
Fig. 4. Digestive gland PCA analysis for (A) Arca noae, (B) Modiolus barbatus, (C) Mytilus galloprovincialis and (D) Ostrea edulis. Projections of variables on the PC1–PC2 plane aregiven in circles.
97D. Ezgeta-Balić et al. / Aquaculture 334–337 (2012) 89–100
Author's personal copy
Besides detritus inM. galloprovincialis and zooplankton inM. barbatus,A. noae and O. edulis, the increased ARA/EPA ratios might point to bivalvelarvae (Napolitano et al., 1988) as an additional source of nutrition fromSeptember to March. Such larvae are present in the water column ofMali Ston Bay throughout the year, accumulating mainly in the middlelayers (Viličić et al., 1994). Relevant to this is that, ingestion and full diges-tion of bivalve larvaewere demonstrated by experimental and field studyfor Mytilus edulis (Lehane and Davenport, 2004). The same authors latershowed that zooplankton ingestion was routine in farmed mussels(Lehane and Davenport, 2006). Larviphagy was also recorded for all in-vestigated species in different amount (Peharda et al., 2012) what isnow further proven with this study. Those findings rise up a question ofsustainable aquaculture in the area where aquaculture of oysters andmussels production relies only on spat collected from the nature.
The need for increased food quality in terms of de-saturationcould be linked to maintenance of organism function under condi-tions of low temperature. Some studies have suggested that enhancedde-saturation in response to decreased temperature could be maskedby the influence of PUFAs of dietary origin (DeMoreno et al., 1976).This was consistent with the high unsaturation degree derivingfrom elevated levels primarily of DHA, EPA and ARA. The ratios infavor of DHA and ARA over EPA indicated an animal component inthe bivalve's diet. Higher contributions made by animal food sourcesto the bivalve's diet during winter and early spring identified in thedigestive gland of all species corresponded to a low abundance ofphytoplankton during this period (Ninčević Gladan, unpublisheddata).
Bivalve fatty acid composition usually reflects a fatty acid compo-sition of their diet, however bivalves showed some ability to elongate(e.g. 16:1(n-7) to 18:1(n-7); 18:1(n-9) to 20:1(n-9); 20:5(n-3) to22:5(n-3); 20:4(n-6) to 22:4(n-6); Albentosa et al., 1996; Delaporteet al., 2005) or desaturate (e.g. 20:3 n-6 to 20:4 n-6; Albentosaet al., 1996) fatty acids. Above mentioned studies were performedunder the laboratory condition when bivalves were fed on culturedphytoplankton or microalgae with known fatty acid compositionwhat facilitate following fatty acid bioconversion. This study was per-formed under the natural condition with mixed food sources thusmaking difficult to follow possible bioconversion.
The selective incorporation of PUFA from the diet differed amongspecies as was reflected in FA profiles of their muscle tissues(Fig. 5). Accumulation of ARA was evident in the muscles of all speciesexcept those of M. galloprovincialis during the cold season; enrich-ment of DHA occurred in A. noae and M. barbatus throughout theyear and in O. edulis during spring and summer. Accumulation ofEPA in A. noae, M. barbatus and M. galloprovincialis occurred only inSeptember and in O. edulis during the period from May to September;otherwise levels were either similar to or lower than in the digestiveglands. The differences in accumulation could be related to the ener-getic character with which EPA has been attributed. The lower levelsof EPA in the adductor muscles than in the digestive glands suggestthat EPA was probably catabolised for the acquisition of the energyrequired for diverse metabolic functions. PUFA are also used selec-tively as energy reserves during periods of nutritional shortage(Freitas et al., 2002). This could plausibly explain significantly lowerEPA in the adductor muscles of all bivalves during the cold monthswhen food availability due to low abundance of phytoplankton, espe-cially diatoms, for which EPA is a biomarker. Higher contribution ofARA in muscle tissue during the cold months, in all species exceptM. galloprovinicalis, could indicate accumulation of ingested zoo-plankton fatty acids which they consume during the winter. As carni-vores and omnivores tend to accumulate 18:1(n-9) in their tissue(Wilson et al., 2010) high accumulation of this carnivory marker inmuscle tissue of M. barbatus, O. edulis and M. galloprovincialis duringthe cold months once again pointed out importance of zooplanktonin bivalve diet. Unlike EPA, the adductor muscle levels of ARA werelower during the spring–summer period. ARA is a major precursor
of eicosanoids including prostaglandins which influence the repro-ductive process in mollusks (Soudant et al., 1999). Prostaglandinstimulates muscle contraction and egg release during spawning(Palacios et al., 2005), which occurred from August to Septemberfor A. noae and M. barbatus (Mladineo et al., 2007; Peharda et al.,2006). Although previous studies (Marčelja, 2009) have identifiedtwo reproductive peaks, a decrease in condition index of O. edulis dur-ing the investigation period showed that gamete release occurredfromMay to August. According to the condition index,M. galloprovin-cialis showed a prolonged egg releasing period from May to January,with sharpest decrease from October to February what correspondto period with low accumulation of ARA.
Besides retention of DHA, the adductormuscles of A. noae,M. barbatusand O. edulis were also rich in NMIDs, in contrast to M. galloprovincialiswhere the levels of both fatty acids were similar or even lower than inthe digestive gland. NMIDs are distributed in greater quantities in the or-gans more exposed to the immediate environments, such as the gills,mantle and foot (Klingensmith, 1982). NMIDs and their precursor palmi-toleic acid were negatively correlated in all species implying that synthe-sis was also stimulated by the presence of C16:1(n-7) in the diet(Zhukova, 1991). A role in substitution of essential fatty acids is suggestedfrom the negative correlation of NMIDs in the adductor muscle with EFAin the digestive glands observed for each species. This relation was not,however, observed inM. galloprovincialis.
In conclusion, our results showed that the studied bivalves usedmixed food, the quality of which depended strongly on seasonalchanges in seston composition. During the periods with a higherabundance of phytoplankton in spring and summer, all bivalve spe-cies mainly ingested phytoplankton followed by zooplankton and de-tritus. Due to low phytoplankton abundance during the autumn–winter period, bivalves relied on other food sources — zooplanktonand/or detritus. However, the FA composition of their muscles indi-cated differences in selective incorporation of PUFA from their diets.While A. noae and M. barbatus accumulated significantly PUFA duringall and O. edulis during spring–summer period, in M. galloprovincialisthis tendency was not observed at all, irrespective of diet consumed.
Since investigated bivalve species used the same food sources,competition among them may occur. However, as Mali Ston Baywas characterized as a moderately eutrophicated area (Viličić,1989), its primary production plus the availability of other foodsources are probably sufficient to satisfy the demands of presentlyaquacultured quantities of oysters and mussels as well as speciesthat occur in natural populations. However, it is planned that bivalveaquaculture production in the area will increase by several folds po-tentially creating conditions with more intensive competition for afood between different species. Furthermore, observed utilization ofbivalve larva as food source is interesting finding from the aquacul-ture point of view. In an area like Mali Ston Bay, where all aquaculturerelies only on natural spat and cultured species live suspended in highdensities in the water column, their feeding on bivalve larvae couldreduce available spat and thus make aquaculture unsustainable overa longer term.
Role of funding source
Funding for this studywas providedby the “Unity throughKnowledgeFund” (UKF) under a grant program designed to support young re-searchers. UKFhadnodirect involvement in studydesign, collection, anal-ysis and interpretation of data, or inwriting of themanuscript. Permissionfor publishing this material was obtained from the funding organization.
Acknowledgments
This research was financed by support from the Croatian ‘Unitythrough Knowledge’ grant 3A “Bivalve feeding, competition andpredation—what is at play”. The authors are grateful toMaro Franušić
98 D. Ezgeta-Balić et al. / Aquaculture 334–337 (2012) 89–100
Author's personal copy
for technical assistance with sample collection and Prof Brian Mortonand Prof John Davenport for their useful suggestions that significantlyimproved the quality of the manuscript.
References
Abad, M., Ruiz, C., Martines, D., Mosquera, G., Sánchez, J., 1995. Seasonal variations oflipid classes and fatty acids in flat oyster, Ostrea edulis, from San Cibran (Galicia,Spain). Comparative Biochemistry and Physiology. C 110, 109–118.
Ahn, I.Y., Choo, K.W., Choi, K.S., Seo, Y., Shin, J., 2000. Lipid content and composition ofthe Antarctic lamellibranch, Laternula elliptica (King & Broderip) (Anomalodesmata: Laternulidae), in King George Island during an austral summer. Polar Biology 23,24–33.
Albentosa, M., Labarta, U., Fernández-Reiriz, M.J., Pérez-Camacho, A., 1996. Fattyacid composition of Ruditapes decussatus spat fed on different microalgaediets. Comparative Biochemistry and Physiology Part A 113, 113–119.
Alfaro, A.C., 2006. Evidence of cannibalism and bentho-pelagic coupling within the lifecycle of the mussel, Perna canaliculus. Journal of Experimental Marine Biology andEcology 329, 206–217.
Alkanani, T., Parrish, C.C., Thompson, R.J., McKenzie, C.H., 2007. Role of fatty acids incultured mussels,Mytilus edulis, grown in Notre Dame Bay, Newfoundland. Journalof Experimental Marine Biology and Ecology 348, 33–45.
Allan, E.L., Ambrose, S.T., Richoux, N.B., Froneman, P.W., 2010. Determining spatialchanges in the diet of nearshore suspension-feeders along the SouthAfrican coastline:stable isotope and fatty acid signatures. Estuarine, Coastal and Shelf Science 87,463–471.
Bachok, Z., Mfilinge, P.L., Tsuchiya, M., 2003. The diet of mud clam Geloina coaxans(Mollusca, Bivalvia) as indicated by fatty acid markers in a subtropical mangroveforest of Okinawa, Japan. Journal of Experimental Marine Biology and Ecology292, 187–197.
Beninger, P.G., Decottignies, P., Guiheneuf, F., Barille, L., Rince, Y., 2007. Comparison ofparticle processing by two introduced suspension feeders: selection in Crepidulafornicata and Crassostrea gigas. Marine Ecology Progress Series 334, 165–177.
Beninger, P.G., Stephan, G., 1985. Seasonal variations in the fatty acids of the triacylgly-cerols and phospholipids of two populations of adult clam (Tapes decussatus L. andT. philippinarum) reared in a common habitat. Comparative Biochemistry andPhysiology Part B 81, 591–601.
Bergé, J.P., Barnathan, G., 2005. Fatty acids from lipids of marine organisms: molecularbiodiversity, roles as biomarkers, biologically active compounds, and economicalaspects. Advances in Biochemical Engineering/Biotechnology 96, 49–125.
Bligh, E.G., Dyer, W.J., 1959. A rapid method of total lipid extraction and purification.Canadian Journal of Biochemistry and Physiology 37, 910–917.
Bougrier, S., Hawkins, A.J.S., Heral, M., 1997. Preingestive selection of different microalgalmixtures inCrassostrea gigas andMytilus edulis, analysed byflowcytometry. Aquaculture150, 123–134.
Budge, S.M., Parrish, C.C., 1998. Lipid biogeochemistry of plankton, settling matter andsediments in Trinity Bay, Newfoundland. II. Fatty acids. Organic Geochemistry 29,1547–1559.
Compton, T.J., Kentie, R., Storey, A.W., Veltheim, I., Pearson, G.B., Piersma, T., 2008. Carbonisotope signatures reveal that diet is related to the relative sizes of the gills and palpsin bivalves. Journal of Experimental Marine Biology and Ecology 361, 104–110.
Cloern, J.E., 1982. Does the benthos control phytoplankton biomass in South San FranciscoBay? Marine Ecology Progress Series 9, 191–202.
Davenport, J., Chen, X., 1987. A comparison of methods for the assessment of conditionin the mussel (Mytilus edulis L.). Journal of Molluscan Studies 53, 293–297.
Davenport, J., Ezgeta-Balić, D., Peharda, M., Skejić, S., Ninčević-Gladan, Ž., Matijević, S.,2011. Size-differential feeding in Pinna nobilis L. (Mollusca: Bivalvia): explorationof detritus, phytoplankton and zooplankton. Estuarine, Coastal and Shelf Science92, 246–254.
Davenport, J., Smith, R.J.J.W., Packer, M., 2000.MusselsMytilus edulis: significant consumersand destroyers of mesozooplankton. Marine Ecology Progress Series 198, 131–137.
Dalsgaard, J., John, M.S., Kattner, G., Müller-Navarra, D., Hagen, W., 2003. Fatty acidtrophic markers in the pelagic marine environment. Advances in Marine Biology46, 229–352.
Defossez, J.M., Hawkins, A.J.S., 1997. Selective feeding in shellfish: size-dependent rejectionof large paticles within pseudofaeces from Mytilus edulis, Ruditapes philippinarum andTapes decussatus. Marine Biology 129, 139–147.
Delaporte, M., Soudant, P., Moal, J., Kraffe, E., Marty, Y., Samain, J.F., 2005. Incorporationand modification of dietary fatty acids in gill polar lipids by two bivalve speciesCrassostrea gigas and Ruditapes philippinarum. Comparative Biochemistry andPhysiology Part A 140, 460–470.
DeMoreno, J.E.A., Moreno, V.J., Brenner, R.R., 1976. Lipid metabolism of the yellowclam, Mesodesma mactroides: I. Composition of the lipids. Lipids 11, 334–340.
Dunstan, G.A., Volkman, J.K., Barrett, S.M., Leroi, J.M., Jeffrey, S.W., 1994. Essentialpolyunsaturated fatty acids from 14 species of diatom (Bacillariophyceae). Phy-tochemistry 35, 155–161.
Frazer, A.J., Sargent, J.R., Gamble, J.C., Seaton, D.D., 1989. Formation and transfer of fattyacids in an enclosed marine food chain comprising phytoplankton, zooplanktonand herring (Clupea harengus L.) larvae. Marine Chemistry 27, 1–18.
Freitas, L., Fernandez-Reiriz, M.J., Labarta, U., 2002. Fatty acid profiles of Mytilusgalloprovincialis (Lmk) mussel of subtidal and rocky shore origin. ComparativeBiochemistry and Physiology. B 132, 453–461.
Fig. 5. Unsaturation degree of digestive gland and muscle tissue of (A) Arca noae, (B) Modiolus barbatus, (C) Mytilus galloprovincialis and (D) Ostrea edulis.
99D. Ezgeta-Balić et al. / Aquaculture 334–337 (2012) 89–100
Author's personal copy
Heslop-Harrison, J., 1971. The PollenWall: Structure andDevelopment. In: Heslop-Harrison,J. (Ed.), Pollen Development and Physiology. Butterworth, London, pp. 75–98.
Jasprica, N., Carić, M., 1997. A comparison of the phytoplankton biomass estimatorsand their environmental correlates in the Mali Ston Bay (Southern Adriatic).P.S.Z.N. Marine Ecology 18, 35–50.
Kharlamenko, V.I., Kiyashko, S.I., Imbs, A.B., Vyshkvartzev, D.I., 2001. Identification offood sources of invertebrates from the seagrass Zostera marina community usingcarbon and sulphur stable isotope ratio and fatty acid analyses. Marine EcologyProgress Series 220, 103–117.
Klingensmith, J.S., 1982. Distribution of methylene and non-methylene interrupted dienoicfatty acids in polar lipids and triacylglycerols of selected tissue of the hardshell clam(Mercenaria mercenaria). Lipids 17, 976–981.
Labarta, U., Fernandez-Reiriz, M., Perez-Camacho, A., 1999. Dynamics of fatty acids inthe larval development, metamorphosis and post-metamorphosis of Ostrea edulis(L.). Comparative Biochemistry and Physiology Part A 123, 249–254.
Langdon, C.J., Newell, R.I.E., 1990. Utilization of detritus and bacteria as food sources bytwo bivalve suspension-feeders, the oyster Crassostrea virginica and the musselGeukensia demissa. Marine Ecology Progress Series 58, 299–310.
Lehane, C., Davenport, J., 2002. Ingestion of mesozooplankton by three species of bivalve;Mytilus edulis, Cerastoderma edule and Aequipecten opercularis. Journal of the MarineBiological Association of the UK 82, 615–619.
Lehane, C., Davenport, J., 2004. Ingestion of bivalve larvae byMytilus edulis: experimentaland field demonstrations of larviphagy in farmed blue mussels. Marine Biology 145,101–107.
Lehane, C., Davenport, J., 2006. A 15-month study of zooplankton ingestion by farmedmussels (Mytilus edulis) in Bantry Bay, Southwest Ireland. Estuarine, Coastal andShelf Science 67, 645–652.
MacDonald, B.A., Thompson, R.J., 1986. Influence of temperature and food availability onthe ecological energetic of the giant scallop Placopecten magellanicus III. Physiologicalecology, the gametogenetic cycle and scope for growth. Marine Biology 93, 37–48.
MacDonald, B.A.,Ward, J.E., 1994. Variation in food quality and particle selectivity in the seascallop Placopecten magellanicus (Mollusca: Bivalvia). Marine Ecology Progress Series108, 251–264.
Mansour, M.P., Volkman, J.K., Jackson, A.E., Blackburn, S.I., 1999. The fatty acid and sterolcomposition of five marine dinoflagellates. Journal of Phycology 35, 710–720.
Mayzaud, P., Chanut, J.P., Ackman, R.G., 1989. Seasonal changes of the biochemicalcomposition of marine particulate matter with special reference to fatty acidsand sterols. Marine Ecology Progress Series 56, 189–204.
Marčelja, E., 2009. Reproduktivni ciklus kamenice (Ostrea edulis L.) u Malostons-kom zaljevu. In: Besendorfer, V. (Ed.), Zbornik sažetaka 10. Hrvatskog biološ-kog kongresa s međunarodnim sudjelovanjem. Hrvatsko biološko društvo1885, Zagreb, pp. 247–248.
Mladineo, I., Peharda, M., Orhanović, S., Bolotin, J., Pavela-Vrančić, M., Treursić, B., 2007.The reproductive cycle, condition index and biochemical composition of horse-bearded mussel Modiolus barbatus. Helgoland Marine Research 61, 183–192.
Morrison, W.R., Smith, L.M., 1964. Preparation of fatty acid methyl esters and dimethylacetals from lipids with boron fluoride–methanol. Journal of Lipid Research 5,600–608.
Najdek, M., Degobbis, D., Mioković, D., Ivančić, I., 2002. Fatty acid and phytoplanktoncomposition of different types of mucilaginous aggregates in the northern Adriatic.Journal of Plankton Research 24, 429–441.
Napolitano, G.E., Ratnayake, W.M.N., Ackman, R.G., 1988. Fatty acid components of larvalOstrea edulis (L.): importance of triacylglycerols as a fatty acid reserve. ComparativeBiochemistry and Physiology. B 90, 875–883.
Palacios, E., Racotta, I.S., Kraffe, E., Marty, Y., Moal, J., Samain, J.F., 2005. Lipid compositionof the giant lion's paw scallop (Nodipecten subnodosus) in relation to gametogenesis I.Fatty acids. Aquaculture 250, 270–282.
Pazos, A.J., Ruíz, C., García-Martin,O., Abad,M., Sánchez, J.L., 1996. Seasonal variations of thelipid content and fatty acid composition of Crassostrea gigas cultured in E1 Grove,Galicia, N.W, Spain. Comparative Biochemistry and Physiology Part B 114, 171–179.
Peharda, M., Mladineo, I., Bolotin, J., Kekez, L., Skaramuca, B., 2006. The reproductivecycle and potential protandric development of the Noah's Ark shell, Arca noae L.:implications for aquaculture. Aquaculture 252, 317–327.
Peharda, M., Ezgeta-Balić, D., Davenport, J., Bojanić, N., Vidjak, O., Ninčević-Gladan, Ž.,2012. Differential ingestion of zooplankton by four species of bivalves (Mollusca)in Mali Ston Bay, Croatia. Marine Biology doi:10.1007/s00227-011-1866-5.
Pirini, M., Manuzzi, M.P., Pagliarani, A., Trombetti, F., Borgatti, A.R., Ventrella, V., 2007.Changes in fatty acid composition ofMytilus galloprovincialis (Lmk) fed onmicroalgaland wheat germ diets. Comparative Biochemistry and Physiology. B 147, 616–626.
Prato, E., Danieli, A., Maffia, M., Biandolino, F., 2010. Lipid and fatty acid compositions ofMytilus galloprovincialis cultured in the Mar Grande of Taranto (southern Italy):feeding strategies and trophic relationships. Zoological Studies 49, 211–219.
Prins, T.C., Small, A.C., Pouwer, A.J., 1991. Selective ingestion of phytoplankton by the bi-valvesMytilus edulis L. and Cerastoderma edule (L.). Hydrobiological Bulletin 25, 93–100.
Serrazanetti, G.P., Pagnucco, C., Conte, L.S., Artusi, R., Fonda-Umani, S., Bergami, C.,1994. Sterols and fatty acids in zooplankton of the Gulf of Trieste. Comparative Bio-chemistry and Physiology. B 107, 443–446.
Silina, A.V., Zhukova, N.V., 2007. Growth variability and feeding of scallop Patinopectenyessoensis on different bottom sediments: evidence from fatty acid analysis. Journalof Experimental Marine Biology and Ecology 348, 46–59.
Soudant, P., van Ryckeghem, K., Marty, Y., Moal, J., Samain, J.F., Sorgeloos, P., 1999. Compari-son of the lipid class and fatty acid composition between a reproductive cycle in natureand a standard hatchery conditioning of the Pacific oyster Crassostrea gigas. ComparativeBiochemistry and Physiology. B 123, 209–222.
Tieszen, L.L., Boutton, T.W., Tesdahl, K.G., Slade, N.A., 1983. Fractionation and turnoverof stable carbon isotopes in animal tissues: implication for δ13C analysis of diet.Oceanologia 57, 32–37.
Vidjak, O., Bojanić, N., Kušpilić, G., Ninčević Gladan, Ž., Tičina, V., 2007. Zooplankton com-munity and hydrographical properties of the Neretva Channel (eastern Adriatic Sea).Helgoland Marine Research 61, 267–282.
Viličić, D., Mušin, D., Jasprica, N., 1994. Interrelations between hydrographic conditions,nanoplankton and bivalve larvae in the Mali Ston Bay (Southern Adriatic). ActaAdriatica 34, 55–65.
Viličić, D., 1989. Phytoplankton population density and volume as indicators of eutrophi-cation in the eastern part of the Adriatic Sea. Hydrobiologia 174, 117–132.
Wilson, S.E., Steinberg, D.K., Chu, F.-L.E., Bishop, J.K.B., 2010. Feeding ecology of mesopelagiczooplankton of the subtropical and subarctic North Pacific Ocean determinedwith fattyacid biomarkers. Deep Sea Research Part I 57, 1278–1294.
Xu, Q., Yang, H., 2007. Food sources of three bivalves living in two habitats of JiaozhouBay (Qingdao, China): indicated by lipid biomarkers and stable isotope analysis.Journal of Shellfish Research 26, 1–7.
Yahel, G.,Marie, D., Beninger, P.G., Eckstein, S., Genin, A., 2009. In situ evidence for pre-capturequalitative selection in the tropical bivalve Lithophaga simplex. Aquatic Biology 6,235–246.
Zhukova, N.V., Kharlamenko, V.I., 1999. Sources of essential fatty acids in the marinemicrobial loop. Aquatic Microbial Ecology 17, 153–157.
Zhukova, N.V., 1991. The pathway of the biosynthesis of non-methylene-interrupted die-noic fatty acids inmollusks. Comparative Biochemistry and Physiology. B 100, 801–804.
100 D. Ezgeta-Balić et al. / Aquaculture 334–337 (2012) 89–100
Related Documents


![Are There Trends in Bivalve Ornamentation Throughout the ......All Bivalves [Stratigraphic Data, Species] All Bivalves [Occurrence Data, Species] All Bivalves [Collections Data, Genus]](https://static.cupdf.com/doc/110x72/60636b20f479816b1c26bf26/are-there-trends-in-bivalve-ornamentation-throughout-the-all-bivalves-stratigraphic.jpg)