Seasonal dynamics and conservative mixing of dissolved organic matter in the temperate eutrophic estuary Horsens Fjord Stiig Markager a, * , Colin A. Stedmon a , Morten Søndergaard b a Department of Marine Ecology, National Environmental Research Institute, Aarhus University, Frederiksborgvej 399, DK-4000 Roskilde, Denmark b Freshwater Biological Laboratory, University of Copenhagen, Helsingørsgade 51, DK-3400 Hillerød, Denmark article info Article history: Received 12 October 2010 Accepted 20 January 2011 Available online 27 January 2011 Keywords: dissolved organic matter DON DOP conservative mixing PARAFAC fluorescence nutrient loadings Denmark Horsens Fjord 55 51 0 10" N 09 54 0 50" E abstract This study presents the results of a year-long study investigating the characteristics of dissolved organic matter (DOM) in the Danish estuary, Horsens Fjord. The estuary is shallow with a mean depth of 2.9 m and receives high loadings of inorganic nutrients from its catchment. The behaviour of different DOM parameters i.e. dissolved organic carbon (DOC), nitrogen (DON), and phosphorous (DOP), light absorption and eight fluorescence components, were analysed relative to conservative mixing. Many of the parameters did not behave conservatively. For DON, DOP and absorption, more than 65% of the fresh- water concentration was removed initially at salinities below 12. At higher salinities two general patterns were identified. Concentrations of DON, DOP and four humic fluorescent fractions were not, or only weakly, related to salinity, showing that other processes than mixing were involved. Other parameters such as DOC and two terrestrial humic components behaved conservatively. The same was true for DON during winter. These results are consistent with the finding that autochthonous DOM was the dominant source of DOM in this estuary. The molar C:N and C:P ratios for DOM (DOC:DON and DOC:DOP) in freshwater were 11 and 758, respectively. The DOC:DON ratio increased in the estuary during the productive season to average values between 13 and 17, due to accumulation of DOC and removal of DON. The DOC:DOP ratio decreased within the estuary showing that in general DOM was enriched with phosphorous, however, during the spring, when phosphorous was limiting, the DOC:DOP ratio increased due to low DOP concentrations. We hypothesise that in estuaries with high loadings of inorganic nutrients relative to DOM, production and degradation of DOM within the estuary will dominate over allochthonous inputs and control both concentration and characteristics of DOM. A conceptual model for this hypothesis is presented. Ó 2011 Elsevier Ltd. All rights reserved. 1. Introduction Estuaries represent a transition zone between terrestrial and marine environments and are highly dynamic ecosystems where freshwater constituents are modified, degraded, diluted, assimilated or transformed into compounds/concentrations typical for the marine environment. The mechanisms acting on the freshwater constituents are physical, chemical, and biological. When freshwater enters the estuary the ionic environment changes dramatically, with both an increase in ionic strength and composition, which can induce flocculation (Sholkovitz, 1976; Sholkovitz et al., 1978; Søndergaard et al., 2003). Bacterial degradation of organic matter continues across the salinity gradient but is affected by the increase in ionic strength and changes in the bacterial population (Stepanauskas et al., 1999; Wikner et al., 1999; Langenheder et al., 2003). Photochemical processes are enhanced due to greater light penetration in the estuary compared to streams. This may lead to enhanced photo- degradation and can transform dissolved organic matter (DOM) into more biodegradable products (Moran and Zepp, 1997; Moran et al., 2000). However, photochemical processes may also lower the degradability of freshly produced DOM (Tranvik and Kokalj, 1998). The higher irradiance and longer residence time also means that marine plants, particularly phytoplankton, can utilise most or all of the available inorganic nutrients and transform them into organic matter. Initially, this organic matter is in particulate form, but due to grazing, cell lysis and excretion, a fraction and probably the majority, is sooner or later transformed into DOM (Carlson et al., 1998; Conan et al., 2007). Thus, the main sources of DOM (terrestrial versus aquatic plants) and its composition, change accordingly among estuaries depending on their hydrodynamic characteristics. Dissolved organic matter is composed of a mixture of different compounds but in general less than 14% can be attributed * Corresponding author. E-mail address: [email protected] (S. Markager). Contents lists available at ScienceDirect Estuarine, Coastal and Shelf Science journal homepage: www.elsevier.com/locate/ecss 0272-7714/$ e see front matter Ó 2011 Elsevier Ltd. All rights reserved. doi:10.1016/j.ecss.2011.01.014 Estuarine, Coastal and Shelf Science 92 (2011) 376e388

Welcome message from author
This document is posted to help you gain knowledge. Please leave a comment to let me know what you think about it! Share it to your friends and learn new things together.
Transcript
lable at ScienceDirect
Estuarine, Coastal and Shelf Science 92 (2011) 376e388
Contents lists avai
Estuarine, Coastal and Shelf Science
journal homepage: www.elsevier .com/locate/ecss
Seasonal dynamics and conservative mixing of dissolved organic matter in thetemperate eutrophic estuary Horsens Fjord
Stiig Markager a,*, Colin A. Stedmon a, Morten Søndergaard b
aDepartment of Marine Ecology, National Environmental Research Institute, Aarhus University, Frederiksborgvej 399, DK-4000 Roskilde, Denmarkb Freshwater Biological Laboratory, University of Copenhagen, Helsingørsgade 51, DK-3400 Hillerød, Denmark
a r t i c l e i n f o
Article history:Received 12 October 2010Accepted 20 January 2011Available online 27 January 2011
Keywords:dissolved organic matterDONDOPconservative mixingPARAFACfluorescencenutrient loadingsDenmarkHorsens Fjord55�51010" N09�54050" E
* Corresponding author.E-mail address: [email protected] (S. Markager).
0272-7714/$ e see front matter � 2011 Elsevier Ltd.doi:10.1016/j.ecss.2011.01.014
a b s t r a c t
This study presents the results of a year-long study investigating the characteristics of dissolved organicmatter (DOM) in the Danish estuary, Horsens Fjord. The estuary is shallow with a mean depth of 2.9 mand receives high loadings of inorganic nutrients from its catchment. The behaviour of different DOMparameters i.e. dissolved organic carbon (DOC), nitrogen (DON), and phosphorous (DOP), light absorptionand eight fluorescence components, were analysed relative to conservative mixing. Many of theparameters did not behave conservatively. For DON, DOP and absorption, more than 65% of the fresh-water concentration was removed initially at salinities below 12. At higher salinities two general patternswere identified. Concentrations of DON, DOP and four humic fluorescent fractions were not, or onlyweakly, related to salinity, showing that other processes than mixing were involved. Other parameterssuch as DOC and two terrestrial humic components behaved conservatively. The same was true for DONduring winter. These results are consistent with the finding that autochthonous DOM was the dominantsource of DOM in this estuary. The molar C:N and C:P ratios for DOM (DOC:DON and DOC:DOP) infreshwater were 11 and 758, respectively. The DOC:DON ratio increased in the estuary during theproductive season to average values between 13 and 17, due to accumulation of DOC and removal of DON.The DOC:DOP ratio decreased within the estuary showing that in general DOM was enriched withphosphorous, however, during the spring, when phosphorous was limiting, the DOC:DOP ratio increaseddue to low DOP concentrations. We hypothesise that in estuaries with high loadings of inorganicnutrients relative to DOM, production and degradation of DOM within the estuary will dominate overallochthonous inputs and control both concentration and characteristics of DOM. A conceptual model forthis hypothesis is presented.
� 2011 Elsevier Ltd. All rights reserved.
1. Introduction
Estuaries represent a transition zone between terrestrial andmarine environments and are highly dynamic ecosystems wherefreshwater constituents are modified, degraded, diluted, assimilatedor transformed into compounds/concentrations typical for themarine environment. The mechanisms acting on the freshwaterconstituents are physical, chemical, and biological. When freshwaterenters the estuary the ionic environment changes dramatically, withboth an increase in ionic strength and composition,which can induceflocculation (Sholkovitz, 1976; Sholkovitz et al., 1978; Søndergaardet al., 2003). Bacterial degradation of organic matter continuesacross the salinity gradient but is affected by the increase in ionicstrength and changes in the bacterial population (Stepanauskas et al.,
All rights reserved.
1999; Wikner et al., 1999; Langenheder et al., 2003). Photochemicalprocesses are enhanced due to greater light penetration in theestuary compared to streams. This may lead to enhanced photo-degradation and can transform dissolved organic matter (DOM) intomore biodegradable products (Moran and Zepp, 1997; Moran et al.,2000). However, photochemical processes may also lower thedegradability of freshly produced DOM (Tranvik and Kokalj, 1998).The higher irradiance and longer residence time also means thatmarine plants, particularly phytoplankton, can utilise most or all ofthe available inorganic nutrients and transform them into organicmatter. Initially, this organic matter is in particulate form, but due tograzing, cell lysis and excretion, a fraction and probably the majority,is sooner or later transformed into DOM (Carlson et al., 1998; Conanet al., 2007). Thus, the main sources of DOM (terrestrial versusaquatic plants) and its composition, change accordingly amongestuaries depending on their hydrodynamic characteristics.
Dissolved organic matter is composed of a mixture of differentcompounds but in general less than 14% can be attributed
S. Markager et al. / Estuarine, Coastal and Shelf Science 92 (2011) 376e388 377
chemically to simple compounds like sugars, lipids or free aminoacids (Benner, 2002). The rest is a complex mixture of compoundsdiffering widely in structure and chemical composition, whichmake chemical characterization difficult. A fraction of DOM is col-oured (CDOM) and can be characterised using optical methods suchas absorption and fluorescence spectroscopy (e.g. Coble, 1996;Stedmon and Markager, 2003). Recent developments in dataanalysis techniques (Stedmon et al., 2003) allow us to quantify thefluorescence of different fluorescent components of the CDOM pooland thereby follow their temporal and spatial variabilities(Stedmon and Markager, 2005). We can seldom unambiguouslyassign the different components to specific sources/processes;nevertheless, by analysing the variability in space and time we canelucidate differences in their behaviour and thereby gather infor-mation about sources and fate. In this study we analyse the vari-ability of eight fluorescence components identified earlier(Stedmon and Markager, 2005) together with concentrations ofdissolved organic carbon (DOC), nitrogen (DON) and phosphorous(DOP) and light absorption. The aims are to test whether the DOMfractions differ in their pattern of distribution and deduce infor-mation from these patterns to explain the sources/role in thecycling of organic matter in the estuary. In particular we want toquantify the role of DON and DOP as sources of nutrients forphytoplankton.
A process which often is considered to dominate in estuaries isconservative mixing. For most compounds the concentrations infreshwater are much higher than in the marine end-member andthere is consequently a significant negative relationship betweenconcentration of a compound and salinity (e.g. Stedmon andMarkager, 2003; Kowalczuk et al., 2006; Spencer et al., 2007).However, if the compounds are degraded or produced at significantrates in the estuary, the observed concentrations will deviateconsiderably from a conservative mixing pattern. Our first objectiveis to evaluate to what extent conservative mixing is able to describethe variability of different DOM fractions.
In an estuary like Horsens Fjord with intense agriculturalactivity in its catchment and high nutrient loadings, the estuary
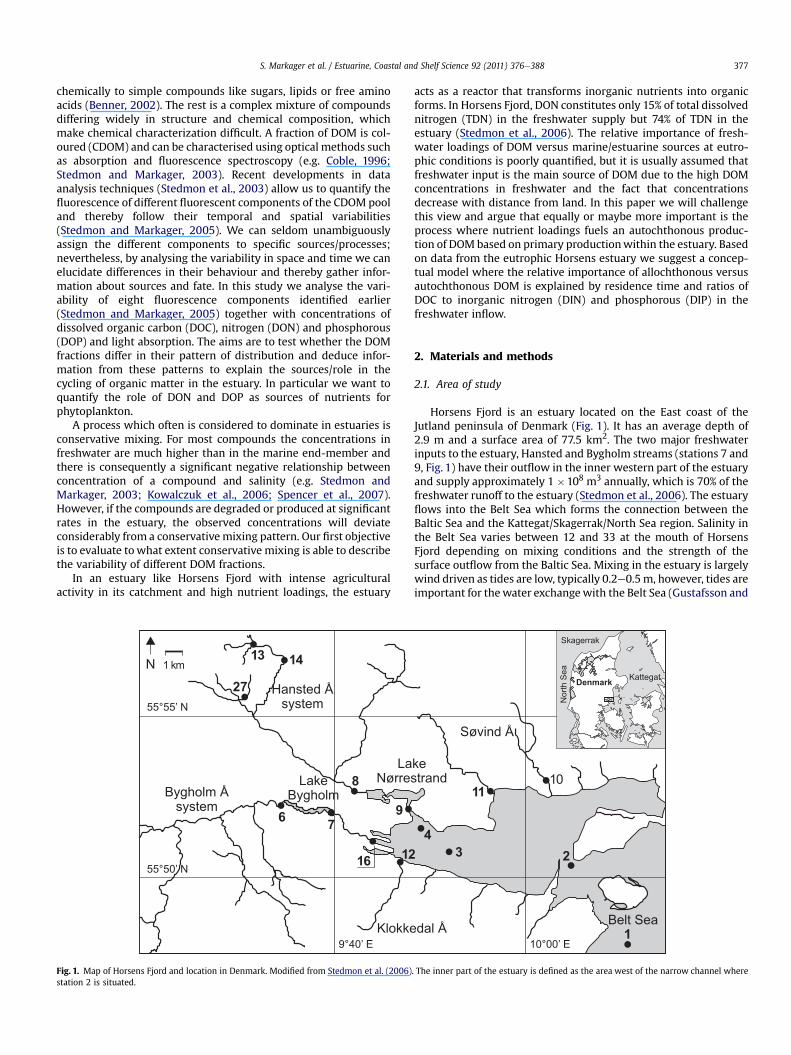
Fig. 1. Map of Horsens Fjord and location in Denmark. Modified from Stedmon et al. (2006)station 2 is situated.
acts as a reactor that transforms inorganic nutrients into organicforms. In Horsens Fjord, DON constitutes only 15% of total dissolvednitrogen (TDN) in the freshwater supply but 74% of TDN in theestuary (Stedmon et al., 2006). The relative importance of fresh-water loadings of DOM versus marine/estuarine sources at eutro-phic conditions is poorly quantified, but it is usually assumed thatfreshwater input is the main source of DOM due to the high DOMconcentrations in freshwater and the fact that concentrationsdecrease with distance from land. In this paper we will challengethis view and argue that equally or maybe more important is theprocess where nutrient loadings fuels an autochthonous produc-tion of DOM based on primary productionwithin the estuary. Basedon data from the eutrophic Horsens estuary we suggest a concep-tual model where the relative importance of allochthonous versusautochthonous DOM is explained by residence time and ratios ofDOC to inorganic nitrogen (DIN) and phosphorous (DIP) in thefreshwater inflow.
2. Materials and methods
2.1. Area of study
Horsens Fjord is an estuary located on the East coast of theJutland peninsula of Denmark (Fig. 1). It has an average depth of2.9 m and a surface area of 77.5 km2. The two major freshwaterinputs to the estuary, Hansted and Bygholm streams (stations 7 and9, Fig. 1) have their outflow in the inner western part of the estuaryand supply approximately 1 �108 m3 annually, which is 70% of thefreshwater runoff to the estuary (Stedmon et al., 2006). The estuaryflows into the Belt Sea which forms the connection between theBaltic Sea and the Kattegat/Skagerrak/North Sea region. Salinity inthe Belt Sea varies between 12 and 33 at the mouth of HorsensFjord depending on mixing conditions and the strength of thesurface outflow from the Baltic Sea. Mixing in the estuary is largelywind driven as tides are low, typically 0.2e0.5m, however, tides areimportant for thewater exchangewith the Belt Sea (Gustafsson and
. The inner part of the estuary is defined as the area west of the narrow channel where
S. Markager et al. / Estuarine, Coastal and Shelf Science 92 (2011) 376e388378
Bendtsen, 2007). The residence time is about 5e10 days (Josefsonand Rasmussen, 2000; Gustafsson and Bendtsen, 2007).
2.2. Sampling program and analysis
Water was collected in a year-long sampling program at thestations indicated in Fig. 1. Here we report data from stations 1e4and average flow weighted concentrations from 7, 9, 11 and 12. Thefour measured streams drain 77% of the total catchment of 517 km2.Stations were visited twice a month and at times weekly, fromSeptember 2001 to September 2002. There were three stationslocated within the estuary and one just outside the estuary. Atstations 1 and 2 samples were taken from 1, 5 and 16 m. The innerparts of the estuary were much shallower and samples wererestricted to 1 and 3 m at station 3 and 1 m only at station 4. Watersamples were taken using a GoFlo bottle mounted on a CTD profiler.
Chlorophyll concentrations were measured on a spectropho-tometer (Shimadzu UV-2401PC) after extraction in 96% ethanol(Jespersen and Christoffersen, 1987). Water chemistry samples(nutrients and DOC) were gently filtered through pre-combustedGF/F filters using a syringe filtration set up. Dissolved organiccarbon (DOC) samples (15 ml) were dispensed directly into acidwashed and pre-combusted glass vials and preserved with 150 ml2 M HCl. DOC was measured on a Shimadzu TOC-5000 analyserusing the approach detailed in Søndergaard et al., (2000). Filteredsample water for nutrient analysis was dispensed into plastic PEH(Polyphenylene ether homopolymer) bottles and stored frozen for1e8 weeks. Total dissolved nitrogen (TDN) and total dissolvedphosphorus (TDP) were measured using the approach described inValderrama (1981). Inorganic nutrients (nitrate, nitrite, ammoniumand phosphate) were measured using the approach detailed inHansen and Koroleff (1999) with flow injection on a Scalar auto-analyser. The concentrations of DON and DOP were determined bysubtracting the inorganic nutrient concentrations from the totaldissolved concentrations. Data for freshwater concentrations andrunoff were obtained from Stedmon et al. (2006).
Samples for light absorption were filtered through combustedAdvantech GF/F filters and stored refrigerated in acid washedamber glass bottles. Light absorption was measured on a Shimadzu2401PC spectrophotometer according to Stedmon et al. (2000) andlight absorption (a) and the slope parameter (S) were calculatedwith a non-linear curve fitting procedure according to Stedmonet al. (2000) from Eq. (1).
a�l�
¼ a375esðl0�lÞ (1)
Eight components of the coloured fractions of DOM wereidentified using fluorescence excitation-emission spectroscopy(EEM) as described in Stedmon andMarkager (2005). The EEM datawere analysed with the multivariate statistical approach, ParallelFactor Analysis (PARAFAC, Stedmon et al., 2003) and eight separatecomponents were identified. The variability and characteristics ofthe eight components (c1ec8) are described in Stedmon andMarkager (2005). Components c1, c3, c5 and c6 contain humicfluorophore groups and absorb primarily in the UV-C (c1 and c3)and UV-A (c5 and c6) parts of the spectrum. Components c2 and c4represent fulvic acid fluorophore groups and c7 and c8 tryptophanand tyrosine containing compounds, respectively.
Primary production by phytoplankton was measured as part ofthe Danish National Aquatic Monitoring and Assessment Program(Conley et al., 2002) with about weekly intervals at station 3. Carbonuptake was measured in 2 h laboratory incubations with 14C-bicarbonate (Steemann Nielsen, 1952). Briefly, 14C purchased at DHI,Hørsholm, Denmark was added (activity was adjusted according tochlorophyll concentration) and 8 subsamples were incubated for 2 h
at six different light intensities including two dark samples. Thesamples then filtered through GF/F filters, acidified and the carbonuptake was measured and calculated according to Markager (1998).Areal production rates were calculated from surface irradiance,measured values of downwelling attenuation coefficients and chlo-rophyll fluorescence profiles. Irradiance and chlorophyll fluores-cenceweremeasured along with profiles of salinity and temperatureas part of the national monitoring program.
Loadings of DOCwere calculated from daily flow rates measuredat stations 7, 9, 11 and 12 and Horsens Town sewage treatmentplant (station 16) and multiplied with DOC concentrations. Dailyvalues for DOC concentrations were found by linear interpolationsbetween measurements. The four measured catchments cover 77%of the total catchment for the estuary and the total loading wascalculated assuming the same loading per unit surface area of themeasured and unmeasured catchment areas.
Conservative mixing of a compound in an estuary can bedescribed by Eq. (2).
c ¼ ff cf þ fmcm (2)
where ff and fm are the fractions of freshwater and the marine end-member in the sample (sum ¼ 1) and cf and cm are the concen-trations in the two end-members, respectively. Assuming a salinityof zero in freshwater, ff for a given sample is equal to (Sm � S)/Sm,where S is the salinity of the sample. Eq. (2) can be rearranged to:
c ¼ Sm � SSm
�cf � cm
�þ cm (3)
This equation can be rearranged to Eq. (4) where c is a functionof salinity:
c ¼ cf þ Scm � cf
Sm(4)
If cf, cm and Sm are constants, Eq. (4) resembles a straight line.However, as we analysed data over an annual cycle all threeparameters varied over time. As the marine end-member could beboth surface and deep water from the Belt Sea, both cm and Smwereunknown whereas cf was measured. The mixing patterns (Eq. (4))were analysed both with a non-linear regression technique (SASproc NLIN, SAS Institute Inc., 2004), where cm and Sm were esti-mated parameters, and with ordinary linear regression. The non-linear technique accounted for the measured variability in cf.
3. Results
3.1. Seasonal patterns
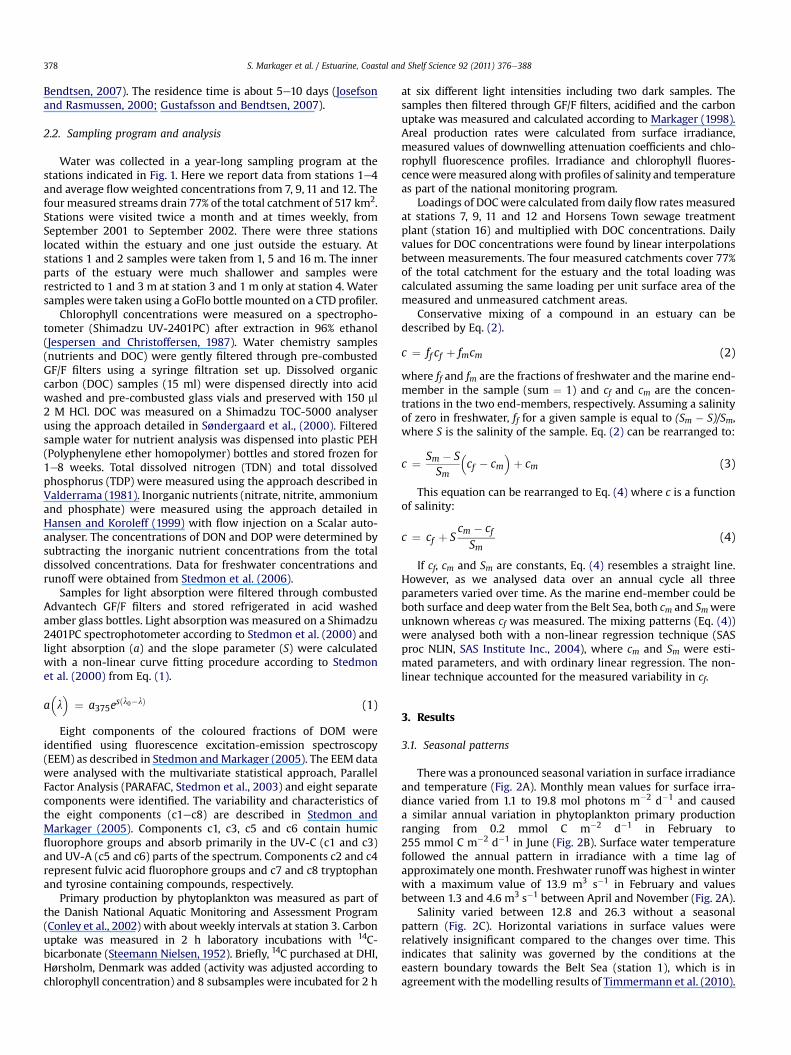
There was a pronounced seasonal variation in surface irradianceand temperature (Fig. 2A). Monthly mean values for surface irra-diance varied from 1.1 to 19.8 mol photons m�2 d�1 and causeda similar annual variation in phytoplankton primary productionranging from 0.2 mmol C m�2 d�1 in February to255 mmol C m�2 d�1 in June (Fig. 2B). Surface water temperaturefollowed the annual pattern in irradiance with a time lag ofapproximately one month. Freshwater runoff was highest inwinterwith a maximum value of 13.9 m3 s�1 in February and valuesbetween 1.3 and 4.6 m3 s�1 between April and November (Fig. 2A).
Salinity varied between 12.8 and 26.3 without a seasonalpattern (Fig. 2C). Horizontal variations in surface values wererelatively insignificant compared to the changes over time. Thisindicates that salinity was governed by the conditions at theeastern boundary towards the Belt Sea (station 1), which is inagreement with the modelling results of Timmermann et al. (2010).
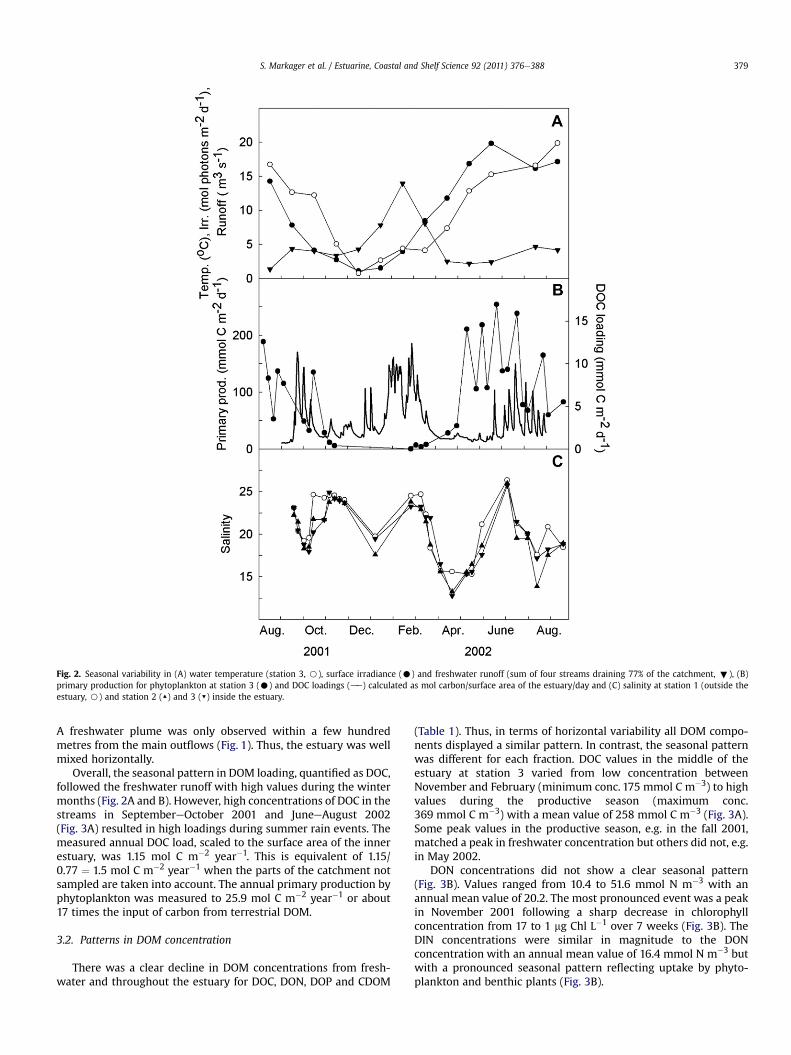
Fig. 2. Seasonal variability in (A) water temperature (station 3, B), surface irradiance (C) and freshwater runoff (sum of four streams draining 77% of the catchment, ;), (B)primary production for phytoplankton at station 3 (C) and DOC loadings (de) calculated as mol carbon/surface area of the estuary/day and (C) salinity at station 1 (outside theestuary, B) and station 2 (▲) and 3 (▼) inside the estuary.
S. Markager et al. / Estuarine, Coastal and Shelf Science 92 (2011) 376e388 379
A freshwater plume was only observed within a few hundredmetres from the main outflows (Fig. 1). Thus, the estuary was wellmixed horizontally.
Overall, the seasonal pattern in DOM loading, quantified as DOC,followed the freshwater runoff with high values during the wintermonths (Fig. 2A and B). However, high concentrations of DOC in thestreams in SeptembereOctober 2001 and JuneeAugust 2002(Fig. 3A) resulted in high loadings during summer rain events. Themeasured annual DOC load, scaled to the surface area of the innerestuary, was 1.15 mol C m�2 year�1. This is equivalent of 1.15/0.77 ¼ 1.5 mol C m�2 year�1 when the parts of the catchment notsampled are taken into account. The annual primary production byphytoplankton was measured to 25.9 mol C m�2 year�1 or about17 times the input of carbon from terrestrial DOM.
3.2. Patterns in DOM concentration
There was a clear decline in DOM concentrations from fresh-water and throughout the estuary for DOC, DON, DOP and CDOM
(Table 1). Thus, in terms of horizontal variability all DOM compo-nents displayed a similar pattern. In contrast, the seasonal patternwas different for each fraction. DOC values in the middle of theestuary at station 3 varied from low concentration betweenNovember and February (minimum conc. 175 mmol C m�3) to highvalues during the productive season (maximum conc.369 mmol C m�3) with a mean value of 258 mmol C m�3 (Fig. 3A).Some peak values in the productive season, e.g. in the fall 2001,matched a peak in freshwater concentration but others did not, e.g.in May 2002.
DON concentrations did not show a clear seasonal pattern(Fig. 3B). Values ranged from 10.4 to 51.6 mmol N m�3 with anannual mean value of 20.2. The most pronounced event was a peakin November 2001 following a sharp decrease in chlorophyllconcentration from 17 to 1 mg Chl L�1 over 7 weeks (Fig. 3B). TheDIN concentrations were similar in magnitude to the DONconcentration with an annual mean value of 16.4 mmol N m�3 butwith a pronounced seasonal pattern reflecting uptake by phyto-plankton and benthic plants (Fig. 3B).
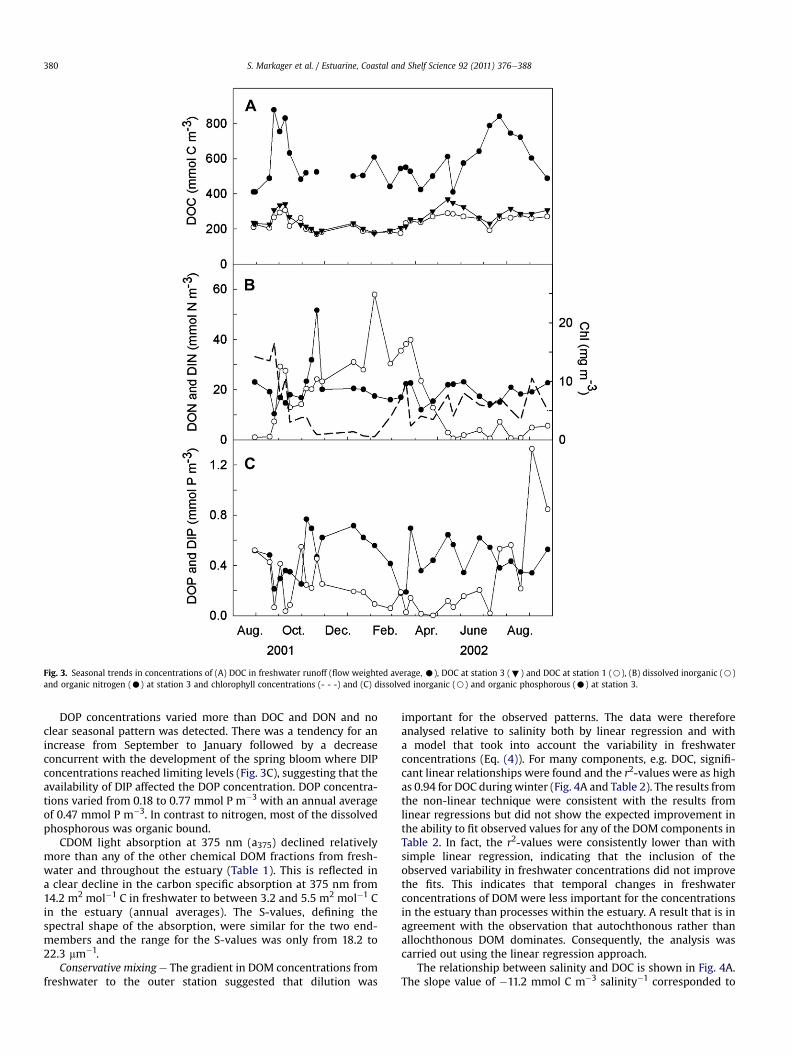
Fig. 3. Seasonal trends in concentrations of (A) DOC in freshwater runoff (flow weighted average, C), DOC at station 3 (;) and DOC at station 1 (B), (B) dissolved inorganic (B)and organic nitrogen (C) at station 3 and chlorophyll concentrations (- - -) and (C) dissolved inorganic (B) and organic phosphorous (C) at station 3.
S. Markager et al. / Estuarine, Coastal and Shelf Science 92 (2011) 376e388380
DOP concentrations varied more than DOC and DON and noclear seasonal pattern was detected. There was a tendency for anincrease from September to January followed by a decreaseconcurrent with the development of the spring bloom where DIPconcentrations reached limiting levels (Fig. 3C), suggesting that theavailability of DIP affected the DOP concentration. DOP concentra-tions varied from 0.18 to 0.77 mmol P m�3 with an annual averageof 0.47 mmol P m�3. In contrast to nitrogen, most of the dissolvedphosphorous was organic bound.
CDOM light absorption at 375 nm (a375) declined relativelymore than any of the other chemical DOM fractions from fresh-water and throughout the estuary (Table 1). This is reflected ina clear decline in the carbon specific absorption at 375 nm from14.2 m2 mol�1 C in freshwater to between 3.2 and 5.5 m2 mol�1 Cin the estuary (annual averages). The S-values, defining thespectral shape of the absorption, were similar for the two end-members and the range for the S-values was only from 18.2 to22.3 mm�1.
Conservative mixing e The gradient in DOM concentrations fromfreshwater to the outer station suggested that dilution was
important for the observed patterns. The data were thereforeanalysed relative to salinity both by linear regression and witha model that took into account the variability in freshwaterconcentrations (Eq. (4)). For many components, e.g. DOC, signifi-cant linear relationships were found and the r2-values were as highas 0.94 for DOC during winter (Fig. 4A and Table 2). The results fromthe non-linear technique were consistent with the results fromlinear regressions but did not show the expected improvement inthe ability to fit observed values for any of the DOM components inTable 2. In fact, the r2-values were consistently lower than withsimple linear regression, indicating that the inclusion of theobserved variability in freshwater concentrations did not improvethe fits. This indicates that temporal changes in freshwaterconcentrations of DOM were less important for the concentrationsin the estuary than processes within the estuary. A result that is inagreement with the observation that autochthonous rather thanallochthonous DOM dominates. Consequently, the analysis wascarried out using the linear regression approach.
The relationship between salinity and DOC is shown in Fig. 4A.The slope value of �11.2 mmol C m�3 salinity�1 corresponded to
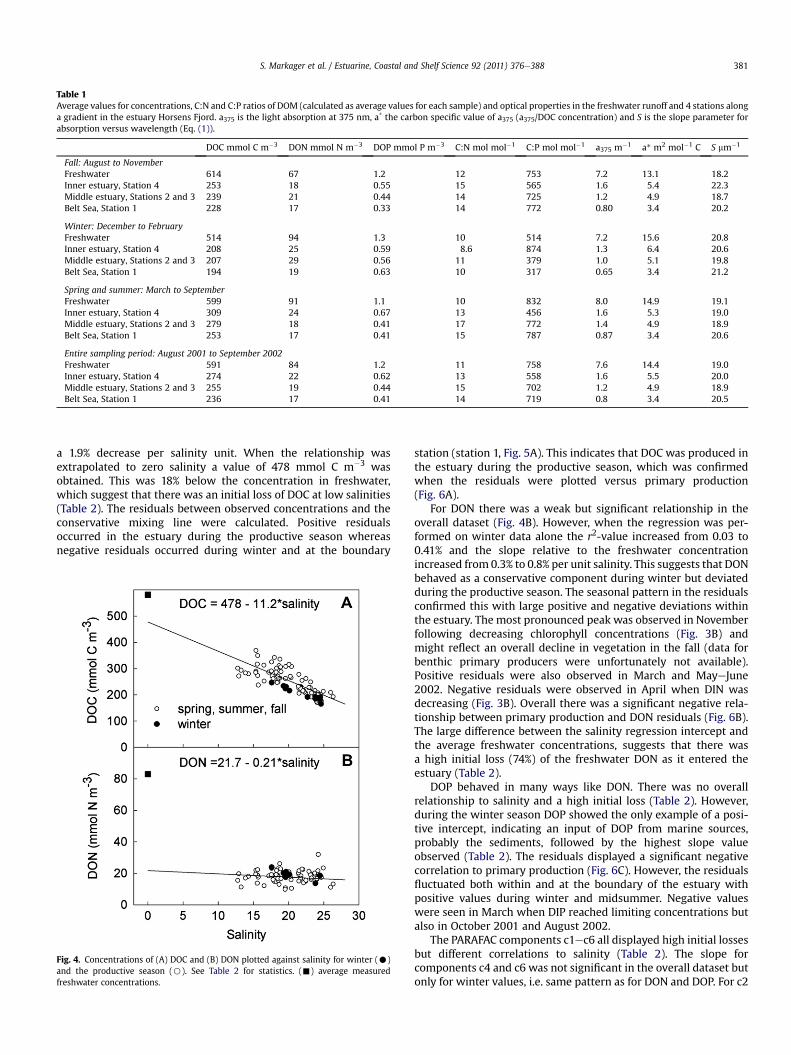
Table 1Average values for concentrations, C:N and C:P ratios of DOM (calculated as average values for each sample) and optical properties in the freshwater runoff and 4 stations alonga gradient in the estuary Horsens Fjord. a375 is the light absorption at 375 nm, a* the carbon specific value of a375 (a375/DOC concentration) and S is the slope parameter forabsorption versus wavelength (Eq. (1)).
DOC mmol C m�3 DON mmol N m�3 DOP mmol P m�3 C:N mol mol�1 C:P mol mol�1 a375 m�1 a* m2 mol�1 C S mm�1
Fall: August to NovemberFreshwater 614 67 1.2 12 753 7.2 13.1 18.2Inner estuary, Station 4 253 18 0.55 15 565 1.6 5.4 22.3Middle estuary, Stations 2 and 3 239 21 0.44 14 725 1.2 4.9 18.7Belt Sea, Station 1 228 17 0.33 14 772 0.80 3.4 20.2
Winter: December to FebruaryFreshwater 514 94 1.3 10 514 7.2 15.6 20.8Inner estuary, Station 4 208 25 0.59 8.6 874 1.3 6.4 20.6Middle estuary, Stations 2 and 3 207 29 0.56 11 379 1.0 5.1 19.8Belt Sea, Station 1 194 19 0.63 10 317 0.65 3.4 21.2
Spring and summer: March to SeptemberFreshwater 599 91 1.1 10 832 8.0 14.9 19.1Inner estuary, Station 4 309 24 0.67 13 456 1.6 5.3 19.0Middle estuary, Stations 2 and 3 279 18 0.41 17 772 1.4 4.9 18.9Belt Sea, Station 1 253 17 0.41 15 787 0.87 3.4 20.6
Entire sampling period: August 2001 to September 2002Freshwater 591 84 1.2 11 758 7.6 14.4 19.0Inner estuary, Station 4 274 22 0.62 13 558 1.6 5.5 20.0Middle estuary, Stations 2 and 3 255 19 0.44 15 702 1.2 4.9 18.9Belt Sea, Station 1 236 17 0.41 14 719 0.8 3.4 20.5
S. Markager et al. / Estuarine, Coastal and Shelf Science 92 (2011) 376e388 381
a 1.9% decrease per salinity unit. When the relationship wasextrapolated to zero salinity a value of 478 mmol C m�3 wasobtained. This was 18% below the concentration in freshwater,which suggest that there was an initial loss of DOC at low salinities(Table 2). The residuals between observed concentrations and theconservative mixing line were calculated. Positive residualsoccurred in the estuary during the productive season whereasnegative residuals occurred during winter and at the boundary
Fig. 4. Concentrations of (A) DOC and (B) DON plotted against salinity for winter (C)and the productive season (B). See Table 2 for statistics. (-) average measuredfreshwater concentrations.
station (station 1, Fig. 5A). This indicates that DOC was produced inthe estuary during the productive season, which was confirmedwhen the residuals were plotted versus primary production(Fig. 6A).
For DON there was a weak but significant relationship in theoverall dataset (Fig. 4B). However, when the regression was per-formed on winter data alone the r2-value increased from 0.03 to0.41% and the slope relative to the freshwater concentrationincreased from 0.3% to 0.8% per unit salinity. This suggests that DONbehaved as a conservative component during winter but deviatedduring the productive season. The seasonal pattern in the residualsconfirmed this with large positive and negative deviations withinthe estuary. The most pronounced peak was observed in Novemberfollowing decreasing chlorophyll concentrations (Fig. 3B) andmight reflect an overall decline in vegetation in the fall (data forbenthic primary producers were unfortunately not available).Positive residuals were also observed in March and MayeJune2002. Negative residuals were observed in April when DIN wasdecreasing (Fig. 3B). Overall there was a significant negative rela-tionship between primary production and DON residuals (Fig. 6B).The large difference between the salinity regression intercept andthe average freshwater concentrations, suggests that there wasa high initial loss (74%) of the freshwater DON as it entered theestuary (Table 2).
DOP behaved in many ways like DON. There was no overallrelationship to salinity and a high initial loss (Table 2). However,during the winter season DOP showed the only example of a posi-tive intercept, indicating an input of DOP from marine sources,probably the sediments, followed by the highest slope valueobserved (Table 2). The residuals displayed a significant negativecorrelation to primary production (Fig. 6C). However, the residualsfluctuated both within and at the boundary of the estuary withpositive values during winter and midsummer. Negative valueswere seen in March when DIP reached limiting concentrations butalso in October 2001 and August 2002.
The PARAFAC components c1ec6 all displayed high initial lossesbut different correlations to salinity (Table 2). The slope forcomponents c4 and c6 was not significant in the overall dataset butonly for winter values, i.e. same pattern as for DON and DOP. For c2
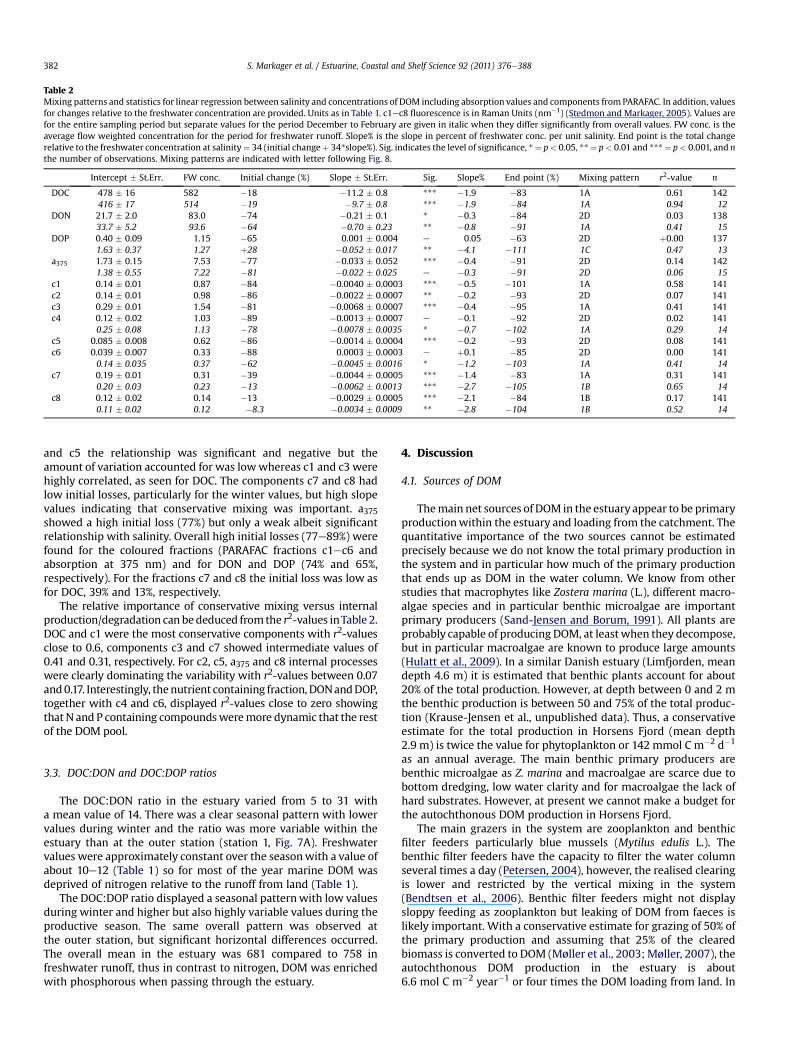
Table 2Mixing patterns and statistics for linear regression between salinity and concentrations of DOM including absorption values and components fromPARAFAC. In addition, valuesfor changes relative to the freshwater concentration are provided. Units as in Table 1. c1ec8 fluorescence is in Raman Units (nm�1) (Stedmon and Markager, 2005). Values arefor the entire sampling period but separate values for the period December to February are given in italic when they differ significantly from overall values. FW conc. is theaverage flow weighted concentration for the period for freshwater runoff. Slope% is the slope in percent of freshwater conc. per unit salinity. End point is the total changerelative to the freshwater concentration at salinity¼ 34 (initial changeþ 34*slope%). Sig. indicates the level of significance, *¼ p< 0.05, **¼ p< 0.01 and ***¼ p< 0.001, and nthe number of observations. Mixing patterns are indicated with letter following Fig. 8.
Intercept � St.Err. FW conc. Initial change (%) Slope � St.Err. Sig. Slope% End point (%) Mixing pattern r2-value n
DOC 478 � 16 582 �18 �11.2 � 0.8 *** �1.9 �83 1A 0.61 142416 � 17 514 �19 �9.7 � 0.8 *** �1.9 �84 1A 0.94 12
DON 21.7 � 2.0 83.0 �74 �0.21 � 0.1 * �0.3 �84 2D 0.03 13833.7 � 5.2 93.6 �64 �0.70 � 0.23 ** �0.8 �91 1A 0.41 15
DOP 0.40 � 0.09 1.15 �65 0.001 � 0.004 e 0.05 �63 2D þ0.00 1371.63 � 0.37 1.27 þ28 �0.052 � 0.017 ** �4.1 �111 1C 0.47 13
a375 1.73 � 0.15 7.53 �77 �0.033 � 0.052 *** �0.4 �91 2D 0.14 1421.38 � 0.55 7.22 �81 �0.022 � 0.025 e �0.3 �91 2D 0.06 15
c1 0.14 � 0.01 0.87 �84 �0.0040 � 0.0003 *** �0.5 �101 1A 0.58 141c2 0.14 � 0.01 0.98 �86 �0.0022 � 0.0007 ** �0.2 �93 2D 0.07 141c3 0.29 � 0.01 1.54 �81 �0.0068 � 0.0007 *** �0.4 �95 1A 0.41 141c4 0.12 � 0.02 1.03 �89 �0.0013 � 0.0007 e �0.1 �92 2D 0.02 141
0.25 � 0.08 1.13 �78 �0.0078 � 0.0035 * �0.7 �102 1A 0.29 14c5 0.085 � 0.008 0.62 �86 �0.0014 � 0.0004 *** �0.2 �93 2D 0.08 141c6 0.039 � 0.007 0.33 �88 0.0003 � 0.0003 e þ0.1 �85 2D 0.00 141
0.14 � 0.035 0.37 �62 �0.0045 � 0.0016 * �1.2 �103 1A 0.41 14c7 0.19 � 0.01 0.31 �39 �0.0044 � 0.0005 *** �1.4 �83 1A 0.31 141
0.20 � 0.03 0.23 �13 �0.0062 � 0.0013 *** �2.7 �105 1B 0.65 14c8 0.12 � 0.02 0.14 �13 �0.0029 � 0.0005 *** �2.1 �84 1B 0.17 141
0.11 � 0.02 0.12 �8.3 �0.0034 � 0.0009 ** �2.8 �104 1B 0.52 14
S. Markager et al. / Estuarine, Coastal and Shelf Science 92 (2011) 376e388382
and c5 the relationship was significant and negative but theamount of variation accounted for was lowwhereas c1 and c3 werehighly correlated, as seen for DOC. The components c7 and c8 hadlow initial losses, particularly for the winter values, but high slopevalues indicating that conservative mixing was important. a375showed a high initial loss (77%) but only a weak albeit significantrelationship with salinity. Overall high initial losses (77e89%) werefound for the coloured fractions (PARAFAC fractions c1ec6 andabsorption at 375 nm) and for DON and DOP (74% and 65%,respectively). For the fractions c7 and c8 the initial loss was low asfor DOC, 39% and 13%, respectively.
The relative importance of conservative mixing versus internalproduction/degradation can bededuced from the r2-values inTable 2.DOC and c1 were the most conservative components with r2-valuesclose to 0.6, components c3 and c7 showed intermediate values of0.41 and 0.31, respectively. For c2, c5, a375 and c8 internal processeswere clearly dominating the variability with r2-values between 0.07and0.17. Interestingly, thenutrient containing fraction, DONandDOP,together with c4 and c6, displayed r2-values close to zero showingthat N and P containing compoundsweremore dynamic that the restof the DOM pool.
3.3. DOC:DON and DOC:DOP ratios
The DOC:DON ratio in the estuary varied from 5 to 31 witha mean value of 14. There was a clear seasonal pattern with lowervalues during winter and the ratio was more variable within theestuary than at the outer station (station 1, Fig. 7A). Freshwatervalues were approximately constant over the seasonwith a value ofabout 10e12 (Table 1) so for most of the year marine DOM wasdeprived of nitrogen relative to the runoff from land (Table 1).
The DOC:DOP ratio displayed a seasonal patternwith low valuesduring winter and higher but also highly variable values during theproductive season. The same overall pattern was observed atthe outer station, but significant horizontal differences occurred.The overall mean in the estuary was 681 compared to 758 infreshwater runoff, thus in contrast to nitrogen, DOM was enrichedwith phosphorous when passing through the estuary.
4. Discussion
4.1. Sources of DOM
Themain net sources of DOM in the estuary appear to be primaryproductionwithin the estuary and loading from the catchment. Thequantitative importance of the two sources cannot be estimatedprecisely because we do not know the total primary production inthe system and in particular how much of the primary productionthat ends up as DOM in the water column. We know from otherstudies that macrophytes like Zostera marina (L.), different macro-algae species and in particular benthic microalgae are importantprimary producers (Sand-Jensen and Borum, 1991). All plants areprobably capable of producing DOM, at least when they decompose,but in particular macroalgae are known to produce large amounts(Hulatt et al., 2009). In a similar Danish estuary (Limfjorden, meandepth 4.6 m) it is estimated that benthic plants account for about20% of the total production. However, at depth between 0 and 2 mthe benthic production is between 50 and 75% of the total produc-tion (Krause-Jensen et al., unpublished data). Thus, a conservativeestimate for the total production in Horsens Fjord (mean depth2.9 m) is twice the value for phytoplankton or 142 mmol C m�2 d�1
as an annual average. The main benthic primary producers arebenthic microalgae as Z. marina and macroalgae are scarce due tobottom dredging, low water clarity and for macroalgae the lack ofhard substrates. However, at present we cannot make a budget forthe autochthonous DOM production in Horsens Fjord.
The main grazers in the system are zooplankton and benthicfilter feeders particularly blue mussels (Mytilus edulis L.). Thebenthic filter feeders have the capacity to filter the water columnseveral times a day (Petersen, 2004), however, the realised clearingis lower and restricted by the vertical mixing in the system(Bendtsen et al., 2006). Benthic filter feeders might not displaysloppy feeding as zooplankton but leaking of DOM from faeces islikely important. With a conservative estimate for grazing of 50% ofthe primary production and assuming that 25% of the clearedbiomass is converted to DOM (Møller et al., 2003; Møller, 2007), theautochthonous DOM production in the estuary is about6.6 mol C m�2 year�1 or four times the DOM loading from land. In
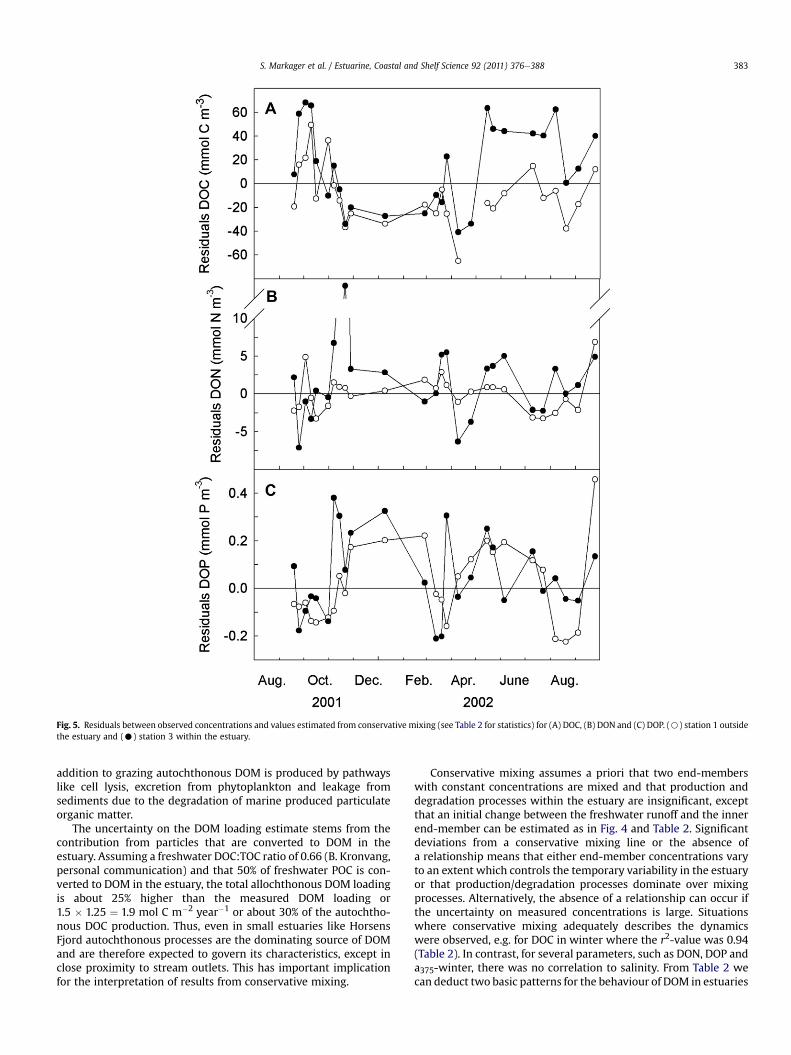
Fig. 5. Residuals between observed concentrations and values estimated from conservative mixing (see Table 2 for statistics) for (A) DOC, (B) DON and (C) DOP. (B) station 1 outsidethe estuary and (C) station 3 within the estuary.
S. Markager et al. / Estuarine, Coastal and Shelf Science 92 (2011) 376e388 383
addition to grazing autochthonous DOM is produced by pathwayslike cell lysis, excretion from phytoplankton and leakage fromsediments due to the degradation of marine produced particulateorganic matter.
The uncertainty on the DOM loading estimate stems from thecontribution from particles that are converted to DOM in theestuary. Assuming a freshwater DOC:TOC ratio of 0.66 (B. Kronvang,personal communication) and that 50% of freshwater POC is con-verted to DOM in the estuary, the total allochthonous DOM loadingis about 25% higher than the measured DOM loading or1.5 � 1.25 ¼ 1.9 mol C m�2 year�1 or about 30% of the autochtho-nous DOC production. Thus, even in small estuaries like HorsensFjord autochthonous processes are the dominating source of DOMand are therefore expected to govern its characteristics, except inclose proximity to stream outlets. This has important implicationfor the interpretation of results from conservative mixing.
Conservative mixing assumes a priori that two end-memberswith constant concentrations are mixed and that production anddegradation processes within the estuary are insignificant, exceptthat an initial change between the freshwater runoff and the innerend-member can be estimated as in Fig. 4 and Table 2. Significantdeviations from a conservative mixing line or the absence ofa relationship means that either end-member concentrations varyto an extent which controls the temporary variability in the estuaryor that production/degradation processes dominate over mixingprocesses. Alternatively, the absence of a relationship can occur ifthe uncertainty on measured concentrations is large. Situationswhere conservative mixing adequately describes the dynamicswere observed, e.g. for DOC in winter where the r2-value was 0.94(Table 2). In contrast, for several parameters, such as DON, DOP anda375-winter, there was no correlation to salinity. From Table 2 wecan deduct two basic patterns for the behaviour of DOM in estuaries
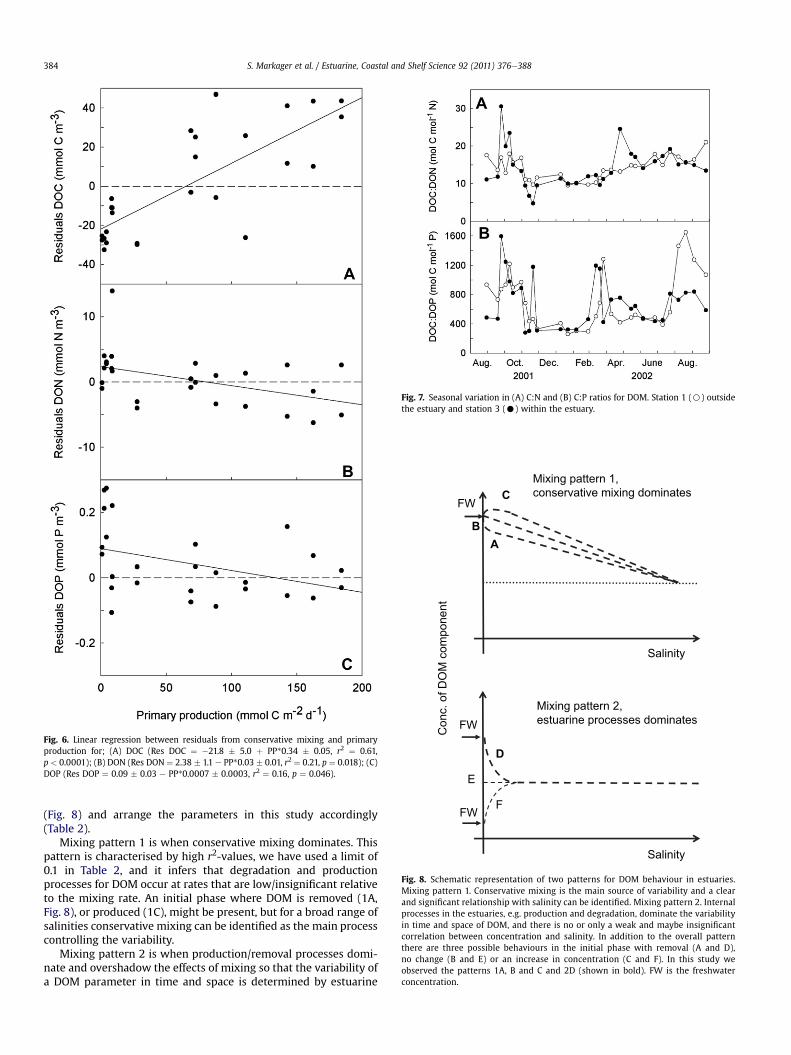
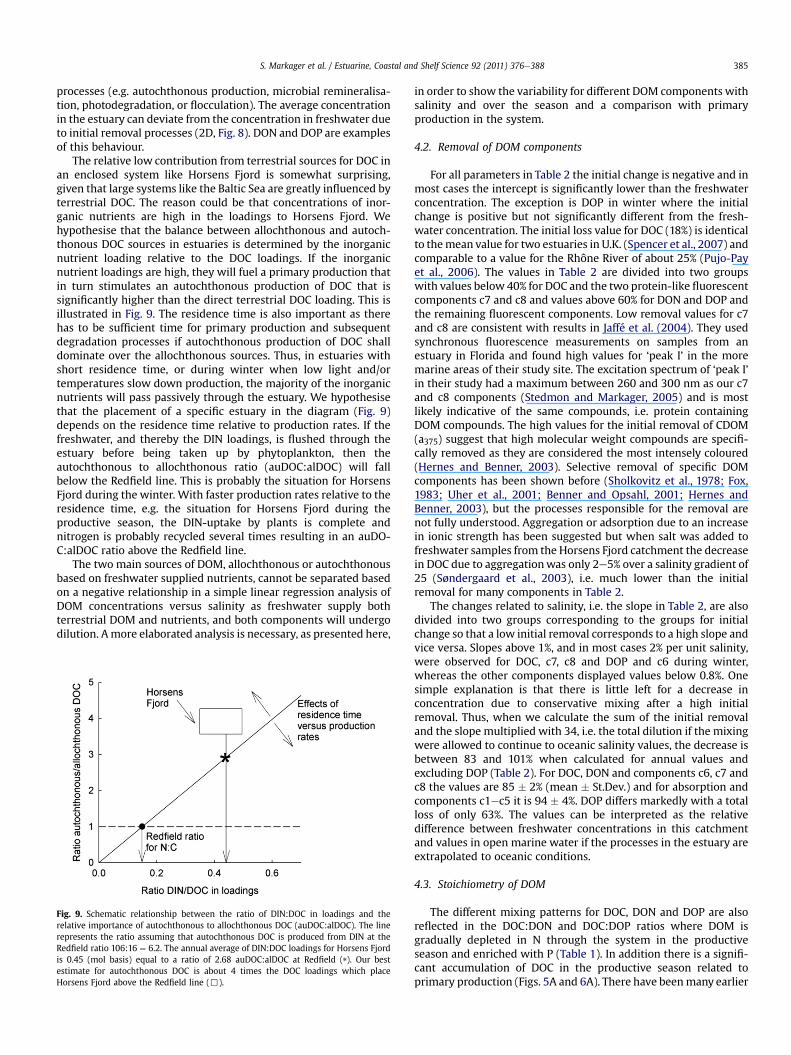
Fig. 6. Linear regression between residuals from conservative mixing and primaryproduction for; (A) DOC (Res DOC ¼ �21.8 � 5.0 þ PP*0.34 � 0.05, r2 ¼ 0.61,p < 0.0001); (B) DON (Res DON ¼ 2.38 � 1.1 e PP*0.03 � 0.01, r2 ¼ 0.21, p ¼ 0.018); (C)DOP (Res DOP ¼ 0.09 � 0.03 e PP*0.0007 � 0.0003, r2 ¼ 0.16, p ¼ 0.046).
Fig. 7. Seasonal variation in (A) C:N and (B) C:P ratios for DOM. Station 1 (B) outsidethe estuary and station 3 (C) within the estuary.
WF
A
B
C
,1nrettapgnixiMsetanimodgniximevitavresnoc
ytinilaS
WF
WF
,2nrettapgnixiMsetanimodsessecorpenirautse
D
E
F
ytinilaS
Con
c. o
f DO
M c
ompo
nent
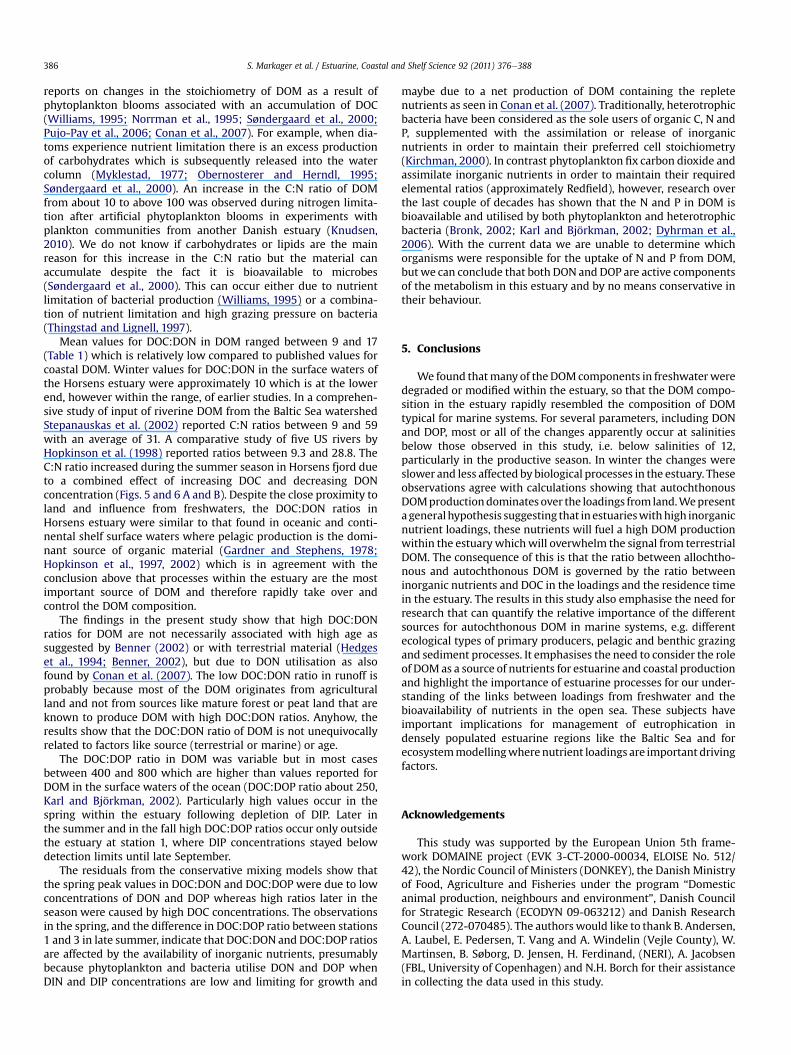
Fig. 8. Schematic representation of two patterns for DOM behaviour in estuaries.Mixing pattern 1. Conservative mixing is the main source of variability and a clearand significant relationship with salinity can be identified. Mixing pattern 2. Internalprocesses in the estuaries, e.g. production and degradation, dominate the variabilityin time and space of DOM, and there is no or only a weak and maybe insignificantcorrelation between concentration and salinity. In addition to the overall patternthere are three possible behaviours in the initial phase with removal (A and D),no change (B and E) or an increase in concentration (C and F). In this study weobserved the patterns 1A, B and C and 2D (shown in bold). FW is the freshwaterconcentration.
S. Markager et al. / Estuarine, Coastal and Shelf Science 92 (2011) 376e388384
(Fig. 8) and arrange the parameters in this study accordingly(Table 2).
Mixing pattern 1 is when conservative mixing dominates. Thispattern is characterised by high r2-values, we have used a limit of0.1 in Table 2, and it infers that degradation and productionprocesses for DOM occur at rates that are low/insignificant relativeto the mixing rate. An initial phase where DOM is removed (1A,Fig. 8), or produced (1C), might be present, but for a broad range ofsalinities conservative mixing can be identified as the main processcontrolling the variability.
Mixing pattern 2 is when production/removal processes domi-nate and overshadow the effects of mixing so that the variability ofa DOM parameter in time and space is determined by estuarine
S. Markager et al. / Estuarine, Coastal and Shelf Science 92 (2011) 376e388 385
processes (e.g. autochthonous production, microbial remineralisa-tion, photodegradation, or flocculation). The average concentrationin the estuary can deviate from the concentration in freshwater dueto initial removal processes (2D, Fig. 8). DON and DOP are examplesof this behaviour.
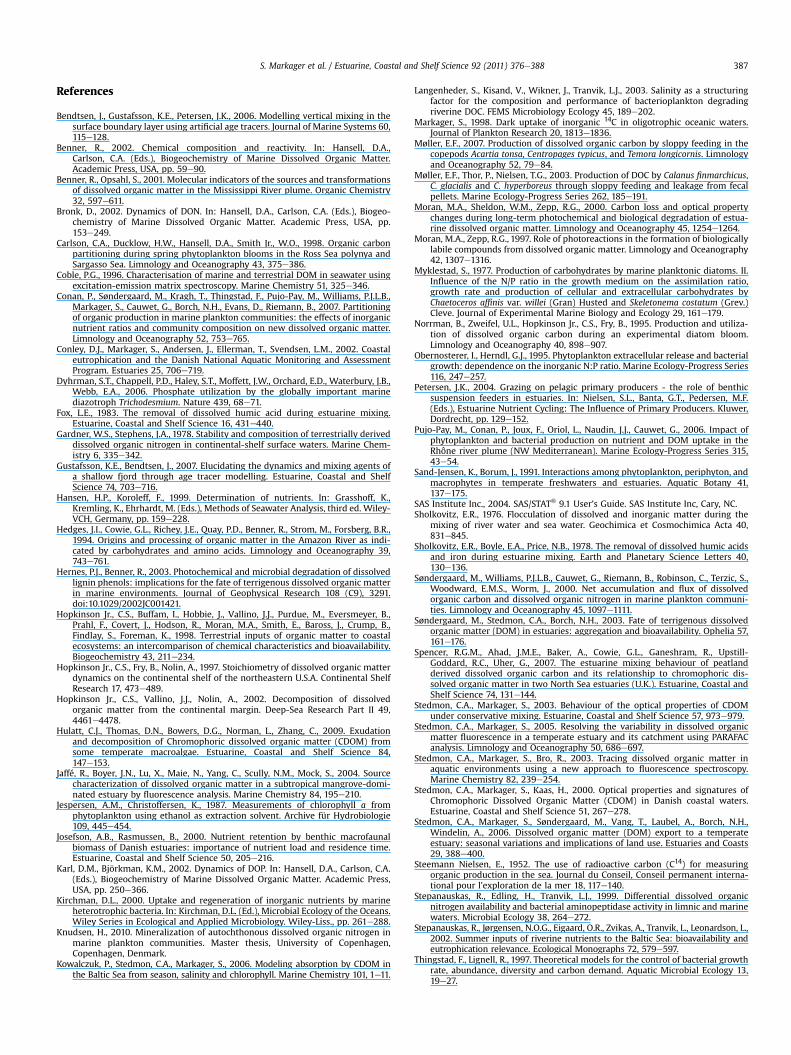
The relative low contribution from terrestrial sources for DOC inan enclosed system like Horsens Fjord is somewhat surprising,given that large systems like the Baltic Sea are greatly influenced byterrestrial DOC. The reason could be that concentrations of inor-ganic nutrients are high in the loadings to Horsens Fjord. Wehypothesise that the balance between allochthonous and autoch-thonous DOC sources in estuaries is determined by the inorganicnutrient loading relative to the DOC loadings. If the inorganicnutrient loadings are high, they will fuel a primary production thatin turn stimulates an autochthonous production of DOC that issignificantly higher than the direct terrestrial DOC loading. This isillustrated in Fig. 9. The residence time is also important as therehas to be sufficient time for primary production and subsequentdegradation processes if autochthonous production of DOC shalldominate over the allochthonous sources. Thus, in estuaries withshort residence time, or during winter when low light and/ortemperatures slow down production, the majority of the inorganicnutrients will pass passively through the estuary. We hypothesisethat the placement of a specific estuary in the diagram (Fig. 9)depends on the residence time relative to production rates. If thefreshwater, and thereby the DIN loadings, is flushed through theestuary before being taken up by phytoplankton, then theautochthonous to allochthonous ratio (auDOC:alDOC) will fallbelow the Redfield line. This is probably the situation for HorsensFjord during the winter. With faster production rates relative to theresidence time, e.g. the situation for Horsens Fjord during theproductive season, the DIN-uptake by plants is complete andnitrogen is probably recycled several times resulting in an auDO-C:alDOC ratio above the Redfield line.
The two main sources of DOM, allochthonous or autochthonousbased on freshwater supplied nutrients, cannot be separated basedon a negative relationship in a simple linear regression analysis ofDOM concentrations versus salinity as freshwater supply bothterrestrial DOM and nutrients, and both components will undergodilution. Amore elaborated analysis is necessary, as presented here,
Fig. 9. Schematic relationship between the ratio of DIN:DOC in loadings and therelative importance of autochthonous to allochthonous DOC (auDOC:alDOC). The linerepresents the ratio assuming that autochthonous DOC is produced from DIN at theRedfield ratio 106:16 ¼ 6.2. The annual average of DIN:DOC loadings for Horsens Fjordis 0.45 (mol basis) equal to a ratio of 2.68 auDOC:alDOC at Redfield .(٭) Our bestestimate for autochthonous DOC is about 4 times the DOC loadings which placeHorsens Fjord above the Redfield line (,).
in order to show the variability for different DOM components withsalinity and over the season and a comparison with primaryproduction in the system.
4.2. Removal of DOM components
For all parameters in Table 2 the initial change is negative and inmost cases the intercept is significantly lower than the freshwaterconcentration. The exception is DOP in winter where the initialchange is positive but not significantly different from the fresh-water concentration. The initial loss value for DOC (18%) is identicalto themean value for two estuaries in U.K. (Spencer et al., 2007) andcomparable to a value for the Rhône River of about 25% (Pujo-Payet al., 2006). The values in Table 2 are divided into two groupswith values below 40% for DOC and the two protein-like fluorescentcomponents c7 and c8 and values above 60% for DON and DOP andthe remaining fluorescent components. Low removal values for c7and c8 are consistent with results in Jaffé et al. (2004). They usedsynchronous fluorescence measurements on samples from anestuary in Florida and found high values for ‘peak I’ in the moremarine areas of their study site. The excitation spectrum of ‘peak I’in their study had a maximum between 260 and 300 nm as our c7and c8 components (Stedmon and Markager, 2005) and is mostlikely indicative of the same compounds, i.e. protein containingDOM compounds. The high values for the initial removal of CDOM(a375) suggest that high molecular weight compounds are specifi-cally removed as they are considered the most intensely coloured(Hernes and Benner, 2003). Selective removal of specific DOMcomponents has been shown before (Sholkovitz et al., 1978; Fox,1983; Uher et al., 2001; Benner and Opsahl, 2001; Hernes andBenner, 2003), but the processes responsible for the removal arenot fully understood. Aggregation or adsorption due to an increasein ionic strength has been suggested but when salt was added tofreshwater samples from the Horsens Fjord catchment the decreasein DOC due to aggregationwas only 2e5% over a salinity gradient of25 (Søndergaard et al., 2003), i.e. much lower than the initialremoval for many components in Table 2.
The changes related to salinity, i.e. the slope in Table 2, are alsodivided into two groups corresponding to the groups for initialchange so that a low initial removal corresponds to a high slope andvice versa. Slopes above 1%, and in most cases 2% per unit salinity,were observed for DOC, c7, c8 and DOP and c6 during winter,whereas the other components displayed values below 0.8%. Onesimple explanation is that there is little left for a decrease inconcentration due to conservative mixing after a high initialremoval. Thus, when we calculate the sum of the initial removaland the slope multiplied with 34, i.e. the total dilution if the mixingwere allowed to continue to oceanic salinity values, the decrease isbetween 83 and 101% when calculated for annual values andexcluding DOP (Table 2). For DOC, DON and components c6, c7 andc8 the values are 85 � 2% (mean � St.Dev.) and for absorption andcomponents c1ec5 it is 94 � 4%. DOP differs markedly with a totalloss of only 63%. The values can be interpreted as the relativedifference between freshwater concentrations in this catchmentand values in open marine water if the processes in the estuary areextrapolated to oceanic conditions.
4.3. Stoichiometry of DOM
The different mixing patterns for DOC, DON and DOP are alsoreflected in the DOC:DON and DOC:DOP ratios where DOM isgradually depleted in N through the system in the productiveseason and enriched with P (Table 1). In addition there is a signifi-cant accumulation of DOC in the productive season related toprimary production (Figs. 5A and 6A). There have beenmany earlier
S. Markager et al. / Estuarine, Coastal and Shelf Science 92 (2011) 376e388386
reports on changes in the stoichiometry of DOM as a result ofphytoplankton blooms associated with an accumulation of DOC(Williams, 1995; Norrman et al., 1995; Søndergaard et al., 2000;Pujo-Pay et al., 2006; Conan et al., 2007). For example, when dia-toms experience nutrient limitation there is an excess productionof carbohydrates which is subsequently released into the watercolumn (Myklestad, 1977; Obernosterer and Herndl, 1995;Søndergaard et al., 2000). An increase in the C:N ratio of DOMfrom about 10 to above 100 was observed during nitrogen limita-tion after artificial phytoplankton blooms in experiments withplankton communities from another Danish estuary (Knudsen,2010). We do not know if carbohydrates or lipids are the mainreason for this increase in the C:N ratio but the material canaccumulate despite the fact it is bioavailable to microbes(Søndergaard et al., 2000). This can occur either due to nutrientlimitation of bacterial production (Williams, 1995) or a combina-tion of nutrient limitation and high grazing pressure on bacteria(Thingstad and Lignell, 1997).
Mean values for DOC:DON in DOM ranged between 9 and 17(Table 1) which is relatively low compared to published values forcoastal DOM. Winter values for DOC:DON in the surface waters ofthe Horsens estuary were approximately 10 which is at the lowerend, however within the range, of earlier studies. In a comprehen-sive study of input of riverine DOM from the Baltic Sea watershedStepanauskas et al. (2002) reported C:N ratios between 9 and 59with an average of 31. A comparative study of five US rivers byHopkinson et al. (1998) reported ratios between 9.3 and 28.8. TheC:N ratio increased during the summer season in Horsens fjord dueto a combined effect of increasing DOC and decreasing DONconcentration (Figs. 5 and 6 A and B). Despite the close proximity toland and influence from freshwaters, the DOC:DON ratios inHorsens estuary were similar to that found in oceanic and conti-nental shelf surface waters where pelagic production is the domi-nant source of organic material (Gardner and Stephens, 1978;Hopkinson et al., 1997, 2002) which is in agreement with theconclusion above that processes within the estuary are the mostimportant source of DOM and therefore rapidly take over andcontrol the DOM composition.
The findings in the present study show that high DOC:DONratios for DOM are not necessarily associated with high age assuggested by Benner (2002) or with terrestrial material (Hedgeset al., 1994; Benner, 2002), but due to DON utilisation as alsofound by Conan et al. (2007). The low DOC:DON ratio in runoff isprobably because most of the DOM originates from agriculturalland and not from sources like mature forest or peat land that areknown to produce DOM with high DOC:DON ratios. Anyhow, theresults show that the DOC:DON ratio of DOM is not unequivocallyrelated to factors like source (terrestrial or marine) or age.
The DOC:DOP ratio in DOM was variable but in most casesbetween 400 and 800 which are higher than values reported forDOM in the surface waters of the ocean (DOC:DOP ratio about 250,Karl and Björkman, 2002). Particularly high values occur in thespring within the estuary following depletion of DIP. Later inthe summer and in the fall high DOC:DOP ratios occur only outsidethe estuary at station 1, where DIP concentrations stayed belowdetection limits until late September.
The residuals from the conservative mixing models show thatthe spring peak values in DOC:DON and DOC:DOP were due to lowconcentrations of DON and DOP whereas high ratios later in theseason were caused by high DOC concentrations. The observationsin the spring, and the difference in DOC:DOP ratio between stations1 and 3 in late summer, indicate that DOC:DON and DOC:DOP ratiosare affected by the availability of inorganic nutrients, presumablybecause phytoplankton and bacteria utilise DON and DOP whenDIN and DIP concentrations are low and limiting for growth and
maybe due to a net production of DOM containing the repletenutrients as seen in Conan et al. (2007). Traditionally, heterotrophicbacteria have been considered as the sole users of organic C, N andP, supplemented with the assimilation or release of inorganicnutrients in order to maintain their preferred cell stoichiometry(Kirchman, 2000). In contrast phytoplankton fix carbon dioxide andassimilate inorganic nutrients in order to maintain their requiredelemental ratios (approximately Redfield), however, research overthe last couple of decades has shown that the N and P in DOM isbioavailable and utilised by both phytoplankton and heterotrophicbacteria (Bronk, 2002; Karl and Björkman, 2002; Dyhrman et al.,2006). With the current data we are unable to determine whichorganisms were responsible for the uptake of N and P from DOM,but we can conclude that both DON and DOP are active componentsof the metabolism in this estuary and by no means conservative intheir behaviour.
5. Conclusions
We found thatmany of the DOMcomponents in freshwaterweredegraded or modified within the estuary, so that the DOM compo-sition in the estuary rapidly resembled the composition of DOMtypical for marine systems. For several parameters, including DONand DOP, most or all of the changes apparently occur at salinitiesbelow those observed in this study, i.e. below salinities of 12,particularly in the productive season. In winter the changes wereslower and less affected by biological processes in the estuary. Theseobservations agree with calculations showing that autochthonousDOMproductiondominates over the loadings from land.Wepresentageneralhypothesis suggesting that in estuarieswithhigh inorganicnutrient loadings, these nutrients will fuel a high DOM productionwithin the estuary whichwill overwhelm the signal from terrestrialDOM. The consequence of this is that the ratio between allochtho-nous and autochthonous DOM is governed by the ratio betweeninorganic nutrients and DOC in the loadings and the residence timein the estuary. The results in this study also emphasise the need forresearch that can quantify the relative importance of the differentsources for autochthonous DOM in marine systems, e.g. differentecological types of primary producers, pelagic and benthic grazingand sediment processes. It emphasises the need to consider the roleof DOM as a source of nutrients for estuarine and coastal productionand highlight the importance of estuarine processes for our under-standing of the links between loadings from freshwater and thebioavailability of nutrients in the open sea. These subjects haveimportant implications for management of eutrophication indensely populated estuarine regions like the Baltic Sea and forecosystemmodellingwherenutrient loadings are important drivingfactors.
Acknowledgements
This study was supported by the European Union 5th frame-work DOMAINE project (EVK 3-CT-2000-00034, ELOISE No. 512/42), the Nordic Council of Ministers (DONKEY), the Danish Ministryof Food, Agriculture and Fisheries under the program “Domesticanimal production, neighbours and environment”, Danish Councilfor Strategic Research (ECODYN 09-063212) and Danish ResearchCouncil (272-070485). The authors would like to thank B. Andersen,A. Laubel, E. Pedersen, T. Vang and A. Windelin (Vejle County), W.Martinsen, B. Søborg, D. Jensen, H. Ferdinand, (NERI), A. Jacobsen(FBL, University of Copenhagen) and N.H. Borch for their assistancein collecting the data used in this study.
S. Markager et al. / Estuarine, Coastal and Shelf Science 92 (2011) 376e388 387
References
Bendtsen, J., Gustafsson, K.E., Petersen, J.K., 2006. Modelling vertical mixing in thesurface boundary layer using artificial age tracers. Journal of Marine Systems 60,115e128.
Benner, R., 2002. Chemical composition and reactivity. In: Hansell, D.A.,Carlson, C.A. (Eds.), Biogeochemistry of Marine Dissolved Organic Matter.Academic Press, USA, pp. 59e90.
Benner, R., Opsahl, S., 2001. Molecular indicators of the sources and transformationsof dissolved organic matter in the Mississippi River plume. Organic Chemistry32, 597e611.
Bronk, D., 2002. Dynamics of DON. In: Hansell, D.A., Carlson, C.A. (Eds.), Biogeo-chemistry of Marine Dissolved Organic Matter. Academic Press, USA, pp.153e249.
Carlson, C.A., Ducklow, H.W., Hansell, D.A., Smith Jr., W.O., 1998. Organic carbonpartitioning during spring phytoplankton blooms in the Ross Sea polynya andSargasso Sea. Limnology and Oceanography 43, 375e386.
Coble, P.G., 1996. Characterisation of marine and terrestrial DOM in seawater usingexcitation-emission matrix spectroscopy. Marine Chemistry 51, 325e346.
Conan, P., Søndergaard, M., Kragh, T., Thingstad, F., Pujo-Pay, M., Williams, P.J.L.B.,Markager, S., Cauwet, G., Borch, N.H., Evans, D., Riemann, B., 2007. Partitioningof organic production in marine plankton communities: the effects of inorganicnutrient ratios and community composition on new dissolved organic matter.Limnology and Oceanography 52, 753e765.
Conley, D.J., Markager, S., Andersen, J., Ellerman, T., Svendsen, L.M., 2002. Coastaleutrophication and the Danish National Aquatic Monitoring and AssessmentProgram. Estuaries 25, 706e719.
Dyhrman, S.T., Chappell, P.D., Haley, S.T., Moffett, J.W., Orchard, E.D., Waterbury, J.B.,Webb, E.A., 2006. Phosphate utilization by the globally important marinediazotroph Trichodesmium. Nature 439, 68e71.
Fox, L.E., 1983. The removal of dissolved humic acid during estuarine mixing.Estuarine, Coastal and Shelf Science 16, 431e440.
Gardner, W.S., Stephens, J.A., 1978. Stability and composition of terrestrially deriveddissolved organic nitrogen in continental-shelf surface waters. Marine Chem-istry 6, 335e342.
Gustafsson, K.E., Bendtsen, J., 2007. Elucidating the dynamics and mixing agents ofa shallow fjord through age tracer modelling. Estuarine, Coastal and ShelfScience 74, 703e716.
Hansen, H.P., Koroleff, F., 1999. Determination of nutrients. In: Grasshoff, K.,Kremling, K., Ehrhardt, M. (Eds.), Methods of Seawater Analysis, third ed. Wiley-VCH, Germany, pp. 159e228.
Hedges, J.I., Cowie, G.L., Richey, J.E., Quay, P.D., Benner, R., Strom, M., Forsberg, B.R.,1994. Origins and processing of organic matter in the Amazon River as indi-cated by carbohydrates and amino acids. Limnology and Oceanography 39,743e761.
Hernes, P.J., Benner, R., 2003. Photochemical and microbial degradation of dissolvedlignin phenols: implications for the fate of terrigenous dissolved organic matterin marine environments. Journal of Geophysical Research 108 (C9), 3291.doi:10.1029/2002JC001421.
Hopkinson Jr., C.S., Buffam, I., Hobbie, J., Vallino, J.J., Purdue, M., Eversmeyer, B.,Prahl, F., Covert, J., Hodson, R., Moran, M.A., Smith, E., Baross, J., Crump, B.,Findlay, S., Foreman, K., 1998. Terrestrial inputs of organic matter to coastalecosystems: an intercomparison of chemical characteristics and bioavailability.Biogeochemistry 43, 211e234.
Hopkinson Jr., C.S., Fry, B., Nolin, A., 1997. Stoichiometry of dissolved organic matterdynamics on the continental shelf of the northeastern U.S.A. Continental ShelfResearch 17, 473e489.
Hopkinson Jr., C.S., Vallino, J.J., Nolin, A., 2002. Decomposition of dissolvedorganic matter from the continental margin. Deep-Sea Research Part II 49,4461e4478.
Hulatt, C.J., Thomas, D.N., Bowers, D.G., Norman, L., Zhang, C., 2009. Exudationand decomposition of Chromophoric dissolved organic matter (CDOM) fromsome temperate macroalgae. Estuarine, Coastal and Shelf Science 84,147e153.
Jaffé, R., Boyer, J.N., Lu, X., Maie, N., Yang, C., Scully, N.M., Mock, S., 2004. Sourcecharacterization of dissolved organic matter in a subtropical mangrove-domi-nated estuary by fluorescence analysis. Marine Chemistry 84, 195e210.
Jespersen, A.M., Christoffersen, K., 1987. Measurements of chlorophyll a fromphytoplankton using ethanol as extraction solvent. Archive für Hydrobiologie109, 445e454.
Josefson, A.B., Rasmussen, B., 2000. Nutrient retention by benthic macrofaunalbiomass of Danish estuaries: importance of nutrient load and residence time.Estuarine, Coastal and Shelf Science 50, 205e216.
Karl, D.M., Björkman, K.M., 2002. Dynamics of DOP. In: Hansell, D.A., Carlson, C.A.(Eds.), Biogeochemistry of Marine Dissolved Organic Matter. Academic Press,USA, pp. 250e366.
Kirchman, D.L., 2000. Uptake and regeneration of inorganic nutrients by marineheterotrophic bacteria. In: Kirchman, D.L. (Ed.), Microbial Ecology of the Oceans.Wiley Series in Ecological and Applied Microbiology. Wiley-Liss., pp. 261e288.
Knudsen, H., 2010. Mineralization of autochthonous dissolved organic nitrogen inmarine plankton communities. Master thesis, University of Copenhagen,Copenhagen, Denmark.
Kowalczuk, P., Stedmon, C.A., Markager, S., 2006. Modeling absorption by CDOM inthe Baltic Sea from season, salinity and chlorophyll. Marine Chemistry 101, 1e11.
Langenheder, S., Kisand, V., Wikner, J., Tranvik, L.J., 2003. Salinity as a structuringfactor for the composition and performance of bacterioplankton degradingriverine DOC. FEMS Microbiology Ecology 45, 189e202.
Markager, S., 1998. Dark uptake of inorganic 14C in oligotrophic oceanic waters.Journal of Plankton Research 20, 1813e1836.
Møller, E.F., 2007. Production of dissolved organic carbon by sloppy feeding in thecopepods Acartia tonsa, Centropages typicus, and Temora longicornis. Limnologyand Oceanography 52, 79e84.
Møller, E.F., Thor, P., Nielsen, T.G., 2003. Production of DOC by Calanus finmarchicus,C. glacialis and C. hyperboreus through sloppy feeding and leakage from fecalpellets. Marine Ecology-Progress Series 262, 185e191.
Moran, M.A., Sheldon, W.M., Zepp, R.G., 2000. Carbon loss and optical propertychanges during long-term photochemical and biological degradation of estua-rine dissolved organic matter. Limnology and Oceanography 45, 1254e1264.
Moran, M.A., Zepp, R.G., 1997. Role of photoreactions in the formation of biologicallylabile compounds from dissolved organic matter. Limnology and Oceanography42, 1307e1316.
Myklestad, S., 1977. Production of carbohydrates by marine planktonic diatoms. II.Influence of the N/P ratio in the growth medium on the assimilation ratio,growth rate and production of cellular and extracellular carbohydrates byChaetoceros affinis var. willei (Gran) Husted and Skeletonema costatum (Grev.)Cleve. Journal of Experimental Marine Biology and Ecology 29, 161e179.
Norrman, B., Zweifel, U.L., Hopkinson Jr., C.S., Fry, B., 1995. Production and utiliza-tion of dissolved organic carbon during an experimental diatom bloom.Limnology and Oceanography 40, 898e907.
Obernosterer, I., Herndl, G.J., 1995. Phytoplankton extracellular release and bacterialgrowth: dependence on the inorganic N:P ratio. Marine Ecology-Progress Series116, 247e257.
Petersen, J.K., 2004. Grazing on pelagic primary producers - the role of benthicsuspension feeders in estuaries. In: Nielsen, S.L., Banta, G.T., Pedersen, M.F.(Eds.), Estuarine Nutrient Cycling: The Influence of Primary Producers. Kluwer,Dordrecht, pp. 129e152.
Pujo-Pay, M., Conan, P., Joux, F., Oriol, L., Naudin, J.J., Cauwet, G., 2006. Impact ofphytoplankton and bacterial production on nutrient and DOM uptake in theRhône river plume (NW Mediterranean). Marine Ecology-Progress Series 315,43e54.
Sand-Jensen, K., Borum, J., 1991. Interactions among phytoplankton, periphyton, andmacrophytes in temperate freshwaters and estuaries. Aquatic Botany 41,137e175.
SAS Institute Inc., 2004. SAS/STAT� 9.1 User’s Guide. SAS Institute Inc, Cary, NC.Sholkovitz, E.R., 1976. Flocculation of dissolved and inorganic matter during the
mixing of river water and sea water. Geochimica et Cosmochimica Acta 40,831e845.
Sholkovitz, E.R., Boyle, E.A., Price, N.B., 1978. The removal of dissolved humic acidsand iron during estuarine mixing. Earth and Planetary Science Letters 40,130e136.
Søndergaard, M., Williams, P.J.L.B., Cauwet, G., Riemann, B., Robinson, C., Terzic, S.,Woodward, E.M.S., Worm, J., 2000. Net accumulation and flux of dissolvedorganic carbon and dissolved organic nitrogen in marine plankton communi-ties. Limnology and Oceanography 45, 1097e1111.
Søndergaard, M., Stedmon, C.A., Borch, N.H., 2003. Fate of terrigenous dissolvedorganic matter (DOM) in estuaries: aggregation and bioavailability. Ophelia 57,161e176.
Spencer, R.G.M., Ahad, J.M.E., Baker, A., Cowie, G.L., Ganeshram, R., Upstill-Goddard, R.C., Uher, G., 2007. The estuarine mixing behaviour of peatlandderived dissolved organic carbon and its relationship to chromophoric dis-solved organic matter in two North Sea estuaries (U.K.). Estuarine, Coastal andShelf Science 74, 131e144.
Stedmon, C.A., Markager, S., 2003. Behaviour of the optical properties of CDOMunder conservative mixing. Estuarine, Coastal and Shelf Science 57, 973e979.
Stedmon, C.A., Markager, S., 2005. Resolving the variability in dissolved organicmatter fluorescence in a temperate estuary and its catchment using PARAFACanalysis. Limnology and Oceanography 50, 686e697.
Stedmon, C.A., Markager, S., Bro, R., 2003. Tracing dissolved organic matter inaquatic environments using a new approach to fluorescence spectroscopy.Marine Chemistry 82, 239e254.
Stedmon, C.A., Markager, S., Kaas, H., 2000. Optical properties and signatures ofChromophoric Dissolved Organic Matter (CDOM) in Danish coastal waters.Estuarine, Coastal and Shelf Science 51, 267e278.
Stedmon, C.A., Markager, S., Søndergaard, M., Vang, T., Laubel, A., Borch, N.H.,Windelin, A., 2006. Dissolved organic matter (DOM) export to a temperateestuary: seasonal variations and implications of land use. Estuaries and Coasts29, 388e400.
Steemann Nielsen, E., 1952. The use of radioactive carbon (C14) for measuringorganic production in the sea. Journal du Conseil, Conseil permanent interna-tional pour l’exploration de la mer 18, 117e140.
Stepanauskas, R., Edling, H., Tranvik, L.J., 1999. Differential dissolved organicnitrogen availability and bacterial aminopeptidase activity in limnic and marinewaters. Microbial Ecology 38, 264e272.
Stepanauskas, R., Jørgensen, N.O.G., Eigaard, O.R., Zvikas, A., Tranvik, L., Leonardson, L.,2002. Summer inputs of riverine nutrients to the Baltic Sea: bioavailability andeutrophication relevance. Ecological Monographs 72, 579e597.
Thingstad, F., Lignell, R., 1997. Theoretical models for the control of bacterial growthrate, abundance, diversity and carbon demand. Aquatic Microbial Ecology 13,19e27.

S. Markager et al. / Estuarine, Coastal and Shelf Science 92 (2011) 376e388388
Timmermann, K., Markager, S., Gustafsson, K.E., 2010. Streams or open sea? Tracingsources and effects of nutrient loadings in a shallow estuary with a 3Dhydrodynamiceecological model. Journal of Marine Systems 82, 111e121.
Tranvik, L., Kokalj, S., 1998. Decreased biodegradability of algal DOC due to inter-active effects of UV radiation and humic matter. Aquatic Microbial Ecology 14,301e307.
Uher, G., Hughes, C., Henry, G., Upstill-Goddar, R.C., 2001. Non-conservative mixingbehaviour of colored dissolved organic matter in a humic-rich turbid estuary.Geophysical Research Letters 28, 3309e3312.
Valderrama, J.C., 1981. The simultaneous analysis of total nitrogen and total phos-phorus in natural waters. Marine Chemistry 10, 109e122.
Wikner, J., Cuadros, R., Jansson, M., 1999. Differences in consumption of allochth-onous DOC under limnic and estuarine conditions in a watershed. AquaticMicrobial Ecology 17, 289e299.
Williams, P.J.L.B., 1995. Evidence for the seasonal accumulation of carbon-richdissolved organic material, its scale in comparison with changes in particulatematerial and the consequential effect on net C/N assimilation ratios. MarineChemistry 51, 17e29.
Related Documents