Atmospheric Environment 41 (2007) 5555–5570 Seasonal distribution of polar organic compounds in the urban atmosphere of two large cities from the North and South of Europe Ce´ sar Oliveira a, , Casimiro Pio a , Ce´lia Alves a , Margarita Evtyugina a , Patrı´cia Santos a , Virgı´nia Gonc - alves a , Teresa Nunes a , Armando J.D. Silvestre b , Finn Palmgren c , Peter Wa˚hlin c , Stuart Harrad d a CESAM & Department of Environment and Planning, University of Aveiro, Campus de Santiago, 3810-193 Aveiro, Portugal b CICECO & Department of Chemistry, University of Aveiro, Campus de Santiago, 3810-193 Aveiro, Portugal c Department of Atmospheric Environment, National Environmental Research Institute, Frederiksborgvej 399, DK-4000 Roskilde, Denmark d Division of Environmental Health & Risk Management, University of Birmingham, Birmingham B15 2TT, UK Received 21 November 2006; received in revised form 2 March 2007; accepted 5 March 2007 Abstract Polar organic species, including n-alkanols, sterols, anhydrosugars, n-alkanoic acids, n-alkenoic acids and dicarboxylic acids were quantified to typify the composition of fine (PM 2.5 ) and coarse (PM 10–2.5 ) aerosols collected simultaneously at roadside and background sites in Oporto (Portugal) and Copenhagen (Denmark) during separate month-long intensive summer and winter campaigns. As a general trend, both cities exhibit roadside average concentrations higher than their correspondent urban background levels. The polar organics are more abundant in the fine fraction, exhibiting a seasonal pattern with high winter concentrations and low summer loads. Aerosols from both cities showed typical distributions of n- alkanols and n-alkanoic acids in the ranges C 12 –C 28 and C 8 –C 28 , respectively. The oC 20 homologues, usually attributed to kitchen emissions, vehicular exhausts and microbial origins, dominated the fatty acid fraction. Linear alcohols were mainly represented by higher molecular weight homologues from vegetation waxes. Molecular tracer species for wood smoke (e.g. levoglucosan, mannosan and resinic acids) were found to contribute significantly to the urban aerosol, especially in winter. Ratios between these tracers indicated different biofuel contributions to the atmospheric particles of the two cities. Secondary constituents from both biogenic (e.g. pinonic acid) and anthropogenic precursors (e.g. phthalic and benzoic acids) were detected in both cities and seasons. r 2007 Elsevier Ltd. All rights reserved. Keywords: Urban aerosols; Polar organic compounds; Tracers; Source apportionment 1. Introduction Atmospheric particulate matter (PM) is an environmental concern above all because it can dramatically reduce visual range (Hobbs, 2002), has ARTICLE IN PRESS www.elsevier.com/locate/atmosenv 1352-2310/$ - see front matter r 2007 Elsevier Ltd. All rights reserved. doi:10.1016/j.atmosenv.2007.03.001 Corresponding author. Tel.: +351 234370200; fax: +351 234429290. E-mail address: [email protected] (C. Oliveira).

Welcome message from author
This document is posted to help you gain knowledge. Please leave a comment to let me know what you think about it! Share it to your friends and learn new things together.
Transcript
ARTICLE IN PRESS
1352-2310/$ - se
doi:10.1016/j.at
�Correspondfax: +351 2344
E-mail addr
Atmospheric Environment 41 (2007) 5555–5570
www.elsevier.com/locate/atmosenv
Seasonal distribution of polar organic compounds in theurban atmosphere of two large cities from the North and South
of Europe
Cesar Oliveiraa,�, Casimiro Pioa, Celia Alvesa, Margarita Evtyuginaa,Patrıcia Santosa, Virgınia Gonc-alvesa, Teresa Nunesa, Armando J.D. Silvestreb,
Finn Palmgrenc, Peter Wahlinc, Stuart Harradd
aCESAM & Department of Environment and Planning, University of Aveiro, Campus de Santiago, 3810-193 Aveiro, PortugalbCICECO & Department of Chemistry, University of Aveiro, Campus de Santiago, 3810-193 Aveiro, Portugal
cDepartment of Atmospheric Environment, National Environmental Research Institute, Frederiksborgvej 399, DK-4000 Roskilde, DenmarkdDivision of Environmental Health & Risk Management, University of Birmingham, Birmingham B15 2TT, UK
Received 21 November 2006; received in revised form 2 March 2007; accepted 5 March 2007
Abstract
Polar organic species, including n-alkanols, sterols, anhydrosugars, n-alkanoic acids, n-alkenoic acids and dicarboxylic
acids were quantified to typify the composition of fine (PM2.5) and coarse (PM10–2.5) aerosols collected simultaneously at
roadside and background sites in Oporto (Portugal) and Copenhagen (Denmark) during separate month-long intensive
summer and winter campaigns. As a general trend, both cities exhibit roadside average concentrations higher than their
correspondent urban background levels. The polar organics are more abundant in the fine fraction, exhibiting a seasonal
pattern with high winter concentrations and low summer loads. Aerosols from both cities showed typical distributions of n-
alkanols and n-alkanoic acids in the ranges C12–C28 and C8–C28, respectively. The oC20 homologues, usually attributed to
kitchen emissions, vehicular exhausts and microbial origins, dominated the fatty acid fraction. Linear alcohols were mainly
represented by higher molecular weight homologues from vegetation waxes. Molecular tracer species for wood smoke (e.g.
levoglucosan, mannosan and resinic acids) were found to contribute significantly to the urban aerosol, especially in winter.
Ratios between these tracers indicated different biofuel contributions to the atmospheric particles of the two cities.
Secondary constituents from both biogenic (e.g. pinonic acid) and anthropogenic precursors (e.g. phthalic and benzoic
acids) were detected in both cities and seasons.
r 2007 Elsevier Ltd. All rights reserved.
Keywords: Urban aerosols; Polar organic compounds; Tracers; Source apportionment
e front matter r 2007 Elsevier Ltd. All rights reserved
mosenv.2007.03.001
ing author. Tel.: +351 234370200;
29290.
ess: [email protected] (C. Oliveira).
1. Introduction
Atmospheric particulate matter (PM) is anenvironmental concern above all because it candramatically reduce visual range (Hobbs, 2002), has
.

ARTICLE IN PRESSC. Oliveira et al. / Atmospheric Environment 41 (2007) 5555–55705556
relevance to radiative forcing of climate (Penneret al., 1998) and causes negative impacts on humanhealth (Pope et al., 2004; Poschl, 2005). Severalstudies on the composition of atmospheric PMrevealed that a significant fraction of the total masscould be attributed to organic constituents (Zhenget al., 2000; Alves et al., 2002; Feng et al., 2006a, b;Park et al., 2006). Most studies on the organicfraction of atmospheric PM have been dedicated toqualitative and quantitative aspects of the apolar orhydrocarbon fraction. Attention has been givento polycyclic aromatic hydrocarbons, because oftheir carcinogenic and mutagenic characteristics(Kavouras and Stephanou, 2002; Cancio et al.,2004; Shimmo et al., 2004; Wang et al., 2006).Numerous polar organic compounds, includingacids, alkanols, aldehydes and sugar derivativeshave been analysed in emissions of fine PM fromdifferent sources (Rogge et al., 1997, 1998; Nolteet al., 2002; Cheng et al., 2004; Otto et al., 2006).Such polar organic compounds are emitted directlyinto the atmosphere as PM by a multiplicity ofsources including power plants, vehicular circula-tion, meat cooking operations and biomass burning.Polar compounds are also produced through seco-ndary organic aerosol (SOA) formation initiated byphotochemical reactions of ozone and hydroxyland nitrate radicals with volatile hydrocarbonsincluding anthropogenic and biogenic hydrocarbons(Kavouras and Stephanou, 2002; Cheng et al., 2004;Alves and Pio, 2005). Studies focussed on thecharacterisation of polar constituents in ambientparticulate samples are scarce (Rogge et al., 1991;Kubatova et al., 2000; Mayol-Bracero et al., 2002;Nolte et al., 2002; Edney et al., 2003; Graham et al.,2003; Yue and Fraser, 2004; Ho et al., 2006; Wardet al., 2006). However, oxygenated species werefound to contribute up to more than 50% ofidentified organic compounds from emissionsources like biomass combustion, meat cookingsmoke, paved road dust, automobiles, cigarettesmoke and leaf surfaces of urban plants (Chenget al., 2004) and may comprise up to 80% of thesolvent extractable organic compounds in PM2.5 atsome urban sites (Zheng et al., 2000). The presenceof these compounds in the ambient aerosol particlesis an indication of a mixture from emission sourcesand atmospheric chemical processes and thereforecan serve as useful tracers for source apportionmentand processes involving organic carbonaceousaerosols when coupled with receptor models (Chenget al., 2004). Moreover, polar organic compounds
are hypothesised to make aerosol surfaces hydro-philic, which increases the particle’s aptitudeto act as cloud condensation nuclei, being importantto improve climate models (Yu, 2000).
To better understand the emissions and atmo-spheric processes influencing the molecular charac-teristics of atmospheric PM in urban environments,a comparative analysis of the aerosol organiccomposition in coarse and fine fractions (PM10–2.5
and PM2.5, respectively) in two very differentclimatic and geographic regions in Europe (Oporto,Portugal and Copenhagen, Denmark) was per-formed. The current study presents the relativestrengths of major emission sources, the impact ofregional transport on ambient PM levels, theinfluence of human activities patterns on molecularcomposition and a comparison between the roadsideconcentrations of polar organic constituents and atthe nearby urban background monitoring sites.
2. Experimental
2.1. Sampling sites
Oporto is the second largest Portuguese city withabout 250,000 residents and a population density of6300 inhabitants per square kilometre. The city,part of a larger region of about 1.2 millioninhabitants known as ‘‘Oporto Metropolitan Area’’,is located in the North of Portugal (411090N,81370W) on the Douro river estuary on the westIberian coast. Topographically this area issomewhat irregular, with a maximum altitude ofabout 400m decreasing to the coast. The climate isNorth maritime, having warm and dry summers,mild and wet winters and spring and autumnas transition seasons. The annual average tempera-ture is around 15 1C, with less than 10 1C betweenwarmer and colder monthly averages. The annualair humidity is between 75% and 80%, and the totalannual mean precipitation varies between 1000 and1200mm, about 40% of which in the winter season,and more than 100 days per year with precipitationequal to or higher than 1mm. The most importantstationary sources of atmospheric pollutants are anoil refinery, a petrochemical plant, a thermoelectricplant working with natural gas, a waste incinerationunit, an international shipping port and an interna-tional airport. Nevertheless, motor traffic is thoughtto be responsible for a significant amount of thepollutants emitted to the atmosphere (Pereira et al.,2005).

ARTICLE IN PRESSC. Oliveira et al. / Atmospheric Environment 41 (2007) 5555–5570 5557
Copenhagen, with about half a million ofinhabitants, or 1.1 million if suburbs are included,has a population density of 5500 inhabitants persquare kilometre. The city is located on flat land atthe coast (551410N, 121360E) facing to the east theOresund, a strait that connects the North Sea withthe Baltic Sea and separates Denmark from Sweden.It has a temperate coastal climate with an averagetemperature in January around the freezing pointand about 17 1C in July/August. Copenhagen hasvery little polluting industry and central district hasheating system from power stations with veryefficient emissions control.
Two sampling sites were selected in Oporto and inCopenhagen, one at a roadside impacted directly byfresh car emissions (roadside site) and the othermore distant from traffic emissions (urban back-ground site) to collect particles between 2.5 and10 mm in diameter (PM10–2.5, coarse fraction) andless than 2.5 mm (PM2.5, fine fraction). In both citiesthe sampling sites were close to each other, beingsubmitted to the same urban background atmo-sphere with differences in air composition only dueto fresh road emissions. Two, 1-month long,intensive winter and summer campaigns wereperformed. In Oporto the sampling programmetook place from 3 to 30 July and from 21 Novemberto 18 December 2003. In Copenhagen, samplecollection was performed in the periods of 13September–12 October 2003 and 19 February–17March 2004.
The Oporto roadside station is part of the city airpollution monitoring network (Pereira et al., 2005).It is placed at about 3m from the street, in the edgeof a roundabout close to an intersection of highlytraffic-affected roads. The site was over the influ-ence of about 60,000 vehicles per day (ratio gaso-line/diesel vehicles about 3–1) with a speed limit of50 kmh�1 and a similar number distribution patternbetween summer and winter weekdays. Besides lightduty vehicles, the station was under the influence ofheavy-duty diesel passenger vehicles as there weresome bus stops in the vicinities. Sampling took placeon the roof of the station, at about 3m height. Theurban background site was sited at about 600mto east from the roadside station and distantfrom traffic-impacted roads. Sampling took placeat about 3m height on the roof of a mobilemonitoring station.
In Copenhagen, the roadside station was placedclose to the first of six lanes (three in each direction)of a busy road, with about 60,000 vehicles passing
per workday (speed limit 60 kmh�1) more than95% of which were light duty. Sampling wasplaced 3m height on the roof of the station thatwas surrounded from one side by a bicyclelane, footway and some official buildings and fromthe other side by an amusement park with trees.Some restaurants were close to the amusementpark. The urban background site was installed onthe roof of a 20m high university building in apark area at 3 km from the roadside station.Although the building was close to a busy road,it was submitted to little direct influence of trafficdue to an open landscape and a large samplingheight.
2.2. Sampling and analytical procedures
Coarse and fine aerosol particles were dailycollected on pre-fired quartz fibre filters with highvolume samplers operating at a flow of1.13m3min�1. High-volume sampling is necessaryto collect enough material for a detailed organicspeciation. However, volatilisation/condensationprocesses of semi-volatile organics may occur onthe filter or particles surface, especially during hotsummer weather. Also, oxidation of filter depositedorganics by strong oxidants, such as ozone, mayhappen during filtration. No special devices, such asdenuders for pre-removal of gaseous oxidants andvolatile organic compounds (VOCs), and/or foamplugs for post-filter collection of volatilised parti-culate components from the filter were used duringsummer, because of the experimental difficulties inapplying such devices to high volume sampling.Measured concentrations for oxygenated organicspecies represent therefore an upper limit of thetrue atmospheric levels (Pio et al., 2001). Aftersampling, filters were temporarily stored in arefrigerator until analysis. Samples were extractedwith dichloromethane with an accelerated solventextraction system and the nitrogen-dried extract wasseparated into different organic fractions by flashchromatography with silica gel and various solventsof increasing polarity. The detailed description ofthe methodology for the extraction of organiccompounds could be found in Gogou et al. (1998)and Alves et al. (2001). The fractionated extractswere analysed by gas chromatography–mass spec-trometry (GC–MS). Before injection, the com-pounds with hydroxylic and carboxylic groupswere converted into the corresponding TMSether or TMS ester derivatives, respectively, by

ARTICLE IN PRESS
Table 1
PM2.5 levels (mgm�3) and PM2.5/PM10 ratios for Oporto and
Copenhagen
Oporto Copenhagen
Summer Winter Summer Winter
PM2.5
Roadside 19.3 27.0 25.0 16.5
Urban background 18.7 20.5 14.2 10.9
PM2.5/PM10
Roadside 0.49 0.62 0.47 0.50
Urban background 0.54 0.56 0.50 0.38
C. Oliveira et al. / Atmospheric Environment 41 (2007) 5555–55705558
addition of N,O-bis(trimethylsilyl)triflouroaceta-mide (BSTFA):trimethylchlorosilane (TMCS) 99:1(Supelco 33149-U), followed by 3 h in an oven at70 1C. Extracts were injected within 24 h after thederivatisation procedure. Two quadrupole GC–MSwere used, a Shimadzu QP5050A with automaticinjection and a HP 6890 MSD 5973 with manualinjection for analysis of fine and coarse particles,respectively. Both instruments worked at similaroperational conditions: (a) 1 mL splitless injectionwith 2min of sampling time and 250 1C of injectortemperature; (b) columns HP-5MS, 30m�0.25mm� 0.25 mm; (c) helium as carrier gas at aconstant flow of 1mLmin�1; (d) heating pro-gramme: 60 1C (1min); 60–150 1C (10 1Cmin�1);150–290 1C (5 1Cmin�1); 290 1C (27min); (e) acqui-sition mode, electronic impact at 70 eV; (f) interfaceand ion source at 290 1C; (g) scanned masses from33 to 800m/z. Calibration for GC–MS analysis wasbased on a total of about 45 standards in fourdifferent concentration levels with relative responsefactors determined individually to the majority ofcompounds. For those with no authentic standardsavailable, relative response factors were calculatedas an average of the relative response factors fromthe overall homologous series. Standards andsamples were both co-injected with tetracosaneD50 (Aldrich 45.177-0) as an internal standard.Compound identification was based on comparisonof resulting spectra with mass spectra libraries(Wiley and Nist), co-injection with authentic stan-dards and analysis of fragmentation patterns.Quantification was performed both by single ionmonitoring and total ion chromatogram analysis,totalising approximately 2000 injections.
3. Results and discussion
3.1. Particulate matter levels
Average values of PM concentrations at each ofthe monitored sites are presented in Table 1. In bothcities, urban background values are lower thanroadside levels and are within the range presentedfor other European cities. Querol et al. (2004)reported PM10 levels varying from 28 to 42 mgm�3
at urban background and from 37 to 53 mgm�3 atkerbside sites in seven selected cities throughoutEurope. Houthuijsa et al. (2001) presented PM10–2.5
and PM2.5 levels measured in 25 study areas of sixcentral and eastern European countries. The lowestconcentrations were found in Banska Bytrica
suburb, Slovak Republic, with arithmetic means of29 and 12 mgm�3 for the fine and coarse fractions,respectively. The highest annual mean PM10–2.5
concentration was obtained in Sofia centre, Bulgaria(38 mgm�3), while the highest annual mean PM2.5
levels were registered in Pszczyna, Poland(37 mgm�3). In Oporto, the PM2.5 levels present awinter maxima probably related to the major man-made emissions (road traffic exhausts and heatingdevices). The PM2.5/PM10 ratio in this Portuguesecity is higher during the cold season than insummer, indicating a build-up or longer residencetime of finer particulates or washout due to wetweather in winter. On the other hand, PM has alarger crustal/mineral in summer mainly allocatedto the coarse fraction. Contrary to Oporto, theDanish capital shows higher PM2.5 levels in summerthan in winter and an unclear seasonal variation ofthe PM2.5/PM10 ratios. PM seasonal variationresults from a complex interplay between differentprocesses affecting the aerosol composition. Pri-mary PM emissions, secondary PM formation, gasto particle phase equilibrium, dispersion of localemissions, transport from outside, wet and drydeposition, all influence the seasonal pattern. Be-sides the local sources, emissions from the rest ofEurope and from shipping were found to contributesignificantly to PM in Denmark (Heidam, 2000).
3.2. Polar organic species in atmospheric particulate
matter
Polar organic species present in the urbanaerosols from Oporto and Copenhagen encompassn-alkanols, sterols, anhydrosaccharides, n-alkanoicacids, n-alkenoic acids and dicarboxylic acids. Theseconstituents reveal a seasonal pattern with high
ARTICLE IN PRESS
OPORTO WD %
N 7.1
NE 0.0
E 0.0
SE 0.0
S 0.0
SW 10.7
W 42.9
SUMMER, Coarse fraction SUMMER, Fine fraction
0
50
100
150
200N
NE
E
SE
S
SW
W
NW
NW 39.3
WD %
N 0.0
NE 7.1
E 10.7
SE 42.9
S 21.4
SW 17.9
W 0.0
WINTER, Coarse fraction
0
20
40
60N
NE
E
SE
S
SW
W
NW
WINTER, Fine fraction
0
500
1000N
NE
E
SE
S
SW
W
NW
NW 0.0
COPENHAGEN WD %
N 6.7
NE 3.3
E 0.0
SE 0.0
S 16.7
SW 36.7
W 26.7
0
50
100N
NE
E
SE
S
SW
W
NW
SUMMER, Coarse fraction SUMMER, Fine fraction
0
50
100
150N
NE
E
SE
S
SW
W
NW
NW 10.0
WD %
N 7.1
NE 21.4
E 10.3
SE 3.6
S 3.6
SW 28.6
W 7.1
WINTER, Coarse fraction
0
50
100
150N
NE
E
SE
S
SW
W
NW
WINTER, Fine fraction
0
200
400
600N
NE
E
SE
S
SW
W
NW
NW 7.1
20
40
60N
NE
E
SE
S
SW
W
NW
0
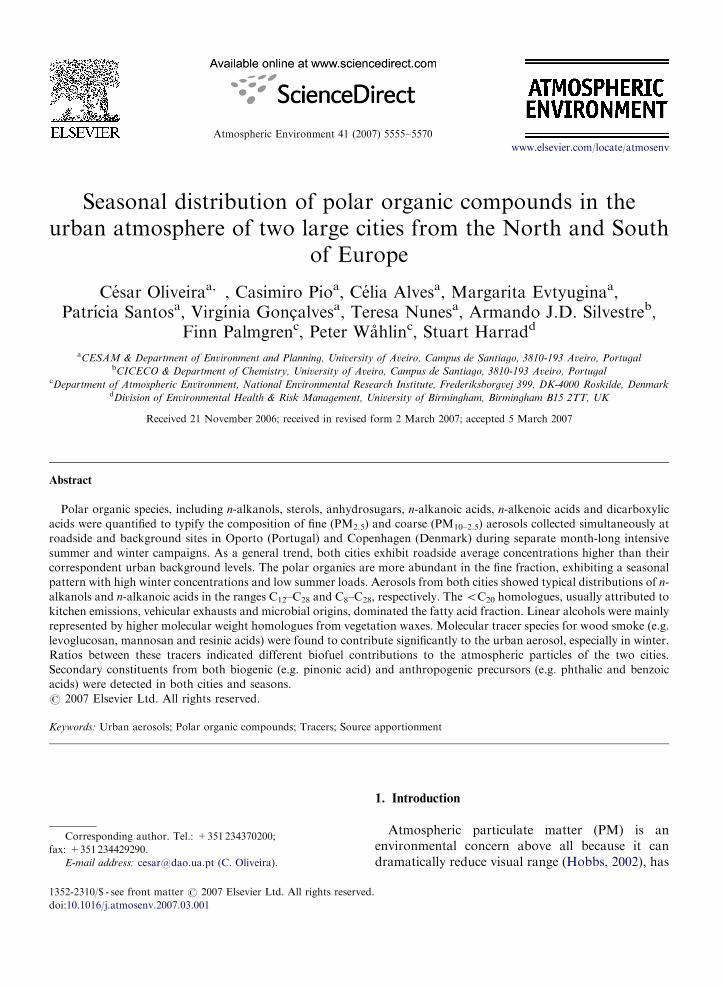
Fig. 1. Pollution roses with total concentrations (ngm�3) of polar organic compounds and frequencies of wind direction (Roadside—grey
fill pattern; Background—dotted fill pattern).
C. Oliveira et al. / Atmospheric Environment 41 (2007) 5555–5570 5559
winter concentrations and low summer loads(Fig. 1). The increase in concentrations duringwinter could be associated with higher pollutantemissions and also with the fact that lower wintertemperatures promote the decrease of mixingheights and the existence of inversion layers, leadingto poorer dispersion and diminishing the dilutionfactors and, therefore, conducting to an increase ofatmospheric pollutant concentrations. As somecompounds have a highly temperature dependentgas/particle partitioning coefficient, the high sum-mer temperature could promote their displacementfrom particulate to gas phase, decreasing theiraerosol phase concentrations (Feng et al., 2006a).In Oporto, the amounts of polar organic constitu-ents maximise in accordance with the prevailingwinds. In summer, more frequent westerly andnorth-westerly winds with Atlantic influence areregistered, while in wintertime the prevailing airmasses come from E/SE, presenting a morecontinental character. In summer, the predomi-nantly Atlantic air masses may bring the contribu-tions of stationary sources located in the SW to Nsectors (e.g. oil refinery, petrochemical plant, ship-ping port, airport, and wood panel industry). Inwinter, long-range transport from source regions
in central Iberian Peninsula may affect the urbanscale.
In spite of winds blowing mostly from the SWdirection, the summer organic aerosol mass obtainedfor the Danish sites is associated with wind directionsfrom S to NE. Taking into account that the powerplant located a few km far from the city centre insouthwest direction has very efficient emissioncontrol technologies, this industry is not expectedto contribute significantly to air pollution loads. Inwinter, particulate components cover all wind sectorswith variable concentrations. Besides traffic, poten-tial sources in the surroundings of the sampling sitesinclude the airport situated about 10km southeast ofthe centre, an incineration plant with air cleaningequipment in the westerly direction and the shippingport. However, backward mass trajectories (notshown) suggest that long-range transport may bringcontributions from distant sources. Atmospherictransport from the North Sea, United Kingdom,other Scandinavian countries, and Germany wasregistered during both seasons. A significant con-tribution from central and western Europe wasadditionally observed during winter.
To investigate weekly trends in chemical compo-sition of the polar carbonaceous fraction of PM, the

ARTICLE IN PRESSC. Oliveira et al. / Atmospheric Environment 41 (2007) 5555–55705560
average weekend concentrations were comparedwith those of working days (Table 2). In Oporto,a weekend decrease in polar compounds is ingeneral observed, possibly due to emissions fromsources with weekly activity patterns, such as motorvehicle traffic (Lough et al., 2006). This trend is notnoticed in Copenhagen, especially in winter, whenhigher weekend levels were observed. Compoundsthat contributed most to the overall weekendincrease during the cold season are sterols andanhydrosaccharides and, to a less extent, diacids.The highest concentrations of sterols and anhydro-saccharides could be related to wood burning inweekend fires or increased late-week restaurantbusiness and use of wood burning ovens andfireplaces (Lough et al., 2006). These primaryemission sources could also contribute to theweekend increase in concentrations of diacids. Sincediacids in PM have also been considered indicatorsof SOA formation, the trend observed may beadditionally due to the accumulation of precursorsthroughout the week (Lough et al., 2006). Glasius etal. (2006) found that the influence of residentialwood combustion on local air quality in a smallrural town is comparable to the local trafficcontribution observed at a busy street in Copenha-gen. The same investigation also pointed out theimportance of long-range transport of organiccomponents to PM2.5, including those due tobiomass burning. In 2002, it was estimated thatthere were about 300,000 stoves in Denmark and90,000 small-scale boilers using wood, which con-tributed to an annual PM2.5 emission of approxi-mately 10,000 tonnes (Illerup and Nielsen, 2004).
Aerosols from both cities showed typical distri-butions of n-alkanols and n-alkanoic acids in theranges C12–C28 and C8–C28, respectively. The
Table 2
Comparison between weekend and working days total concentrations
Oporto
Summer Winter
Working days Weekend Working days W
Coarse fraction
Roadside 39.4 26.2 49.6 4
Urban background 27.9 18.4 39.2 4
Fine fraction
Roadside 99.5 83.1 710 51
Urban background 127 97.2 561 56
identification of homologous compound seriespresent in the chromatographically elutable polarfraction allows the determination of distinct diag-nostic parameters (Tables 3 and 4). The presence ofbiogenic inputs and directly emitted anthropogenicorganic compounds can be evaluated with thecarbon preference index (CPI) that, for n-alkanolsand n-alkanoic acids, is defined as the ratio of themass of even-to-odd compounds over the corre-spondent homologous series. The biogenic n-alka-nols and n-alkanoic acids present an even-to-oddcarbon number predominance over a given carbonnumber range. Cmax is a parameter that allowsaccounting for the relative incorporation of bio-genic material in atmospheric PM. Normally,n-alcohols and n-acids with C24, or higher carbonnumber, as Cmax are indicative of a considerableinput of epicuticular waxes from terrestrial higherplants, whereas compounds with Cmax carbonchains below C20 might be attributed to microbialsources (Simoneit, 1989). Wax n-alkanols (WNAL)and wax n-alkanoic acids (WNAC) are used toevaluate the relative input of higher plant epicuti-cular waxes to the aerosol (Simoneit et al., 1991).The concentrations of the WNAL and WNAC arecalculated by subtraction from each odd carboncompound, the average value of the next higher andlower even carbon numbered homologues ðWCn ¼
Cn � 0:5½ðCnþ1Þ þ ðCn�1Þ�Þ taking as zero the nega-tive values. The average chain length (ACL) is equaltoPðnCnÞ=
PCn, where C is the abundance and n
represents the even C numbers ranging from 22 to34 (Alves et al., 2001; SchefuX et al., 2003).
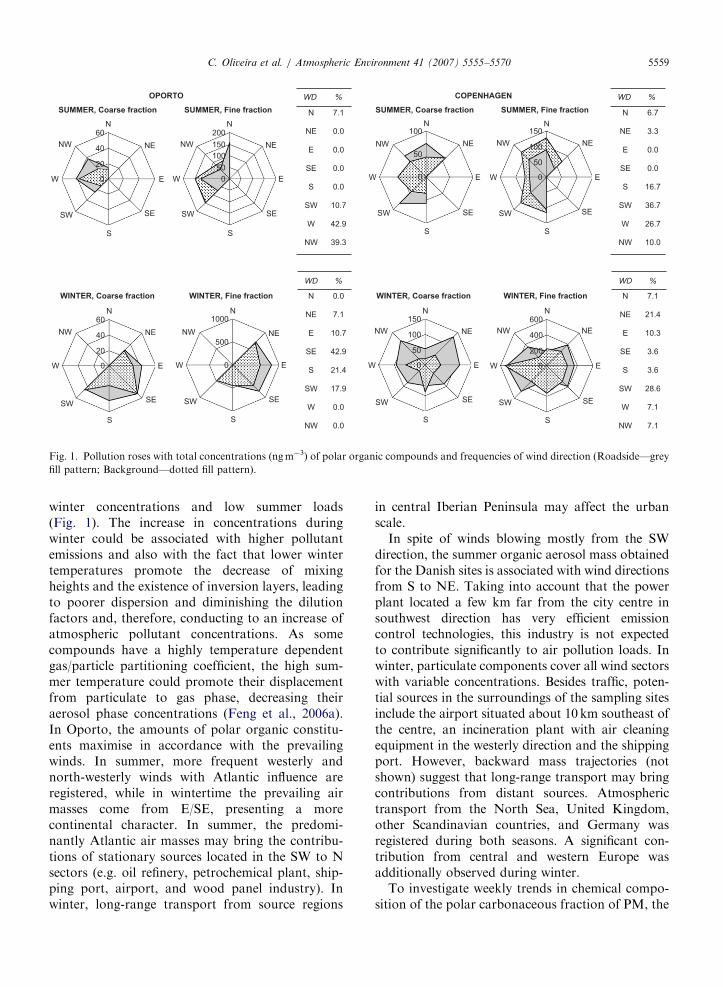
The distributions of the homologous compoundseries of n-alkanols do not differ substantiallybetween summer and winter though the concentra-tions were quite different in each season (Fig. 2a).
of polar organic compounds (ngm�3)
Copenhagen
Summer Winter
eekend Working days Weekend Working days Weekend
0.6 74.3 46.5 97.8 91.1
4.5 46.0 50.9 34.1 52.1
9 67.5 86.6 328 455
5 113 83.8 263 344

ARTICLE IN PRESS
Table 3
Summary of analytical results and geochemical parameters for n-alkanols [(S)—summer; (W)—winter]
Oporto Copenhagen
Roadside Urban background Roadside Urban background
Coarse Fine Coarse Fine Coarse Fine Coarse Fine
Avg. conc.
(ngm�3)
0.8 (W) 36.5 (W) 0.5 (W) 35.7 (W) 0.9 (W) 21.1 (W) 0.4 (W) 19.6 (W)
1.3 (S) 13.8 (S) 0.8 (S) 14.5 (S) 2.7 (S) 13.2 (S) 2.0 (S) 8.5 (S)
Max. conc.
(ngm�3)
0.19 (W) 6.46 (W) 0.10 (W) 5.47 (W) 0.18 (W) 4.28 (W) 0.12 (W) 5.47 (W)
0.54 (S) 3.39 (S) 0.38 (S) 3.89 (S) 1.16 (S) 4.00 (S) 0.98 (S) 3.07 (S)
Cmax C18; C26; C28 (W) C22; C15; C12 (W) C26; C18; C28 (W) C15; C22; C12 (W) C26; C18; C28 (W) C15; C12; C22 (W) C18; C26 (W) C15; C12; C22 (W)
C26; C28; C18 (S) C15; C26; C28 (S) C26 (S) C15; C26 (S) C26; C28 (S) C15; C26 (S) C26; C28 (S) C15; C26 (S)
XC20/oC20 0.45 (W) 4.58 (W) 0.47 (W) 4.28 (W) 0.65 (W) 5.59 (W) 1.10 (W) 6.95 (W)
0.45 (S) 5.87 (S) 0.60 (S) 8.39 (S) 0.69 (S) 5.35 (S) 0.43 (S) 13.19 (S)
ACL 26.1 (W) 23.7 (W) 26.2 (W) 24.1 (W) 26.0 (W) 23.7 (W) 25.3 (W) 24.0 (W)
26.6 (S) 26.1 (S) 26.7 (S) 26.1 (S) 25.8 (S) 26.1 (S) 25.6 (S) 25.1 (S)
Global CPI 23.6 (W) 2.98 (W) 26.1 (W) 3.04 (W) 15.9 (W) 3.02 (W) 41.8 (W) 2.44 (W)
23.9 (S) 2.00 (S) 22.4 (S) 1.96 (S) 21.7 (S) 1.81 (S) 66.4 (S) 1.57 (S)
WNAL
(ngm�3)
0.37 (W) 11.9 (W) 0.26 (W) 11.4 (W) 0.44 (W) 6.88 (W) 0.16 (W) 6.45 (W)
0.91 (S) 5.80 (S) 0.61 (S) 6.11 (S) 2.10 (S) 4.77 (S) 1.60 (S) 3.35 (S)
WNAL (%) 48.7 (W) 32.5 (W) 56.2 (W) 31.9 (W) 50.5 (W) 32.6 (W) 41.0 (W) 32.9 (W)
69.6 (S) 42.1 (S) 75.0 (S) 42.3 (S) 76.8 (S) 36.1 (S) 79.8 (S) 39.3 (S)
C. Oliveira et al. / Atmospheric Environment 41 (2007) 5555–5570 5561
The n-alkanol homologues oC20 appear to bederived from microbial sources, although someodd carbon number homologues have been detectedin meat cooking particulate emissions (Rogge et al.,1991) and cigarette smoke (Rogge et al., 1994). Thelong chain linear alcohols are characteristic of thevegetation waxes. Epicuticular waxes present onsurfaces of plant leaves can become airborne whenleaves rub against each other in the wind. However,anthropogenic activities involving biogenic sourcessuch as wildfires also contribute to particles contain-ing these high molecular weight compounds (Nolteet al., 2002). In Oporto and Copenhagen, themajority of the n-alkanol mass is concentrated inthe fine aerosol fraction, for which a seasonalpattern is observed with higher concentrations andhigher CPI values in winter. The average of winter/summer concentration ratios is approximately 2.This may reflect an enhanced microbial componentduring the colder season, since the wax constituentshave a less pronounced percentual contribution tothe aerosol content in this period of the year. Aninput of microbial lipids could arise by theremobilisation of soil dust (Simoneit et al., 1991).Additionally, bacteria may grow attached to theleaves and be emitted with plant wax (Rogge et al.,1993a). During summer, an increment in anthro-pogenic inputs is observed, thus lowering the globalCPI ratios. The homologue that contributed most tothis fact was the C15, which has been detected inemissions from charbroilers and meat cooking
operations (Rogge et al., 1991). Percentually, then-alkanols wax content of the fine fraction, wherethe mass is concentrated, increases from around30% in winter to 40% in summer for both thePortuguese and Danish samples. Although present-ing low concentrations, the coarse aerosol isdominated by the wax components C26 and C28,which contribute to very high CPI values of this sizefraction. Since primary emissions, such as leafabrasion and biomass burning, originate predomi-nantly fine particles (Rogge et al., 1993a, b, 1998),the presence of these constituents in larger aerosolsmay be related to adsorption processes onto coarsedust particles. Given that road dust is partiallycomprised of atmospheric particles that have beendeposited to the road surface, any particulateorganic compound found in the atmosphere mightbe expected to be detectable in road dust, which canbe re-suspended (Nolte et al., 2002). Kavouras andStephanou (2002) showed that n-alkanols in urbanaerosols from Greece presented a mass meanaerodynamic diameter of 2.45 mm. The size distribu-tion reported by Pio et al. (2006) for aerosols froman anthropogenically influenced rural German siteshowed a single peak in the range 1.3–4.2 mm.
The ACL index of n-alkanols apparently de-creases in winter for the fine fraction, while it suffersvery slight changes between periods for the coarsefraction. This suggests that the incorporationprocesses into the atmospheric particles reflect themajor seasonal changes in the wax constitution of

ARTICLE IN PRESS
Table 4
Summary of analytical results and geochemical parameters for n-alkanoic acids [(S)—summer; (W)—winter]
Oporto Copenhagen
Roadside Urban background Roadside Urban background
Coarse Fine Coarse Fine Coarse Fine Coarse Fine
Avg. conc.
(ngm�3)
13.0 (W) 222 (W) 10.3 (W) 218 (W) 9.8 (W) 109 (W) 4.3 (W) 63.4 (W)
8.5 (S) 33.0 (S) 4.5 (S) 47.5 (S) 12.1 (S) 18.7 (S) 3.8 (S) 13.0 (S)
Max. conc.
(ngm�3)
6.01 (W) 69.5 (W) 4.14 (W) 64.7 (W) 4.20 (W) 28.1 (W) 1.84 (W) 14.2 (W)
3.21 (S) 12.2 (S) 1.94 (S) 14.5 (S) 4.82 (S) 10.3 (S) 1.74 (S) 5.59 (S)
Cmax C16; C18 (W, S) C16; C18; C12 (W) C16; C18 (W, S) C18; C16 (W) C16; C18 (W, S) C16; C12; C18 (W) C16; C18 (W, S) C16; C12; C18 (W)
C16; C18 (S) C16; C18 (S) C16; C18 (S) C16; C18 (S)
XC20/oC20 0.64 (W) 0.80 (W) 0.50 (W) 0.75 (W) 0.64 (W) 0.85 (W) 2.02 (W) 0.92 (W)
0.66 (S) 0.63 (S) 0.62 (S) 0.58 (S) 0.94 (S) 0.23 (S) 0.69 (S) 0.71 (S)
ACL 23.63 (W) 23.3 (W) 24.4 (W) 23.8 (W) 22. 9 (W) 23.1 (W) 23.5 (W) 22.9 (W)
23.27 (S) 23.8 (S) 22.6 (S) 24.3 (S) 24.0 (S) 22.4 (S) 23.1 (S) 22.9 (S)
C18:0/C18:1 10.3 (W) 4.67 (W) 14.6 (W) 5.54 (W) 31.1 (W) 0.79 (W) 13.0 (W) 0.70 (W)
22.7 (S) 14.5 (S) 17.5 (S) 13.7 (S) 10.2 (S) 9.43 (S) 5.28 (S) 9.45 (S)
C18:0/C16:0 0.67 (W) 0.85 (W) 0.68 (W) 0.87 (W) 0.75 (W) 0.61 (W) 0.55 (W) 0.55 (W)
0.57 (S) 0.52 (S) 0.47 (S) 0.56 (S) 0.85 (S) 0.35 (S) 0.53 (S) 0.35 (S)
C18:0/C18:2 22.5 (W) 2.59 (W) 27.4 (W) 6.11 (W) 250 (W) 0.74 (W) 65.7 (W) 0.64 (W)
56.1 (S) 23.1 (S) 32.7 (S) 19.8 (S) 48.9 (S) 38.1 (S) 19.5 (S) 22.0 (S)
Global CPI 14.3 (W) 7.55 (W) 14.3 (W) 8.17 (W) 9.76 (W) 5.73 (W) 7.78 (W) 4.98 (W)
7.11 (S) 6.78 (S) 8.28 (S) 5.97 (S) 12.6 (S) 9.15 (S) 9.38 (S) 6.26 (S)
WNAC
(ngm�3)
0.92 (W) 7.21 (W) 1.02 (W) 13.6 (W) 0.19 (W) 4.15 (W) 0.32 (W) 2.54 (W)
0.26 (S) 4.94 (S) 0.18 (S) 9.78 (S) 1.12 (S) 0.27 (S) 0.24 (S) 0.87 (S)
WNAC (%) 7.1 (W) 3.3 (W) 9.9 (W) 6.2 (W) 1.9 (W) 3.8 (W) 7.5 (W) 4.0 (W)
3.1 (S) 15.0 (S) 4.0 (S) 20.6 (S) 9.3 (S) 1.4 (S) 6.2 (S) 6.7 (S)
C. Oliveira et al. / Atmospheric Environment 41 (2007) 5555–55705562
the predominant vegetation and that those pro-cesses took place chiefly in the small aerosol sizes. Ithas been assumed that in warmer tropical climateslonger chain compounds are biosynthesised as waxlipids, whereas in cooler temperate regions predo-minantly shorter chain compounds are produced.However, certain environmental conditions, such asfog exposure, precipitation regime, aridity andgrowing-season temperature may influence the plantor microbial enzymatic mechanisms, shifting thewax composition and, consequently, the aerosolconstitution (SchefuX et al., 2003). The inducedchanges may include the cleavage and loss of one ortwo carbons of the long chain homologues. On theother hand, transport of air masses influenced byinputs of different taxonomic species may also playan important role (Alves et al., 2007). The widerange of ACL values obtained in both cities isindicative of a multiplicity of processes contributingto the WNAL.
Fatty acids were the most abundant componentin the polar organic fraction of aerosols (Fig. 2b).TheoC20 homologues of fatty acids are ubiquitous.Anthropogenic sources for n-alkanoic acids includethe combustion of fossil fuels, wood and organicdetritus. Meat cooking also contributes to the
presence of n-alkanoic acids in ambient aerosols.The dominant n-alkanoic acids in meat smokeaerosol are C14:0, C16:0 and C18:0, with highestemission rates for C16:0 and C18:0. The release ofn-alkanoic acids from fossil fuel combustion isanother important source of the lower molecularweight n-alkanoic acids, maximising at C16:0.Alkanoic acids oC20 have been found in the wax-like extracts of fungi (molds), bacteria, spores,pollen, and algae (Rogge et al., 1993a). Lowmolecular weight n-alkanoic acids, such as palmitic(C16:0) and stearic (C18:0) were the most abundantconstituents in all Portuguese and Danish samples.The dominance of n-carboxylic acids oC20, espe-cially during the wintertime, with ratiosXC22/oC20
under 1 and Cmax at C16 and C18 reflects largemicrobial contributions, which are usually found inurban aerosols (Fang et al., 1999). The averageACL values found both in Oporto and Copenhagenare in accordance with the fatty acid wax content ofconifer vegetation in coastal areas (Alves et al.,2001). The wax portion, although small in totalfatty acid contributions, present higher concentra-tions in winter than in summer. The higher winteramount of waxy acids was probably due to thehigher wax content in dead leaves and from wind
ARTICLE IN PRESS
0
10
20
30
40
50
Oporto
Co
ncen
trati
on
(n
g m
-3)
Co
ncen
trati
on
(n
g m
-3)
Co
ncen
trati
on
(n
g m
-3)
Co
ncen
trati
on
(n
g m
-3)
Co
ncen
trati
on
(n
g m
-3)
Co
ncen
trati
on
(n
g m
-3)
Co
ncen
trati
on
(n
g m
-3)
Co
ncen
trati
on
(n
g m
-3)
0
10
20
30
40
50Winter Summer
R UB R UB R UB R UB R UB R UB R UB R UB
R UB R UB R UB R UB R UB R UB R UB R UB
R UB R UB R UB R UB R UB R UB R UB R UB
R UB R UB R UB R UB R UB R UB R UB R UB
0
50
100
150
200
250
300
0
20
40
60
80
0
50
100
150
200
Winter Summer Winter Summer Winter Summer
Winter Summer Winter Summer
Winter Summer Winter Summer
Winter Summer Winter Summer
Winter Summer Winter Summer
Winter Summer Winter Summer
Winter Summer Winter Summer
Copenhagen Oporto Copenhagen
Oporto Copenhagen
Oporto Copenhagen
Oporto Copenhagen
Oporto Copenhagen
Oporto Copenhagen
Oporto Copenhagen
0
10
20
30
40
50
60
0.0
1.0
2.0
3.0
4.0
5.0
6.0
0.0
0.5
1.0
1.5
2.0
2.5
3.0
Fig. 2. Average concentrations of: (a) total n-alkanols; (b) total n-alkanoic acids; (c) biomass burning sterols; (d) levoglucosan; (e) total
resinic acids; (f) pinonic acid; (g) benzoic acid; and (h) phthalic acid. R—roadside site; UB—urban background site. Black bars correspond
to fine fraction and white bars to coarse fraction.
C. Oliveira et al. / Atmospheric Environment 41 (2007) 5555–5570 5563
ARTICLE IN PRESSC. Oliveira et al. / Atmospheric Environment 41 (2007) 5555–55705564
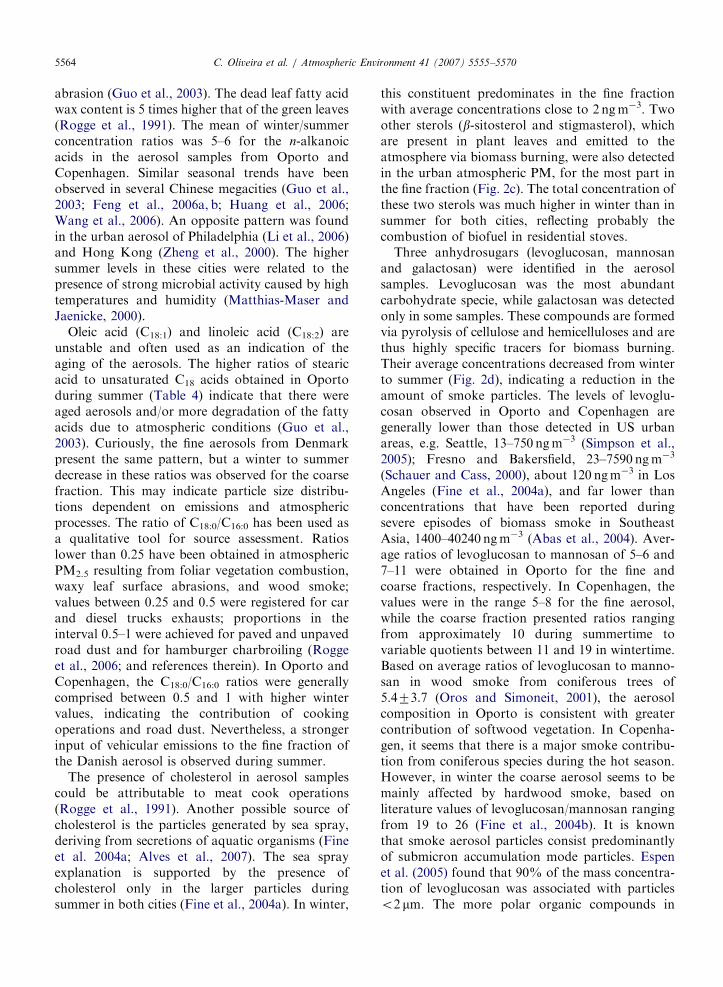
abrasion (Guo et al., 2003). The dead leaf fatty acidwax content is 5 times higher that of the green leaves(Rogge et al., 1991). The mean of winter/summerconcentration ratios was 5–6 for the n-alkanoicacids in the aerosol samples from Oporto andCopenhagen. Similar seasonal trends have beenobserved in several Chinese megacities (Guo et al.,2003; Feng et al., 2006a, b; Huang et al., 2006;Wang et al., 2006). An opposite pattern was foundin the urban aerosol of Philadelphia (Li et al., 2006)and Hong Kong (Zheng et al., 2000). The highersummer levels in these cities were related to thepresence of strong microbial activity caused by hightemperatures and humidity (Matthias-Maser andJaenicke, 2000).
Oleic acid (C18:1) and linoleic acid (C18:2) areunstable and often used as an indication of theaging of the aerosols. The higher ratios of stearicacid to unsaturated C18 acids obtained in Oportoduring summer (Table 4) indicate that there wereaged aerosols and/or more degradation of the fattyacids due to atmospheric conditions (Guo et al.,2003). Curiously, the fine aerosols from Denmarkpresent the same pattern, but a winter to summerdecrease in these ratios was observed for the coarsefraction. This may indicate particle size distribu-tions dependent on emissions and atmosphericprocesses. The ratio of C18:0/C16:0 has been used asa qualitative tool for source assessment. Ratioslower than 0.25 have been obtained in atmosphericPM2.5 resulting from foliar vegetation combustion,waxy leaf surface abrasions, and wood smoke;values between 0.25 and 0.5 were registered for carand diesel trucks exhausts; proportions in theinterval 0.5–1 were achieved for paved and unpavedroad dust and for hamburger charbroiling (Roggeet al., 2006; and references therein). In Oporto andCopenhagen, the C18:0/C16:0 ratios were generallycomprised between 0.5 and 1 with higher wintervalues, indicating the contribution of cookingoperations and road dust. Nevertheless, a strongerinput of vehicular emissions to the fine fraction ofthe Danish aerosol is observed during summer.
The presence of cholesterol in aerosol samplescould be attributable to meat cook operations(Rogge et al., 1991). Another possible source ofcholesterol is the particles generated by sea spray,deriving from secretions of aquatic organisms (Fineet al. 2004a; Alves et al., 2007). The sea sprayexplanation is supported by the presence ofcholesterol only in the larger particles duringsummer in both cities (Fine et al., 2004a). In winter,
this constituent predominates in the fine fractionwith average concentrations close to 2 ngm�3. Twoother sterols (b-sitosterol and stigmasterol), whichare present in plant leaves and emitted to theatmosphere via biomass burning, were also detectedin the urban atmospheric PM, for the most part inthe fine fraction (Fig. 2c). The total concentration ofthese two sterols was much higher in winter than insummer for both cities, reflecting probably thecombustion of biofuel in residential stoves.
Three anhydrosugars (levoglucosan, mannosanand galactosan) were identified in the aerosolsamples. Levoglucosan was the most abundantcarbohydrate specie, while galactosan was detectedonly in some samples. These compounds are formedvia pyrolysis of cellulose and hemicelluloses and arethus highly specific tracers for biomass burning.Their average concentrations decreased from winterto summer (Fig. 2d), indicating a reduction in theamount of smoke particles. The levels of levoglu-cosan observed in Oporto and Copenhagen aregenerally lower than those detected in US urbanareas, e.g. Seattle, 13–750 ngm�3 (Simpson et al.,2005); Fresno and Bakersfield, 23–7590 ngm�3
(Schauer and Cass, 2000), about 120 ngm�3 in LosAngeles (Fine et al., 2004a), and far lower thanconcentrations that have been reported duringsevere episodes of biomass smoke in SoutheastAsia, 1400–40240 ngm�3 (Abas et al., 2004). Aver-age ratios of levoglucosan to mannosan of 5–6 and7–11 were obtained in Oporto for the fine andcoarse fractions, respectively. In Copenhagen, thevalues were in the range 5–8 for the fine aerosol,while the coarse fraction presented ratios rangingfrom approximately 10 during summertime tovariable quotients between 11 and 19 in wintertime.Based on average ratios of levoglucosan to manno-san in wood smoke from coniferous trees of5.473.7 (Oros and Simoneit, 2001), the aerosolcomposition in Oporto is consistent with greatercontribution of softwood vegetation. In Copenha-gen, it seems that there is a major smoke contribu-tion from coniferous species during the hot season.However, in winter the coarse aerosol seems to bemainly affected by hardwood smoke, based onliterature values of levoglucosan/mannosan rangingfrom 19 to 26 (Fine et al., 2004b). It is knownthat smoke aerosol particles consist predominantlyof submicron accumulation mode particles. Espenet al. (2005) found that 90% of the mass concentra-tion of levoglucosan was associated with particleso2 mm. The more polar organic compounds in
ARTICLE IN PRESSC. Oliveira et al. / Atmospheric Environment 41 (2007) 5555–5570 5565
wood smoke may make the particles more hygro-scopic and favour additional growth to larger sizes(Fine et al., 2004a). Redistribution of organics fromsubmicron to larger particle sizes in urban environ-ments may also occur by adsorption of thosecompounds onto mineral dust particles (Falkovichet al., 2004).
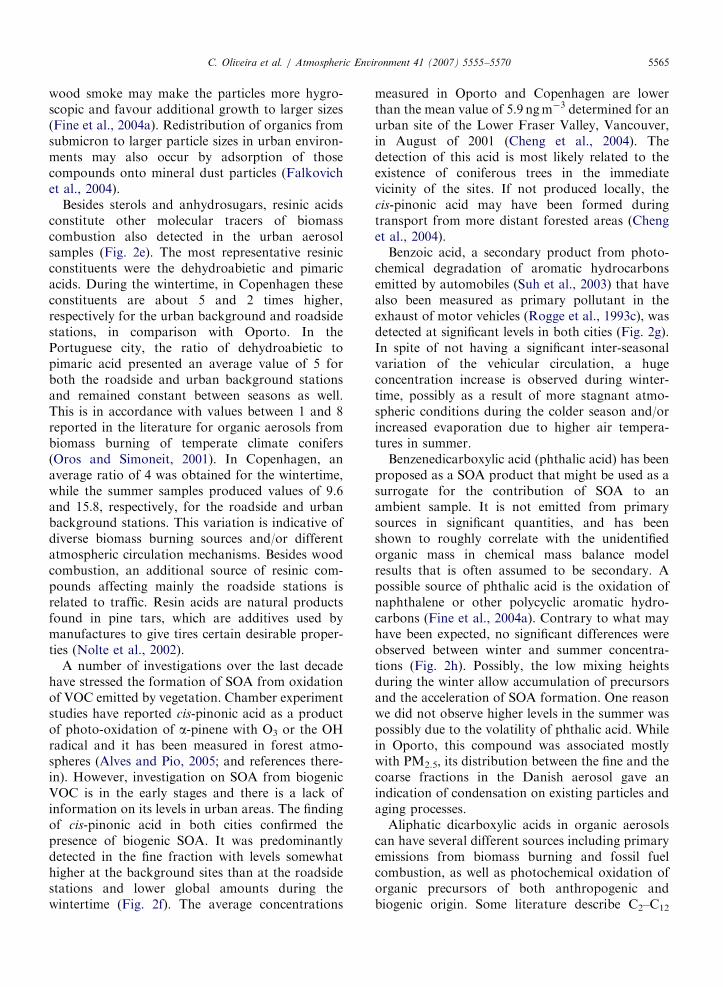
Besides sterols and anhydrosugars, resinic acidsconstitute other molecular tracers of biomasscombustion also detected in the urban aerosolsamples (Fig. 2e). The most representative resinicconstituents were the dehydroabietic and pimaricacids. During the wintertime, in Copenhagen theseconstituents are about 5 and 2 times higher,respectively for the urban background and roadsidestations, in comparison with Oporto. In thePortuguese city, the ratio of dehydroabietic topimaric acid presented an average value of 5 forboth the roadside and urban background stationsand remained constant between seasons as well.This is in accordance with values between 1 and 8reported in the literature for organic aerosols frombiomass burning of temperate climate conifers(Oros and Simoneit, 2001). In Copenhagen, anaverage ratio of 4 was obtained for the wintertime,while the summer samples produced values of 9.6and 15.8, respectively, for the roadside and urbanbackground stations. This variation is indicative ofdiverse biomass burning sources and/or differentatmospheric circulation mechanisms. Besides woodcombustion, an additional source of resinic com-pounds affecting mainly the roadside stations isrelated to traffic. Resin acids are natural productsfound in pine tars, which are additives used bymanufactures to give tires certain desirable proper-ties (Nolte et al., 2002).
A number of investigations over the last decadehave stressed the formation of SOA from oxidationof VOC emitted by vegetation. Chamber experimentstudies have reported cis-pinonic acid as a productof photo-oxidation of a-pinene with O3 or the OHradical and it has been measured in forest atmo-spheres (Alves and Pio, 2005; and references there-in). However, investigation on SOA from biogenicVOC is in the early stages and there is a lack ofinformation on its levels in urban areas. The findingof cis-pinonic acid in both cities confirmed thepresence of biogenic SOA. It was predominantlydetected in the fine fraction with levels somewhathigher at the background sites than at the roadsidestations and lower global amounts during thewintertime (Fig. 2f). The average concentrations
measured in Oporto and Copenhagen are lowerthan the mean value of 5.9 ngm�3 determined for anurban site of the Lower Fraser Valley, Vancouver,in August of 2001 (Cheng et al., 2004). Thedetection of this acid is most likely related to theexistence of coniferous trees in the immediatevicinity of the sites. If not produced locally, thecis-pinonic acid may have been formed duringtransport from more distant forested areas (Chenget al., 2004).
Benzoic acid, a secondary product from photo-chemical degradation of aromatic hydrocarbonsemitted by automobiles (Suh et al., 2003) that havealso been measured as primary pollutant in theexhaust of motor vehicles (Rogge et al., 1993c), wasdetected at significant levels in both cities (Fig. 2g).In spite of not having a significant inter-seasonalvariation of the vehicular circulation, a hugeconcentration increase is observed during winter-time, possibly as a result of more stagnant atmo-spheric conditions during the colder season and/orincreased evaporation due to higher air tempera-tures in summer.
Benzenedicarboxylic acid (phthalic acid) has beenproposed as a SOA product that might be used as asurrogate for the contribution of SOA to anambient sample. It is not emitted from primarysources in significant quantities, and has beenshown to roughly correlate with the unidentifiedorganic mass in chemical mass balance modelresults that is often assumed to be secondary. Apossible source of phthalic acid is the oxidation ofnaphthalene or other polycyclic aromatic hydro-carbons (Fine et al., 2004a). Contrary to what mayhave been expected, no significant differences wereobserved between winter and summer concentra-tions (Fig. 2h). Possibly, the low mixing heightsduring the winter allow accumulation of precursorsand the acceleration of SOA formation. One reasonwe did not observe higher levels in the summer waspossibly due to the volatility of phthalic acid. Whilein Oporto, this compound was associated mostlywith PM2.5, its distribution between the fine and thecoarse fractions in the Danish aerosol gave anindication of condensation on existing particles andaging processes.
Aliphatic dicarboxylic acids in organic aerosolscan have several different sources including primaryemissions from biomass burning and fossil fuelcombustion, as well as photochemical oxidation oforganic precursors of both anthropogenic andbiogenic origin. Some literature describe C2–C12

ARTICLE IN PRESS
Roadside
C3 C4 C5 C6 C7 C8 C9 C10 C16
ng m
-3ng m
-3
0
5
10
15
20Urban background
C3 C4 C5 C6 C7 C8 C9 C10 C16
PM2.5 - Winter
PM10-2.5 - Winter
PM2.5 - Summer
PM10-2.5 - Summer
Copenhagen
Roadside
C3 C4 C5 C6 C7 C8 C9 C10 C160
5
10
15
20Urban background
C3 C4 C5 C6 C7 C8 C9 C10 C16
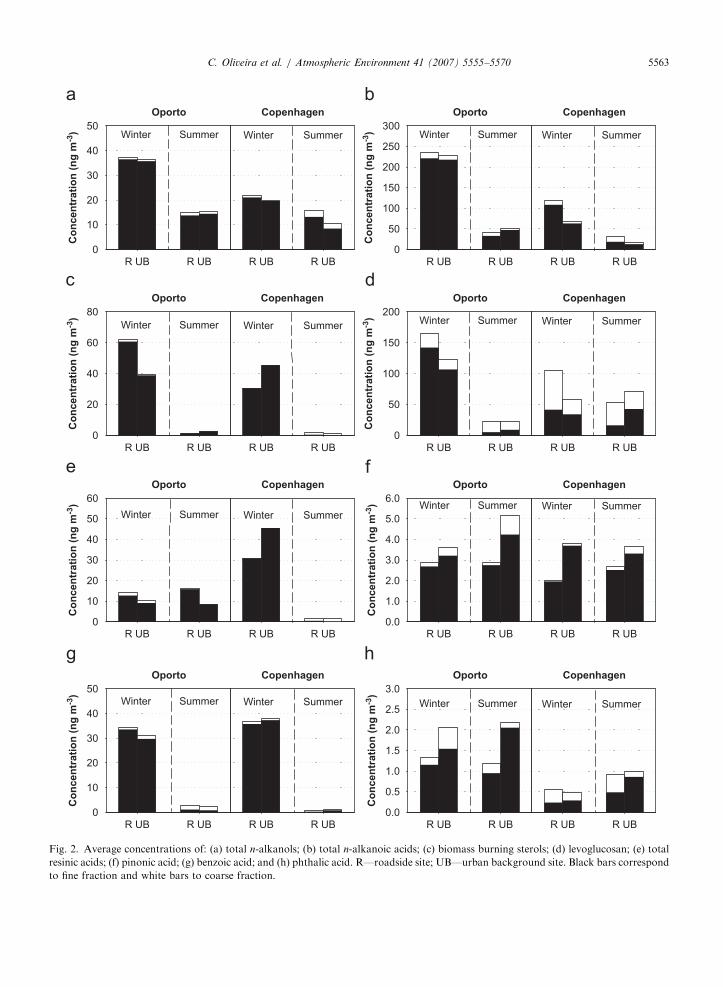
Fig. 3. Average concentrations of aliphatic dicarboxylic acids.
C. Oliveira et al. / Atmospheric Environment 41 (2007) 5555–55705566
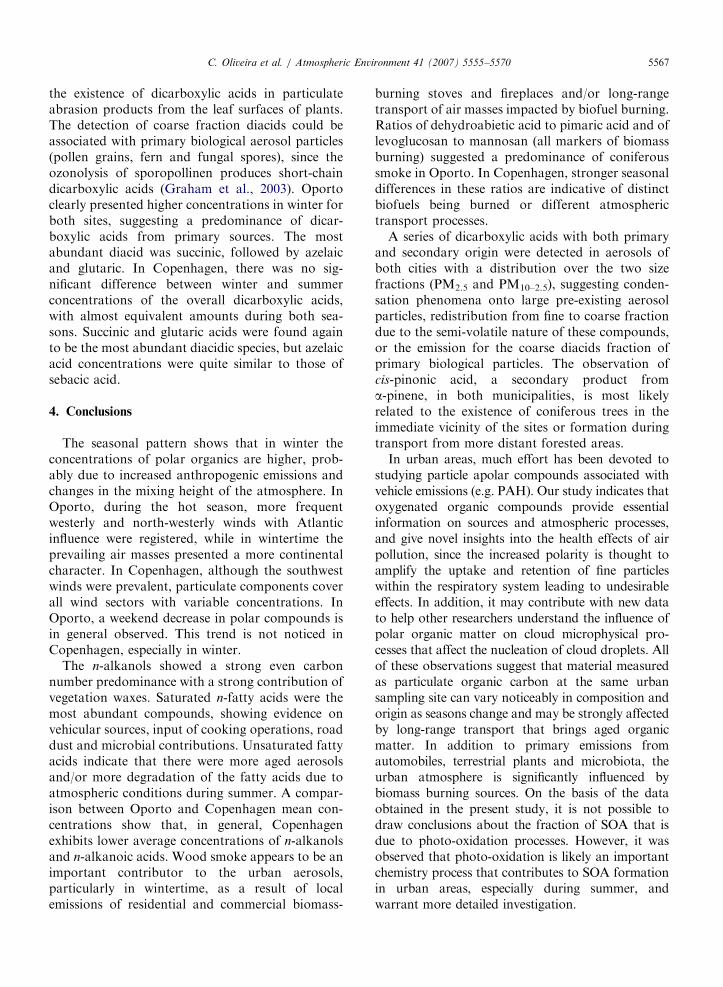
dicarboxylic acids as being emitted directly frombiogenic and anthropogenic sources such as fossilfuel burning, forest fires, meat-cooking, and cigar-ette smoke (Chattopadhyay and Ziemann, 2005,and references therein). Malonic acid (C3) is emittedfrom pine wood burning and succinic acid (C4) fromoak wood burning (Rogge et al., 1998). Azelaic acid(C9) is likely to derive from oxidation of alkenoicacids, since they are very reactive under atmosphericconditions as their electron-rich double bond iseasily attacked by atmospheric oxidants like ozoneto form oxo- and dicarboxylic acids. Thus, cis-9-octadecenoic (oleic, C18:1) acid, after emission toatmosphere through cooking operations is rapidlyoxidised to azelaic acid and other products in thepresence of atmospheric oxidants (Kawamura andGagosian, 1987; Kawamura and Sakaguchi, 1999).Therefore, an abundance of azelaic acid mayindicate aerosol submitted to significant atmo-spheric processing. Besides the primary sourcesalready mentioned, sebacic acid (C10) may consti-tute a secondary aerosol product resulting from theozonolysis of cycloalkenes (Ziemann, 2002). Fig. 3
presents average concentrations of aliphatic dicar-boxylic acids detected in the aerosol samples fromOporto and Copenhagen. In general, both citiesexhibited the highest concentrations in fine fraction,except for succinic (C4) and glutaric (C5) that in theCopenhagen roadside site were found mostly in thecoarse fraction and also in significant amounts inlarge-size particles of the Oporto and Copenhagenurban background sites. It is quite likely that acombination of both direct emissions and in situsecondary formation was responsible for the genericenrichment of these compounds in fine particles.The abundance of succinic and glutaric acids in thecoarse fraction may be associated with condensa-tion phenomena onto large pre-existing aerosolparticles, or redistribution from fine to coarsefraction due to the semi-volatile behaviour of theseacids (Limbeck et al., 2001). Additionally, it hasbeen defended that the presence of some acids in thecoarse fraction may be related with vegetationdetritus as they are present in the guttation fluids,fruits and tissues of plants (Graham et al., 2003).However, Rogge et al. (1993b) have not reported
ARTICLE IN PRESSC. Oliveira et al. / Atmospheric Environment 41 (2007) 5555–5570 5567
the existence of dicarboxylic acids in particulateabrasion products from the leaf surfaces of plants.The detection of coarse fraction diacids could beassociated with primary biological aerosol particles(pollen grains, fern and fungal spores), since theozonolysis of sporopollinen produces short-chaindicarboxylic acids (Graham et al., 2003). Oportoclearly presented higher concentrations in winter forboth sites, suggesting a predominance of dicar-boxylic acids from primary sources. The mostabundant diacid was succinic, followed by azelaicand glutaric. In Copenhagen, there was no sig-nificant difference between winter and summerconcentrations of the overall dicarboxylic acids,with almost equivalent amounts during both sea-sons. Succinic and glutaric acids were found againto be the most abundant diacidic species, but azelaicacid concentrations were quite similar to those ofsebacic acid.
4. Conclusions
The seasonal pattern shows that in winter theconcentrations of polar organics are higher, prob-ably due to increased anthropogenic emissions andchanges in the mixing height of the atmosphere. InOporto, during the hot season, more frequentwesterly and north-westerly winds with Atlanticinfluence were registered, while in wintertime theprevailing air masses presented a more continentalcharacter. In Copenhagen, although the southwestwinds were prevalent, particulate components coverall wind sectors with variable concentrations. InOporto, a weekend decrease in polar compounds isin general observed. This trend is not noticed inCopenhagen, especially in winter.
The n-alkanols showed a strong even carbonnumber predominance with a strong contribution ofvegetation waxes. Saturated n-fatty acids were themost abundant compounds, showing evidence onvehicular sources, input of cooking operations, roaddust and microbial contributions. Unsaturated fattyacids indicate that there were more aged aerosolsand/or more degradation of the fatty acids due toatmospheric conditions during summer. A compar-ison between Oporto and Copenhagen mean con-centrations show that, in general, Copenhagenexhibits lower average concentrations of n-alkanolsand n-alkanoic acids. Wood smoke appears to be animportant contributor to the urban aerosols,particularly in wintertime, as a result of localemissions of residential and commercial biomass-
burning stoves and fireplaces and/or long-rangetransport of air masses impacted by biofuel burning.Ratios of dehydroabietic acid to pimaric acid and oflevoglucosan to mannosan (all markers of biomassburning) suggested a predominance of coniferoussmoke in Oporto. In Copenhagen, stronger seasonaldifferences in these ratios are indicative of distinctbiofuels being burned or different atmospherictransport processes.
A series of dicarboxylic acids with both primaryand secondary origin were detected in aerosols ofboth cities with a distribution over the two sizefractions (PM2.5 and PM10–2.5), suggesting conden-sation phenomena onto large pre-existing aerosolparticles, redistribution from fine to coarse fractiondue to the semi-volatile nature of these compounds,or the emission for the coarse diacids fraction ofprimary biological particles. The observation ofcis-pinonic acid, a secondary product froma-pinene, in both municipalities, is most likelyrelated to the existence of coniferous trees in theimmediate vicinity of the sites or formation duringtransport from more distant forested areas.
In urban areas, much effort has been devoted tostudying particle apolar compounds associated withvehicle emissions (e.g. PAH). Our study indicates thatoxygenated organic compounds provide essentialinformation on sources and atmospheric processes,and give novel insights into the health effects of airpollution, since the increased polarity is thought toamplify the uptake and retention of fine particleswithin the respiratory system leading to undesirableeffects. In addition, it may contribute with new datato help other researchers understand the influence ofpolar organic matter on cloud microphysical pro-cesses that affect the nucleation of cloud droplets. Allof these observations suggest that material measuredas particulate organic carbon at the same urbansampling site can vary noticeably in composition andorigin as seasons change and may be strongly affectedby long-range transport that brings aged organicmatter. In addition to primary emissions fromautomobiles, terrestrial plants and microbiota, theurban atmosphere is significantly influenced bybiomass burning sources. On the basis of the dataobtained in the present study, it is not possible todraw conclusions about the fraction of SOA that isdue to photo-oxidation processes. However, it wasobserved that photo-oxidation is likely an importantchemistry process that contributes to SOA formationin urban areas, especially during summer, andwarrant more detailed investigation.

ARTICLE IN PRESSC. Oliveira et al. / Atmospheric Environment 41 (2007) 5555–55705568
Acknowledgements
This research work was financially supported bythe European Commission through the projectSAPPHIRE (EVK4-CT-2002-00089). Cesar Oli-veira acknowledges the post-doctoral grant by theFundac- ao para a Ciencia e a Tecnologia. Theauthors thank the city of Oporto Traffic Division,the Comissao de Coordenac- ao e Desenvolvimento
Regional do Norte (CCDR-N) for providing theroadside station air quality data and the Centro
Educativo de Santo Antonio—Instituto de Reinserc- ao
Social for allowing the use of their facilities.
References
Abas, M.R., Oros, D.R., Simoneit, B.R.T., 2004. Biomass burning
as the main source of organic aerosol particulate matter in
Malaysia during haze episodes. Chemosphere 55, 1089–1095.
Alves, C., Pio, C., 2005. Secondary organic compounds in
atmospheric aerosols: speciation and formation mechanisms.
Journal of the Brazilian Chemical Society 16, 1017–1029.
Alves, C., Pio, C., Duarte, A., 2001. Composition of extractable
organic matter of air particles from rural and urban
Portuguese areas. Atmospheric Environment 35, 5485–5496.
Alves, C., Carvalho, A., Pio, C., 2002. Mass balance of organic
carbon fractions in atmospheric aerosols. Journal of Geo-
physical Research 107 (D21), 8345–8353.
Alves, C., Oliveira, T., Pio, C., Silvestre, A., Fialho, P., Barata,
G., Legrand, M., 2007. Characterisation of carbonaceous
aerosols from the Azorean island of Terceira. Atmospheric
Environment 41, 1359–1373.
Cancio, J.A.L., Castellano, A.V., Santana, M.S.S., Rodrıguez,
J.F.S., 2004. Size distributions of PAHs in ambient air
particles of two areas of Las Palmas de Gran Canaria. Water,
Air, and Soil Pollution 154, 127–138.
Chattopadhyay, S., Ziemann, P.J., 2005. Vapor pressures of
substituted and unsubstituted monocarboxylic and dicar-
boxylic acids measured using an improved thermal desorption
particle beam mass spectrometry method. Aerosol Science
and Technology 39, 1085–1100.
Cheng, Y., Li, S.M., Leithead, A., Brickel, P.C., Leaitch, R.,
2004. Characterizations of cis-pinonic acid and n-fatty acids
on fine aerosols in the Lower Fraser Valley during Pacific
2001 Air Quality Study. Atmospheric Environment 38,
5789–5800.
Edney, E.O., Kleindienst, T.E., Conver, T.S., McIver, D.D.,
Corse, E.W., Weathers, W.S., 2003. Polar organic oxygenates
in PM2.5 at a southeastern site in the United States.
Atmospheric Environment 37, 3947–3965.
Espen, K.Y., Christian, D., Havard, S.L., Ole-Anders, B., 2005.
Quantification of monosaccharide anhydrides by liquid
chromatography combined with mass spectrometry: applica-
tion to aerosol samples from an urban and a suburban site
influenced by small-scale wood burning. Journal of the Air
and Waste Management Association 55, 1169–1177.
Falkovich, A.L., Schkolnik, G., Ganor, E., Rudich, Y., 2004.
Adsorption of organic compounds pertinent to urban
environments onto mineral dust particles. Journal of Geo-
physical Research 109, D02208.
Fang, M., Zheng, M., Wang, F., To, K.L., Jaafar, A.B., Tong,
S.L., 1999. The solvent-extractable organic compounds in the
Indonesia biomass burning aerosols—characterization stu-
dies. Atmospheric Environment 33, 783–795.
Feng, J., Chan, C., Fang, M., Hu, M., He, L., Tang, X., 2006a.
Characteristics of organic matter in PM2.5 in Shanghai.
Chemosphere 64, 1393–1400.
Feng, J., Hu, M., Chan, C.K., Lau, P.S., Fang, M., He, L., Tang,
X., 2006b. A comparative study of the organic matter in
PM2.5 from three Chinese megacities in three different
climatic zones. Atmospheric Environment 40, 3983–3994.
Fine, P., Chakrabarti, B., Krudysz, M., Schauer, J.J., Sioutas, C.,
2004a. Diurnal variations of individual organic compound
constituents of ultrafine and accumulation mode particulate
matter in the Los Angeles Basin. Environmental Science and
Technology 38, 1296–1304.
Fine, P.M., Cass, G.R., Simoneit, B.R.T., 2004b. Chemical
characterisation of fine particle emissions from the wood
stove combustion of prevalent United States tree species.
Environmental Engineering Science 21, 705–721.
Glasius, M., Ketzel, M., Wahlin, P., Jensen, B., Mønster, J.,
Berkowicz, R., Palmgren, F., 2006. Impact of wood combus-
tion levels in a residential area in Denmark. Atmospheric
Environment 40, 7115–7124.
Gogou, A., Apostolaki, M., Stephanou, E., 1998. Determination
of organic molecular markers in marine aerosols and
sediments: one-step flash chromatography compound class
fractionation and capillary gas chromatographic analysis.
Journal of Chromatography A 799, 215–231.
Graham, B., Guyon, P., Taylor, P.E., Artaxo, P., Maenhault, W.,
Glovsky, M.M., Flagan, C., Andreae, O., 2003. Organic
compounds present in the natural Amazonian aerosol:
characterization by gas chromatography–mass spectrometry.
Journal of Geophysical Research 108, 4766.
Guo, Z.G., Sheng, L.F., Feng, J.L., Fang, M., 2003. Seasonal
variation of solvent extractable organic compounds in the
aerosols in Qingdao, China. Atmospheric Environment 37,
1825–1834.
Heidam, N.Z., 2000. The background air quality in Denmark
1978–1997. NERI Technical Report No. 341, National
Environment Research Institute, Denmark, 192p.
Ho, K.F., Lee, S.C., Cao, J.J., Kawamura, K., Watanabe, T.,
Cheng, Y., Chow, J.C., 2006. Dicarboxylic acids, ketocar-
boxylic acids and dicarbonyls in the urban roadside area of
Hong Kong. Atmospheric Environment 40, 3030–3040.
Hobbs, P.V., 2002. Clean air slots amid atmospheric pollution.
Nature 415, 861.
Houthuijsa, D., Breugelmans, O., Hoek, G., Vaskovic, E.,
Mihalikova, E., Pastuszka, J.S., Jirik, V., Sachelarescu, S.,
Lolova, D., Meliefste, K., Uzunova, Marinescu, C., Volf, J.,
Leeuw, F., Wiel, H., Fletcher, T., Lebret, E., Brunekreef, B.,
2001. PM10 and PM2.5 concentrations in Central and Eastern
Europe: results from the Cesar study. Atmospheric Environ-
ment 35, 2757–2771.
Huang, X.X., He, L., Hu, M., Zhang, Y., 2006. Annual variation
of particulate organic compounds in PM2.5 in the urban
atmosphere of Beijing. Atmospheric Environment 40,
2449–2458.
Illerup, J.B., Nielsen, M., 2004. Improved PM emissions
inventory for residential wood combustion. In: Proceedings

ARTICLE IN PRESSC. Oliveira et al. / Atmospheric Environment 41 (2007) 5555–5570 5569
of the PM Emission Inventories Scientific Workshop, Lago
Maggiori, Italy, 18 October 2004, EUR 21302 EN, JRC, 5p.
Kavouras, I.G., Stephanou, E.G., 2002. Particle size distribution
of organic primary and secondary aerosol constituents in
urban, background marine, and forest atmosphere. Journal of
Geophysical Research A 107, 4069–4072.
Kawamura, K., Gagosian, R.B., 1987. Implications of o-oxocarboxylic acids in the remote atmosphere for photo-
oxidation of unsaturated fatty acids. Nature 325, 330–332.
Kawamura, K., Sakaguchi, F., 1999. Molecular distribution of
water soluble dicarboxylic acids in marine aerosols over the
Pacific Ocean including tropics. Journal of Geophysical
Research 104, 3501–3509.
Kubatova, A., Vermeylen, R., Claeys, M., Cafmeyer, J.,
Maenhaut, W., Roberts, G., Artaxo, P., 2000. Carbonaceous
aerosol characterisation in the Amazon Basin, Brazil: novel
dicarboxylic acids and related compounds. Atmospheric
Environment 34, 5037–5051.
Li, M., McDow, S., Tollerud, D., Mazurek, M., 2006. Seasonal
abundance of organic molecular markers in urban particulate
matter from Philadelphia, PA. Atmospheric Environment 40,
2260–2273.
Limbeck, A., Puxbaum, H., Otter, L., Scholes, M.C., 2001.
Semivolatile behaviour of dicarboxylic acids and other polar
organic species at a rural background site. Atmospheric
Environment 35, 1853–1862.
Lough, G.C., Schauer, J.J., Lawson, D.R., 2006. Day-of-week
trends in carbonaceous aerosol composition in the urban
atmosphere. Atmospheric Environment 40, 4137–4149.
Matthias-Maser, J., Jaenicke, R., 2000. The size distribution of
primary biological aerosol particles in the multiphase atmo-
sphere. Aerobiologia 16, 207–210.
Mayol-Bracero, O.L., Guyon, P., Graham, B., Roberts, G.,
Andreae, M.O., Decesari, S., Facchini, M.C., Fuzzi, S.,
Artaxo, P., 2002. Water-soluble organic compounds in
biomass burning aerosols over Amazonia. 2. Apportio-
nment of the chemical composition and importance of the
polyacidic fraction. Journal of Geophysical Research 107
(D20), 8091.
Nolte, C.G., Schauer, J.J., Cass, G.R., Simoneit, B.R.T., 2002.
Trimethylsilyl derivatives of organic compounds in source
samples and in atmospheric fine particulate matter. Environ-
mental Science Technology 36, 4273–4281.
Oros, D.R., Simoneit, B.R.T., 2001. Identification and emission
factors of molecular tracers in organic aerosols from biomass
burning. Part 1. Temperate climate conifers. Applied Geo-
chemistry 16, 1513–1544.
Otto, A., Gondokusumo, R., Simpson, M.J., 2006. Characteriza-
tion and quantification of biomarkers from biomass burning
at a recent wildfire site in Northern Alberta, Canada. Applied
Geochemistry 21, 166–183.
Park, S.S., Bae, M.S., Schauer, J.J., Kim, Y.J., Cho, S.Y., Kim,
S.J., 2006. Molecular composition of PM2.5 organic aerosol
measured at an urban site of Korea during the ACE-Asia
campaign. Atmospheric Environment 40, 4182–4198.
Penner, J.E., Chuang, C.C., Grant, K., 1998. Climate forcing by
carbonaceous and sulphate aerosols. Climate Dynamics 14,
839–851.
Pereira, M.C., Alvim-Ferraz, M.C.N., Santos, R.C., 2005.
Relevant aspects of air quality in Oporto (Portugal): PM10
and O3. Environmental Monitoring and Assessment 101,
203–211.
Pio, C., Alves, C., Duarte, A., 2001. Identification, abundance
and origin of atmospheric particulate matter in a Portuguese
rural area. Atmospheric Environment 35, 1365–1375.
Pio, C., Alves, C., Carvalho, A., Santos, C., 2006. Size
distribution characteristics of organic species in atmospheric
particulate matter from Finnish and German from rural sites
with variable anthropogenic influence. Environmental En-
gineering Science 23, 929–937.
Pope, C.A., Burnett, T.R., Thurston, G.D., Thun, M.J., Calle,
E.E., Krewski, D., Godleski, J.J., 2004. Cardiovascular
mortality and long-term exposure to particulate air pollu-
tion—epidemiological evidence of general pathophysiological
pathways of disease. Circulation 109, 71–77.
Poschl, U., 2005. Atmospheric aerosols: composition, transfor-
mation, climate and health effects. Angewandte Chemie—
International Edition 44, 7520–7540.
Querol, X., Alastuey, A., Ruiz, C.R., Artinano, B., Hansson,
H.C., Harrison, R.M., Buringh, E., ten Brink, H.M., Lutz,
M., Bruckmann, P., Straehl, P., Schneider, J., 2004. Specia-
tion and origin of PM10 and PM2.5 in selected European cities.
Atmospheric Environment 38, 6547–6555.
Rogge, W., Mazurek, M., Hildemann, L., Cass, G., Simoneit, B.,
1993a. Quantification of urban organic aerosols at a
molecular level: identification, abundance and seasonal
variation. Atmospheric Environment 27A, 1309–1330.
Rogge, W.F., Hildemann, L.M., Mazurek, M.A., Cass, G.R.,
Simoneit, B.R.T., 1991. Sources of fine organic aerosol. 1.
Charbroilers and meat cooking operations. Environmental
Science and Technology 25, 1112–1125.
Rogge, W.F., Hildemann, L.M., Mazurek, M.A., Cass, G.R.,
Simoneit, B.R.T., 1993b. Sources of fine organic aerosol. 4.
Particulate abrasion products from leaf surfaces of urban
plants. Environmental Science and Technology 27, 2700–2711.
Rogge, W.F., Hildemann, L.M., Mazurek, M.A., Cass, G.R.,
Simoneit, B.R.T., 1993c. Sources of fine organic aerosol. 2.
Noncatalyst and catalyst-equipped automobiles and heavy-
duty diesel trucks. Environmental Science and Technology 27,
636–651.
Rogge, W.F., Hildemann, L.M., Mazurek, M.A., Gass, G.R.,
Simoneit, B.R.T., 1997. Sources of fine organic aerosol. 8.
Boilers burning No. 2 distillate fuel oil. Environmental
Science and Technology 31, 2731–2737.
Rogge, W.F., Hildemann, L.M., Mazurek, M.A., Gass, G.R.,
Simoneit, B.R.T., 1998. Sources of fine organic aerosol. 9.
Pine, Oak, and synthetic log combustion in residential
fireplaces. Environmental Science and Technology 32, 13–22.
Rogge, W.F., Hildemann, L.-M., Mazurek, M.A., Cass, G.R.,
Simoneit, B.R.T., 1994. Sources of fine organic aerosol. 6.
Cigarette smoke in the urban atmosphere. Environmental
Science and Technology 28, 1375–1388.
Rogge, W.F., Medeiros, P.M., Simoneit, B.R.T., 2006. Organic
marker compounds for surface soil and fugitive dust from
open lot dairies and cattle feedlots. Atmospheric Environment
40, 27–49.
Schauer, J.J., Cass, G.R., 2000. Source apportionment of winter-
time gas-phase and particulate-phase air pollutants using
organic compounds as tracers. Environmental Science and
Technology 34, 1821–1832.
SchefuX, E., Rateyer, V., Stuut, J.-B.W., Jansen, J.H.F., Damste,
J.S.S., 2003. Carbon isotope analyses of n-alkanes in dust
from the lower atmosphere over the central eastern Atlantic.
Geochimica et Cosmochimica Acta 67, 1757–1767.

ARTICLE IN PRESSC. Oliveira et al. / Atmospheric Environment 41 (2007) 5555–55705570
Shimmo, M., Saarnio, K., Aalto, P., Hartonen, K., Hyotylainen,
T., Kulmala, M., Riekkola, M.-L., 2004. Particle size
distribution and gas-particle partition of polycyclic aromatic
hydrocarbons in Helsinki urban area. Journal of Atmospheric
Chemistry 47, 223–241.
Simoneit, B.R.T., 1989. Organic matter of the troposphere–V:
application of molecular marker analysis to biogenic emis-
sions into the troposphere for source reconciliations. Journal
of Atmospheric Chemistry 8, 251–275.
Simoneit, B.R.T., Sheng, G., Chen, X., Fu, J., Zhang, J., Xu, Y.,
1991. Molecular marker study of extractable organic matter
in aerosols from urban areas of China. Atmospheric
Environment 25A, 2111–2129.
Simpson, C.D., Paulsen, M., Dills, R.L., Liu, L.J., Kalman,
D.A., 2005. Determination of methoxyphenols in ambient
atmospheric particulate matter: tracers for wood combustion.
Environmental Science and Technology 39, 631–637.
Suh, I., Zhang, R., Molina, L.T., Molina, M.J., 2003. Oxidation
mechanism of aromatic peroxy and bicyclic radicals from
OH-toluene reactions. Journal of the American Chemical
Society 125, 12655–12665.
Wang, G., Kawamura, K., Lee, S., Ho, K., Cao, J., 2006.
Molecular, seasonal, and spatial distributions of organic
aerosols from fourteen Chinese cities. Environmental Science
and Technology 40, 4619–4625.
Ward, T.J., Hamilton, R.F., Dixon, R.W., Paulsen, M., Simpson,
C.D., 2006. Characterisation and evaluation of smoke tracers
in PM: results from the 2003 Montana wildfire season.
Atmospheric Environment 40, 7005–7017.
Yu, S., 2000. Role of organic acids (formic, acetic, pyruvic and
oxalic) in the formation of cloud condensation nuclei (CCN):
a review. Atmospheric Research 53, 185–217.
Yue, Z., Fraser, M.P., 2004. Polar organic compounds measured
in fine particulate matter during TexAQS 2000. Atmospheric
Environment 38, 3253–3261.
Zheng, M., Fang, M., Wang, F., To, K.L., 2000. Characterization
of the solvent extractable organic compounds in PM2.5 aerosols
in Hong Kong. Atmospheric Environment 34, 2691–2702.
Ziemann, P.J., 2002. Evidence for low-volatility diacyl peroxides
as a nucleating agent and major component of aerosol formed
from reactions of O3 with cyclohexene and homologous
compounds. Journal of Physical Chemistry A 106, 4390–4402.
Related Documents