\\ SEASONAL DIET AND HABITAT PREFERENCES OF CATTLE (Bos indicus ), KONGONI (Alcephalus buselaphus) AND WILDEBEEST (Connochaetes taurinus) GRAZING ON A COMMON RANGE. A THESIS SUBMITTED IN PARTIAL FULFILLMENT OF THE REQUIREMENTS FOR THE DEGREE OF MASTER OF SCIENCE IN RANGE MANAGEMENT IN THE FACULTY OF AGRICULTURE OF THE UNIVERSITY OF NAIROBI. pv W. EGO 1996.

Welcome message from author
This document is posted to help you gain knowledge. Please leave a comment to let me know what you think about it! Share it to your friends and learn new things together.
Transcript
\\SEASONAL DIET AND HABITAT PREFERENCES OF CATTLE (Bos indicus), KONGONI (Alcephalus buselaphus)
AND WILDEBEEST (Connochaetes taurinus) GRAZINGON A COMMON RANGE.
A THESIS SUBMITTED IN PARTIAL
FULFILLMENT OF THE REQUIREMENTS
FOR THE DEGREE OF
MASTER OF SCIENCE
IN
RANGE MANAGEMENT
IN THE FACULTY OF AGRICULTURE
OF THE
UNIVERSITY OF NAIROBI.
pv
W. EGO
1996.
DECLARATION
THIS IS MY ORIGINAL WORK AND HAS NOT BEEN PRESENTED FOR A
DEGREE IN ANY OTHER UNIVERSITY.
SIGNATURE
THIS THESIS HAS BEEN SUBMITTED FOR EXAMINATION WITH MY
APPROVAL AS UNIVERSITY SUPERVISOR.
SIGNATURE __MR. D. M. MBUVI
DATE f b — ^ ._______
THIS THESIS HAS BEEN SUBMITTED FOR EXAMINATION WITH MY
APPROVAL AS UNIVERSITY SUPERVISOR.
SIGNATURE ____________________________________PROF. C .N . KARUE
/(o / V- I ^ (qDATE

DEDICATION
To my parents who thought I could do better than to look
after cattle, brothers, sisters and grandmother and all
who have encouraged me and contributed to my academic
achievements since 1970 and to my grandfather, who dearly
loved me, but could not live long to see this thesis.
Special dedication to my wife, Damaris, my children
Jerotich and Kokwo and to all those who cherish the beauty of the African bush.
ACKNOWLEDGEMENTS
I wish to thank the European Economic Commission
(EEC) for providing the scholarship, which enabled me to
pursue this study. I am very grateful to the Director
Kenya Agricultural Research Institute (KARI) for granting
me study leave during the course of the study. I am also
very grateful to the owner of the Game Ranching Ltd., Dr.
D. Hopcraft, and Dr. M. Sommeralte, the Director of
Research for allowing me easy access to the Ranch and to
use their camping facilities. The Ranch manager Mr. P.
Tilley and N. Nyamu were co-operative and friendly.
I express my sincere gratitude to Mr. D.M. Mbuvi and
Prof. C.N. Karue, under whose supervision this study was
carried out. Their patience, untiring guidance, helpful
suggestions and constructive criticisms, despite their
busy schedules, are highly appreciated. Special thanks
to the Director, National Range Research Centre, Mr.
P.F.K. Kibet, for allowing me to use laboratory
facilities and other resources. Thanks to Dr. H.K.
Cheruiyot of KARI for fruitful discussions,
encouragement, comments and friendship. I am greatly
indebted to the late Dr. T. Tandingar and Mr. F. Nang'ayo
for their assistance in data analysis.
I thank Mr. J.M. Kinyua and S.M. Mwangi for their
great assistance both in the field and laboratory work.
Their sense of humour made the ticks and thorns bearable.
IV
ABSTRACT
The feeding habits of cattle (Bos indicus), kongoni
(Alcephalus buselaphus) and wildebeest (Connochaetes
taurinus) whether as single species or in combination
with other animal species on the same range have been
studied by several researchers in different environments.
Generally these studies conclude that animals do select
their diets from an of array plants depending on what is
available to them and the prevailing conditions.
This thesis is the result of a study conducted at
Game Ranching Ltd. situated at the Athi Kapiti Plains,
Kenya, between January and August 1993, to determine the
diet and habitat preferences of cattle, kongoni and
wildebeest. The following six vegetation types
(habitats) occur in the ranch; Themeda grassland,
Balanites glabra tree grassland, Balanites - Acacia tree
grassland, Acacia drepanolobium dwarf tree grassland,
Acacia woodland and Acacia xanthophloea bushland.
The diet preference by the three herbivores was
determined by using microhistological analysis technique.
The three dominant grasses in the ranch Themeda triandra,
Digitaria macroblephara and Penisetum mezianum also
formed the major diets of the animals. The browse
component of the diets increased during the dry season by
about 100% irrespective of the animal species, with
cattle always having twice as much browse as the wild
v
herbivores. The animals, however, selected similar diets
in terms of plant species during both seasons. Dietary
overlaps were always above 75%, but higher during the dry
season, than during the wet season. The overlaps were
lower between cattle and wild herbivores than between the
wild herbivores.
During the wet season Balanites glabra tree
grassland was the most preferred while all other habitats
had negative preference indices, with Acacia woodland and
Acacia xanthophloea bushland habitats being avoided
completely by kongoni and wildebeest. During the dry
season the two herbivores shifted their habitat
preferences to Balanites - Acacia tree grassland habitat,
with Acacia xanthophloea being avoided completely.
Balanites - Acacia grassland seem to be the best
available habitat in the ranch as it is the habitat upon
which kongoni and wildebeest depend for their survival
during the dry season. Balanites glabra grassland,
however is the most preferred habitat but is only
available during the wet season.
vi
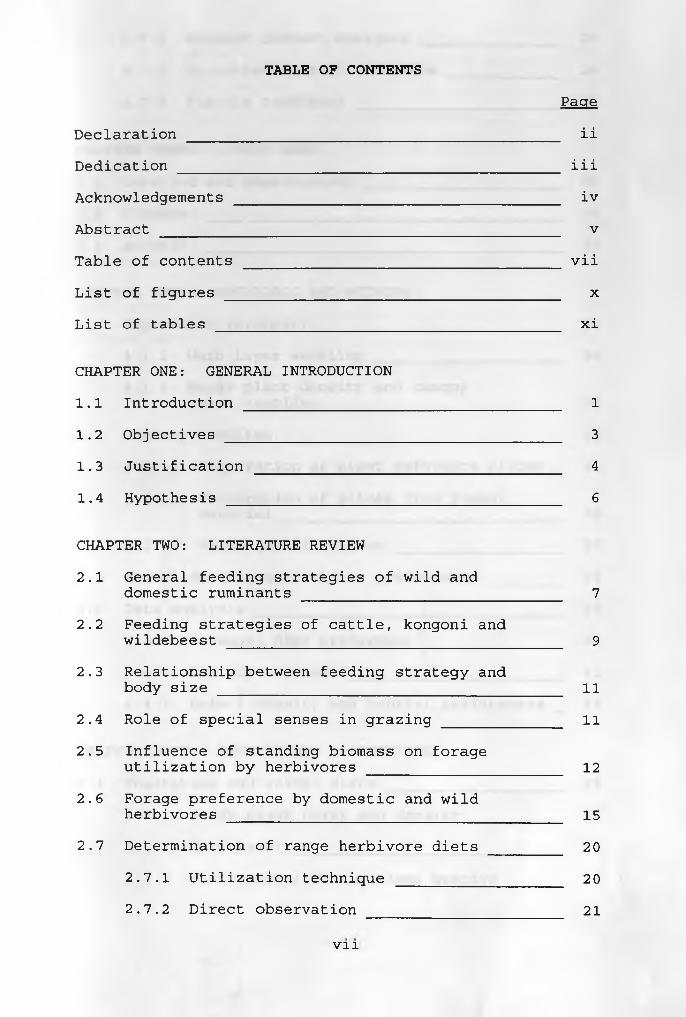
TABLE OF CONTENTSPage
Declaration __________________________________________ ii
Dedication ___________________________________________ iii
Acknowledgements _____________________________________ iv
Abstract _____________________________________________ v
Table of contents ____________________________________ vii
List of figures ______________________________________ xList of tables _______________________________________ xi
CHAPTER ONE: GENERAL INTRODUCTION
1.1 Introduction ____________________________________ 1
1.2 Objectives ______________________________________ 3
1.3 Justification ___________________________________ 4
1.4 Hypothesis ______________________________________ 6
CHAPTER TWO: LITERATURE REVIEW
2.1 General feeding strategies of wild anddomestic ruminants _____________________________ 7
2.2 Feeding strategies of cattle, kongoni andwildebeest ______________________________________ 9
2.3 Relationship between feeding strategy andbody size _______________________________________ 11
2.4 Role of special senses in grazing _____________ 11
2.5 Influence of standing biomass on forageutilization by herbivores ______________________ 12
2.6 Forage preference by domestic and wildherbivores ______________________________________ 15
2.7 Determination of range herbivore diets ________ 20
2.7.1 Utilization technique ___________________ 20
2.7.2 Direct observation 21
vii
222.7.3 Stomach content analysis
2.7.4 Microhistological technique ____________ 24
2.7.5 Fistula technique _______________________ 27
CHAPTER THREE: STUDY AREA
3.1 Location and physiography 28
3.2 Climate 30
3.3 Animals 33
CHAPTER FOUR: MATERIALS AND METHODS
4.1 Vegetation inventory 34
4.1.1 Herb layer sampling 34
4.1.2 Woody plant density and canopy cover sampling 34
4.2 Dietary sampling 35
4.2.1. Preparation of plant reference slides 35
4.2.2 Preparation of slides from faecal material 36
4.2.3 Slide quantification 374.3 Animal density and habitat preferences 384.4 Data analysis 39
4.4.1 Seasonal diet preference 394.4.2 Dietary overlaps 414.4.3 Animal density and habitat preferences 43
CHAPTER FIVE: RESULTS AND DISCUSSIONS
5.1 Vegetation and animal diets 455.1.1 Woody plant cover and density 455.1.2 Herb layer 525.1.3 Diet composition by plant species 63
viii
715.1.4 Seasonal dietary overlap between
animals _________________________
5.1.5 Discussion ______________________________ 75
5.2 Animal density and habitat preferences ________ 81
5.2.1 Number and distribution of animals _____ 81
5.2.2 Animal density and habitat preference __ 82
5.2.3 Discussion ______________________________ 88
CHAPTER SIX: CONCLUSIONS AND RECOMMENDATIONS _______ 91
REFERENCES ___________________________________________ 93
APPENDICES 101
ix
LIST OF FIGURESFigure Page
1. Geographical location of Game Ranching Ltd. andits vegetation types ___________________________ 29
2. Monthly rainfall during the study periodcompared to the mean monthly rainfall in the study area ______________________________________ 3 2
3. Map showing the areas sampled in eachvegetation type for animals ____________________ 40
4. Prominent grass and browse in animal dietsduring the wet and dry seasons _________________ 65
5. Percent animal diet overlaps during the wetand dry seasons _________________________________ 73
6. Seasonal changes in habitat preference for kongoni and wildebeest for the six habitat types ___________________________________ 86
x
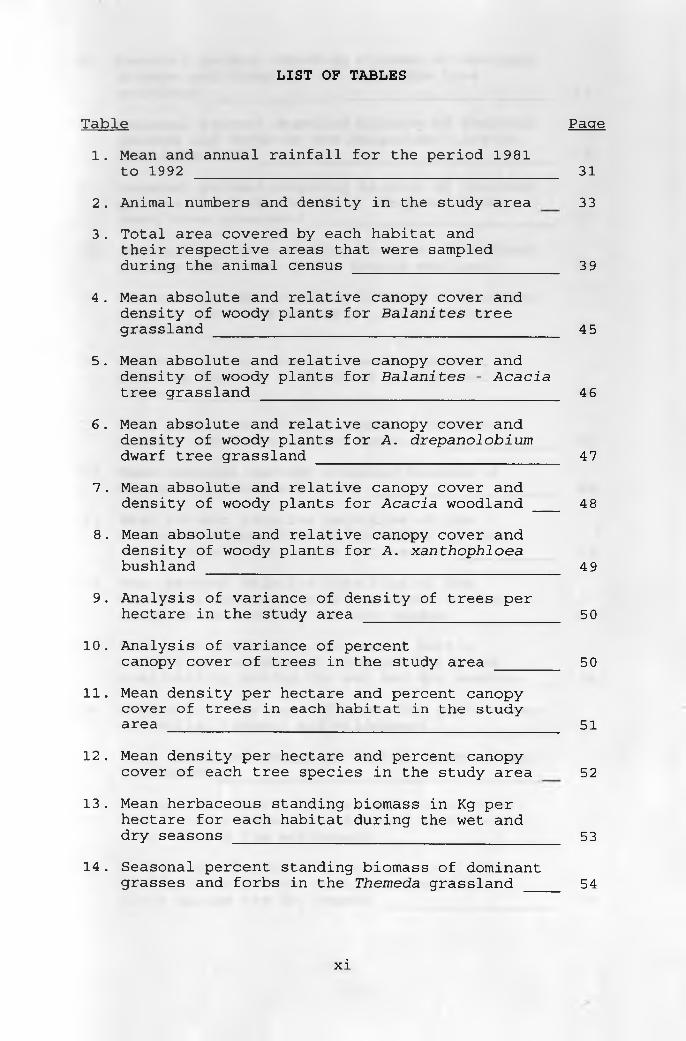
LIST OF TABLES
Table Pace
1. Mean and annual rainfall for the period 1981 to 1992 31
2 . Animal numbers and density in the study area 33
3 . Total area covered by each habitat and their respective areas that were sampled during the animal census 39
4 . Mean absolute and relative canopy cover and density of woody plants for Balanites tree grassland 45
5 . Mean absolute and relative canopy cover and density of woody plants for Balanites - Acacia tree grassland 46
6 . Mean absolute and relative canopy cover and density of woody plants for A. drepanolobium dwarf tree grassland 47
7 . Mean absolute and relative canopy cover and density of woody plants for Acacia woodland 48
8 . Mean absolute and relative canopy cover and density of woody plants for A. xanthophloea bushland 49
9 . Analysis of variance of density of trees per hectare in the study area 50
10 . Analysis of variance of percent canopy cover of trees in the study area 50
11. Mean density per hectare and percent canopy cover of trees in each habitat in the study area 51
12 . Mean density per hectare and percent canopy cover of each tree species in the study area 52
13 . Mean herbaceous standing biomass in Kg per hectare for each habitat during the wet and dry seasons 53
14 . Seasonal percent standing biomass of dominant grasses and forbs in the Themeda grassland 54
xi
55
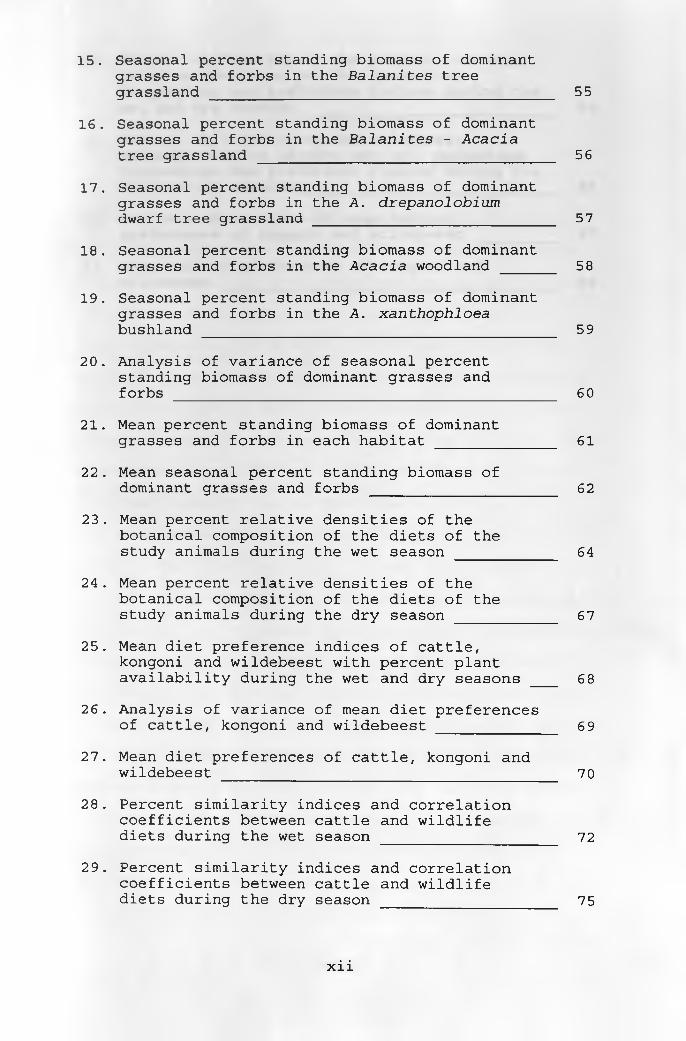
15. Seasonal percent standing biomass of dominantgrasses and forbs in the Balanites tree grassland _____________________________________
16. Seasonal percent standing biomass of dominantgrasses and forbs in the Balanites - Acacia tree grassland __________________________________ 56
17. Seasonal percent standing biomass of dominant grasses and forbs in the A. drepanolobium dwarf tree grassland ___________________________ 57
18. Seasonal percent standing biomass of dominantgrasses and forbs in the Acacia woodland ______ 58
19. Seasonal percent standing biomass of dominant grasses and forbs in the A. xanthophloea bushland 59
20. Analysis of variance of seasonal percent standing biomass of dominant grasses and forbs 60
21. Mean percent standing biomass of dominantgrasses and forbs in each habitat ______________ 61
22. Mean seasonal percent standing biomass ofdominant grasses and forbs _____________________ 62
23. Mean percent relative densities of thebotanical composition of the diets of thestudy animals during the wet season ___________ 64
24. Mean percent relative densities of thebotanical composition of the diets of thestudy animals during the dry season ___________ 6 7
25. Mean diet preference indices of cattle,kongoni and wildebeest with percent plant availability during the wet and dry seasons ___ 68
26. Analysis of variance of mean diet preferencesof cattle, kongoni and wildebeest _____________ 69
27. Mean diet preferences of cattle, kongoni andwildebeest_____________________70
28. Percent similarity indices and correlation coefficients between cattle and wildlife diets during the wet season ____________________ 72
29. Percent similarity indices and correlation coefficients between cattle and wildlife diets during the dry season ____________________ 75
xii
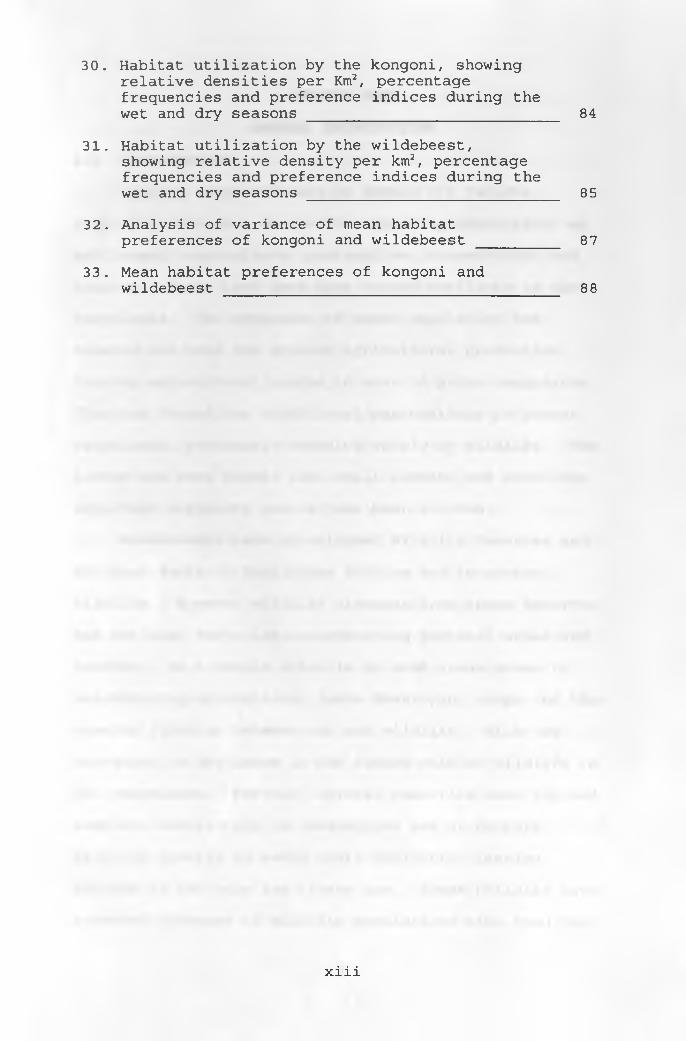
30. Habitat utilization by the kongoni, showing relative densities per Km2, percentage frequencies and preference indices during thewet and dry seasons ____________________________ 84
31. Habitat utilization by the wildebeest, showing relative density per km2, percentage frequencies and preference indices during thewet and dry seasons ____________________________ 85
32. Analysis of variance of mean habitatpreferences of kongoni and wildebeest _________ 87
33. Mean habitat preferences of kongoni andwildebeest 88
xiii
CHAPTER ONEGENERAL INTRODUCTION
1.1 IntroductionKenya's rangelands are in demand for various
competing land uses due to the expanding population, eg
settlement, agriculture, pastoralism, conservation and
tourism. These land uses have caused conflicts in the
rangelands. The expansion of human population has
created the need for greater agricultural production,
forcing agricultural people to move to prime rangelands.
This has forced the traditional pastoralists to poorer
rangelands, previously occupied solely by wildlife. The
latter has been forced into small pockets and sometimes
important migratory routes have been blocked.
Governments have established Wildlife Reserves and
National Parks to facilitate tourism and to protect
wildlife. However wildlife migrates from these Reserves
and National Parks into neighbouring pastoral areas and
ranches. As a result wildlife in some areas moves to
neighbouring agricultural lands destroying crops and thus
causing friction between man and wildlife. With the
foregoing, a key issue is the future role of wildlife in
the rangelands. Further, several countries have imposed
complete restriction on consumptive use of certain
wildlife species to avoid their extinction leaving
tourism as the only legitimate use. These policies have
promoted increase of wildlife populations with resultant
1
conflicts with those of livestock producers being in the
forefront. Wildlife destroy fences, compete for food
resources and are carriers of diseases to the detriment
of livestock producers. Compensation schemes have never
been adequate for such damages.
Natural forage is the main source of feed for both
wild and domestic herbivores in the arid and semi-arid
rangelands. Pratt and Gwynne (1977) stated that grass
will remain the cheapest source of livestock feed in
Kenya in the foreseeable future due to limited supply of
grain and the cost of manufactured feed. Ruminants
(bovids) are highly efficient compared to simple
stomached herbivores (equids) in the conversion of forage
to meat (Church 1975). Duncan et al. (1990), however
argues that equids compared to similarly sized grazing
bovids have higher rates of food intake, which more than
compensates for their lesser ability to digest plant
material and are capable of extracting more nutrients
from at libitum forage diets than bovids, especially from
very high and very low fibre diets. This implies that
given an equal amount of feed, bovids would efficiently
convert it to meat than equids but the equids can extract
more nutrients from an ad libitum diet than bovids.
However, maximum livestock production is dependent upon
proper management of the resources. The most fundamental
of these is stocking the range with the correct
kinds/class and numbers of animals (Heady 1975) .
Unlike stall-fed animals that receive their rations
2
in amounts and proportions dictated by the livestock
owners, free ranging animals choose their diets from the
complex variety of available forage plant species in the
plant communities they utilize. Man therefore exerts
only limited managerial control through such decisions as
stocking rates, herd composition and size, and location
of grazing areas. The diet that an animal will
ultimately select in a particular situation and location
is a function of many interacting plant and animal
related factors (Malechek and Provenza 1983). Certain
characteristics of individual plants which influence
their acceptance or rejection therefore play a major
role. Further unique morphological, physiological and
other characteristics of a particular plant species
interact to determine the animal's feeding strategy as
they exploit the available food resources. The aggregate
effect of all these is manifested in the feeding
behaviour termed "selectivity", that is the consumption
of some plant species or plant parts to the exclusion of
others (Heady 1975, Malechek and Provenza, 1983).
1.2 ObjectivesThe objectives of this study were;
a) to determine seasonal diet preferences and
dietary overlaps of cattle, kongoni and
wildebeest, grazing on the same range and
b) to determine the seasonal habitat preferences of
the cattle, kongoni and wildebeest.
3
1.3 JustificationEast African rangelands have highly seasonal growing
conditions and periodic fluctuation of large herbivore
populations. This results from periodic shortage and
replenishment of feed resource due to seasonality of
rainfall. Foraging is an important component of fitness
and many aspects of behaviour and morphology are shaped
by the need to gather food. Foraging efficiency in part
determines the inclusive fitness of an individual, and
though food acquisition is central to activities, it
competes for time with other activities such as mating,
territory defence and predator vigilance (Krebs 1978).
As natural selection favours individuals with highest
inclusive fitness, animals are under pressure to forage
efficiently. This notion of foraging efficiency has led
to studies that investigate diet preference, competition
and habitat preference. Problems arise from the nature
of herbivore diet and constraints it imposes on the
digestive process which include those of animal
physiology which dictate the diet selection, foraging
time limitations and nutritional constraints from food
(Belovsky and Jordan 1978, Demment et al. 1986 and Van
Soest 1982).
The degree of diet selection determines the
dispersion and availability of food items for a
herbivore. Highly selective herbivores have their diets
compost of buds and flowers, which are highly digestible
but making up only a tiny fraction of the plant biomass.
4
This type of food is highly dispersed, relatively rare
and only small amounts can be harvested (Geist 1974,
Githaiga 1991). By lowering its acceptance threshold, a
larger proportion of the plant community becomes
available as food for a grazer, bites are almost
continuous and search time is reduced (Jarman 1974). The
patterning of the nutrient content and its distribution
in the vegetation is therefore critical in feeding
strategy of a ruminant grazer depending on its
selectivity regime.
Field (1968) noted that in some parts of Uganda and
East Africa as a whole, overstocking of domestic animals
by pastoralists, leads to overgrazing and range
destruction. He concluded that in many such cases the
value of wildlife is neglected and it is the first to
suffer following degradation of its habitat. Thus the
management of domestic animals do affect the survival of
wildlife. It is therefore important that the influences
of interrelated multiple use of grazing strategies should
be considered in range management to successfully meet
the objectives of finding optimal use of the range, for
livestock or for wildlife or a combination of livestock
and wildlife.
Knowledge of feeding habits and habitat preference
of both wild and domestic animals is necessary in order
to solve problems arising from the issue of preservation
and food requirement of wild animals. Information on
dietary habits of both wild and domestic herbivores is
5
therefore an important tool to a range manager in
determining what competition exists among different range
animals and in balancing wildlife and livestock numbers
with available forage (Holechek et al. 1982a, Wangoi
1984). An indication of the plant species consumed
enables a manager to know what the key plant species are
and animal performance (Holechek et al. 1981). Further
information on the feeding habits of animals utilizing a
common range is important in offering a basis for
assessing the usefulness of the range to the animals
dependent on it. Consequently data and information on
food habits and habitat preferences are important in
making management decisions, like the manipulation of the
vegetation to achieve the desired objective(s).
1.4 HypothesisThe following hypothesis were formulated in trying
to test this problem
HOi - Cattle, wildebeest and kongoni have similar
diet preferences,
H02 - Cattle, kongoni and wildebeest prefer similar
habitats irrespective of seasons.
6
CHAPTER TWOLITERATURE REVIEW
2.1 General feeding strategies of wild and domesticruminantsThe way in which ruminant species select their diet
is termed the feeding strategy (Hanley 1982). The
selectivity of each ruminant diet is expressed by; the
amount of grass versus browse, the choice of plant species
within each forage consumed and the amount of each plant
part consumed. Pregastric fermentation of ingested plant
material supplies ruminants with energy and nutrients in
the form of microbial products (Hungate 1966). In
ruminants, the initial consumer of plant primary
production is the anaerobic microbial population of the
rumen. This buffered anaerobic fermentation, supplies
nutrients to ruminants in the form of volatile fatty
acids, the end products of fermentation. The growth of
microbial cells produce proteins and vitamins which are
harvested from the rumen by passage to the abomasum where
peptic digestion occurs. This gives the advantage to the
ruminants over simple stomach mammals with hind gut
fermentation, where most microbial cells are lost in the
faeces. This advantage is especially important when plant
products, such as cell wall carbohydrates, which are not
digested by enzymes secreted by mammals, are a large
portion of ingested food. Another advantage is that plant
7
toxins are substantially modified by the rumen
fermentation which in most cases renders them less toxic
and harmless. Since the ingested plant material is
retained in the rumen for fermentation, ruminants may be
more restricted by the fermentation characteristics of
plant material than in large simple stomached herbivores
(Van Soest 1982).
Van Soest (1982) reported that intake is the most
important parameter in the nutritional status of all
mammals. He also concluded that the rumen has a limited
capacity and rumen fill is considered an important factor
regulating intake. The turnover and capacity of the rumen
must therefore place limits to intake as it is the major
site of digestion. Welch and Smith (1969) in their
studies concluded that as plant cell wall increases in the
ruminant diet, rumination time increases to a limit at
which point intake must decrease. Rumination, which
reduces ingesta to a size that will pass through the
reticulo-omasal orifice, is therefore an important factor.
Hofmann (1973) suggested that the omasum plays an
important role in regulating rumen turnover and that its
structure and place in the digestive tract suggest a
sieving and pumping function. Therefore, the omasum also
regulate the passage rate of digesta to the lower tract.
In contrast, mammals such as zebra and elephants have no
blockage to the passage of ingesta. This gives them the
ability to increase intake in response to decreased
quality of food beyond the capabilities of ruminants.
8
These relationships suggest that ruminant herbivores need
to select diets that correspond to the limitations
inherent in the functional anatomy of the digestive tract
of each species.
2.2 Feeding strategies of cattle, kongoni and wildebeestThe prehensile capabilities of cattle, kongoni and
wildebeest is related to their feeding strategies (Jarman
and Sinclair 1979). Dentition, muzzle width and manner of
grazing or browsing are important in the ease with which
herbivores can select plants with different morphological
attributes. The most important aspect of the feeding
strategy of cattle is that they are domesticated. Their
grazing patterns and habitats in which they feed are
controlled by man. Traditional methods of keeping cattle
in bomas at night severely restrict their feeding time.
This would force cattle to be less selective when feeding
because of time limit. On the other hand, the ability of
cattle as well as sheep and goats to increase fill under
conditions of restricted feeding time (Hoppe 1977) may be
an important feature in their adaptation to domestication.
The relatively broad muzzles and efficient use of
tongues in wildebeest and cattle allow rapid and efficient
harvesting of grass leaves from dense leafy swards.
However in tall grass communities kongoni with a long,
narrow, flat muzzle is more capable of selecting for grass
leaves than cattle (Jarman and Sinclair 1979). Kongoni
are classified as "bulk feeders and roughage eaters" in
9
the subclass of the "roughage grazers" (Hofmann 1973).
Jarman (1974) described kongoni as being rather
unselective for grass species but more selective for plant
parts or growth stages. Kongoni select for maximum intake
of grass leaves in the wet season, but in the dry season
grass sheath is selected over grass stem (Stanley-Price
1977). Kongoni appear to be able to select for grass leaf
in tall grass vegetation types (Stewart and Stewart 1970,
Talbot and Talbot 1962) . Wildebeest are classified by
Hofmann (1973) as "bulk and roughage eaters" in the
subclass "fresh grass grazers dependant upon water". In
Jarman's (1974) classification scheme, wildebeest are in
the same class as kongoni, unselective for grass species
but more selective for plant parts and growth stages.
Wildebeest show preference for short grass vegetation
types (Mentis and Duke 1976). Unlike kongoni, wildebeest
do not seem capable of selecting for grass leaf in tall
grass vegetation types. Instead, they maximize intake of
grass leaves by migration or association with less
selective ungulates (especially zebra) in grazing
succession (Bell 1971). Zebra create a more acceptable
sward structure for wildebeest in the grazing succession
along the catena change from tall grass to short grass
vegetation types. This process is also repeated across
the rainfall gradients which create short and tall grass
vegetation types as occurs in the Serengeti plains (Bell 1971) .
10
2.3 Relationship between feeding strategy and body sizeA number of authors have related feeding strategies
of African ungulates to their body weight (Vessey-
Fitzgerald I960, Jarman 1974, Van Soest 1982). The
concept that very small ruminants (<15Kg) are selective
feeders and very large ruminants (>200Kg) are relatively
unselective is generally accepted. The relationship
between energy requirements, body weight and digestive
tract capacity supports this conclusion (Van Soest 1982,
Mentis 1977) . The consequence of this relationship is
very important to the feeding strategies of ruminants
differing in body weight (Van Soest 1982) . Very small
ruminants such as duikers, suni and dik-dik need to select
for diets that have both high rates of digestion and high
digestive tract passage rates to maintain rumen turnover
and intake levels necessary to meet their nutrient
requirements. Plants that meet this criteria are very low
in abundance (Jarman 1974, Mentis 1977). Consequently
these animals are restricted in specific habitats.
2.4 Role of special senses in grazingThe senses of sight, smell, taste and touch are
involved in diet selection (Arnold and Dudzinki 1978,
Arnold 1966a, Krueger et al. 1974) . Sight is the most
important in orientating the animal to other animals and
its environment. Sheep do recognize conspicuous food
plants by sight but do not use sight to help them graze
selectively. This was documented by Arnold (1966a) who
11
found that blind folded sheep ate similar diets to those
of sheep that could see under a wide range of conditions.
Arnold (1966b), in a series of studies with surgically
treated sheep to produce single and multiple sensory
impairments showed that, not only were there marked
changes in acceptability of plant species when each of the
senses were impaired, but that total food intake was
affected. He found that inability to taste had the effect
of improving the acceptability of more species than did
the inability to smell or feel them.
Arnold and Dudzinki (1978) indicated that chemical
signals influence food selection. These are received at
receptors for taste and smell. Stimuli are transmitted to
the brain and the animal responds behaviourally or
physiologically to the messages they contain (Krueger et
al. 1974). The animal then responds by integrating these
messages with others, such as feedbacks on the current
nutritional state of the animal. The desire to eat may
then result in lowering either taste or smell thresholds
of rejection (Goatcher and Church 1970, Arnold and Dudzinki 1978).
2.5 Influence of standing biomass on forage utilizationby herbivoresOne of the most important properties of the East
African rangelands is the abundance of plant biomass on a
temporal and spatial basis, which is mainly dependent
largely on rainfall. Rainfall is the major determinant of
12
the quality and quantity of the forage available for
consumption by herbivores, thereby determining the
abundance of both plant and animal components of which the
East African grasslands support a greater biomass and
diversity of herbivores than any other terrestrial
ecosystem (Van Dyne et al. 1980). This combination may
result from high degree of resource partitioning among
these herbivores, with large populations and high
diversity permitted by relatively efficient use of
available food and space (Lamprey 1963, Jarman and
Sinclair 1979).
The growth form (i.e. height, leaf/stem ratio and
crown structure) of tropical grasses has an important
effect on the eating time, bite size and intake (Stobbs
1973, Chacon and Stobbs 1976). They concluded that in
general tall growth of tropical grasses leads to a longer
eating time, smaller bite size and lower intake by cattle
when compared to short leafy growth of the same grasses.
Herbage yield is also negatively related to bite size and
intake. These relationships indicate that the presence of
large amount of grass biomass would be deleterious to
ruminant utilization. The ability of grazing ruminants to
maximize forage intake on short grass swards may be a
factor in migratory patterns and choice of vegetation
types of wild ruminants in East Africa. The grazing
succession described by Bell (1971), in which Zebra create
a short grass sward more acceptable to wildebeest and
Thomson's gazelle, fits this concept. Wildebeest also
13
migrate to the short grass plains in the Serengeti
ecosystem in their period of peak demands during
parturition and early lactation (Sinclair and Norton-
Griffiths 1979).
Concomitant with large seasonal changes in plant
standing biomass are equally large and important changes
in nutrient contents and digestibility. Although there
are infinite variations in nutritive value among plant
species, there are some similarities among plant groups.
Generally the grasses and forbs of the herb layer, have
relatively high digestibility (French 1957) and high
concentrations of nitrogen, phosphorus and other nutrients
(Bredon and Wilson 1963, Taerum 1970) soon after growth
resumes at the onset of rainy season. During the period
of early growth, concentration of crude protein in grass
leaves is approximately 8-20%, while forbs have a higher
concentration ranging from 15-30% (Dougall et al. 1964).
As the growth ages, its nutritional quality declines as a
result of increases in structural carbohydrates, so that
both nutrient concentration and digestibility decrease
(French 1957, Kilcher 1981). By contrast, browse plants
in tropical grasslands generally have deeper root system
which exploit a less ephemeral moisture supply and store
food reserves in stems and leaves rather than in roots
(Lawton 1968, Owen-Smith 1982). Browse, therefore do not
decrease much in protein and carbohydrates, with advancing
maturity as much as grasses do (Heady 1975).
14
2.6 Forage preference by domestic and wild herbivoresNumerous studies geared towards understanding the
feeding habits of both wild and domestic herbivores have
been conducted. The evidence assembled todate indicate
that ungulates are selective in their diet for at least
part of the year, involving habitat selection, plant
species selection, and selection for plant parts (Jarman
and Sinclair 1979). As diet quality declines, with higher
incidence of fibrous material, more time at the expense of
feeding must be set aside for rumination which is thus a
critical component of foraging. Thus what a grazer does
when not foraging is as important as it does in overall
feeding strategy (Demment et al. 1986). The fibrous
material content of the diet ultimately controls ingestion
and assimilation of other nutrients (Van Soest 1967). The
constraints imposed by the digestive physiology dictate
that ruminants select an easily digestible diet of high
quality. This selectivity with a preference for green
grass parts, has been documented by several studies in
domestic and wild herbivores (Sinclair 1972, Stobbs 1975,
Talbot and Talbot 1962, Gakahu 1982).
Ruminants have been found to display different
selectivity regimes closely associated with body size with
profound effects on the ecology and behaviour of the
species. Gwynne and Bell (1968) showed that larger
animals tolerate coarser, lower quality food, and smaller
ungulates can coexist with larger species by using
scattered remnants of high quality food. Larger species
15
therefore facilitate plant/forage utilization by smaller
species by removing coarser material and exposing the
higher quality portions. However reduction of resources
below a critical level can trigger competition (Field
1972) . Hillman and Hillman (1977) concluded that food
resource shortages are so intense in drought years as to
cause high mortality among ungulates. Further evidence of
resource shortage comes from observations of a shift in
diet composition among plant parts. Andere (1981)
concluded that if resource abundance varies with season
and there is evidence of seasonal shortage, then niche
overlap may be construed as actual competition.
Wildebeest and zebra are virtually pure grazers and
select leaves, which have the highest ratio of protein and
soluble carbohydrates to cellulose (Gwynne and Bell,
1968) . In the dry season there is a decrease in the
intake of leaves, at the expenses of leave sheath and
stem. Similarly Owaga (1975) found that both wildebeest
and zebra are almost pure grazers, taking little forbs
(about 1-2%) during the wet periods and almost none at
other times. The proportions in zebra diet were usually
close to the availability and therefore seemed to be
relatively random feeders. In his experiment in Kruger
National Park, South Africa, Ben-Shahar (1991) showed that
there was a considerable overlap of grass species
composition in the diets of zebra and wildebeest. However
wildebeest diet alternated with seasons, showing high
preferences during the winter for grasses which were
16
rejected during the summer.
Field (1975) noted that cattle, buffalo, eland and
oryx grazed within the grass/herb layer during the early
growth period. He also noted that annual and drought
tolerant grasses form the main diet of oryx, while buffalo
and cattle feed on bulky perennial grasses. A study of
goat and eland diets on the Kiboko Research Station, Kenya
by Ng'ethe and Box (1976) showed that the bulk of diets of
both animal species consisted of leaves from relatively
few plant species. Although elands utilized a wide
variety of plants, they consumed a larger proportion of
grasses than goats. Elands are mixed feeders. Van Zyl
(1965) reported that elands browsed 76.5% and grazed 23.5%
of their time in the field, while Lamprey (1963) concluded
that elands selected 70% grasses and 30% browse species.
Kerr et al. (1970) reported that grasses were minor forage
components for elands. These conflicting conclusions
imply that intake could be largely dictated by the
nutritional status of the animal, locality and
availability of forage. Further they confirm the
observation that elands are capable of utilizing a wide variety of plant species.
Field and Potere (1972) have documented that cattle
prefer grazing to browsing and that sheep like fine grass,
forbs and shrubs while goats are mainly browsers. In a
study on the feeding behaviour of cattle in a semi-arid
part of Tanganyika, Payne and MacFarlane (1963) noted that
cattle were browsing more frequently as the dry season
17
advanced. Holechek et al. (1982b) investigated the
seasonal diets of cattle in the Oregon forests, United
States of America. The study showed that grasses, forbs
and shrubs averaged 61%, 16% and 23% of the diet
respectively. Composition of the diet differed with
advancement of the season. Forbs were heavily used in the
early part of the growing season before maturation.
Browse comprised as much as 47% of the diet when green
grass was unavailable. They concluded that cattle were
opportunistic grazers and did not limit their selection to
grass species. Kayongo Male (1986) studying the seasonal
variability in cattle diets in Marsabit District, Kenya,
concluded that during the wet season, annual and perennial
grasses made up the bulk of cattle diets. When the dry
season become severe the herbs, dwarf shrubs, trees and
litter constituted major portion of cattle diets. This
was in general agreement with other studies by Payne and
MacFarlane (1963). Wangoi and Hansen (1987) investigating
the seasonal dietary habits of camels, cattle, sheep and
goats grazing a common range in Marsabit District, Kenya,
concluded that although cattle predominantly ate grasses,
the browse component of their diet was higher in the wet
season than in the dry season. More than 50% of the sheep
diet consisted of grasses for all except one season, when
the browse component of their diet tended to increase
during the very dry and very wet season. Goats also
tended to browse relatively more during the driest season.
However, for camels which have mouth parts adapted for
18
browsing just like sheep and goats, the grass component
was highest during the dry season.
From most of the studies done so far, there is a
general conclusion, that grazing animals do select their
diet from an array of plants depending on what is
available to them and prevailing conditions. The animals
tend to be opportunists utilizing whatever is available
thereby showing great variation in feeding habits in
different ecological regions and certain seasonal
variation of these habits within the same region. To
consider dietary data as forage classes (grass, forbs and
shrubs) overlooks in general the important fact that
animals select their diets on a plant species basis and
even plant parts. It is important therefore that dietary
selection studies consider analysis and reporting of
diets at species level. Seasonal dietary shifts can be
abrupt particularly in areas having distinct wet and dry
seasons like in the temperate areas. The nutritional
consequences of these shifts are probably great in terms
of competition among animals on a common range.
Generalization from these diet selection studies are
difficult because all have been conducted under conditions
of different plant availabilities. Consequently, the
results tend to be location specific in terms of
applicability to management. However, such studies when
applied to the site from which the data originated, can
provide range managers with some basis for making management decisions.
19
2.7 Determination of range herbivore dietsThe procedures that have been used to determine the
botanical composition of grazing animal diets include;
- utilization technique,
- direct observation of the animal(s),
- stomach content analysis,
- microhistological technique and
- fistula techniques.
2.7.1 Utilization techniqueUtilization is one of the oldest approaches used to
evaluate grazing animal's diet (Holechek et al. 1982a).
Approaches to determining utilization (Holechek et al.
1982a) have involved;
- evaluating differences between grazed and ungrazed
plots,
- evaluating differences before and after grazing,
- measurements involving correlation and regression
of factors related to utilization,
- general observation and comparison with
predetermined standards of use and
- ocular estimate methods which involve comparing
the amount of herbage inside and outside cages.
The advantages of this approach include the speed and
the fact that it provides information on location and the
degree a range is used in a given time period. Its major
disadvantage is that it does not indicate when a forage
species was used and how often it is used. This technique
20
does not account for large scale losses of plant parts
from weathering and trampling by animals other than those
of interest (Cook and Stoddart, 1953). Further still, for
actively growing forage, and regrowth after defoliation
can make accurate determination of utilization difficult.
Cook and Stoddart (1953) indicated that when forage is
actively growing and/or being used by more than one
herbivore, any utilization technique has severe
limitations. Under these conditions other procedures
should be selected for determination of botanical
composition of diet.
2.7.2 Direct observationDirect observation of the grazing animal is a widely
used procedure in studies of botanical composition of a
herbivore diet. The major advantages of direct
observation include simplicity, minor equipment
requirements and ease of use (Holechek et al. 1982a). The
problem associated with this method include difficulties
in species identification and quantifying information from
direct observation obtained from bite-count and feeding
minutes approaches. When the feeding minute technique is
employed, time spent grazing each species is quantified
and assumed to be proportional to the importance of the
species in the diet (Bjugstad et al. 1970). The
bite-count procedure differs in that number of bites taken
from each species, rather than the length of grazing time,
is recorded. This method may not apply to wild ungulates
21
which are often difficult to locate and approach closely
enough for accurate observations. These problems do not
occur in studies if tame animals are used for study. It
may be difficult to differentiate between mere nibbling
and active grazing, and only one animal can be observed at
a time even with tame animals.
Results from direct observation studies of tame
animals have been shown to be consistent with data from
esophageal fistulated animals (Sanders et al. 1980).
Sanders et al. (1980) reported that direct observation was
not practical for use on large brush infested pasture with
rough terrain. Factors that may influence the accuracy
and precision of direct observation procedure include the
degree of training of the observer, complexity of the
plant community present, and/or phenological development
of individual plants.
Diet selection is a complex behaviuoral act that is
influenced by several factors (Krueger et al. 1974).
Physiological condition, degree of hunger, topography,
other animals present and past experience, all influence
which and how much of individual plant species are
consumed. Therefore the previously mentioned factors can
be greatly altered by using artificially reared and
maintained animals.
2.7.3 Stomach content analysisStomach content analysis method of determining
botanical composition of animal diets is a common
22
procedure among wildlife researchers (Chippendale 1962,
Chamrad and Box 1964) . Stomach content analysis provides
information on what species are being consumed and gives
an indication of relative proportions consumed. The main
disadvantage of this procedure is that it involves killing
of animals and therefore, is restricted primarily to wild
animals with large populations. Difficulties also arise
from the fact the complete or partial digestion of some
material may alter the original proportions in the diet
and also make plant identification fragments difficult.
Tabulation of food item numbers, tabulations of frequency
of food item occurrences, volumetric measurement, and
weight measurement are methods that have been used to
evaluate stomach contents. Chamrad and Box (1964)
described a method which appears to be superior to other
methods in speed, accuracy and precision. The
microhistological technique by Spark and Malechek (1968),
and microscope point technique by Heady and Van Dyne
(1965) can be used to evaluate species composition by
weight.
A modification of this procedure has been reported by
Wilson et al. (1977) to avoid the problem of animal
sacrifice when stomach analysis is used to sample large
ruminant's diet. Tranquilization is used to immobilize
animals and rumen samples are taken with a trochar. The
resulting wound is sewn shut. However, layering of rumen
contents, effective tranquilization of animals and
infection by bacteria are problems associated with trochar
23
sampling. Further, due to the danger of death from
parasites, diseases and overdosing occurring often, the
technique may not be liberally applied to rare or
endangered species (Holechek et al. 1982a).
2.7.4 Microhistological techniqueMicrohistological technique has received greater use
for evaluating range herbivore food habits. The procedure
has several unique advantages that account for its
popularity in research (Croker 1959, Scother 1979) . These
include;
- non interference with the normal habits of animals,
- it permits practically unlimited sampling,
- there is no restriction on animal movement,
- it is of great value where animals graze over mixed
plant communities and
- actual sampling requires very little equipment.
Important disadvantages noted by Slater and Jones
(1971), Scother (1979), Vavra and Holechek (1980), Sanders
et al. (1980) include;
- accuracy may be a problem because forage species
passed in faeces are often not proportional to
those consumed,
- considerable equipment and labour are required for
actual analysis,
- an extensive reference plant collection is
required,
- an observer must have considerable experience or
24
training in order to accurately identify plant
fragments,
- some plant species are difficult to separate at the
species level and sometimes even at the genus
level,
- plant identification is tedious and time consuming,
- procedures of sample collection may bias the
results,
- some species of plants may become unidentifiable in
faeces and
- identification can be complicated by aging of
faecal material before sample collection.
Major points of interest concerning microhistological
techniques have been the influence of digestion, frequency
of observation and degree of training of observer on the
accuracy of diet composition determination. Hansen (1971)
reported good agreement between composition of ingested
and faecal material. Todd and Hansen (1973) indicated
that the relative number of plant fragments of each kind
of plant, remains similar in passing through the digestive
process. They suggest that digestion reduce the mean
weight of fragments rather than eliminating the whole
fragment. Sanders et al. (1980) compared the
microhistological technique and bite count method for
range animal diets. The experiment indicated that the two
methods gave similar results for estimating major
components of cattle diets. It was further noted that the
25
bite-count method could not be used on large bush-infested
areas with rough terrain whereas the other method could be
used under such conditions. Holechek and Gross (1982)
used seventeen forage species to determine the effects of
stage of maturity and skill of observation on the accuracy
of microhistological analysis for species composition of
hand compounded samples. Results indicated that growth
stage had little effect on the accuracy of estimation.
Five observers with specialized training and experience
obtained similarity indices for estimates of diets
composition of 95%, 88%, 85%, 93% and 75%. Poor accuracy
was recorded for the observer without specialized
training. The effect of observer was the most important
of the factors examined. Observers with specialized
training most accurately evaluated botanical composition
of each diet. In an experiment to study mastication
effects on cattle diets determined by microhistological
analysis, Bryan et al. (1983) reported that mastication
had no overall effect on diet composition. None of the
individual species was affected by mastication,
considerable variation occurred between observers in this
study. In general, the experiments pointed out that
fragments of plants survive the chewing and the digestive
process and can be identified and quantified in herbivore
faeces by microhistological technique. This method thus
remains the one of choice in the study of dietary
composition of free-ranging animals in mixed plant
communities.
26
2.7.5 Fistula techniqueEsophageal and rumen fistula techniques have
considerable advantages over some of the above methods in
that fistula enable the investigator to obtain naturally-
grazed samples. Both fistula are popular in research but
esophageal fistula is generally preferred to the rumen
fistula because rumen evacuation subjects animals to
abnormal conditions, is mainly limited to large animals
and is more laborious (Holechek et al. 1982a). Problems
associated with the use of the esophageal fistula include
contamination by rumen contents, incomplete recoveries,
high cost, and low sampling precision for individual
species in the diet.
27
CHAPTER THREESTUDY AREA
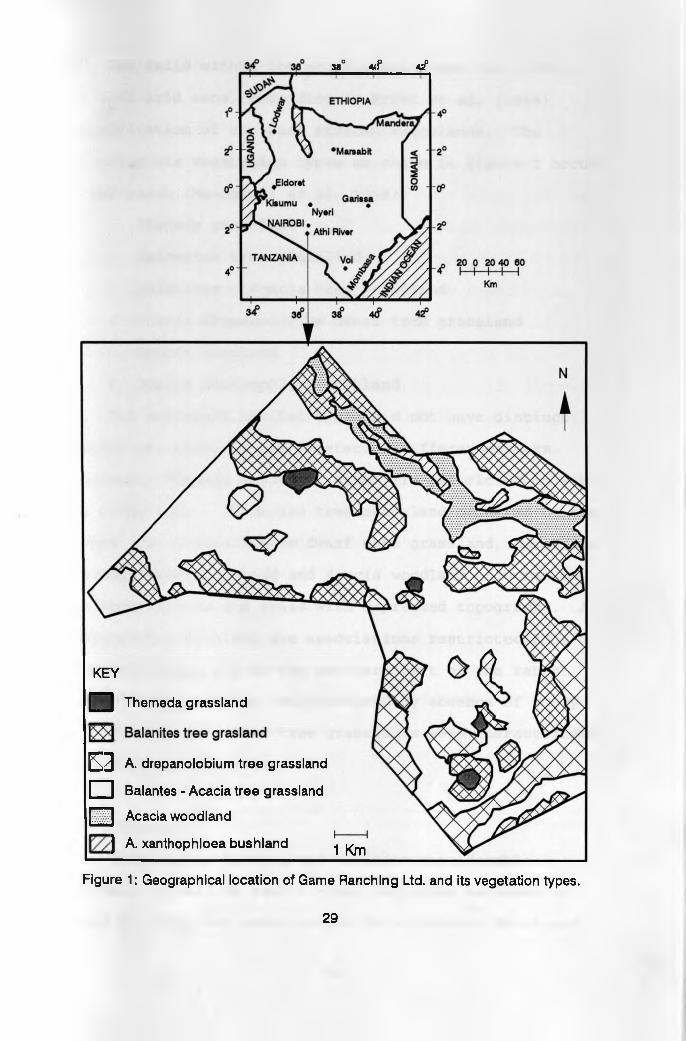
3.1 Location and physiographyGame Ranching Ltd (GRL), Athi River, is a privately
owned, mixed game and cattle ranch. GRL was initiated to
demonstrate the economic and environmental viability as
well as the social acceptability of game ranching. The
ranch occupies an area of 8,100 Ha. and is located 40 Km
South - East of Nairobi on the Athi Kapiti plains (Figure
1). Elevation varies between 1600 and 1700 M above sea-
level, latitude 0.1 30"S, and longitude 37 02"E (Stelfox
1985, MacDowell et al. 1988). The ranch is only 5 Km to
the North of Kajiado District, which is mainly used for
pastoralism and is bordered by unfenced private ranches.
It is separated from Nairobi National Park by Portland
Cement Ranch and the Nairobi - Namanga road.
Prior to 1981, GRL was operated as a cattle and
sheep ranch. Following the findings of research by
Hopcraft (1975) on productivity comparison between
Thomson Gazelle and cattle, and their relation to the
ecosystem, GRL applied to the Kenya Government for a
permit to operate it as a game ranch. To meet the
government regulations GRL had to complete several
modifications including a 50 Km chain-link fence, 2.6 M
in height along the perimeter to ensure the existence of
a closed system. This closed system was used in this
study to investigate the diets and habitat preferences of
cattle, and kongoni wildebeest.
28
38C 4(f 42°
KEY
□ Themeda grassland
Balanites tree grasland
E3 A. drepanolobium tree grassland
□ Balantes - Acacia tree grassland
■ Acacia woodland
) A. xanthophloea bushland ̂ ^
Figure 1: Geographical location of Game Ranching Ltd. and its vegetation types.
29
GRL falls within the eco-climatic zone four (IV),
the semi-arid zone, according to Pratt et al. (1966)
classification of the East African rangelands. The
following six vegetation types as shown in Figure 1 occur
in the ranch (MacDowell et al. 1988);
1. Themeda grassland
2. Balanites tree grassland
3. Balanites - Acacia tree grassland
4. Acacia drepanolobium dwarf tree grassland
5. Acacia woodland
6. Acacia xanthophloea bushland
The different habitat types did not have distinct
boundaries, however, the vegetation differences were
apparent. Themeda grassland areas are restricted only to
the ridge tops. Balanites tree grassland occurred on the
slopes. A. drepanolobium dwarf tree grassland, Balanites
- Acacia tree grassland and Acacia woodland occurred on
the lower slopes and areas with depressed topography. A.
xanthophloea bushland are associations restricted to a
seasonal stream bed at the northern part of the ranch.
Themeda grassland was characterized by absence of woody
plants. The Balanites tree grasslands were characterized
by widely spaced trees.
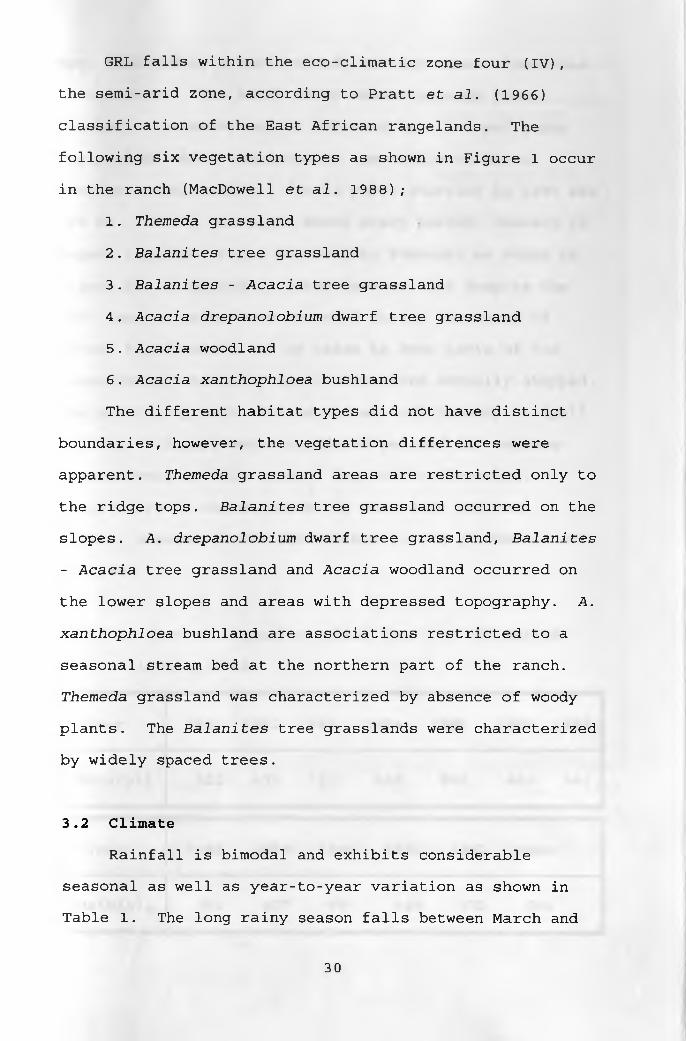
3.2 ClimateRainfall is bimodal and exhibits considerable
seasonal as well as year-to-year variation as shown in
Table 1. The long rainy season falls between March and
30
May, followed by a cool, cloudy and dry season from June
to September. The short rainy season extends from
October to December and is followed by a hot and sunny
dry period, which continues to the middle of March.
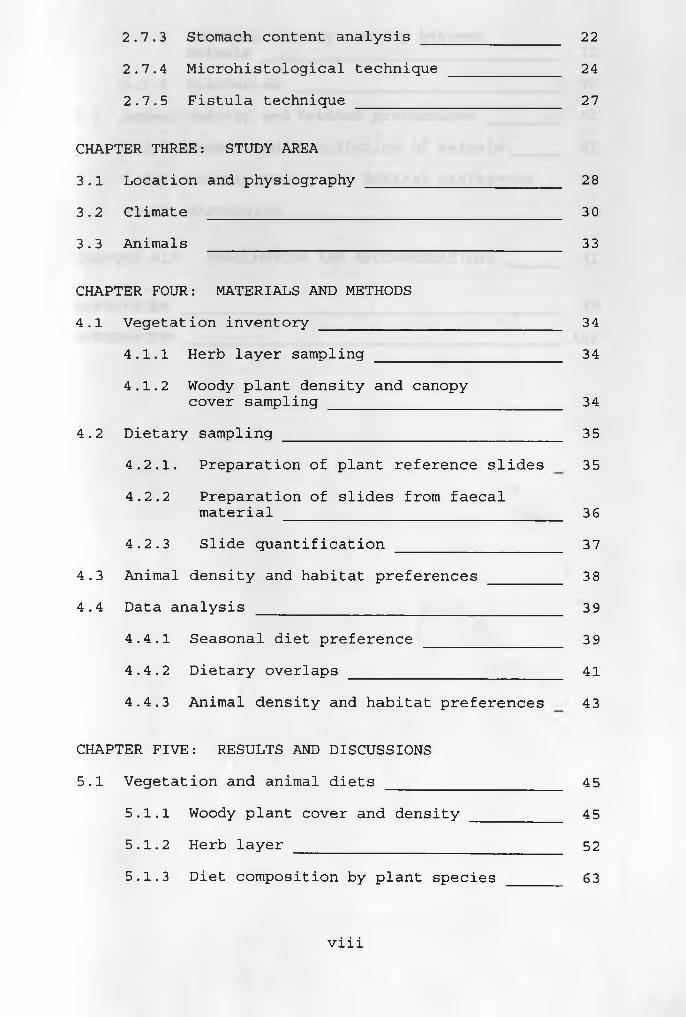
Average annual rainfall for 12 years starting in 1981 was
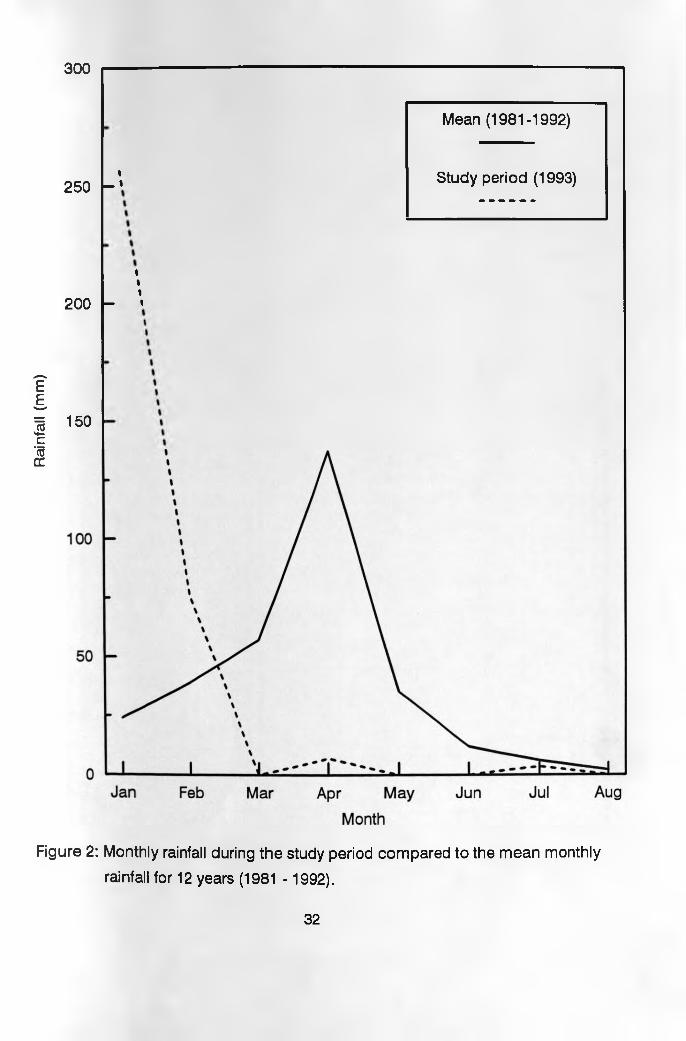
502 mm. During the eight month study period, January to
August the short rains extended to February as shown in
Figure 2. It should be noted however that despite the
fact that no rains were recorded during the month of
March, there were a lot of rains in some parts of the
ranch through to early April when rains actually stopped.
The usual long rains failed and as such January to April
and May to August were considered wet and dry seasons
respectively in this study. Due to the elevation,
temperature is characterized by warm days and cool
nights, maximum 24.9°C and minimum 13.7°C (MacDowell et
al. 1988).
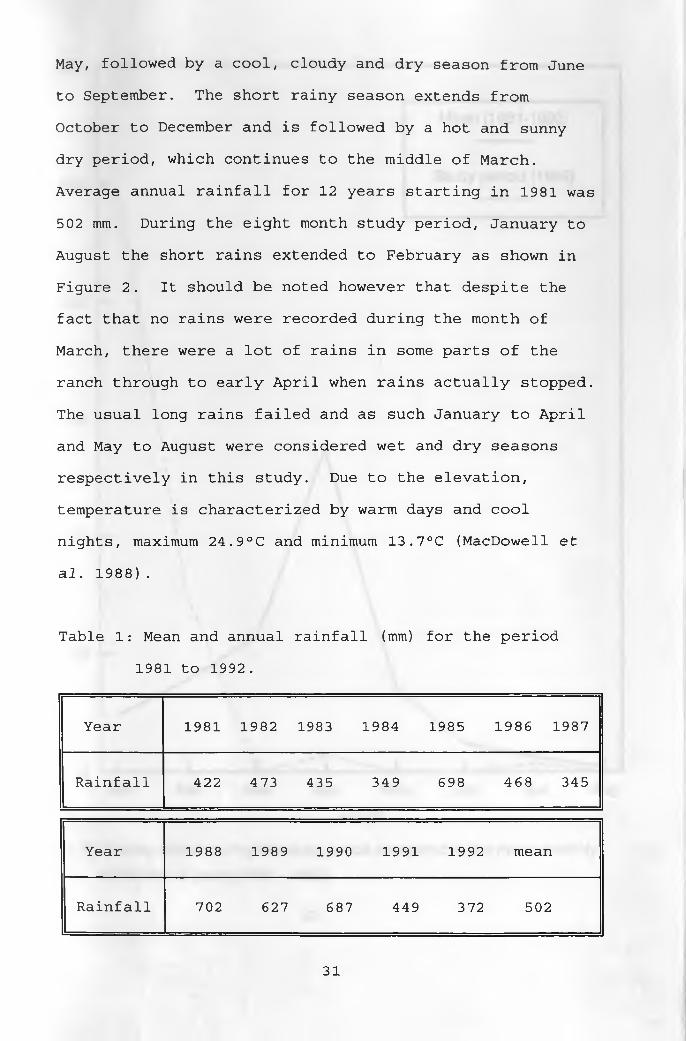
Table 1: Mean and annual rainfall (mm) for the period
1981 to 1992.
Year 1981 1982 1983 1984 1985 1986 1987
Rainfall 422 473 435 349 698 468 345
Year 1988 1989 1990 1991 1992 mean
Rainfall 702 627 687 449 372 502
31
Rainfall (mm
)300
250
200
150
t_ i
i i «u- »
Mean (1981-1992)
Study period (1993)
Figure 2: Monthly rainfall during the study period compared to the mean monthly
rainfall for 12 years (1981 - 1992).
32
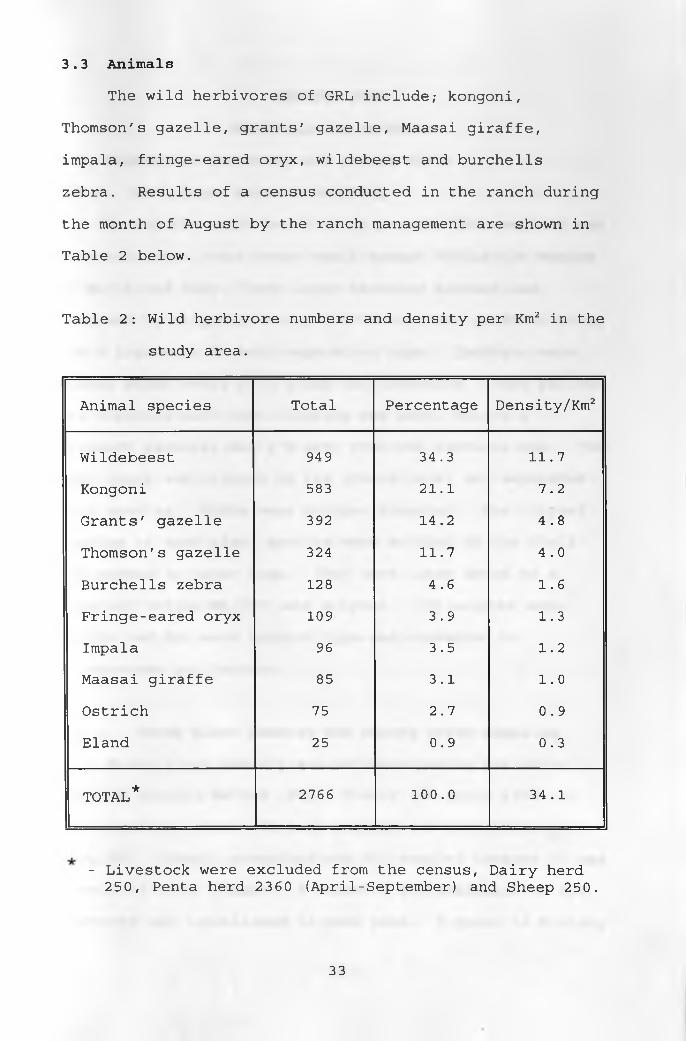
3.3 AnimalsThe wild herbivores of GRL include; kongoni,
Thomson's gazelle, grants' gazelle, Maasai giraffe,
impala, fringe-eared oryx, wildebeest and burchells
zebra. Results of a census conducted in the ranch during
the month of August by the ranch management are shown in
Table 2 below.
Table 2: Wild herbivore numbers and density per Km2 in the
study area.
Animal species Total Percentage Density/Km2
Wildebeest 949 34.3 11.7
Kongoni 583 21.1 7.2
Grants' gazelle 392 14.2 4.8
Thomson's gazelle 324 11.7 4.0
Burchells zebra 128 4.6 1.6
Fringe-eared oryx 109 3.9 1.3
Impala 96 3.5 1.2
Maasai giraffe 85 3.1 1.0
Ostrich 75 2.7 0.9
Eland 25 0.9 0.3
TOTAL* 2766 100.0 34.1
- Livestock were excluded from the census, Dairy herd 250, Penta herd 2360 (April-September) and Sheep 250.
33
CHAPTER FOURMATERIALS AND METHODS
4.1 Vegetation inventory and animal diets4.1.1 Herb layer biomass sampling
During the eight month study period, the sampling was
done six times, once every month except during the months
of March and July. Herb layer standing biomass was
obtained by clipping thirty 0.5 M 2 circular quadrats along
300 M transects in each vegetation type. Quadrats were
placed after every 10 M along the transects. This process
was repeated each time clipping was done, but on a
transect parallel and 4 M away from the previous one. The
herb layer was clipped to the ground level and separated
into species. Forbs were grouped together. The clipped
samples of each plant species were weighed in the field
and packed in paper bags. They were later dried to a
constant weight at 60°C and weighed. Dry weights were
determined for each habitat type and converted to
Kilogrammes per hectare.
4.1.2 Woody plant density and canopy cover samplingWoody plant density was estimated using the Point
Centred Quarter Method (PCQ) (Dieter and Heinz 1974) in
five habitat types. In each habitat two transects were
sampled. Themeda grassland was not sampled because it was
devoid of woody plants. A transect perpendicular to the
contours was established in each plot. A point 15 M along
34
each transect was selected for placing the PCQ stick.
Four sampling quarters was established by making two
lines, one parallel to the transect and the other
perpendicular to the transect at the PCQ stick. In each
quarter the distance between the nearest woody plant and
the stick was measured. Each plant was sampled for stem
diameter, and two perpendicular crown diameters. Canopy
cover was determined by calculating the means of the crown
diameters of each tree and hence their area. The crown
cover area of all the trees were totaled to give the total
cover and hence percentage cover calculated. The mean
area occupied by each tree was determined by using the
mean distance from the PCQ stick. Total area was then
calculated by multiplying the mean area by 120, the number
of quadrats sampled (4 x 30) in each vegetation type. The
density of the trees per hectare was then determined.
4.2 Dietary sampling4.2.1 Preparation of plant reference slides
In this study microhistological technique was used in
the analysis of dietary samples from the study animals.
Reference slides were prepared from plant species
collected from the study area. The plants were identified
in the field, collected, oven dried and finely ground
using a Willey Mill with 1 mm sieve. Slides were made
from the materials following the procedures described by
Cavender and Hansen (1970). A 5-10 gm sub-sample of the
reference material was soaked in a bleaching agent for
35
about 15 minutes. Soaking helped bleach the plant
pigments and softened the tissues during slide
preparation. Following this treatment the bleached
samples were then washed with running tap water over a 212
fim sieve for about 3 minutes to remove smaller plant
fragments, bleaching agent and any dirt. A small amount
of the material was then put near the end of a glass
microscope slide using a spatula and a template. Hoyer's
solution (Cavender and Hansen 1970) was added in small
quantities so as to cover the sample. A teasing needle
was used to mix the sample material with the solution.
The mixture was then spread evenly over an area large
enough to be covered by a 22 x 40 mm glass cover slip.
The cover slip was affixed and the slide was slowly heated
over an alcohol burner till the solution started to
bubble. The bottom part of the slide was immediately
pressed onto a wet cloth material to drive out air
bubbles. The cover slip was then gently, sealed to the
slide using a few drops of Hoyer's solution. Five slides
were prepared for each sample. The prepared slides were then placed in a rack and dried at 6 0°C for 4 8 hours and
stored.
4.2.2 Preparation of slides from faecal materialFor each of the animal species and for each month,
faecal samples were collected for 3 days each week during
a three week collection period from randomly selected
fresh dung/faeces in the field. Faecal samples for each
36
animal species were compounded from the weekly samples to
form one composite sample. Each composite sample was then
crushed, washed over a 600 /zm and 212 /xm sieves with
running tap water. The sample retained by the 212 fim
sieve was then dried and stored in sealed plastic bags.
For each composite sample five slides were made using the
procedures described above.
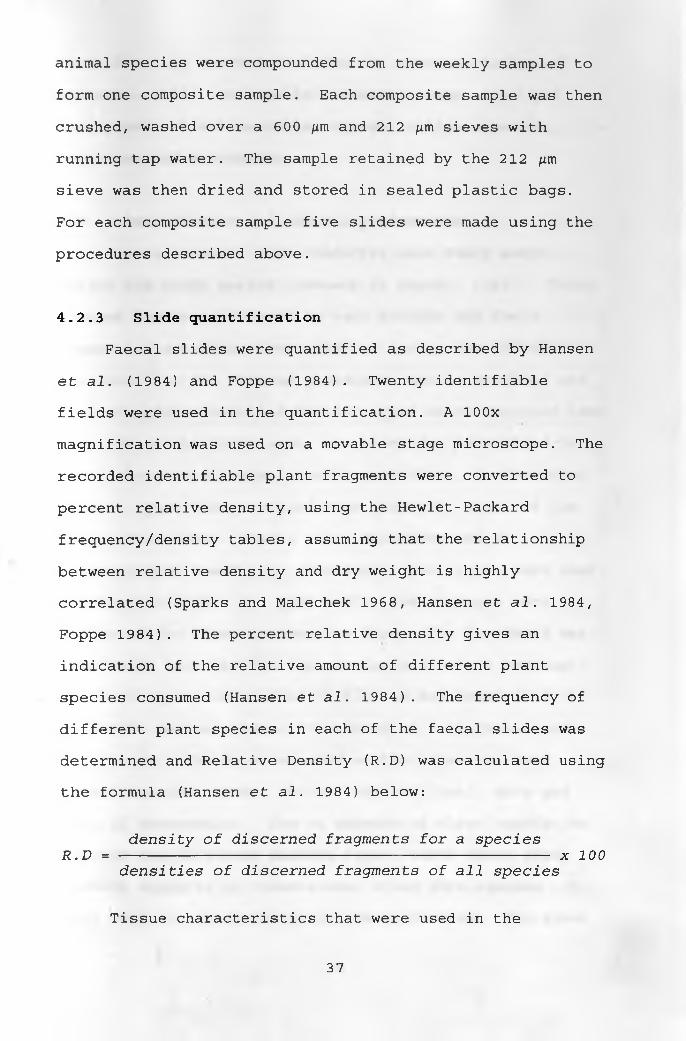
4.2.3 Slide quantificationFaecal slides were quantified as described by Hansen
et al. (1984) and Foppe (1984). Twenty identifiable
fields were used in the quantification. A lOOx
magnification was used on a movable stage microscope. The
recorded identifiable plant fragments were converted to
percent relative density, using the Hewlet-Packard
frequency/density tables, assuming that the relationship
between relative density and dry weight is highly
correlated (Sparks and Malechek 1968, Hansen et al. 1984,
Foppe 1984) . The percent relative density gives an
indication of the relative amount of different plant
species consumed (Hansen et al. 1984) . The frequency of
different plant species in each of the faecal slides was
determined and Relative Density (R.D) was calculated using
the formula (Hansen et al. 1984) below:
density of discerned fragments for a speciesR.D = ------------------------------------------------- x 100
densities of discerned fragments of all species
Tissue characteristics that were used in the
37
identification process included the characteristics of
epidermal cells, cell walls, stomatal shape, size and
arrangement of silica cells, druses, silica suberose,
trichomes and microhairs.
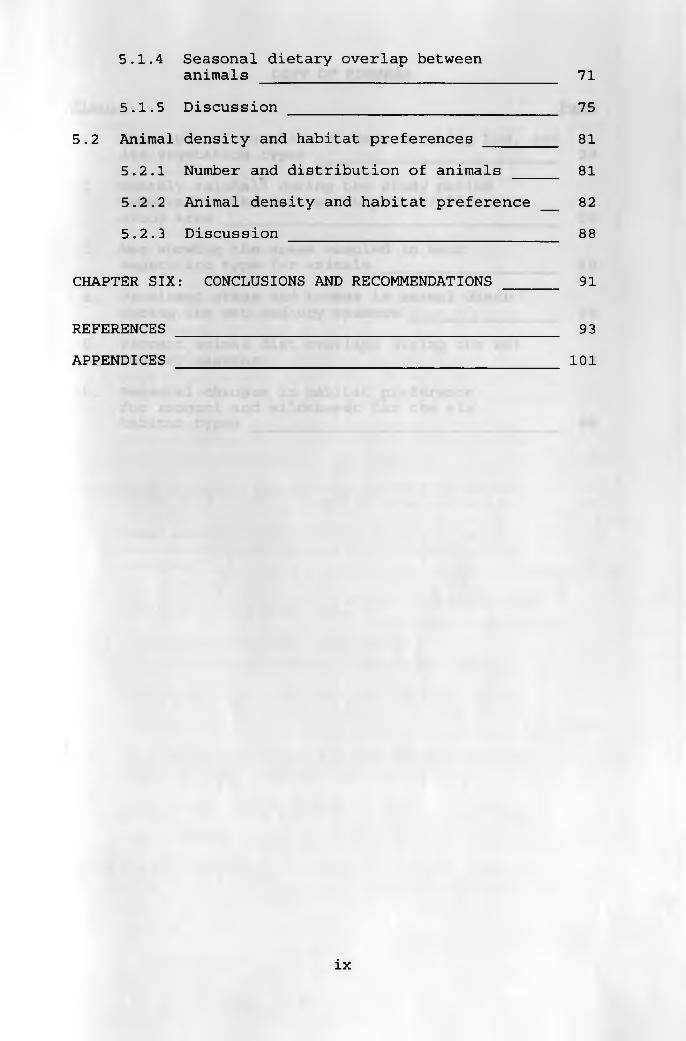
4.3 Animal density and habitat preferencesAnimal censuses were conducted once every month
during the study period (January to August, 1993) . Table
3 shows the areas covered by each habitat and their
respective areas that were sampled during the animal
censuses. In the Themeda grassland, Acacia woodland and
A. xanthophloea bushland habitat types which occupied less
than 10% of the Ranch each, one block was identified in
each, where total animal counts were done. In the other
habitat types that occupied more than 10%, each, of the
ranch (Balanites - Acacia tree, Balanites and A.
drepanolobi urn dwarf tree grasslands) two blocks were used
as shown in Figure 3. Each month, the censuses were
conducted for three consecutive days. The fieldwork was
done twice each day (in the morning and in the evening).
The morning census started at 6.30 am and ended at 9.30
am, while in the evening it started at 3.30 pm and ended
at 6.30 pm. The data recorded at the sites included
animal species, number, block (habitat type), date and
time of observation. Due to absence of clear boundaries
between the different habitat types, herds whose group
members appeared in transitional areas were assumed to
have been utilizing the block, hence counted. The areas
38
covered during the animal censuses were calculated by
using a map overlaid with grids and showing all the
locations of each vegetation type in the Ranch. The grids
on the map demarcated an area of 2.5 Km2.
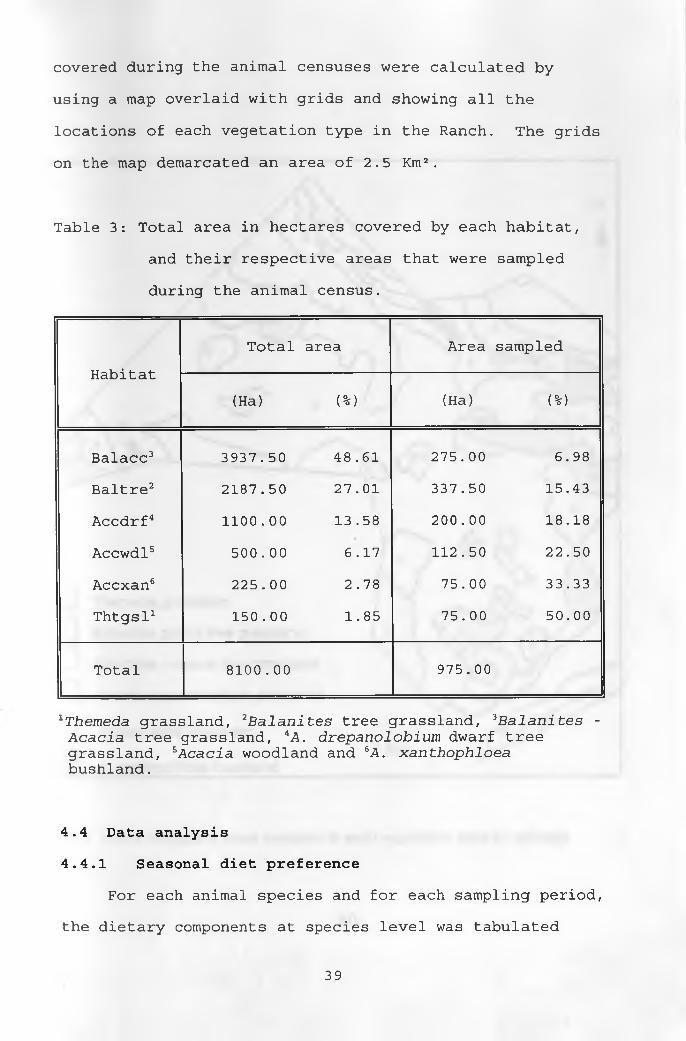
Table 3: Total area in hectares covered by each habitat,
and their respective areas that were sampled
during the animal census.
HabitatTotal area Area sampled
(Ha) (%) (Ha) (%)
Balacc3 3937.50 48.61 275.00 6.98
Baltre2 2187.50 27.01 337.50 15.43
Accdrf4 1100.00 13.58 200.00 18.18
Accwdl5 500.00 6.17 112.50 22.50
Accxan6 225.00 2.78 75.00 33.33
Thtgsl1 150.00 1.85 75.00 50.00
Total 8100.00 975.00
1Themeda grassland, 2Balanites tree grassland, balanites - Acacia tree grassland, 4A. drepanolobium dwarf tree grassland, 5Acacia woodland and 6A. xanthophloea bushland.
4.4 Data analysis4.4.1 Seasonal diet preference
For each animal species and for each sampling period,
the dietary components at species level was tabulated
39
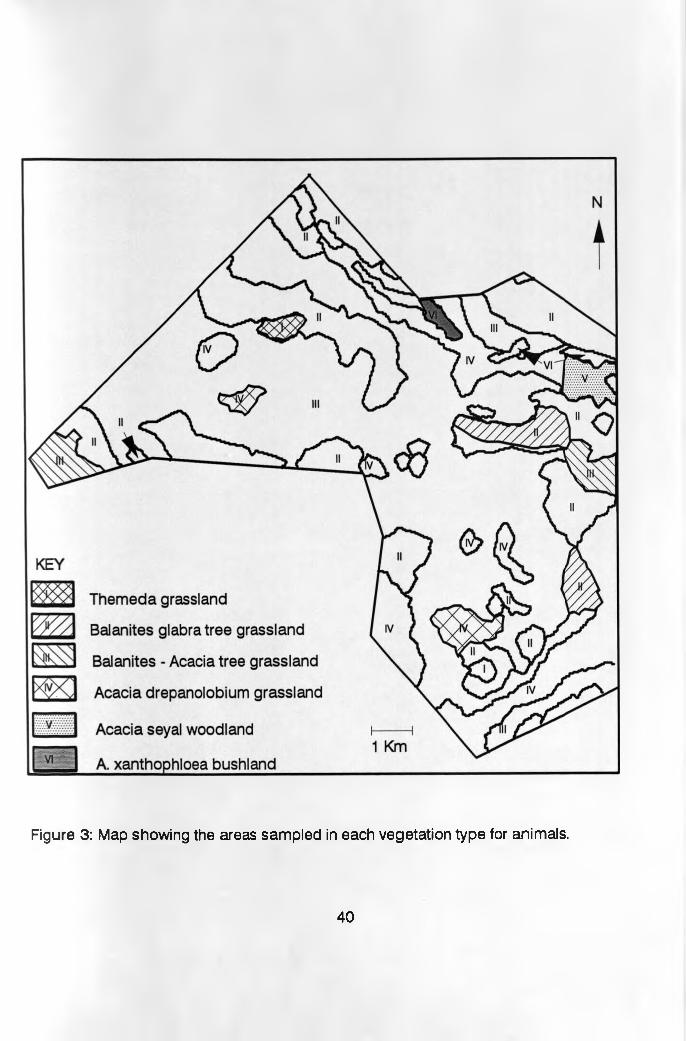
Figure 3: Map showing the areas sampled in each vegetation type for animals.
40
together with relative density and any changes in density
due to season. This was compared with plant species
available in the range so as to determine animal diet
preference by calculating their preference indices. Diet
preference indices were then calculated by using the
following equation adapted from Viljoen (1989).
Percentage in animal dietDiet preference index = ---------------------------
Percentage availability
4.4.2 Dietary overlapsDietary overlaps between animal species were
calculated using percent similarity index (S.I) (Oosting,
1956) .
E 2WiS.I. =■ i= 1
Y (ai+-ki)i =1
*100Where; Wi = Lesser percentage of
food category in the two diets being compared and
ai + bi = Sum of the percentages of food category in the two diets.
Comparisons were made between animals within seasons using
the above formula. The similarity index represents the
percentage of the diets that is identical or the
percentage of diets that is shared by two herbivores. It
shows the potential for competition between two
herbivores. Snedecor and Cochran (1967) and Hansen et al.
(1984) calculated a coefficient, Rs, as shown in the equation below from the relative densities of the plant
species common in the diets of two animals being compared
(Pair-wise comparisons).
41
Where;1-6 E rf2
i?s=- i= 1n (J23—1)
d = differences between pairedranks of common plant species,
n = number of pairs of observation and Rs = Spearman's rank correlation
coefficient.
Comparisons were made between animals within seasons. A
high Rs value (close to 1) indicates a strong correlation
for the order in which different plant species are
selected by the animals. A strong negative Rs value shows
a low potential for food competition by the animals being
compared. Test of significance for a positive Rs value
was by way of comparison with table values at n-2 degrees
of freedom (Snedecor and Cochran 1967) . Using the above
two methods, animal diets were compared two at a time for
each season. Significant positive values were interpreted
to mean strong correlations for the order in which any two
herbivores select the same plant species that constitute
their diets. Trophic diversity indices (H") were
calculated using the formula below to indicate food niche
breadth using Shannon's diversity index (1948).
H //=~y^ NilnNi where Ni is the proportion of the ithn=i food item in the diet.
Trophic diversity index indicates variety and evenness of
components in the diet. The index decreases as an animal
relies on fewer food categories for most of their diets
(Hurtubia 1973). High trophic diversity indices indicate
that an animal does not rely of fewer major food
categories for most of their diets, but is able to feed on
many categories. Therefore, the herbivore with high
trophic diversities is potentially better able to adopt
42
its diets to changes in plant composition.
4.4.3 Animal density and habitat preferencesAnimal density per Km2 was calculated as shown below:
Animals counted in each blockAnimal density (N/Km2) = ---------------------------- x 100
Total block area (Ha)
The total number of each species was obtained by
multiplying its density in each vegetation type by the
total area occupied by the vegetation type and summing up
the totals of each vegetation type. The distribution of
kongoni and wildebeest in all the habitat types were
determined by monthly ground sample counts. To evaluate
the animals' habitat preference, the relative densities of
each animal species were calculated on seasonal basis. A
Preference Index (P.I) was calculated for each species in
each habitat type using an equation adopted from Hillman
(1979) as shown below;
1 . If, nx > ax Nt At'
then, P. I (x) 1__y { nx_ ax)ax Nt At At
2. If, then,p.l(x) =•Nt At ax Nt
At
axAt
Where; P.I = Habitat Preference Index,nx = the number of animal species expected in
habitat "X",Nt = the total number of each animal species
expected in the ranch, ax = the surface area of habitat "X" (Km2),At = area (Km2) covered during the census in
habitat "X',nx/Nt = proportion of animal species expected in
habitat "X" andax/At = the proportion of the total area covered by
habitat "X".
43
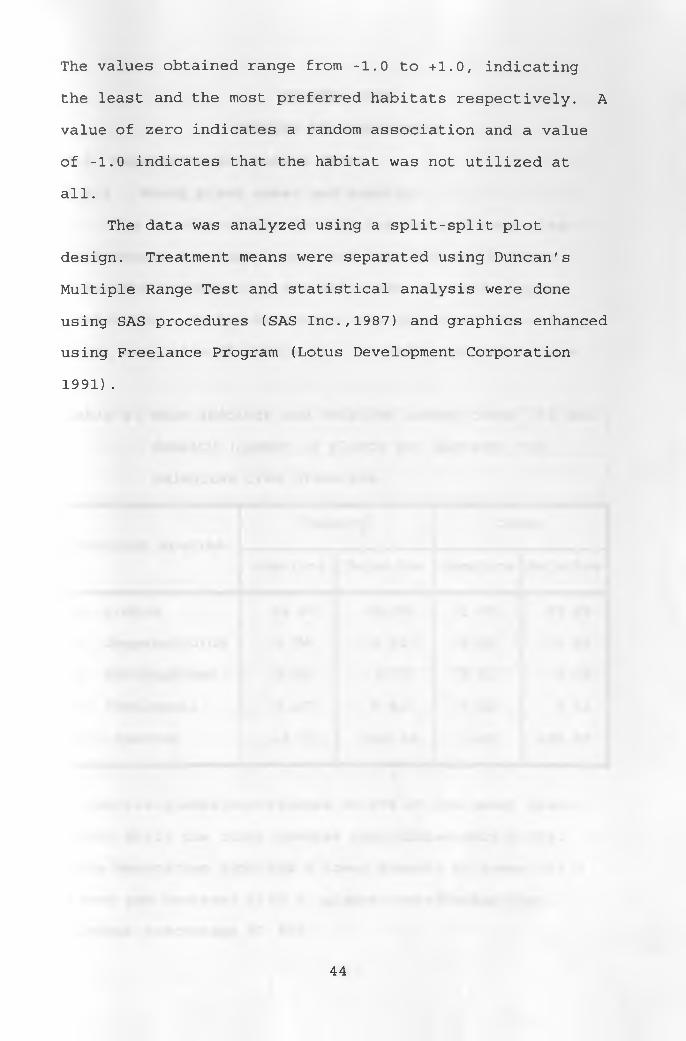
The values obtained range from -1.0 to +1.0, indicating
the least and the most preferred habitats respectively. A
value of zero indicates a random association and a value
of -1.0 indicates that the habitat was not utilized at
all.
The data was analyzed using a split-split plot
design. Treatment means were separated using Duncan's
Multiple Range Test and statistical analysis were done
using SAS procedures (SAS Inc.,1987) and graphics enhanced
using Freelance Program (Lotus Development Corporation
1991).
44
CHAPTER FIVERESULTS AND DISCUSSION
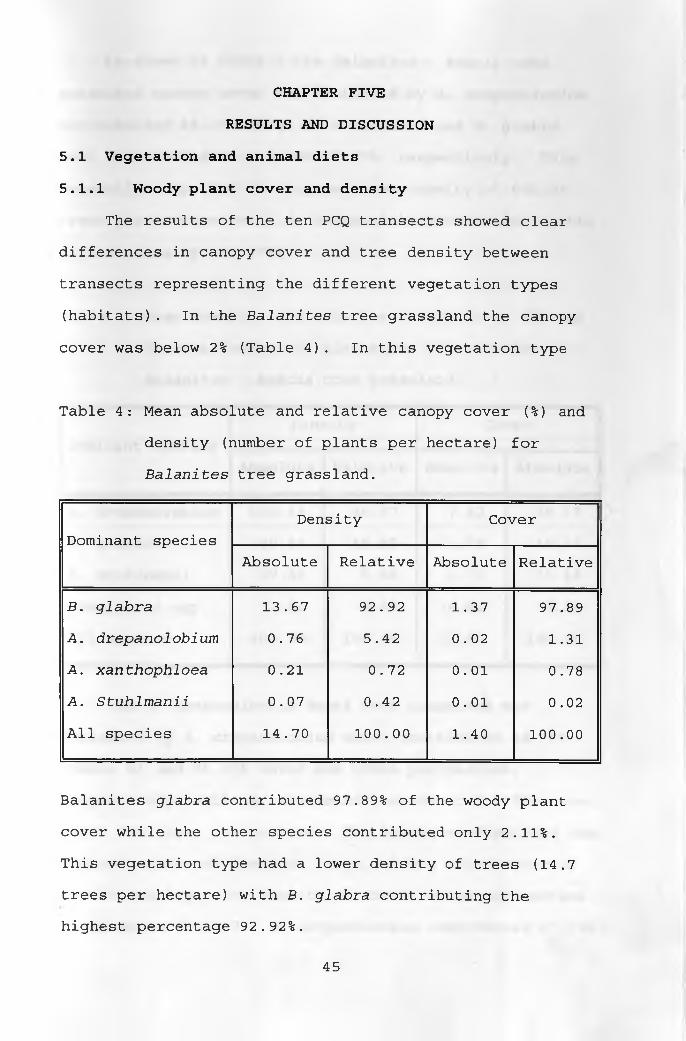
5.1 Vegetation and animal diets5.1.1 Woody plant cover and density
The results of the ten PCQ transects showed clear
differences in canopy cover and tree density between
transects representing the different vegetation types
(habitats). In the Balanites tree grassland the canopy
cover was below 2% (Table 4). In this vegetation type
Table 4: Mean absolute and relative canopy cover (%) and
density (number of plants per hectare) for
Balanites tree grassland.
Dominant speciesDensity ------ „----------- 1Cover
Absolute Relative Absolute Relative
B. glabra 13.67 92.92 1.37 97.89A. drepanolobium 0.76 5.42 0.02 1.31A. xanthophloea 0.21 0.72 0.01 0.78A. Stuhlmanii 0.07 0.42 0.01 0.02All species 14.70 100.00 1.40 100.00
Balanites glabra contributed 97.89% of the woody plant
cover while the other species contributed only 2.11%.
This vegetation type had a lower density of trees (14.7
trees per hectare) with B. glabra contributing the highest percentage 92.92%.
45
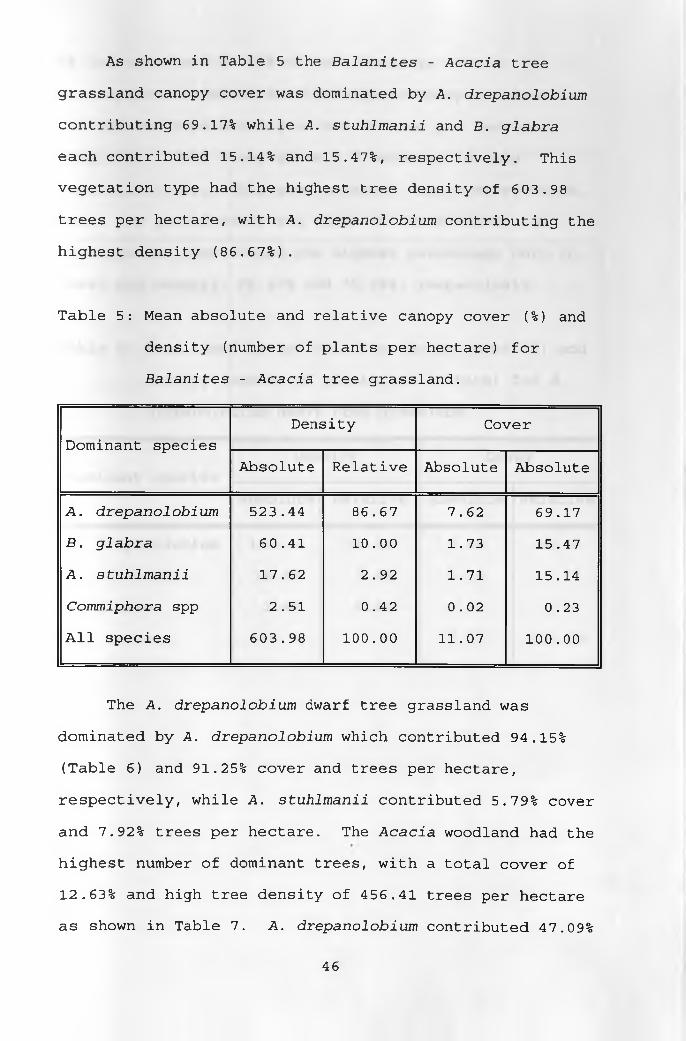
As shown in Table 5 the Balanites - Acacia tree
grassland canopy cover was dominated by A. drepanolobium
contributing 69.17% while A. stuhlmanii and B. glabra
each contributed 15.14% and 15.47%, respectively. This vegetation type had the highest tree density of 603.98
trees per hectare, with A. drepanolobium contributing the
highest density (86.67%).
Table 5: Mean absolute and relative canopy cover (%) and
density (number of plants per hectare) for
Balanites - Acacia tree grassland.
Dominant speciesDensity Cover
Absolute Relative Absolute Absolute
A . drepanolobi urn 523.44 86.67 7.62 69.17B. glabra 60.41 10.00 1.73 15.47A. stuhlmanii 17.62 2.92 1.71 15.14Commiphora spp 2.51 0.42 0.02 0.23All species 603.98 100.00 11.07 100.00
The A. drepanolobium dwarf tree grassland was
dominated by A . drepanolobium which contributed 94.15%
(Table 6) and 91.25% cover and trees per hectare,
respectively, while A. stuhlmanii contributed 5.79% cover
and 7.92% trees per hectare. The Acacia woodland had the
highest number of dominant trees, with a total cover of
12.63% and high tree density of 456.41 trees per hectare
as shown in Table 7. A. drepanolobium contributed 47.09%
46
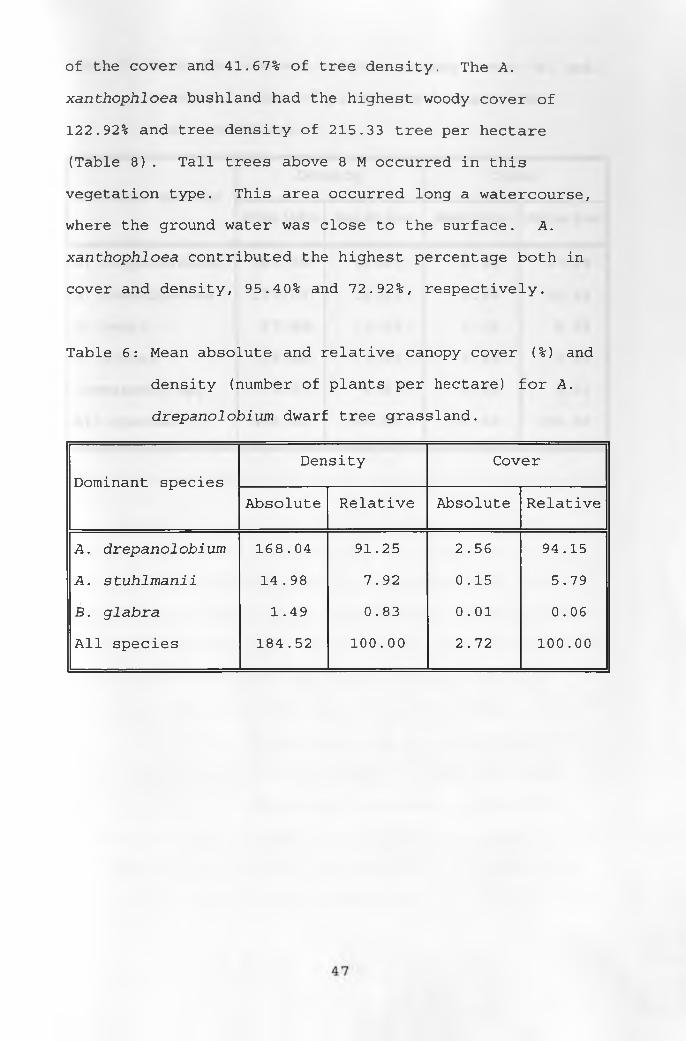
of the cover and 41.67% of tree density. The A.
xanthophloea bushland had the highest woody cover of
122.92% and tree density of 215.33 tree per hectare
(Table 8). Tall trees above 8 M occurred in this
vegetation type. This area occurred long a watercourse,
where the ground water was close to the surface. A.
xanthophloea contributed the highest percentage both in
cover and density, 95.40% and 72.92%, respectively.
Table 6: Mean absolute and relative canopy cover (%) and
density (number of plants per hectare) for A.
drepanolobium dwarf tree grassland.
Dominant speciesDensity Cover
Absolute Relative Absolute Relative
A . drepanolobi um 168.04 91.25 2.56 94.15
A. stuhlmanii 14.98 7.92 0.15 5.79
B. glabra 1.49 0.83 0.01 0.06
All species 184.52 100.00 2.72 100.00
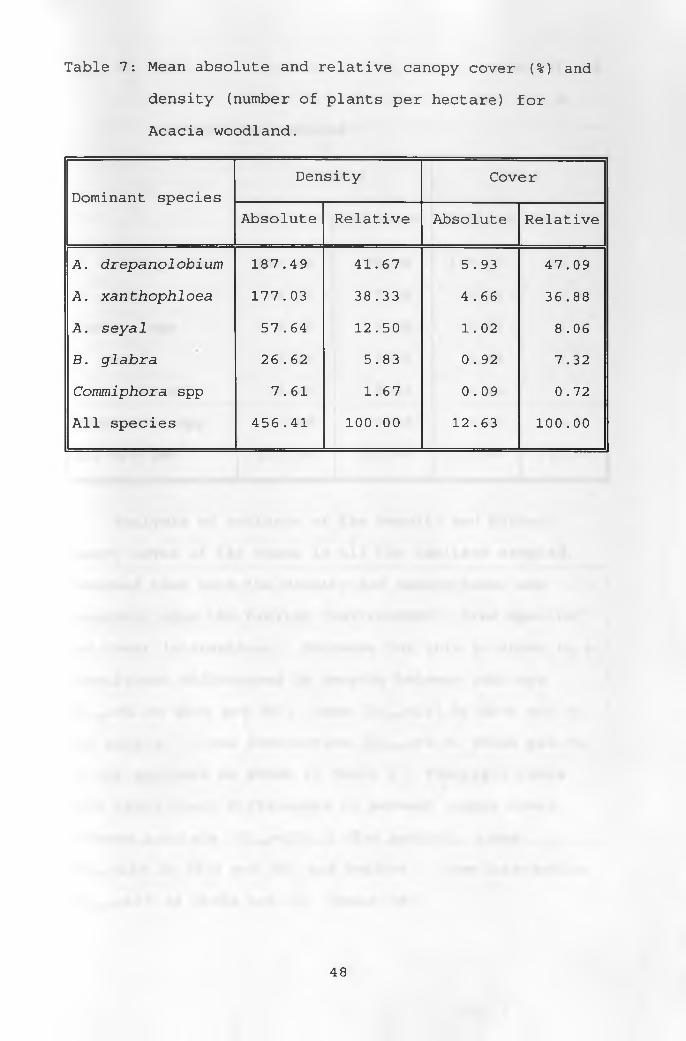
Table 7: Mean absolute and relative canopy cover (%) and
density (number of plants per hectare) for
Acacia woodland.
Dominant speciesDensity Cover
Absolute Relative Absolute Relative
A. drepanolobium 187.49 41.67 5.93 47.09
A . xanthophloea 177.03 38.33 4.66 36.88
A. seyal 57.64 12.50 1.02 8.06
B. glabra 26.62 5.83 0.92 7.32
Commiphora spp 7.61 1.67 0.09 0.72
All species 456.41 100.00 12.63 100.00
48
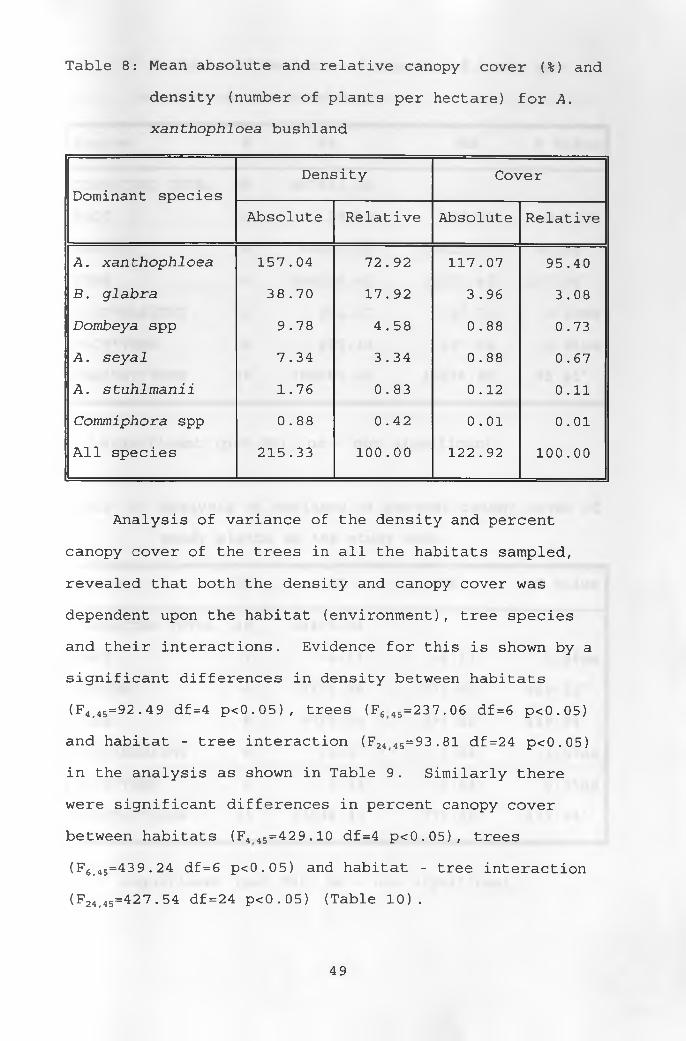
Table 8: Mean absolute and relative canopy cover (%) and
density (number of plants per hectare) for A . xanthophloea bushland
Dominant speciesDensity Cover
Absolute Relative Absolute Relative
A. xanthophloea 157.04 72.92 117.07 95.40B. glabra 38.70 17.92 3.96 3.08Dombeya spp 9.78 4.58 0.88 0.73A . seyal 7.34 3.34 0.88 0.67
A. stuhlmanii 1.76 0.83 0.12 0.11Commiphora spp 0.88 0.42 0.01 0.01All species 215.33 100.00 122.92 100.00
Analysis of variance of the density and percent
canopy cover of the trees in all the habitats sampled,
revealed that both the density and canopy cover was
dependent upon the habitat (environment), tree species
and their interactions. Evidence for this is shown by a
significant differences in density between habitats
(p4,45=92 • 49 df=4 p<0.05) , trees (F6 45=237.06 df = 6 p<0.05)
and habitat - tree interaction (F24 4 5 = 93.81 df=24 p<0.05)
in the analysis as shown in Table 9. Similarly there
were significant differences in percent canopy cover
between habitats (F4 45=429.10 df=4 p<0.05), trees
(F6,45=439.24 df=6 p<0.05) and habitat - tree interaction
(F24,45 = 4 2 7.54 df = 24 p<0.05) (Table 10).
49
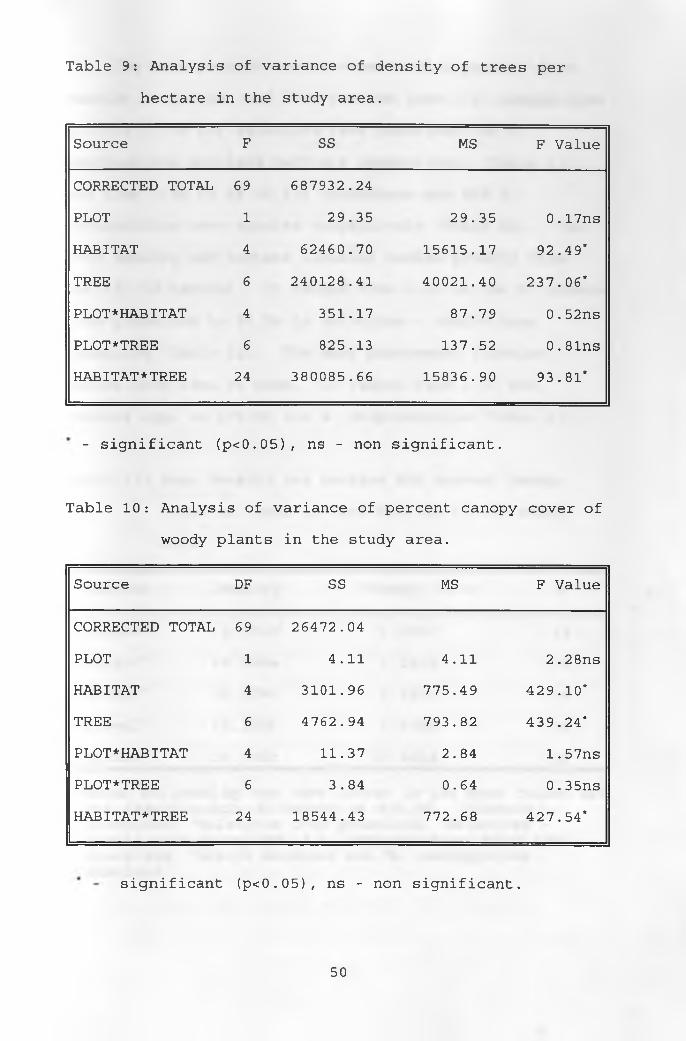
Table 9: Analysis of variance of density of trees per
hectare in the study area.
Source F SS MS F Value
CORRECTED TOTAL 69 687932.24
PLOT 1 29.35 29.35 0.17ns
HABITAT 4 62460.70 15615.17 92.49*
TREE 6 240128.41 40021.40 237.06*
PLOT*HABITAT 4 351.17 87.79 0.52nsPLOT*TREE 6 825.13 137.52 0.81nsHABITAT*TREE 24 380085.66 15836.90 93.81*
- significant (p<0. 05) , ns - non significant.
Table 10: Analysis of variance of percent canopy cover of
woody plants in the study area.
Source DF SS MS F Value
CORRECTED TOTAL 69 26472.04
PLOT 1 4.11 4.11 2.28nsHABITAT 4 3101.96 775.49 429.10*TREE 6 4762.94 793.82 439.24*PLOT*HABITAT 4 11.37 2.84 1.57nsPLOT*TREE 6 3.84 0.64 0.35nsHABITAT*TREE 24 18544.43 772.68 427.54*
significant (p<0.05), ns - non significant.
50
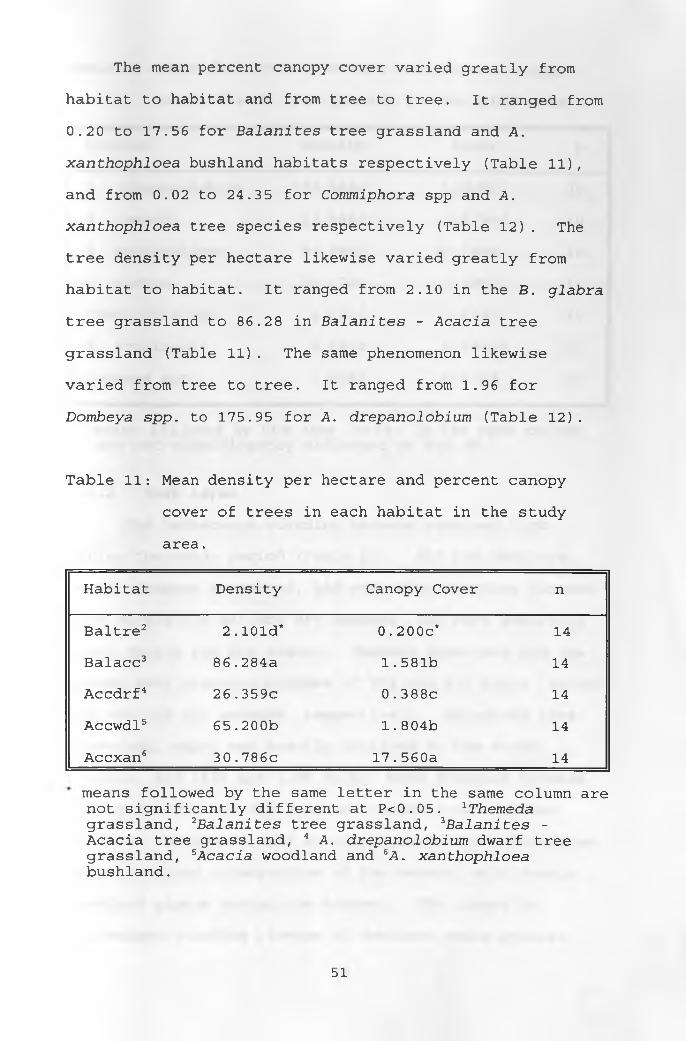
The mean percent canopy cover varied greatly from
habitat to habitat and from tree to tree. It ranged from
0.20 to 17.56 for Balanites tree grassland and A .
xanthophloea bushland habitats respectively (Table 11),
and from 0.02 to 24.35 for Commiphora spp and A.
xanthophloea tree species respectively (Table 12). The
tree density per hectare likewise varied greatly from
habitat to habitat. It ranged from 2.10 in the B. glabra
tree grassland to 86.28 in Balanites - Acacia tree
grassland (Table 11). The same phenomenon likewise
varied from tree to tree. It ranged from 1.96 for
Dombeya spp. to 175.95 for A. drepanolobium (Table 12).
Table 11: Mean density per hectare and percent canopy
cover of trees in each habitat in the study
area.
Habitat Density Canopy Cover n
Baltre2 2.10Id* 0.200c* 14Balacc3 86.284a 1.581b 14Accdrf4 26.359c 0 .388c 14
Accwdl5 65.200b 1.804b 14
Accxan6 30.786c 17.560a 14
means followed by the same letter in the same column are not significantly different at P<0.05. 1Themeda grassland, 2Balanites tree grassland, 3Balanites - Acacia tree grassland, 4 A. drepanolobium dwarf tree grassland, 5Acacia woodland and 6A. xanthophloea bushland.
51
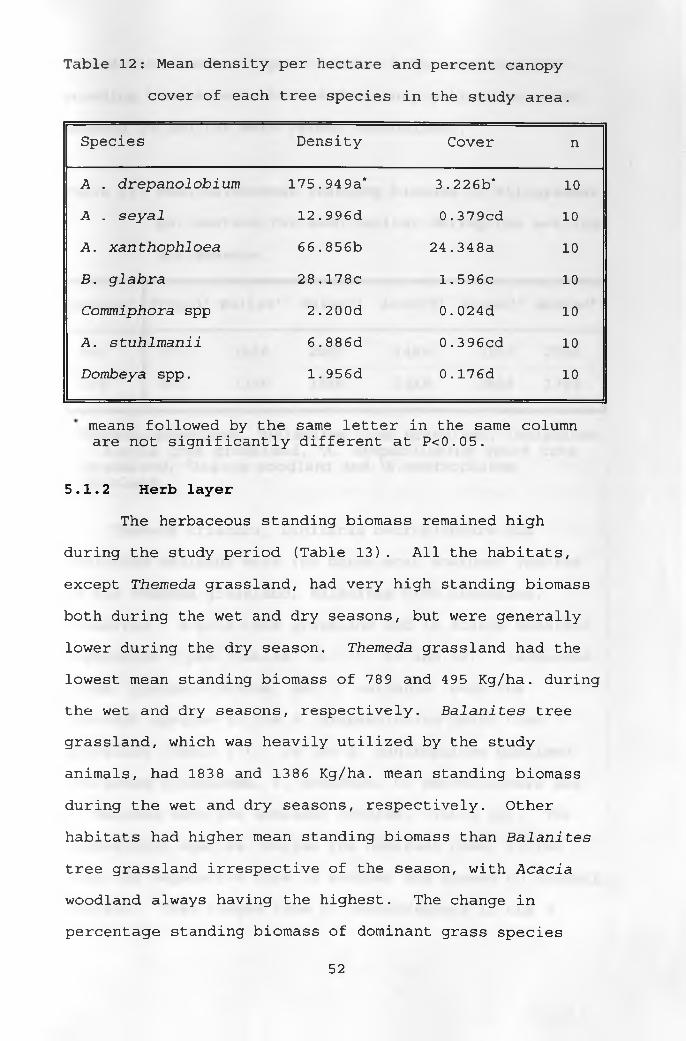
Table 12: Mean density per hectare and percent canopy
cover of each tree species in the study area.
Species Density Cover n
A . drepanolobium 175.949a* 3.226b* 10A . seyal 12.996d 0.379cd 10A. xanthophloea 66.856b 24.348a 10
B. glabra 28.178c 1.596c 10Commiphora spp 2.200d 0.024d 10A. stuhlmanii 6.886d 0.3 96cd 10
Dombeya spp. 1.956d 0.176d 10
means followed by the same letter in the same column are not significantly different at P<0.05.
5.1.2 Herb layerThe herbaceous standing biomass remained high
during the study period (Table 13). All the habitats,
except Themeda grassland, had very high standing biomass
both during the wet and dry seasons, but were generally
lower during the dry season. Themeda grassland had the
lowest mean standing biomass of 789 and 495 Kg/ha. during
the wet and dry seasons, respectively. Balanites tree
grassland, which was heavily utilized by the study
animals, had 1838 and 1386 Kg/ha. mean standing biomass
during the wet and dry seasons, respectively. Other
habitats had higher mean standing biomass than Balanites
tree grassland irrespective of the season, with Acacia
woodland always having the highest. The change in
percentage standing biomass of dominant grass species
52
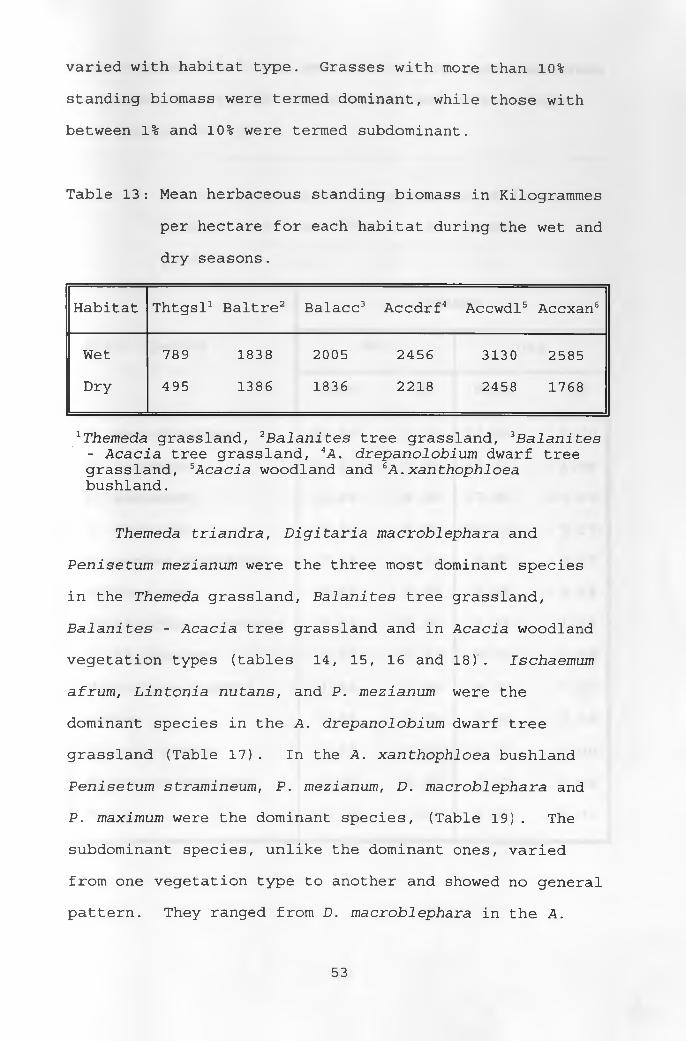
varied with habitat type. Grasses with more than 10%
standing biomass were termed dominant, while those with
between 1% and 10% were termed subdominant.
Table 13: Mean herbaceous standing biomass in Kilogrammes
per hectare for each habitat during the wet and
dry seasons.
Habitat Thtgsl1 Baltre2 Balacc3 Accdrf4 Accwdl5 Accxan6
Wet 789 1838 2005 2456 3130 2585Dry 495 1386 1836 2218 2458 1768
1Themeda grassland, 2Balanites tree grassland, 3Balanites - Acacia tree grassland, 4A. drepanolobium dwarf tree grassland, 5Acacia woodland and 6A. xanthophloea bushland.
Themeda triandra, Digitaria macroblephara and
Penisetum mezianum were the three most dominant species
in the Themeda grassland, Balanites tree grassland,
Balanites - Acacia tree grassland and in Acacia woodland
vegetation types (tables 14, 15, 16 and 18)'. Ischaemum
afrum, Lintonia nutans, and P. mezianum were the
dominant species in the A. drepanolobium dwarf tree
grassland (Table 17). In the A. xanthophloea bushland
Penisetum stramineum, P. mezianum, D. macroblephara and
P. maximum were the dominant species, (Table 19) . The
subdominant species, unlike the dominant ones, varied
from one vegetation type to another and showed no general
pattern. They ranged from D. macroblephara in the A.
53
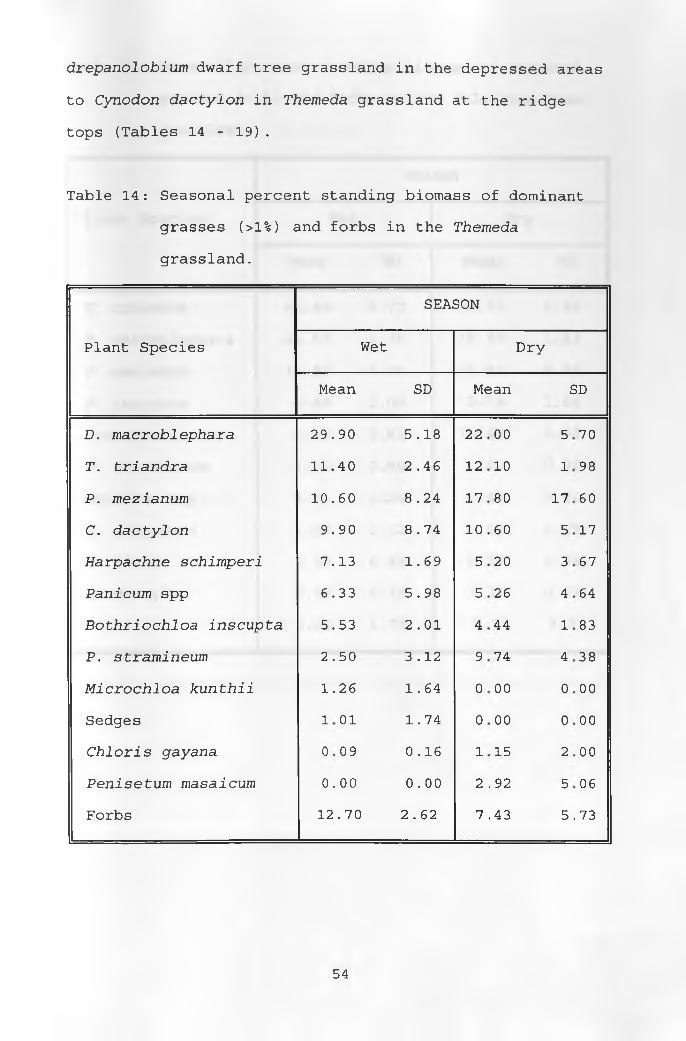
drepanolobium dwarf tree grassland in the depressed areas
to Cynodon dactylon in Themeda grassland at the ridge
tops (Tables 14 - 19) .
Table 14: Seasonal percent standing biomass of dominant
grasses (>1%) and forbs in the Themeda
grassland.
SEASON
Plant Species Wet Dry
Mean SD Mean SD
D. macroblephara 29 .90 5 .18 22 00 5 70
T. triandra 11. 40 2 .46 12 10 1 98
P. mezianum 10. 60 8 .24 17 80 17 60
C. dactylon 9. 90 8 . 74 10 60 5 17
Harpachne schimperi 7. 13 1 .69 5 20 3 67
Panicum spp 6 .33 5 . 98 5 26 4 64
Bothriochloa inscupta 5.53 2 . 01 4 44 1 83
P. stramineum 2. 50 3 .12 9 74 4 38
Microchloa kunthii 1.26 1 .64 0 00 0 00
Sedges 1 01 1 . 74 0 00 0 00
Chi oris gayana 0 09 0 .16 1 15 2 00
Penisetum masaicum 0. 00 0 .00 2 .92 5 06
Forbs 12 .70 2 .62 7 .43 5 .73
54
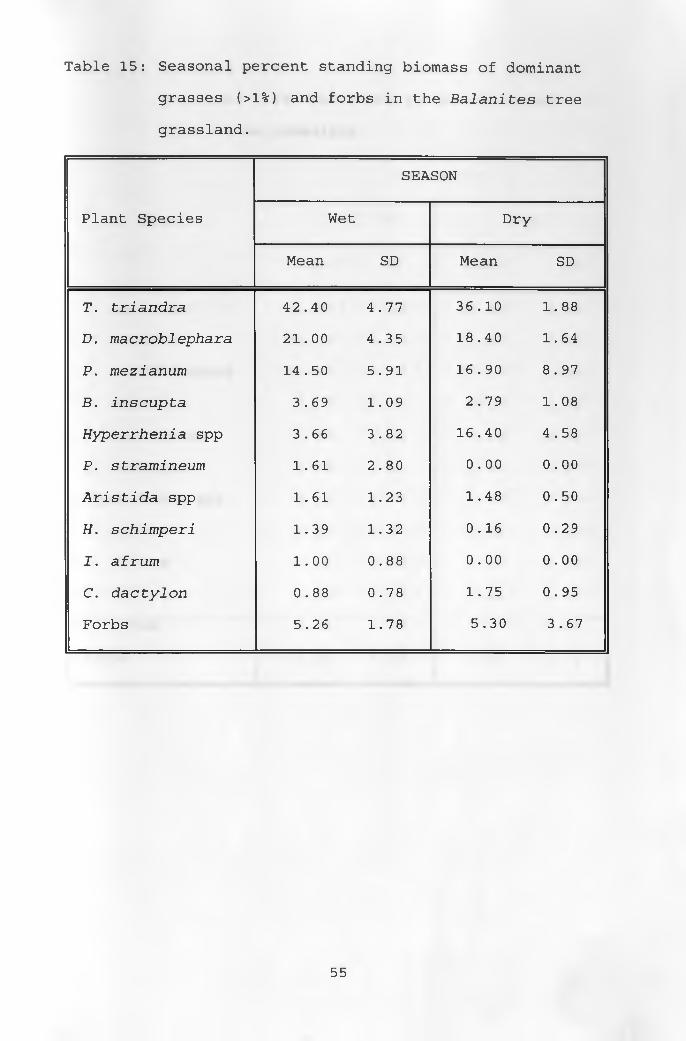
Table 15: Seasonal percent standing biomass of dominant
grasses (>1%) and forbs in the Balanites tree
grassland.
Plant Species
SEASON
Wet Dry
Mean SD Mean SD
T. triandra 42.40 4.77 36.10 1.88
D . macroblephara 21.00 4.35 18.40 1.64
P. mezianum 14.50 5.91 16.90 8.97
B. inscupta 3.69 1.09 2.79 1.08
Hyperrhenia spp 3.66 3.82 16.40 4.58
P. stramineum 1.61 2.80 0.00 0.00
Aristida spp 1.61 1.23 1.48 0.50
H. schimperi 1.39 1.32 0.16 0.29
I. afrum 1.00 0.88 0.00 0.00
C. dactylon 0.88 0.78 1.75 0.95
Forbs 5.26 1.78 5.30 3.67
55
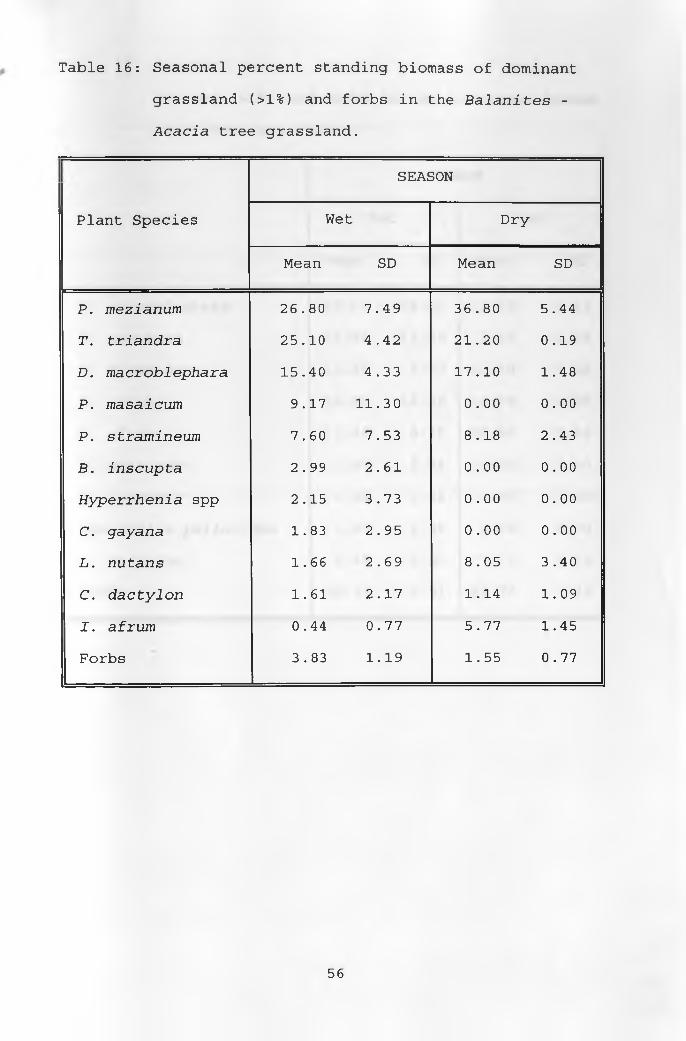
Table 16: Seasonal percent standing biomass of dominant
grassland (>1%) and forbs in the Balanites -
Acacia tree grassland.
Plant Species
SEASON
Wet Dry
Mean SD Mean SD
P. mezianum 26.80 7.49 36.80 5.44
T. triandra 25.10 4.42 21.20 0.19
D. macroblephara 15.40 4.33 17.10 1.48
P. masaicum 9.17 11.30 0.00 0.00
P. stramineum 7.60 7.53 8.18 2.43
B. inscupta 2.99 2.61 0.00 0.00
Hyperrhenia spp 2.15 3.73 0.00 0.00
C . gayana 1.83 2.95 0.00 0.00
L. nutans 1.66 2.69 8.05 3.40
C. dactylon 1.61 2.17 1.14 1.09
I. afrum 0.44 0.77 5.77 1.45
Forbs 3.83 1.19 1.55 0.77
56
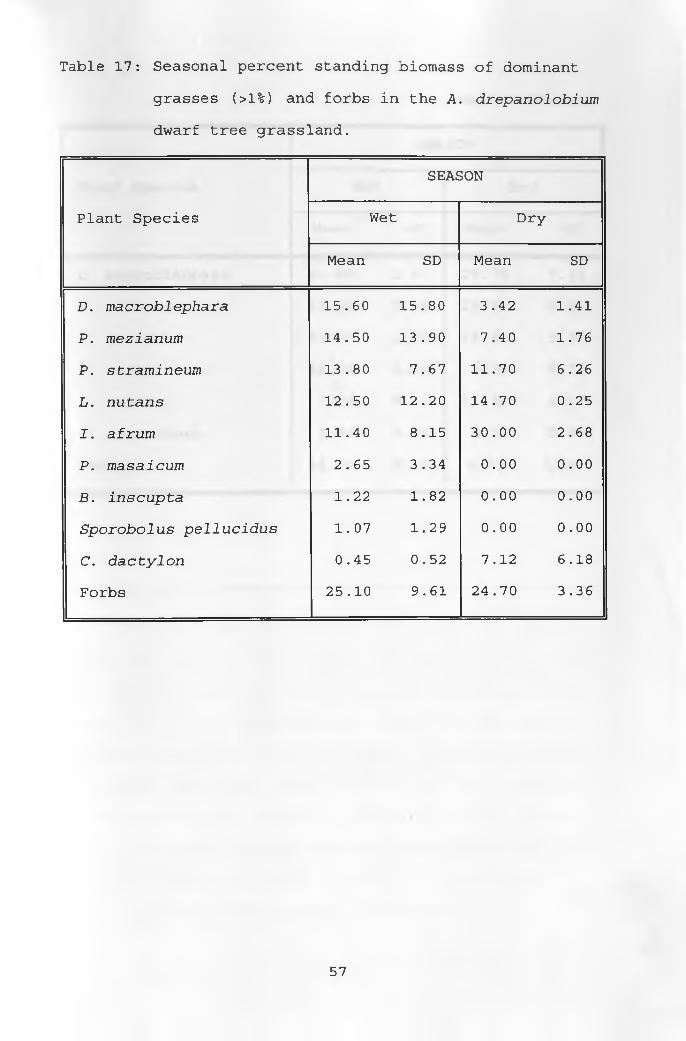
Table 17: Seasonal percent standing biomass of dominant
grasses (>1%) and forbs in the A. drepanolobium
dwarf tree grassland.
Plant Species
SEASON
Wet Dry
Mean SD Mean SD
D. macroblephara 15.60 15.80 3.42 1.41
P. mezianum 14.50 13.90 7.40 1.76
P. stramineum 13.80 7.67 11.70 6.26
L. nutans 12.50 12.20 14.70 0.25
I. afrum 11.40 8.15 30.00 2.68
P. masaicum 2.65 3.34 0.00 0.00
B. inscupta 1.22 1.82 0.00 0.00
Sporobolus pellucidus 1.07 1.29 0.00 0.00
C. dactylon 0.45 0.52 7.12 6.18
Forbs 25.10 9.61 24.70 3.36
57
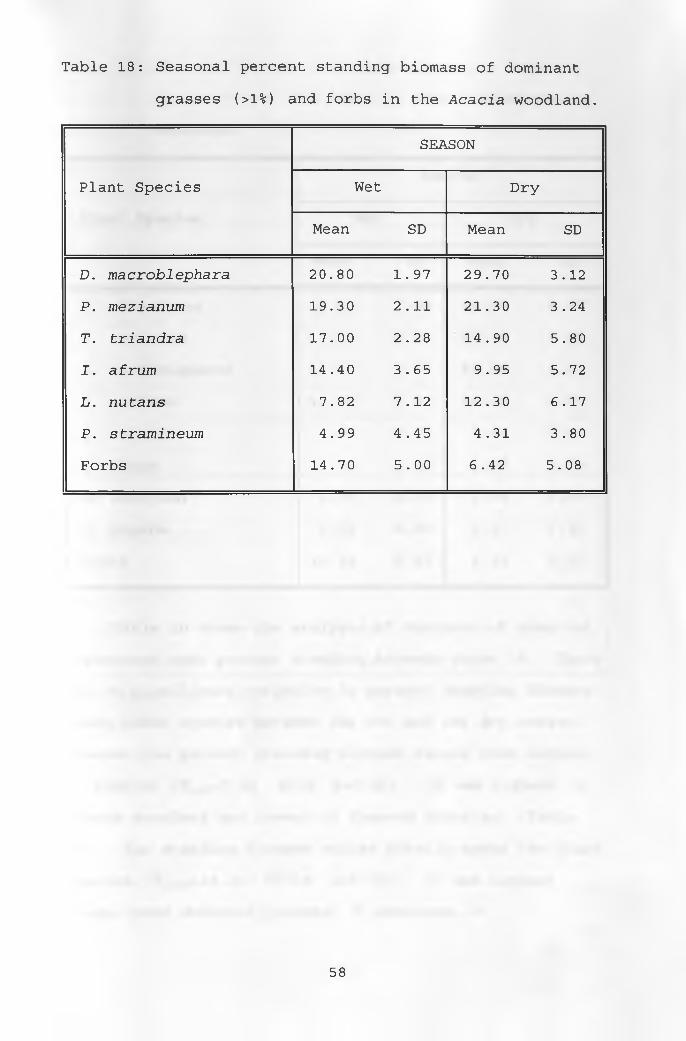
Table 18: Seasonal percent standing biomass of dominant
grasses (>1%) and forbs in the Acacia woodland.
Plant Species
SEASON
Wet Dry
Mean SD Mean SD
D. macroblephara 20.80 1.97 29.70 3.12
P. mezianum 19.30 2.11 21.30 3.24
T. triandra 17.00 2.28 14.90 5.80
I . afrum 14.40 3.65 9.95 5.72
L. nutans 7.82 7.12 12.30 6.17
P. stramineum 4.99 4.45 4.31 3.80
Forbs 14.70 5.00 6.42 5.08
58
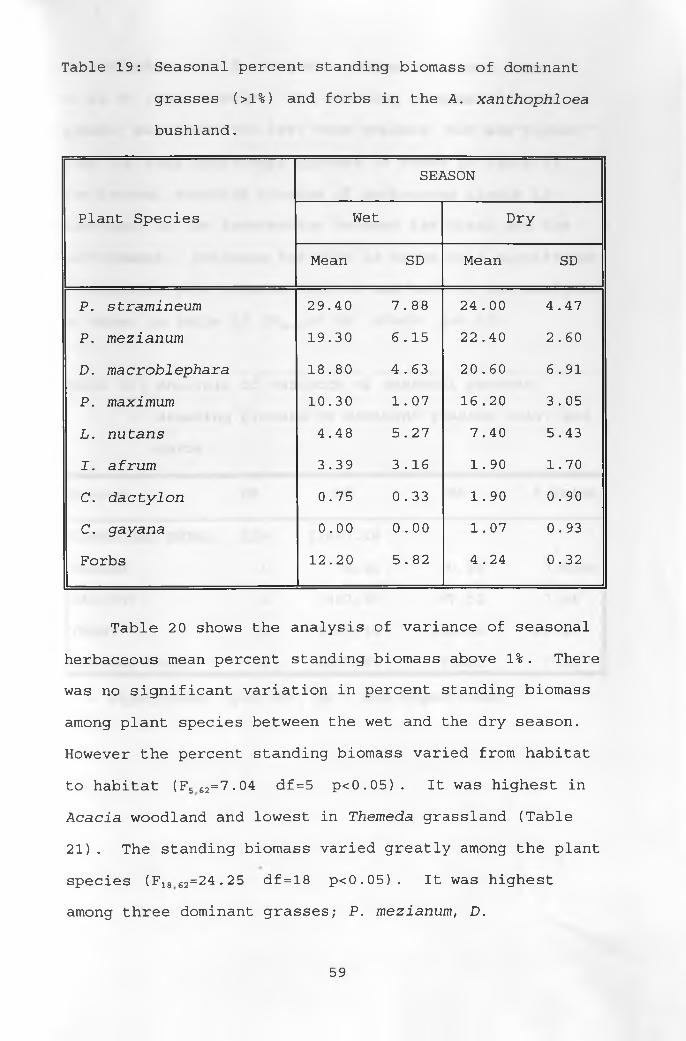
Table 19: Seasonal percent standing biomass of dominant
grasses (>1%) and forbs in the A. xanthophloea
bushland.
Plant Species
SEASON
Wet Dry
Mean SD Mean SD
P. stramineum 29.40 7.88 24.00 4.47
P. mezianum 19.30 6.15 22.40 2.60
D. macroblephara 18.80 4.63 20.60 6.91
P. maximum 10.30 1.07 16.20 3.05
L. nutans 4.48 5.27 7.40 5.43
I. afrum 3.39 3.16 1.90 1.70
C. dactylon 0.75 0.33 1.90 0.90
C. gayana 0.00 0.00 1.07 0.93
Forbs 12.20 5.82 4.24 0.32
Table 20 shows the analysis of variance of seasonal
herbaceous mean percent standing biomass above 1%. There
was no significant variation in percent standing biomass
among plant species between the wet and the dry season.
However the percent standing biomass varied from habitat
to habitat (F5 62=7.04 df=5 p<0.05) . It was highest in
Acacia woodland and lowest in Themeda grassland (Table
21) . The standing biomass varied greatly among the plant
species (F1862=24.25 df = 18 p<0.05). It was highest
among three dominant grasses; P. mezianum, D.
59
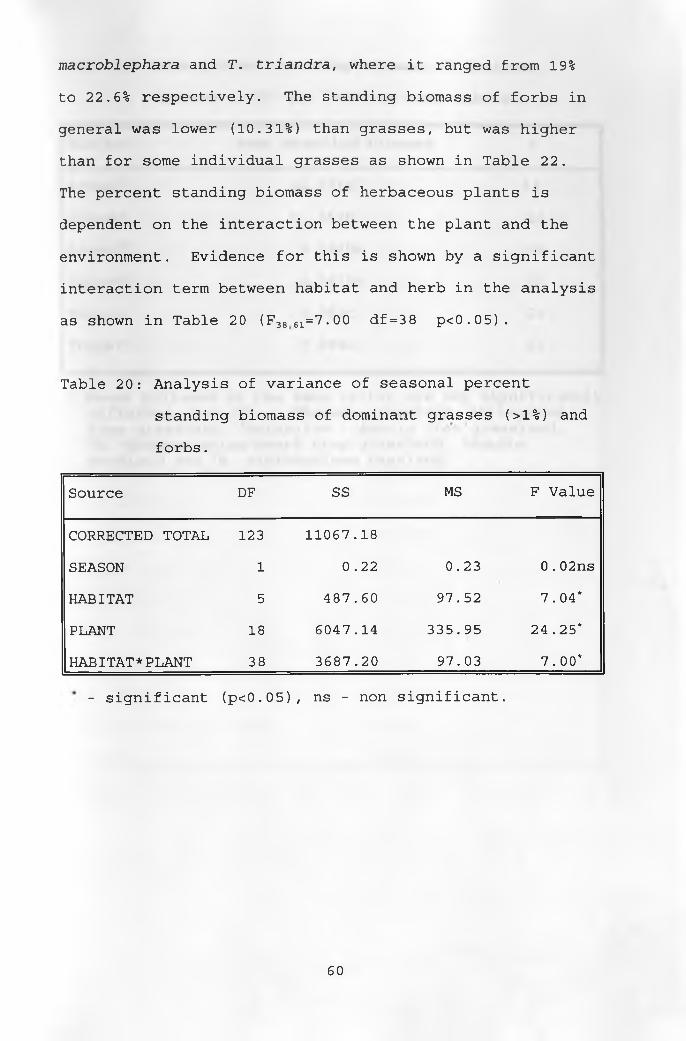
macroblephara and T. triandra, where it ranged from 19%
to 22.6% respectively. The standing biomass of forbs in
general was lower (10.31%) than grasses, but was higher
than for some individual grasses as shown in Table 22.
The percent standing biomass of herbaceous plants is
dependent on the interaction between the plant and the
environment. Evidence for this is shown by a significant
interaction term between habitat and herb in the analysis
as shown in Table 20 (F38 61=7.00 df=38 p<0.05).
Table 20: Analysis of variance of seasonal percent
standing biomass of dominant grasses (>1%) and
forbs.
Source DF SS MS F Value
CORRECTED TOTAL 123 11067.18
SEASON 1 0.22 0.23 0.02ns
HABITAT 5 487.60 97.52 7.04*
PLANT 18 6047.14 335.95 24.25*
HABITAT*PLANT 38 3687.20 97.03 7.00*
- significant (p<0.05) , ns - non significant.
60
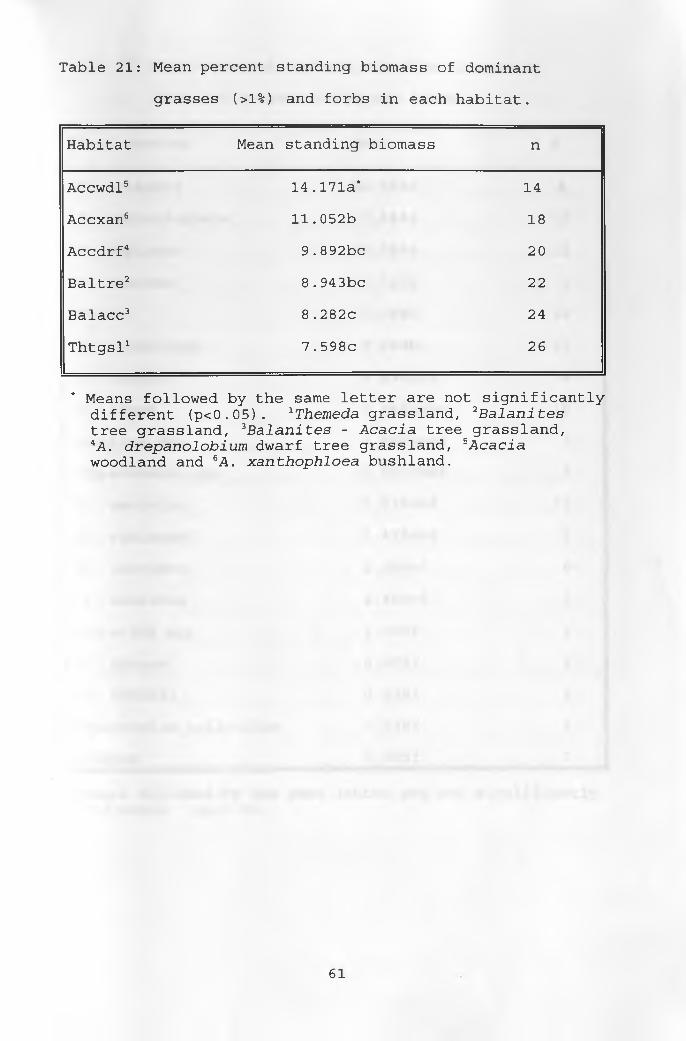
Table 21: Mean percent standing biomass of dominant
grasses (>1%) and forbs in each habitat.
Habitat Mean standing biomass n
Accwdl5 14.171a* 14
Accxan6 11.052b 18
Accdrf4 9.892bc 20
Baltre2 8.943bc 22
Balacc3 8.282c 24
Thtgsl1 7.598c 26
* Means followed by the same letter are not significantly different (p<0.05). 1Themeda grassland, 2Balanites tree grassland, 3Balanites - Acacia tree grassland,4A. drepanolobium dwarf tree grassland, 5Acacia woodland and eA. xanthophloea bushland.
61
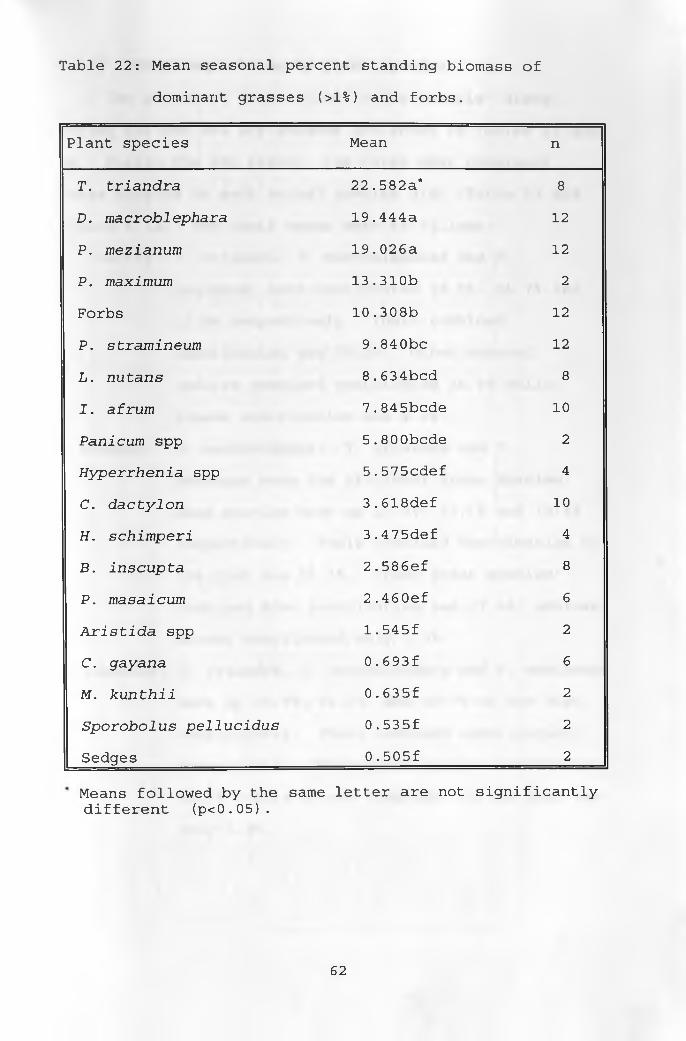
Table 22: Mean seasonal percent standing biomass of
dominant grasses (>1%) and forbs.
Plant species Mean n
T. triandra 22.582a* 8
D . macroblephara 19.444a 12
P. mezianum 19.026a 12
P . maximum 13.310b 2
Forbs 10.308b 12
P. stramineum 9.84 Obc 12
L. nutans 8.634bcd 8
I. afrum 7.845bcde 10
Panicum spp 5.800bcde 2
Hyperrhenia spp 5.575cdef 4
C. dactylon 3.618def 10
H. schimperi 3.475def 4
B. inscupta 2.586ef 8
P. masaicum 2.460ef 6
Aristida spp 1.545f 2
C . gayana 0.693f 6
M. kunthii 0.635f 2
Sporobolus pellucidus 0.535f 2
Sedges 0.505f 2
Means followed by the same letter are not significantlydifferent (p<0.05).
62
5.1.3 Diet composition by plant speciesThe botanical composition in the animals' diets
during the wet and dry seasons are shown in Tables 23 and
24. During the wet season, the three most prominent
grass species in each animal species diet (Table 23 and
Figure 4 (A)) and their means were as follows:
Cattle: T. triandra, D. macroblephara and P.
mezianum, each contributed 29.5%, 24.7% and
15.9% respectively. Their combined
contribution was 70.2%. Other monocot
species combined contributed 25.8% while
browse contribution was 4.0%.
Kongoni: D. macroblephara, T. triandra and P.
mezianum were the prominent grass species.
Each species made up 20.8%, 21.1% and 19.4%
respectively. Their combined contribution to
the diet was 61.3%. Other grass species'
combined diet contribution was 37.4%, whereas
browse contributed only 1.2%.
Wildebeest: T. triandra, D. macroblephara and P. mezianum
made up 23.7%, 21.1%, and 18.7% of the diet
respectively. Their combined contribution
being 63.4%. Other grass species contributed
34.7% while browse component of the diet was
only 1.9%.
63
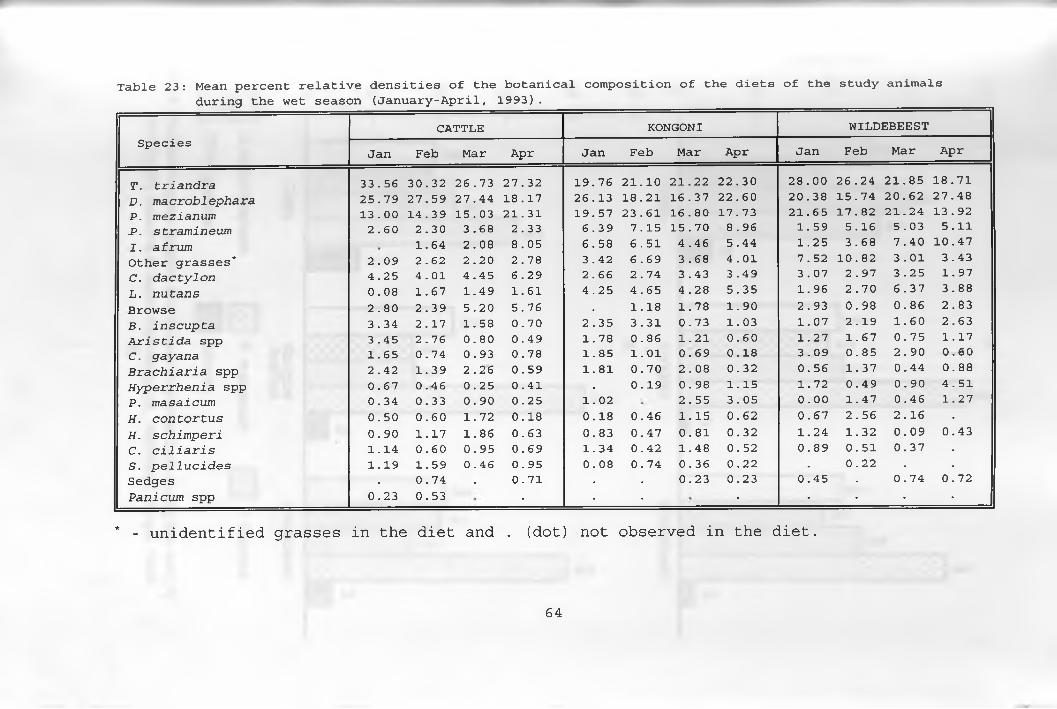
Table 23: Mean percent relative densities of the botanical composition of the diets of the study animals during the wet season (January-April, 1993) ._____________________________________________________
SpeciesCATTLE KONGONI WILDEBEEST
Jan Feb Mar Apr Jan Feb Mar Apr Jan Feb Mar Apr
T. triandra 33.56 30.32 26.73 27.32 19.76 21.10 21.22 22.30 28.00 26.24 21.85 18.71D. macroblephara 25.79 27.59 27.44 18.17 26.13 18.21 16.37 22.60 20.38 15.74 20.62 27.48P. mezianum 13.00 14.39 15.03 21.31 19.57 23.61 16.80 17.73 21.65 17.82 21.24 13.92i3. stramineum 2.60 2.30 3.68 2.33 6.39 7.15 15.70 8.96 1.59 5.16 5.03 5.11I. afrum 1.64 2.08 8.05 6.58 6.51 4.46 5.44 1.25 3.68 7.40 10.47Other grasses* 2.09 2.62 2.20 2.78 3.42 6.69 3.68 4.01 7.52 10.82 3.01 3.43C. dactylon 4.25 4.01 4.45 6.29 2.66 2.74 3.43 3.49 3.07 2.97 3.25 1.97L. nutans 0.08 1.67 1.49 1.61 4.25 4.65 4.28 5.35 1.96 2.70 6.37 3.88Browse 2.80 2.39 5.20 5.76 • 1.18 1.78 1.90 2.93 0.98 0.86 2.83B. inscupta 3.34 2.17 1.58 0.70 2.35 3.31 0.73 1.03 1.07 2.19 1.60 2.63Aristida spp 3.45 2.76 0.80 0.49 1.78 0.86 1.21 0.60 1.27 1.67 0.75 1.17C. gayana 1.65 0.74 0.93 0.78 1.85 1.01 0.69 0.18 3.09 0.85 2.90 0.60Brachiaria spp 2.42 1.39 2.26 0.59 1.81 0.70 2.08 0.32 0.56 1.37 0.44 0.88Hyperrhenia spp 0.67 0.46 0.25 0.41 • 0.19 0.98 1.15 1.72 0.49 0.90 4.51P. masaicum 0.34 0.33 0.90 0.25 1.02 2.55 3.05 0.00 1.47 0.46 1.27H. contortus 0.50 0.60 1.72 0.18 0.18 0.46 1.15 0.62 0.67 2.56 2.16 •H. schimperi 0.90 1.17 1.86 0.63 0.83 0.47 0.81 0.32 1.24 1.32 0.09 0.43C. ciliaris 1.14 0.60 0.95 0.69 1.34 0.42 1.48 0.52 0.89 0.51 0.37 •S. pellucides 1.19 1.59 0.46 0.95 0.08 0.74 0.36 0.22 • 0.22 . •Sedges . 0.74 . 0.71 . . 0.23 0.23 0.45 • 0.74 0.72Panicum spp 0.23 0.53 • • • • • • • •
* - unidentified grasses in the diet and . (dot) not observed in the diet.
64
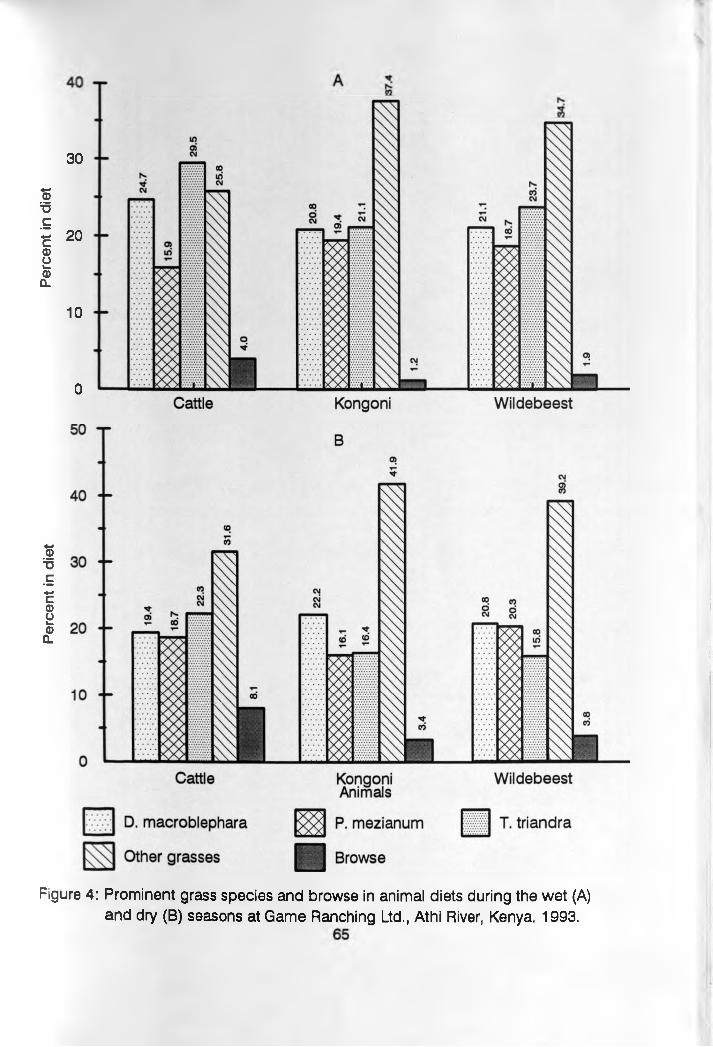
Per
cent
in d
iet
Per
cent
in d
iet
30
20
10
0
Figure 4: Prominent grass species and browse in animal diets during the wet (A) and dry (B) seasons at Game Ranching Ltd., Athi River, Kenya. 1993.
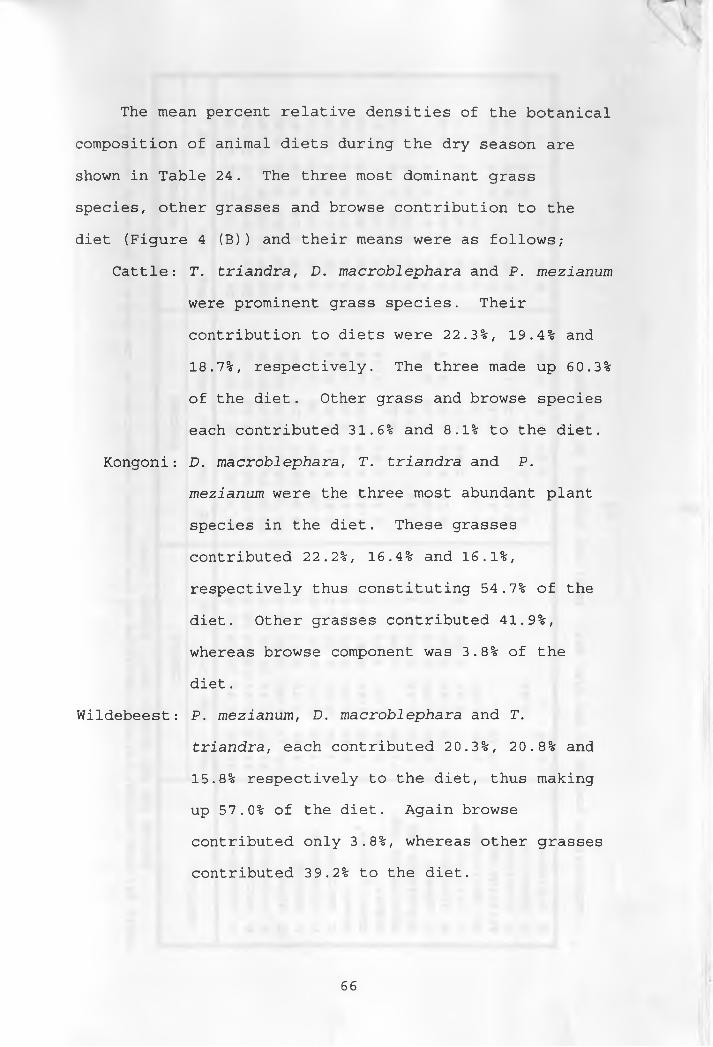
The mean percent relative densities of the botanical
composition of animal diets during the dry season are
shown in Table 24. The three most dominant grass
species, other grasses and browse contribution to the
diet (Figure 4 (B)) and their means were as follows;
Cattle: T. triandra, D. macroblephara and P. mezianum
were prominent grass species. Their
contribution to diets were 22.3%, 19.4% and
18.7%, respectively. The three made up 60.3%
of the diet. Other grass and browse species
each contributed 31.6% and 8.1% to the diet.
Kongoni: D. macroblephara, T. triandra and P.
mezianum were the three most abundant plant
species in the diet. These grasses
contributed 22.2%, 16.4% and 16.1%,
respectively thus constituting 54.7% of the
diet. Other grasses contributed 41.9%,
whereas browse component was 3.8% of the
diet.
Wildebeest: P. mezianum, D. macroblephara and T.
triandra, each contributed 20.3%, 20.8% and
15.8% respectively to the diet, thus making
up 57.0% of the diet. Again browse
contributed only 3.8%, whereas other grasses
contributed 39.2% to the diet.
66
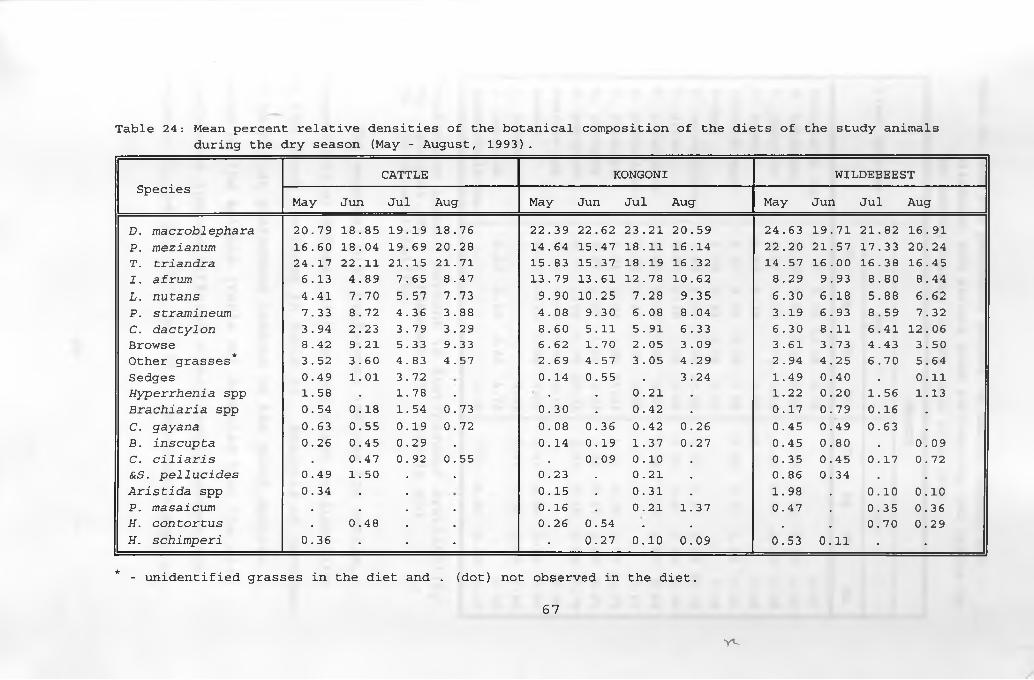
Table 24: Mean percent relative densities of the botanical composition of the diets of the study animalsduring the dry season (May - August, 1993).
SpeciesCATTLE KONGONI WILDEBEEST
May Jun Jul Aug May Jun Jul Aug May Jun Jul AugD. macroblephara 20.79 18.85 19.19 18.76 22.39 22.62 23.21 20.59 24.63 19.71 21.82 16.91P. mezianum 16.60 18.04 19.69 20.28 14.64 15.47 18.11 16.14 22.20 21.57 17.33 20.24T. triandra 24.17 22.11 21.15 21.71 15.83 15.37 18.19 16.32 14.57 16.00 16.38 16.45I. afrum 6.13 4.89 7.65 8.47 13.79 13.61 12.78 10.62 8.29 9.93 8.80 8.44L. nutans 4.41 7.70 5.57 7.73 9.90 10.25 7.28 9.35 6.30 6.18 5.88 6.62P. stramineum 7.33 8.72 4.36 3.88 4.08 9.30 6.08 8.04 3.19 6.93 8.59 7.32C. dactylon 3.94 2.23 3.79 3.29 8.60 5.11 5.91 6.33 6.30 8.11 6.41 12.06Browse 8.42 9.21 5.33 9.33 6.62 1.70 2.05 3.09 3.61 3.73 4.43 3.50Other grasses* 3.52 3.60 4.83 4.57 2.69 4.57 3.05 4.29 2.94 4.25 6.70 5.64Sedges 0.49 1.01 3.72 0.14 0.55 . 3.24 1.49 0.40 • 0.11Hyperrhenia spp 1.58 . 1.78 • . . 0.21 • 1.22 0.20 1.56 1.13Brachiaria spp 0.54 0.18 1.54 0.73 0.30 . 0.42 . 0.17 0.79 0.16 .C. gayana 0.63 0.55 0.19 0.72 0.08 0.36 0.42 0.26 0.45 0.49 0.63 •B. inscupta 0.26 0.45 0.29 . 0.14 0.19 1.37 0.27 0.45 0.80 . 0.09C. ciliaris . 0.47 0.92 0.55 . 0.09 0.10 • 0.35 0.45 0.17 0.72&S. pellucides 0.49 1.50 . . 0.23 . 0.21 . 0.86 0.34 . .Aristida spp 0.34 . . 0.15 . 0.31 . 1.98 • 0.10 0.10P. masaicum . . . . 0.16 • 0.21 1.37 0.47 • 0.35 0.36H. contortus . 0.48 . . 0.26 0.54 . • • • 0.70 0.29H. schimperi 0.36 • • • • 0.27 0.10 0.09 0.53 0.11 • •
* - unidentified grasses in the diet and . (dot) not observed in the diet.
67
y v
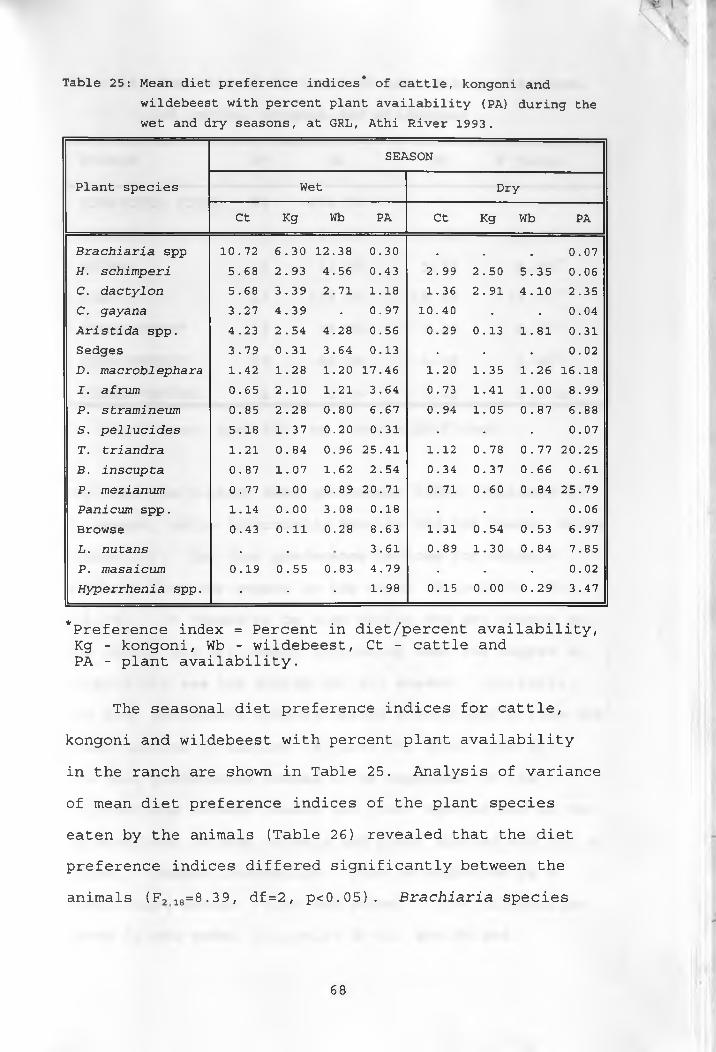
Table 25: Mean diet preference indices* of cattle, kongoni andwildebeest with percent plant availability (PA) during the wet and dry seasons, at GRL, Athi River 1993.
Plant species
SEASONWet Dry
Ct Kg Wb PA Ct Kg Wb PA
Brachiaria spp 10.72 6.30 12.38 0.30 # . # 0.07H. schimperi 5.68 2.93 4.56 0.43 2.99 2.50 5.35 0.06C. dactylon 5.68 3.39 2.71 1.18 1.36 2.91 4.10 2.35C. gayana 3.27 4.39 • 0.97 10.40 • . 0.04Aristida spp. 4.23 2.54 4.28 0.56 0.29 0.13 1.81 0.31Sedges 3.79 0.31 3.64 0.13 • • • 0.02D . macrohlephara 1.42 1.28 1.20 17.46 1.20 1.35 1.26 16.18I. afrum 0.65 2.10 1.21 3.64 0.73 1.41 1.00 8.99P. stramineum 0.85 2.28 0.80 6.67 0.94 1.05 0.87 6.88S. pellucides 5.18 1.37 0.20 0.31 . . . 0.07T. triandra 1.21 0.84 0.96 25.41 1.12 0.78 0.77 20.25B. inscupta 0.87 1.07 1.62 2.54 0.34 0.37 0.66 0.61P. mezianum 0.77 1.00 0.89 20.71 0.71 0.60 0.84 25.79Panicum spp. 1.14 0.00 3.08 0.18 • • • 0.06Browse 0.43 0.11 0.28 8.63 1.31 0.54 0.53 6.97L. nutans . . 3.61 0.89 1.30 0.84 7.85P. masaicum 0.19 0.55 0.83 4.79 . • • 0.02Hyperrhenia spp. • • • 1.98 0.15 0.00 0.29 3.47
*Preference index = Percent in diet/percent availability, Kg - kongoni, Wb - wildebeest, Ct - cattle and PA - plant availability.
The seasonal diet preference indices for cattle,
kongoni and wildebeest with percent plant availability
in the ranch are shown in Table 25. Analysis of variance
of mean diet preference indices of the plant species
eaten by the animals (Table 26) revealed that the diet
preference indices differed significantly between the
animals (F218=8.39, df=2, p<0.05). Brachiaria species
68
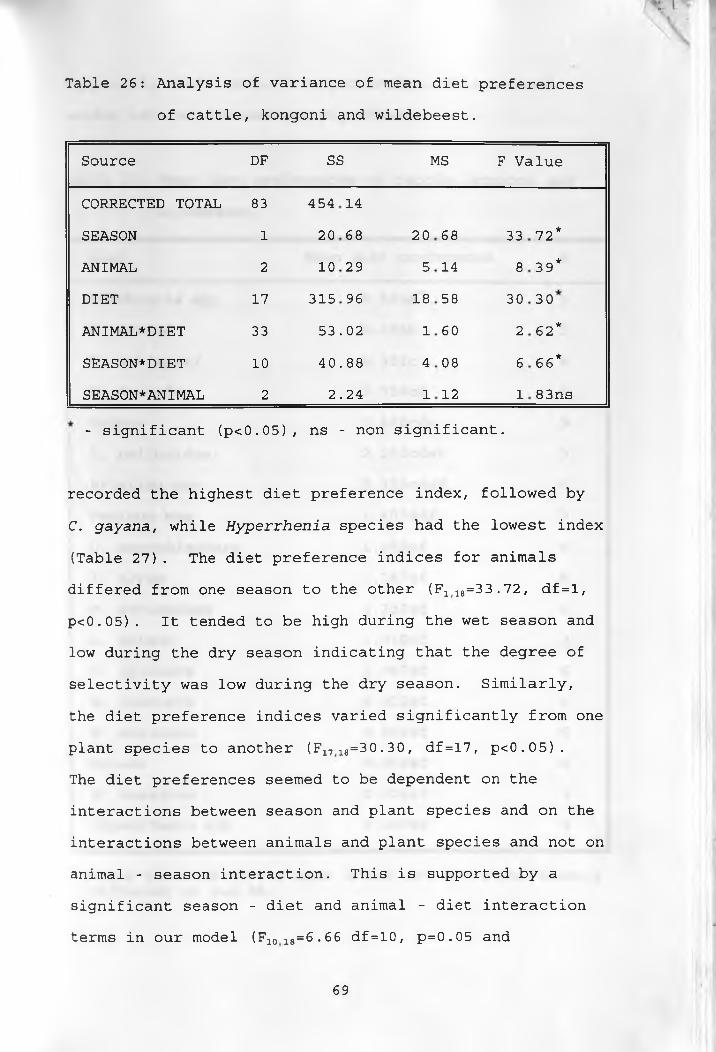
*
Table 26: Analysis of variance of mean diet preferences
of cattle, kongoni and wildebeest.
Source DF SS MS F Value
CORRECTED TOTAL 83 454 14
SEASON 1 20 68 20 68 33 72*
ANIMAL 2 10 29 5 14 8 39*
DIET 17 315 96 18 58 30 30
ANIMAL*DIET 33 53 .02 1 60 2 62*
SEASON*DIET 10 40 .88 4 08 6 66*
SEASON* ANIMAL 2 2 .24 1 12 1 83ns
- significant (p<0.05), ns - non significant.
recorded the highest diet preference index, followed by
C. gayana, while Hyperrhenia species had the lowest index
(Table 27). The diet preference indices for animals
differed from one season to the other (Flie=33.72, df = l,
p<0.05). It tended to be high during the wet season and
low during the dry season indicating that the degree of
selectivity was low during the dry season. Similarly,
the diet preference indices varied significantly from one
plant species to another (F17 18=30.30 , df=17, p<0.05).
The diet preferences seemed to be dependent on the
interactions between season and plant species and on the
interactions between animals and plant species and not on
animal - season interaction. This is supported by a
significant season - diet and animal - diet interaction
terms in our model (F1018=6.66 df = 10, p=0.05 and
69
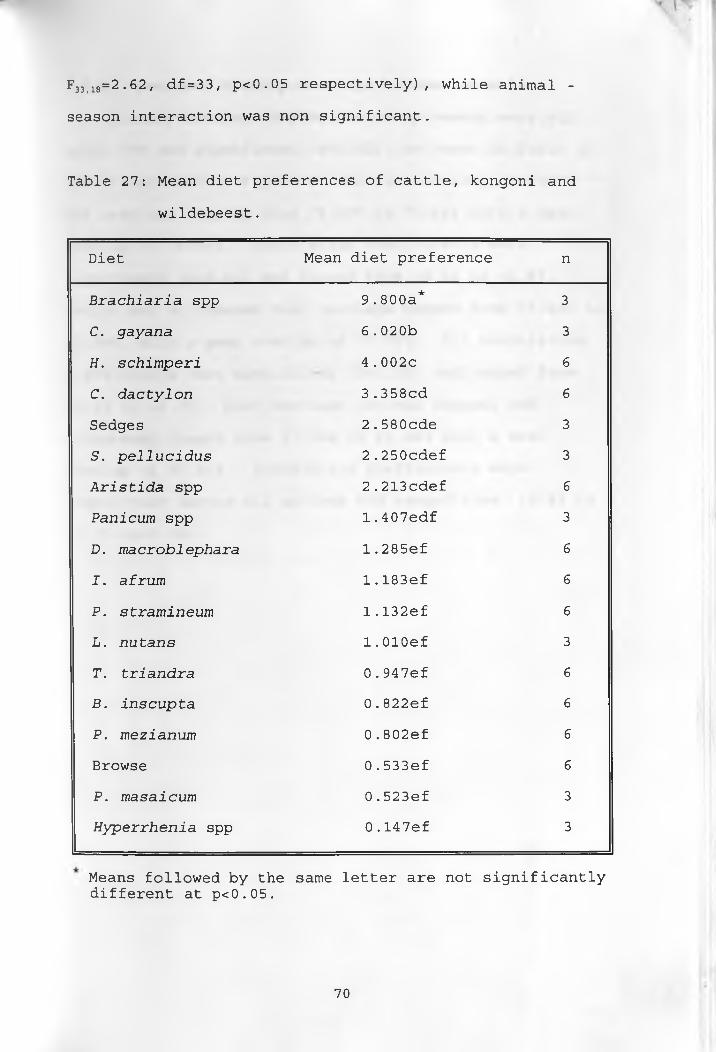
F33,i8=2.62/ df=33, p<0.05 respectively), while animal -
season interaction was non significant.
Table 27: Mean diet preferences of cattle, kongoni and
wildebeest.
Diet Mean diet preference n
Brachiaria spp 9.800a* 3
C. gayana 6.020b 3
H. schimperi 4.002c 6
C. dactylon 3.358cd 6
Sedges 2.580cde 3
S. pellucidus 2.250cdef 3
Aristida spp 2.213cdef 6
Panicum spp 1 .407edf 3
D. macroblephara 1.285ef 6
I. afrum 1.183ef 6
P. stramineum 1.132ef 6
L. nutans l.OlOef 3
T. triandra 0.947ef 6
B. inscupta 0.822ef 6
P. mezianum 0 .802ef 6
Browse 0 .533ef 6
P. masaicum 0 .523ef 3
Hyperrhenia spp 0 .147ef 3
Means followed by the same letter are not significantly different at p<0.05.
70
5.1.4 Seasonal dietary overlaps between animalsDietary overlaps during the rainy season were all
above 70% and significant (P<0.05), as shown in Table 28
and illustrated in Figure 5. Cattle and kongoni diets
had overlaps ranging from 72.59% to 79.56% with a mean
overlap of 76.06%. Correlation coefficients were
significant (p<0.05) and ranged from +0.46 to +0.87.
Cattle and wildebeest diet overlaps ranged from 74.56% to
78.74%, with a mean overlap of 77.30%. All correlation
coefficients were significant (P<0.05) and ranged from
+0.62 to +0.72. Diet overlaps between kongoni and
wildebeest ranged from 77.24% to 82.06% with a mean
overlap of 80.83%. Correlation coefficients were
significant during all periods and ranged from +0.64 to
+0.90 (p<0.05).
71
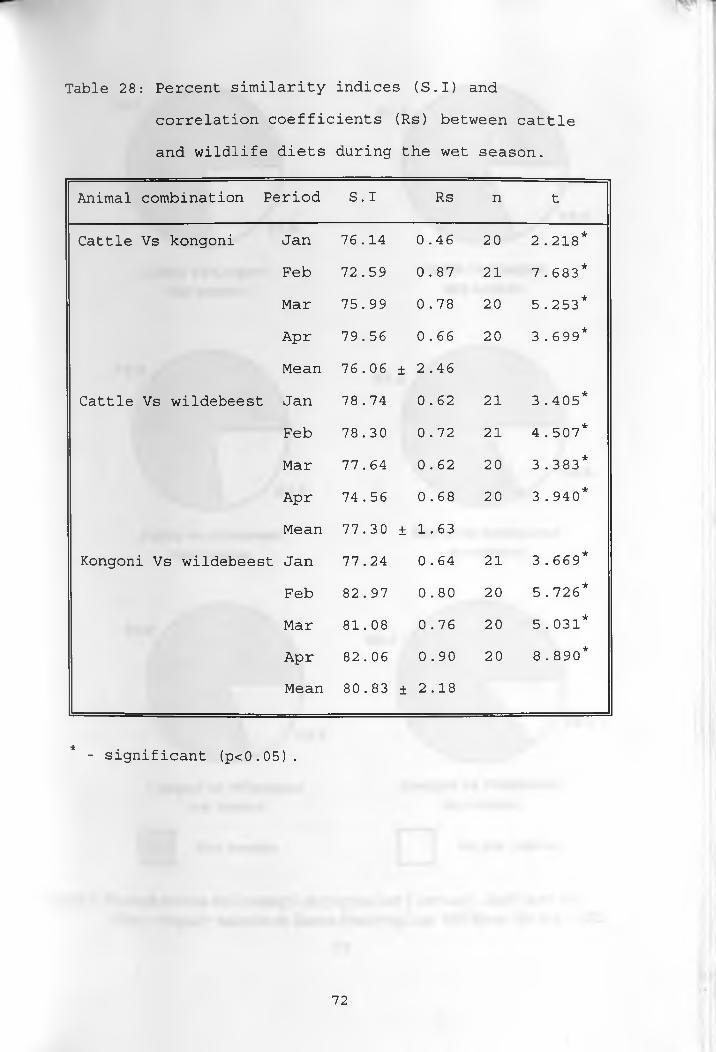
correlation coefficients (Rs) between cattle
Table 28: Percent similarity indices (S.I) and
and wildlife diets during the wet season.
Animal combination Period S.I Rs n t
Cattle Vs kongoni Jan 76.14 0.46 20 2.218*
Feb 72.59 0.87 21 7.683*
Mar 75.99 0.78 20 5.253*
Apr 79.56 0.66 20 3.699*
Mean 76.06 ± 2.46
Cattle Vs wildebeest Jan 78.74 0.62 21 3.405*
Feb 78.30 0.72 21 4.507*
Mar 77.64 0.62 20 3.383*
Apr 74.56 0.68 20 3.940*
Mean 77.30 ± 1.63
Kongoni Vs wildebeest Jan 77.24 0.64 21 3.669*
Feb 82.97 0.80 20 5.726*
Mar 81.08 0.76 20 5.031*
Apr 82.06 0.90 20 8.890*
Mean 80.83 ± 2.18
* - significant (p<0.05).
72
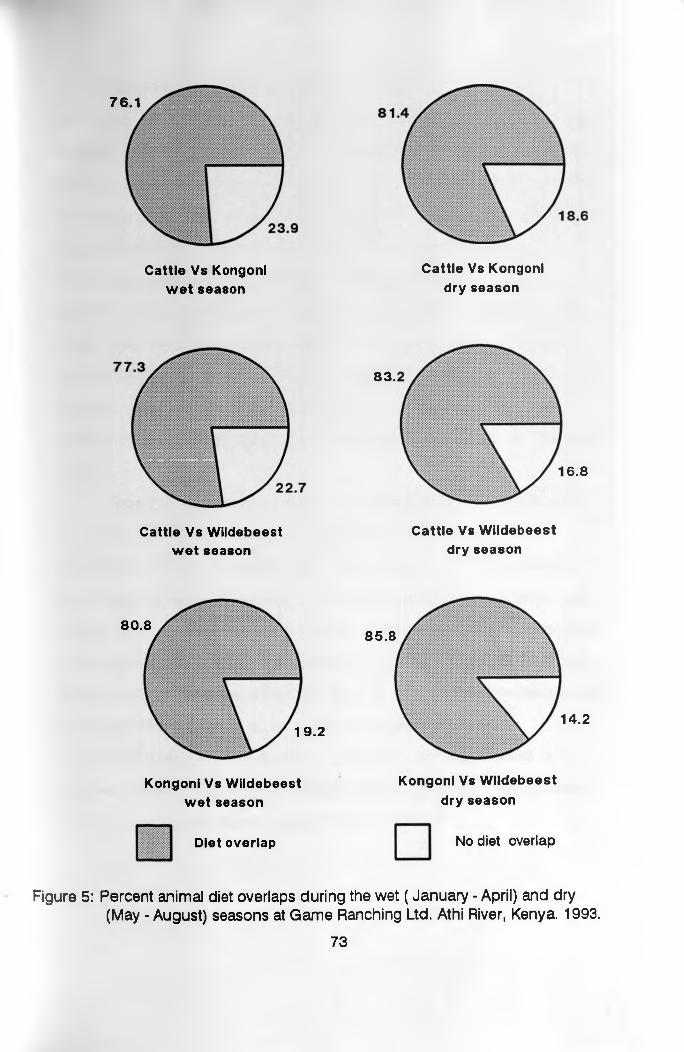
76.1
Cattle Vs Kongonl wet season
Cattle Vs Kongonl dry season
Cattle Vs Wildebeest wet season
83 .
6.8
Cattle Vs Wildebeest dry season
80.8
19.2
85.8
14.2
Kongonl Vs Wildebeest wet season
Kongonl Vs Wildebeest dry season
Diet overlap No diet overlap
Figure 5: Percent animal diet overlaps during the wet ( January - April) and dry(May - August) seasons at Game Ranching Ltd. Athi River, Kenya. 1993.
73
Dietary overlaps exhibited during the dry season
were all above 75%, (Table 29 and Figure 5). Cattle and
Kongoni diets had overlaps ranging from 80.18% to 83.16%
with a mean of 81.44%. All correlation coefficients were
all positive and ranged from +0.78 to +0.86, and were all
significant (P<0.05). Cattle and wildebeest diets
overlaps ranged from 79.96% to 85.60% with a mean of
83.19%. All correlation coefficients were significantly
high (P<0.05) and ranged from +0.78 to +0.84. Kongoni
and wildebeest diet overlaps ranged from 83.06% to 88.49%
with a mean of 85.84%. Correlation coefficients were
significantly high (P<0.05) and ranged between +0.78, and
+ 0.83 .
Trophic diversity index measures niche breadth and
it complements studies on overlap and competition
(Hurtubia 1973). Generally, all animals in this study
had high trophic diversity indicating that they were not
dependent on any one particular plant species, but rather
selected from a wide spectrum of plants. Cattle had the
lowest trophic diversity (2.12 ± 0.06) and wildebeest had
the highest (2.20 ± 0.05), while kongoni's was
intermediate (2.16 ± 0.05). Overall, wildlife had a
higher trophic diversity than cattle, but the difference
was not statistically significant (p=0.05).
74
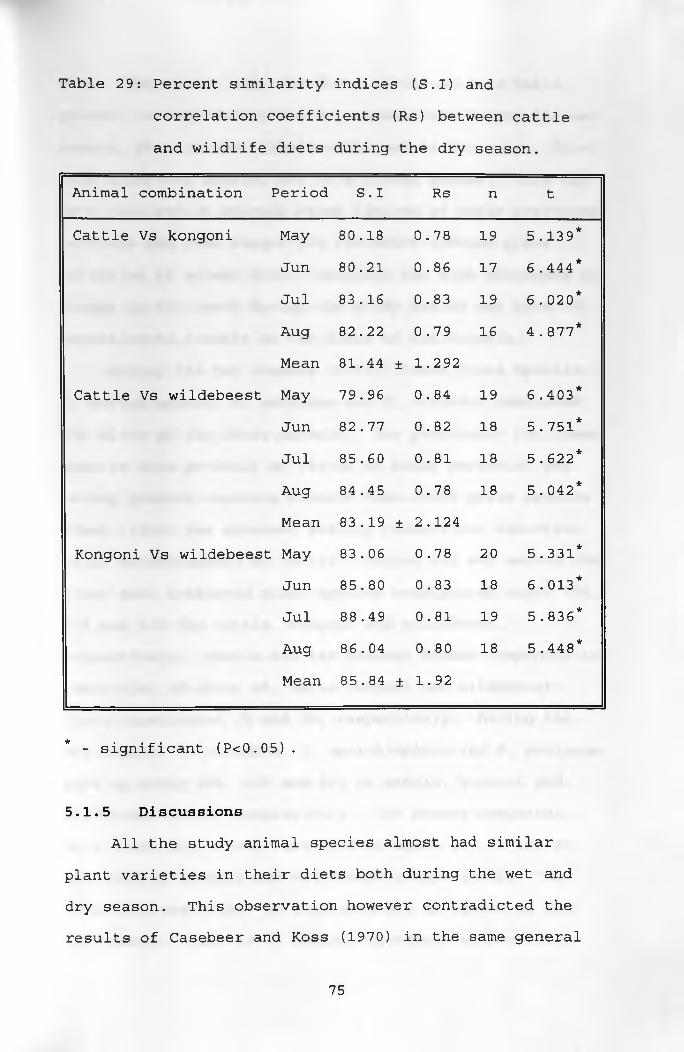
Table 29: Percent similarity indices (S.I) and
correlation coefficients (Rs) between cattle
and wildlife diets during the dry season.
Animal combination Period S . I Rs n t
Cattle Vs kongoni May 80.18 0.78 19 5.139*
Jun 80.21 0.86 17 6.444*
Jul 83.16 0.83 19 6.020*
Aug 82.22 0.79 16 4.877*
Mean 81.44 ± 1.292
Cattle Vs wildebeest May 79.96 0.84 19 6.403*
Jun 82.77 0.82 18 5.751*
Jul 85.60 0.81 18 5.622*
Aug 84.45 0.78 18 5.042*
Mean 83.19 ± 2.124
Kongoni Vs wildebeest May 83.06 0.78 20 5.331*
Jun 85.80 0.83 18 6.013*
Jul 88.49 0.81 19 5.836*
Aug 86.04 0.80 18 5.448*
Mean 85.84 ± 1.92
* - significant (P<0.05).
5.1.5 DiscussionsAll the study animal species almost had similar
plant varieties in their diets both during the wet and
dry season. This observation however contradicted the
results of Casebeer and Koss (1970) in the same general
75
area. They found that the diets of the animals had a
greater variety during the dry season than during the wet
season, this is most likely explained in two ways. First
this study was carried out in a closed system. This may
have resulted in animals being limited in their preferred
habitats and home ranges and therefore limited plant
varieties to select from. Secondly the high abundance of
forage in the ranch during the study period may have not
necessitated a shift in the diets of the animals.
During the two seasons in 1993 three grass species;
D. macroblephara, P. mezianum and T. triandra dominated
the diets of the three animals. The preference for these
species were probably by virtue of being perennial and
having greater standing biomass than other grass species.
Kibet (1984) has advanced similar reasons for selection
of D. macroblephara by cattle. During the wet season the
three most preferred plant species constituted about 70%,
61% and 63% for cattle, kongoni and wildebeest,
respectively. Cattle had the highest browse component in
their diet of about 4%, while kongoni and wildebeest
diets constituted 1% and 2%, respectively. During the
dry season, T. triandra, D. macroblephara and P. mezianum
made up about 60%, 54% and 55% of cattle, kongoni and
wildebeest diets, respectively. The browse component
during the dry season increased to about 8%, 4% and 4%
for cattle, kongoni and wildebeest respectively. The
results clearly show an increased use of browse in the
dry season. This is in general agreement with earlier
76
studies by Payne and MacFarlane (1963) and Kayongo Male
(1986) who found that browse component in cattle diets
increased as the dry season progressed. This results,
however contradict those of Wangoi and Hansen (1987) who
concluded that cattle are predominantly grassers and the
browse component of their diet was higher during the wet
season than in the dry season. Whereas cattle in this
study browsed more during the dry season, Wangoi (1984)
working in Rendile part of Kenya observed that cattle
browsed most during the wet season when browse shoots are
most abundant. This difference is most likely due to
differences in the vegetation in the two areas. Most of
the trees and shrubs in the Rendile area which is in
ecological zone six were reported (same study) to be
devoid of leaves in the dry season. In the study area
(GRL) most shrubs and trees retained their leaves long
into the dry season (Personal observation), thereby
offering browse to the animals. Owaga (1975) observed
that wildebeest browsed about 1-2% of browse during the
wet season and almost none, at other times. This was in
contrast to the findings of this study, where wildebeest
took more browse during the dry season but about the same
amount during the wet season. This difference is most
likely due to management. Whereas Owaga did her study
on animals whose movement was unrestricted, this study
was carried out in a closed system which did not allow
for migration of the animals. This observation can be
explained in four ways. During the wet season the
77
animals utilized habitats which had less browse material
than during the dry season. It seems clear therefore
that the locality of the animals in relation to plant
availability will affect the proportion of browse in the
diet. Secondly, during the wet season, the new growth
from all plants is high in crude protein, digestibility,
has less fibre, and forage is abundant in general. There
would be no nutritional advantage in animals walking from
one shrub/tree to another in search of browse, whereas
the grass at ground level was more abundant, and
accessible. The energy cost involved would outweigh the
benefits. Thirdly this can also be viewed as a resource
utilization strategy whereby these animals make maximum
use of the grass when still growing and high in nutrient
contents before suddenly declining in quality with
advancement of maturity. This may result in browse
preservations, which declines less in quality, for the
critical dry season. Fourth, it has also been reported
(Van Soest, 1982) that young growing browse plants may
contain high levels of secondary compounds (tannins,
sapponins, etc). Some of these compounds interfere with
the digestive mechanisms in the animal, among other
effects. It is possible then, that these animals could
simply be avoiding much of the browse growth which may
contain the compounds. These explanations are however
neither mutually exclusive nor exhaustive because diet
selection under range condition is a complex process
involving both animal related and plant related factors,
78
as ameliorated by the environment.
During the wet and dry seasons, the dietary overlaps
and Spearman Rank Correlation Coefficients were high
among all the animal species. The findings of this study
clearly indicate that cattle, kongoni and wildebeest most
likely compete with each other for forage resources. Do
overlaps indicate competition?. Not necessarily. Field,
(1972) documented that competition only occurs when the
resources being shared are limiting. Many researchers in
East Africa have addressed the question of resource
partitioning and coexistence of East African ungulates.
Some of the theories on how coexistence is achieved
include; spatial and temporal distribution, grazing at
different herb layers, grazing of different plant parts,
differences in mouth structure and differences in body
size. Thus, it is possible that the study animals,
despite having high dietary overlaps, may have had
differential selectivity for plant parts. Talbot and
Talbot (1963) pointed out that ecological separation was
achieved by spatial separation. They also mentioned that
diets of various plains ungulates were complementary and
non duplicative. According to the findings of this
study, many diets were duplicated and none were
complementary. Spatial and temporal separation was
exhibited partially by kongoni and wildebeest.
Bell (1969) observed that during the wet season all
the species in the Serengeti plains occupy the same plain
catena. At the GRL, the study animals concentrated on
79
those habitats where grass was kept short and or in
growing condition by trampling, mowing and grazing. The
short grass was preferred as it was leafy and nutritious.
Thus, in the wet season, the animals were limited by
quality of food rather than the quantity. There was
super abundance of forage resources during this study
period hence critical levels that trigger competition may
have not been attained. This may be one of the reasons
why dietary overlaps were high. In conclusion the
dietary overlaps were lower between cattle and wildlife
than among wild animals.
Diet preference index for the animals differed from
season to season, and from plant to plant. The animals
were more selective during the wet season. This could be
explained in various ways first, the presence of higher
standing biomass during the wet season gave the animals
an opportunity to select diets that they prefer most.
During the dry season forage species that were not
preferred by the animals during the wet season were also
eaten resulting in lower diet preference. Secondly
animals select plant parts that are more nutritious. It
is possible therefore that the animals selected for those
plant parts that were more nutritious during the dry
season from those plants that were not preferred during
the wet season. Finally different habitats had different
proportions of standing biomass of each plant species.
The seasonal changes in the habitat preferences of the
animals therefore exposed them to those plants that were
80
not equally accessible during the wet season. These
seasonal changes in habitat preference by the animals
were reflected by the changes in diet preferences.
The changes in the proportion of the standing
biomass and variation in species of the herbaceous
materials from habitat to habitat can be explained by the
changes in cover, elevation, soils and utilization by the
animals. Habitats on the ridgetops and on the higher
slopes generally had a lower standing biomass, than those
on the lower slopes and lowlying areas. Similarly
habitats which had higher cover generally had higher
standing biomass than those with lower cover.
Interestingly habitats on the ridged tops and on the
slopes had lower cover and received heavier animal
utilization especially during the wet season. Habitats
on the lower slopes had higher cover and were least
utilized by the animals. This resulted in accumulation
of dry matter in these habitats hence higher standing
biomass.
5.2 Animal density and habitat preferences 5.2.1 Number and distribution of animals
This work was conducted to determine the preference
of the study animals for the different habitat types
during the wet and dry seasons. During the study period
cattle were herded throughout. Cattle thus had no free
choice of habitat. During wet months (January, February,
March and April) they grazed mainly in the Themeda
81
grassland and Balanites tree grassland. During this
period there were only 250 heads of mainly dairy cattle1
in the Ranch. From April onwards cattle numbers were
increased to 2,500 as animals for fattening (Penta herd)
were purchased. Cattle bomas were located at hill tops,
resulting in heavy livestock pressures being exerted on
these areas. On daily basis from April onwards cattle
were always herded from their bomas at the hilltops to
the low-lying areas where dams have been constructed for
watering the animals. This resulted therefore in the
animals utilizing most vegetation types. As the dry
season progressed (July and August) they were herded into
the Acacia woodland and A. xanthophloea bushland.
5.2.2 Animal density and habitat preferenceThe results of the habitat preference study were
based on observations of the wild herbivores (kongoni and
wildebeest) over a period of eight months. The seasonal
habitat preference indices, percent frequencies and
relative densities of all the six habitat types for
kongoni and wildebeest are shown on Tables 30 and 31,
respectively, and illustrated in Figure 6 (A) and 6 (B) .
It is evident that during the wet season, for kongoni and
wildebeest, the highest and positive preference indices
occurred in the Balanites tree grassland habitat on the
higher slopes (0.44 and 0.50 for kongoni and wildebeest
respectively) . All other habitat types had negative
indigenous animals kept for milk production.
82
preference indices. Themeda grassland, Balanites -
Acacia and A. drepanolobium dwarf tree grasslands had
-0.82, -0.32 and -0.44 preference indices, respectively,
for kongoni and -1.00, -0.34 and -0.65, respectively, for
wildebeest. The Acacia woodland and A. xanthophloea
bushland were avoided completely by the two animal
species (Preference Index -1.00).
During the dry season the two animal species
shifted their habitat preferences to the Balanites -
Acacia grassland. Preference indices were 0.45 and 0.36
for kongoni and wildebeest respectively. A. xanthophloea
bushland was avoided completely by both animals. Themeda
grassland, and Acacia woodland had negative preference
indices close to -1. Their respective indices were -0.92
and -0.76 for kongoni and -0.97 and -0.98 for wildebeest.
A. drepanolobium dwarf tree grassland had lower but
negative preference indices. They were -0.21 and -0.23
for kongoni and wildebeest respectively, while Balanites
tree grassland had preference indices of -0.47 and -0.25
for kongoni and wildebeest respectively.
83
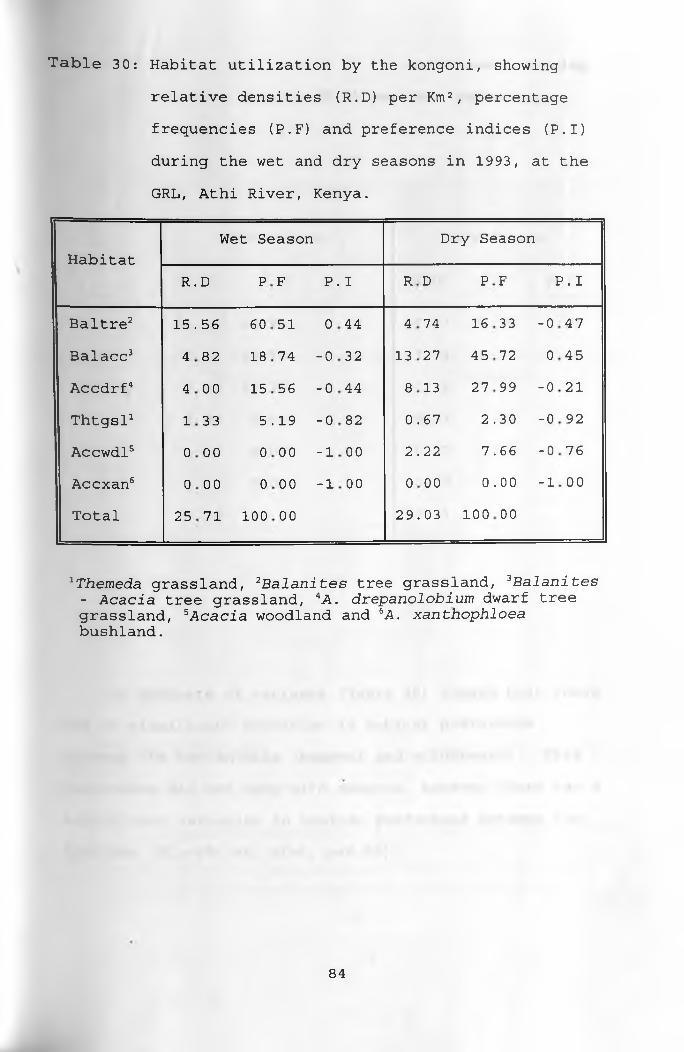
Table 30: Habitat utilization by the kongoni, showing
relative densities (R.D) per Km2, percentage
frequencies (P.F) and preference indices (P.I)
during the wet and dry seasons in 1993, at the
GRL, Athi River, Kenya.
HabitatWet Season Dry Season
R. D P F P. I R D P F P . I
Baltre2 15. 56 60 51 0 44 4 74 16 33 -0 47
Balacc3 4 82 18 74 - 0 32 13 27 45 72 0 4 5
Accdrf4 4 00 15 56 - 0 44 8 13 27 99 - 0 2 1
Thtgsl1 1 33 5 .19 - 0 82 0 .67 2 .30 -0 92
Accwdl5 0 00 0 00 - 1 00 2 . 22 7 . 66 -0 76
Accxan6 0 00 0
oo -1 oo 0
oo 0 . 00 -1 00
Total 25 71 100 00 29 .03 100
oo
1Themeda grassland, 2Balanites tree grassland, 3Balanites - Acacia tree grassland, 4A. drepanolobium dwarf tree grassland, 5Acacia woodland and 6A. xanthophloea bushland.
84
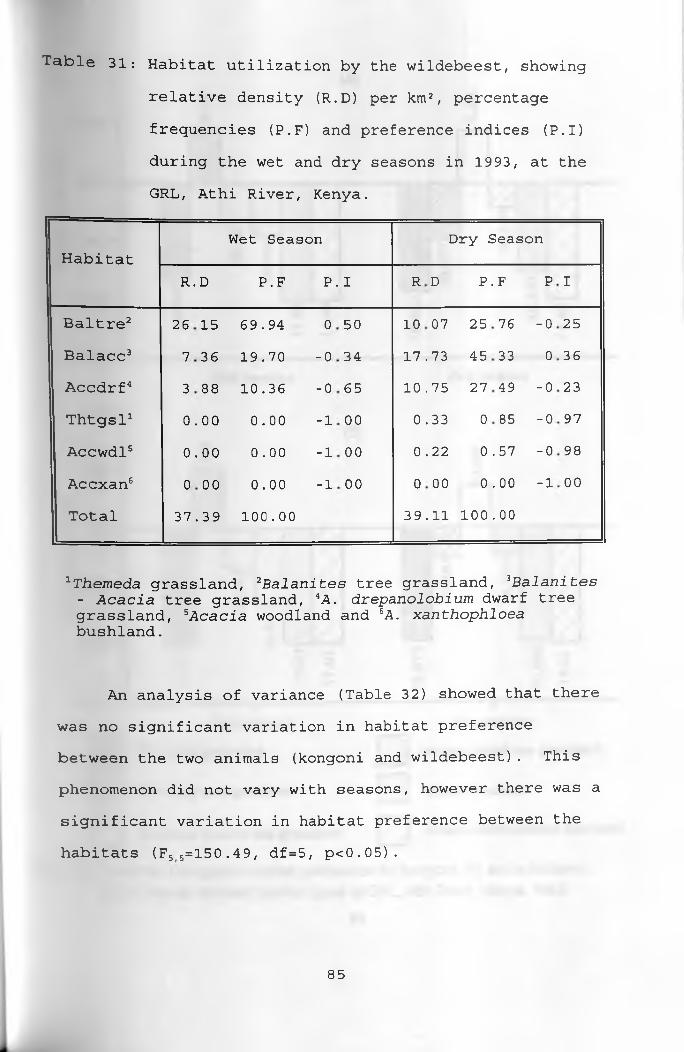
Table 31: Habitat utilization by the wildebeest, showing
relative density (R.D) per km2, percentage
frequencies (P.F) and preference indices (P.I)
during the wet and dry seasons in 1993, at the
GRL, Athi River, Kenya.
HabitatWet Season Dry Season
R. D P .F P. I R D P. F P I
Baltre2 26 15 69. 94 0 50 10 07 25 76 -0 25
Balacc3 7 36 19. 70 -0 34 17 .73 45 33 0 36
Accdrf4 3 88 10. 36 -0 65 10 .75 27 49 -0 23
Thtgsl1 0 .00 0. 00 -1 00 0 .33 0 85 -0 97
Accwdl5 0 .00 0. 00 -1 00 0 .22 0 .57 -0 98
Accxan6 0 oo 0. 00 -1 00 0 oo 0 .00 -1 00
Total 37 .39 100 .00 39 .11 100 .00
1Themeda grassland, 2Balanites tree grassland, 3Balanites - Acacia tree grassland, 4A. drepanolobium dwarf tree grassland, 5Acacia woodland and eA. xanthophloea bushland.
An analysis of variance (Table 32) showed that there
was no significant variation in habitat preference
between the two animals (kongoni and wildebeest). This
phenomenon did not vary with seasons, however there was a
significant variation in habitat preference between the
habitats (F5 5=150.49, df=5, p<0.05).
85
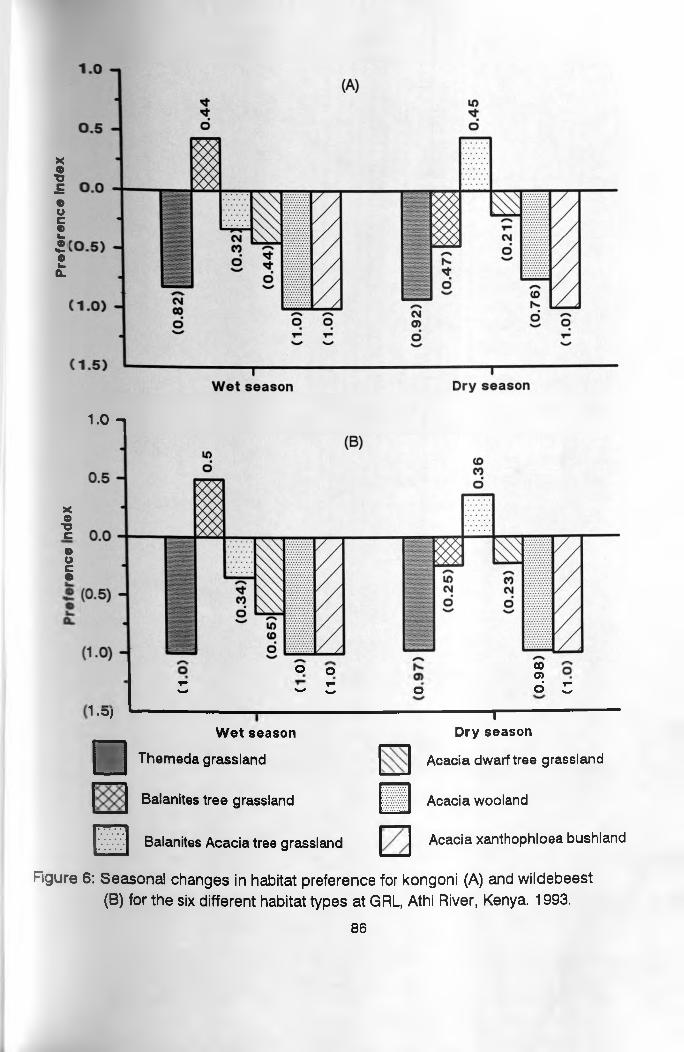
Pref
eren
ce In
dex
1.0 -i
x©■ Oc©oc©
o o 000>
1
1“ r-w -- - o 6 Z
1.OJW et season
iDry season
Themeda grassland Acacia dwarf tree grassland
Balanites tree grassland Acacia wooland
Balanites Acacia tree grassland Acacia xanthophloea bushland
Figure 6: Seasonal changes in habitat preference for kongoni (A) and wildebeest (B) for the six different habitat types at GRL, Athi River, Kenya. 1993.
86
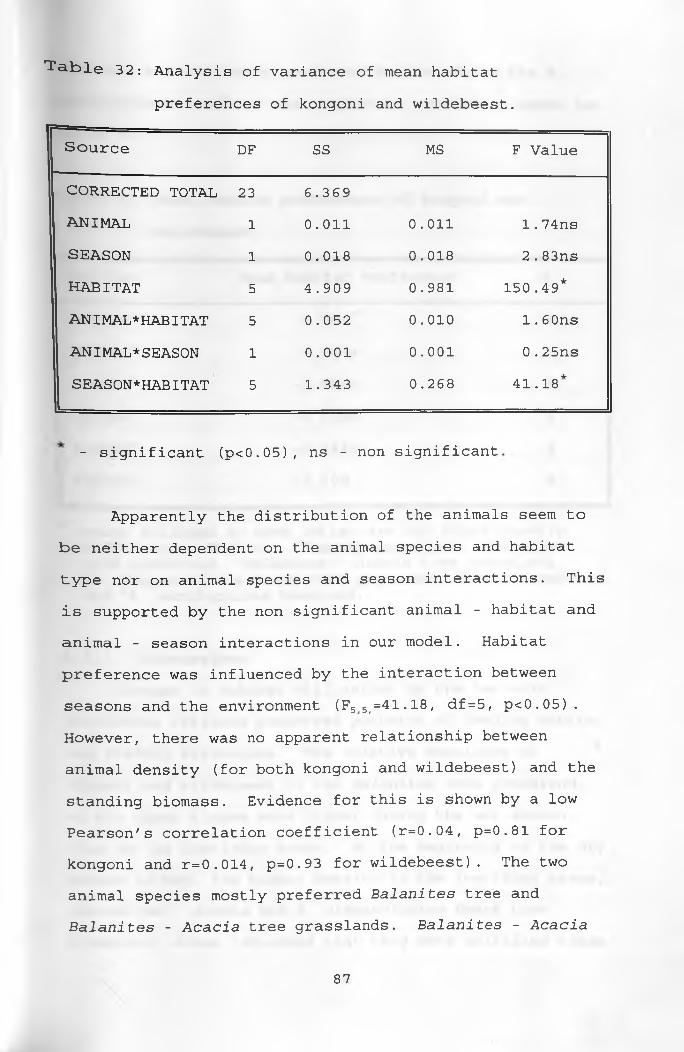
^ a kle 32: Analysis of variance of mean habitat
preferences of kongoni and wildebeest.
Source DF SS MS F Value
CORRECTED TOTAL 23 6.369
a n i m a l 1 0.011 0.011 1.74ns
SEASON 1 0.018 0.018 2.83ns
HABITAT 5 4.909 0.981 150.49*
ANIMAL* HABITAT 5 0.052 0.010 1.60ns
ANIMAL* SEASON 1 0.001 0.001 0.25ns
S E AS ON * HABI TAT 5 1.343 0.268 4*41.18
- significant (p<0.05), ns - non significant
Apparently the distribution of the animals seem to
fc>e neither dependent on the animal species and habitat
type nor on animal species and season interactions. This
is supported by the non significant animal - habitat and
animal - season interactions in our model. Habitat
preference was influenced by the interaction between
seasons and the environment (F55(=41.18, df = 5, p<0.05) .
However, there was no apparent relationship between
animal density (for both kongoni and wildebeest) and the
standing biomass. Evidence for this is shown by a low
Pearson's correlation coefficient (r=0.04, p=0.81 for
kongoni and r=0.014, p=0.93 for wildebeest). The two
animal species mostly preferred Balanites tree and
Balanites - Acacia tree grasslands. Balanites - Acacia
87
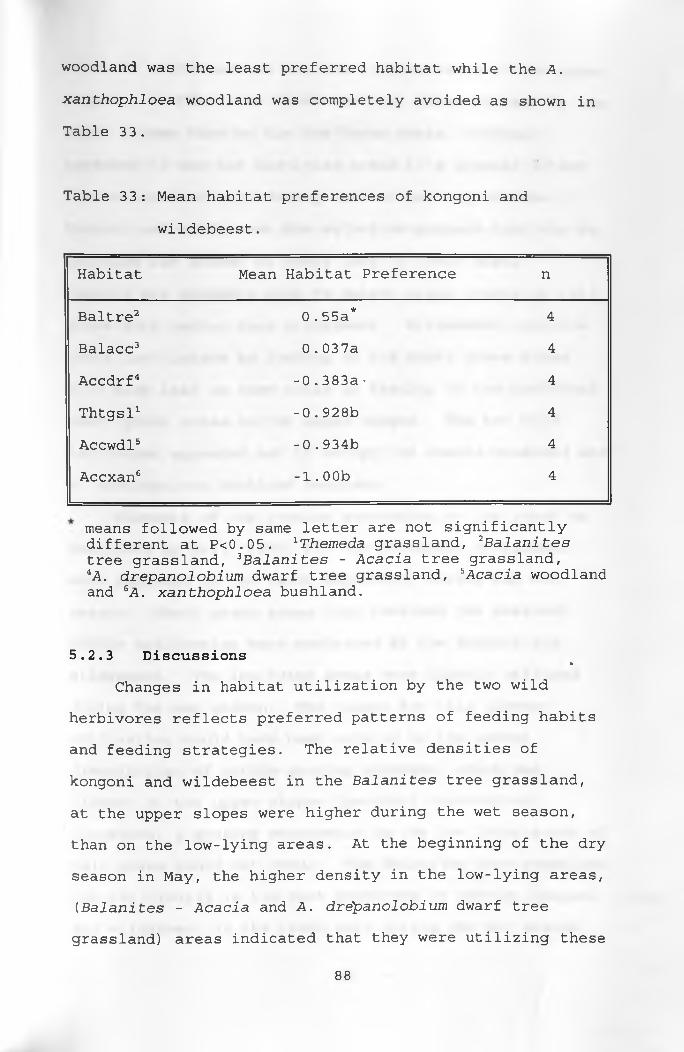
woodland was the least preferred habitat while the A.
xanthophloea woodland was completely avoided as shown in
Table 33.
Table 33: Mean habitat preferences of kongoni and
wildebeest.
Habitat Mean Habitat Preference n
Baltre2 0.55a* 4
Balacc3 0.037a 4
Accdrf4 -0.383a- 4
Thtgsl1 -0.928b 4
Accwdl5 -0.934b 4
Accxan6 -1.00b 4
means followed by same letter are not significantly different at P<0.05. 1Themeda grassland, 2Balanites tree grassland, 3Balanites - Acacia tree grassland,4A. drepanolobium dwarf tree grassland, bAcacia woodland and 6A. xanthophloea bushland.
5.2.3 Discussions fc
Changes in habitat utilization by the two wild
herbivores reflects preferred patterns of feeding habits
and feeding strategies. The relative densities of
kongoni and wildebeest in the Balanites tree grassland,
at the upper slopes were higher during the wet season,
than on the low-lying areas. At the beginning of the dry
season in May, the higher density in the low-lying areas,
(Balanites - Acacia and A . drepanolobium dwarf tree
grassland) areas indicated that they were utilizing these
88
areas in preference to the short grass areas at the upper
slopes. At this time there was less green biomass at the
upper slopes than on the low-lying areas. Kongoni
appeared to use the low-lying areas to a greater extent
than wildebeest both during the wet and dry seasons.
Kongoni and wildebeest are selective grazers that try to
maximize the amount of grass leaf in their diets.
Kongoni are probably able to select grass leaves in tall
grass area better than wildebeest. Wildebeest maximize
grass leaf intake by feeding in the short grass areas
with high leaf to stem ratio by feeding on the preferred
short grass areas on the upper slopes. The two wild
herbivores appeared not to occupy the Acacia woodland and
A. xanthophloea bushland habitats.
Elements of the grazing succession on the ranch as
described by Bell (1971) for the Serengeti ecosystem,
were apparent on the ranch especially during the wet
season. Short grass areas that received the heaviest
cattle utilization were preferred by the kongoni and
wildebeest. The low-lying areas were lightly utilized
during the wet season. One reason for this lighter
utilization could have been related to the uneven
distribution of cattle grazing pressure, which was
highest on the upper slopes (personal observation).
Therefore, a grazing succession in the low lying areas of
tall grass could not occur. The Balanites tree grassland
habitat clearly is the most preferred by cattle, kongoni
and wildebeest in the ranch only during the wet season
89
while Balanites - Acacia tree grassland is the most
preferred during the dry season. The seasonal habitat
preferences by kongoni and wildebeest is probably an
important mechanism of survival and optimum utilization
of the available resources, which aims at reducing the
impact on the dry season habitats during the wet season
90
CHAPTER SIXCONCLUSIONS AND RECOMMENDATIONS
The feeding habits of cattle, kongoni and wildebeest
whether as single species or in combination with other
animal species on the same range, have been studied by-
several researchers in different environments. Some
findings concur, while others conflict. In the current
study the animal species (kongoni, wildebeest and cattle)
increased browse components in their diets by about 100%
during the dry season. The animals, however, selected
similar diets in terms of plant species during both
seasons. The locality of the animals in relation to
plant availability affects the diet preferences and the
proportions of browse and grass in the diet.
The Balanites - Acacia tree grassland is the best
available habitat. It is the habitat upon which kongoni
and wildebeest depend on for their survival in the ranch
during the dry season, when the forage resources are
limiting. Without this habitat these animals would lose
their body condition, which will eventually result in
increased mortalities and reduced population size.
Balanites tree grassland, however, is the most preferred
habitat but is only available during the wet season.
Generally the proportion of herbaceous standing
biomass, and cover of the woody species is dependent on
the interactions between the plants and the environment.
Diet preference is dependent on interactions between
91
season and plant and on interaction between animal and
plant. Therefore any changes of factors in the
interactions will result in changes in the dependable/
factor. One therefore can manipulate any one of these
habitat factors so as to achieve a desired objective.
Such habitat manipulation when being implemented should
take into consideration herbage production, habitat
requirements and the diet preference of the animals in
question. In a closed system animals are limited in
their habitats and plant variety to select diets from.
This therefore calls for proper management. This can be
achieved by harvesting/cropping the animals and through
habitat manipulation. Habitat manipulation should aim at
increasing heterogeneity rather than homogeneity in
habitats. This will allow the animals to maximize their
habitat and diet selection and hence result in increased
productivity.Finally it is recommended that similar studies be
undertaken on other animal species in the ranch. This
will enable comprehensive management package to be
developed. Such a package should take into consideration
habitat and feed requirements of all the herbivores in
the ranch while taking into consideration the management
objective.
92
REFERENCESAndere, D.K. 1981. Wildebeest (Connochaetes taurinus)
and its food supply in Amboseli Basin. Afr. J.Ecol. 19:239-250.
Arnold, G.W. 1966a. The special senses in grazing animals. I. Sight and dietary habits in sheep.Aust. J. Agric. Res. 17:521-529.
Arnold, G.W. 1966b. The special senses in grazing animals II: Smell, taste and touch and dietary habits in sheep. Aust. J. Agric. Res. 17:531-542.
Arnold, G.W. and M.C. Dudzinki. 1978. Ethology of free- ranging animals. Elselvier Sci. Publ. Co. Netherlands.
Bell, R.H.V. 1969. The use of the herb layer by grazing ungulates in Serengeti. In: A. Watson, ed. Animal population in relation to food resources. Symp.Brt. Ecol. Soc., Blackwell, Oxford, Edinborough.
Bell, R.H.V. 1971. A grazing ecosystem in Serengeti. Scientific Americana, 225:36-93.
Belovsky, G.E. and P.A. Jordan. 1978. Time-Energy budget of a moose. Theor. pop biol. 14:76-104
Ben-Shahar, R. 1991. Selectivity in large generalists herbivores; feeding patterns of African ungulates a semi-arid habitat. Afr. J. Ecol. 29:302-315.
Bjugstad, A.J., H.S. Crawford and I.N. Donald. 1970.Determining forage consumption by direct observation of domestic animals. In Range Wildl. Habitat Eval-A Res. Symp. US. Dep. Pub. No. 1147, 220p.(Quoted by Holechek et al. 1982b).
Bredon, R.M. and J. Wilson. 1963. The chemicalcomposition and nutritive value of grasses from semi arid area of Karamoja as related to ecology and types of soils. East Afr. Agric. For. J. 29:134- 142.
Bryan, D.G., M. Elfatih and J.L. Holechek. 1983.Mastication effect on cattle diets determined by microhistological analysis. J. Range Manage. 36:475-478.
Casebeer, R.L. and G. Koss. 1970. Food habits ofwildebeest, zebra, hartebeest and cattle in Kenya, Masailand. E. Afr. Wild. J. 8:25-36.
93
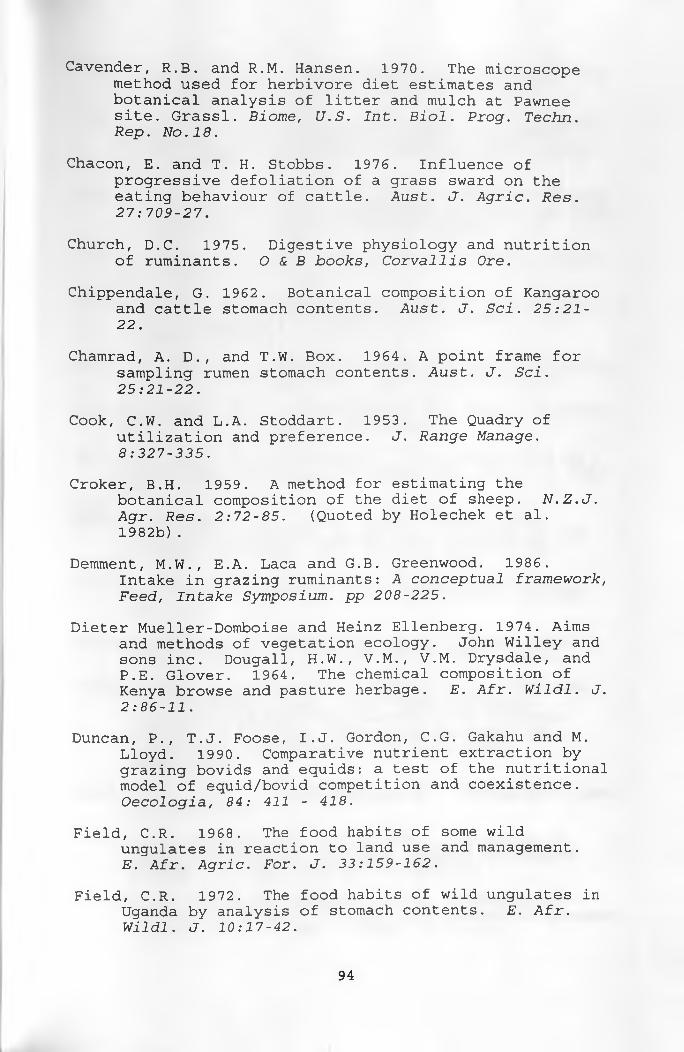
Cavender, R.B. and R.M. Hansen. 1970. The microscope method used for herbivore diet estimates and botanical analysis of litter and mulch at Pawnee site. Grassl. Biome, U.S. Int. Biol. Prog. Techn.Rep. No.18.
Chacon, E. and T. H. Stobbs. 1976. Influence ofprogressive defoliation of a grass sward on the eating behaviour of cattle. Aust. J. Agric. Res. 27:709-27.
Church, D.C. 1975. Digestive physiology and nutrition of ruminants. O & B books, Corvallis Ore.
Chippendale, G. 1962. Botanical composition of Kangaroo and cattle stomach contents. Aust. J. Sci. 25:21- 22.
Chamrad, A. D., and T.W. Box. 1964. A point frame for sampling rumen stomach contents. Aust. J. Sci. 25:21-22.
Cook, C.W. and L.A. Stoddart. 1953. The Quadry ofutilization and preference. J. Range Manage. 8:327-335.
Croker, B.H. 1959. A method for estimating thebotanical composition of the diet of sheep. N.Z.J. Agr. Res. 2:72-85. (Quoted by Holechek et al.1982b).
Demment, M.W., E.A. Laca and G.B. Greenwood. 1986.Intake in grazing ruminants: A conceptual framework, Feed, Intake Symposium, pp 208-225.
Dieter Mueller-Domboise and Heinz Ellenberg. 1974. Aims and methods of vegetation ecology. John Willey and sons inc. Dougall, H.W., V.M., V.M. Drysdale, and P.E. Glover. 1964. The chemical composition of Kenya browse and pasture herbage. E. Afr. Wildl. J. 2:86-11.
Duncan, P., T.J. Foose, I.J. Gordon, C.G. Gakahu and M. Lloyd. 1990. Comparative nutrient extraction by grazing bovids and equids: a test of the nutritional model of equid/bovid competition and coexistence. Oecologia, 84: 411 - 418.
Field, C.R. 1968. The food habits of some wildungulates in reaction to land use and management.E. Afr. Agric. For. J. 33:159-162.
Field, C.R. 1972. The food habits of wild ungulates in Uganda by analysis of stomach contents. E . Afr. Wildl. J. 10:17-42.
94
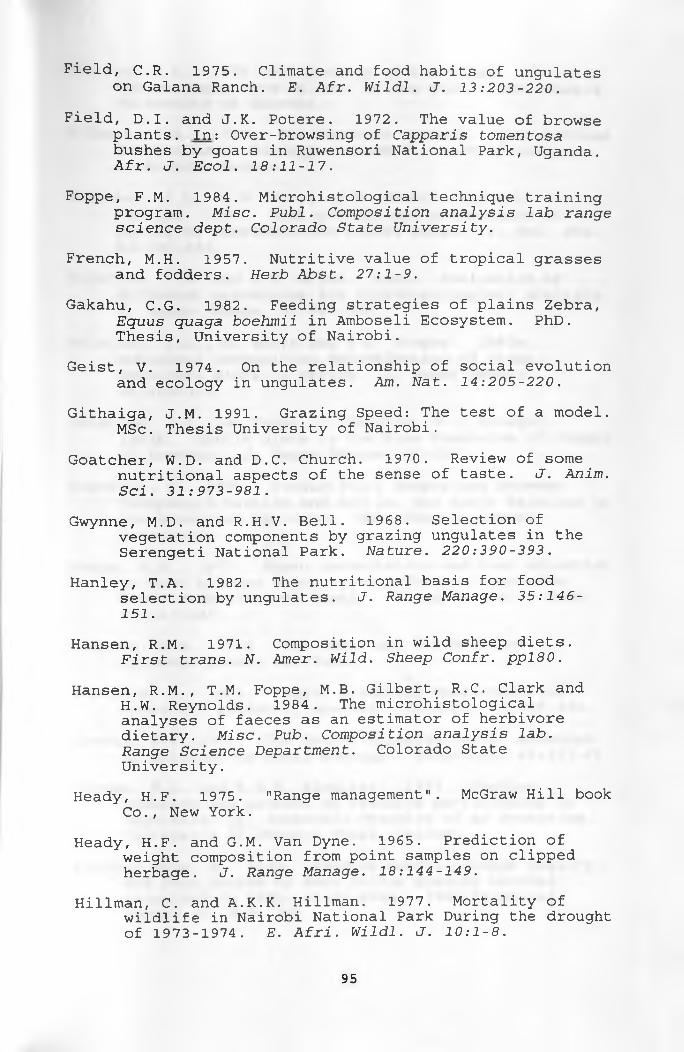
Field, C.R. 1975. Climate and food habits of ungulates on Galana Ranch. E. Afr. Wildl. J. 13:203-220.
Field, D.I. and J.K. Potere. 1972. The value of browseplants. 1n: Over-browsing of Capparis tomentosa bushes by goats in Ruwensori National Park, Uganda. Afr. J. Ecol. 18:11-17.
Foppe, F.M. 1984. Microhistological technique training program. Misc. Publ. Composition analysis lab range science dept. Colorado State University.
French, M.H. 1957. Nutritive value of tropical grasses and fodders. Herb Abst. 27:1-9.
Gakahu, C.G. 1982. Feeding strategies of plains Zebra, Equus quaga boehmii in Amboseli Ecosystem. PhD. Thesis, University of Nairobi.
Geist, V. 1974. On the relationship of social evolution and ecology in ungulates. Am. Nat. 14:205-220.
Githaiga, J.M. 1991. Grazing Speed: The test of a model. MSc. Thesis University of Nairobi.
Goatcher, W.D. and D.C. Church. 1970. Review of somenutritional aspects of the sense of taste. J. Anim. Sci. 31:973-981.
Gwynne, M.D. and R.H.V. Bell. 1968. Selection ofvegetation components by grazing ungulates in the Serengeti National Park. Nature. 220:390-393.
Hanley, T.A. 1982. The nutritional basis for foodselection by ungulates. J. Range Manage. 35:146- 151.
Hansen, R.M. 1971. Composition in wild sheep diets. First trans. N. Amer. Wild. Sheep Confr. ppl80.
Hansen, R.M., T.M. Foppe, M.B. Gilbert, R.C. Clark and H.W. Reynolds. 1984. The microhistological analyses of faeces as an estimator of herbivore dietary. Misc. Pub. Composition analysis lab.Range Science Department. Colorado State University.
Heady, H.F. 1975. "Range management". McGraw Hill book Co., New York.
Heady, H.F. and G.M. Van Dyne. 1965. Prediction of weight composition from point samples on clipped herbage. J. Range Manage. 18:144-149.
Hillman, C. and A.K.K. Hillman. 1977. Mortality ofwildlife in Nairobi National Park During the drought of 1973-1974. E. Afri. Wildl. J. 10:1-8.
95
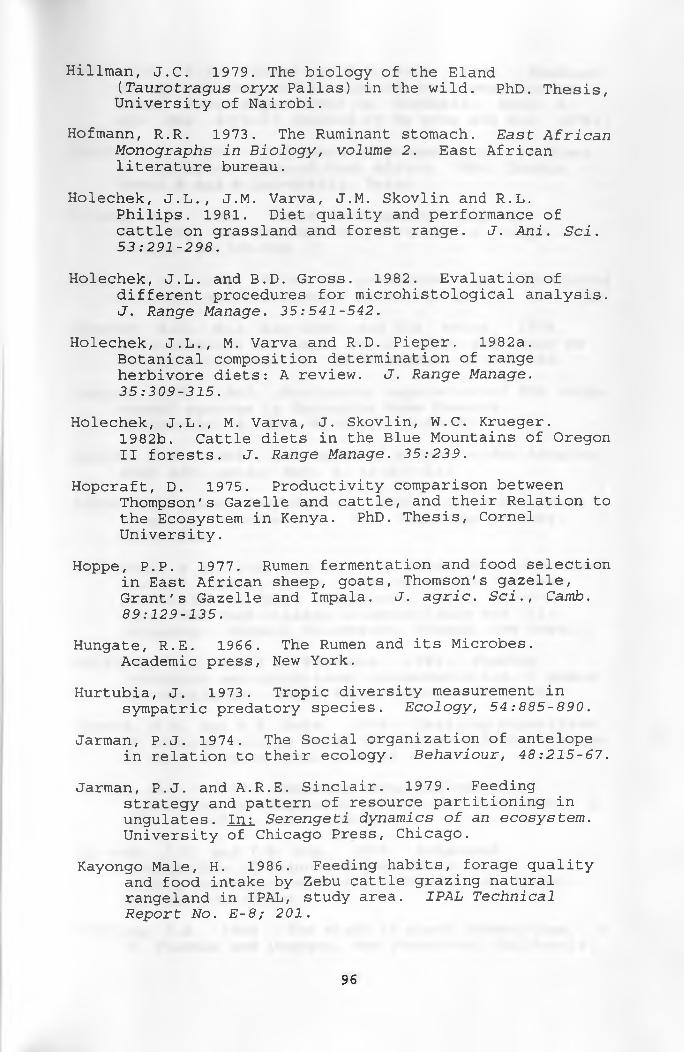
Hillman, J.C. 1979. The biology of the Eland(Taurotragus oryx Pallas) in the wild. PhD. Thesis, University of Nairobi.
Hofmann, R.R. 1973. The Ruminant stomach. East African Monographs in Biology, volume 2. East African literature bureau.
Holechek, J.L., J.M. Varva, J.M. Skovlin and R.L.Philips. 1981. Diet quality and performance of cattle on grassland and forest range. J. Ani. Sci. 53:291-298.
Holechek, J.L. and B.D. Gross. 1982. Evaluation ofdifferent procedures for microhistological analysis. J. Range Manage. 35:541-542.
Holechek, J.L., M. Varva and R.D. Pieper. 1982a. Botanical composition determination of range herbivore diets: A review. J. Range Manage. 35:309-315.
Holechek, J.L., M. Varva, J. Skovlin, W.C. Krueger.1982b. Cattle diets in the Blue Mountains of Oregon II forests. J. Range Manage. 35:239.
Hopcraft, D. 1975. Productivity comparison betweenThompson's Gazelle and cattle, and their Relation to the Ecosystem in Kenya. PhD. Thesis, Cornel University.
Hoppe, P.P. 1977. Rumen fermentation and food selection in East African sheep, goats, Thomson's gazelle, Grant's Gazelle and Impala. J. agric. Sci., Camb. 89:129-135.
Hungate, R.E. 1966. The Rumen and its Microbes.Academic press, New York.
Hurtubia, J. 1973. Tropic diversity measurement insympatric predatory species. Ecology, 54:885-890.
Jarman, P.J. 1974. The Social organization of antelopein relation to their ecology. Behaviour, 48:215-67.
Jarman, P.J. and A.R.E. Sinclair. 1979. Feedingstrategy and pattern of resource partitioning in ungulates. In: Serengeti dynamics of an ecosystem. University of Chicago Press, Chicago.
Kayongo Male, H. 1986. Feeding habits, forage quality and food intake by Zebu cattle grazing natural rangeland in IPAL, study area. IPAL Technical Report No. E-8; 201.
96
Kerr, J.A. , V.J. Wilson and H.H. Roth. 1970. Studies on agricultural utilization of semi-domesticated Eland (Taurotragus oryx) in Rhodesia. Rhod. J.Agr. Res. 8:71-71 (Quoted by Ng'ethe and Box. 1976) .
Kibet, P.K. 1984. Influence of browse on cattle diets in Acacia savannah of East Africa. MSc. Thesis Texas A and M University, Texas.
Kilcher M.R. 1981. Plant development, stage ofmaturity, and nutrient composition. J. Range manage. 34:363-364.
Krebs, J.R. 1978. Rules for predators. In: Behavioural ecology: An Evolutionary Approach, pp 23 - 68. Eds.
Krueger, W.C., W.C. Lay Cock, and D .A . Price. 1974.Relationships of taste, smell, sight and touch to forage selection. J. Range Manage. 27:258-262.
Lamprey, H.F. 1963. Ecological separation of the large mammal species in Tarangire Game Reserve,Tanganyika. E. Afr. Wildl. J. 1:63-92.
Lawton, R.M. 1968. The value of browse in dry tropics. East Afr. agric. For. J. 33:227-231.
Lotus Development Corporation. 1991. Lotus Freelance Graphics, version 4.0. 55. Cambridge parkway,Cambridge.
MacDowell, R.E., D.G. Sister, E.C. Schemerhon, J.D. Reed and R.P. Bauer. 1988. Game or cattle for meat production on Kenya rangelands. Dept, of Anim.Sci., New York College of Agriculture and life sciences. Cornell University, Ithaca, New York.
Malechek, J.C. and F.D. Provenza. 1983. Feedingbehaviour and nutritional characteristics of goats on rangelands. World Animal Review, 47: P.38.
Mentis, M.T. and R.R. Duke. 1976. Carrying capacitiesof natural veld in Netal for forage wild herbivores. S. Afr. J. Wild. Res. 6:65-74.
Mentis, M.T. 1977. Stocking rates and carryingcapacities for ungulates on African rangelands. S. Afr. J. Wildl. res. 7:89-98.
Ng'ethe, J.C. and T.W. Box. 1976. Botanical composition of Eland and goat diets on an acacia-grassland community in Kenya. J. Range Manage. 29:290-293.
Oosting, J.H. 1956. The study of plant communities. W. H. Freeman and Company, San Francisco, California.
97
Owaga, M.L. 1975. The feeding ecology of the wildebeest and zebra in Athi Kapiti Plains. E . Afr. Wildl. J. 13:375-383.
Owen-Smith, N. 1982. Factors influencing theconsumption of plant products by large herbivores.In: Ecology of tropical Savannas. (Eds B.J. Huntley and B.H. Walker) PP. 359-404. Springer-verlag, New York.
Payne, W.J.A. and J.S. Macfarlane. 1963. A brief study of cattle browsing behaviour in a semi-arid area of Tanganyika. E. Afr. For. J. 29:131.
Pratt, D.J. and M.D. Gwynne. 1977. "Rangelandmanagement and ecology in East Africa". Robert E. Krueger Publ. Co. Huntington, New York.
Pratt, D.J., P.J. Greenway and M.D. Gwynne. 1966. Aclassification of East African Rangelands. J. App. Ecology, 3:369-392.
Sanders, K.D., B.E. and G. Scott. 1980. Bite count Vs fecal analysis for range animals diets. J. Range Manage. 32:146-149.
SAS Inc., 1987. SAS (r) Proprietary Software Release 6.04. Cary, NC 27512-8000, U.S.A.
* Scother, J.S.B. 1979. A review of fecal analysistechniques for determination of the diet of wild grazing herbivores. Proc. Grassld. Soc. Afr. 14:141-146. (Quoted by Holechek et al. 1982a)
Shannon, C.E. 1948. A mathematical theory ofcommunication. Bell Systems Techn. J. 27:378-423.
Sinclair, A.R.E. and M. Norton - Griffiths, 1979,Serengeti: Dynamics of an ecosystem. The University of Chicago press, Chicago and London.
Sinclair, A. R. E. 1972. Food selection and competition in East African Buffalo (Syncerus cafer Sparman).E. Afri. Wildl. J. 10: 77-78.
Slater, J. and R.J. Jonnes. 1971. Estimation of diets selected by grazing animals from microscopic analysis of faeces. J. Aust. Inst. Agri. Sci. 37:238. (Quoted by Holechek 1982a).
Snedecor, G.W. and W.G. Cochran. 1967. Statisticalmethods. The Iowa State University Press, Ames, Iowa, U.S.A.
98
* Sparks, D.R., and J.C. Malechek. 1968. Estimatingpercentage in diets using a microscopic technique.J. Range Manage. 21:264-265.
Stanley - Price, M.R. 1977. The estimation of food intake and its seasonal variation, in the hartebeest. E. Afr. Wildl. J. 15:107-124.
Stelfox, J.B. 1985. Mixed species Game Ranching on the Athi Kapiti plains, Kenya. PhD. Thesis. University of Albert: In: Sinnary, A.S. and J.J. Hebrard. 19 91. A new approach for detecting visibility bias. Afr. J. Ecol. 29:222-28.
Stewart, D.R.M. and J. Stewart. 1970. Food preference data analysis for african plains ungulates.Zoologica Africana, 5:115-129.
Stobbs, T.H. 1973. The effect of plant structure onintake of tropical pastures. Aust. J. Agric. Res. 24:809-19.
Stobbs, T.H. 1975. The effect of plant structure on the intake of Tropical pastures. Ill Influence of fertilizer nitrogen on the size of bite harvested by Jersey cows grazing Setaria anceps CV. Kazungula swards. Aust. J. Agric. Res. 26:997-1007.
Taerum, R. 1970. A note on the chemical contents ofsome East African grasses. East Afr. Agric. For. J. 46:171-176.
Talbot, L.M. and M.H. Talbot. 1962. Food preferences of some East African wild Ungulates. E. Afr. Agric. For. J. 27:131-138.
Talbot, L.M. and M.H. Talbot. 1963. The wildebeest in western Maasailand East Africa. Wildlife Monograph, 2:88.
Todd, J.W. and R.M. Hansen. 1973. Plant fragments in faeces of big horns as indicators of food habits.J. Wild. Manage. 37:363-367.
Van Dyne, G.M., N.R. Brockngton, Z. Szocs, J, Duek and C. A. Ribic. 1980. Large herbivore subsystem. In: Grasslands System Analysis and Man. (Edn A.I. Brey Meyer and G.M. Van Dyne) pp 269 - 537. I.B.P. Synthesis 19. Cambridge University Press,Cambridge.
Van Soest, P.J. 1982. Nutritional ecology of the ruminant. O&B Books Inc. Corvallis, Ore.
99
Van Soest, P.J. 1967. Development of a comprehensive system of feed analysis and its application to forage. J. Anim. Sci. 26: 119 - 128
Van Zyl, J.H.M. 1965. The vegetation of S.A. Lombard Nature Reserve and its utilization by certain antelopes. Zoologica Africana, 1:55. Quoted by Ng'ethe and Box 1976).
tVavra, M. and J.L. Holechek. 1980. Factors influencing microhistological analysis of herbivore diets. J. Range Manage. 33:371-374.
Vessey - Fitzgerald, D.F. 1960. Grazing successionamong East African game animals. J. Mammal. 41:161- 72.
Viljoen, P.J. 1989. Habitat selection and preferred food plants of a desert-dwelling elephant in the northern Namib Desert, South West Africa/Namimbia.J. Afr. Ecol. 27:227-240.
Wangoi, E. Migongo. 1984. The tropic relations ofdomestic animals in he central part of Rendile land in Northern Kenya. Ph.D Diss. Colorado State Univ. Fort Collins, Co.
Wangoi Migongo-Bake and R.M. Hansen. 1987. Seasonaldiets of camels, cattle, sheep and goats in a common range in East Africa. J. Range Manage. 40:76.
Welch, J.G. and A.M. Smith. 1969. Influence of forage quality on rumination time in sheep. J. Anim. Sci. 28:813-818.
* Wilson, A.E., S.M. Hirst and R.P. Ellis. 1977.Determination of feeding preferences in wild ruminants from fecal samples. J. Wild. Manage. 41:70-75.
100
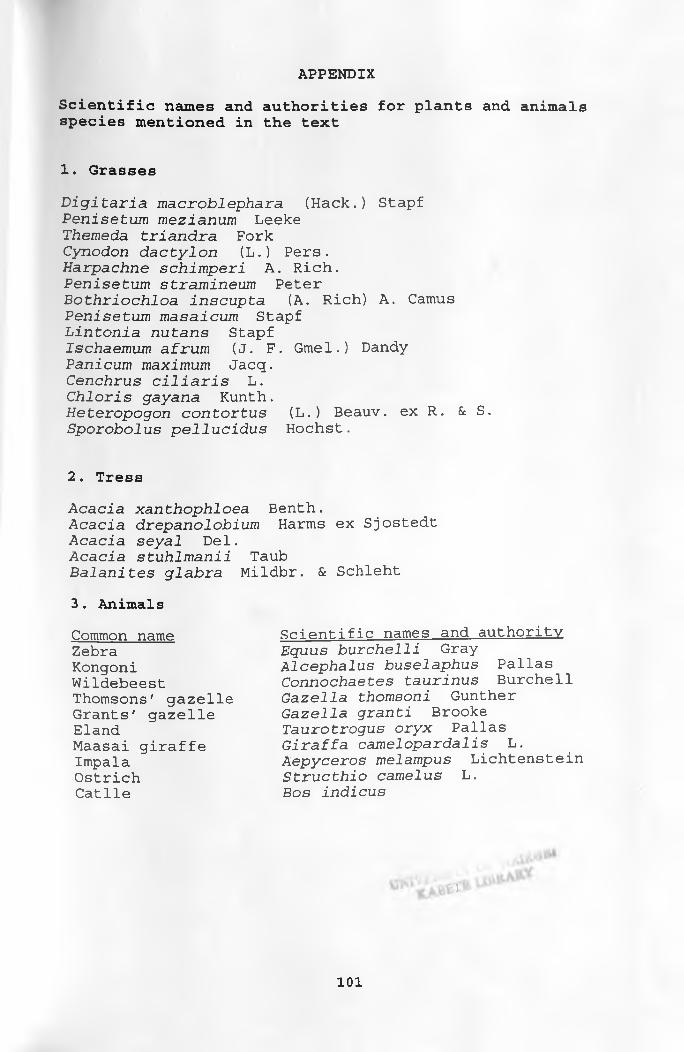
APPENDIXScientific names and authorities for plants and animals species mentioned in the text
1. GrassesDigitaria macroblephara (Hack.) Stapf Penisetum mezianum Leeke Themeda triandra Fork Cynodon dactylon (L.) Pers.Harpachne schimperi A. Rich.Penisetum stramineum PeterBothriochloa inscupta (A. Rich) A. CamusPenisetum masaicum StapfLintonia nutans StapfIschaemum afrum (J. F. Gmel.) DandyPanicum maximum Jacq.Cenchrus ciliaris L.Chloris gayana Kunth.Heteropogon contortus (L.) Beauv. ex R. & S. Sporobolus pellucidus Hochst.
2 . TressAcacia xanthophloea Benth.Acacia drepanolobium Harms ex Sjostedt Acacia seyal Del.Acacia stuhlmanii Taub Balanites glabra Mildbr. & Schleht
3. AnimalsCommon nameZebraKongoniWildebeestThomsons' gazelleGrants' gazelleElandMaasai giraffe Impala Ostrich Catlle
Scientific names and authority Equus burchelli Gray Alcephalus buselaphus Pallas Connochaetes taurinus Burchell Gazella thomsoni Gunther Gazella granti Brooke Taurotrogus oryx Pallas Giraffa Camelopardalis L. Aepyceros melampus Lichtenstein Structhio camelus L.Bos indicus
3t
101
Related Documents