Research papers Seasonal δ 13 C and δ 15 N isoscapes of fish populations along a continental shelf trophic gradient Kara R. Radabaugh n , David J. Hollander, Ernst B. Peebles 1 College of Marine Science, University of South Florida, St. Petersburg, FL 33701, USA article info Article history: Received 31 October 2012 Received in revised form 21 May 2013 Accepted 24 August 2013 Available online 31 August 2013 Keywords: Stable isotope C and N pathways Isoscape Marine food web Animal migration abstract The West Florida Shelf, located in the eastern Gulf of Mexico, transitions from a eutrophic ecosystem dominated by the Mississippi River plume to mesotrophic and oligotrophic ecosystems off the coast of peninsular Florida. Three extensive trawl surveys in this region were used to acquire samples of fish muscle, benthic algae from sea urchin stomach contents, and filtered particulate organic matter (POM) to create δ 13 C and δ 15 N isoscapes. Muscle δ 15 N from three widely distributed fish species, Synodus foetens (inshore lizardfish), Calamus proridens (littlehead porgy), and Syacium papillosum (dusky flounder), exhibited strong longitudinal correlations (Pearson′s r ¼0.67 to 0.90, p o0.001) that coincided with the principal trophic gradient, whereas δ 13 C values of fish muscle and benthic algae were correlated with depth (Pearson′s r ¼0.34 to 0.73, p o0.05). Correlations between isotopic values and surface concentrations of chlorophyll and particulate organic carbon (POC) imply linkages between the isotopic baseline and transitions from eutrophic to oligotrophic waters. The δ 13 C depth gradient and the δ 15 N longitudinal gradient were consistent between seasons and years, providing a foundation for future stable isotope studies of animal migration in the Gulf of Mexico. & 2013 Elsevier Ltd. All rights reserved. 1. Introduction Isotopic spatial gradients have been found on marine continental shelves in the δ 13 C and δ 15 N values of primary producers, consumers, and organic matter in surface sediments (Weffer and Killingley, 1986; Fry, 1988; Jennings and Warr, 2003; Alt-Epping et al., 2007; Nerot et al., 2012). In consumers, depth-related δ 13 C variation may be partially due to consumption of different food sources in inshore and offshore waters (Cherel and Hobson, 2007; Nerot et al., 2012). In primary producers, δ 13 C variation is linked to environmental factors regulating species composition, rates of primary production, δ 13 C signatures of aqueous CO 2 , and the magnitude of photosynthetic fractionation (Fry, 1988; Cooper and DeNiro, 1989; Hofmann et al., 2000; Liu et al., 2007). On a regional scale, marine δ 13 C values are generally higher in shallow waters and in areas with high primary productivity (Fry, 1988; Muscatine et al., 1989; Graham et al., 2010). Spatial gradients in δ 15 N are also common in continental shelf waters (Jennings and Warr, 2003; Alt-Epping et al., 2007; Olson et al., 2010; Nerot et al., 2012). Although the specific mechanisms affecting baseline δ 15 N gradients on continental shelves vary, the root of this phenomenon is often linked to transitions from eutrophic or mesotrophic conditions to oligotrophic waters (Hansson et al., 1997; Alt-Epping et al., 2007; Harmelin-Vivien et al., 2008; Nerot et al., 2012). Diazotrophs such as the cyanobacterium Trichodesmium provide fixed nitrogen with δ 15 N values close to 0‰, which can lower the δ 15 N baseline in oligotrophic ecosystems (Carpenter et al., 1997; Montoya et al., 2002; Montoya, 2007). In contrast, δ 15 N of nutrients and particulate organic matter (POM) in fluvial sources may have higher isotopic values in the range of 5–9‰, particularly if the terrestrial runoff contains sewage or manure (Hansson et al., 1997; Kendall et al., 2001). The POM and dissolved nutrients in river plumes can increase the δ 15 N baseline in eutrophic or mesotrophic waters on continental shelves (Alt-Epping et al., 2007; Harmelin- Vivien et al., 2008; Dorado et al., 2012). Geographic variability in isotope signatures can be displayed graphically as isoscapes (West et al., 2010). Isoscapes are useful for determining the foundation of food webs or the trophic level of a species (Graham et al., 2010; Olson et al., 2010). Isoscapes are also used to trace the origin and migration of animals, as the isotopic composition of an animal′s diet is retained in certain body tissues for extended lengths of time (Rubenstein et al., 2002; Hobson et al., 2010). An animal′s isotopic signature can be compared to the isotopic baseline to determine its most likely origin (Wunder and Norris, 2008; Hobson et al., 2010). For instance, the δD and δ 13 C signatures of bird feathers have been used to estimate breeding Contents lists available at ScienceDirect journal homepage: www.elsevier.com/locate/csr Continental Shelf Research 0278-4343/$ - see front matter & 2013 Elsevier Ltd. All rights reserved. http://dx.doi.org/10.1016/j.csr.2013.08.010 n Corresponding author. E-mail addresses: [email protected] (K.R. Radabaugh), [email protected] (D.J. Hollander), [email protected] (E.B. Peebles). 1 EBP and DJH conceived and designed the study. KRR conducted fieldwork, isotopic analyses, and data analyses. KRR and EBP wrote the manuscript; DJH provided editorial advice. Continental Shelf Research 68 (2013) 112–122

Welcome message from author
This document is posted to help you gain knowledge. Please leave a comment to let me know what you think about it! Share it to your friends and learn new things together.
Transcript
Research papers
Seasonal δ13C and δ15N isoscapes of fish populationsalong a continental shelf trophic gradient
Kara R. Radabaughn, David J. Hollander, Ernst B. Peebles1
College of Marine Science, University of South Florida, St. Petersburg, FL 33701, USA
a r t i c l e i n f o
Article history:Received 31 October 2012Received in revised form21 May 2013Accepted 24 August 2013Available online 31 August 2013
Keywords:Stable isotopeC and N pathwaysIsoscapeMarine food webAnimal migration
a b s t r a c t
The West Florida Shelf, located in the eastern Gulf of Mexico, transitions from a eutrophic ecosystemdominated by the Mississippi River plume to mesotrophic and oligotrophic ecosystems off the coast ofpeninsular Florida. Three extensive trawl surveys in this region were used to acquire samples of fishmuscle, benthic algae from sea urchin stomach contents, and filtered particulate organic matter (POM) tocreate δ13C and δ15N isoscapes. Muscle δ15N from three widely distributed fish species, Synodus foetens(inshore lizardfish), Calamus proridens (littlehead porgy), and Syacium papillosum (dusky flounder),exhibited strong longitudinal correlations (Pearson′s r¼�0.67 to �0.90, po0.001) that coincided withthe principal trophic gradient, whereas δ13C values of fish muscle and benthic algae were correlated withdepth (Pearson′s r¼�0.34 to �0.73, po0.05). Correlations between isotopic values and surfaceconcentrations of chlorophyll and particulate organic carbon (POC) imply linkages between the isotopicbaseline and transitions from eutrophic to oligotrophic waters. The δ13C depth gradient and the δ15Nlongitudinal gradient were consistent between seasons and years, providing a foundation for futurestable isotope studies of animal migration in the Gulf of Mexico.
& 2013 Elsevier Ltd. All rights reserved.
1. Introduction
Isotopic spatial gradients have been found on marine continentalshelves in the δ13C and δ15N values of primary producers, consumers,and organic matter in surface sediments (Weffer and Killingley, 1986;Fry, 1988; Jennings and Warr, 2003; Alt-Epping et al., 2007; Nerotet al., 2012). In consumers, depth-related δ13C variation may bepartially due to consumption of different food sources in inshore andoffshore waters (Cherel and Hobson, 2007; Nerot et al., 2012).In primary producers, δ13C variation is linked to environmentalfactors regulating species composition, rates of primary production,δ13C signatures of aqueous CO2, and the magnitude of photosyntheticfractionation (Fry, 1988; Cooper and DeNiro, 1989; Hofmann et al.,2000; Liu et al., 2007). On a regional scale, marine δ13C values aregenerally higher in shallow waters and in areas with high primaryproductivity (Fry, 1988; Muscatine et al., 1989; Graham et al., 2010).
Spatial gradients in δ15N are also common in continental shelfwaters (Jennings andWarr, 2003; Alt-Epping et al., 2007; Olson et al.,2010; Nerot et al., 2012). Although the specific mechanisms affecting
baseline δ15N gradients on continental shelves vary, the root ofthis phenomenon is often linked to transitions from eutrophic ormesotrophic conditions to oligotrophic waters (Hansson et al., 1997;Alt-Epping et al., 2007; Harmelin-Vivien et al., 2008; Nerot et al.,2012). Diazotrophs such as the cyanobacterium Trichodesmiumprovide fixed nitrogen with δ15N values close to 0‰, which canlower the δ15N baseline in oligotrophic ecosystems (Carpenter et al.,1997; Montoya et al., 2002; Montoya, 2007). In contrast, δ15N ofnutrients and particulate organic matter (POM) in fluvial sourcesmay have higher isotopic values in the range of 5–9‰, particularly ifthe terrestrial runoff contains sewage or manure (Hansson et al.,1997; Kendall et al., 2001). The POM and dissolved nutrients in riverplumes can increase the δ15N baseline in eutrophic or mesotrophicwaters on continental shelves (Alt-Epping et al., 2007; Harmelin-Vivien et al., 2008; Dorado et al., 2012).
Geographic variability in isotope signatures can be displayedgraphically as isoscapes (West et al., 2010). Isoscapes are useful fordetermining the foundation of food webs or the trophic level of aspecies (Graham et al., 2010; Olson et al., 2010). Isoscapes are alsoused to trace the origin and migration of animals, as the isotopiccomposition of an animal′s diet is retained in certain body tissuesfor extended lengths of time (Rubenstein et al., 2002; Hobsonet al., 2010). An animal′s isotopic signature can be compared to theisotopic baseline to determine its most likely origin (Wunder andNorris, 2008; Hobson et al., 2010). For instance, the δD and δ13Csignatures of bird feathers have been used to estimate breeding
Contents lists available at ScienceDirect
journal homepage: www.elsevier.com/locate/csr
Continental Shelf Research
0278-4343/$ - see front matter & 2013 Elsevier Ltd. All rights reserved.http://dx.doi.org/10.1016/j.csr.2013.08.010
n Corresponding author.E-mail addresses: [email protected] (K.R. Radabaugh),
[email protected] (D.J. Hollander), [email protected] (E.B. Peebles).1 EBP and DJH conceived and designed the study. KRR conducted fieldwork,
isotopic analyses, and data analyses. KRR and EBP wrote the manuscript; DJHprovided editorial advice.
Continental Shelf Research 68 (2013) 112–122
latitudes using simple linear regressions of isotopic gradients(Rubenstein et al., 2002; Wunder and Norris, 2008).
Variations in the marine isotopic baseline provide a similaropportunity to estimate the movements of marine animals(Graham et al., 2010; Hobson et al., 2010). Empirical isoscapeshave been created for marine plankton (Graham et al., 2010) andphytoplankton δ13C values have been modeled at global scales(Hofmann et al., 2000). Consumers provide a time-averagedisotopic signal that is more stable than that of primary producers(Post, 2002), yet only a few isoscapes have been created usingmarine fish populations (Jennings and Warr, 2003; Graham et al.,2010; Olson et al., 2010). Isotopic analysis of fish populationspresents the opportunity to examine the temporal and spatialstability of these marine isotopic gradients.
1.1. West Florida Shelf
The West Florida Shelf (WFS, Fig. 1), located in the eastern Gulfof Mexico, exhibits a trophic gradient from highly eutrophicwaters associated with the Mississippi River and Mobile Bay
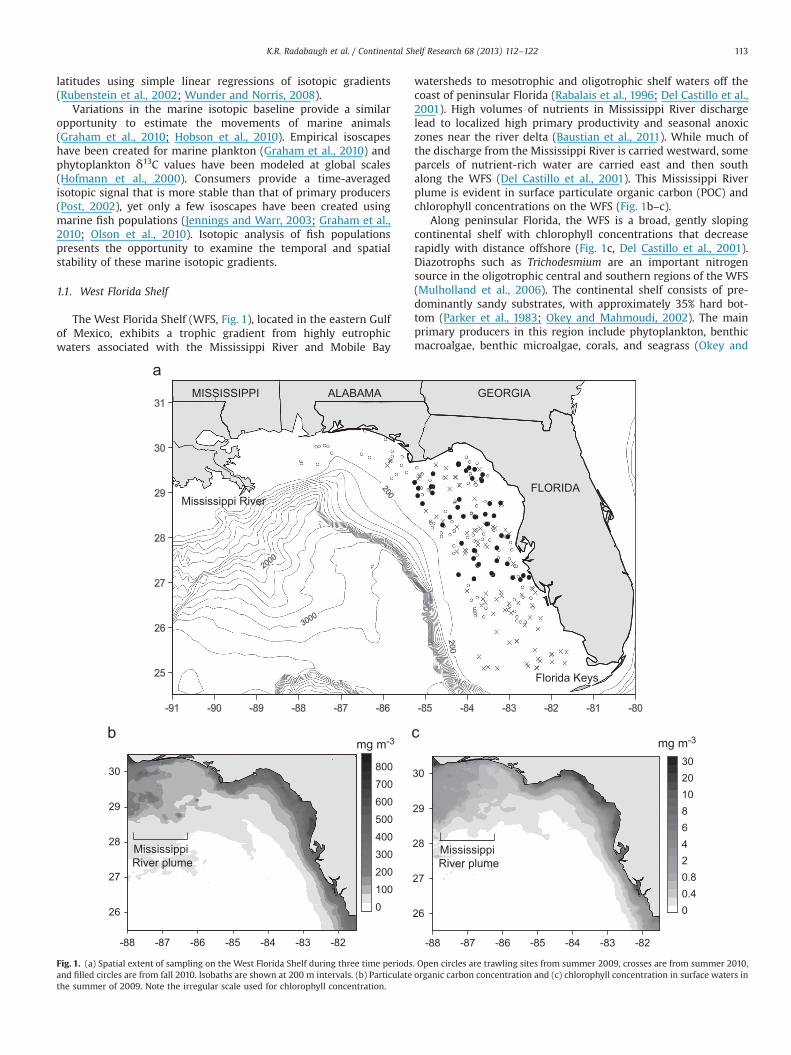
watersheds to mesotrophic and oligotrophic shelf waters off thecoast of peninsular Florida (Rabalais et al., 1996; Del Castillo et al.,2001). High volumes of nutrients in Mississippi River dischargelead to localized high primary productivity and seasonal anoxiczones near the river delta (Baustian et al., 2011). While much ofthe discharge from the Mississippi River is carried westward, someparcels of nutrient-rich water are carried east and then southalong the WFS (Del Castillo et al., 2001). This Mississippi Riverplume is evident in surface particulate organic carbon (POC) andchlorophyll concentrations on the WFS (Fig. 1b–c).
Along peninsular Florida, the WFS is a broad, gently slopingcontinental shelf with chlorophyll concentrations that decreaserapidly with distance offshore (Fig. 1c, Del Castillo et al., 2001).Diazotrophs such as Trichodesmium are an important nitrogensource in the oligotrophic central and southern regions of the WFS(Mulholland et al., 2006). The continental shelf consists of pre-dominantly sandy substrates, with approximately 35% hard bot-tom (Parker et al., 1983; Okey and Mahmoudi, 2002). The mainprimary producers in this region include phytoplankton, benthicmacroalgae, benthic microalgae, corals, and seagrass (Okey and
Mississippi River
Florida Keys
-91 -90 -89 -88 -87 -86 -85 -84 -83 -82 -81 -80
25
26
27
28
29
30
31
FLORIDA
ALABAMA AIGROEGIPPISSISSIM
mg m-3
-88 -87 -86 -85 -84 -83 -82
26
27
28
29
30
0
100
200
300
400
500
600
700
800
-88 -87 -86 -85 -84 -83 -82
26
27
28
29
30
00.40.82468102030
mg m-3
Mississippi River plume
Mississippi River plume
Fig. 1. (a) Spatial extent of sampling on the West Florida Shelf during three time periods. Open circles are trawling sites from summer 2009, crosses are from summer 2010,and filled circles are from fall 2010. Isobaths are shown at 200 m intervals. (b) Particulate organic carbon concentration and (c) chlorophyll concentration in surface waters inthe summer of 2009. Note the irregular scale used for chlorophyll concentration.
K.R. Radabaugh et al. / Continental Shelf Research 68 (2013) 112–122 113
Mahmoudi, 2002). The present study seeks to determine if theshift from eutrophic to oligotrophic waters on the WFS is reflectedin the δ13C and δ15N values of selected primary producers and fishspecies. Additionally, this study examines the spatiotemporalstability of these isotopic values to assess their potential use inanimal migration studies.
2. Materials and methods
2.1. Target species
Calamus proridens (littlehead porgy, family Sparidae), Syaciumpapillosum (dusky flounder, family Paralichthyidae), and Synodusfoetens (inshore lizardfish, family Synodontidae) were selected astarget species due to their abundance and wide distribution on theWFS. C. proridens is a benthic invertebrate feeder that associateswith structures such as reefs and hard bottom in relatively shallowwaters (Darcy, 1986; Okey and Mahmoudi, 2002). S. papillosum is abenthic invertebrate feeder that is commonly found on sand-dominated substrates (Okey and Mahmoudi, 2002). S. foetens is asolitary benthic predator that is also found on sandy substrates(Okey and Mahmoudi, 2002). S. foetens primarily feeds on demersaland pelagic fishes (Cruz-Escalona et al., 2005).
Samples of benthic algae were obtained from the stomachs ofthe variegated sea urchin, Lytechinus variegatus. L. variegatus isprimarily found on sand but is also present on hard substrates inoffshore waters (Cobb and Lawrence, 2005). L. variegatus isomnivorous, yet it exhibits dietary selectivity for algae overanimals (Cobb and Lawrence, 2005). L. variegatus feeds randomlyon the available species of algae, including drift algae. In the Cobband Lawrence (2005) study, the most common taxa of algaeconsumed by L. variegatus at offshore sites on the West FloridaShelf included Chlorophyta (Cladophora spp.), Phaeophyta (Dic-tyota spp., Sargassum spp.), Rhodophyta (Rhodomelaceae family,Kylinia crassipes, Lithothamnion spp.), Anthophyta (Thalassia testu-dinum), and epiphytic microalgae.
2.2. Sample collection
Samples were obtained during Southeast Area Monitoring andAssessment Program (SEAMAP) shrimp and groundfish cruises,which are part of a state/federal program designed to collectfisheries-independent monitoring data. Over 800 samples of thetarget fish species and primary producers were collected andanalyzed from water depths 9.0–102.4 m (Fig. 1a, ElectronicSupplementary material (ESM) 1). Fish and sea urchins wereobtained by deploying 12.8 m otter trawls with 4.1 cm stretchedmesh according to the fishery-independent sampling SEAMAPtrawl protocol (SEDAR27-RD-05). Trawling stations were deter-mined according to a stratified-random sampling design, withrandomization conducted independently for each cruise. Not allfish species or primary producers were collected at each trawlingstation. Samples were collected during three time periods: 10 to30-July-2009, 27-June to 14-July-2010, and 16-October to 12-November-2010. These time periods are hereafter referred to assummer 2009, summer 2010, and fall 2010.
Standard lengths of the three target species were recorded anda lateral muscle sample was collected midway between the dorsaland caudal fins and frozen at �20 1C at sea. Stomach linings andcontents of the sea urchin L. variegatus were removed, avoidingroe, and frozen. Due to the difficulty of isolating phytoplankton,a small size fraction of POM containing both phytoplankton anddetritus was used as a proxy to determine the isotopic baseline ofsurface waters (Harmelin-Vivien et al., 2008; Graham et al., 2010;Dorado et al., 2012). For POM samples, a bucket of surface water
was pre-filtered through a 125 μm sieve to remove most zoo-plankton biomass. A volume of 5–20 L of this water was thenfiltered through pre-combusted Whatman GF/F filters using aperistaltic pump at 10 psi, and the filters were frozen at �20 1C.The filtered amount varied due to variable phytoplankton con-centrations in inshore and offshore waters. POM samples were notcollected in duplicate.
2.3. Stable isotope analysis
Skin, scales, and visible blood vessels were removed fromfish muscle samples. The samples were dried for 48 h at 55 1Cand homogenized into powder using a stainless steel ball mill.0.5–1mg of powdered sample was weighed and packed into tin cups.13C/12C and 15N/14N were measured in duplicate on an ElementalAnalyzer (EA Carlo-Erba NA2500 Series II) coupled to a continuousflow Isotopic Ratio Mass Spectrometer (IRMS ThermoFinniganDeltaþXL) at the University of South Florida College of MarineScience in St. Petersburg, Florida. The lower limit of quantificationwas 12 μg of C or N. Calibrating standards were NIST 8573 andNIST 8574 L-glutamic acid Standard Reference Materials. Analyticalprecision, obtained by replicate measurements of NIST 1570aspinach leaves, was 0.0870.19‰ for δ15N and �27.2870.21‰for δ13C (average standard deviation of n¼307 replicates). δ13C isreported relative to the Pee Dee Belemnite standard and δ15N isreported relative to atmospheric N2, such that
δAð‰Þ ¼ ½ðRspl=RstdÞ–1� � 1000 ð1Þwhere δA is δ15N or δ13C and Rspl and Rstd are the isotopic ratios ofthe sample and standard.
Lipid correction was not necessary as the C:N ratios of all fishmuscle samples were below 3.5, thus lipid content was below 5%(Post et al., 2007). Within fish species, a correction for ontogeneticshifts in trophic level and/or diet was applied if there was asignificant relationship between δ15N or δ13C and the length of thefish (i.e., if linear regression slope po0.05, with each time periodand species assessed separately). This trend removal used theequation
δX′¼ δX–ðmlþbÞþδXm ð2Þwhere δX′ is the corrected δ15N or δ13C value, δX is the originalisotopic value for a fish of standard length l, and δXm is the mean ofall δX from a species. The slope m and intercept b are from thelinear regressions δX¼mlþb presented in Table 1. All datapresented in this manuscript utilize length-detrended isotopicvalues.
Sea urchin stomach contents, which contained algae, calciumcarbonate and silicious sand grains (quartz), were separated fromsea urchin stomach linings and tissues. Algae samples were nottaxonomically identified. Stomach contents were soaked in 0.5 NHCl for 24 h with additional acid added after 12 h. The algae werepoured off the top of the sample, leaving behind settled quartzsand. Algae were rinsed on a 35 μm Nitex mesh sieve, then soakedin de-ionized (DI) water for 1 h. Samples were dried, homoge-nized, and analyzed following the same procedure used for fishmuscle samples. For 17 urchins, stomach contents were dividedinto two samples to test the effect of the acidification procedure onalgal δ15N; the control samples were soaked in DI water instead ofHCl. The acidification procedure used to remove calcium carbonatefrom sea urchin stomach contents did not significantly alter algalδ15N (paired t test, n¼17, t¼�1.04, p¼0.31).
POM filters were rinsed with DI water to remove salt andwere cut in half. For δ13C analysis, half of the filter was acidifiedwith 0.5 N HCl then rinsed with DI water on a vacuum filtrationapparatus at 10 psi. POM samples were dried and analyzed follow-ing the aforementioned procedure. Both acidified and nonacidified
K.R. Radabaugh et al. / Continental Shelf Research 68 (2013) 112–122114
POM samples were analyzed in duplicate; POM samples with poorduplicate replication were omitted from analyses.
2.4. Isoscapes
Isoscapes were created using Surfer version 8.06.39. Ordinarypoint kriging was used with the default linear variogram modeland no drift. Most trawl locations had 2–3 individuals of eachspecies; their isotopic values (length-corrected, if applicable) wereaveraged for the creation of isoscapes. No nugget effect wasspecified; the gridding method was an exact interpolator for theaveraged data at each sampling location. Statistical analyses wereperformed using Statgraphics Centurion XVI Version 16.1.17. For allcorrelations and regressions, isotopic values of fish of the samespecies caught in the same trawl were treated as duplicates andaveraged to avoid pseudoreplication. With the exception of ESM1 and Table 1, all figures and tables within the manuscript utilizethese station-averaged values; thus all means of isotopic data arereferred to as “grand means.”
2.5. Remote sensing data
In order to compare isotopic trends with water-quality para-meters, POC and chlorophyll data were obtained from the Gio-vanni online data system, which is developed and maintained bythe NASA GES DISC at http://giovanni.gsfc.nasa.gov (Berrick et al.,2009). NASA GES DISC defines POC as organic particles that arecaught by a filter with pore size 0.7 μm. MODIS-Aqua data at a4 km resolution were obtained from the Ocean Portal′s OceanColor Radiometry Online Visualization and Analysis system. Satel-lite data were averaged for the calendar month of the start of datacollection and two months prior for summer 2009, summer 2010,and fall 2010. This three month time frame was selected to reflecttissue turnover time. For muscle tissue in adult fish, isotopic halflives in diet-switch studies are generally on the order of 1.5 monthsto 46 months (McIntyre and Flecker, 2006; Buchheister andLatour, 2010; Nelson et al., 2011). The locations for remote sensingdata were matched with stable isotope data to the nearest tenth ofa decimal degree using latitude and longitude.
3. Results
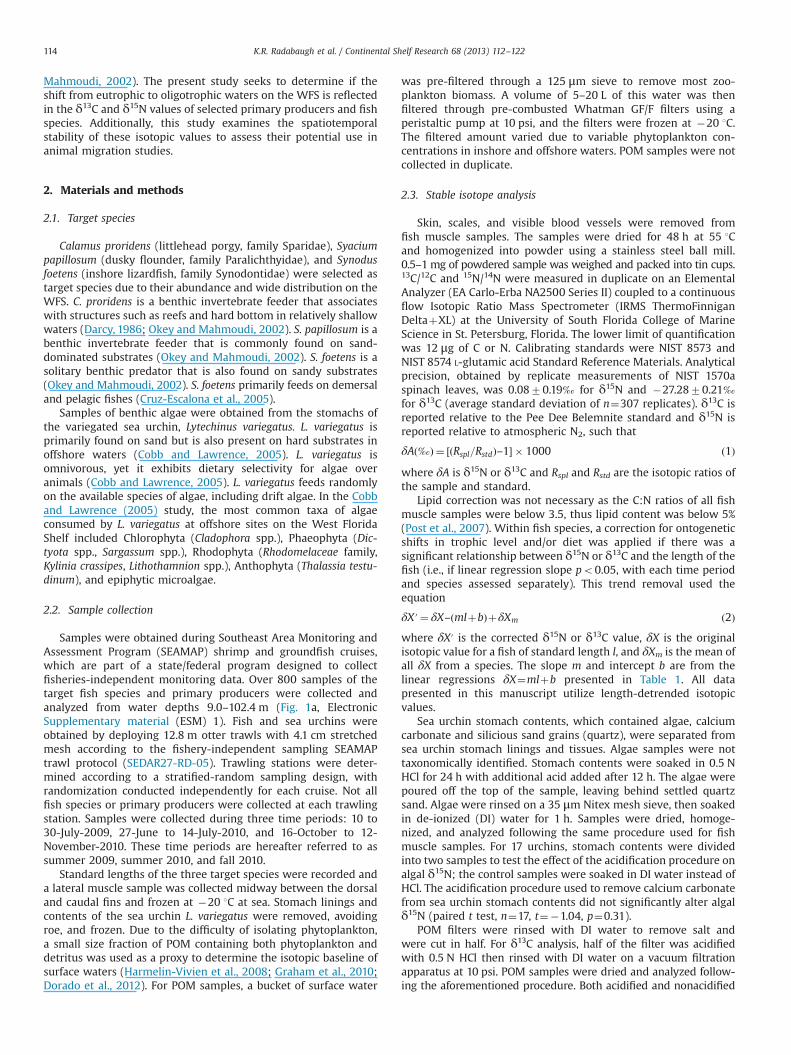
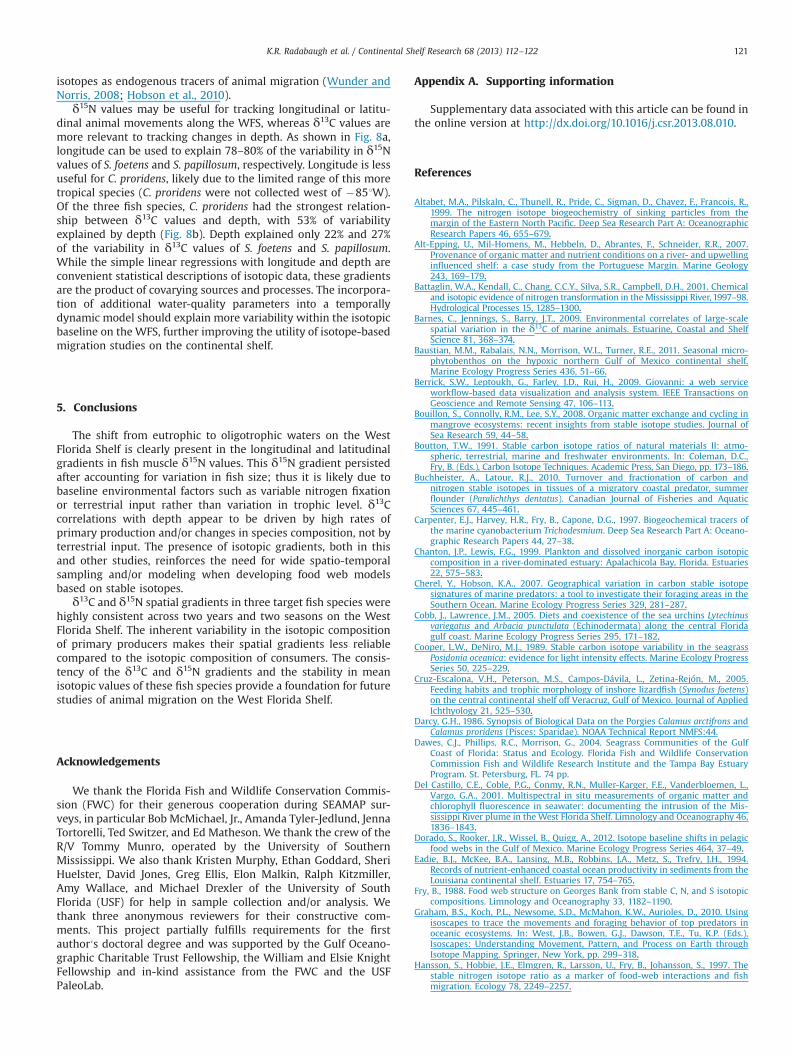
The POC and chlorophyll concentrations from summer 2009 areshown in Fig. 1b and c, respectively. The specific region sampledon the WFS varied during each time period (Fig. 1a). To comparetemporal stability, the grand means of isotopic values werecalculated within the area north of 27.01N and east of �85.31W(outlined region in Fig. 2a), as this region was extensively sampledduring all three time periods. As shown in Fig. 2b, species-specificgrand mean δ15N and δ13C values differed by less than 0.9‰ acrosstime periods (C. proridens and S. foetens ANOVA p-values o0.05,S. papillosum ANOVA p-values 40.05).
Each of the three fish species required corrections for signifi-cant relationships between isotopic composition and length dur-ing at least one of the time periods (Table 1). Isotopic spatialgradients are shown in the isoscapes of the three fish species(Figs. 3–5). The piscivorous S. foetens occupies a higher trophiclevel than S. papillosum and C. proridens; thus higher δ15N valuesare visible in Fig. 3 isoscapes. All three fish species had significantcorrelations between muscle δ15N and latitude and longitude(Table 2). These spatial trends, with higher δ15N in the northwest
δ13C (‰)
δ15N
(‰)
S. papillosum
C. proridens
S. foetens
POM
benthic algae
Longitude
Latit
ude
Summer 2009Summer 2010Fall 2010
-88 -87 -86 -85 -84 -83 -82 -81 -8025
26
27
28
29
30
31
Summer 2009Summer 2010Fall 2010
-24 -22 -20 -18 -16 -14
2
4
6
8
10
12
14
Fig. 2. (a) The square outlines the spatial extent sampled during all three timeperiods; this region was used to calculate (b) grand mean δ13C and δ15N values (7SD) of fish and primary producers across the three time periods. POM was notcollected in 2009.
Table 1Significant relationships between fish standard length (l, in cm) and muscle tissueδ13C and δ15N composition. Values from linear regressions used in Eq. (2) for lengthcorrection.
Fish species,time period
n fish Stableisotope
R2 Slopep-value
Linearregression
Calamus proridensSummer 2009 64 δ15N 0.024 0.216 None
δ13C 0.046 0.091 NoneSummer 2010 56 δ15N 0.042 0.132 None
δ13C 0.002 0.768 NoneFall 2010 61 δ15N 0.385 o0.001 δ15N¼8.04þ0.09� l
δ13C 0.020 0.278 None
Synodus foetensSummer 2009 104 δ15N 0.001 0.733 None
δ13C 0.418 o0.001 δ13C¼�19.45þ0.09� lSummer 2010 71 δ15N 0.004 0.612 None
δ13C 0.197 o0.001 δ13C¼�20.14þ0.10� lFall 2010 51 δ15N 0.301 o0.001 δ15N¼8.65þ0.087� l
δ13C 0.028 0.243 None
Syacium papillosumSummer 2009 183 δ15N 0.042 0.006 δ15N¼8.07þ0.07� l
δ13C 0.034 0.013 δ13C¼�18.35þ0.06� lSummer 2010 72 δ15N 0.004 0.588 None
δ13C 0.079 0.017 δ13C¼�19.06þ0.07� lFall 2010 69 δ15N 0.057 0.049 δ15N¼7.93þ0.06� l
δ13C 0.016 0.301 None
K.R. Radabaugh et al. / Continental Shelf Research 68 (2013) 112–122 115
-19
-18
-17
-16
-15δ13C (‰)
Longitude
Latit
ude 25
26
27
28
29
30
δ15N (‰)
10
11
12
13
-88 -87 -86 -85 -84 -83 -8225
26
27
28
29
30
-86 -85 -84 -83 -82 -86 -85 -84 -83 -82
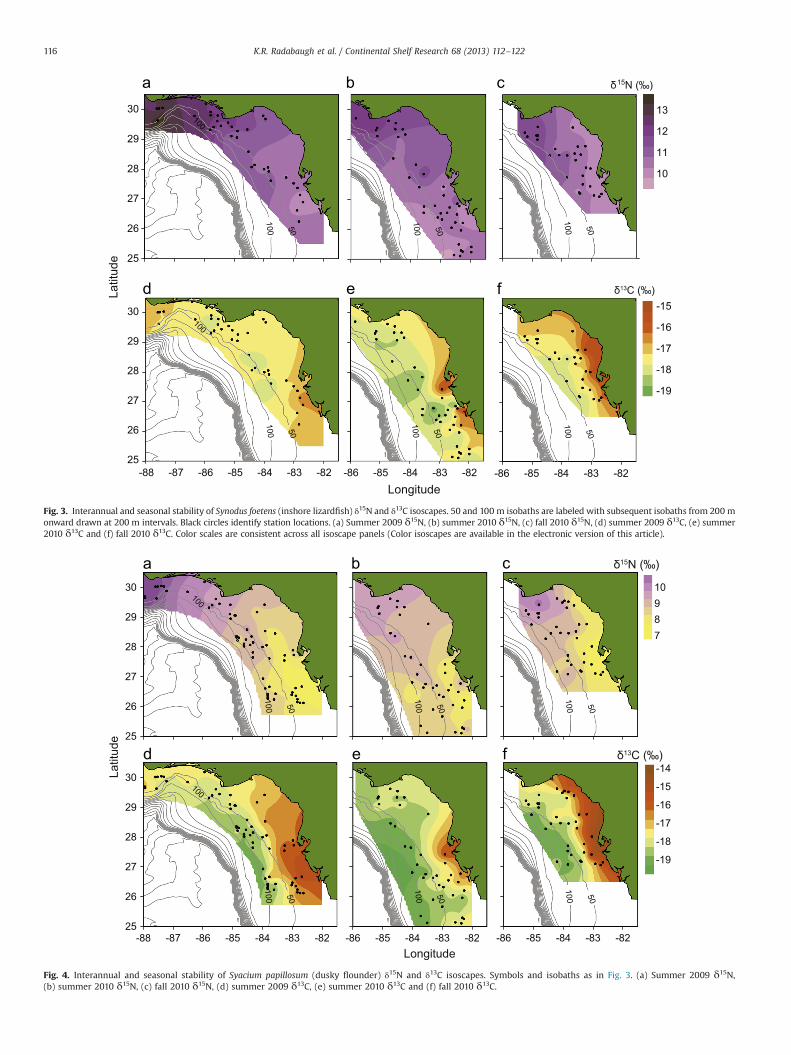
Fig. 3. Interannual and seasonal stability of Synodus foetens (inshore lizardfish) δ15N and δ13C isoscapes. 50 and 100 m isobaths are labeled with subsequent isobaths from 200 monward drawn at 200 m intervals. Black circles identify station locations. (a) Summer 2009 δ15N, (b) summer 2010 δ15N, (c) fall 2010 δ15N, (d) summer 2009 δ13C, (e) summer2010 δ13C and (f) fall 2010 δ13C. Color scales are consistent across all isoscape panels (Color isoscapes are available in the electronic version of this article).
Latit
ude
Longitude
78910
δ15N (‰)
-19
-18
-17
-16
-15
-14δ13C (‰)
-86 -85 -84 -83 -82-86 -85 -84 -83 -82-88 -87 -86 -85 -84 -83 -8225
26
27
28
29
30
25
26
27
28
29
30
Fig. 4. Interannual and seasonal stability of Syacium papillosum (dusky flounder) δ15N and δ13C isoscapes. Symbols and isobaths as in Fig. 3. (a) Summer 2009 δ15N,(b) summer 2010 δ15N, (c) fall 2010 δ15N, (d) summer 2009 δ13C, (e) summer 2010 δ13C and (f) fall 2010 δ13C.
K.R. Radabaugh et al. / Continental Shelf Research 68 (2013) 112–122116
region of the WFS and lower values near southwest Florida, areclearly visible in the δ15N isoscapes (Figs. 3–5). Longitudinal δ15Ncorrelations were significant for all three fish species during eachtime period (all p-values o0.01). S. foetens and S. papillosum δ15Nvalues also had significant positive correlations with surfacechlorophyll and POC concentrations (Table 2). Benthic algae andPOM had less consistent δ15N spatial trends (Figs. 6 and 7), andlacked many of the spatial correlations present in fish populations(Table 2).
There were significant negative correlations between waterdepth and δ13C for all three fish species and benthic algae(Table 2). These correlations, with higher δ13C values present inshallower waters, were significant for all three fish species duringeach time period (p-values o0.05). Fish muscle δ13C values alsodemonstrated significant positive correlations with surface POCand chlorophyll concentrations (Table 2). Simple linear regressionswere fit to δ15N as a function of longitude and δ13C as a functionof depth to examine the predictive capabilities of these
9
10
δ15N (‰)
Latit
ude
Longitude-86 -85 -84 -83 -82-86 -85 -84 -83 -82
25
26
27
28
29
30
-17
-16
-15
-14δ13C (‰)
-86 -85 -84 -83 -82
25
26
27
28
29
30
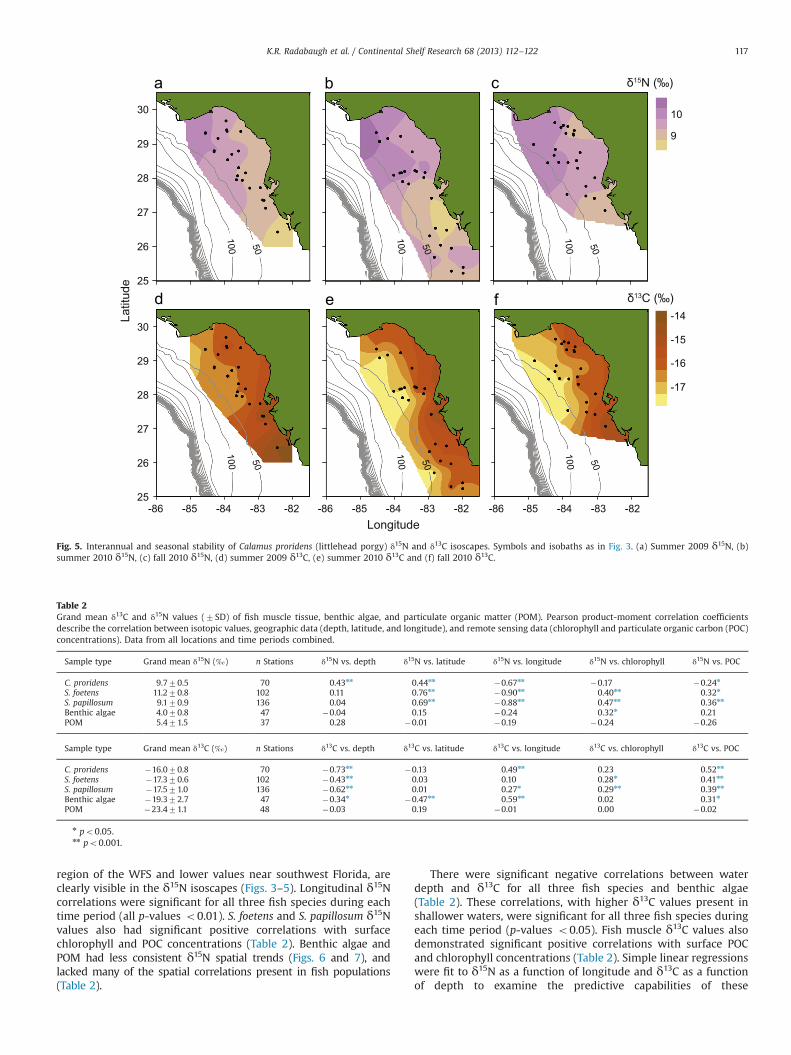
Fig. 5. Interannual and seasonal stability of Calamus proridens (littlehead porgy) δ15N and δ13C isoscapes. Symbols and isobaths as in Fig. 3. (a) Summer 2009 δ15N, (b)summer 2010 δ15N, (c) fall 2010 δ15N, (d) summer 2009 δ13C, (e) summer 2010 δ13C and (f) fall 2010 δ13C.
Table 2Grand mean δ13C and δ15N values (7SD) of fish muscle tissue, benthic algae, and particulate organic matter (POM). Pearson product-moment correlation coefficientsdescribe the correlation between isotopic values, geographic data (depth, latitude, and longitude), and remote sensing data (chlorophyll and particulate organic carbon (POC)concentrations). Data from all locations and time periods combined.
Sample type Grand mean δ15N (‰) n Stations δ15N vs. depth δ15N vs. latitude δ15N vs. longitude δ15N vs. chlorophyll δ15N vs. POC
C. proridens 9.770.5 70 0.43nn 0.44nn �0.67nn �0.17 �0.24n
S. foetens 11.270.8 102 0.11 0.76nn �0.90nn 0.40nn 0.32n
S. papillosum 9.170.9 136 0.04 0.69nn �0.88nn 0.47nn 0.36nn
Benthic algae 4.070.8 47 �0.04 0.15 �0.24 0.32n 0.21POM 5.471.5 37 0.28 �0.01 �0.19 �0.24 �0.26
Sample type Grand mean δ13C (‰) n Stations δ13C vs. depth δ13C vs. latitude δ13C vs. longitude δ13C vs. chlorophyll δ13C vs. POC
C. proridens �16.070.8 70 �0.73nn �0.13 0.49nn 0.23 0.52nn
S. foetens �17.370.6 102 �0.43nn 0.03 0.10 0.28n 0.41nn
S. papillosum �17.571.0 136 �0.62nn 0.01 0.27n 0.29nn 0.39nn
Benthic algae �19.372.7 47 �0.34n �0.47nn 0.59nn 0.02 0.31n
POM �23.471.1 48 �0.03 0.19 �0.01 0.00 �0.02
n po0.05.nn po0.001.
K.R. Radabaugh et al. / Continental Shelf Research 68 (2013) 112–122 117
characteristics on fish isotopic values (Fig. 8). Data utilized for thedepth vs. δ13C regression lines in Fig. 8b were restricted to 0–53 mto reflect the depth range shared by all three target fish species.
4. Discussion
4.1. δ13C correlations
δ13C depth gradients have previously been found in primaryproducers such as macroalgae, seagrass, and coral zooxanthellae(Weffer and Killingley, 1986; Cooper and DeNiro, 1989; Muscatineet al., 1989) and in consumers such as molluscs, seabirds, andsquid (Cherel and Hobson, 2007; Barnes et al., 2009; Nerot et al.,2012; Ruiz-Cooley and Gerrodette, 2012). While some of thisvariability is due to differences between inshore and offshorespecies, δ13C values of primary producers are also impacted by themagnitude of photosynthetic fractionation (εp). εp occurs whenplants selectively fix 12C over 13C during photosynthesis, resultingin primary producers with lower δ13C values relative to ambientCO2. Among other factors, the magnitude of εp is lower during highgrowth rates and in low aqueous CO2 concentrations (Popp et al.,1998; Hofmann et al., 2000). Thus, δ13C depth gradients in benthicmacroalgae, seagrass, and coral zooxanthellae have been attribu-ted to increased light availability in shallow waters leading tohigher growth rates and lower εp (Weffer and Killingley, 1986;Cooper and DeNiro, 1989; Muscatine et al., 1989). Regions of highproductivity may also drive down localized aquatic CO2 concen-trations and alter the δ13C values of available CO2 (Liu et al., 2007;Graham et al., 2010).
In the present study, correlations between δ13C values and bothPOC and chlorophyll concentrations support the idea that rapidalgal growth rates in shallow, nutrient-rich waters may havereduced εp by one of the processes mentioned above, resultingin higher δ13C values. δ13C correlations with POC concentrationwere consistently stronger than correlations with chlorophyll(Table 2). Although POC and chlorophyll concentrations are bothhigh along peninsular Florida and within the Mississippi Riverplume, chlorophyll concentrations decrease more rapidly than POCconcentrations (note different scales in Fig. 1b and c).
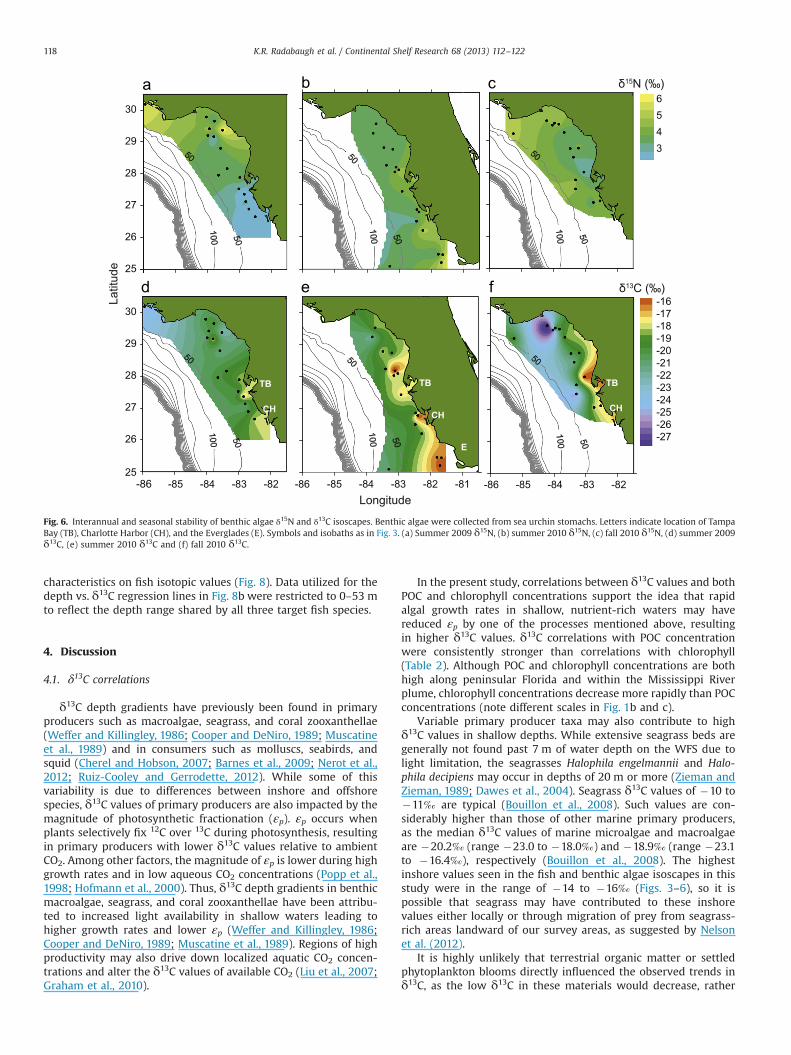
Variable primary producer taxa may also contribute to highδ13C values in shallow depths. While extensive seagrass beds aregenerally not found past 7 m of water depth on the WFS due tolight limitation, the seagrasses Halophila engelmannii and Halo-phila decipiens may occur in depths of 20 m or more (Zieman andZieman, 1989; Dawes et al., 2004). Seagrass δ13C values of �10 to�11‰ are typical (Bouillon et al., 2008). Such values are con-siderably higher than those of other marine primary producers,as the median δ13C values of marine microalgae and macroalgaeare �20.2‰ (range �23.0 to �18.0‰) and �18.9‰ (range �23.1to �16.4‰), respectively (Bouillon et al., 2008). The highestinshore values seen in the fish and benthic algae isoscapes in thisstudy were in the range of �14 to �16‰ (Figs. 3–6), so it ispossible that seagrass may have contributed to these inshorevalues either locally or through migration of prey from seagrass-rich areas landward of our survey areas, as suggested by Nelsonet al. (2012).
It is highly unlikely that terrestrial organic matter or settledphytoplankton blooms directly influenced the observed trends inδ13C, as the low δ13C in these materials would decrease, rather
Latit
ude
3456
δ15N (‰)
-86 -85 -84 -83 -8225
26
27
28
29
30
TB
CH
δ13C (‰)
-27-26-25-24-23-22-21-20-19-18-17-16
-86 -85 -84 -83 -82
TB
CH
Longitude-86 -85 -84 -83 -82 -81
TB
CH
E
25
26
27
28
29
30
Fig. 6. Interannual and seasonal stability of benthic algae δ15N and δ13C isoscapes. Benthic algae were collected from sea urchin stomachs. Letters indicate location of TampaBay (TB), Charlotte Harbor (CH), and the Everglades (E). Symbols and isobaths as in Fig. 3. (a) Summer 2009 δ15N, (b) summer 2010 δ15N, (c) fall 2010 δ15N, (d) summer 2009δ13C, (e) summer 2010 δ13C and (f) fall 2010 δ13C.
K.R. Radabaugh et al. / Continental Shelf Research 68 (2013) 112–122118
than increase, δ13C values in nearshore waters (Chanton andLewis, 1999; Dorado et al., 2012; Radabaugh and Peebles, 2012).The average δ13C signatures of terrestrial C3 and C4 plants are�27‰ (range �33 to �20‰) and �13‰ (range �17 to �9‰),respectively (Boutton, 1991; Sharp, 2007). C4 Spartina grasses arepresent in northern Florida, but southern Florida coastlines aredominated by C3 mangroves (Dawes et al., 2004). Thus C4 plantsare unlikely to significantly contribute organic matter with highδ13C values to fluvial POM along the southern Florida peninsula.Even within the Apalachicola estuary, which is located on Florida′snorthern Gulf coast in an area that includes substantial Spartinamarshes, average δ13C values from POM are �26.7 to �22.4‰(total range �30.2 to �22.0‰) (Chanton and Lewis, 1999). Giventhese low δ13C values for fluvial POM, it is unlikely that terrestrialmaterial influenced δ13C values in our study as the highest valueswere found near shore.
4.2. POM isotopic values
Significant correlations that were present in benthic algae andfish isotopic values were absent in surface POM values (Table 2),even when each time period was examined independently. Corre-lations were also weaker in benthic algae than in fish. Primaryproducers have an inherently variable isotopic signal, whereasconsumers present a more stable, time-averaged signature (Post,2002). This may explain why gradients found in multiple species offish are not as clear at the primary producer level. Additionally, thePOM samples presented in this study were only obtained from
surface water. POM δ13C values vary with depth due to variablephotosynthetic fractionation and remineralization of sinkingorganic matter (Liu et al., 2007; Harmelin-Vivien et al., 2008).Thus, surface POM does not present the full spectrum of plank-tonic isotopic values in the water column.
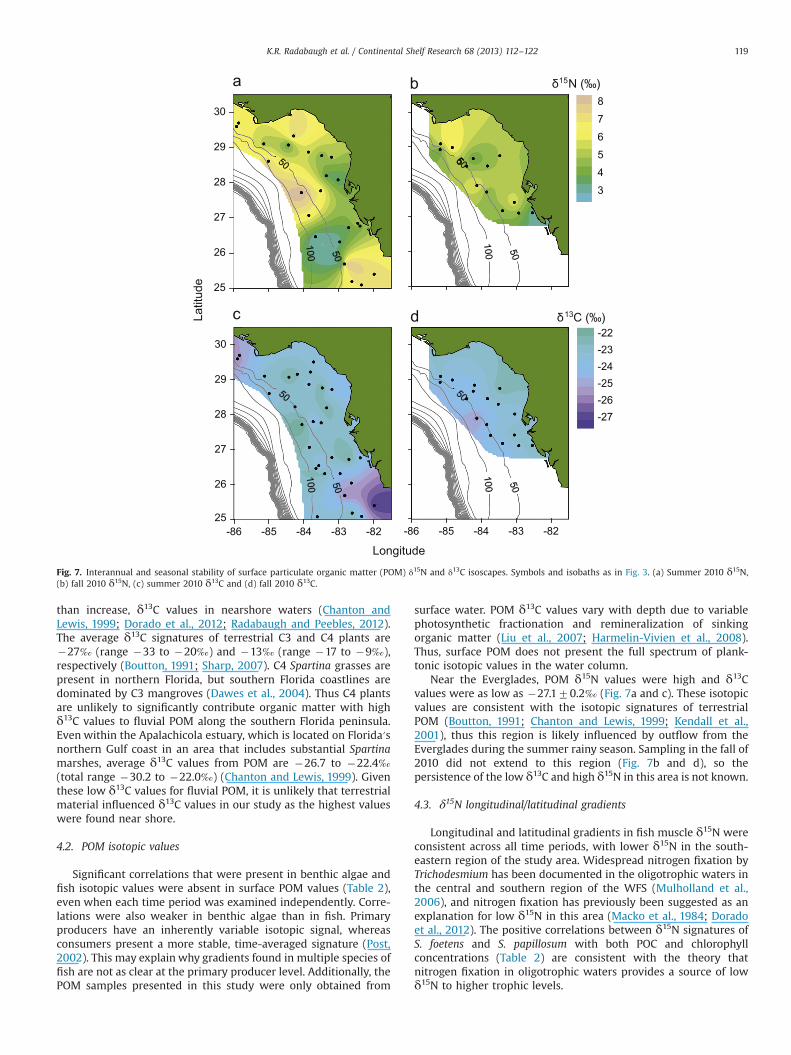
Near the Everglades, POM δ15N values were high and δ13Cvalues were as low as �27.170.2‰ (Fig. 7a and c). These isotopicvalues are consistent with the isotopic signatures of terrestrialPOM (Boutton, 1991; Chanton and Lewis, 1999; Kendall et al.,2001), thus this region is likely influenced by outflow from theEverglades during the summer rainy season. Sampling in the fall of2010 did not extend to this region (Fig. 7b and d), so thepersistence of the low δ13C and high δ15N in this area is not known.
4.3. δ15N longitudinal/latitudinal gradients
Longitudinal and latitudinal gradients in fish muscle δ15N wereconsistent across all time periods, with lower δ15N in the south-eastern region of the study area. Widespread nitrogen fixation byTrichodesmium has been documented in the oligotrophic waters inthe central and southern region of the WFS (Mulholland et al.,2006), and nitrogen fixation has previously been suggested as anexplanation for low δ15N in this area (Macko et al., 1984; Doradoet al., 2012). The positive correlations between δ15N signatures ofS. foetens and S. papillosum with both POC and chlorophyllconcentrations (Table 2) are consistent with the theory thatnitrogen fixation in oligotrophic waters provides a source of lowδ15N to higher trophic levels.
Longitude
Latit
ude
25
26
27
28
29
30
-86 -85 -84 -83 -82
25
26
27
28
29
30
3
4
5
6
7
8
-86 -85 -84 -83 -82
-27-26-25-24-23-22
δ15N (‰)
δ13C (‰)
Fig. 7. Interannual and seasonal stability of surface particulate organic matter (POM) δ15N and δ13C isoscapes. Symbols and isobaths as in Fig. 3. (a) Summer 2010 δ15N,(b) fall 2010 δ15N, (c) summer 2010 δ13C and (d) fall 2010 δ13C.
K.R. Radabaugh et al. / Continental Shelf Research 68 (2013) 112–122 119
δ15N variability along eutrophic-to-oligotrophic gradients havealso been linked to fluvial outflows (Hansson et al., 1997;Harmelin-Vivien et al., 2008; Nerot et al., 2012) and to oceanicupwelling (Olson et al., 2010; Ruiz-Cooley and Gerrodette, 2012).The correlations between δ15N values and both POC and chlor-ophyll concentrations may be linked to intrusions of the Missis-sippi River plume, which is carried along the WFS by the Gulf ofMexico Loop Current (Del Castillo et al., 2001). In the lowerMississippi River and its tributaries, average δ15N ranges from�3 to 9‰ for nitrate and �5 to 7‰ for POM, providing arelatively high δ15N source to the Gulf of Mexico and possibly tothe northwestern portion of our study area (Battaglin et al., 2001;Kendall et al., 2001; Dorado et al., 2012). δ15N values fromsedimentary organic matter near the mouth of the MississippiRiver have increased by approximately 1.5–2‰ over the pastcentury (Eadie et al., 1994). If current trends in eutrophicationcontinue, this source of high δ15N may become even moreprominent in the future.
Finally, denitrification can be a source of high δ15N (Altabetet al., 1999; Montoya, 2007). Under low oxygen conditions,bacteria use nitrate as an electron acceptor during respiration.The strong fractionation (20–30‰) during this denitrificationprocess results in higher δ15N for the residual nitrate (Altabetet al., 1999; Montoya, 2007). Although the surveyed region waseast of areas known to experience the chronic anoxia that facil-itates denitrification (Rabalais et al., 1996), westward water massesthat do experience anoxia and extensive denitrification are morelikely to mix with waters in the northwest part of the survey areathan the southeast part. The only explanation for fish δ15N spatialgradients that we do not believe to be likely is geographicdifferences in trophic level. Within-species variation in trophiclevel is generally related to increased fish length and mouth gape,yet the strong δ15N gradients persisted after removal of thispotential bias.
4.4. Fish and sea urchin site fidelity
The significant spatial isotopic gradients in fish muscle implythe three target fish species had relatively high site fidelities, asextensive movement by fish throughout the study area would havedestroyed the observed gradients. Prior studies have found thatthese three species can be somewhat mobile on continentalshelves. S. foetens moves between trawled and non-trawled areasin the northern Gulf of Mexico (Jeffers et al., 2008). Near theYucatan peninsula, C. proridens moves seasonally on continentalshelves (Darcy, 1986). While limited information is availableconcerning movement patterns of S. papillosum, other membersof the Syacium genus near the Yucatan peninsula have been foundto exhibit seasonal movements driven by spawning and changes inprimary productivity on the continental shelf (Sánchez-Gil et al.,1994). At some point in their life cycles, all three species of fish arecapable of moving tens of kilometers, primarily between inshoreand offshore waters on continental shelves (Darcy, 1986; Sánchez-Gil et al., 1994; Cruz-Escalona et al., 2005; Jeffers et al., 2008).Some of the small-scale variability in the fish isoscapes may bedue to fish mobility rather than to true differences in the isotopicbaseline. Nevertheless, the consistent isotopic gradients imply thespecimens analyzed during the present study must have main-tained a high degree of site fidelity during the months prior tosampling.
L. variegatus has also been found to move about on continentalshelves (Moore et al., 1963). However, the distance the algaesamples could travel within the urchin would be limited by therates of movement and digestion by the sea urchins. Moresignificant influences on the clarity of algal isotopic patterns maybe the impact of digestion or the inclusion of drift algae, whichL. variegatus is known to consume indiscriminately (Cobb andLawrence, 2005). L. variegatus is omnivorous (Cobb and Lawrence,2005), so some animal material may have been present in stomachcontents. However, membranes or other visible animal tissue weremanually removed during the algal preparation procedure.
4.5. Utility of isoscapes for animal migration studies
Previous studies have found seasonally variable δ15N and δ13Csignatures on continental shelves as a result of variable fluvialinput and primary productivity (Mariotti et al., 1983; Kürten et al.,2012). However, in this study, average isotopic values were fairlyconsistent interannually and seasonally for the target fish species,with grand means for both δ15N and δ13C varying by less than0.9‰ (Fig. 2b). This stability and the presence of consistent andsignificant spatial gradients provide the basis of a reliable isoscapefor the WFS, fulfilling the first requirement for using stable
C. proridens
S. foetens
S. papillosumδ13C = -15.77 - 0.05z, R2 = 0.27
δ13C = -16.47 - 0.03z, R2 = 0.22
δ13C = -14.34 - 0.06z, R2 = 0.53
δ13C
(‰)
Depth (m)
C. proridens
S. foetens
S. papillosumδ15N = -31.43 - 0.49L, R2 = 0.45
δ15N = -36.47 - 0.57L, R2 = 0.80
δ15N = -45.06 - 0.64L, R2 = 0.78
δ15N
(‰)
Longitude
-88 -87 -86 -85 -84 -83 -82 -817
8
9
10
11
12
13
14
15
10 20 30 40 50
-19
-18
-17
-16
-15
-14
-13
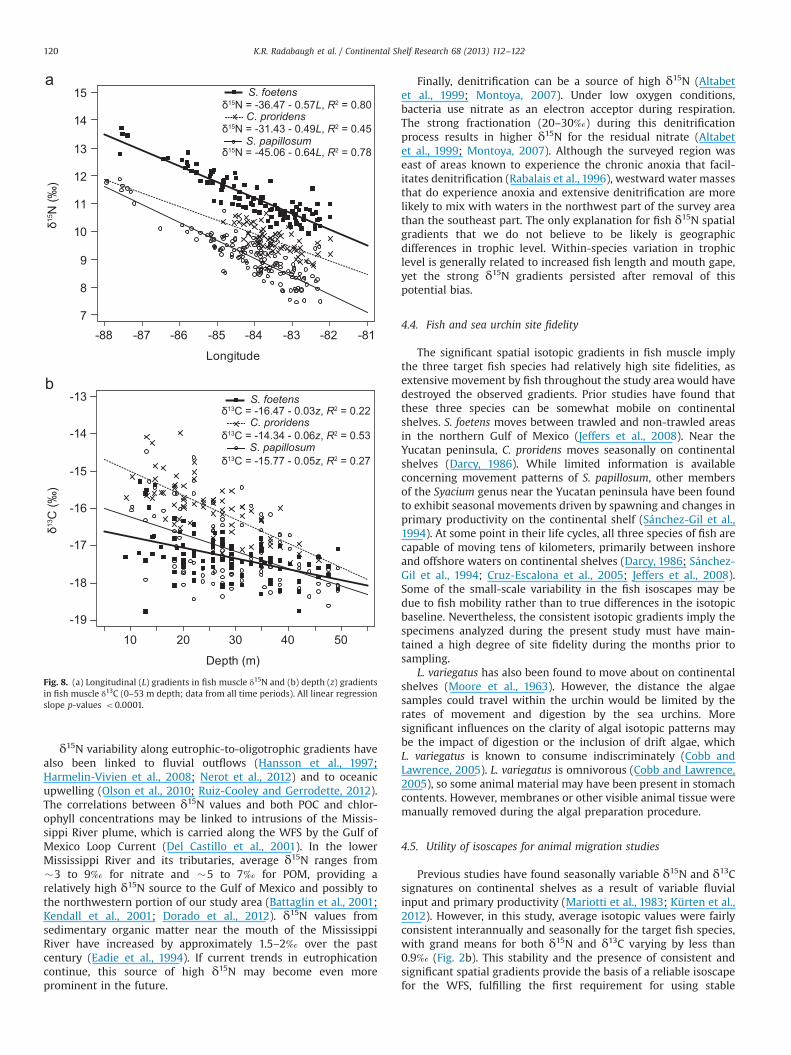
Fig. 8. (a) Longitudinal (L) gradients in fish muscle δ15N and (b) depth (z) gradientsin fish muscle δ13C (0–53 m depth; data from all time periods). All linear regressionslope p-values o0.0001.
K.R. Radabaugh et al. / Continental Shelf Research 68 (2013) 112–122120
isotopes as endogenous tracers of animal migration (Wunder andNorris, 2008; Hobson et al., 2010).
δ15N values may be useful for tracking longitudinal or latitu-dinal animal movements along the WFS, whereas δ13C values aremore relevant to tracking changes in depth. As shown in Fig. 8a,longitude can be used to explain 78–80% of the variability in δ15Nvalues of S. foetens and S. papillosum, respectively. Longitude is lessuseful for C. proridens, likely due to the limited range of this moretropical species (C. proridens were not collected west of �851W).Of the three fish species, C. proridens had the strongest relation-ship between δ13C values and depth, with 53% of variabilityexplained by depth (Fig. 8b). Depth explained only 22% and 27%of the variability in δ13C values of S. foetens and S. papillosum.While the simple linear regressions with longitude and depth areconvenient statistical descriptions of isotopic data, these gradientsare the product of covarying sources and processes. The incorpora-tion of additional water-quality parameters into a temporallydynamic model should explain more variability within the isotopicbaseline on the WFS, further improving the utility of isotope-basedmigration studies on the continental shelf.
5. Conclusions
The shift from eutrophic to oligotrophic waters on the WestFlorida Shelf is clearly present in the longitudinal and latitudinalgradients in fish muscle δ15N values. This δ15N gradient persistedafter accounting for variation in fish size; thus it is likely due tobaseline environmental factors such as variable nitrogen fixationor terrestrial input rather than variation in trophic level. δ13Ccorrelations with depth appear to be driven by high rates ofprimary production and/or changes in species composition, not byterrestrial input. The presence of isotopic gradients, both in thisand other studies, reinforces the need for wide spatio-temporalsampling and/or modeling when developing food web modelsbased on stable isotopes.
δ13C and δ15N spatial gradients in three target fish species werehighly consistent across two years and two seasons on the WestFlorida Shelf. The inherent variability in the isotopic compositionof primary producers makes their spatial gradients less reliablecompared to the isotopic composition of consumers. The consis-tency of the δ13C and δ15N gradients and the stability in meanisotopic values of these fish species provide a foundation for futurestudies of animal migration on the West Florida Shelf.
Acknowledgements
We thank the Florida Fish and Wildlife Conservation Commis-sion (FWC) for their generous cooperation during SEAMAP sur-veys, in particular Bob McMichael, Jr., Amanda Tyler-Jedlund, JennaTortorelli, Ted Switzer, and Ed Matheson. We thank the crew of theR/V Tommy Munro, operated by the University of SouthernMississippi. We also thank Kristen Murphy, Ethan Goddard, SheriHuelster, David Jones, Greg Ellis, Elon Malkin, Ralph Kitzmiller,Amy Wallace, and Michael Drexler of the University of SouthFlorida (USF) for help in sample collection and/or analysis. Wethank three anonymous reviewers for their constructive com-ments. This project partially fulfills requirements for the firstauthor′s doctoral degree and was supported by the Gulf Oceano-graphic Charitable Trust Fellowship, the William and Elsie KnightFellowship and in-kind assistance from the FWC and the USFPaleoLab.
Appendix A. Supporting information
Supplementary data associated with this article can be found inthe online version at http://dx.doi.org/10.1016/j.csr.2013.08.010.
References
Altabet, M.A., Pilskaln, C., Thunell, R., Pride, C., Sigman, D., Chavez, F., Francois, R.,1999. The nitrogen isotope biogeochemistry of sinking particles from themargin of the Eastern North Pacific. Deep Sea Research Part A: OceanographicResearch Papers 46, 655–679.
Alt-Epping, U., Mil-Homens, M., Hebbeln, D., Abrantes, F., Schneider, R.R., 2007.Provenance of organic matter and nutrient conditions on a river- and upwellinginfluenced shelf: a case study from the Portuguese Margin. Marine Geology243, 169–179.
Battaglin, W.A., Kendall, C., Chang, C.C.Y., Silva, S.R., Campbell, D.H., 2001. Chemicaland isotopic evidence of nitrogen transformation in the Mississippi River, 1997–98.Hydrological Processes 15, 1285–1300.
Barnes, C., Jennings, S., Barry, J.T., 2009. Environmental correlates of large-scalespatial variation in the δ13C of marine animals. Estuarine, Coastal and ShelfScience 81, 368–374.
Baustian, M.M., Rabalais, N.N., Morrison, W.L., Turner, R.E., 2011. Seasonal micro-phytobenthos on the hypoxic northern Gulf of Mexico continental shelf.Marine Ecology Progress Series 436, 51–66.
Berrick, S.W., Leptoukh, G., Farley, J.D., Rui, H., 2009. Giovanni: a web serviceworkflow-based data visualization and analysis system. IEEE Transactions onGeoscience and Remote Sensing 47, 106–113.
Bouillon, S., Connolly, R.M., Lee, S.Y., 2008. Organic matter exchange and cycling inmangrove ecosystems: recent insights from stable isotope studies. Journal ofSea Research 59, 44–58.
Boutton, T.W., 1991. Stable carbon isotope ratios of natural materials II: atmo-spheric, terrestrial, marine and freshwater environments. In: Coleman, D.C.,Fry, B. (Eds.), Carbon Isotope Techniques. Academic Press, San Diego, pp. 173–186.
Buchheister, A., Latour, R.J., 2010. Turnover and fractionation of carbon andnitrogen stable isotopes in tissues of a migratory coastal predator, summerflounder (Paralichthys dentatus). Canadian Journal of Fisheries and AquaticSciences 67, 445–461.
Carpenter, E.J., Harvey, H.R., Fry, B., Capone, D.G., 1997. Biogeochemical tracers ofthe marine cyanobacterium Trichodesmium. Deep Sea Research Part A: Oceano-graphic Research Papers 44, 27–38.
Chanton, J.P., Lewis, F.G., 1999. Plankton and dissolved inorganic carbon isotopiccomposition in a river-dominated estuary: Apalachicola Bay, Florida. Estuaries22, 575–583.
Cherel, Y., Hobson, K.A., 2007. Geographical variation in carbon stable isotopesignatures of marine predators: a tool to investigate their foraging areas in theSouthern Ocean. Marine Ecology Progress Series 329, 281–287.
Cobb, J., Lawrence, J.M., 2005. Diets and coexistence of the sea urchins Lytechinusvariegatus and Arbacia punctulata (Echinodermata) along the central Floridagulf coast. Marine Ecology Progress Series 295, 171–182.
Cooper, L.W., DeNiro, M.J., 1989. Stable carbon isotope variability in the seagrassPosidonia oceanica: evidence for light intensity effects. Marine Ecology ProgressSeries 50, 225–229.
Cruz-Escalona, V.H., Peterson, M.S., Campos-Dávila, L., Zetina-Rejón, M., 2005.Feeding habits and trophic morphology of inshore lizardfish (Synodus foetens)on the central continental shelf off Veracruz, Gulf of Mexico. Journal of AppliedIchthyology 21, 525–530.
Darcy, G.H., 1986. Synopsis of Biological Data on the Porgies Calamus arctifrons andCalamus proridens (Pisces: Sparidae). NOAA Technical Report NMFS:44.
Dawes, C.J., Phillips, R.C., Morrison, G., 2004. Seagrass Communities of the GulfCoast of Florida: Status and Ecology. Florida Fish and Wildlife ConservationCommission Fish and Wildlife Research Institute and the Tampa Bay EstuaryProgram. St. Petersburg, FL. 74 pp.
Del Castillo, C.E., Coble, P.G., Conmy, R.N., Muller-Karger, F.E., Vanderbloemen, L.,Vargo, G.A., 2001. Multispectral in situ measurements of organic matter andchlorophyll fluorescence in seawater: documenting the intrusion of the Mis-sissippi River plume in the West Florida Shelf. Limnology and Oceanography 46,1836–1843.
Dorado, S., Rooker, J.R., Wissel, B., Quigg, A., 2012. Isotope baseline shifts in pelagicfood webs in the Gulf of Mexico. Marine Ecology Progress Series 464, 37–49.
Eadie, B.J., McKee, B.A., Lansing, M.B., Robbins, J.A., Metz, S., Trefry, J.H., 1994.Records of nutrient-enhanced coastal ocean productivity in sediments from theLouisiana continental shelf. Estuaries 17, 754–765.
Fry, B., 1988. Food web structure on Georges Bank from stable C, N, and S isotopiccompositions. Limnology and Oceanography 33, 1182–1190.
Graham, B.S., Koch, P.L., Newsome, S.D., McMahon, K.W., Aurioles, D., 2010. Usingisoscapes to trace the movements and foraging behavior of top predators inoceanic ecosystems. In: West, J.B., Bowen, G.J., Dawson, T.E., Tu, K.P. (Eds.),Isoscapes: Understanding Movement, Pattern, and Process on Earth throughIsotope Mapping. Springer, New York, pp. 299–318.
Hansson, S., Hobbie, J.E., Elmgren, R., Larsson, U., Fry, B., Johansson, S., 1997. Thestable nitrogen isotope ratio as a marker of food-web interactions and fishmigration. Ecology 78, 2249–2257.
K.R. Radabaugh et al. / Continental Shelf Research 68 (2013) 112–122 121
Harmelin-Vivien, M., Loizeau, V., Mellon, C., Beker, B., Arlhac, D., Bodiguel, X.,Ferraton, F., Hermand, R., Philippon, X., Salen-Picard, C., 2008. Comparison of Cand N stable isotope ratios between surface particulate organic matter andmicrophytoplankton in the Gulf of Lions (NW Mediterranean). ContinentalShelf Research 28, 1911–1919.
Hobson, K.A., Barnett-Johnson, R., Cerling, T., 2010. Using isoscapes to track animalmigration. In: West, J.B., Bowen, G.J., Dawson, T.E., Tu, K.P. (Eds.), Isoscapes:Understanding Movement, Pattern, and Process on Earth through IsotopeMapping. Springer, New York, pp. 273–298.
Hofmann, M., Wolf-Gladrow, D.A., Takahashi, T., Sutherland, S.C., Six, K.D., Maier-Reimer, E., 2000. Stable carbon isotope distribution of particulate organicmatter in the ocean: a model study. Marine Chemistry 72, 131–150.
Jeffers, S.A., Patterson III, W.F., Cowan Jr., J.H., 2008. Habitat and bycatch effects onpopulation parameters of inshore lizardfish (Synodus foetens) in the northcentral Gulf of Mexico. Fisheries Bulletin 106, 417–426.
Jennings, S., Warr, K.J., 2003. Environmental correlates of large-scale spatialvariation in the δ15N of marine animals. Marine Biology 142, 1131–1140.
Kendall, C., Silva, S.R., Kelly, V.J., 2001. Carbon and nitrogen isotopic compositions ofparticulate organic matter in four large river systems across the United States.Hydrological Processes 15, 1301–1346.
Kürten, B., Frutos, I., Struck, U., Painting, S.J., Polunin, N.V.C., Middleburg, J.J., 2012.Trophodynamics and functional feeding groups of North Sea fauna: a combinedstable isotope and fatty acid approach. Biogeochemistry, http://dx.doi.org/10.1007/s10533-012-9701-8.
Liu, K.K., Kao, S.J., Hu, H.C., Chou, W.C., Hung, G.W., Tseng, C.M., 2007. Carbonisotopic composition of suspended and sinking particulate organic matter inthe northern South China Sea—from production to deposition. Deep SeaResearch Part II: Topical Studies in Oceanography 54, 1504–1527.
McIntyre, P.B., Flecker, A.S., 2006. Rapid turnover of tissue nitrogen of primaryconsumers in tropical freshwaters. Oecologia 148, 12–21.
Macko, S.A., Entzeroth, L., Parker, P.L., 1984. Regional differences in nitrogen andcarbon isotopes on the continental shelf of the Gulf of Mexico. Naturwis-senschaften 71, 374–375.
Mariotti, A., Lancelot, C., Billen, G., 1983. Natural isotopic composition of nitrogen asa tracer of origin for suspended organic matter in the Scheldt estuary.Geochimica et Cosmochimica Acta 48, 549–555.
Montoya, J.P., Carpenter, E.J., Capone, D.G., 2002. Nitrogen fixation and nitrogenisotope abundances in zooplankton of the oligotrophic North Atlantic. Limnologyand Oceanography 47, 1617–1628.
Montoya, J.P., 2007. Natural abundance of 15N in marine planktonic ecosystems.In: Michener, R., Lajtha, K. (Eds.), Stable Isotopes in Ecology and EnvironmentalScience, second ed. Blackwell Publishing, Malden, Massachusetts, pp. 176–201.
Moore, H.B., Jutare, T., Bauer, J.C., Jones, J.A., 1963. The biology of Lytechinusvariegatus. Bulletin of Marine Science of the Gulf and Caribbean 13, 23–53.
Mulholland, M.R., Bernhardt, P.W., Heil, C.A., Bronk, D.A., O′Neil, J.M., 2006.Nitrogen fixation and release of fixed nitrogen by Trichodesmium spp. in theGulf of Mexico. Limnology and Oceanography 51, 1762–1776.
Muscatine, L., Porter, J.W., Kaplan, I.R., 1989. Resource partitioning by reef corals asdetermined from stable isotope composition. 1. δ13C of zooxanthellae andanimal tissue vs depth. Marine Biology 100, 185–193.
Nelson, J., Chanton, J., Coleman, F., Koenig, C., 2011. Patterns of stable carbon isotopeturnover in gag, Mycteroperca microlepis, an economically important marinepiscivore determined with a non-lethal surgical biopsy procedure. Environ-mental Biology of Fishes 90, 243–252.
Nelson, J., Wilson, R., Coleman, F., Koenig, C., DeVries, D., Gardner, C., Chanton, J.,2012. Flux by fin: fish-mediated carbon and nutrient flux in the northeasternGulf of Mexico. Marine Biology 159, 365–372.
Nerot, C., Lorrain, A., Grall, J., Gillikin, D.P., Munaron, J.M., Le Bris, H., Paulet, Y.M.,2012. Stable isotope variations in benthic filter feeders across a large depthgradient on the continental shelf. Estuarine, Coastal and Shelf Science 96,228–235.
Okey, T.A., Mahmoudi, B., 2002. An Ecosystem Model of the West Florida Shelf foruse in Fisheries Management and Ecological Research: Volume II. ModelConstruction. Florida Marine Research Institute, St. Petersburg, Florida, USA.154 pp.
Olson, R.J., Popp, B.N., Graham, B.S., Lopez-Ibarra, G.A., Galvan-Magana, F., Lennert-Cody, C.E., Bocanegra-Castillo, N., Wallsgrove, N.J., Gier, E., Alatorre-Ramirez, V.,Balance, L.T., Fry, B., 2010. Food-web inferences of stable isotope spatialpatterns in copepods and yellowfin tuna in the pelagic eastern Pacific Ocean.Progress in Oceanography 86, 124–138.
Parker, R.O., Colby, D.R., Willis, T.D., 1983. Estimated amount of reef habitat on aportion of the United States south Atlantic and Gulf of Mexico continental shelf.Bulletin of Marine Science 33, 935–940.
Popp, B.N., Laws, E.A., Bidigare, R.R., Dore, J.E., Hanson, K.L., Wakeham, S.G., 1998.Effect of phytoplankton cell geometry on carbon isotopic fractionation. Geo-chimica et Cosmochimica Acta 62, 69–77.
Post, D.M., 2002. Using stable isotopes to estimate trophic position: models,methods, and assumptions. Ecology 83, 703–718.
Post, D.M., Layman, C.A., Arrington, D.A., Takimoto, G., Quattrochi, J., Montana, C.G.,2007. Getting to the fat of the matter: models, methods and assumptions fordealing with lipids in stable isotope analyses. Oecologia 152, 179–189.
Rabalais, N.N., Turner, R.E., Justic, D., Dortch, Q., Wiseman, W.J., Sen Gupta, B.K.,1996. Nutrient changes in the Mississippi River and system responses on theadjacent continental shelf. Estuaries 19, 386–407.
Radabaugh, K.R., Peebles, E.B., 2012. Detection and classification of phytoplanktondeposits along an estuarine gradient. Estuaries and Coasts 35, 1361–1375.
Rubenstein, D.R., Chamberlain, C.P., Holmes, R.T., Ayres, M.P., Waldbauer, J.R.,Graves, G.R., Tuross, N.C., 2002. Linking breeding and wintering ranges of amigratory songbird using stable isotopes. Science 295, 1062–1065.
Ruiz-Cooley, R.I., Gerrodette, R., 2012. Tracking Large-scale Latitudinal Patterns ofδ13C and δ15N along the E Pacific Using epi-mesopelagic Squid as Indicators.Ecosphere 3, article 63, 17 pp.
Sánchez-Gil, P., Arreguín-Sánchez, F., García-Abad, M.C., 1994. Ecological strategiesand recruitment of Syacium gunteri (Pisces, Bothidae) in the southern Gulf ofMexico shelf. Netherlands Journal of Sea Research 32, 433–439.
Sharp, Z., 2007. Principles of Stable Isotope Geochemistry. Pearson Prentice Hall,Upper Saddle River, NJ p. 344.
SEDAR27-RD-05. Fishery-Independent Sampling: SEAMAP Trawl. Southeast AreaMonitoring & Assessment Program (SEAMAP) Trawl Protocol. 7 pp.
Weffer, G., Killingley, J.S., 1986. Carbon isotopes in organic matter from a benthicalga Halimeda incrassata (Bermuda): effects of light intensity. Chemical Geology:Isotope Geoscience Section 59, 321–326.
West, J.B., Bowen, G.J., Dawson, T.E., 2010. Preface: context and background for thetopic and book. In: West, J.B., Bowen, G.J., Dawson, T.E., Tu, K.P. (Eds.), Isoscapes:Understanding Movement, Pattern, and Process on Earth through IsotopeMapping. Springer, New York, pp. v–xi.
Wunder, M.B., Norris, D.R., 2008. Analysis and design for isotope-based studies ofmigratory animals. In: Hobson, K.A., Wassenaar, L.I. (Eds.), Tracking AnimalMigration with Stable Isotopes. Elsevier Inc., London, pp. 107–128. (TerrestrialEcology Series).
Zieman, J.C., Zieman, R.T., 1989. The Ecology of the Seagrass Meadows of the WestCoast of Florida, USA: A Community Profile. U.S. Fish and Wildlife ServiceBiological Report, 85: I-IX, 1–156.
K.R. Radabaugh et al. / Continental Shelf Research 68 (2013) 112–122122
Related Documents


