Debris-Covered Glaciers (Proceedings of a workshop held at Seattle, Washington, USA, September 2000). IAHS Publ. no. 264, 2000. 277 Seasonal changes in dissolved chemical composition and flux of meltwater draining from Lirung Glacier in the Nepal Himalayas MAYA P. BHATT*, TOSHIYUKI MASUZAWA, MINEKO YAMAMOTO, AKIKO SAKAI & KOJI FUJITA Institute for Hydrospheric-Atmospheric Sciences, Nagoya University, Furo-cho, Chikusa-ku, Nagoya 464-8601, Japan e-mail: [email protected] Abstract Glacier meltwaters were sampled at approximately weekly intervals at the outlet of the debris-covered glacier, Lirung Glacier (28°12.9'N, 86°39.9'E; 4000 m a.m.s.l.), in the Nepal Himalayas from 16 May (pre- monsoon) to 26 October (post-monsoon) 1996. The average water discharge during the monsoon period (19 June-13 September) was 2.85±0.35 times higher than that during the pre- and post-monsoon periods. During the monsoon period the average TDS concentration was lower (0.57 times) and the average daily TDS flux was higher (1.63±0.23 times) than during the pre- and post-monsoon periods. The major cation and anion compositions in equivalent I" 1 were Ca 2+ » Mg 2+ > Na + > K + » NH/ and Alk > S0 4 2 " » NO3" > CI", respectively. The composition of the major species was, however, quite constant throughout the observed period. The dominance of Ca 2+ , Alk and S0 4 2 " indicates that sulphide oxidation coupled with carbonate dissolution is the dominant chemical weathering processes occurring within the subglacial drainage system of this glacier as widely observed in other alpine glacierized basins. The monsoon season affected the weathering fluxes of solutes through the enhanced meltwater mass but not the weathering mechanism(s) within the subglacial drainage system of the glacier. INTRODUCTION Meltwaters from mountain glaciers of the Himalayas are one of the dominant water resources for Nepal. Understanding the associated geochemical processes for the development of their chemical composition is important. Glaciological and meteorological observations on glaciers and climate in the Nepal Himalayas have been carried out since 1973, and the Langtang Valley has been under observation since 1980 through the Glaciological Expedition of Nepal (Higuchi et al, 1982). However, there are only limited data on the chemical composition of glacier meltwaters, pond waters and ice cores in the Nepal Himalayas (Watanabe et al, 1984; Kamiyama, 1984; Reynolds et al, 1995). There have been no measurements of seasonal changes in glacier meltwaters in the Nepal Himalayas although these data have been reported for other Himalayan areas (Hasnain & Thayyen, 1999; Collins, 1999). This study was undertaken to observe seasonal changes and fluxes of major chemical constituents in * Present address: Environmental Sciences Division, School of Science, Kathmandu University, Dhulikhel, Kavre, Nepal

Welcome message from author
This document is posted to help you gain knowledge. Please leave a comment to let me know what you think about it! Share it to your friends and learn new things together.
Transcript

Debris-Covered Glaciers (Proceedings of a workshop held at Seattle, Washington, USA, September 2000). IAHS Publ. no. 264, 2000. 277
Seasonal changes in dissolved chemical composition and flux of meltwater draining from Lirung Glacier in the Nepal Himalayas
MAYA P. BHATT*, TOSHIYUKI MASUZAWA, MINEKO YAMAMOTO, AKIKO SAKAI & KOJI FUJITA Institute for Hydrospheric-Atmospheric Sciences, Nagoya University, Furo-cho, Chikusa-ku, Nagoya 464-8601, Japan e-mail: [email protected]
Abstract Glacier meltwaters were sampled at approximately weekly intervals at the outlet of the debris-covered glacier, Lirung Glacier (28°12.9'N, 86°39.9'E; 4000 m a.m.s.l.), in the Nepal Himalayas from 16 May (pre-monsoon) to 26 October (post-monsoon) 1996. The average water discharge during the monsoon period (19 June-13 September) was 2.85±0.35 times higher than that during the pre- and post-monsoon periods. During the monsoon period the average TDS concentration was lower (0.57 times) and the average daily TDS flux was higher (1.63±0.23 times) than during the pre-and post-monsoon periods. The major cation and anion compositions in equivalent I"1 were Ca2 + » Mg 2 + > Na+ > K+ » NH/ and Alk > S0 4
2" » NO3" > CI", respectively. The composition of the major species was, however, quite constant throughout the observed period. The dominance of Ca2+, Alk and S0 4
2" indicates that sulphide oxidation coupled with carbonate dissolution is the dominant chemical weathering processes occurring within the subglacial drainage system of this glacier as widely observed in other alpine glacierized basins. The monsoon season affected the weathering fluxes of solutes through the enhanced meltwater mass but not the weathering mechanism(s) within the subglacial drainage system of the glacier.
INTRODUCTION
Meltwaters from mountain glaciers of the Himalayas are one of the dominant water resources for Nepal. Understanding the associated geochemical processes for the development of their chemical composition is important. Glaciological and meteorological observations on glaciers and climate in the Nepal Himalayas have been carried out since 1973, and the Langtang Valley has been under observation since 1980 through the Glaciological Expedition of Nepal (Higuchi et al, 1982). However, there are only limited data on the chemical composition of glacier meltwaters, pond waters and ice cores in the Nepal Himalayas (Watanabe et al, 1984; Kamiyama, 1984; Reynolds et al, 1995). There have been no measurements of seasonal changes in glacier meltwaters in the Nepal Himalayas although these data have been reported for other Himalayan areas (Hasnain & Thayyen, 1999; Collins, 1999). This study was undertaken to observe seasonal changes and fluxes of major chemical constituents in
* Present address: Envi ronmenta l Sciences Divis ion, School of Science , Ka thmandu Universi ty, Dhul ikhel , Kavre , Nepal

278 Maya P. Bhatt et al.
glacier meltwaters from the debris-covered glacier, Lirung Glacier. Data acquired through the pre- to post-monsoon season indicate that the principal weathering processes controlling the chemical composition of the glacier meltwaters is sulphide oxidation coupled with carbonate dissolution as widely observed in other alpine glacierized basins. The effect of surface debris cover on the chemical composition of discharge waters seems to be not significant.
STUDY AREA
Lirung Glacier (28°12.9TSf, 86°39.9'E) is located 60 km north of Kathmandu in the Langtang Valley and is the headwater area of the Langtang-Narayani River system. Figure 1 shows a topographical map of Lirung Glacier basin (Sakai et al, 1997). The
Tsangbu Ri 6760
Langtan Lirun:
7 0 0 0 m
6000m
Legend I I Clean glacier area
I j Debris-cover glacier area
• Measurement site of elevation angles
Langtang
28oN
Valley Khumbu Himal
86oE
Moraine"
Terminus
Pond
^ v Meteorological
Station
È4200m
Observation Site
Kyangjin Kharka
Fig. 1 Topographic map of Lirung Glacier basin in the Nepal Himalayas (after Sakai etal, 1997).

Seasonal changes in dissolved chemical composition and flux of meltwater from Lirung Glacier 279
altitude of the Lirung Himal is 7234 m and the lowest point of the basin, the outlet, is 4000 m a.m.s.l. The total area of the drainage basin is 13.8 km 2, of which 33% is steep bedrock walls, 16% debris-covered glacier and the remaining 51% debris-free ice (Fukushima et al, 1987). Geologically, the Langtang Lirung area lies in a complex transition zone between the High Himalayan metasediments (south) and the Tethyan sedimentary series (north). The lithology mainly consists of high-grade metamorphic rocks with traces of igneous rocks including migmatites, gneisses, schists, phyllites and granites (Inger & Harris, 1992).
MATERIALS AND METHODS
Discharge waters were sampled at approximately weekly intervals from 16 May to 26 October 1996 at the outlet of Lirung Glacier (Fig. 1), as a part of the Cryosphere Research Expedition in the Himalayas in 1996 (Nakawo et al, 1997; Fujita et al, 1997; Sakai et al, 1997). Hourly measurements of physical variables and tri-hourly sampling for chemical analyses were carried out for 30 h on 30-31 May and 29-30 September 1996 at the outlet to examine diurnal changes. Discharge at the outlet was observed from 8 May to 25 October 1996 except for a period from 29 June to 5 July (Sakai et al, 1997). Daily precipitation was observed at the debris-covered area of Lirung Glacier ( P L R ; 4190 m a.m.s.l.) and at Kyanjing Base House ( P B H ; 3880 m a.m.s.l.; Fig. 1). Meteorological variables were measured during the same calendar interval in 1996 (Fujita et al, 1997).
Each water sample was filtered with a pre-weighed 25-mm or 47-mm GELMAN Supor polyethersulfone filter with a 0.2-um pore size by using a hand vacuum pump or a syringe just after sampling. The filter with the residue was stored in a petrislide. The filtrate was stored in a pre-washed Milli-Q-water-filled 50-ml polyethylene (PE) bottle for major species analyses (non-acidified) and a pre-washed 50-ml PE bottle filled with ultra-pure water prepared by sub-boiling distillation and added 0.5 ml of 6M HC1 for PO4-P and trace element analyses (acidified). The non-acidified samples were stored in a refrigerator and the acidified samples at room temperature until chemically analysed. Air temperature, water temperature, electrical conductivity (EC; Horiba B-173) and pH (Horiba B-212) of discharge waters were measured at the time of sampling.
Analytical methods used for the water samples were as follows: Suspended sediment (SS) was weighed with the filter after drying in a vacuum oven at 60°C for 48 h. Major cations (Na+, K +, Mg 2 + , Ca 2 + and NH 4
+ ) and anions (CT, N0 2", N0 3 " and S0 4
2") were determined by cation (DIONEX DX-100) and anion (DIONEX QIC) chromatography, respectively, relative to IAPSO international standard seawater as well as to standard solutions prepared from analytical reagents. Alkalinity (Alk) was determined by acid titration, and dissolved silica ( S i Û 2 ) and PO4-P spectrophotometrically (Hitachi 124) by the standard molybdenum blue methods. Detection limits for SS and Alk were 1 mg l"1 and 1 uequivalent (ueq) l"1, respectively, and analytical errors were <2% for Cl", NO3", S 0 4 ", Na +, K +, Mg 2 + , Ca 2 + and Si0 2 , <4% for NEL}"1" and <5% for PO4-P. The analysis of a few blank solutions kept in washed PE bottles, which were carried to Nepal and then back to Japan, indicated that

280 Maya P. Bhatt et al.
contarriinatiori of these chemical species was negligibly small during the processes of storage and transportation.
R E S U L T S A N D D I S C U S S I O N
Physical variables and chemical composition of the discharge waters are listed in Table 1 and shown in Figs 2 and 3. The monsoon season in 1996 was from 19 June (Julian day 170) to 13 September (Julian day 257) according to the precipitation data (Fujita et al, 1997).
Two 30-h periods of hourly observations, one in May and one in September 1996, showed that discharge maxima occurred in the evening and minima in the morning. The ratios of maximum to minimum discharge were 1.38 and 2.13, respectively. Tri-hourly variations in concentrations and relative proportions of major dissolved species were, however, small compared with the large variation in discharge.
The concentrations of all measured dissolved species were lower during the monsoon period than those in the pre- and post-monsoon periods (Fig. 3). Conversely, daily discharge fluxes of these species were higher during the monsoon period than those in the pre- and post-monsoon periods (Fig. 4). The major cation and anion compositions in eq I"1 (Fig. 3) are Ca 2 + » Mg 2 + > Na + > K + » NH*+ and Alk > S0 4
2 " » N0 3 " > CF, respectively, and Ca 2 + , Alk, most of which is as HC0 3", and S0 4
2 " are the dominant ions.
For discussion below, the observation period is divided into three periods, pre-(9 May to 18 June; 41 days), actual (87 days) and post- (14 September to 25 October; 42 days) monsoon. Averages calculated and discussed below refer to these intervals.
Precipitation over Lirung Glacier basin (PLG) is estimated based on altitude dependency of precipitation and area fractions for altitude zones (Rana et al, 1997) as a function of Pm (Fujita et al, 1997). The P L G value is separated into precipitation as snow ( P S N ) and that as rain ( P RA ) based on an air temperature of 2°C (Ageta et al, 1980) set at an altitude estimated from the daily air temperature observed at Kyanjing Base House (Fujita et al, 1997) and a laps rate of -0.6°C per 100 m. Cumulative PLG, F S N and P R A values for the pre-, actual and post-monsoon periods in 1996 are given in Table 2. The estimated average percentages of P S N relative to P L G are 89, 69 and 89% for the pre-, actual and post-monsoon periods, respectively. Cumulative precipitation through the observed period (170 days) was 852 mm and accounts for 36% of cumulative discharge (2344 mm; Table 2). Since most of the annual precipitation and melting occur during this period, this suggests a strongly negative mass balance for Lirung Glacier similar to observations at Glacier AX010 in the east Nepal Himalayas (Kadota etal, 1997).
Discharge ( V D ) is given by the sum of meltwater ( V M ) and rain (VRA ) . Evaporation can be neglected due to very low temperature (Fukushima et al, 1987). Changes in water storage are unknown, but are assumed to be negligible. Average concentration of species i in meltwater as a result of chemical weathering within the glacier system (CM ; ) is estimated by using a mass balance equation:
CMI= (YD C D / - VRA CRAI)/VM (1)

T a b l e 1 Seasonal changes in discharge, air t empera ture (Ta), water tempera ture (rw), p H , electrical conduct iv i ty (EC), suspended sediment (SS) and chemical compos i t ions o f d i scharge waters at the outlet of Li rung Glacier from 16 M a y to 26 October 1996.
Name Date Time Julian Discharge* day (10 3
Ta pH EC SS Na N H 4 K Mg Ca CI N 0 3 S 0 4
Alk P 0 4 S i 0 2 SAnion SCation Julian Discharge* day (10 3
CO CO (umol (umol (umol (umol (umol (umol (pmol (umol (pmol (pmol nf day") cm"1) (mgl"') I"1) r 1 ) 1-') l"1) I"1) f ) I"1) (ueq 1"') 1") I-') (ueq 1"') (ueq l"1)
LO-1 16/5/96 14:55 137 74.8 11.7 7.1 - 38 - 40.1 0.5 27.2 21.3 160.5 5.0 24.6 71.0 217 0.02 47.4 388 431 LO-2 17/5/96 11:00 138 66.4 9.4 5.1 7.2 28 - 37.8 0.4 27.7 20.4 154.3 4.5 24.1 67.4 213 0.02 46.0 376 415 LO-3 17/5/96 16:00 138 66.4 6.9 5.0 7.1 28 - 38.6 0.0 27.1 20.8 158.8 4.2 25.1 69.0 245 0.05 47.6 413 425 LO-4 18/5/96 08:00 139 75.2 5.4 0.7 - 34 - 36.9 0.0 27.1 20.3 152.9 4.1 24.5 65.8 201 0.01 45.6 362 410 LO-5 22/5/96 08:35 143 70.3 - 1.7 7.9 47 148 38.2 0.4 26.5 20.9 152.6 5.4 25.8 68.0 192 0.01 46.8 359 412 LO-6 22/5/96 15:10 143 70.3 - 5.6 8.1 50 42 40.3 1.9 26.7 21.2 154.7 7.2 25.6 68.2 204 0.07 47.3 374 421 LO-7 23/5/96 17:30 144 62.3 - - 7.3 43 97 35.5 4.8 24.9 19.6 145.2 4.4 25.2 64.1 192 0.02 45.0 350 395 LO-8 26/5/96 09:30 147 120.9 - 2.9 6.4 30 375 28.2 2.2 23.2 14.1 107.1 7.6 21.9 42.1 145 0.02 32.5 259 296 LO-9 29/5/96 08:05 150 91.0 - - 7.3 33 308 34.3 5.6 23.0 14.5 112.2 12.0 21.6 44.0 151 0.07 32.2 273 316 LO-10 30/5/96 09:00 151 76.4 - 3.6 7.1 34 158 28.8 1.0 22.1 15.7 120.1 5.0 24.5 50.0 160 0.05 36.7 290 324 LO-18 31/5/96 09:00 152 67.0 - 1.3 7.8 37 93 30.8 0.3 22.7 17.3 129.6 4.6 25.2 55.8 158 0.09 40.0 299 348 LO-21 02/6/96 09:35 154 62.6 - - 7.6 42 93 35.3 0.4 23.2 18.9 140.9 4.2 26.5 61.3 178 0.00 44.9 331 379 LO-22 04/6/96 09:00 156 61.9 - 1.6 8.2 47 48 44.5 0.6 26.3 22.0 160.3 7.0 26.2 71.9 204 0.00 49.9 381 436 LO-23 06/6/96 13:30 158 70.8 - - 7.6 52 218 51.7 0.4 28.8 23.8 174.1 8.3 24.8 80.6 235 0.00 56.6 429 477 LO-24 12/6/96 08:15 164 105.4 11.6 2.5 - 27 101 26.9 0.0 20.4 15.3 114.2 4.9 20.2 46.8 146 0.20 34.9 265 306 LO-25 16/6/96 - 168 126.5 - - - - 122 20.7 0.0 17.7 12.6 97.6 3.0 21.0 36.2 124 0.00 29.4 221 259 1.0-26" 1976/96 09Ï00 171 "253.3 - - . 7 T _ . . """"23" ~~m 16.2"""" "TM"'" ""VTA 10.4 """'"SO" 3.1 18.7 30.0 1""09 0.00 26.9 TOI 228 LO-27 29/6/96 11:00 181 - 8.3 2.3 8.5 25 115 14.4 0.8 14.0 9.0 74.7 2.2 12.5 26.7 92 0.00 23.1 161 196 LO-28 05/7/96 08:00 187 - 7.6 1.0 8.4 17 84 19.6 1.8 15.4 11.4 90.9 2.6 13.1 35.2 114 0.00 28.4 200 241 LO-29 13/7/96 07:50 195 299.1 8.2 0.8 8.6 20 140 14.0 1.3 14.3 8.9 72.7 1.8 8.8 24.7 94 0.00 23.3 153 193 LO-30 20/7/96 07:50 202 282.5 10.2 1.1 8.9 15 112 14.5 0.2 13.7 8.9 74.1 1.8 7.5 26.0 95 0.00 23.8 156 194 LO-31 28/7/96 10:05 210 365.3 11.8 2.2 8.4 20 86 14.8 1.1 13.2 8.9 74.2 1.8 6.9 26.2 97 0.00 23.1 158 195 LO-32 06/8/96 08:10 219 318.1 9.9 1.0 - 20 81 15.5 0.4 13.0 9.7 79.7 1.7 6.7 27.5 104 0.00 24.0 167 208 LO-33 13/8/96 08:50 226 386.0 10.7 1.0 - 14 436 12.9 0.0 14.2 8.4 70.9 1.5 5.6 26.8 96 0.00 21.1 157 186 LO-34 20/8/96 08:10 233 244.6 10.6 1.1 - 26 74 20.4 1.0 15.2 11.9 95.9 1.8 7.1 38.4 139 0.00 31.3 225 252 LO-35 26/8/96 09:30 239 199.0 - - - 31 71 24.8 0.5 17.5 13.9 108.1 2.0 7.6 46.8 151 0.00 35.9 254 287 LO-36 02/9/96 08:20 246 271.1 7.3 1.1 - 26 66 20.2 0.4 15.8 12.0 95.0 2.2 6.9 39.0 129 0.00 30.3 216 250 LO-37 09/9/96 11:20 253 212.1 9.8 5.2 - 28 60 24.1 0.0 17.3 13.9 108.2 2.3 7.5 46.8 144 0.00 35.3 247 286 1.0-38 15/9/96 10:25 259 737.9— 13.7 475" " - 33" "6"9" """ ""2? .4" 1.3 19.0 " T O " " 121.9 2.3 8 3 ' 53.7 ' " 168 0.00 " 40.1 "28~6 '"""323 LO-39 22/9/96 07:30 266 140.1 7.4 1.2 - 33 64 30.3 1.3 20.0 16.4 121.8 2.9 10.2 53.4 168 0.00 40.2 288 328 LO-40 28/9/96 16:15 272 205.6 7.9 0.5 7.9 35 120 22.1 0.0 16.5 13.0 104.2 3.0 11.8 43.9 141 0.00 29.6 243 273 LO-41 29/9/96 09:00 273 182.3 11.7 2.8 7.8 27 63 23.5 0.2 16.8 13.4 106.5 2.9 11.5 43.4 142 0.00 28.2 244 280 LO-49 30/9/96 09:00 274 122.4 8.4 -0 .6 7.8 46 39 32.8 0.4 20.2 16.0 124.6 5.1 12.8 53.9 177 0.02 41.6 302 335 LO-53 04/10/96 11:45 278 73.3 5.6 -0 .3 7.5 57 29 41.6 0.0 24.5 21.7 157.1 5.8 13.5 74.0 227 0.00 53.7 394 424 LO-54 06/10/96 13:30 280 96.4 5.7 3.1 7.8 53 41 37.5 0.0 24.0 19.9 149.1 3.9 12.0 66.4 223 0.00 50.8 372 400 LO-55 06/10/96 14:30 280 96.4 6.1 1.4 8.3 53 67 44.1 1.5 25.4 20.3 151.2 10.1 12.8 67.4 224 0.01 51.4 382 414 LO-56 13/10/96 08:40 287 73.0 7.4 1.5 8.4 42 11 42.9 0.5 25.4 22.8 162.0 3.7 11.3 76.4 228 0.01 52.7 396 438 LO-57 19/10/96 14:30 293 87.4 9.7 5.3 9.6 42 15 47.2 0.5 26.6 24.1 172.8 4.1 8.8 82.5 231 0.09 54.4 409 468 LO-58 26/10/96 09:10 300 64.2 1.2 0.7 10.4 31 52 55.1 0.4 30.0 26.8 192.9 5.1 13.3 93.8 286 0.01 61.9 492 525
* Sakai et al. (1997).

282 Maya P. Bhatt et al.
400000,
u o
<u
a. B a I -
X a
a
en m
20
Tw
M ,' Ta
May June "'"July 1 Aug. 1996
Sept. Oct.
Fig . 2 Seasonal variations of discharge (Sakai et al, 1997), water and air temperature, p H , electrical conductivi ty (EC) and concentrat ion of suspended sediment (SS) of d ischarge waters at the outlet of Li rung Glacier in the Nepal Himalayas from M a y to October 1996.
where Co/ and CR A , are average concentrations of species i in discharge water and rainwater, respectively. The CRA/ values as well as those of snow (CSN/) for the pre-, actual and post-monsoon periods are assumed to be equal to average concentrations of snow pit samples collected at Yala Glacier (5450 m a.m.s.l.) on 20 May (245 cm deep), 3 August (158 cm deep) and 9 October (200 cm deep) 1996 , respectively (Bhatt et al, unpublished data). The Co/ (observed), CSN; and CRA/ (assumed) and CM/ (estimated) values for the three periods in 1 9 9 6 are listed in Table 2. Average daily fluxes of dissolved species in discharge, rain and melt waters are estimated by multiplying the average concentrations with cumulative volumes of discharge, rain and melt waters, respectively, for the three periods, and are also shown in Table 2.
The average daily water discharge during the monsoon period was 3.2 and 2.5 times higher than those of pre- and post-monsoon periods, respectively (Table 2). The average

Seasonal changes in dissolved chemical composition and flux of meltwater from Lirung Glacier 283
TDS concentration during the monsoon period was lower (0.57 times) than those during the pre- and post-monsoon periods. The average daily TDS flux during the monsoon period was 1.86 and 1.46 times higher than those during the pre- and post-monsoon periods. The total discharge of TDS through the observed period (170 days) was 597 t, and that during the monsoon period (87 days) was 63% of the total discharge (Table 2). The contributions of dissolved species from rain to discharge water were less than 1% by mass except for NH/ (25%) and CI" (2.3%). This indicates that dissolved species in the discharge waters were derived from chemical weathering within the subglacial drainage system (Tranter et al., 1993). During the monsoon period, the concentrations

284 Maya P. Bhatt et al.
800001
1996 Fig. 4 Seasonal variations of discharge fluxes of anions, cat ions (eq day" 1) and dissolved silica (moles day" 1) at the outlet of Lirung Glacier in the Nepa l Himalayas from M a y to October 1996.
were lower than those of the pre- and post-monsoon periods mainly by dilution from enhanced melting and rainfall (Fukushima et al, 1987; Rana et al, 1997). However, weathering activity was much higher during the monsoon period due to the larger melting water mass.
The dominance of Ca 2 + , Alk and S0 4
2 " in glacier meltwaters has been widely observed and considered to be due to sulphide oxidation (SO) coupled with calcium carbonate dissolution (CD) within the subglacial drainage system (Tranter & Raiswell, 1991; Tranter et al, 1993; Hasnain & Thayyen, 1999). Linear relationships of cation and anion concentrations vs sulphate concentration (Tranter & Raiswell, 1991) are also observed at the outlet of Lirung Glacier.
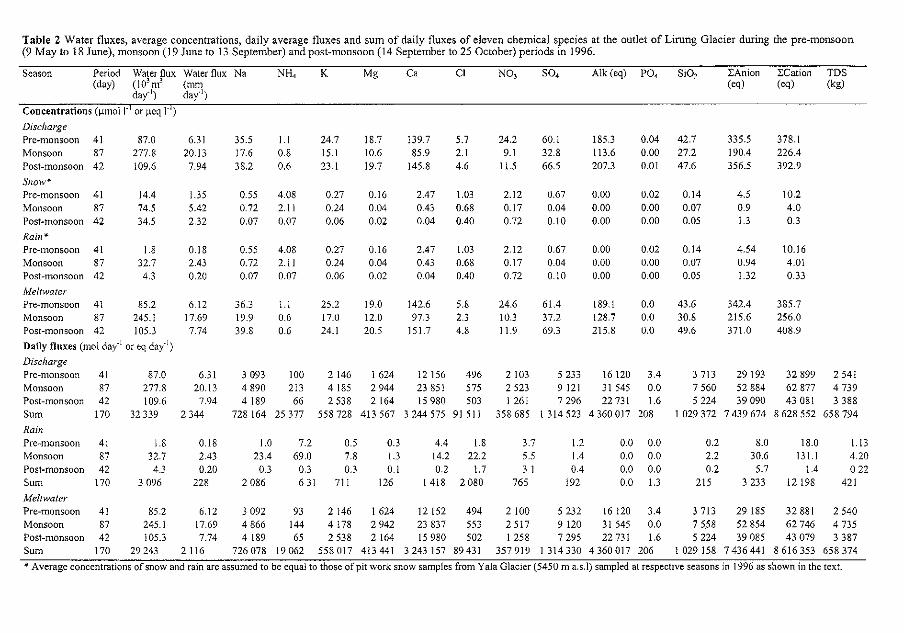
Table 2 W a t e r fluxes, average concentrat ions , dai ly average fluxes and s u m of dai ly fluxes of e leven chemica l species at the outlet o f L i rung Glac ier during the p r e - m o n s o o n (9 M a y to 18 June) , monsoon (19 June to 13 September) and pos t -monsoon (14 September to 25 October) per iods in 1996.
Season Period Water flux Water flux Na N H 4 K Mg Ca Cl N 0 3 S 0 4 Alk(eq) P 0 4 S i 0 2 SAnion SCation TDS (day) ( 1 0 3 m 3 (mm (eq) (eq) (kg)
day 1 ) day' 1)
Concentrat ions (umol l"1 or peq l"1)
Discharge Pre-monsoon 41 87.0 6.31 35.5 1.1 24.7 18.7 139.7 5.7 24.2 60.1 185.3 0.04 42.7 335.5 378.1 Monsoon 87 277.8 20.13 17.6 0.8 15.1 10.6 85.9 2.1 9.1 32.8 113.6 0.00 27.2 190.4 226.4 Post-monsoon 42 109.6 7.94 38.2 0.6 23.1 19.7 145.8 4.6 11.5 66.5 207.3 0.01 47.6 356.5 392.9
Snow* Pre-monsoon 41 14.4 1.35 0.55 4.08 0.27 0.16 2.47 1.03 2.12 0.67 0.00 0.02 0.14 4.5 10.2 Monsoon 87 74.5 5.42 0.72 2.11 0.24 0.04 0.43 0.68 0.17 0.04 0.00 0.00 0.07 0.9 4.0 Post-monsoon 42 34.5 2.32 0.07 0.07 0.06 0.02 0.04 0.40 0.72 0.10 0.00 0.00 0.05 1.3 0.3
Rain * Pre-monsoon 41 1.8 0.18 0.55 4.08 0.27 0.16 2.47 1.03 2.12 0.67 0.00 0.02 0.14 4.54 10.16 Monsoon 87 32.7 2.43 0.72 2.11 0.24 0.04 0.43 0.68 0.17 0.04 0.00 0.00 0.07 0.94 4.01 Post-monsoon 42 4.3 0.20 0.07 0.07 0.06 0.02 0.04 0.40 0.72 0.10 0.00 0.00 0.05 1.32 0.33
Meltwater Pre-monsoon 41 85.2 6.12 36.3 1.1 25.2 19.0 142.6 5.8 24.6 61.4 189.1 0.0 43.6 342.4 385.7 Monsoon 87 245.1 17.69 19.9 0.6 17.0 12.0 97.3 2.3 10.3 37.2 128.7 0.0 30.8 215.6 256.0 Post-monsoon 42 105.3 7.74 39.8 0.6 24.1 20.5 151.7 4.8 11.9 69.3 215.8 0.0 49.6 371.0 408.9
Daily fluxes (mol day"1 or eq day"1)
Discharge Pre-monsoon 41 87.0 6.31 3 093 100 2 146 1 624 12 156 496 2 103 5 233 16 120 3.4 3 713 29 193 32 899 2 541 Monsoon 87 277.8 20.13 4 890 213 4 185 2 944 23 851 575 2 523 9 121 31 545 0.0 7 560 52 884 62 877 4 739 Post-monsoon 42 109.6 7.94 4 189 66 2 538 2 164 15 980 503 1 261 7 296 22 731 1.6 5 224 39 090 43 081 3 388 Sum
Rain Pre-monsoon
170 32 339 2 344 728 164 25 377 558 728 413 567 3 244 575 91 511 358 685 1 314 523 4 360 017 208 1 029 372 7 439 674 : 8 628 552 658 794 Sum
Rain Pre-monsoon 41 1.8 0.18 1.0 7.2 0.5 0.3 4.4 1.8 3.7 1.2 0.0 0.0 0.2 8.0 18.0 1.13 Monsoon 87 32.7 2.43 23.4 69.0 7.8 1.3 14.2 22.2 5.5 1.4 0.0 0.0 2.2 30.6 131.1 4.20 Post-monsoon 42 4.3 0.20 0.3 0.3 0.3 0.1 0.2 1.7 3.1 0.4 0.0 0.0 0.2 5.7 1.4 0.22 Sum 170 3 096 228 2 086 6 3 1 711 126 1 418 2 080 765 192 0.0 1.3 215 3 233 12 198 421
Meltwater Pre-monsoon 41 85.2 6.12 3 092 93 2 146 1 624 12 152 494 2 100 5 232 16 120 3.4 3 713 29 185 32 881 2 540 Monsoon 87 245.1 17.69 4 866 144 4 178 2 942 23 837 553 2 5 1 7 9 120 31 545 0.0 7 558 52 854 62 746 4 735 Post-monsoon 42 105.3 7.74 4 189 65 2 538 2 164 15 980 502 1 258 7 295 22 731 1.6 5 224 39 085 43 079 3 387 Sum 170 29 243 2 116 726 078 19 062 558 017 413 441 3 243 157 89 431 357 919 1 314 330 4 360 017 206 1 029 158 7 436 441 ; 8 616 353 658 374
* Average concentrations of snow and rain are assumed to be equal to those of pit work snow samples from Yala Glacier (5450 m a.s.l) sampled at respective seasons in 1996 as shown in the text.

286 Maya P. Bhatt et al.
Figure 5 shows seasonal variations of relative proportions of anions to the sum of anions, those of cations to the sum of cations, and SiCVAlk ratio. They were quite constant throughout the pre- to post-monsoon period in 1996. For example, average relative proportions (+1 SD) of Alk, S0 4
2", N0 3 " and CF were 57.4 ± 2.5%, 35.6 ± 2.1%, 5.5 ± 2.2% and 1.43 ± 0.67%, respectively, and those of Ca 2 + , Mg 2 + , Na +, K + and NELt+ were 74.6 ± 1.2%, 9.7 ± 0.4%, 8.9 ± 1.0%, 6.5 ± 0.6% and 0.29 ± 0.37%, respectively. The constancy of chemical composition of meltwaters throughout the pre-to post-monsoon period suggests that the principal chemical weathering processes are not changed by the enhanced melting during the monsoon period.
<a c o c < c o •c o a. o
a o
DC
c o c o a. o
cr
I o E
Ci
O CO
so;
60
40
20h-
Premonsoon
100
80
60]
Monsoon
Alk.
SO.
Ca2
Postmonsoon
Fig . 5 Seasonal variations of relative proport ions of anions (%), those of cations (%) and S i 0 2 / A l k ratio in discharge waters at the outlet of L i rung Glacier in the Nepal Himalayas from M a y to October 1996.

Seasonal changes in dissolved chemical composition and flux of meltwater from Lirung Glacier 287
Impurities in pond waters on the debris-covered surface of Lirung Glacier showed that most of them were much more dilute than in the discharge waters (Masuzawa et al., paper in preparation). Weathering of the surface debris may be relatively slow compared to the fresh rock flower introduced into the water at the base of the glacier. Furthermore, Rana et al. (1997) suggested the melting within the debris-covered area w a s a b o u t 1 0 % of t o t a l m e l t i n g of Lirung G l a c i e r . So the effect of surface debris cover on the chemical composition of discharge water of Lirung Glacier seems to be not significant.
The cationic denudation rate (CDR) of the Lirung Glacier basin is estimated to be 740 meq nf2 year"1 based on assumptions that the water discharge from November to April is 12% of the annual discharge (Fukushima et al, 1987) and that average concentrations of dissolved species in discharge waters from November to April are equal to the average values for the pre- and post-monsoon periods in 1996 (Table 2). The estimated CDR for Lirung Glacier is about 1/6 of CDR found for Dokriani Glacier, Garhwal Himalayas, India, but is similar to CDR for European and North American glaciers (Hasnain &Thayyen, 1999).
Acknowledgements The authors would like to express their thanks to Prof. Y. Ageta and Dr M. Nakawo for allowing them to join the Cryosphere Research Expedition in the Himalayas in 1996. They thank all members of the expedition for their cooperation during the fieldwork. The interest shown by Prof. Mohan B. Gewali of Tribhuvan University in the preparation of this paper is greatly appreciated. They are indebted to two anonymous reviewers and Prof. C. F. Raymond for their critical reviews and valuable comments. This work was supported in part by a Grant-in-Aid for Scientific Research (no. 06041051) from the Ministry of Education, Science, Sports and Culture, Japan.
REFERENCES
Ageta, Y., Ohata, T., Tanaka, Y„ Dcegami, K. & Higuchi, K. (1980) Mass balance of Glacier AX010 in Shorong Himal, East Nepal during the summer monsoon season. J. Japan. Soc. Snow Ice (Seppyo) 41, 34-41.
Collins, D. N. (1999) Solute flux in meltwaters draining from a glacierized basin in the Karakoram mountains. Hydrol. Processes 13,3001-3015.
Fujita, K., Sakai, A. & Chhetri, T. B. (1997) Meteorological observation in Langtang Valley, Nepal Himalaya, 1996. Bull. Glacier Res. 15, 71-78.
Fukushima, Y., Kawashima, K., Suzuki, M., Ohta, T., Motoyama, H., Kubota, H., Yamada, T. & Bajracharya, O. R. (1987) Runoff characteristics in three glacier-covered watershed of Langtang Valley, Nepal Himalayas. Bull. Glacier Res. 5, U-18 .
Hasnain, S. I. & Thayyen, R. J. (1999) Controls on the major-ion chemistry of the Dokriani glacier meltwaters, Ganga basin, Garhwal Himalaya, India. J. Glaciol. 45, 87-92.
Higuchi, K., Ageta, Y., Yasunari, T. & Inoue, J. (1982) Characteristics of precipitation during the monsoon season in high mountain areas of the Nepal Himalaya. In: Hydrological Aspects of Alpine and High-Mountain Areas (ed. by J. W. Glen) (Proc. Exeter Symp., July 1982), 21-30. IAHS Publ. no. 138.
Inger, S. & Harris, B. W. (1992) Tectonothermal evolution of the High Himalayan Crystalline Sequence, Langtang Valley, northern Nepal. J. Metamorphic Geol. 10,439^152.
Kadota, T., Fujita, K., Seko, K., Kayasta, R. & Ageta, Y. (1997) Monitoring and prediction of shrinkage of a small glacier in the Nepal Himalaya. Ann. Glaciol. 24, 90-94.
Kamiyama, K. (1984) Lakes and their sediments around Yala Glacier. In: Glacial Studies in Langtang Valley (ed. by K. Higuchi), 85-89. Data Centre for Glacier Research, Water Res. Inst., Nagoya Univ., Nagoya, Japan.
Nakawo, M., Fujita, K., Ageta, Y., Shankar, K. & Pokhrel, A. P. (1997) Basic studies for assessing the impacts of the global worming on the Himalayan cryosphere, 1994-1996. Bull. Glacier Res. 15, 53-58.

2 8 8 Maya P. Bhatt et al.
Rana, B., Nakawo, M., Fukushima, Y. & Ageta, Y. (1997) Application of a conceptual precipitation-runoff (HYCYMODEL) in the debris-covered glacierized basin of Langtang Valley, Nepal Himalaya. Ann. Glaciol. 25, 226-231.
Reynolds, B., Chapman, P. J., French, M. C , Jenkins, A. & Wheater, H. S. (1995) Major, minor and trace element chemistry of surface waters in the Everest region of Nepal. In: Biochemistry of Seasonally Snow-Covered Catchments (ed. by K. A. Tonnessen, Mark W. Williams & Martyn Tranter), 405^112. IAHS Publ. no. 228.
Sakai, A., Fujita, K., Aoki, T., Asahi, K. & Nakawo, M. (1997) Water discharge from the Lirung Glacier in Langtang Valley, Nepal Himalaya, 1996. Bull. Glacier Res. 15,79-83.
Tranter, M. & Raiswell, R. (1991) The composition of the englacial and subglacial component in bulk meltwaters draining the Gornergletscher, Switzerland. J. Glaciol. 37, 59-66
Tranter, M., Brown, G., Raiswell, R., Sharp, M. & Gurnell, A. (1993) A conceptual model of solute acquisition by Alpine glacial meltwaters. J. Glaciol. 39, 573-581.
Watanbe, O., Takenaka, S., Iida, H., Kamiyama, K., Thapa, K. B. & Mulmi, D. D. (1984) First results from Himalayan Glacier Boring Project in 1981-1982: Part I. Stratigraphie analyses of full-depth cores from Yala Glacier, Langtang Himal, Nepal. In: Glacial Studies in Langtang Valley (ed. by K. Higuchi), 7-23. Data Centre for Glacier Research, Water Res. Inst., Nagoya Univ., Nagoya, Japan.
Related Documents