Pergamon 0967-0637(95)00089-5 CopyrIght Q 1995 Elsevier Science Lrd Printed in Great Bntain. All rights rewrved lM74h371Y5 ww+ 0 (IO Seasonal changes in coccolithophore densities in the Southern California Bight during 1991-1992 P. ZIVERI.*?_ R. C. THUNELL* and D. RIO? (Received 30 June lY9-!: in reviwdfbrrn 14 February 1995; accepted 13 August 1905) Abstract-Seasonal changes in coccolithophore cell densities in the San Pedro Basin, Southern California Bight, were investigated for the period October 1991 to September 1992. Coccolitho- phore cell densities ranged from 6.3 x lfy coccospheres per liter in March 1992 to Ocells per liter in November 1991. High coccolithophore concentrations occurred in late winter and spring, and low densities occurred in the summer and fall. The high coccolithophore densities during spring 1992 were associated with unusually low surface nutrient concentrations and a lack of upwelling. suggesting that the high densities were not part of a typical spring phytoplankton bloom in this region. We propose that the suppression of upwelling during spring 1992 may have been related to the prevailing ENS0 conditions. Ewziliunia huxleyi type A dominated the total coccolithophorc population throughout the year. Unzbilicosphaera sibogae var. Gbogae being the second most important contributor to the coccolithophorc a\scmblagcs. INTRODUCTION The Southern California Bight falls within a major eastern boundary upwelling system. Seasonal as well as short term changes in wind stress drive the upwelling and are responsible for mesoscale variability in both physical and biological processes in this region. The Borderlands of Southern California are also influenced by the quasiperiodic EZ Niriol Southern Oscillation (ENSO), which results in pronounced deepening of the thermocline, warming of the surface mixed layer, reduced coastal upwelling, and enhanced onshore transport of low salinity waters from offshore (Simpson, 1984; McGowan, 1985). It has been reported that during ENS0 events both phytoplankton and zooplankton biomass are reduced (Reid et al., 1985; McGowan, 1985). However, there have been no attempts to document and understand the relationship between ENS0 events and coccolithophore productivity. Several previous studies in coastal upwelling environments (Smayda, 1966; Winter, 1985; Mitchell-Innes and Winter, 1987; Kleijne et al., 1991; Giraudeau et al., 1993) have shown that coccolithophores can be important contributors to the total phytoplankton population. While diatoms dominate in newly upwelled water, blooms of coccolitho- phores and other microflagellates may occur once the surface waters become more stratified and nutrient-depleted (Mitchell-Innes and Winter. 1987). Few observations have been made of seasonal changes in coccolithophore productivity *Dept. of Geological Sciences, University of South Carolina, Columbia. SC 29208, U.S.A. c-mail: [email protected]. tDip. di Geologia, Paleontologia c Geofisica. Universita degli Studi di Padova, Padova. Italia.

Welcome message from author
This document is posted to help you gain knowledge. Please leave a comment to let me know what you think about it! Share it to your friends and learn new things together.
Transcript
Pergamon 0967-0637(95)00089-5
CopyrIght Q 1995 Elsevier Science Lrd Printed in Great Bntain. All rights rewrved
lM74h371Y5 ww+ 0 (IO
Seasonal changes in coccolithophore densities in the Southern California Bight during 1991-1992
P. ZIVERI.*?_ R. C. THUNELL* and D. RIO?
(Received 30 June lY9-!: in reviwdfbrrn 14 February 1995; accepted 13 August 1905)
Abstract-Seasonal changes in coccolithophore cell densities in the San Pedro Basin, Southern California Bight, were investigated for the period October 1991 to September 1992. Coccolitho- phore cell densities ranged from 6.3 x lfy coccospheres per liter in March 1992 to Ocells per liter in November 1991. High coccolithophore concentrations occurred in late winter and spring, and low densities occurred in the summer and fall. The high coccolithophore densities during spring 1992 were associated with unusually low surface nutrient concentrations and a lack of upwelling. suggesting that the high densities were not part of a typical spring phytoplankton bloom in this region. We propose that the suppression of upwelling during spring 1992 may have been related to the prevailing ENS0 conditions. Ewziliunia huxleyi type A dominated the total coccolithophorc population throughout the year. Unzbilicosphaera sibogae var. Gbogae being the second most important contributor to the coccolithophorc a\scmblagcs.
INTRODUCTION
The Southern California Bight falls within a major eastern boundary upwelling system. Seasonal as well as short term changes in wind stress drive the upwelling and are responsible for mesoscale variability in both physical and biological processes in this region. The Borderlands of Southern California are also influenced by the quasiperiodic EZ Niriol Southern Oscillation (ENSO), which results in pronounced deepening of the thermocline, warming of the surface mixed layer, reduced coastal upwelling, and enhanced onshore transport of low salinity waters from offshore (Simpson, 1984; McGowan, 1985). It has been reported that during ENS0 events both phytoplankton and zooplankton biomass are reduced (Reid et al., 1985; McGowan, 1985). However, there have been no attempts to document and understand the relationship between ENS0 events and coccolithophore productivity.
Several previous studies in coastal upwelling environments (Smayda, 1966; Winter, 1985; Mitchell-Innes and Winter, 1987; Kleijne et al., 1991; Giraudeau et al., 1993) have shown that coccolithophores can be important contributors to the total phytoplankton population. While diatoms dominate in newly upwelled water, blooms of coccolitho- phores and other microflagellates may occur once the surface waters become more stratified and nutrient-depleted (Mitchell-Innes and Winter. 1987).
Few observations have been made of seasonal changes in coccolithophore productivity
*Dept. of Geological Sciences, University of South Carolina, Columbia. SC 29208, U.S.A. c-mail: [email protected].
tDip. di Geologia, Paleontologia c Geofisica. Universita degli Studi di Padova, Padova. Italia.
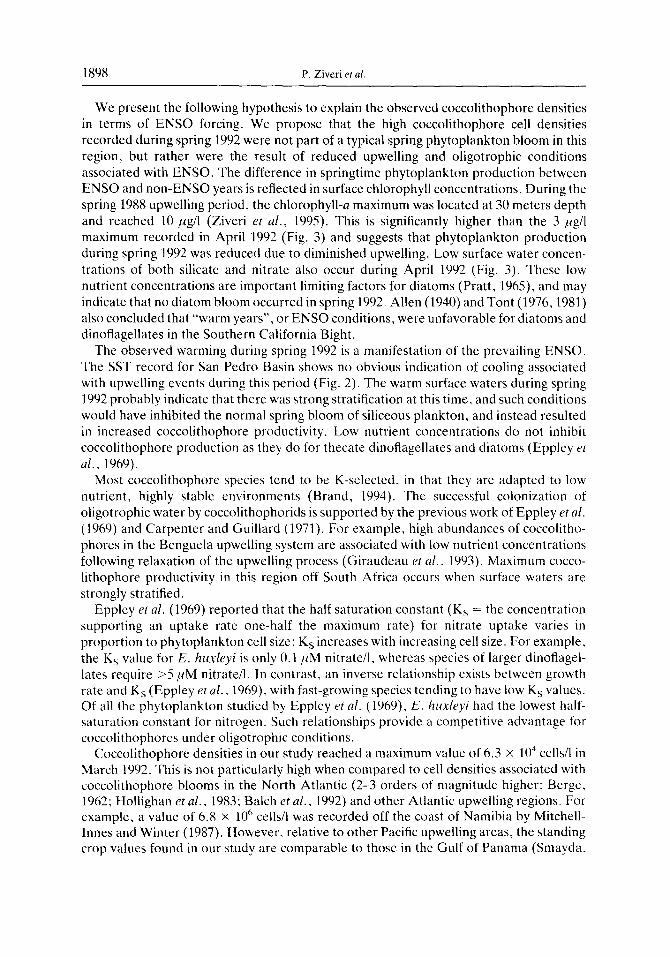
I882 P. Ziveri et al.
34’N
33’N
I I I / 1 119"w 118”W 117”w
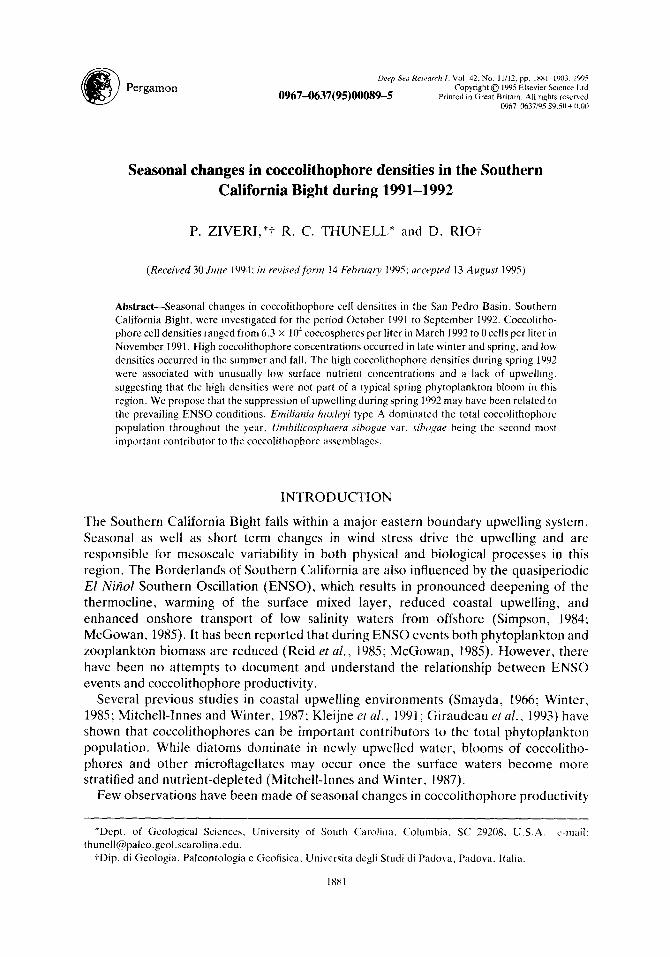
Fig. 1. Bathymetric map (meters) of the Southern California Bight showing the location of the surface water sampling site (black square) in the San Pedro Basin (SP). The other Borderland basins include Santa Monica (SM). Santa Cruz (SO). Catalina (CA). San Nicolas and Tanner
(‘I-A).
(Okada and McIntyre, 1979; Reid, 1980). Most studies of modern coccolithophores have used sampling frequencies that are too low to evaluate seasonal variability. Rather than collecting a continuous time series of samples at one site, these studies have tended to concentrate on regional biogeographic patterns of coccolithophores (McIntyre and Be, 1967; McIntyre et al. 1970; Okada and Honjo. 1973; Honjo and Okada, 1974). In the present study, we investigate seasonal changes in coccolithophore cell density and species composition in the San Pedro Basin, Southern California Bight (Fig. l), during the year- long period from October 1991 to September 1992.
HYDROGRAPHY AND CLIMATOLOGY
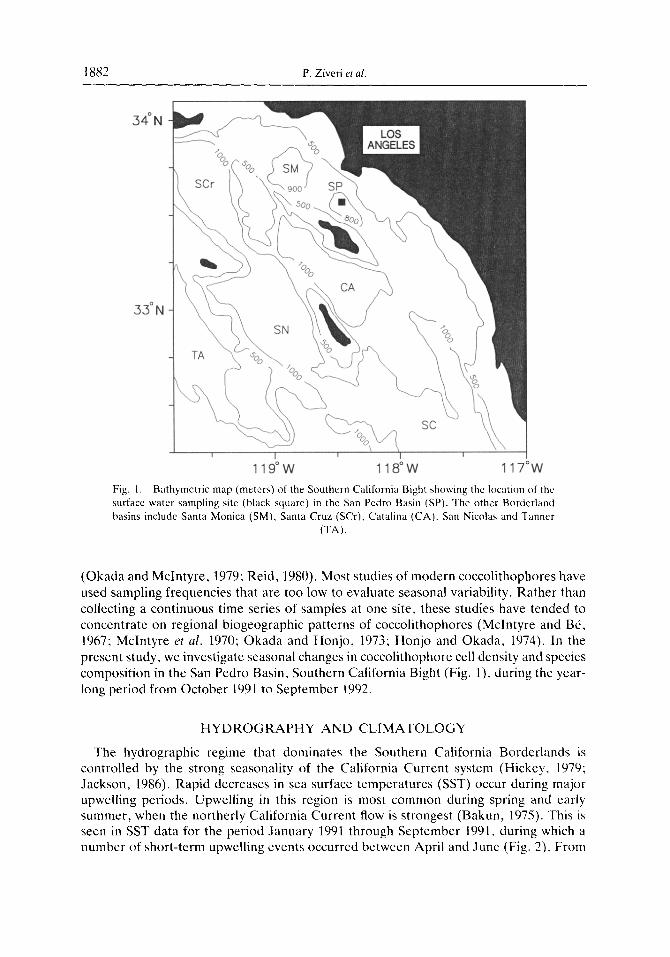
The hydrographic regime that dominates the Southern California Borderlands is controlled by the strong seasonality of the California Current system (Hickey, 1979; Jackson, 1986). Rapid decreases in sea surface temperatures (SST) occur during major upwelling periods. Upwelling in this region is most common during spring and early summer, when the northerly California Current flow is strongest (Bakun, 1975). This is seen in SST data for the period January 1991 through September 1991 1 during which a number of short-term upwelling events occurred between April and June (Fig. 2). From
Changes in coccolithophore densities 1883
24.0 ,
12.0 j , , , , , , , , ,’ , , , , , , , , , , , I
Jan Mar May Jul Sep Nov Jan Mar May Jul Sep
1991 1992
Fig. 2. Daily SST record for January 1991 to September 1992 in San Pedro Basin (solid lint). The dashed lint represents the long term mean SST record based on data from 1960-1991 (data from National Data Buoy Center). Water samples used in this study were collected between October
1991 and September 1992.
mid-1991 through late 1993, ENS0 conditions existed in the eastern equatorial Pacific, resulting in a deepening of the thermocline, a decrease in the tradewinds, and a decrease in upwelling (Hayes and McPhaden, 1992; Halpert et al., 1994). The warm surface waters associated with this ENS0 event are clearly recorded in the San Pedro Basin SST record (Fig. 2). In particular, SSTs during the spring and early summer of 1992 were several degrees warmer than during the previous year and 2-3°C warmer than the long-term mean for this location. In addition, the SSTrecord suggests that there were no obvious upwelling events in San Pedro Basin during spring-early summer of 1992.
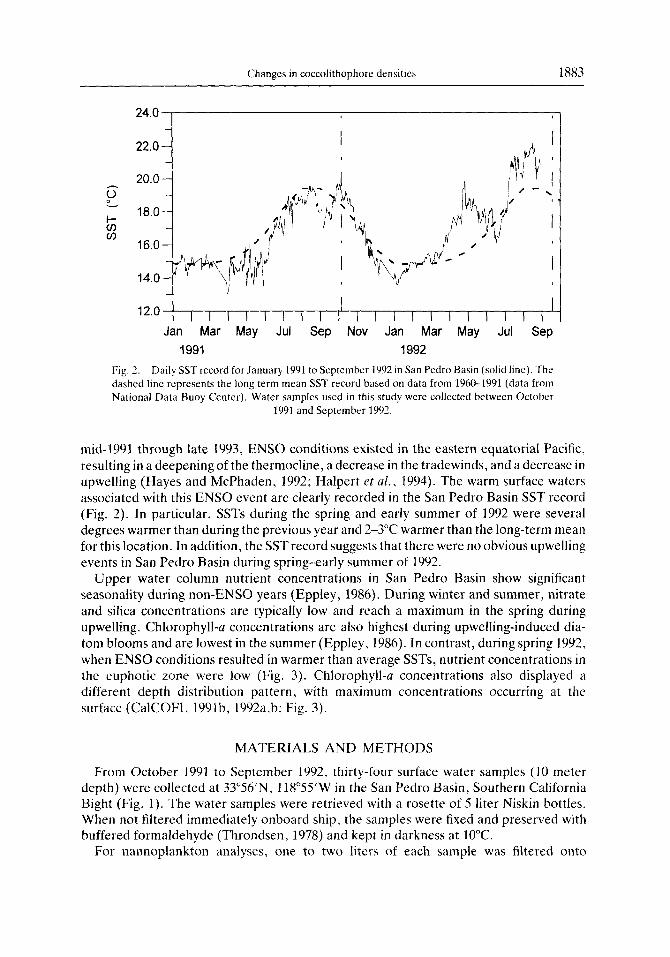
Upper water column nutrient concentrations in San Pedro Basin show significant seasonality during non-ENS0 years (Eppley, 1986). During winter and summer, nitrate and silica concentrations are typically low and reach a maximum in the spring during upwelling. Chlorophyll-a concentrations are also highest during upwelling-induced dia- tom blooms and are lowest in the summer (Eppley, 1986). In contrast, during spring 1992, when ENS0 conditions resulted in warmer than average SSTs, nutrient concentrations in the euphotic zone were low (Fig. 3). Chlorophyll-a concentrations also displayed a different depth distribution pattern, with maximum concentrations occurring at the surface (CalCOFJ, 1991b, 1992a.b; Fig. 3).
MATERIALS AND METHODS
From October 1991 to September 1992, thirty-four surface water samples (10 meter depth) were collected at 33”.56’N, llS”55’W in the San Pedro Basin, Southern California Bight (Fig. 1). The water samples were retrieved with a rosette of 5 liter Niskin bottles. When not filtered immediately onboard ship. the samples were fixed and preserved with buffered formaldehyde (Throndsen, 1978) and kept in darkness at 10°C.
For nannoplankton analyses, one to two liters of each sample was filtered onto
I X84 P. Ziveri et al.
Nitrate (urn/l) Silicate (urn/l)
0.0 10.0 20.0 30.0
Chl-a (us/l)
-+ October05.1991 + Febw,ryC4.1992 + April23.1992 + JulyO8.1992 -z+ OchkrO2. ‘992
Fig. 3. Depth profiles of nitrate ~ silicate and chlorophyll-a concentrations measured on 5 October 1901. 4 February 1992. 23 April 1992. 8 July 1992 and 2 October 1992 at CalCOFI (California Cooperative Fisheries Investigations) Stas X7 39.6 (33”40.9N-118”573W). 87 39.4 (33”41N- 118”56W). 87 39.4 (33”41N-llV56.1 W). 87 39.4 (33”41 N-l lB”%W), 87 40 (33”39,4N-1 lB”SB.hW)
87 40 (33”39.7N-118’58.3W). respectively (data from Scripps Institution of Oceanography).
NucleporeTM (47 mm diameter, 0.40 pm pore size) and Millipore”‘” (47 mm diameter, 0.45 pm pore size) membrane filters for scanning electronic microscope (SEM) and light microscope (LM) studies, respectively. The filters were dried at 50°C and stored in air- tight plastic cases.
Coccolithophore cell densities were estimated with a polarized optical light microscope at 1250x magnification. A portion of each MilliporeTM filter was mounted on a glass slide and rendered transparent with immersion oil. The number of cells per liter was then calculated from the number of cells counted in a known area of each filter. The LM was also used to study the cell densities of species that are readily recognizable under low magnification: Umhilicosphaera sibogae, Helicosphaera spp., Rhubdosphaera xiphos, Rh. clasigera and Calcidiscus leptoporus.
Those samples which contained relatively high cell densities also were examined for species composition under a Hitachi 2500 Delta scanning electron microscope (SEM). In preparation for SEM analysis, a portion of known area of each NucleporeTM filter was mounted on a 15 mm aluminum stub and coated with a 100 A thick layer of gold. When possible, at least 200 individuals per sample were counted and identified. The species identification followed the taxonomies of Winter and Siesser (1994), Borsetti and Cati (1972. 1976),OkadaandHonjo(1975),Nishida(1979),HeimedalandGaarder(l9Xl)and Norris (1984). Identification of the various Erniliartia huxleyi morphotypes is based on Young and Westbroek (1991).
Sea surface temperature data collected from a NOAA buoy in San Pedro Basin were obtained from the National Data Buoy Center (Stennis Space Center, Mississippi). Daily
Changes in coccolithophore densities 1885
averages were calculated from hourly SST measurements. In addition, nitrate, silicate and chlorophyll-u concentrations were measured by CalCOFI (Scripps Institution of Ocean- ography) at different times during the study period. CalCOFI stations 87.39.6 and 87.40 (33”40’N, 118”57’W and 33”39’N, 118”58’W, respectively) are approximately 15 km from the water sampling site. Silicate and nitrate were determined with an auto-analyzer according to Atlas et al. (1981). Chlorophyll-cr concentrations were determined with a Turner Designs flourometer (Holm-Hansen et 01.. 1965).
RESULTS
Seasonal distribution of coccolithophore cell densities
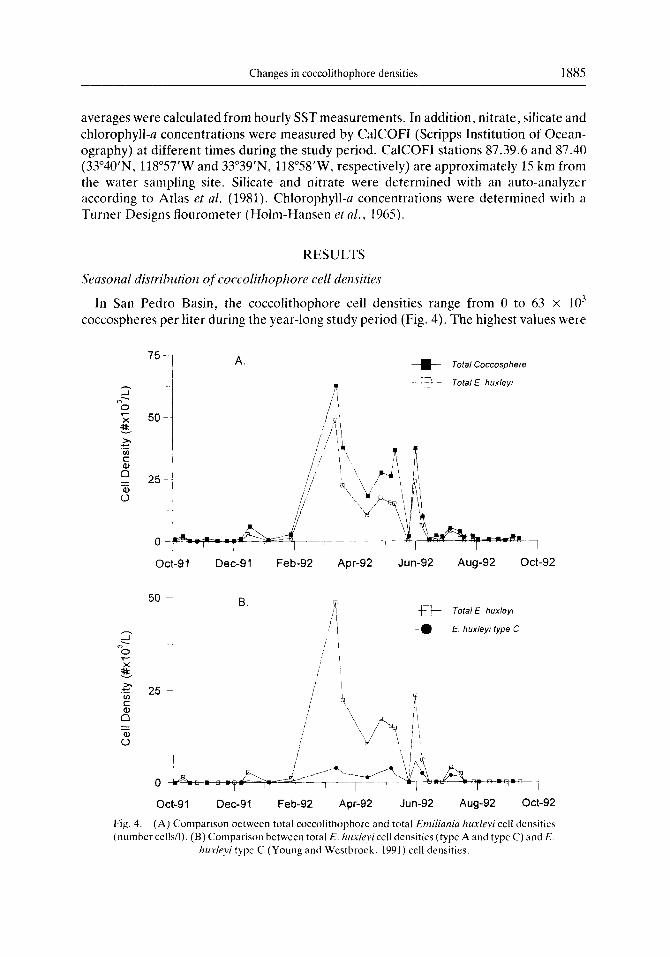
In San Pedro Basin, the coccolithophore cell densities range from 0 to 63 x IO”
coccospheres per liter during the year-long study period (Fig. 4). The highest values were
75
50
25
0
Dee-91 Feb-92 Apr-92 Jun-92 Aug-92 Ott-92
50 1 B
O- i
act-9 1 Dee-91 Feb-92 Apr-92 Jun-92 Aug-92 Ott-92
Fig. 4. (A) Comparison between total coccolithophorc and total Emiliania huxlqvi cell dcnsitics (number cells/l). (B) Comparison between total E. hule~icell dcnsitics (type A and type C) and E
h&eyi type C (Young and Wcstbroek. 1991) cell dcnsitics.
Changes in coccolithophore densities 1887
1888 P. Ziveri et al
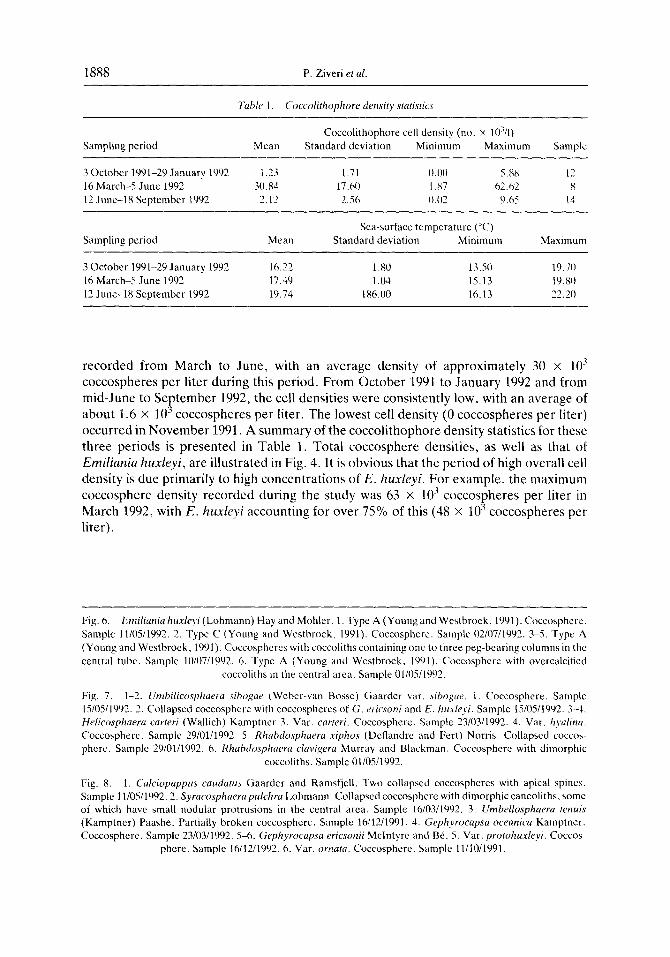
Table 1. (hccoiithophore density statistics
Coccolithophore cell density (no. x 1041) Sampling period Mean Standard deviation Minimum Maximum Sample
3 October 1991-29 January 1992 1.33 1.71 O.UO 5.88 12 16 March-5 June 1992 30.84 17.60 I.87 62.62 x 12 June-1 8 September 1992 2.12 2.56 0.02 Y.65 14
Sampling period Mean
3 October 1991-29 January 1992 16.22 16 March-S June 1992 17.49 12 June-lx September 1992 19.74
Sea-surface tempcraturc (“C) Standard deviation Minimum
1.80 13.50 1.04 15.13
1X6.00 16.13
Maximum
19.70 19X1 77 ‘0 __.-
recorded from March to June, with an average density of approximately 30 x 103
coccospheres per liter during this period. From October 1991 to January 1992 and from mid-June to September 1992, the cell densities were consistently low, with an average of about 1.6 x IO3 coccospheres per liter. The lowest cell density (0 coccospheres per liter) occurred in November 1991. A summary of the coccolithophore density statistics for these three periods is presented in Table 1. Total coccosphere densities, as well as that of Emiliania huxleyi, are illustrated in Fig. 4. It is obvious that the period of high overall cell density is due primarily to high concentrations of E. huxleyi. For example, the maximum coccosphere density recorded during the study was 63 x lo3 coccospheres per liter in March 1992, with E. huxleyi accounting for over 75% of this (48 x lo7 coccospheres per liter).
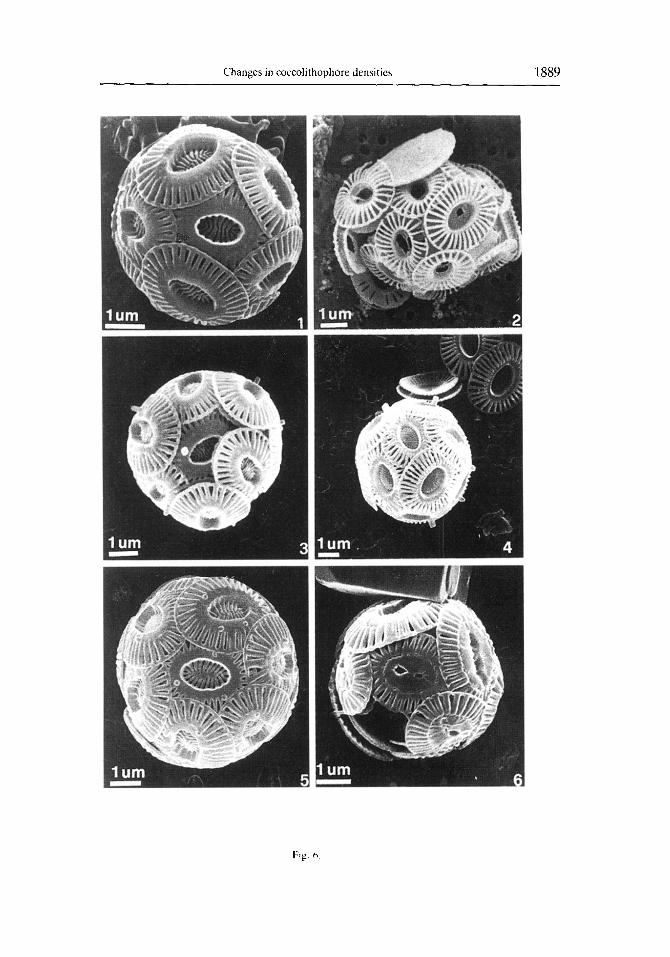
Fig. 6. Emikznia huxleyi (Lohmann) Hay and Mohler. I. Type A (Young and Westhroek. 1991). Coccospherc. Sample 11/05/1992. 2. Type C (Young and Westhroek. lY91). Coccosphcre. Sample 02/07/1993. 3-5. Type A (Young and Westbroek, 1991). Coccosphcrcs with coccoliths containing one to three peg-bearing columns in the central tube. Sample 10/07/191)2. 6. Type A (Young and Westbroek, 19Yl). Coccospherc with overcalcified
coccoliths in the central area. Sample Ol/OS/lY92.
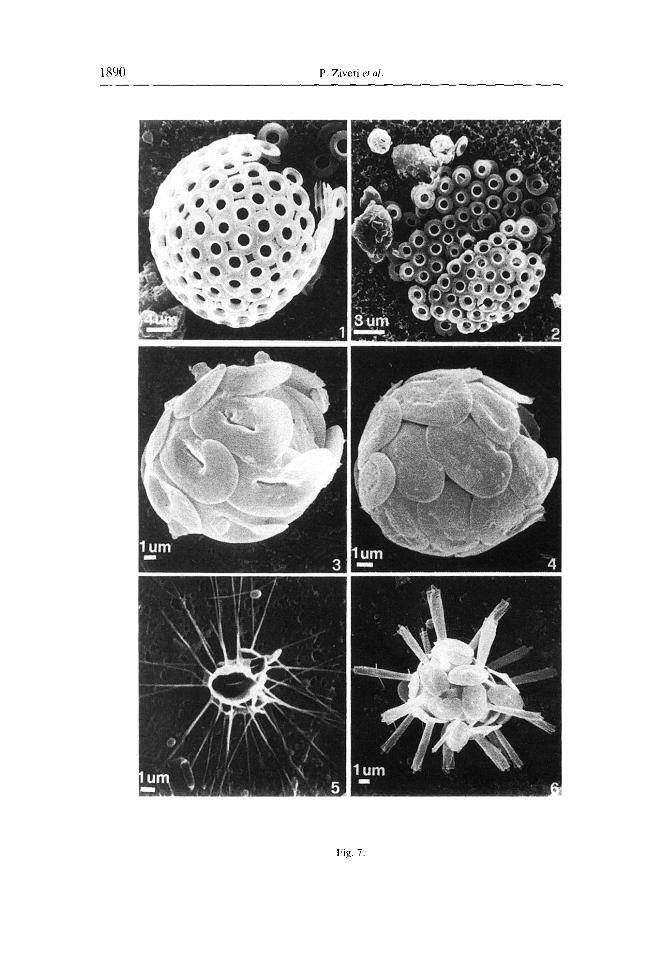
Fig. 7. l-2. Umbrlicosphaera sibogae (Wcher-van Rosse) Gaardcr var. sibogae. 1. Coccosphcre. Sample 15/05/1992. 2. Collapsed coccosphcrc with cuccosphercs of G. ericsoni and E. hux[eyi. Sample 15/05/19Y2. 3-4. Helicosphaeru carteri (Wallich) Kamptncr 3. Var. carteri. Coccosphere. Sample 23/03/1992. 4. Var. hyalina. Coccospherc. Sample 29/01/1992. 5. Rhabdosphaera xiphos (Deflandre and Fert) Norris. Collapsed coccos- pherc. Sample 29/01/1992. 6. Rhabdosphuera clavigeru Murray and Blackman. Coccosphcre with dimorphic
coccoliths. Sample 0110511992.
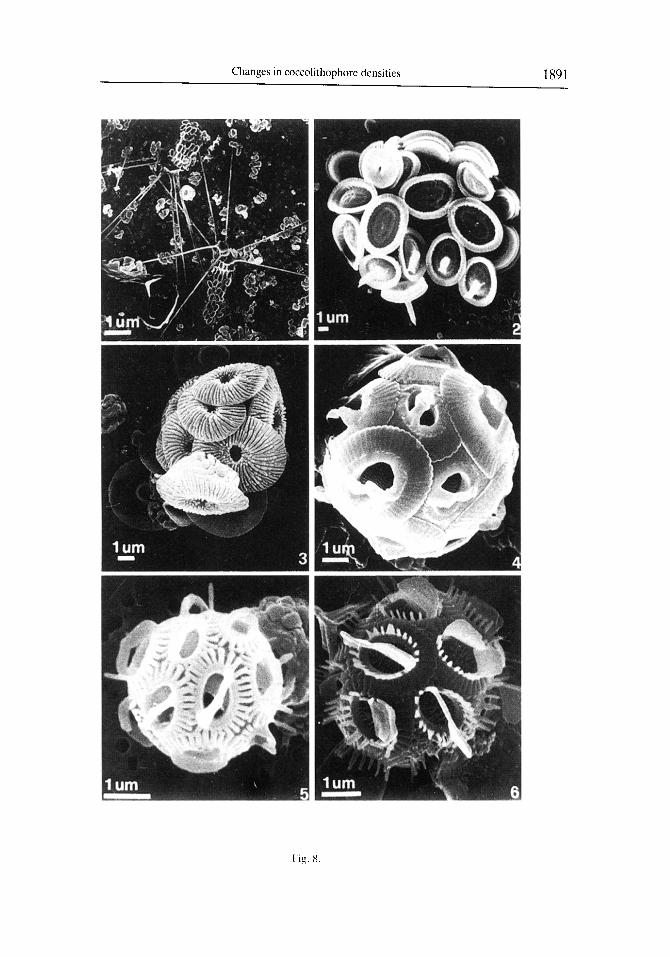
Fig. 8. 1. Cakiopappus caudatus Gaarder and Ramsfjell. Two collapsed coccospheres with apical spines. Sample 11/05/lY92.2. Syracosphaerapulchra Lohmann. Collapsed coccosphcre with dimorphic caneoliths. some of which have small nodular protrusions in the central area. Sample 16/03/1092. 3. Umhellosphaera tenuis (Kamptner) Paashe. Partially broken coccosphcrc. Sample 1611211991. 4. Gephyrocapsa oceanica Kamptncr. Coccosphcre. Sample 23/03/1992. 54. Gephyrocapsa ericsorzii McIntyre and Bk. 5. Var. protohuxleyi. Coccos-
phere. Sample 16112119Y2. 6. Var. orrzata. Coccosphere. Sample 11110/1991.
Changes in coccolithophore densities 1889
Fig. 6
P. Ziveri et al.
Fig. 7
Changes in coccolithophore densities 2391
Fig. 8
Changes in coccolithophore densities 1893
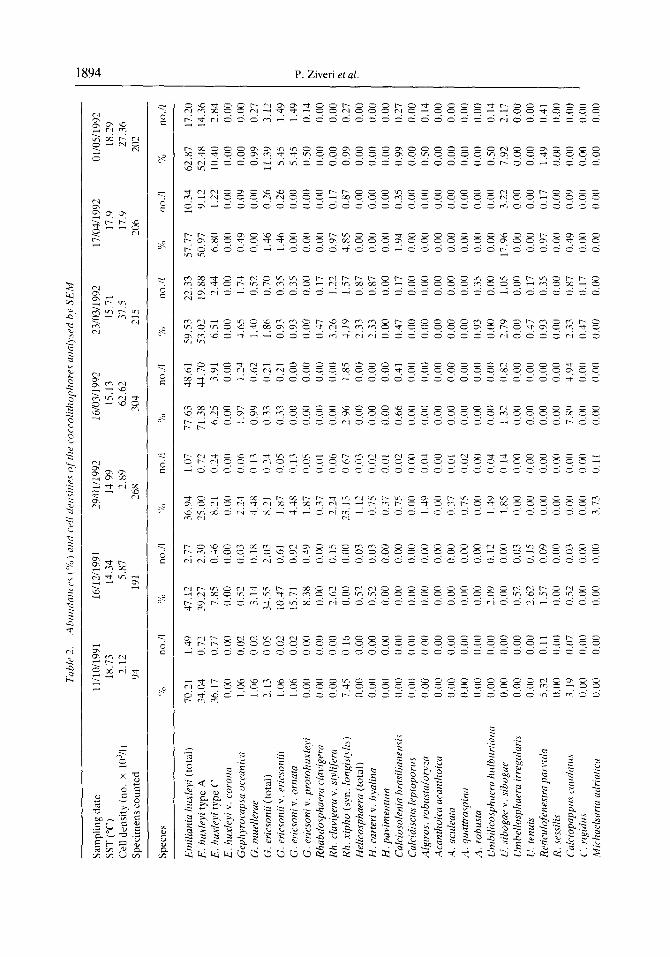
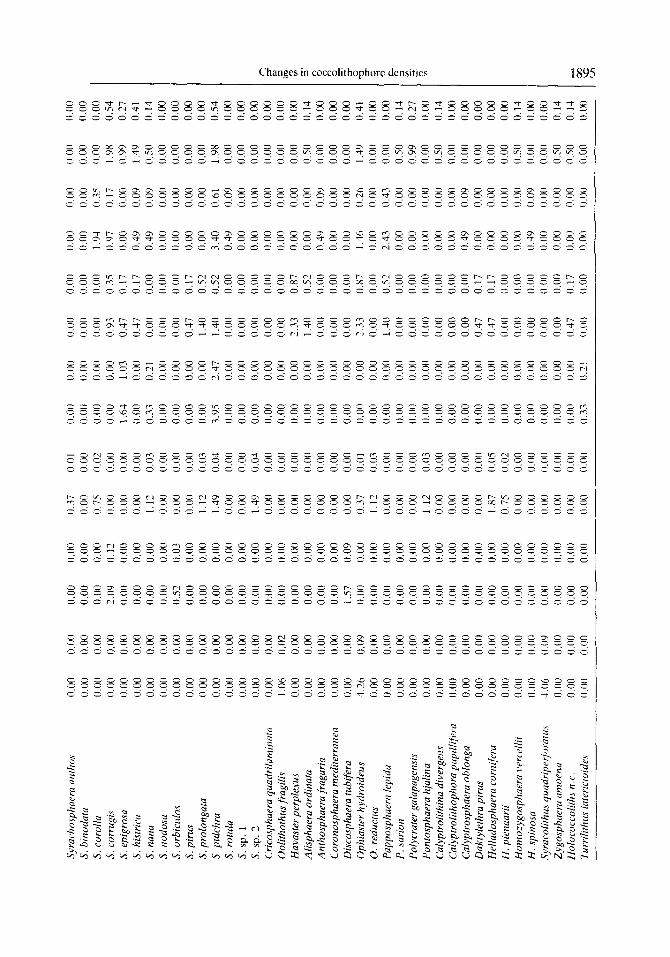
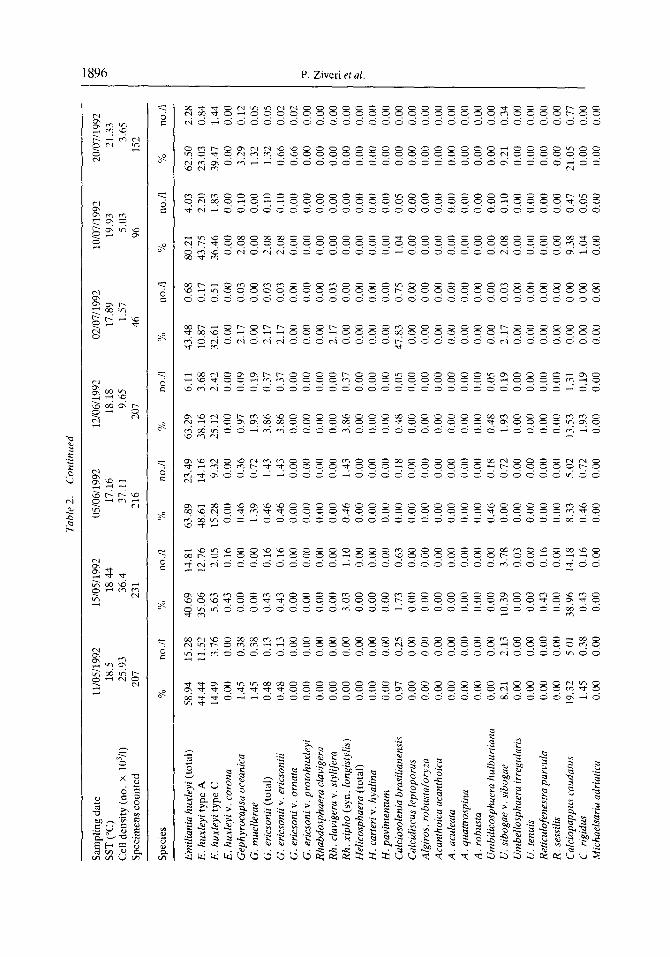
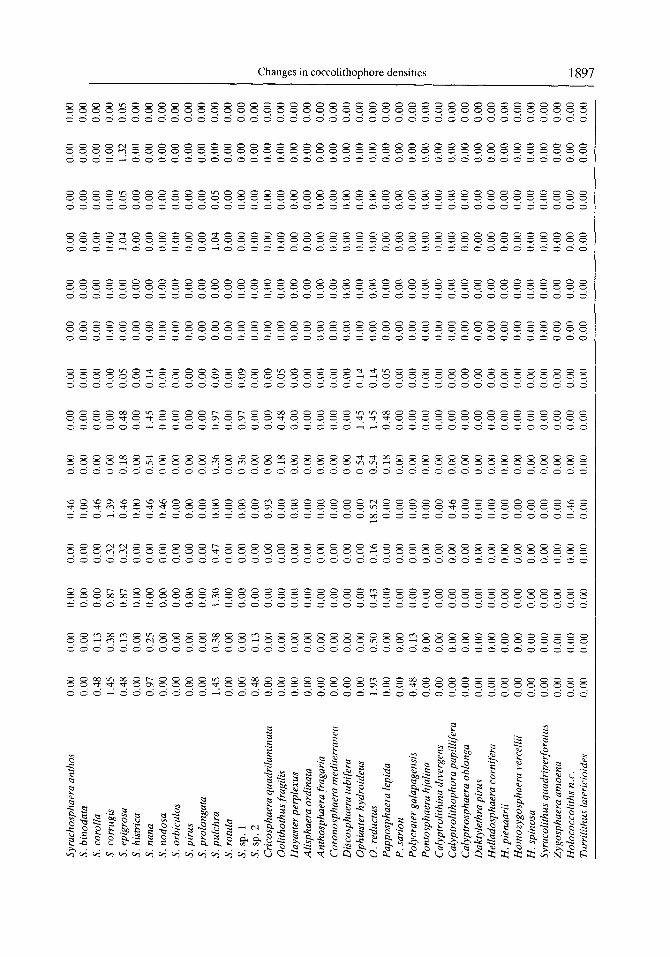
Seasonal composition of coccolithophore assemblages
A total of 63 coccolithophore species were identified in our samples, 12 of which are holococcolithophores (Table 2). As already indicated. Emiliania huxleyi was the dominant species throughout the study period, accounting for approximately 60% of each sample assemblage. The highest relative abundance of this species occurred in July 1992, with E. huxleyi constituting 80% of the total assemblage. In addition, most of the E. huxleyi present are type A (Fig. 6.1, 6.6); type C forms are rare (Fig. 6.2), and type B forms are absent. The surface water sample collected on 10 July 1992, contained a peculiar morphotype of E. huxleyi type A. These particular specimens had one to three peg- bearing columns in the central tube region (Fig. 6.3, 6.5). In this study, these forms are included in E. huxleyi type A (Table 2; Fig. 4).
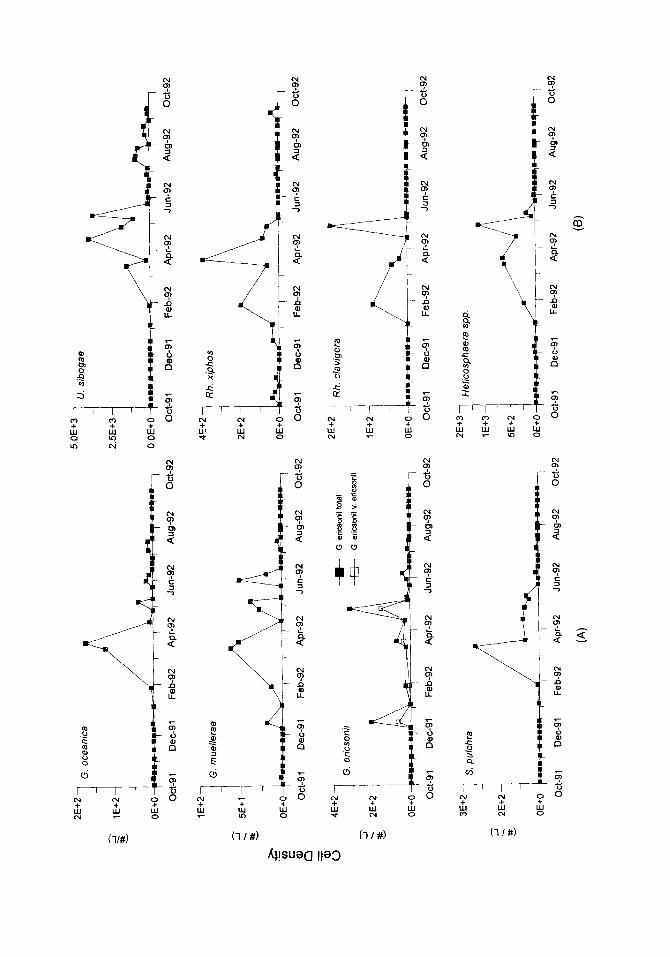
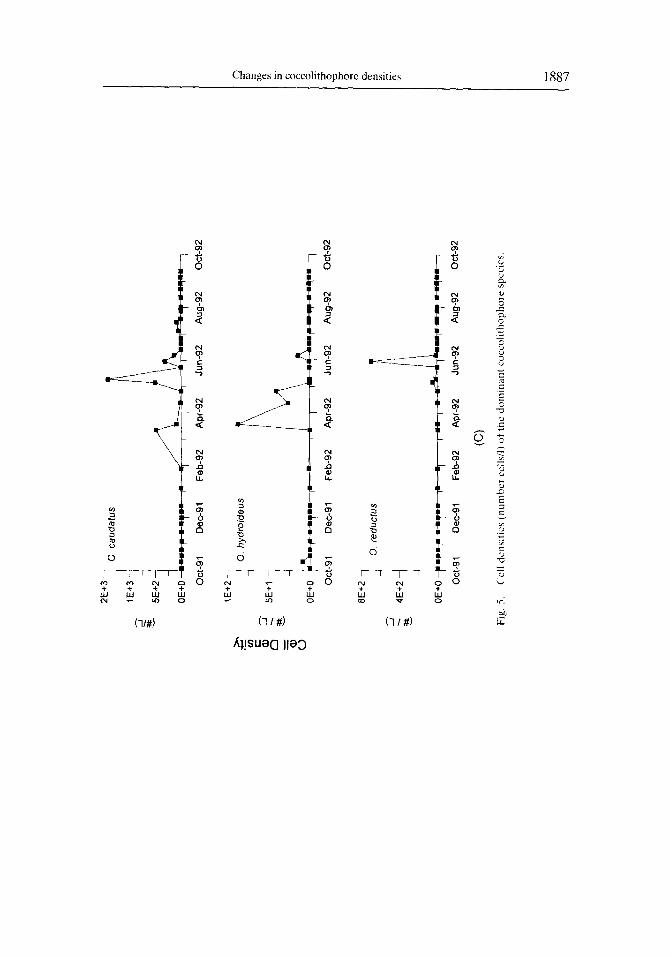
Temporal changes in the cell densities of the other major coccolithophore species identitiable under low magnitication of the LM are illustrated in Fig. 5. As with E. huxleyi, the highest concentrations of these secondary species typically occurred between March and June. Umbilicosphaera sibogae var. sibogae (Fig. 7.1, 7.2) was the second most abundant species in our samples, with maximum cell densities during April and May. Rhabdosphaera xiphos (Fig. 7.5), Calciopappus caudatus (Fig. S.l), Gephyrocapsa spp. (Fig. 8.4, 8.6). Uphyaster spp., Helicosphaera spp. (Fig. 7.3. 7.4) and Syracosphaera pulchra (Fig. 8.2) were also well represented, but were always much less abundant than E‘. huxleyi (Fig. 5; Table 2). Although the individual species abundance patterns did vary during the time of overall high cell densities, there was no obvious temporal succession of species during this period (Fig. 5).
DISCUSSION
1. Seasonal changes in cell density
Ideally, we would like to be able to compare cell density data collected over a number of years in order to evaluate interannual variability and ENSO/non-ENS0 differences. Unfortunately, there is little additional coccolithophore cell abundance data available for San Pedro Basin. However, a time-series sediment trap study of coccolithophore fluxes in San Pedro Basin was carried out in 1988 during non-ENS0 conditions (Ziveri et al., 1995) and can be used for comparative purposes. The results of that sediment trap study revealed that the highest coccosphere and coccolith fluxes occurred in winter (January-February), when sea surface temperatures were low and surface waters were nutrient-depleted. In contrast, coccolithophore fluxes were low during the 1988 spring upwelling period, when surface water nutrient concentrations were relatively high. In addition, the seasonal trends in coccolithophore fluxes were negatively correlated with diatom fluxes (Ziveri et al., 1995).
In contrast to the 1988 sediment trap study, the present water sampling study was carried out when ENS0 conditions resulted in SSTs that were up to 2-3°C warmer than average (Fig. 2). Our results show that significant seasonal changes in coccolithophore cell density occurred in San Pedro Basin during the year-long sampling period. In particular, we recorded high cell concentrations in late winter and spring (March-June), and low standing stocks during summer and fall. Conditions during spring 1992 were atypical in that upwelling was suppressed and surface nutrient concentrations were low (Figs 2 and 3).
1894 P. Ziveri et al.
Changes in coccolithophore densities 1895
1896 P. Ziveri et al
Changes in coccolithophore densities 1897
0000~0000000000000000000000 000000000000000000000000000 8888888888888 ddjjddddddddjddjddddjddjdijjjddjdddjjjdj
0=00N0000000000300000000000 o3oomoooooooooooooooooooooo 8
000000300003 000000300000
d 5 ti c’ ,: 6 6 6 d 6 d 6 d 6 6 5 6 d 6 d 5 6 5 0’ 6 6 5 d 6 5 6 5 5 6 6 d 6 d d c’
3c0~~0000300300033c335~ mC00300030000C300 ~oom~oqqoqo~oqo~~qoqoqodcoo =oooooooooooo dtid6Si o~~o~-dodododo~o~~dl~ & C’ j j 6 6 j 6 6 j j C’ c.
1898 P. Ziveri et al.
We present the following hypothesis to explain the observed coccolithophore densities in terms of ENS0 forcing. We propose that the high coccolithophore cell densities recorded during spring 1992 were not part of a typical spring phytoplankton bloom in this region, but rather were the result of reduced upwelling and oligotrophic conditions associated with ENSO. The difference in springtime phytoplankton production between ENS0 and non-ENS0 years is reflected in surface chlorophyll concentrations. During the spring 1988 upwelling period, the chlorophyll-a maximum was located at 30 meters depth and reached 10 pug/l (Ziveri rr al., 1995). This is significantly higher than the 3 FLg/l maximum recorded in April 1992 (Fig. 3) and suggests that phytoplankton production during spring 1992 was reduced due to diminished upwelling. Low surface water concen- trations of both silicate and nitrate also occur during April 1992 (Fig. 3). These low nutrient concentrations are important limiting factors for diatoms (Pratt, 1965), and may indicate that no diatom bloom occurred in spring 1992. Allen (1940) and Tont (1976,1981) also concluded that “warm years”, or ENS0 conditions, were unfavorable for diatoms and dinoflagellates in the Southern California Bight.
The observed warming during spring 1992 is a manifestation of the prevailing ENSO. The SST record for San Pedro Basin shows no obvious indication of cooling associated with upwelling events during this period (Fig. 2). The warm surface waters during spring 1992 probably indicate that there was strong stratification at this time, and such conditions would have inhibited the normal spring bloom of siliceous plankton, and instead resulted in increased coccolithophore productivity. Low nutrient concentrations do not inhibit coccolithophore production as they do for thecate dinoflagellates and diatoms (Eppley rr al., 1969).
Most coccolithophore species tend to be K-selected. in that they are adapted to low nutrient, highly stable environments (Brand, 1994). The successful colonization of oligotrophic water by coccolithophorids is supported by the previous work of Eppley et al. ( 1969) and Carpenter and Guillard ( 1971). For example, high abundances of coccolitho- phores in the Benguela upwelling system are associated with low nutrient concentrations following relaxation of the upwelling process (Giraudeau et rd., 1993). Maximum cocco- lithophore productivity in this region off South Africa occurs when surface waters are strongly stratified.
Eppley et al. (1969) reported that the half saturation constant (KS = the concentration supporting an uptake rate one-half the maximum rate) for nitrate uptake varies in proportion to phytoplankton cell size: Ks increases with increasing cell size. For example, the KS value for E. huxleyi is only 0.1 ,uM nitrate/l, whereas species of larger dinofagel- lates require >.5 ,LIM nitrate/l. In contrast, an inverse relationship exists between growth rate and K, (Eppley et al.. 1969), with fast-growing species tending to have low KS values. Of all the phytoplankton studied by Eppley et al. (1969), E. huxleyi had the lowest half- saturation constant for nitrogen. Such relationships provide a competitive advantage for coccolithophores under oligotrophic conditions.
Coccolithophore densities in our study reached a maximum value of 6.3 X 10” cells/l in March 1992. This is not particularly high when compared to cell densities associated with coccolithophore blooms in the North Atlantic (2-3 orders of magnitude higher; Berge, 1962; Hollighan et nl., 1983; Balch et al., 1992) and other Atlantic upwelling regions. For example, a value of 6.8 x 10’ cells/l was recorded off the coast of Namibia by Mitchell- Innes and Winter (1987). However, relative to other Pacific upwelling areas, the standing crop values found in our study are comparable to those in the Gulf of Panama (Smayda,
Changes in coccolithophore densities 1899
1966) and the equatorial Pacific (Okada and Honjo, 1973), but one order of magnitude lower than off Peru during the 1982/83 El Nina (Chavez, 1985). Within the Southern California Bight, Winter (1985) measured coccolithophore cell densities of 6.2 x lO’cells/l in San Nicolas Basin and 1.4 x 10” cells/l in San Pedro Basin in March 1982.
2. Seasonal changes in species composition of coccolithophore assemblages
Seasonal changes in coccolithophore assemblages during the study period are domi- nated by changes in the abundance of E. huxleyi. The conditions in the Southern California Borderlands clearly favor this most opportunistic and ubiquitous coccolitho- phore species. Relative to the large blooms of this species observed in the transitional and subpolar region of the North Atlantic, the E. huxleyi cell densities recorded in San Pedro Basin are low. These differences may be real or they may be due to patchy spatial distributions. Additionally, these quantitative differences may be related to differences in sampling depths.
In our study, the lack of a distinct species succession during the period of greatest coccolithophore density suggests that the water column remained relatively stable during this period. The large differences in E. huxleyi standing stocks between spring and the remainder of the year are probably due to several factors. Although the optimal or preferred environmental conditions for E. huxleyi productivity are not well-known, it has been demonstrated that this species becomes abundant when the water column becomes stratified (Brand, 1994). In addition, the low surface water nutrient concentrations during spring 1992 (Fig. 3) would have prevented a large bloom of diatoms and allowed E. huxleyi to flourish. The availability of different forms of nitrogen may also control the production of various phytoplankton based on their cell size. According to Probyn (1993), coccolitho- phore production is favored by the presence of regenerated reduced nitrogen (ammonium and urea). while nitrate-dominated new production allows diatoms to flourish.
The second most abundant species, Umbilicosphaera sibogae var. sibogae (Fig. 5), has been shown to prefer warm oligotrophic waters (Okada and McIntyre, 1979). Honjo (19X2) recorded a monospecitic bloom of U. sibogae from June through July during non- upwelling conditions in the Panama Basin. Reid etal. (1985) carried out a study off Scripps pier during the 1983 ENS0 and found I/. sibogae to be present only in September and October, when there were positive temperature anomalies characteristic of El Nirio conditions. Guraudeau (1992) considers this species to be an indicator of oligotrophic conditions because it occurs in higher abundances in surface sediments underlying oligotrophic waters than in sediments beneath the upwelling region off Southwestern Africa. In the Southern California Bight, Winter (1985) found this species to be associated with the poleward flowing, warm water California Countercurrent. These previous observations are consistent with the occurrence of I/. sibogae in San Pedro Basin during ENS0 conditions. In our 1988 sediment trap study (Ziveri ct al., 1995), fluxes of this species were very low and no intact coccospheres were recorded.
Rhabdosphaera xiphos (synonymy Rh. longistylis) and Rh. clavigera exhibit similar seasonal patterns with Rhabdosphaeraxiphos being the more abundant of the two (Fig. 5). In the northwestern Pacific, Rh. xiphos is associated with the warm Kuroshio (Okada and McIntyre, 1977). while in the Southern California Bight it was previously found only in coastal stations (Winter, 1985). Rhahdosphaera &v&era is abundant in temperate to subtropical waters (McIntyre rtd., 1970: Gaarder. 1970). According to Brand (1994), this
1900 P. Ziveri et al.
species grows well at low nutrient levels and does not increase its growth rate in response to elevated nutrient concentrations. In our study, Rhabdosphaera spp. are recorded over a wide range of SSTs (14-2O”C), suggesting that temperature is not the major factor controlling its distribution in this region.
Helicosphaera spp., with H. carteri being dominant, were found to be abundant in San Pedro Basin sediment trap samples when overall coccolithophore fluxes were high (Ziveri et al., 1995). In the present study Helicosphaera spp. were abundant between January and late May 1992, the time of high overall coccolithophore cell densities.
Calciopappus caudatus and Ophiaster spp. were also seasonally important in the San Pedro Basin coccolithophore assemblages. Calciopappus caudatus lives within a wide range of temperatures (Okada and McIntyre, 1979); similarly Ophiaster hydrideus is present in the Pacific from the equator to the transitional regions (Okada and McIntyre, 1977). Unfortunately these two species are very susceptible to dissolution and have little potential as paleoceanographic indicators.
Gephyrocapsa spp. were present as small Gephyrocapsa (G. ericsonii), G. muellerae and G. oceanica. In our previous sediment trap study (Ziveri rt al., 1995), Gephyrocapsa, along with E. huxleyi and Florisphaera profunda, were the dominant coccolithophore species. Gephyrocapsa oceanica is known to prefer warm waters (McIntyre et al., 1970; Okada and Honjo, 1975; Okada and McIntyre, 1977) and it has been suggested that its abundances increase in nutrient-rich coastal waters. The high temperatures recorded during the 1991-1992 ENS0 could have encouraged the growth of this species, but the low nutrient concentrations probably kept cell densities relatively low.
Syracosphaera is the most diverse living coccolithophore genus (Okada and McIntyre, 1977) and in general does not exhibit a distinct biogeographic pattern (Okada and McIntyre, 1979). In our study, Syrucosphaera pulchra was the most abundant species of this genus, with maximum cell densities occurring in March when SST was slightly warmer than normal. In Winter’s (1985) study of the California Borderlands. S. pulchru was always in low abundances.
CONCLUSIONS
During spring 1992 favorable conditions existed in the Southern California Bight for high coccolithophore cell densities. We hypothesize that the typical seasonal distribution patterns of diatom and coccolithophore productivity in this area are modified during ENS0 years due to reduced upwelling and the development of more oligotrophic conditions. Low surface water nutrient concentrations during spring 1992 prevented the typical siliceous phytoplankton bloom that usually occurs at this time. Rather, the growth of coccolithophores was favored under these conditions, with maximum cell densities occurring from March to June 1992. The high coccolithophore cell densities at this time reflect the general adaptation of this phytoplankton group to oligotrophic conditions.
Seasonal changes in coccolithophore assemblages during the year-long sampling period were dominated by changes in the abundance of E. huxleyi. In particular, E. huxleyi type A dominated the total coccolithophore assemblage during this period. During the spring period of high coccolithophore cell densities there was no distinct species succession, suggesting that conditions in the upper water column remained relatively stable. The presence of Umbilicosphaera sibogae var. sibogae seems to be related to the oligotrophic and warm surface water conditions associated with the ENS0 conditions.
Changes in coccolithophore densities 1901
Acknowledgements-We thank the staff of the University of Southern California Marine Support Facility for assistance in the water sampling. We also thank E. Tappa for technical assistance and N. Watabe for use of the SEM Laboratory of the University of South Carolina. We thank C. Brown and an anonymous reviewer for suggestions that greatly improved the manuscript. This research was supported by NSF Grant OCE-9102151 to R.C.T.
REFERENCES
Allen W. E. (1937) Plankton diatoms of the Gulf of California obtained by the G. Allan Hancock expedition of 1936. Unit.. South. Culif. Pub/. . 5. 4749.
Atlas E., J. Callaway, R. Tomlinson, L. Gordon. L. Burstow and P. Park (1971) A practical manual for use of the Technicon Auto-Analyzer in sea water nutrient analysis. Oregon State University Technical Report 215.
Bakun A. (1975) Daily and weekly upwelling indices, west coast of North America, 3967-1973. Nat. Oceanic Atmos. Adm. (U.S.), Spec. Sci. Rep.-Fish. No. 693,114 pp.
Balch W. M.. P. M. Holligan and K. A. Kilpatrick (1992) Calcification, photosynthesis andgrowth of the bloom- forming coccolithophore, Emiliania huxleyi. Continental Shelf Research. 12, 13551374.
Bergc G. (1962) Discoloration of the sea due to a Coccolithus huxleyi “bloom”. Sarsia, 6, 27-60.
Borsetti A. M. and F. Cati (1972) II nannoplankton calcareo vivcnte ncl Tirreno centro meridionalc. Ginrr~.
Geol., Ser. 2a. 38,395-452.
Bornetti A. M. and F. Cati (1976) II nannoplankton calcareo vivcntc nel Tirrcno ccntro meridionale. Partc 2”. Gionl. Geol. Ser. 2a. 40, 209-240.
Brand L. E. (1994) Physiological ecology of marine coccolithophores. In: Coccolithophores. A. Winter and W. Siesser, editors. Cambridge University Press, pp. 39-49.
Burns D. A. (1975) The abundance and species composition of nannofossil assemblages in sediments from continental shelf to offshore basin. western Tasman Sea. Deep-Sea Research, 22.425-431.
California Cooperative Fisheries Investigations (1991b) Data Report: Physical, Chemical and Biological Data. CALCOFI Cruise 9108-9110, Scripps Inst. of Oceanography Ref.: 92-16.
California Cooperative Fisheries Investigations (1992a) Data Report: Physical. Chemical and Biological Data. CALCOFl Cruise 9202-9204, Scripps Inst. of Oceanography Ref.: 92-20.
California Cooperative Fisheries Investigations (1992b) Data Report: Physical. Chemical and Biological Data. CALCOFI Cruise 9207-9310. Scripps Inst. of Oceanography Ref.: 93-13.
Carpenter E. J. and R. L. Guillard (1971) Intraspecific differences in nitrate half saturation constants for the three species of marine phytoplankton. Ecology. 52, 1X3-185.
Chavez F. P. (19X.5) Ocean variability and phytoplankton community structure: onset of the 19X2-83 El NiAo in the Peruvian upwelling region. In: Preprints of thesympo.rium on the vertical motion in the Equatorial Upper
&earl and its effects upon living resources and the atmosphere. SCOR-UNESCO. Paris. Cullcn J. J., F. M. H. Reid and E. Stewart (19H2a) Phytoplankton in the surface and chlorophyll maximum off
Southern California in August. 197X. Journal of Planktort Research. 4,665-694.
Cullen J. J., S. G. Horrigan. M. E. Huntley and F. M. H. Reid (1982b) Yellow water in La Jolla Bay, California. July 1980. A bloom of the dinofagcllate. Gymnodrnium javum Kofoid and Swezy. J. E.rp. Mar. Biol.
Ecol., 63. 67-X0. Eppley R. W. ( 19%) Plankton dynamics of the Southern California Bight, lecture rlotes qf coastal and estuarine
.srudies. Springer. New York. 373 pp. Eppley R. W., J. N. Rogers and W. G. Harrison (1969) Half-saturation constants for uptake of nitrate and
ammonium by marine phytoplankton. Limnolog_v atzd Oceanographv, 14. 912-920.
Friehcle E. S., D. L. Correl and M. A. Faust (197X) Relationship between cell size and rate of orthophosphate uptake: In situ observations of an estuarine population. Marine Riolog~. 45.39-52.
Gaarder K. R. (1971)) Three new taxa of coccolithineae. Nytt. Mug. Bot., 17. 113-126. Giraudeau J. (1092) Coccolith paleotempcrature and paleosalinity estimates in the Caribbean Sea for the
Middle-Late Pleistocene (DSDP Leg 6X-Hole 502B). Memoir SC. Geol.. Padova, 43.3755387. Giraudeau J., P. M. S. Monteiro and K. Nikodemus (1993) Distribution and malformation of living coccolitho-
phorcs in the northern Benguela upwelling system off Namibia. Marine Micropaleontology. 22, 93-110. Halpert M. S.. G. Bell, V. Kousky and C. Ropelewski (1993) Fifth Annual Climate Assessment. Dept. of
Commerce, NOAA/NMC. Climate Analysis Center. 11 I pp. Hayes S. P. and M. J. McPhaden (1992) Winds, Temperatures. and Currents in the Equatorial Pacific show
ENS0 Patterns. U.S. JGOFS News.. v. 3, 3: 3.
1902 P. Ziveri et al
Hcimedal B. R. and K. R. Gaarder (1981) Coccolithophorids from the northern part of the eastern central Atlantic. lI. Heterococcolithophorids. “Meteor” Forsch-Ergebnisse. Ser. D, 33. 37-69.
Hickey B. M. (1979) The California Current system-Hypotheses and facts. Progress in Oceanography, 8,
193-279.
Holligan P. M.. M. Viollier. P. Harbour. P. Camus and M. Champagne-Philippe (1983) Satellite and ship studies of coccolithophore production along a continental shelf edge. Nature, 304.339-342.
Holm-Hansen 0.. C. Lorenzen, R. Holmes and J. Strickland (1965) Flourometric determination of chlorophyll. J. Corks. Perm. Int. E.wplor. Mer., 30. 3-15.
Honjo S. (1982) Scasonality and interaction of biogenic and lithogcnic particulate flux at the Panama Basin. Science. 218, X83-884.
Honjo S. and H. Okada (1974) Community structure of coccolithophores in the photic layer of the mid-Pacific. Micropaleontology, 29, 209-230.
Jackson G. A. (1986) Physical Oceanography of the Southern California Bight. In: Plankton dynamics of the southern California Bight, lecturetlotes ofcoastal ar~drstrtarinestudies, R. W. Eppley. editor, Springer. New York, pp. 13-52.
Kleijne A.. D. Kroon and W. Zevernoom (1989) Phytoplankton and foraminifcral frequencies in northern Indian Ocean and Red Sea surface waters. In: Proc. Snellius-II Symp., Theme 1, part 2, J. E. van Hintc. Tj. C. E. van Weering and A. R. Fortuin. editors. Netherlands Journal ofSea Research. 24(4), 531-539.
Krupatkina D. K., Z. Z. Fincnko and A. A. Shalapyonok (lY91) Primary production and size-fractionated structure of the Black Sea phytoplankton in the winter-spring period. Marine Ecology Progress Series, 73.
75-3 I. McIntyre A. and A. W. H. Be (1967) Modern coccolithophoridae of the Atlantic Ocean-I Placoliths and
Cyrtoliths. Deep-Sea Research, 14, X1-597.
McIntyre A.. A. W. H. Be and M. B. Roche (1970) Modern Pacific Coccolithophorida: a palcontological thermometer. Trans. N.Y. Acad. SC;. Ser. II, 32.720~731.
McGowan J. A. (1985) El Nitio 1983 in the Southern California Bight. In: El Nirio North. NiAo Ef;tects irl the
Easrern Subarctic Pacific Ocean. W. S. Wooster and D. L. Fluharty. editors. pp. 166-184. Mitchell-Innes B. A. and A. Winter (1987) Coccolithophores: a major phytoplankton component in mature
upwelled waters off the Cape Pcnimula, South Africa in March, 1983. Marine Biology, 95. 25-30. Montciro P. M. S. and R. E. Loewnthal (in press) Carbon dioxide fluxed in the southern Benguela upwclling
system: the biogcochcmistry and stoichiomctry of the mechanisms. Conlinenta[ Shelf Research.
Norris R. E. (19X4) Indian Ocean nanoplankton. 1. Rhabdosphacraccae (Prymncsiophyccae) with a review of extant taxa. .Joumal of Phycology. 20.2731.
Nishida S. ( lY79) Atlas of Pacific nannoplankton. News of Osaka Micropalcont. Special Paper. n. 3, April, LY7Y. I-31.
Okada H. and S. Honjo (19733 The distribution of oceanic coccolithophorids in Pacihc. Deep-Sea Research. 20,
x5-374.
Okada H. and S. Honjo ( 1975) Distribution of coccolithophorcs in marginal seas along the Western Pacihc Ocean and the Red Sea. Marine Biology. 31. 271-785.
Okada H. and A. McIntyre (1977) Modern coccolithophorcs of the Pacific and North Atlantic Oceans. Micropaleorlfology. 23. l-55.
Okada H. and A. Mclntvrc (1979) Seasonal distribution of modern coccolithophorcs in the wcstcrn North Atlantic Ocean. Ma&e Riolog!, 54. 3lY-32X.
Parsons T. R. and M. Takahashi (1973) Environmental control of phytoplankton cell size. l.inrrro/o~~ arld
Ocranography. 18, 51 I-S 1.5. Parsons 7‘. R.. M. Takahashi and B. Hargravc (1984) Riologicrd oceartographic processrs. Pergamon Press.
Oxford, 3rd cd., 330 pp. Pratt I>. M. (lY6S) The winter-spring diatom Rowering in Narragansett Bay. Limnology a& Oceanography. IO,
173-184. Probyn 1. A. (IY93) The inorganic nitrogen nutritions of the phytoplankton in the southern Bcngucla: new
productions. phytoplankton size and implication for pelagic food webs. South African JorrrnaL of Marine
Science. 12. 41 I-430. Reid F. M. H. (19X0) Coccolithophorids in the North Pacific Central Gyrc with noms on their vcrticul and
\casonal distribution. Micropaleontology, 26, 15 l-176. Reid F. M. H.. C. B. Lange and M. M. White (1985) Microplankton Species Assemblages at Scripps Pier from
March to November 1083 during the 1982-1983 El Nido Event. Botarl. Mar., 28.4431352.
Changes in coccolithophore densities 1903
Simpson J. J. (1984) El Nirio-induced onshore transport in the California Current during 1982-83. Geophysical
Research Letters, 11.233-136. Smayda R. R. (1966) A quantitative analysis of the Gulf of Panama, III. General ecological conditions of the
phytopiankton dynamics at 8”45’N, 75”23’W. from November 1954 to May 1957. Ztzler. -Amer. Trop. Tunrr
Comm.. 11,355413. Svcrdrup (1953) On conditions for the vernal blooming of the phytoplankton. J. Cons. CIEM, 18.2X7-295.
Throndscn J. (197X) Preservation and storage. In: Phytoplankron manual. A. Sournia. editor, UNESCO. pp. 69- 74.
Tnnt S. A. (1976) Short-period climatic fluctuations: Effects on diatom biomass. Science, 194. 942-931. Tent S. A. (1981) Temporal variations in diatom abundance off southern California in relation to surface
temperature, air temperature and sea level. Journal o.fMarine Research. 39, 191-101.
Winter A. (1985) Distribution of living coccolithophorcs in the California Current system. Southern California Borderlands. Marine Micropaleonrology. 9,3X5-393.
Winter A. and W. G. Siesscr (in press) Coccolitko~~hores. Cambridge University Press,. Young J. R. and P. Westbroek (1991) Genotypic variation in the coccolithophorid species Emikrnia huxkqi.
Marine Micropaleontology, 18, S-23.
Young J. R.. J. M. Didymus. P. R. Brown, B. Prins and S. Mann (1W) Crystal assembly and phylogenetic evolution in heterococcoliths. Nature. 356, 516-518.
Zi\cri P.. R. C. Thunell and D. Rio (1995) Export production ofcoccolithophores in an upwellingrcgion: results from San Pedro Basin, Southern California Borderlands. kfarine Micropaleontology, 24.335-35X.
Related Documents