New Forests 11: 207-232, 1996. (~) 1996 Kluwer Academic Publishers. Printed in the Netherlands. Seasonal changes in chlorophyll fluorescence of white spruce seedlings from different latitudes in relation to gas exchange and winter storability WOLFGANG D. BINDER and PETER FIELDER British Columbia Ministry of Forests, Research Branch, 1320 Glyn Road, Victoria, B.C., V8W 3E7, Canada Received 5 May 1994; accepted in revised form 25 September 1995 Key words: Variable chlorophyll fluorescence, dormancy, frost hardiness, RGP, field growth performance Application. Variable chlorophyll fluorescence may be used as a tool to reflect the physio- logical status in white spruce during the growing season, frost hardening or prior to (cold) storage. Specific Fvar curve attributes can provide information to determine whether white spruce nursery seedlings are actively growing, or can be lifted safely for cold storage. The Fvar curve attribute at 5 seconds (Fss) may be used to estimate seedling net photosynthesis over the growing season. The Fvar measurements discussed can be carried out on whole seedlings, are non-destructive, nonqnvasive and take only seconds to complete. Abstract. Variable chlorophyll fluorescence (Fvar) was investigated as a tool in the detection of distinct seasonal physiological changes in 1+0 intact white spruce seedlings. The loss of the characteristic Fvar peak (Fp) between 0.8 and 1.0 s after illumination of dark adapted seedlings is an indicationof regulation of photosynthetic activity in August. The peak represents excess photochemical water-splitting of photosystem II. We interpret its loss as a physiological indicator of the process of dormancy induction. Three dimensional (i.e. X[0-300 s], Y[rfu], Z[time of year] axis) Fvar curves of non-stressed seedlings measured over 300 s followed a three phase change over the growing season. In actively growing seedlings, the portion of the Kautsky induction curve between 60 and 300 s was 0.4 relative fluorescence units (flu) in northem (i.e. >560 latitude) seedlots and 0.6 in the southem (i.e. <56 ° latitude) range seedlot from August until early September. About mid-Septembercurve features between 60 and 300 s decreased sharply to approximately zero (flu) by October. Freeze test data indicated seedlings became frost hardy during this time. The third, or inactive phase was seen as flat line from 40 to 100 s. The portion of the curve after 100 s was responsive to short term temperature changes. White spruce seedlots of northern and southern B.C. latitudes having curve fluorescence peak (Fp) values at about 1 s of 0.6, and 0.8 (flu) respectively, plus curve minimum (Fmin) values at about 60 s which do not decrease further over a 2-3 week period represent stock which can safely be lifted for cold storage. The Fvar. attribute at 5 s after the actinic light is turned on (Fss) correlates well with net photosynthesis (r2 = 0.61) during the growing season. Introduction Costs of seedling production, silvicultural site preparation, and planting require forestry planting stock to be of the highest possible quality. The

Welcome message from author
This document is posted to help you gain knowledge. Please leave a comment to let me know what you think about it! Share it to your friends and learn new things together.
Transcript

New Forests 11: 207-232, 1996. (~) 1996 Kluwer Academic Publishers. Printed in the Netherlands.
Seasonal changes in chlorophyll fluorescence of white spruce seedlings from different latitudes in relation to gas exchange and winter storability
W O L F G A N G D. BINDER and PETER FIELDER British Columbia Ministry of Forests, Research Branch, 1320 Glyn Road, Victoria, B.C., V8W 3E7, Canada
Received 5 May 1994; accepted in revised form 25 September 1995
Key words: Variable chlorophyll fluorescence, dormancy, frost hardiness, RGP, field growth performance
Application. Variable chlorophyll fluorescence may be used as a tool to reflect the physio- logical status in white spruce during the growing season, frost hardening or prior to (cold) storage. Specific Fvar curve attributes can provide information to determine whether white spruce nursery seedlings are actively growing, or can be lifted safely for cold storage. The Fvar curve attribute at 5 seconds (Fss) may be used to estimate seedling net photosynthesis over the growing season. The Fvar measurements discussed can be carried out on whole seedlings, are non-destructive, nonqnvasive and take only seconds to complete.
Abstract. Variable chlorophyll fluorescence (Fvar) was investigated as a tool in the detection of distinct seasonal physiological changes in 1+0 intact white spruce seedlings. The loss of the characteristic Fvar peak (Fp) between 0.8 and 1.0 s after illumination of dark adapted seedlings is an indication of regulation of photosynthetic activity in August. The peak represents excess photochemical water-splitting of photosystem II. We interpret its loss as a physiological indicator of the process of dormancy induction. Three dimensional (i.e. X[0-300 s], Y[rfu], Z[time of year] axis) Fvar curves of non-stressed seedlings measured over 300 s followed a three phase change over the growing season. In actively growing seedlings, the portion of the Kautsky induction curve between 60 and 300 s was 0.4 relative fluorescence units (flu) in northem (i.e. >560 latitude) seedlots and 0.6 in the southem (i.e. <56 ° latitude) range seedlot from August until early September. About mid-September curve features between 60 and 300 s decreased sharply to approximately zero (flu) by October. Freeze test data indicated seedlings became frost hardy during this time. The third, or inactive phase was seen as flat line from 40 to 100 s. The portion of the curve after 100 s was responsive to short term temperature changes. White spruce seedlots of northern and southern B.C. latitudes having curve fluorescence peak (Fp) values at about 1 s of 0.6, and 0.8 (flu) respectively, plus curve minimum (Fmin) values at about 60 s which do not decrease further over a 2-3 week period represent stock which can safely be lifted for cold storage. The Fvar. attribute at 5 s after the actinic light is turned on (Fss) correlates well with net photosynthesis (r 2 = 0.61) during the growing season.
Introduction
Costs of seedl ing p roduc t ion , s i lv icu l tu ra l site preparat ion, and p lan t ing
require forestry p l an t ing stock to be of the h ighes t poss ib le quality. The

208
majority of commonly used indicators of stock quality are morphologi- cally based, mainly because they are relatively simple and inexpensive to measure. Although some correlations between morphological characteristics and seedling stress resistance have been reported, the relationships are weak and have not proven to be of much value for improving reforestation success (Sutton 1979; Hobbs 1984; Navratil et al. 1986). Consequently, physiolog- ical characterization of seedlings is an important factor for complete stock quality assessment (Zaerr and Lavender 1980; Zaerr 1985; Puttonen 1989; Hawkins and Binder 1990; Grossnickle et al. 1991). For example, lifting seedlings for cold storage in a sufficiently resistant state is known to be a requirement for acceptable survival and growth after planting (Holbo et al. 1981; Puttonen 1989; Rose et al. 1990). However, determination of seedling physiological status only by morphological condition, or by calendar date, is imprecise because ontonogenetic stages of development (Fuchigami et al. 1982) shift from year to year, depending on environmental, and nursery cultural conditions (Holbo et al. 1981; Oquist 1983; Rose et al. 1990). The ability to assess major physiological systems directly, quickly, quantitatively, non-destructively and, most importantly, diagnostically (i.e. indicate seedling physiological state, and/or detect damage) is highly relevant to forest nursery operations, as well as basic forest research.
In recent years, chlorophyll fluorescence has become well-known as "an intrinsic probe of the photosynthetic system" (Kranse and Weis 1984) and has been used increasingly in plant physiology as a diagnostic tool (Lichtenthaler 1988; Lichtenthaler and Rinderle 1988). Detailed discussions of variable chlorophyll fluorescence (Fvar) theory and kinetics are well documented else- where (e.g. Lichtenthaler 1988; Lichtenthaler and Rindefle 1988; Vidaver et al. 1991). Chlorophyll fluorescence in general may be defined as the red light (685-740 nm) produced by photosystem II (PSII) of the chloroplast thylakoid membrane when a plant is exposed to light. The red light is generated as a result of energized (excited) electrons, produced via PSII water-splitting reactions returning to their ground state (see Vidaver et al. 1991 p. 43). In general any internal or external factor that can potentially affect the photosynthetic rate will produce corresponding changes in fluorescence emission (Lichtenthaler 1988; Vidaver et al. 1991). In conifers, chlorophyll fluorescence has been used to study seasonal variations in photosynthetic activity and in ecophysiological studies (Lichtenthaler and Rinderle 1988; Vidaver et al. 1989a, b; Vidaver et al. 1991; Gillies 1993), frost damage (Strand and Oquist 1988; Sundblad et al. 1990; see also Binder and Fielder 1996), water stress (Toivonen and Vidaver 1988; Vidaver et al. 1991; Epron and Dreyer 1992), and dormancy induction (Hawkins and Lister 1985; Vidaver et al. 1989a, b, 1991; Oquist et al. 1992), as well as nutrient deft-

209
ciency (Baillon et al. 1988) and wood formation rates (Falls et al. t991). Based on a number of weighted criteria of the most promising seedling tests based on physiology now available Fvar ranked first (Hawkins and Binder 1990; Mohammed et al. 1995). It also appears to have the widest diagnostic applications.
Our study examined the potential utility of Fvar as a tool to detect definitive seasonal physiological changes and, whether such Fvar curve alterations may be useful as a relatively quick assessment of when to lift white spruce seedlings for winter storage.
Materials and methods
Seedling material
During the first week of March 1991 fifteen hundred white spruce seed of each of four seedlots (Table 1) were sown, in PSB313a Styroblocks contain- ing a 3:1 (v/v) peat:vermiculite mix with a supplement of 30.5 g/1 of dolomite lime, and were grown in a heated glasshouse at the Glyn Road Research Station, Victoria, British Columbia (48°39 ~ N 123°26 t W, 100 m elevation). Glasshouse conditions were maintained at 24 °C for a 24 h day/night cycle with an 18 h light period of ambient light supplemented with fluorescent light (approximately 75 #mol m -2 s- l ) . On June 4 seedlings were moved to an open-ended polyhouse, and an 18 h light period was maintained by extending natural day length with incandescent light (approximately 10 #mol m -2 s -1) until July 22 when the natural day length was about 15 h and 30 min. Fertilizer (20-20-20 PlantProd) applications were made during irrigation at a rate of 150 #1 1-1 beginning on April 8 and continued until November. Maximum and minimum hourly seasonal air temperatures in the polyhouse, at seedling height, were monitored by thermocouples connected to a data logger (Figure 1). Container crop height and diameter measurements were made on July 28, August 8, September 9 and October 12. Height was measured from the soil level to the top-most needle-tip and stem diameter was measured at the root collar. Maximum crop height of about 18 cm was reached on Septem- ber 9 for all four seedlots. Maximum stem diameter of about 2.4 mm was reached by seedlots 1, 2 and 3 on August 8 but seedlot 4 did not achieve this until September 9. Terminal bud initiation was not accurately determined. A detailed study of apical development with respect to fluorescence measures was outside the scope of this study especially as we were chiefly interested in the period of cold hardiness development which overlaps with embryonic shoot development. However, buds were excised on dates when cold hardi- ness tests were made, the first being on September 16. On this date simple
210
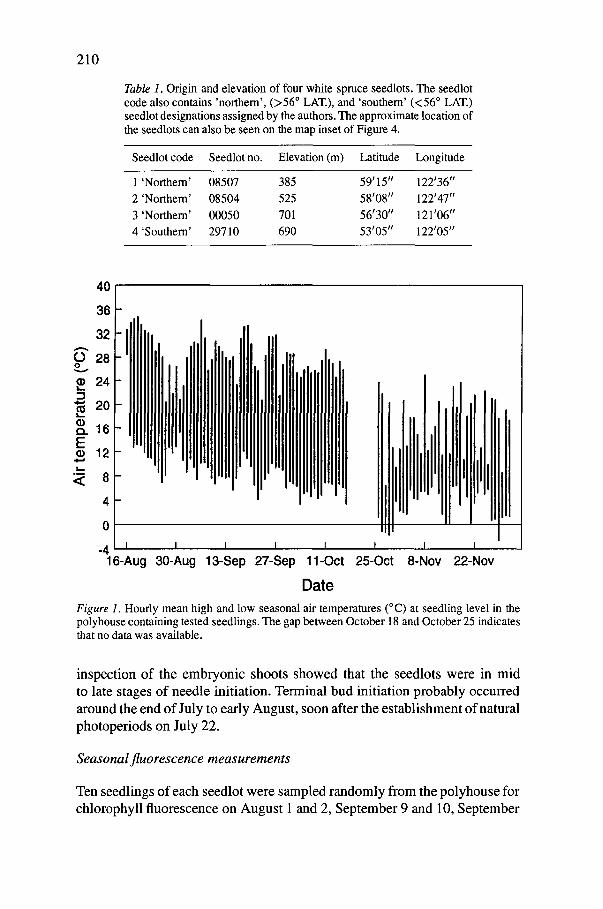
Table 1. Origin and elevation of four white spruce seedlots. The seedlot code also contains 'northern', (>56 ° LAT.), and 'southern' (<56 o LAT.) seedlot designations assigned by the authors. The approximate location of the seedlots can also be seen on the map inset of Figure 4.
Seedlot code Seedlot no. Elevation (m) Latitude Longitude
1 'Northem' 08507 385 59115" 122'36" 2 'Northern' 08504 525 58'08" 122'47" 3 'Northern' 00050 701 56'30 ff 121106" 4 'Southern' 29710 690 53'05 II 122'05"
40
3 6
32
2 8 o 2 4
~ 2o ~ 1 6 E • 1 2 .i-. < 8
,11 4~-
0
-4 I 16-Aug
,ill Ill I I I I
30-Aug 13-Sep 27-Sep 11-Oct
Date
I,tllllt ttl t
t 25-0ct
IIIIIIF] I I I
8-Nov 2 2 - N o v
Figure 1. Hourly mean high and low seasonal air temperatures (°C) at seedling level in the polyhouse containing tested seedlings. The gap between October 18 and October 25 indicates that no data was available.
inspection of the embryonic shoots showed that the seedlots were in mid to late stages of needle initiation. Terminal bud initiation probably occurred
around the end of July to early August, soon after the establ ishment of natural
photoperiods on July 22.
Seasonal fluorescence measurements
Ten seedlings of each seedlot were sampled randomly f rom the polyhouse for chlorophyll fluorescence on August 1 and 2, September 9 and 10, September

211
16, October 7, October 17, November 4, and December 5 and 6. Measurements on consecutive days were combined to give a sample size of twenty. Prior to fluorescence measurements, watered seedlings were preconditioned ovemight in a growth chamber as described previously (Binder and Fielder 1991) Seedlings were conditioned in the dark from 1800 h to 0600 h at 22 -t- 2 °C and 44 ~ 6% RH. At 0600 h lights were switched on at an intensity of 270 to 300 #mol m -2 s -1 . Temperature and relative humidity were 25 + 2 °C and 34 ± 8%.
Fluorescence measurements were made using an integrating fluorometer of the type described by Toivonen and Vidaver (1984). A measurement was made by enclosing the seedling inside the sphere and initiating automatic data acquisition through the software according to protocols described in Vidaver et al. (1991). Data acquisition and storage was controlled by software devel- oped by the Pacific Fluorotec Corporation, Simon Fraser University, Burnaby, B.C. All seedlings were dark-adapted for 20 min before measurement by covering the seedling entirely with a close-fitting black plastic sleeve. The sleeve was kept in place until the seedling was positioned inside the inte- grating sphere. The work area was darkened to less than 1 #mol m -2 s -1. Fluorescence measurements began at about 0900 h and continued for about six hours.
Scan attributes and machine settings
Fluorescence data were stored as an ASCII text file containing fluorescence values normalized with respect to initial fluorescence (Fo) (Dub6 and Vidaver 1990). Selected fluorescence scan curve attributes are described in Table 2. The ratio Fo/IABS offset the effect of seedling size on Fo (Toivonen and Vidaver 1984) and is useful for gaining insight into the early events of photosynthesis (Dub6 and Vidaver 1990). Fp (Toivonen and Vidaver 1984, 1988), Fss, Fmin and Ft were determined by curve attribute selection and averaging of the normalized scans. The excitation light intensity in the empty sphere was set to 100 #mol m -2 s -~.
Seasonal gas exchange measurements
Apparent (net) photosynthesis (A), stomatal conductance (gs) and transpira- tion (E) were determined, after fluorescence, on the same seedlings. Seedlings were moved to a growth chamber (Conviron E-15) and allowed to equilibrate for at least 30 min at 400 #mol m -2 s -1, 25 °C and 75% RH before gas exchange was measured using a LI-COR 6200 photosynthesis system. The system was calibrated before each series of measurements with 333 #1 1- CO2. Measurements were made in a 0.25 1 chamber with the seedling at 90 °

212
Table 2. Fluorescence scan feature attribute type, units of measurement, and definition obtained from the Fluoroview data acquisition program and from analysis of the normalized curves.
Attribute Units Description
Fo mV
IABS /~mol m -2 s -1
Fo/IABs mV/#mol m-2 s- l
Fp flu
Fss rfu
Fmin rfu
Ft rfu
The estimated initial fluorescence emitted by the sample total chlorophyll before the onset of measurable photo- chemistry. Proportional to the total number of excited chlorophyll molecules (Dub6 and Vidaver 1990).
Excitation light absorbed by the seedling.
Adjusts Fo for the light quanta absorbed (i.e. seedling size).
Maximum normalized variable fluorescence within the first second of the 300 s scan.
Normalized variable fluorescence at 5 s of the 300 s scan.
Minimum normalized variable fluorescence over the whole scan after 1 s.
Normalized variable fluorescence at 300 s
to the light source (an equal combination of sodium and metal halide high intensity discharge lamps). Average A, gs and E rates were obtained for each seedling from ten readings over a 45 s period. The photosynthetic chamber was kept shaded when not in use to prevent excessive heat build-up through absorbed radiant energy. Projected needle areas were estimated from needle dry weight using a linear equation [Needle area (cm 2) -- 0.356+59.22*dry weight(g)] (according to Binder, W.D. unpublished data).
Seedling hardiness testing
Fifty seedlings of each seedlot were randomly selected for testing on Septem- ber 16, October 7, November 4, and December 5. On each test date 25 seedlings were subjected to control (+2 °C) or - 1 8 °C freeze treatments. Testing was carried out in a 1-m 3 low-temperature chest freezer ( - 6 0 °C) with a 0.8-m 3 test box containing a fan and heating coil. Temperature control was achieved with an Enercorp Optomat Programme Controller connected to a glass wire RTD temperature sensor. Freeze-box temperature was monitored using thermocouples and input to a CR21X Campbell Scientific datalogger. Whole seedlings were placed in the test box in the dark. Seedlings were kept upright, with root plugs inside plastic tubes, held in styrofoam for insulation. The temperature was lowered to - 1 8 °C at 6 °C/h, held constant for one hour, after which the seedlings were transferred to a +2 °C cool room using a covered, insulated box at +2 °C. Seedlings were allowed to thaw overnight
213
after which they were moved to a glasshouse at 22 °C day/night temperature and ambient light and day length. Visible needle damage was estimated for each seedling after 10 days at 22 °C on a scale of 0 to 100% split into 11 cate- gories (0, 1-10%, 10--20%, etc). Needle damage was identified as a change in colour from green to yellow, brown or red or loss of needles.
Seedling fall lifting and cold storage, RGP testing, outplanting and growth analysis
On each of the four dates of seedling hardiness testing 116 seedlings per seedlot were sampled randomly from the polyhouse, put into waxed boxes lined with plastic-lined paper bags, and stored at - 2 °C. Seedlings destined for RGP testing were stored in separate boxes from those for outplanting, but packing and storage conditions were similar. Starting on April 27 sixteen seedlings per lift x seedlot combination were sampled, thawed in boxes at 5 °C over four days (Binder and Fielder 1995), and tested for Root Growth Potential (RGP). The test procedure consisted of potting seedlings into one gallon pots in a 3:1 (v/v) peat-vermiculite mix (pH adjusted with dolomite lime) and holding them in a growth chamber (400 #mol m -2 s- l, 16 h light @ 22 °C, and 8 h dark @ 18 °C, and 704-10% RH) for seven days. After seven days all the roots growing out of the plug > 1 cm in length were counted and converted to a root growth index (Burdett 1979). All treatment combinations tested were completed within a 12 day period. During the first week in May, 100 seedlings per lift x seedlot combination were thawed in boxes at 5 °C over four days (Binder and Fielder 1995) and planted on a farm field in a completely randomized design. The farm field is situated at the Research Station at an elevation of 100 m with a mean annual precipitation of 857.9 mm and a mean annual temperature of 9.5 °C. Each lift x seedlot combination of 100 seedlings was divided into four replicates of 25 seedlings. The resultant 64 replicates (4 lifts and 4 seedlots each with 4 replicates) were randomized over a planting area of 32 rows of 50 seedlings spaced at 20 cm intervals with 50 cm between rows. Six days after planting, shoot height (root collar to top most needle on shoot), stem diameter (at the root collar), and the percentage of needles damaged of each planted seedling were measured. Shoot extension and stem diameter increment were derived from final measurements of height and stem diameter made in October. After final measurement seedlings were excised at soil level, placed in paper bags, and dried at 90 °C for 24 h to assess shoot dry weight.
214
Statist ical analysis
The experiment was unreplicated with respect to year and (polyhouse) envi- ronment. All sampling was completely random. Averaged fluorescence scans were graphed as a three-dimensional response surface of date (z) by scan duration (x) by relative variable fluorescence (y). Averaged scan attributes and photosynthetic data were displayed graphically with standard error bars (-4- 1 SE). Means, standard errors, analysis of variance (ANOVA) and linear regressions were analyzed using the general linear models procedure (Proc GLM) in SAS (SAS Institute Inc. 1988).
Two way ANOVAs for the main effects of seedlot and date were performed for the fluorescence attributes (Fo/IABs, Fp, Fss, Frnin and Ft (Table 2)), gas exchange measurements (A, gs, and E) and the growth performance indicators (RGP, visible needle damage, shoot elongation, stem diameter increment, and shoot dry weight). Where justified, one way ANOVAs were performed as well as Duncan's multiple range tests.
A mixed linear model was used with seedlot and date as random and fixed effects, respectively. The linear model can be expressed algebraically as follows:
Yijk -~ m + ai + bj + abi j + eijk
Each reading of Y is composed of the grand mean of the population m, a random deviation from the mean due to seedlot (ai), a fixed deviation from the mean due to date (bj), an interaction effect between the two main effects (abij), and a random deviation e~jk of the k th group. The distribution of eijk is assumed to be normal with a mean of zero. The 'Random' statement, with the appropriate model statement, was used in the Proc GLM procedure to account for random effects. Analysis of fluorescence and gas exchange measurements was performed according to an unreplicated (i.e. one growth chamber used) factorial design where, for variate Y, i -- 1 to 4, j = 1 to 7 and k -- 10 or 20 individual seedlings. Growth performance indicators were analyzed accord- ing to a replicated factorial design. For RGP (Y), i -- 1 to 4, j = 1 to 4, and k = 16, k was divided among two plots (growth chambers) of eight seedlings. For the field measures (Y), i -- 1 to 4, j -- 1 to 4, k -- 100 and k was divided into four plots (rows) of 25 seedlings.
A linear regression was tested on an individual-seedling basis between fluorescence curve attribute Fss and apparent photosynthesis. Attributes Fp, Fv/Fm and Ft were also tested but all had weaker correlations with A than Fss.

215
Results and discussion
Seasonal fluorescence (FvaT ) changes
Variable fluorescence (Fvar) curves, seen as individual continuous lines between 0 and 300 seconds changed seasonally in shape and amplitude (Figure 2), and, in general, conformed to typical Fvar curve structure for white spruce described by others (Toivonen and Vidaver 1984; Vidaver et al. 1989a; and Vidaver et al. 1991). However we could not duplicate the elevated, slow (40-50 s) kinetic curve feature reported by Vidaver et al. (1989a) for this species in late summer. Vidaver et al. (1989a) referred to this feature as M but do not state whether this may be M~ or M2. However, data of Hawkins and Lister (1985) (Douglas-ri0 and Toivonen and Vidaver (1988) (white spruce) suggest this cannot be M1 because that feature actually occurs in under 5 seconds after light exposure. This raised feature routinely observed in the summer-early fall by Vidaver and co-workers may be M2, and may reflect summer drought stress characteristic of seedlings grown in small containers (pers. comm. W. Vidaver, 1994; see also Sundblad et al. 1990). The relative humidity at which we maintained the seedlings in our test chamber could account for some of the difference but in our study seedlings were well-watered 12 h prior to measurement. Furthermore, stomatal closure was not evident in our test seedlings, according to photosynthetic measure- ments. Some of the difference may also be due to seedling mineral content since nutrient alterations are known to cause significant changes in both pho- tochemical and non-photochemical fluorescence quenching in white spruce (Baillon et al. 1988) and other species (Dannehl et al. 1995). We could not measure these quenching events because the integrating sphere fluorometer we used in this study does not have that capability. An instrument capable of producing a second pulse of saturating actinic light or a pulse modulated, low intensity, beam is required to estimate the separate components of quenching, both photochemical and non-photochemical. Figure 2 shows response sur- faces for only the most northern (A), and most southern (B) seedlots of the four tested from August 1 to December 5. With test date on the Z axis, the seasonal change in full Kautsky induction curve features was clearly demon- strated. Selected individual fluorescence attributes (Fo/IABs, Fp and Ft) for all four tested seedlots are shown in Figure 2A, 2B and 2C respectively.
In all four seedlots, the first fluorescence curve change in late summer was the loss of the Fp peak feature (Figure 3). The Fp peak represents energy derived from the Oxygen Evolving Complex (OEC) (see Vidaver et al. 1991), which is in excess of that which can be utilized for ATP and NADPH + produc- tion (Vidaver et al. 1991). A decrease in Fp due to increased photochemical quenching during periods of environmental stress is known to occur (Conroy

216
Figure 2. Three dimensional relative fluorescence curves of two 1+0 white spruce seedlots (1 and 4) over seven test dates (August 1 to December 5). Fluorescence curve time is given from zero (actinic light on) through 300 seconds. Darkest shade -- non-hardy, growing stock; lightest shade = 'cascade effect', stock becoming frost hardy; medium shade = stock becoming physiologically inactive and frost hardy. Shading corresponds to shade pattern showing needle damage (%) after freezing to -18 °C (Figure 5). A = seedlot 1 (the northem-most seedlot tested), and B = seedlot 4 (the southern-most seedlot tested).
et al. 1986; Dub6 et al. 1986; Toivonen and Vidaver 1988), and is interpreted as the reversible inactivation of the OEC in evergreens and other stress- resistant plants (Toivonen and Vidaver 1988; Gillies and Vidaver 1990). It
is known that stress resistance involves mechanisms that protect chloroplasts f rom the effects o f drought and low temperature when light levels are high
(photodamage) (Gillies and Vidaver 1990). However , we suggest that in white

217
spruce this sudden seasonal loss of the Fp peak observed in the summer is not the result of any specific environmental stress, but rather was a controlled physiological event that was day length-dependent. If the PSII photochemical process is daylength-dependent, the reduction in Fp peak may be the result of a controlled process resembling a kind of 'seasonal photoregulation', which has a photochemical or biochemical basis. The concept of regulated photo- synthetic inactivation in white spruce was first proposed by Vidaver et al. (1991) and the idea is supported by electron microscopy observations of chloroplast structural changes (Senser et al. 1975) and photosynthetic data showing seasonal decline in CO2 uptake obtained here (Figure 4A), as well as by others (Toivonen and Vidaver 1988; Vidaver et al. 1989a). The ability to regulate photochemistry is believed to protect needle chloroplasts from stress- induced photodamage (Bolhar-Nordenkamph and Lechner 1988; Vidaver et al. 1989b).
If correct, for white spruce, this phenomenon may indicate a change in needle physiology which may signal, or accompany processes initiating dormancy of the apical meristem and cold hardiness of the whole seedling. In seedlings, the environmental cue (i.e. short days) that induces the morpho- genetic switch to bud development is perceived up to several weeks before the development of a visible bud and cessation of height growth. Fluores- cence may be useful to detect that change without waiting for visible bud scales or cessation of height growth. The idea of applying Eva r technology for dormancy induction assessment in conifers was perhaps first suggested by Hawkins and Lister (1985), who, using five populations of Douglas-fir, showed parallel reductions in fluorescence with declining fall temperatures. If 'photoregulation' is a natural part, either leading or accompanying dormancy induction, in white spruce then one might speculate that, once induction is complete, a dormancy releasing treatment such as a certain number of chilling hours might be required to overcome the effect on PSII. Interestingly, a similar reduction in the amplitude of the Fp peak has been reported in coastal Douglas- fir, but in response to reduced temperature rather than day length (Vidaver et al. 1989b, 1991). However, unlike spruce this reduction in Douglas-fir was not seasonally irreversible the peak amplitude was restored when the temperature was again raised. The ecological conditions under which these two species grow may be a major driving force for the difference in their responses to environmental cues. However, as with Douglas-fir, in our study the Fp attribute for spruce continued to represent the curve peak fluorescence even after its 'spike-like' feature was lost for all four seedlots measured.
The 3D surface of Fvar response showed a general trend consisting of three distinct seasonal phases in the 40 through 300 s region of the scan. Phase one went from August 1 until September 16 (Figure 1A and B, darkest

218
A) 18"
15 ka
4 E
o
S. ~2 g
J 2
9
_J ®
Seedlot= 1
. . . . 2
. . . . . . . 3
. . . . . . . . . 4
Bar = 1S.E. ...[. ...........
"....
"'"I
Aug,01 Aug.22 Sep.12 Oct.03 Oct.24 Nov.14 Dec.05
Da te (wk)
Seedlot: - - 1 . . . . 2 . . . . . . . 3 . . . . . . . . . 4
B a r . 1 S.E.
A~4~1,01
Cl 1.1
1.o
0.9
o . 8
~ o.7
~ 0.6
~ 0.5
~ o.4
Lu" o.3
0.2
o.1
o,o
-o.1
&1~.22 ,~p.12 O(~t.03 Oct.24 Nov.14 Dec.05
D a t e (wk)
Seedlot: 1
. . . . 2
. . . . . . 3 . . . . . . . . . 4
Bar= 1 S.E.
-O.2 Aug.01 Aug.22 ~ D . 1 2 Oct.03 OCL24 NOV.14 DOC.05
Da te (wk)
Figure 3. Mean -t-1 SE of Fo/IABs(A), Fp (peak relative fluorescence) (B), and Ft (relative fluorescence at 300 seconds) (C), of four white spruce 1 + 0 seedlots over seven test dates (August 1 to December 5). n = 10-20 seedlings. The two way ANOVA p values for the three fluorescence attributes are shown in Table 2.

219
shade), and was characterized by a flat plane that, for seedlots 1, 2, and 3, ended with Ft (300 s) at about 0.2 flu. Seedlot 4 (Figure 2B) ended at about 0.5 flu. The second phase, (lightest shade level in Figure 2A and B) which we have termed the 'cascade effect' was characterized by a sharp drop in relative fluorescence between September 16 and October 7. For each seedlot the cascade effect ended with the beginning of the third level. This last phase (medium shade in Figure 2A and B) again was essentially a flat plane after 40 to 100 s between October 17 and December 5. For all of the seedlots, the Fvar value at 40 s was 0±0.2 flu.
Changes in the overall shape of the Fvar c u r v e s in Figure 2A and B agree with other information on the seasonal growth cycle of spruce. In response to declining day length, white spruce stops shoot elongation, sets terminal buds, and its chloroplasts undergo structural changes (Senser et al. 1975). Apparently, the first alteration of mature chloroplasts occurs in early autumn, when the synthesis of assimilation starch ceases in favour of the formation of the oligosaccharrides, raffinose, and stachyose (Senser et al. 1971). During late fall and early winter the chloroplasts group closely together (Senser et al. 1975), a phenomenon also observed by Parker and Philpott (1961, 1963) in mesophyll cells of white pine.
Notable differences among curve features existed among seedlots at any given time. For example, there was a curve depression in seedlot 1 (Figure 2A) in early September, between 50 and 150 seconds (darkest shaded area in Figure 2A). This dip in the curve tended to be less in the other seedlots (e.g. see same area in Figure 2B). At 100 seconds seedlot 1 had a mean value of 0.147(+ 0.039) rfu and seedlot 4 was 0.377(~ 0.055) rfu (means + 1 SE, n = 20). This would suggest that under the same environmental conditions the northern- latitude seedlot began to enter the fvar inactivation process at an earlier date than did the southern-latitude seedlot. Other seedlot curve changes included the Fvar curve tails from 100 to 300 seconds. Mean fluorescence values at 250 seconds for seedlots 1 and 4 were 0.092 (+ 0.034) and 0.314 (+ 0.04) rfu respectively (means ± 1 SE, n = 18 or 19). These curve changes likely reflected environmental cues presented to the seedlings just prior (i.e. 24--48 h) to measurement. For example, before the November 4 test date an increasing cold period was suddenly followed by a warming period in the greenhouse (Figure 1). The wanning had much more of an effect on the curve (after 100 seconds) in the more southern seedlot (Figure 2B) than the more northern one (Figure 2A). This suggests that the southern-latitude seedlot was more reactive to short-term environmental changes even late in the year. However, since only one southern seedlot is represented there is no sure way of knowing whether the differences are related to latitiude. Others have shown that for Douglas-fir seedlings the entire Eva r c u r v e increases during short wanning

220
trends (Vidaver et al. 1991; Gillies 1993). Gillies (1993) reported significant seedling mortality if seedlings lifted and stored under such conditions are planted in the spring. That white spruce did not show this rise in the entire Fvar curve during late fall or early winter during such wanning periods supports the known physiological differences between coastal and interior conifer species. Douglas-fir photosynthetic rates can be quite nominal during warm winter periods (Vidaver et al. 1991; Gillies 1993) while spruce shows a progressively decreasing photosynthetic rate into the fall and winter (Figure 4A, Vidaver et al.. 1991). These apparently different adaptive strategies to environmental changes may reflect these two species natural geographic locations. Viewed in this way the difference in Fvar tail-response to the warming trends between the northern and southern origin seedlots of spruce may then represent an intra-specific variation in response due to provenance geographic differences.
The three phases indicated in the 3D surface can also be analyzed for single Fvar curve attributes. Three of the most important of these attributes (Fo/IABs, Fp and Ft) for all four tested seedlots are shown in Figures 3A, 3B and 3C respectively. Test date and seedlot significantly affected five curve attributes as main effects (p < 0.05), interaction effect (p < 0.10), or both (Table 3). Fast phase fluorescence kinetics of the antenna chlorophyll pigment bed, represented by Fo/IABS (Dub6 and Vidaver 1990), stays relatively constant over the dates tested, but seedlots changed their relative ranking late in the fall (Figure 3A). In the southern most seedlot tested, all curve parameters examined increased significantly when greenhouse temperature increased before the November 4 test date. Photosynthetic rate stopped decreasing in all seedlots on this date (Figure 4A), but frost hardiness did not decline above -18 °C (Figure 5). We conclude that individual fluorescence features respond to seasonal environmental trends and may be used to identify, and reflect seedling physiological alterations that accompanied such trends.
Seasonal photosynthetic, stomatal and transpiration changes
Analysis of variance results indicated that date and seedlot significantly (p < 0.05) affected apparent photosynthesis (A), stomatal conductance (gs) and transpiration (E), and there that was no interaction between these main effects (Table 4). Apparent photosynthesis remained steady until early September, declined gradually until early November when the rate either remained con- stant, or showed a non-significant downward trend into winter (Figure 4A). The southern seedlot tested (4) maintained a significantly higher (a = 0.05) photosynthetic rate through the fall and into the winter compared to the more northern latitude seedlots. These results agree with earlier studies with white spruce using an open system to assess CO2 uptake (Vidaver et al. 1989). The major effect on seedling gs and E occurred between August and Septem-

221
A) 14,
13 .
12 ,
11 .
lO .
E
6 ,
4 ,
3 .
2 .
1 ,
B) 1.o
0,9
0.8
c)
4 E
W
Seedlot: 1
. . . . 2
. . . . . . . 3
. . . . . . . . . 4
Bar. 1 S.E.
...... ~ , ~ . _ . - ~ , .
• -,ii , , , .~ . . . .
z - - - ~
0 Aug.01 Aug .22 Sep.12 Oct .03 Oct .24 NOV.14 Dec,05
Date (~)
Seedlot: - - 1 . . . . 2 . . . . . . . 3 . . . . . . . . . 4
Bar = 1 S.E.
0 . 6
0 . 5
0 . 4
0 . 3
0 ,2
0.1
O.G Aug.01 ALIg.22 Oct .24 NOV.14 DEC.05 Sep.12 Oct .o3
Date (wk)
19 ] Seedlot: 18 ] 1 17 . . . . 2
16 . . . . . . . 3
15 . . . . . . . . . 4
14 Bar = 1 S.E. 1,3
12
11 1o .... ~ 'X \~ . .
Aug,01 Aug .22 Sep.12 Oct.O3 Oc t .,?.4 Nov.14 Dec.05
Date (wk)
Figure 4. Mean -4-1 SE of Apparent photosynthesis (A), stomatal conductance (B), and seedling transpiration (C), of four white spruce seedlots over seven test dates (August 1 to December 5). n = 10--20 seedlings. The two way ANOVA p values for the three attributes are shown in Table 4.
222
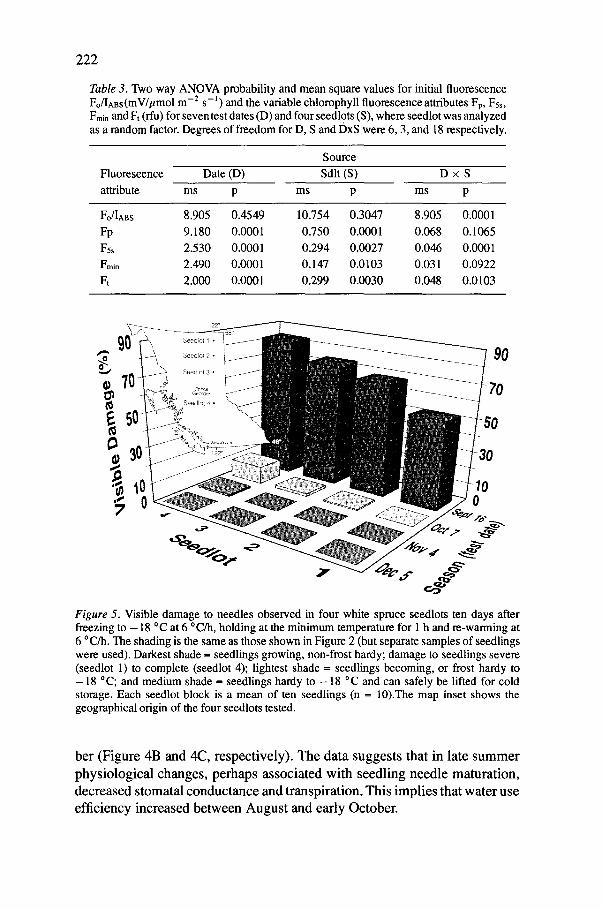
Table 3. Two way ANOVA probability and mean square values for initial fluorescence Fo/IABs(mV/tLmo1 m -2 s - l ) and the variable chlorophyll fluorescence attributes Fp, Fss, Fmin and Ft (flu) for seven test dates (D) and four seedlots (S), where seedlot was analyzed as a random factor. Degrees of freedom for D, S and DxS were 6, 3, and 18 respectively.
Source
Fluorescence Date (D) Sdlt (S) D x S
attribute ms p ms p ms p
Fo/IABs 8.905 0.4549 10.754 0.3047 8.905 Fp 9.180 0.0001 0.750 0.0001 0.068 Fss 2.530 0.0001 0.294 0.0027 0.046 Fmin 2.490 0.0001 0.147 0.0103 0.031 Ft 2.000 0.0001 0.299 0.0030 0.048
0.0001 0.1065 0.0001 0.0922
0.0103
G) O~ t~
90
'0
Figure 5. Visible damage to needles observed in four white spruce seedlots ten days after freezing to - 18 °C at 6 °C/h, holding at the minimum temperature for 1 h and re-warming at 6 °C/h. The shading is the same as those shown in Figure 2 (but separate samples of seedlings were used). Darkest shade = seedlings growing, non-frost hardy; damage to seedlings severe (seedlot 1) to complete (seedlot 4); lightest shade = seedlings becoming, or frost hardy to - 1 8 °C; and medium shade = seedlings hardy to - 1 8 °C and can safely be lifted for cold storage. Each seedlot block is a mean of ten seedlings (n = 10).The map inset shows the geographical origin of the four seedlots tested.
b e r (F igu re 4B and 4C, r e spec t i ve ly ) . T h e d a t a sugges t s that in la te s u m m e r
p h y s i o l o g i c a l changes , pe rhaps a s soc i a t ed wi th s e e d l i n g n e e d l e ma tu ra t i on ,
dec rea sed s toma ta l c o n d u c t a n c e and t r ansp i r a t ion . Th i s i m p l i e s that w a t e r use
e f f ic iency inc reased b e t w e e n A u g u s t and ea r ly October .
223
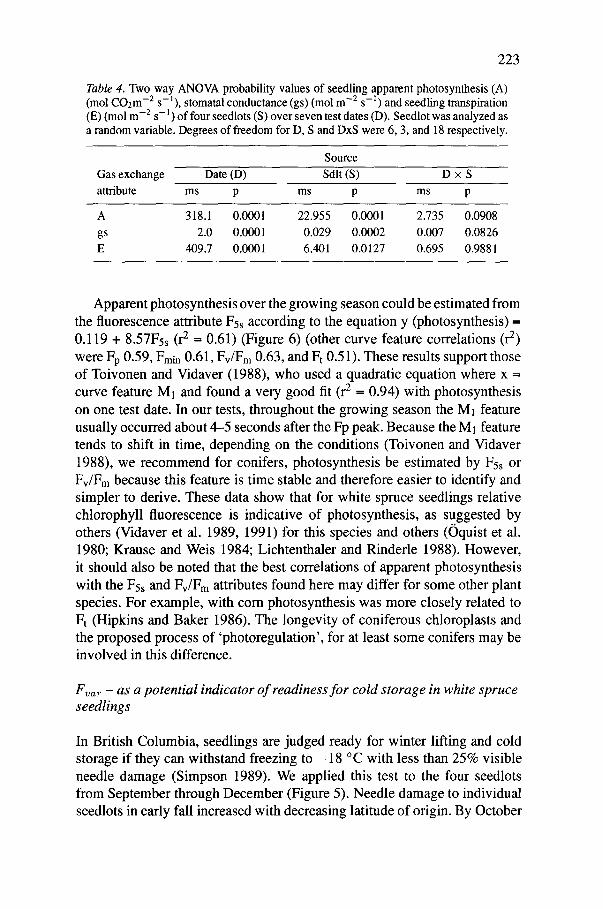
Table 4. Two way ANOVA probability values of seedling apparent photosynthesis (A) (mol CO2m -2 s- 1), stomatal conductance (gs) (mol m -2 s- i) and seedling transpiration (E) (mol m -2 s -l) of four seedlots (S) over seven test dates (D). Seedlot was analyzed as a random variable. Degrees of freedom for D, S and DxS were 6, 3, and 18 respectively.
Source
Gas exchange Date (D) Sdlt (S) D × S
attribute ms p ms p ms p
A 318.1 0.0001 22.955 0.0001 2.735 0.0908
gs 2.0 0.0001 0.029 0.0002 0.007 0.0826
E 409.7 0.0001 6.401 0.0127 0.695 0.9881
Apparent photosynthesis over the growing season could be estimated from the fluorescence attribute Fss according to the equation y (photosynthesis) -- 0.119 + 8.57Fss (re --- 0.61) (Figure 6) (other curve feature correlations (r e) were Up 0.59, Fmin 0.61, Fv/Fm 0.63, and Ft 0.51). These results support those of Toivonen and Vidaver (1988), who used a quadratic equation where x = curve feature M1 and found a very good fit (re -- 0.94) with photosynthesis on one test date. In our tests, throughout the growing season the M1 feature usually occurred about 4-5 seconds after the Fp peak. Because the Ml feature tends to shift in time, depending on the conditions (Toivonen and Vidaver 1988), we recommend for conifers, photosynthesis be estimated by Fss or Fv/Fm because this feature is time stable and therefore easier to identify and simpler to derive. These data show that for white spruce seedlings relative chlorophyll fluorescence is indicative of photosynthesis, as suggested by others (Vidaver et al. 1989, 1991) for this species and others (Oquist et al. 1980; Krause and Weis 1984; Lichtenthaler and Rinderle 1988). However, it should also be noted that the best correlations of apparent photosynthesis with the Fss and Fv/Fm attributes found here may differ for some other plant species. For example, with corn photosynthesis was more closely related to Ft (Hipkins and Baker 1986). The longevity of coniferous chloroplasts and the proposed process of 'photoregulation', for at least some conifers may be involved in this difference.
Fva~ - as a potential indicator of readiness for cold storage in white spruce seedlings
In British Columbia, seedlings are judged ready for winter lifting and cold storage if they can withstand freezing to - 1 8 °C with less than 25% visible needle damage (Simpson 1989). We applied this test to the four seedlots from September through December (Figure 5). Needle damage to individual seedlots in early fall increased with decreasing latitude of origin. By October

224
14" r 2 = 0 .61 A
13- Y=O, 1 1 9 + 8 . 5 7 X A • M
12" M
A
11 A A • ,, , A ~ A A A
~E 7 " ~B • A gtI~'..A .A " A A I A A A A
6 • A , ~ '~ .A ,~ , , , , , , , JP , '~ ,,,,,A A ,,
• , , " , , . ~ c ' . ,, , . , ~ , , k - - • A - ~ A ~ t , A
-- A • A & A A ~ A A A
1 t A' " ~ 0 . . . . . . . . . . . .
0.2 0.3 0.4 0.5 0.6 0.7 0.8 0.9 1.0 1.1 1.2 1.3
F5S (rel. fluor, units)
Figure 6. Regression of apparent photosynthesis versus normalized variable chlorophyll fluorescence attribute Fss of the four white spruce seedlots tested over seven test dates (August 1 to December 5) Each seedling had a corresponding measurement of Fss and A. n = 408 seedlings. The equation for the linear fit is A -- 0.119 + 8.57Fss, r 2 =0.61.
7, all seedlots passed the - 18 °C test for storability in that all had less than 25 % needle damage 10 days after the freezing test. The degree of shading over seasonal test dates in Figure 5 corresponds to that in Figure 2, and together with photosynthetic data (Figure 4A), indicates that the darkest shade reflects actively growing seedlings that were not frost hardy. The lightest shaded area indicates when seedlings were becoming frost hardy to - 1 8 °C and reflects a zone of transition, when seedlings went from not being ready for storage (Sept. 16) to being ready (Oct. 7). The medium shade show seedlings that were frost hardy to - 18 o C and could be safely lifted for cold storage. Vidaver et al. (1989a, b) reported a similar progressive seasonal decline of Fvar curves in white spruce seedlings. Their data showed photosynthetic inactivation for white spruce began in mid-August and approached completion in late October when stock passed the - 18 °C frost hardiness test. However in that study sampling dates in any year, and sample numbers used, were too few to establish the onset and duration of the hardening process with any accuracy. Furthermore, their fluorescence curves are shown only in 2 dimensions. Our study, carried out under operational nursery conditions, confirms the data of Vidaver et al. (1989a, b) regarding changes of curve shape for those curve features appearing 1 second or longer after light exposure, and shows these
225
seasonal changes in fluorescence by inclusion of seasonal date as a third variable in the typical amplitude/time fluorescence curve.
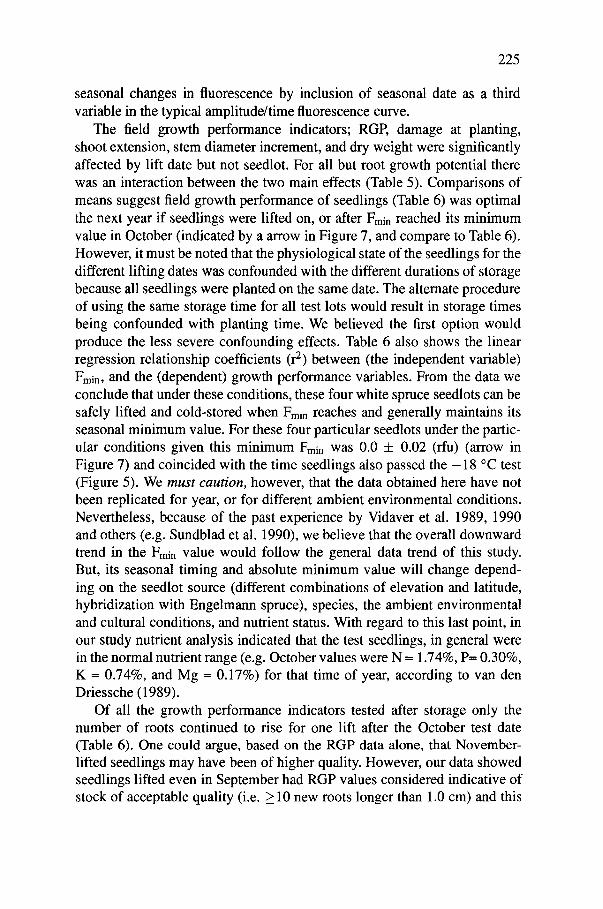
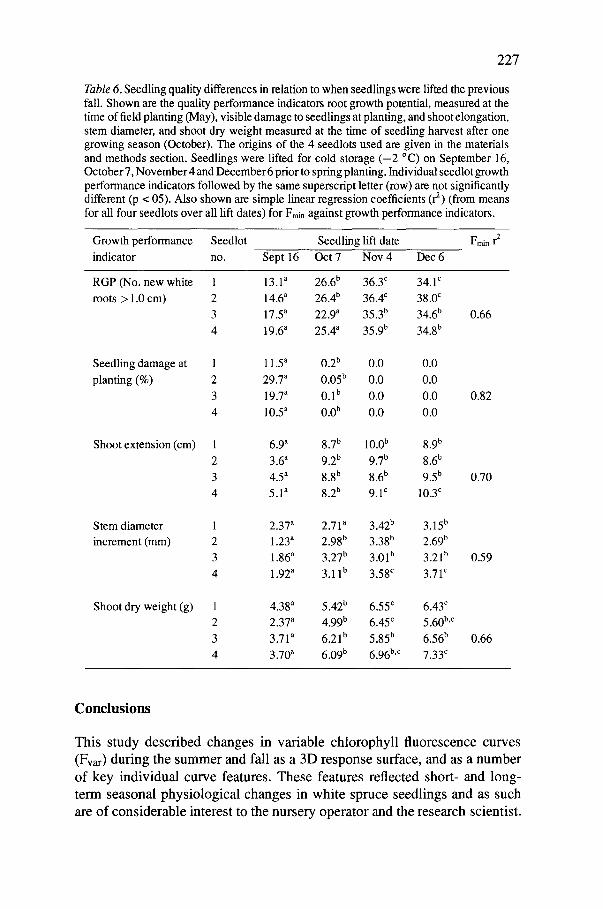
The field growth performance indicators; RGP, damage at planting, shoot extension, stem diameter increment, and dry weight were significantly affected by lift date but not seedlot. For all but root growth potential there was an interaction between the two main effects (Table 5). Comparisons of means suggest field growth performance of seedlings (Table 6) was optimal the next year if seedlings were lifted on, or after Fmin reached its minimum value in October (indicated by a arrow in Figure 7, and compare to Table 6). However, it must be noted that the physiological state of the seedlings for the different lifting dates was confounded with the different durations of storage because all seedlings were planted on the same date. The alternate procedure of using the same storage time for all test lots would result in storage times being confounded with planting time. We believed the first option would produce the less severe confounding effects. Table 6 also shows the linear regression relationship coefficients (r 2) between (the independent variable) Frnin, and the (dependent) growth performance variables. From the data we conclude that under these conditions, these four white spruce seedlots can be safely lifted and cold-stored when Fmin reaches and generally maintains its seasonal minimum value. For these four particular seedlots under the partic- ular conditions given this minimum Fmin was 0.0 -4- 0.02 (rfu) (arrow in Figure 7) and coincided with the time seedlings also passed the -18 °C test (Figure 5). We must caution, however, that the data obtained here have not been replicated for year, or for different ambient environmental conditions. Nevertheless, because of the past experience by Vidaver et al. 1989, 1990 and others (e.g. Sundblad et al. 1990), we believe that the overall downward trend in the Fmin value would follow the general data trend of this study. But, its seasonal timing and absolute minimum value will change depend- ing on the seedlot source (different combinations of elevation and latitude, hybridization with Engelmann spruce), species, the ambient environmental and cultural conditions, and nutrient status. With regard to this last point, in our study nutrient analysis indicated that the test seedlings, in general were in the normal nutrient range (e.g. October values were N -- 1.74%, P-- 0.30%, K -- 0.74%, and Mg -- 0.17%) for that time of year, according to van den Driessche (1989).
Of all the growth performance indicators tested after storage only the number of roots continued to rise for one lift after the October test date (Table 6). One could argue, based on the RGP data alone, that November- lifted seedlings may have been of higher quality. However, our data showed seedlings lifted even in September had RGP values considered indicative of stock of acceptable quality (i.e. _> 10 new roots longer than 1.0 cm) and this

226
Table 5. Two way ANOVA of seedling lift date and four seedlots for the quality growth performance indicators root growth potential (RGP, number of new white roots > 1.0 cm) measured at the time of field planting (May), visible damage to seedlings at planting, and shoot elongation, stem diameter increment, and shoot dry weight measured at the time of seedling harvest at the end of one growing season (October). Degrees of freedom for Lift (L), Seedlot (S) and L x S were 3, 3, and 9 respectively.
Source
Growth perform- Lift (L) Sdlt (S) L × S
ance indicator ms p ms p ms p
RGP 5612 0.0001 40.4 0.6195 65.2 0.9650
Damage (%) 38699 0.0001 1317.0 0.4386 1325.0 0.0153
Shoot elong. (cm) 1631 0.0002 59.7 0.5507 79.9 0.0031 St. diam. incr (mm) 178 0.0005 17.5 0.2471 10.6 0.0007 Shootdry wt (g) 694 0.0001 91.4 0.0589 25.4 0.0117
has been confirmed by others with white spruce (Binder et al. 1988; Simpson et al. 1988). Simpson (1989) did not find a relationship between pre-lift frost hardiness and root growth potential for white spruce.
The hypothesis put forward here suggesting a predictive value of slow phase fluorescence curve kinetics for seedling physiological status does not conflict with the findings of Strand and Oquist (1988) that the fast fluores- cence kinetics (i.e. those under 1 second after light exposure), not the slow ones, seem more related to the incident light level during frost hardening than to the frost hardening stage. Also, from their analysis of Scots pine Sunblad et al. (1990) concluded that the curve kinetics that contain most of the hardiness prediction information are far removed from the primary pho- tochemical events of photosynthesis. Sicher et al. (1988) showing that ATP consumption of chloroplasts is sensitive to the state of plant (frost) hardiness speculate that the predictive ability of fluorescence may stem from altered ATP tumover in the chloroplast of a hardened photosynthetic system. Our data also supports the suggestion of Walker et al. (1983a, b) that the $2-M2 attribute transients are associated with regulatory adjustments in the rate of CO2 assimilation. The loss of these transient attributes due to exposure to freezing stress is known to signal a substantial reduction in the rate of CO2 fixation (Strand and Oquist 1988). With white spruce, we suggest a similar loss of these attributes in the absence of freezing stress, as fall progresses, results in the Fvar attribute 'Fmin'. Its minimum value is attained at the bottom of the 'cascade effect' when the seedlings pass the - 18 °C test of storability and as such may quality as a a 'kinetic fingerprint' for hardiness prediction, suggested by Sunblad et al. (1990).
227
Table 6. Seedling quality differences in relation to when seedlings were lifted the previous fall. Shown are the quality performance indicators root growth potential, measured at the time of field planting (May), visible damage to seedlings at planting, and shoot elongation, stem diameter, and shoot dry weight measured at the time of seedling harvest after one growing season (October). The origins of the 4 seedlots used are given in the materials and methods section. Seedlings were lifted for cold storage ( - 2 °C) on September 16, October 7, November 4 and December 6 prior to spring planting. Individual seedlot growth performance indicators followed by the same superscript letter (row) are not significantly different (p < 05). Also shown are simple linear regression coefficients (r z) (from means for all four seedlots over all lift dates) for Fmin against growth performance indicators.
Growth performance Seedlot Seedling lift date Fmin 12 indicator no. Sept 16 Oct 7 Nov 4 Dec 6
RGP (No. new white 1 13.1 a 26.6 b 36.3 ~ 34.1 c
roots > 1.0 cm) 2 14.6 a 26.4 b 36.4 ~ 38.0 c
3 17.5 ~ 22.9" 35.3 b 34.6 b
4 19.6 a 25.4 a 35.9 b 34.8 b
Seedling damage at 1 11.5 a 0.2 b 0.0 0.0
planting (%) 2 29.7 a 0.05 b 0.0 0.0
3 19.7 a O. 1 b 0.0 0.0
4 10.5 ~ 0.0 b 0.0 0.0
Shoot extension (cm)
Stem diameter
increment (ram)
Shoot dry weight (g)
1 6.9 ~ 8.7 b 10.0 b 8.9 b
2 3.6 a 9.2 b 9.7 b 8.6 b
3 4.5 a 8.8 b 8.6 b 9.5 b
4 5.1 a 8.2 b 9.U 10.3 ~
1 2.37 a 2.71 a 3.42 b 3.15 b
2 1.23 a 2.98 b 3.38 b 2.690
3 1.86 a 3.27 b 3.01 b 3.21 b
4 1.92 a 3.11 b 3.58 ~ 3.71 c
1 4.38 a 5.42 b 6.55 c 6.43 c
2 2.37 a 4.99 b 6.45 ~ 5.60 b'~
3 3.71 a 6.21 b 5.85 b 6.56 b
4 3.70 a 6.09 b 6.96 b'~ 7.33 c
0.66
0.82
0.70
0.59
0.66
Conclusions
This study described changes in variable chlorophyll fluorescence curves (Fvar) during the summer and fall as a 3D response surface, and as a number of key individual curve features. These features reflected short- and long- term seasonal physiological changes in white spruce seedlings and as such are of considerable interest to the nursery operator and the research scientist.
228
t -
,c_ E
14.
1 . 2 •
1.1
1.0
0.9"
0.8"
0.7'
Seedlot:
1 . . . . 2 . . . . . 3
................ 4
8a t . I S,E.
0 ° 6 " t....°...°.,........ O5o,
o.2°"3 " ' 1 I
0.1 1 0.0
-0.1
-0.2
- 0 . 3 , . . • . . . . . . . . . . . . . . ,
Aug.01 Aug.22 Sep. 12 Oct.03 Oct.24 Nov. 14 Dec.05
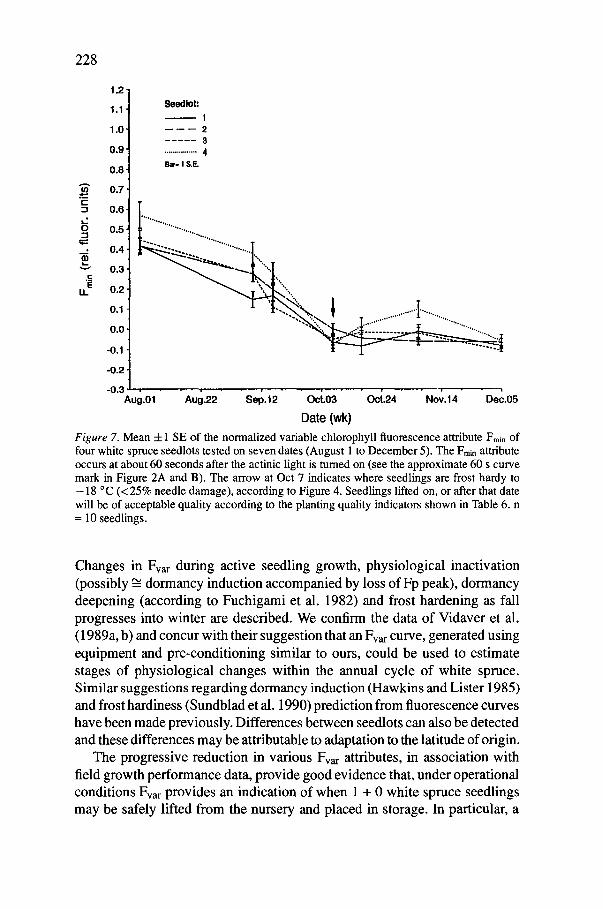
Date (wk) F i g u r e 7 . Mean -4-1 SE of the normalized variable chlorophyll fluorescence attribute Fmin of four white spruce seedlots tested on seven dates (August 1 to December 5). The Fmin attribute occurs at about 60 seconds after the actinic light is tumed on (see the approximate 60 s curve mark in Figure 2A and B). The arrow at Oct 7 indicates where seedlings are frost hardy to - 18 °C (<25% needle damage), according to Figure 4. Seedlings lifted on, or after that date will be of acceptable quality according to the planting quality indicators shown in Table 6. n = 10 seedlings.
Changes in Fvar during active seedling growth, physiological inactivation (possibly ~ dormancy induction accompanied by loss of Fp peak), dormancy deepening (according to Fuchigami et al. 1982) and frost hardening as fall progresses into winter are described. We confirm the data of Vidaver et al. (1989a, b) and concur with their suggestion that an Fvar curve, generated using equipment and pre-conditioning similar to ours, could be used to estimate stages of physiological changes within the annual cycle of white spruce. Similar suggestions regarding dormancy induction (Hawkins and Lister 1985) and frost hardiness (Sundblad et al. 1990) prediction from fluorescence curves have been made previously. Differences between seedlots can also be detected and these differences may be attributable to adaptation to the latitude of origin.
The progressive reduction in various Fvar attributes, in association with field growth performance data, provide good evidence that, under operational conditions Fvar provides an indication of when 1 + 0 white spruce seedlings may be safely lifted from the nursery and placed in storage. In particular, a
229
rapid decline in the Fvar attribute Fmi n occurred during the period of rapid frost hardening. This culminated in seedlings being hardy to -18 °C and suitable for storage. We have termed the rapid decline in Fmin the "'cascade effect". The Fmin attribute can be obtained with a 60 s scan after exposure to light. However, the timing of the 'cascade effect' and absolute values of Fmi n will be influenced by seedlot geographic source, environmental and cultural conditions and will, if detectable, probably vary between species.
The decline in apparent photosynthesis observed in the early fall may be related to physiological dormancy induction in conifers but, because photo- synthesis continued to decline for some time after seedlings passed the - 18 °C storability test, it was not useful as a lifting indicator. Seedling stomatal con- ductance and transpiration also did not appear to be useful for this purpose because they permanently decreased too early in the season (Figure 4). More- over, photosynthetic data takes more time to acquire than the Fmi n attribute, requires more expensive equipment, and is destructive because CO2 uptake must be related to needle area, or shoot dry weight. We suggest the Fvar curve attribute manifested at 5 seconds after dark-adapted seedlings are exposed to light can be used to estimate apparent photosynthesis in white spruce. The variable fluorescence measurements described here are non-invasive and non-destructive, can be done on branches or whole seedlings, and take only seconds to complete.
Acknowledgments
We are grateful to R. Storm of Information Services Branch, also V. Sit and W. Bergerud of Research Branch, Ministry of Forests (MoF) for their valuable statistical advice and consultation during the analysis of these data and to Amanda Nemec of International Statistics and Research Corporation for statistical advise during the preparation of the final manuscript. We also acknowledge J. Lort for technical assistance; P. Nystedt, D. Izard of MoF Research Branch, and A. Ring of MoF Tech. & Admin. Branch for their excellent art work; and T. Simoes for typing the original manuscript. We thank Drs. S. L'Hirondelle and C. Hawkins of MoF for their manuscript review comments. Finally, we are grateful to Dr. D. Draper, Manager of Forest Biology, Research Branch and Mr. H. Benskin, Director of Silviculture Branch, MoF for their continued support of this project. This work was supported by the Canadian - British Columbia Forest Resource Development Agreement, Project 2.19.

230
References
Baillon, E, Dalschaert, S., Grassi, S., and Geiss, E 1988. Spruce photosynthesis: Possibility of early damage diagnosis due to exposure to magnesium or potassium deficiency. Trees 2: 173-179.
Binder, W. D., Scagel, R. K., and Krumlik, G. J. 1988. Root growth potential: Facts, myths, value?, pp. 111-118. In: Proceedings, Combined Meetings of the Westem Forest Nursery Associations: Vernon, British Columbia, 1988. USDA For Serv. Gen. Tech. Rep. RM 167 Fort Collins, CO.
Binder, W. D., and Fielder, P. 1991. A preconditioning light box for variable chlorophyll fluorescence measurement: It's requirement and construction. Project 2.19. Seed and Stock Quality. British Columbia FRDA Research Memo No. 151.
Binder, W. D., and Fielder, E t995. Heat damage in boxed white spruce (Picea glauca [Moench.] Voss) seedlings: Its pre-planling detection and effect on field performance. New Forests. 9: 237-259.
Binder, W. D., and Fielder, P. 1996. Chlorophyll fluorescence as an indicator of frost hardiness in white spruce seedlings from different latitudes. New Forests (in Press).
Bolhar-Nordenkamph, H. R., and Lechner, E. G. 1988. Temperature and light dependent modifications of chlorophyll fluorescence kinetics in spruce needles during winter. Photo- synthetic Research 18: 287-298.
Burdett, A. N. 1979. New methods for measuring root growth capacity: their value in assessing lodgepole pine stock quality. Can. J. For. Res. 9: 63-67.
Conroy, J. P., Smillie, R. M., Kuppers, M., Bevege, D. I., and Barlow, E. W. 1986. Chlorophyll a fluorescence and photosynthetic and growth responses of Pinus radiata to phosphorus deficiency, drought stress and high CO2. Plant. Physiol. 81: 423-429.
Dannehl, H., Herbik, A., and Godde, D. 1995. Stress-induced degradation of the photosynthetic apparatus is accompanied by changes in thylakoid protein turn-over and phosphorylation. Physiol. Plant. 93: 179-186.
Dub6, S., and Vidaver, W. E. 1990. An integrating fluorometer data acquisition system. Plant Physiol. Biochem. 28: 539-546.
Dub6, S., Binder, W. D., Lister, G. R,, Vidaver, W. E. and Brooke, R. C. 1986. Chlorophyll fluorescence induction analysis as an indicator of quality of conifer nursery stock.Proceed- ings of the Canadian Society of Plant Physiologists, 26th Annual Meeting, Saskatoon, Saskatchewan.
Epron, D., and Dreyer, E. 1992. Effects of severe dehydration on leaf photosynthesis in Quercus petraea (Matt.) Liebl.: Photosystem II efficiency photochemical and non-photochemical fluorescence quenching and electrolyte leakage. Tree Physiol. 10: 273-284.
Falls, R. W., Toivonen, P., and Taylor, I. E. P. 1991. Chlorophyll a fluorescence and pre-season seedling directions as indicators of wood formation rates in white spruce (Picea glauca). Can. J. For. Res. 21:1106-1110.
Fuchigami, L. H., Weiser, C. J., Kogayashi, K., Timmis, R., and Gusta, L. V. 1982. A degree growth stage (°GS) model and cold acclimation in temperate woody plants. In: Li, P., Sakai, A. (Eds) Plant Cold Hardiness and Freezing Stress, Vol. 2, Academic Press, Orlando, FL, pp 93.
Gillies, S. L., and Vidaver, W. E. 1990. Mini review: Resistance to photodamage in evergreen conifers. Physiol. Plant. 80:148-153.
Gillies, S. L. 1993. A physiological study of fall dormancy and spring reactivation in white spruce (Picea glauca (Moench) Voss) and Douglas-fir (Pseudotsuga menziesii (Mirb.) Franco). Ph.D. Thesis. Simon Fraser University, Burnaby, B.C.
Grossnickle, S. C., Major, J. E., Amott, J. T., and Lemay, V. M. 1991. Stock quality assessment through an integrated approach. New Forests 5: 77-91.
Hawkins, C. D. B., and Binder, W. D. 1990. Chapter 8: State of the art seedling stock quality tests based on seedling physiology, pp. 9 I - 121. In: Target Seedling Symposium: Proceedings,

231
Combined Meeting of the Western Forest Nursery Associations. August 13-17, 1990. Roseburg, Oregon. USDA, For. Ser. Gen. Tech. Rep. RM-200.
Hawkins, C. D. B., and Lister, G. R. 1985. In vivo chlorophyll fluorescence as a possible indicator of the dormancy stage in Douglas-fir seedlings. Can. J. For. Res. 15:607-612.
Hipkins, M. E, and Baker, N. R. 1986. Spectroscopy. Chap. 4., pp. 51-100. In: Hipkins, M. E and Baker N. R. (Eds) Photosynthetic energy transduction: a practical approach. IRL Press Oxford.
Hobbs, S. D. 1984. The influence of species and stocktype selection on stand establishment: an ecophysiological perspective. In: Duryea, M. L. and Brown G. N. (Eds) Seedling physiology and reforestation success. Martinus Nijhoff/Dr. Junk Publishers, Dordrecht, The Netherlands.
Holbo, H. R., Askren, C. A., and Hermann, R. C. 1981. Does the oscilloscope technique reveal the dormancy status of Douglas-fir and Ponderose pine? For. Sci. 27: 405-412.
Krause, G. H. and Weis, E. 1984. Chlorophyll fluorescence as a tool in plant physiology. Interpretation of fluorescence signals. Photosynth. Res. 5:139-157.
Lichenthaler, H. K. (Ed) 1988. Applications of chlorophyll fluorescence in photosynthesis research, stress physiology, hydrobiology and remote sensing. Kluwer Academic Publishers. Dordrecht. 366 pp.
Lichenthaler, H. K. and Rinderle, U. 1988. The role of chlorophyll fluorescencein the detection of stress conditions in plants. Critical Reviews in Analytical Chemistry. 19 Suppl 1: 529- 585.
Mohammed, G. H., Binder, W. D., and Gillies, S. L. 1995. Chlorophyll fluorescence: A review of its practical forestry applications and instrumentation. Scan. J For. Res. 10: 383-410.
Navratil, S., Brace, L. G., and Edwards, I. K. 1986. Planting stock quality monitoring. Infor. Rep. Nor-X-279. Northem Forestry Centre, Canadian Forestry Service. p. 21.
Oquist, G., Brunes, L., H~llgren, J.-E., Gezelius, K., Halle'n, M., and Malmberg, G. 1980. Effects of artificial frost hardening and winter stress net photosynthesis, photosynthetic electron transport and RuBP carboxylase activity in seedlings of Pinus silvestris. Physiol. plant. 48: 526-531.
Oquist, G. 1983. Effect of low temperature on photosynthesis. Plant, Cell Environment. 6: 281-300.
0quist, G., Chow, W. S., and Anderson, J. M. 1992. Photoinhibition of photosynthesis repre- sents a mechanism for the long-term regulation of photosystem II. Planta 186: 450-460.
Parker, J., and Philpott, D. E. 1961. An electron microscopic study of chloroplast condition in summer and winter in Pinus strobus. Protoplasma 53: 575-583.
Parker, J., and Philpott. D. E. 1963. Seasonal continuity of chloroplasts in white pine and rhododendron. Protoplasma 56:355-361.
Puttonen, P. 1989. Criteria for using seedling performance tests. New Forests 3: 67-87. Rose, R., Campbell, S. J., and Landis, T. D. (Eds) 1990. Target seedling symposium: Proceed-
ings, combined meeting of the western forest nursery associations. USDA For. Ser. Gen. Tech. Rep. RM-200, Fort Collins, CO. 286 pp.
SAS Institute Inc. 1988. SAS/Stat user's guide: Release 6.03. Cary, NC, USA. Senser, M., Schrtz, F., and Beck, E. 1975. Seasonal changes in structure and function of spruce
chloroplasts. Planta 126: 1-10. Senser, M., Dittrich, P., Kandler, O., Thanbichler, A., and Kuhn, B. 1971. Isotopenstudien tiber
den Einfluss der Jahreszeit auf dem Oligosacehardumsatz bei Conifre. Ber. Deutsch. Bot. Ges. 84: 445-455.
Sicher, R. C., Sundblad, L. G., and Oquist, G. 1988. Effects of low temperature acclimation upon photosynthetic induction in barley primary leaves. Physiol. Plant. 73:206-210.
Simpson, D. G., Vyse, A., and Thompson, C. F. 1988. Root growth capacity effects on field performance, pp. 119-121. In: Proceedings, Combined Meetings of the Western Forest Nursery Associations: Vernon, British Columbia, 1988. USDA For Gen. Tech. Rep. RM 167 Fort Collins, CO.

232
Simpson, D. G. 1989. Frost Hardiness, root growth capacity, and field performance relation- ships in interior spruce, todgepole pine, Douglas-fir, and western hemlock seedlings. Can. J. For. Res. 20: 566-572.
Strand, M., and t)quist, G. 1988. Effects of frost hardening, dehardening and freezing stress on in vivo chlorophyll fluorescence of seedlings of Scots pine (Pinus sylvestris L.). Plant Cell Environ. 11: 231-238.
Sundblad, L. G., Sjrstrrm, M., Malmberg, G., and Oquist, G. 1990. Prediction of frost hardiness in seedlings of Scots pine (Pinus sylvestris L) using multivariate analysis of chlorophyll a fluorescence and luminescence kinetics. Can. J. For. Res. 20: 592-597.
Sutton, R. F. 1979. Planting stock quality and grading. For. Ecol. Manage 2: 123-132. Toivonen, P., and Vidaver, W. E. 1984. Integrating fluorometer for the measurement of chloro-
phyll fluorescence induction in intact plants. Rev. Sci. Instrum. 55: 1687-1690. T0ivonen, P., and Vidaver, W. E. 1988. Variable chlorophyll a fluorescence and CO2 uptake in
water stressed white spruce seedlings. Plant Physiol. 86: 744--748. van den Driessche, R. 1989. Nutrient deficiency symptoms in container-grown Douglas-fir and
white spruce seedlings. B.C. Ministry of Forests FRDA Rep. Number 100. p 5. Vidaver, W. E., Binder, W. D., Brooke, R. C., Lister, G. R., and Toivonen P. M. A. 1989a.
Assessment of photosynthetic activity of nursery grown Picea glauca (Moench) Voss seedlings using an integrating fluorometer to monitor variable chlorophyll fluorescence. Can. J. For. Res. 19: 1478-1482.
Vidaver, W. E., Toivonen, P. Brooke, R., Lister, G., and Binder, W. D. 1989b. Provenance differences in Conifer seedling variable chlorophyll fluorescence responses detected using the integrating fluorometer. Intermountain Forest Nursery Association Meeting. August 14-17, 1989. Bismarck, ND.
Vidaver, W. E., Lister, G. R., Brooke, R. C., and Binder, W. D. 1991. A Manual for the use of variable chlorophyll fluorescence in the assessment of the ecophysiology of conifer seedlings. British. Columbia Ministry of Forests FRDA Rep. No. 163.60 pp.
Walker, D. A., Horton, P., Sivak, M. N., and Quick, W. P. 1983a. Anti-parallel relationship between 02 evolution and slow fluorescence induction kinetics. Photobiochemistry and Photobiophysics 5: 35-39.
Walker, D. A., Sivak, M. N., Prinsley, R. T., and Cheesbrough, J. K. 1983b. Simultaneous measurements of oscillations in oxygen evolution and chlorophyll a fluorescence in leaf pieces. Plant physiol. 73: 542-549.
Zaerr, J. B. 1985. The role of biochemical measurements in evaluating vigor, pp. 137-141. In: Duryea M. L. fEd) Evaluating seedling quality: principles, procedures, and predictive abilities of major tests. Proc. Workshop, Oct. 1 6-18, 1984. For. Res. Lab., OR. State Univ., Corvallis, OR.
Zaerr, J. B., and Lavender, D. P. 1980. Analysis of plant growth substances in relation to seedling and plant growth. N.Z.J. For. Sci. 10: 186-195.
Related Documents