Seasonal and plant-density dependency for quantitative trait loci affecting flowering time in multiple populations of Arabidopsis thaliana JAVIER F. BOTTO & MARÍA PAULA COLUCCIO IFEVA, Facultad de Agronomía, Universidad de Buenos Aires,Av San Martín 4453, C1417DSE Ciudad de Buenos Aires, Argentina ABSTRACT Multiple environmental cues regulate the transition to flow- ering. In natural environments, plants perceive seasonal progression by changes in day length and growth tempera- ture, and plant density is monitored by changes in the light quality reflected from neighbouring vegetation. To under- stand the seasonal and plant-density dependence associated with natural allelic variation in flowering time, we con- ducted a quantitative trait loci (QTL) mapping study in Ler ¥ Cvi, Bay ¥ Sha and Ler ¥ No-0 recombinant inbred line (RIL) populations of Arabidopsis thaliana. Days and total leaf number to bolting were examined under low and high plant density (200 or 1600 plants m -2 ) in autumn– winter and spring seasons. We found between 4 and 10 QTLs associated with seasonal and density variations in each RIL population. For Ler ¥ Cvi and Bay ¥ Sha RIL populations, a major proportion of QTLs showed seasonal and density interaction (up to 63%) and four QTLs were common to all environments (21%). Only three QTLs showed seasonal or density dependency. By aligning the linkage maps onto a common physical map, we detected at least one QTL at chromosome 2 and two QTLs at chromo- some 5 that overlap between the three RIL populations, suggesting that these QTLs play a crucial role in the adap- tive control of flowering time. Key-words: QTL; RIL populations; seasonal environments. INTRODUCTION The major developmental transition in flowering plants is the switch from vegetative to reproductive development. The correct timing of this transition is essential to maximize reproductive success and is a primary determinant of fitness in many species (Stratton 1998). Multiple environmental cues regulate the transition to flowering like temperature and light (Simpson & Dean 2002; Hayama & Coupland 2004). In natural environments, plants perceive seasonal progression by changes in the day length and growth temperature, and plant density is monitored by changes in the light quality reflected from neighbouring vegetation. The natural history and genetic basis of developmental pathways to flowering in Arabidopsis thaliana suggest that different loci may contribute to variation in reproductive timing in different environmental conditions (Weinig et al. 2002). Arabidopsis is a predominantly self-fertilizing, colo- nizing annual species, native to Eurasia but now widely naturalized elsewhere. Arabidopsis populations occur over a wide latitudinal and altitudinal gradients, and accessions differ substantially in life history and reproductive phenol- ogy (Nordborg & Bergelson 1999). Arabidopsis accessions display two principal reproductive strategies: rapid-cycling or winter-annual habits. Seeds of northern populations, originated from regions where winter is severe, germinate and flower within a season to enable more than one life cycle a year, whereas southern populations tend to behave as winter annuals exhibiting a fixed autumn germination, complete their vegetative development in late winter or early spring, and flower in late spring, a trait considered to be adaptative in regions where summer is hot or dry (Ratcliffe 1965, 1976; Napp-Zinn 1976). Plant neighbours alter the spectral quality of light because chlorophyll absorbs red wavelengths (R) but trans- mits and reflects far-red wavelengths (FR), an unambiguous signal quantitatively related to plant density (Ballaré, Scopel & Sánchez 1990). FR is detected by the phyto- chromes, a family of photoreceptor molecules whose activ- ity is a function of the relative amounts of R and FR radiation (Smith & Holmes 1977). The identification of loci required for shade-avoidance responses is possible using the expected genetic variation required for adaptation to specific geographical conditions. In a large survey of Arabi- dopsis accessions for responses to low and high R/FR ratios, Botto & Smith (2002) demonstrated significant genetic variation in shade avoidance but also no correlation in the sensitivity of the two classical shade-avoidance responses: seedling hypocotyl elongation and flowering-time accelera- tion, suggesting that different selective forces for the same shade light signal are acting during the life cycle of the plant. Using populations of recombinant inbred lines (RILs) and quantitative trait loci (QTL) approximation, several loci were identified to regulate hypocotyl growth Correspondence: J. F. Botto. Fax: 5411 4514 8730; e-mail: [email protected] Plant, Cell and Environment (2007) 30, 1465–1479 doi: 10.1111/j.1365-3040.2007.01722.x © 2007 The Authors Journal compilation © 2007 Blackwell Publishing Ltd 1465

Welcome message from author
This document is posted to help you gain knowledge. Please leave a comment to let me know what you think about it! Share it to your friends and learn new things together.
Transcript

Seasonal and plant-density dependency for quantitativetrait loci affecting flowering time in multiple populationsof Arabidopsis thaliana
JAVIER F. BOTTO & MARÍA PAULA COLUCCIO
IFEVA, Facultad de Agronomía, Universidad de Buenos Aires, Av San Martín 4453, C1417DSE Ciudad de Buenos Aires,Argentina
ABSTRACT
Multiple environmental cues regulate the transition to flow-ering. In natural environments, plants perceive seasonalprogression by changes in day length and growth tempera-ture, and plant density is monitored by changes in the lightquality reflected from neighbouring vegetation. To under-stand the seasonal and plant-density dependence associatedwith natural allelic variation in flowering time, we con-ducted a quantitative trait loci (QTL) mapping study inLer ¥ Cvi, Bay ¥ Sha and Ler ¥ No-0 recombinant inbredline (RIL) populations of Arabidopsis thaliana. Days andtotal leaf number to bolting were examined under low andhigh plant density (200 or 1600 plants m-2) in autumn–winter and spring seasons. We found between 4 and 10QTLs associated with seasonal and density variations ineach RIL population. For Ler ¥ Cvi and Bay ¥ Sha RILpopulations, a major proportion of QTLs showed seasonaland density interaction (up to 63%) and four QTLs werecommon to all environments (21%). Only three QTLsshowed seasonal or density dependency. By aligning thelinkage maps onto a common physical map, we detected atleast one QTL at chromosome 2 and two QTLs at chromo-some 5 that overlap between the three RIL populations,suggesting that these QTLs play a crucial role in the adap-tive control of flowering time.
Key-words: QTL; RIL populations; seasonal environments.
INTRODUCTION
The major developmental transition in flowering plants isthe switch from vegetative to reproductive development.The correct timing of this transition is essential to maximizereproductive success and is a primary determinant of fitnessin many species (Stratton 1998). Multiple environmentalcues regulate the transition to flowering like temperatureand light (Simpson & Dean 2002; Hayama & Coupland2004). In natural environments, plants perceive seasonalprogression by changes in the day length and growth
temperature, and plant density is monitored by changes inthe light quality reflected from neighbouring vegetation.
The natural history and genetic basis of developmentalpathways to flowering in Arabidopsis thaliana suggest thatdifferent loci may contribute to variation in reproductivetiming in different environmental conditions (Weinig et al.2002). Arabidopsis is a predominantly self-fertilizing, colo-nizing annual species, native to Eurasia but now widelynaturalized elsewhere. Arabidopsis populations occur overa wide latitudinal and altitudinal gradients, and accessionsdiffer substantially in life history and reproductive phenol-ogy (Nordborg & Bergelson 1999). Arabidopsis accessionsdisplay two principal reproductive strategies: rapid-cyclingor winter-annual habits. Seeds of northern populations,originated from regions where winter is severe, germinateand flower within a season to enable more than one lifecycle a year, whereas southern populations tend to behaveas winter annuals exhibiting a fixed autumn germination,complete their vegetative development in late winter orearly spring, and flower in late spring, a trait consideredto be adaptative in regions where summer is hot or dry(Ratcliffe 1965, 1976; Napp-Zinn 1976).
Plant neighbours alter the spectral quality of lightbecause chlorophyll absorbs red wavelengths (R) but trans-mits and reflects far-red wavelengths (FR), an unambiguoussignal quantitatively related to plant density (Ballaré,Scopel & Sánchez 1990). FR is detected by the phyto-chromes, a family of photoreceptor molecules whose activ-ity is a function of the relative amounts of R and FRradiation (Smith & Holmes 1977). The identification of locirequired for shade-avoidance responses is possible usingthe expected genetic variation required for adaptation tospecific geographical conditions. In a large survey of Arabi-dopsis accessions for responses to low and high R/FR ratios,Botto & Smith (2002) demonstrated significant geneticvariation in shade avoidance but also no correlation in thesensitivity of the two classical shade-avoidance responses:seedling hypocotyl elongation and flowering-time accelera-tion, suggesting that different selective forces for the sameshade light signal are acting during the life cycle of theplant. Using populations of recombinant inbred lines(RILs) and quantitative trait loci (QTL) approximation,several loci were identified to regulate hypocotyl growth
Correspondence: J. F. Botto. Fax: 5411 4514 8730; e-mail:[email protected]
Plant, Cell and Environment (2007) 30, 1465–1479 doi: 10.1111/j.1365-3040.2007.01722.x
© 2007 The AuthorsJournal compilation © 2007 Blackwell Publishing Ltd 1465

and cotyledon opening during de-etiolation processes(Yanovsky, Casal & Luppi 1997; Borevitz et al. 2002; Bottoet al. 2003; Alconada-Magliano et al. 2005). In some cases,the role of specific genes can be determined through themolecular dissection of the loci of interest. For example, thenatural genetic variation in the photomorphogenic seedlingdevelopment involves the unexpected participation ofCRY2 in the regulation of the cotyledon opening under FRpulses even in the absence of blue light (Botto et al. 2003).
QTL mapping provides an excellent means for exploringthe genetic basis of the relation of phenotypic plasticity (theability of a genotype to produce distinct phenotypes whenexposed to different environments throughout its ontog-eny) to genotype by environment interactions of photomor-phogenic responses to crowding and vegetation shade(Schmitt 1997; Pigliucci 1998; Tonsor, Alonso-Blanco &Koornneef 2005). In Arabidopsis, analysis of the QTL archi-tecture of flowering time and fitness traits like survivorshipand fecundity using Ler ¥ Col RIL population revealednovel loci involved under ecologically relevant conditions(Weinig et al. 2002, 2003).
Understanding the ecological significance of the flower-ing variation for plant adaptation requires its analysis underwell-defined complex natural environments due to thenumber of environmental factors involved and to spatialand temporal heterogeneity (Koornneef, Alonso-Blanco &Vreugdenhil 2004). In this work, we focus on the analysis ofthe natural allelic variation for flowering response associ-ated with two factors shaping this variation: the temporalheterogeneity determined by seasonal changes in photope-riod, light intensity and temperature; and spatial heteroge-neity modulated by plant density.We report a QTL study inthree RIL populations of Arabidopsis growth at low andhigh plant density in autumn–winter and spring seasons.The exploration of the genetic basis of flowering time inmultiple RIL populations permits examination of the rel-evance of new or previously identified flowering time QTLin the context of well-defined ecological settings, and it alsopermits evaluation of whether the QTLs involved in flow-ering time overlap between the RIL populations exposed tothe same intensity of seasonal and density variations.
MATERIALS AND METHODS
Mapping populations
We used three sets of RIL populations to map flowering timeQTL involved in the perception of seasonal and densityvariations. We selected the Ler ¥ Cvi RIL population(Alonso-Blanco et al. 1998a) for representing the widestlatitudinal range between parent accessions of RIL popula-tions available at the Arabidopsis Biological ResourceCenter (Ohio State University, Columbus, OH, USA) andthe Bay ¥ Sha RIL population (Loudet et al. 2002) derivedfrom crosses between parent accessions originated in oppo-site altitudinal places. In this study, we included the analysisof natural allelic variation for flowering in Ler ¥ No-0 RILpopulation (Alconada-Magliano et al. 2005) in which the
flowering time QTL analysis has never been tested. Thenumber of lines was 62 for the Ler ¥ Cvi RIL population,159for the Bay ¥ Sha RIL population and 119 for the Ler ¥ No-0RIL population. Because some seeds failed to germinate orplants were occasionally lost during experiments, thenumber of RILs used in the QTL mapping analysis was up to8% less than the original depending on the environmentalcondition and the RIL population tested.
Glasshouse experiments
The experiments were carried out in a glasshouse at IFEVA(Faculty of Agronomy, University of Buenos Aires, Argen-tina) in autumn–winter and spring growing seasons of thesouthern hemisphere. In 2004, two sets of RIL populationswere sown between 15 May (Ler ¥ Cvi RIL population) and26 May (Bay ¥ Sha RIL population) for the autumn–winterexperiments and between 15 September (Ler ¥ Cvi RILpopulation) and 22 September (Bay ¥ Sha RIL population)for the spring experiments. For Ler ¥ No-0 RIL population,we started the experiment on 29 June 2005. Seeds weresown on agar-water and incubated at 7 °C for 7 d. Then, theseeds were irradiated with an R pulse for 1 h and incubatedat 25 °C in darkness.After 24 h, the seeds were sown on soilsurface with a pipette. Plants were grown from sowing tomaturity in a pot (8 cm in diameter and 10 cm in height)filled with soil (2/3 topsoil and 1/3 vermiculite). Two densi-ties were established in the experiments: one or eightplants per pot (i.e. 200 and 1600 plants m-2). The R : FRratios established before flowering measurements were0.98 � 0.022 and 0.63 � 0.015 for low and high plant densi-ties, respectively. The RIL seeds were sown in the centre ofeach pot. Fifteen seeds of Columbia were sown around eachRIL seed to produce the effect of neighbours. The plantdensity in each treatment was obtained 1 week after sowingby eliminating excess of seedlings by hand pulling; trans-planting was used in some cases to compensate poor ger-mination or emergence defects. Plants were allowed tocompete above and below ground. Pots were irrigatedeveryday and fertilized with 1 g of Ca(NO3)2 per litre twiceduring experiments.The photosynthetically active radiation(PAR) at clear midday was up to 2.4-fold higher in springcompared with autumn–winter experiments. The photope-riod varied between 10 and 14.5 h in autumn–winter andspring, respectively. The average temperatures in the glass-house were between 18.6 and 21.2 °C in autumn–winter andspring, respectively (Table 1). Three plants for RIL and sixplants for parental genotypes were grown per treatment ina randomized complete-block design. RIL and parentalgenotypes were moved three times during the experimentinto block at the same level of density. Flowering time wasrecorded as total leaf number at bolting (TLN) and days toflowering (DTF).
Statistical and QTL analyses
Marker segregation data for RIL populations wereobtained from http://www.arabidopsis.org/. We used 99
1466 J. F. Botto & M. P. Coluccio
© 2007 The AuthorsJournal compilation © 2007 Blackwell Publishing Ltd, Plant, Cell and Environment, 30, 1465–1479

markers discriminating for the Ler ¥ Cvi RIL population(Alonso-Blanco et al. 1998a), 40 markers for the Bay ¥ ShaRIL population (Loudet et al. 2002) and 46 markers for theLer ¥ No-0 RIL population (Alconada-Magliano et al.2005). MAPMAKER/EXP 3.0 (Lander et al. 1987) was usedto construct the linkage map. Linkage groups were verifiedwith a minimum LOD = 3 and a maximum distance = 50 cM(Kosambi function). Both the linkage map data and data setof the genotypes and phenotypes were then importedto QTL Cartographer version 2.0 obtained fromhttp://statgen.ncsu.edu/qtlcart/WQTLCart.htm (Wang et al.2004). RIL mean values were transformed (square root orlogarithmic) to improve the normality of distributions. Thelikelihood, location, additive effect and percentage of vari-ance explained by each QTL were calculated using model 6based on the composite interval mapping (CIM) method(Zeng 1994). QTL cofactors were initially selected by usingforward–backward stepwise multiple regression. Mappingwas conducted with a walking speed = 0.5 cM and a windowsize = 3 cM. For precise determination of significant QTL,the thresholds of LOD for each linkage group were calcu-lated by a permutation test method (Doerge & Churchill1996) with 1000 permutations at the permutation signifi-cance level (P < 0.05).The LOD varied from 2.4 to 2.7 for thedifferent traits.
The support interval of each QTL was constructed using2-LOD rule with the confidence intervals being defined byall those values falling within 2-LOD score of the maximumvalue (Lynch & Walsh 1998).To declare the presence of twodifferent QTLs in the same chromosome, the confidenceintervals of both QTLs should not be superposed betweenthem. We classified the QTL into four categories followingthese criteria: S-QTLs (i.e. seasonal QTLs) are thosemapped on both seasons, D-QTLs (i.e. density QTLs) arethose mapped on both densities, S + D-QTLs (i.e. conspicu-ous QTLs) are those mapped on both seasons and densitiesand S ¥ D-QTLs (i.e. interaction QTLs) are those mappedunder a particular environment of season and density. Toalign the linkage maps per chromosome for the three popu-lations, the linkage positions of markers in each populationwere aligned with their corresponding physical positions onthe Col physical map following the methodology used bySymonds et al. (2005).
For DTF and TLN, a search for interactions betweenQTLs was performed using the computer programEPISTAT (Chase, Adler & Lark 1997) with log-likelihoodratio thresholds corresponding to a significant value of
P < 0.0005. Ten thousand trials were used in Monte Carlosimulations performed with EPISTAT to establish the sta-tistical significance of the LOD values for the interactions(P < 0.01).
The overall G ¥ E interaction was tested for each trait bytwo-factor analysis of variance (anova) using genotypes(RILs) and environments as classifying factors. We alsoused anova to partition variance for TLN and DTF intosources originating from season (S), density (D), spatialblock (B) and error. No significant block effect wasobserved, thus this factor was removed from the model(Sokal & Rohlf 1995). In this model, we also excluded theRIL genotype factor to do a robust analysis for season anddensity factors. For each trait and for each putative QTL,QTL ¥ E interaction was tested by repeated measuresanova using the corresponding marker and the environ-ment as classifying factor. The general linear modelmodule of the InfoStat statistical package (http://www.infostat.com.ar) was used (InfoStat 2002).
Growth chamber experiments
In order to confirm some QTLs, we used near isogenic lines(NILs) from the Ler ¥ Cvi RIL population. The EDI NILand CRY2-Cvi and CRY2-Ler transgenic plants were usedpreviously (El-Assal et al. 2001) and allowed us to confirma QTL on the top of chromosome 1, NIL43 and La(ER+)were used to confirm a QTL in the middle of chromosome2 (for reference, see Botto et al. 2003), and NIL DOG17.1was used to confirm a QTL in the middle of chromosome 5(Alonso-Blanco et al. 2003). We carried out experiments ingrowth chambers with short (8 h light + 16 h dark) and long(16 h light + 8 h dark) photoperiods at 22 °C. Because end-of-day (EOD) FR light treatment mimics shade-avoidanceresponses, plants were grown under white light (WL) orwhite light supplemented with 30 min of FR at the end ofeach photoperiod (WL + EOD).
RESULTS
Natural variation for flowering time in seasonaland plant-density environments
We have conducted density experiments in autumn–winterand spring seasons using two RIL populations: Ler ¥ Cvi(parents from opposite latitudinal origins) and Bay ¥ Sha(parents from opposite altitudinal origins) (Fig. 1). Four
Table 1. Average mean radiation at 14 PM and average mean, maximum and minimum temperatures into glasshouse during theexperiments
Average mean radiation(mmol m-2 s-1)
Average meantemperature (°C)
Average maximumtemperature (°C)
Average minimumtemperature (°C)
Autumn–winter 2004 748 � 63 19.1 � 0. (24.5–12.7) 28.5 � 0.4 (32.8–16.6) 14.3 � 0.5 (7.2–22.9)Spring 2004 1527 � 155 21.2 � 0.3 (23.5–18.2) 28.9 � 0.5 (34.5–22.2) 15.1 � 0.3 (12.1–17.8)Autumn–winter 2005 637 � 65 18.6 � 0.2 (20.7–15.6) 25.3 � 0.3 (27.7–17.5) 13.9 � 0.2 (11.2–15.6)
Data are means � SE (between parenthesis is shown the range of temperature variation).
Ecological flowering time QTL 1467
© 2007 The AuthorsJournal compilation © 2007 Blackwell Publishing Ltd, Plant, Cell and Environment, 30, 1465–1479

experimental treatments were established: low density inautumn–winter (LA), high density in autumn–winter (HA),low density in spring (LS) and high density in spring (HS).Parent genotypes accelerated flowering response in springwith respect to autumn–winter growing season, decreasingDTF between 13 and 18 d (Table 2). The Sha accessionflowered with a lower TLN than the Bay accession albeitDTF in the same experimental condition was similarbetween parent genotypes (Table 2). Cvi genotype boltedearlier than Ler in all conditions with the exception of lowdensity in autumn–winter (Table 2).Although flowering dif-ferences between parental accessions were small, transgres-sive variations in both directions were observed in bothRIL populations under the four environmental conditions(Table 2, Supplementary Figs S1 & S2). The heritability,defined as the proportion of the total phenotypic variationthat is genetic, ranged between 0.73 and 0.99 for the fourexperimental settings (Table 2). Genetic variation of indi-vidual RIL differed significantly across seasons and densi-ties as showed by highly significant G ¥ E interaction(P < 0.0001). This indicates the presence of allelic variationbetween RILs whose effect is expressed differentiallywithin each seasonal and density environment to controlflowering. In a two-way anova analysis with season anddensity factors as sources of partition variance, we found ahigh contribution of season and secondarily of density inthe total variance of the model with the exception of DTFdensity factor in the Ler ¥ Cvi RIL population (Supplemen-tary Table S1). Overall, the plants of RIL genotypes in bothpopulations accelerated flowering response in high densityand spring with respect to low density and autumn–winter.Only season ¥ density interaction was detected for TLN inthe Bay ¥ Sha RIL population and it is explained by ahigher contribution of density effect in autumn–winter thanin spring (Supplementary Table S1 and data not shown).
QTL mapping for flowering time in seasonaland plant-density environments
To identify and locate the loci controlling flowering varia-tion under the four environments (LA, HA, LS and HS), weproceeded with QTL analysis for DTF and TLN inBay ¥ Sha and Ler ¥ Cvi RIL populations. A total of 9 and10 QTLs were detected in Bay ¥ Sha and Ler ¥ Cvi RILpopulations, respectively (Figs 2 & 3, Tables 3 & 4). TheDTF and TLN QTL analysis explained between 25 and60% of the variation observed in the Bay ¥ Sha RIL popu-lation and between 30 and 87% of the total phenotypicvariation observed in the Ler ¥ Cvi RIL population(Tables 3 & 4). A major proportion of QTLs (up to 63%)showed seasonal and density interaction (i.e. S ¥ D-QTL;Table 5) and four loci were present in both seasons anddensities (i.e. S + D-QTL; Table 5). In the Bay ¥ Sha RILpopulation, one QTL was associated with the autumn–winter season independently of the density (i.e. S-QTL) andthe other two QTLs showed plant-density dependency (i.e.D-QTL; Table 5). Neither seasonal nor density QTL wasdetected in the Ler ¥ Cvi RIL population (Table 5).
In the Bay ¥ Sha RIL population, the loci associated withthe marker MSAT2.36, NGA249 and MSAT5.12 werecommon for the four experimental environments (Fig. 2,Tables 3 & 4). The locus MSAT1.5 at the bottom arm ofchromosome 1 was detected in autumn–winter indepen-dently of the plant density. For DTF, the locus MSAT4.8 atthe top of chromosome 4 was clearly associated with lowplant density independently of the seasonal environment,meanwhile F21M12 QTL showed high plant-density depen-dency for TLN. Other QTLs were mapped to a specificcombination of seasonal and plant-density environment.We detected QTL ¥ QTL interactions for the traits mea-sured. Strong interactions occurred between the bottom of
Figure 1. Parent genotypes of Cvi ¥ Lerand Bay ¥ Sha recombinant inbred line(RIL) populations. The photographsshow plants grown in low (right) andhigh (left) plant densities. Thehigh-density effect was obtained growingseven Col plants around each RIL orparental plants. The photographs weretaken 15 d after sown in the springexperiment.
Cvi Ler
Bay Sha
1468 J. F. Botto & M. P. Coluccio
© 2007 The AuthorsJournal compilation © 2007 Blackwell Publishing Ltd, Plant, Cell and Environment, 30, 1465–1479

Tab
le2.
Sum
mar
yst
atis
tics
for
flow
erin
gti
me
(DT
Fan
dT
LN
)
Day
sto
flow
erin
g(D
TF
)To
tall
eaf
num
ber
(TL
N)
Aut
umn–
win
ter
Spri
ngA
utum
n–w
inte
rSp
ring
Low
dens
ity
(LA
)H
igh
dens
ity
(HA
)L
owde
nsit
y(L
S)H
igh
dens
ity
(HS)
Low
dens
ity
(LA
)H
igh
dens
ity
(HA
)L
owde
nsit
y(L
S)H
igh
dens
ity
(HS)
Bay
¥Sh
aB
ay44
.5�
2.5
44.6
�2.
428
�1.
428
�1.
423
.3�
1.3
21.4
�1.
214
.0�
0.8
10.7
�1.
7Sh
a44
.9�
1.7
45.9
�2.
729
.3�
4.0
25.8
�1.
819
.3�
1.6
15.8
�1.
59.
3�
0.6
8.6
�0.
9R
ILm
ean
45.4
�5.
246
.15
�5.
327
.3�
4.3
28.3
�4.
422
.6�
5.2
17.9
�3.
612
.2�
4.1
9.6
�2.
2R
ILm
ax–m
in36
–67
36–5
420
–41
21.5
–42
12–4
310
.5–2
7.3
6.5–
336–
17[V
g]a
27.1
427
.90
19.5
21.7
626
.90
12.6
418
.57
5.68
[Ve]
b3.
991.
660.
942.
708.
074.
731.
410.
67[H
2]c
0.87
0.94
0.95
0.88
0.77
0.73
0.92
0.88
[CV
g]d
11.4
811
.44
16.1
716
.48
22.9
719
.84
35.2
624
.66
Ler
¥C
viL
er35
.7�
2.0
38.8
�3.
529
.3�
2.4
30.2
�3.
511
.0�
3.2
11.8
�0.
89.
0�
0.6
9.3
�2.
4C
vi42
.2�
3.4
36.3
�5.
025
.0�
3.2
26.0
�2.
412
.4�
1.3
9.7
�2.
08.
3�
2.0
9.0
�1.
3R
ILm
ean
36.3
�6.
136
.4�
6.1
23.5
�5.
123
.7�
4.6
8.1
�2.
37.
6�
2.0
7.1
�2.
26.
5�
1.7
RIL
max
–min
27–4
527
–45
17–3
518
–34
5.5–
134.
5–11
.55.
0–13
.54.
0–12
.5[V
g]37
.45
37.2
026
.08
21.4
55.
434.
084.
962.
95[V
e]3.
302.
640.
683.
230.
560.
490.
020.
08[H
2]0.
910.
930.
970.
850.
890.
880.
990.
97[C
Vg]
16.8
516
.73
21.7
319
.50
28.5
926
.68
31.2
326
.42
a Vg
isth
eam
ong
RIL
line
vari
ance
com
pone
ntfo
rea
chtr
ait.
b Ve
isth
ere
sidu
al(e
rror
)va
rian
ceco
mpo
nent
.c H
2is
defin
edas
broa
dse
nse
heri
tabi
lity
calc
ulat
edas
sG2/
sz2
.H2
isth
epr
opor
tion
ofth
eto
talp
heno
typi
cva
rian
ceth
atis
gene
tic
[Vg/
(Vg
+V
e)].
d CV
gis
the
coef
ficie
ntof
gene
tic
vari
atio
nca
lcul
ated
as(1
00¥
√Vg)
/med
ia.
Dat
aar
em
eans
�SE
.R
IL,r
ecom
bina
ntin
bred
line.
Ecological flowering time QTL 1469
© 2007 The AuthorsJournal compilation © 2007 Blackwell Publishing Ltd, Plant, Cell and Environment, 30, 1465–1479

6
16
27
44 56
64
70
84
13
27
35
43
56
62
7 24
41
49 66
16
25
34
47
56 70
18
22
36
49
64
76
12
34
50
02
3
00
0M
SA
T2.5
MS
AT
2.3
8
MS
AT
2.3
6
MS
AT
2.4
1
MS
AT
2.7
MS
AT
2.1
0
MS
AT
2.2
2
MS
AT
1.1
0
NG
A248
T27K
12
NG
A128
F5I1
4
MS
AT
1.1
3
MS
AT
1.5
F21M
12
T1G
11
NG
A172
AT
HC
HIB
2
MS
AT
3.1
9
MS
AT
3.3
2
MS
AT
3.2
1
MS
AT
3.1
8
MS
AT
4.3
9M
SA
T4
.8
NG
A8
MS
AT
4.3
5
MS
AT
4.1
5
MS
AT
4.1
8
MS
AT
4.9
NG
A225
NG
A249
MS
AT
5.1
4
NG
A139
MS
AT
5.2
2
MS
AT
5.9
MS
AT
5.1
2
MS
AT
4.3
7
MS
AT
5.1
9
13
10
53
10
12
4
3
124
3 10
6
12
3
4
18
15
7
4
73
146
10
11
3
4
113
81
4
11
34
3
10
15
15
3
4
3
175
73 11
12
4
3
LA
LA
LS
LS
HA
HA
HS
HS
LA
LA
LS
LS
HA
HA
HS
HS
LA
LA
LS
LS
HA
HA
HS
HS
LA
LA
LS
LS
HA
HA
HS
HS
LA
LA
LS
LS
HA
HA
HS
HS
= B
ay a
llele
incre
ases the a
vera
ge v
alu
e o
f th
e tra
it
= S
ha a
llele
incre
ases the a
vera
ge v
alu
e o
f th
e tra
it
= M
ap p
ositio
n o
f hig
hest LO
D s
core
= 2
-LO
D s
upport
inte
rval
= H
ighest LO
D s
core
= P
erc
enta
ge o
f expla
ined v
ariance
115
DT
F
TL
ND
TF
T
LN
DT
F
TL
ND
TF
T
LN
DT
F
TL
N 265
*
**
**
**
*
Fig
ure
2.Q
TL
map
for
flow
erin
gti
me
(DT
Fan
dT
LN
)un
der
four
diff
eren
ten
viro
nmen
tsin
the
Bay
¥Sh
aR
ILpo
pula
tion
.Rec
tang
les
show
the
2-L
OD
supp
ort
inte
rval
,the
arro
whe
ads
insi
deth
ere
ctan
gles
poin
tto
the
posi
tion
ofth
ehi
ghes
tL
OD
scor
e,th
enu
mbe
rsab
ove
the
arro
whe
ads
indi
cate
the
LO
Dsc
ore,
the
num
bers
belo
wth
ear
row
head
sin
dica
teth
epe
rcen
tage
ofex
plai
ned
vari
ance
for
each
QT
L.T
hear
row
head
sou
tsid
eth
ere
ctan
gles
show
the
alle
licef
fect
sof
each
QT
L:t
hear
row
head
spo
int
upw
ards
whe
nth
eB
ayal
lele
sin
crea
sed
and
dow
nwar
dsw
hen
the
Sha
alle
les
incr
ease
dth
eav
erag
eva
lue
ofth
etr
ait.
Ast
eris
ksin
dica
teth
epo
siti
onof
the
QT
Lw
ith
LO
Dhi
gher
than
2w
itho
utsi
gnifi
canc
eat
P<
0.05
.LA
,low
dens
ity
inau
tum
n–w
inte
r;L
S,lo
wde
nsit
yin
spri
ng;H
A,h
igh
dens
ity
inau
tum
n–w
inte
r;H
S,hi
ghde
nsit
yin
spri
ng;Q
TL
,qua
ntit
ativ
etr
ait
loci
;TL
N,t
otal
leaf
num
ber
atbo
ltin
g;D
TF,
days
toflo
wer
ing.
1470 J. F. Botto & M. P. Coluccio
© 2007 The AuthorsJournal compilation © 2007 Blackwell Publishing Ltd, Plant, Cell and Environment, 30, 1465–1479

35
21
38
25
26
55
24
44
5
174
4
41
21
13
65
3
22
30
6
4
163
144
213
215 12
16
34
133
35
21
38
25
26
55
24
44
5
174
4
41
21
13
65
3
22
30
6
4
163
144
213
215 12
16
34
133
*
Fig
ure
3.Q
TL
map
for
flow
erin
gti
me
(DT
Fan
dT
LN
)un
der
four
diff
eren
ten
viro
nmen
tsin
the
Ler
¥C
viR
ILpo
pula
tion
.Onl
ych
rom
osom
esw
ith
sign
ifica
ntQ
TL
are
show
n.T
hear
row
head
sou
tsid
eth
ere
ctan
gles
poin
tup
war
dsw
hen
the
Ler
alle
les
incr
ease
dan
ddo
wnw
ards
whe
nth
eC
vial
lele
sin
crea
sed
the
aver
age
valu
eof
the
trai
t.A
ster
isks
indi
cate
the
posi
tion
ofth
eQ
TL
wit
hL
OD
high
erth
an2
wit
hout
sign
ifica
nce
atP
<0.
05.L
A,l
owde
nsit
yin
autu
mn–
win
ter;
LS,
low
dens
ity
insp
ring
;HA
,hig
hde
nsit
yin
autu
mn–
win
ter;
HS,
high
dens
ity
insp
ring
;QT
L,q
uant
itat
ive
trai
tlo
ci;T
LN
,tot
alle
afnu
mbe
rat
bolt
ing;
DT
F,da
ysto
flow
erin
g.Fo
rot
her
refe
renc
es,s
eeFi
g2.
Ecological flowering time QTL 1471
© 2007 The AuthorsJournal compilation © 2007 Blackwell Publishing Ltd, Plant, Cell and Environment, 30, 1465–1479
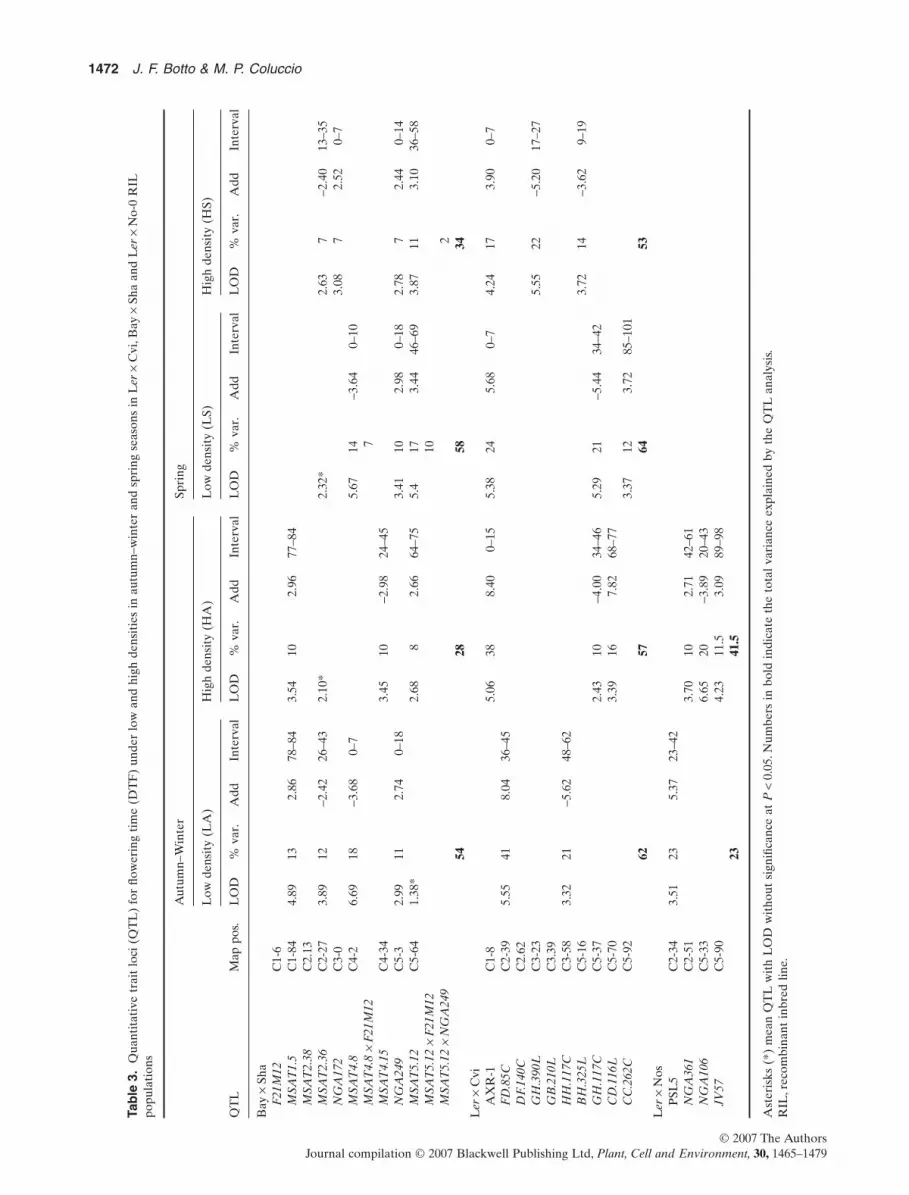
Tab
le3.
Qua
ntit
ativ
etr
ait
loci
(QT
L)
for
flow
erin
gti
me
(DT
F)
unde
rlo
wan
dhi
ghde
nsit
ies
inau
tum
n–w
inte
ran
dsp
ring
seas
ons
inL
er¥
Cvi
,Bay
¥Sh
aan
dL
er¥
No-
0R
ILpo
pula
tion
s
QT
LM
appo
s.
Aut
umn–
Win
ter
Spri
ng
Low
dens
ity
(LA
)H
igh
dens
ity
(HA
)L
owde
nsit
y(L
S)H
igh
dens
ity
(HS)
LO
D%
var.
Add
Inte
rval
LO
D%
var.
Add
Inte
rval
LO
D%
var.
Add
Inte
rval
LO
D%
var.
Add
Inte
rval
Bay
¥Sh
aF
21M
12C
1-6
MSA
T1.
5C
1-84
4.89
132.
8678
–84
3.54
102.
9677
–84
MSA
T2.
38C
2.13
MSA
T2.
36C
2-27
3.89
12-2
.42
26–4
32.
10*
2.32
*2.
637
-2.4
013
–35
NG
A17
2C
3-0
3.08
72.
520–
7M
SAT
4.8
C4-
26.
6918
-3.6
80–
75.
6714
-3.6
40–
10M
SAT
4.8
¥F
21M
127
MSA
T4.
15C
4-34
3.45
10-2
.98
24–4
5N
GA
249
C5-
32.
9911
2.74
0–18
3.41
102.
980–
182.
787
2.44
0–14
MSA
T5.
12C
5-64
1.38
*2.
688
2.66
64–7
55.
417
3.44
46–6
93.
8711
3.10
36–5
8M
SAT
5.12
¥F
21M
1210
MSA
T5.
12¥
NG
A24
92
5428
5834
Ler
¥C
viA
XR
-1C
1-8
5.06
388.
400–
155.
3824
5.68
0–7
4.24
173.
900–
7F
D.8
5CC
2-39
5.55
418.
0436
–45
DF.
140C
C2.
62G
H.3
90L
C3-
235.
5522
-5.2
017
–27
GB
.210
LC
3.39
HH
.117
CC
3-58
3.32
21-5
.62
48–6
2B
H.3
25L
C5-
163.
7214
-3.6
29–
19G
H.1
17C
C5-
372.
4310
-4.0
034
–46
5.29
21-5
.44
34–4
2C
D.1
16L
C5-
703.
3916
7.82
68–7
7C
C.2
62C
C5-
923.
3712
3.72
85–1
0162
5764
53L
er¥
Nos
PSL
5C
2-34
3.51
235.
3723
–42
NG
A36
1C
2-51
3.70
102.
7142
–61
NG
A10
6C
5-33
6.65
20-3
.89
20–4
3JV
57C
5-90
4.23
11.5
3.09
89–9
823
41.5
Ast
eris
ks(*
)m
ean
QT
Lw
ith
LO
Dw
itho
utsi
gnifi
canc
eat
P<
0.05
.Num
bers
inbo
ldin
dica
teth
eto
talv
aria
nce
expl
aine
dby
the
QT
Lan
alys
is.
RIL
,rec
ombi
nant
inbr
edlin
e.
1472 J. F. Botto & M. P. Coluccio
© 2007 The AuthorsJournal compilation © 2007 Blackwell Publishing Ltd, Plant, Cell and Environment, 30, 1465–1479
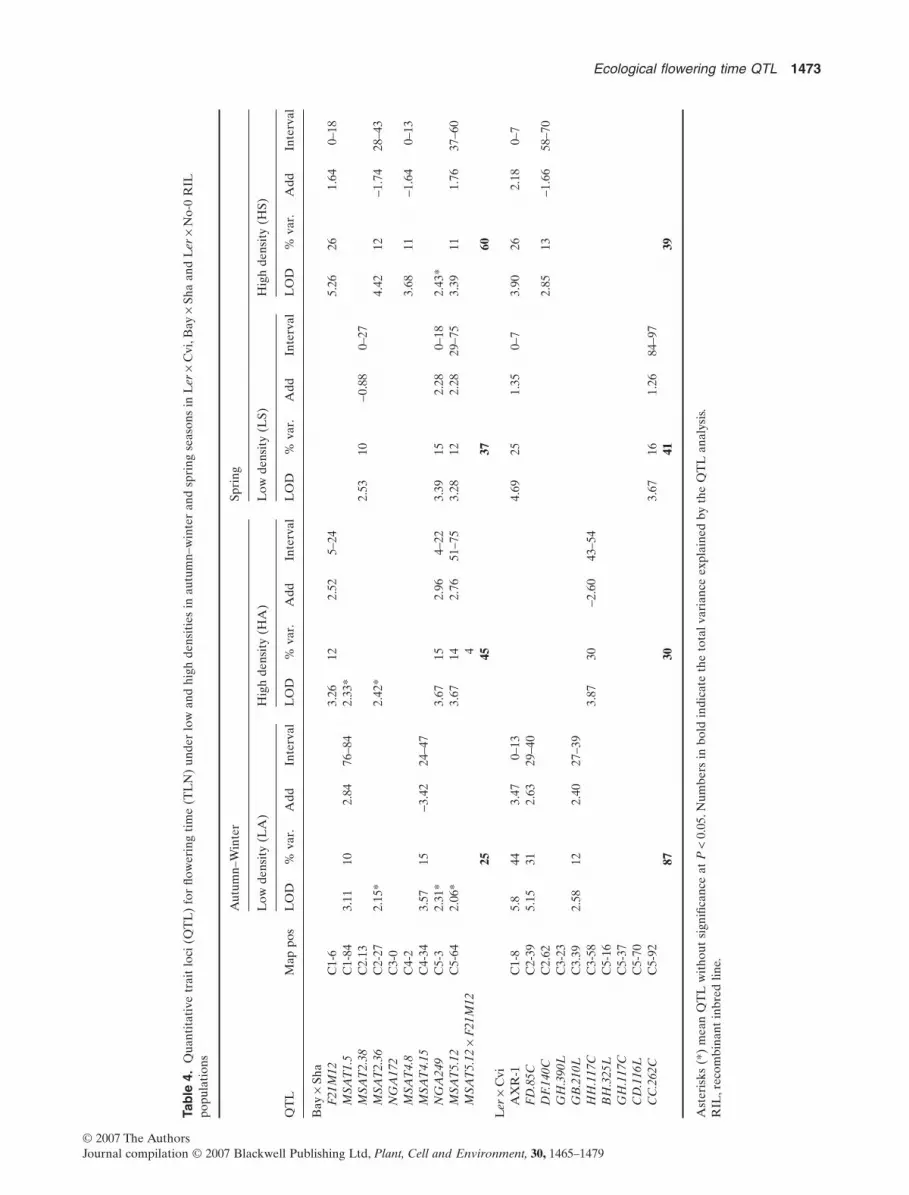
Tab
le4.
Qua
ntit
ativ
etr
ait
loci
(QT
L)
for
flow
erin
gti
me
(TL
N)
unde
rlo
wan
dhi
ghde
nsit
ies
inau
tum
n–w
inte
ran
dsp
ring
seas
ons
inL
er¥
Cvi
,Bay
¥Sh
aan
dL
er¥
No-
0R
ILpo
pula
tion
s
QT
LM
appo
s
Aut
umn–
Win
ter
Spri
ng
Low
dens
ity
(LA
)H
igh
dens
ity
(HA
)L
owde
nsit
y(L
S)H
igh
dens
ity
(HS)
LO
D%
var.
Add
Inte
rval
LO
D%
var.
Add
Inte
rval
LO
D%
var.
Add
Inte
rval
LO
D%
var.
Add
Inte
rval
Bay
¥Sh
aF
21M
12C
1-6
3.26
122.
525–
245.
2626
1.64
0–18
MSA
T1.
5C
1-84
3.11
102.
8476
–84
2.33
*M
SAT
2.38
C2.
132.
5310
-0.8
80–
27M
SAT
2.36
C2-
272.
15*
2.42
*4.
4212
-1.7
428
–43
NG
A17
2C
3-0
MSA
T4.
8C
4-2
3.68
11-1
.64
0–13
MSA
T4.
15C
4-34
3.57
15-3
.42
24–4
7N
GA
249
C5-
32.
31*
3.67
152.
964–
223.
3915
2.28
0–18
2.43
*M
SAT
5.12
C5-
642.
06*
3.67
142.
7651
–75
3.28
122.
2829
–75
3.39
111.
7637
–60
MSA
T5.
12¥
F21
M12
425
4537
60L
er¥
Cvi
AX
R-1
C1-
85.
844
3.47
0–13
4.69
251.
350–
73.
9026
2.18
0–7
FD
.85C
C2-
395.
1531
2.63
29–4
0D
F.14
0CC
2.62
2.85
13-1
.66
58–7
0G
H.3
90L
C3-
23G
B.2
10L
C3.
392.
5812
2.40
27–3
9H
H.1
17C
C3-
583.
8730
-2.6
043
–54
BH
.325
LC
5-16
GH
.117
CC
5-37
CD
.116
LC
5-70
CC
.262
CC
5-92
3.67
161.
2684
–97
8730
4139
Ast
eris
ks(*
)m
ean
QT
Lw
itho
utsi
gnifi
canc
eat
P<
0.05
.Num
bers
inbo
ldin
dica
teth
eto
talv
aria
nce
expl
aine
dby
the
QT
Lan
alys
is.
RIL
,rec
ombi
nant
inbr
edlin
e.
Ecological flowering time QTL 1473
© 2007 The AuthorsJournal compilation © 2007 Blackwell Publishing Ltd, Plant, Cell and Environment, 30, 1465–1479

chromosome 5 and the top of chromosome 1(MSAT5.12 ¥ F21M12), and the top of chromosome 4 andthe same marker of chromosome 1 (MSAT4.8 ¥ F21M12).A much smaller QTL ¥ QTL interaction was observedbetween MSAT5.12 and NGA249 QTL at chromosome 5(Tables 3 & 4). The QTL ¥ E analysis detected a significantinteraction for TLN at MSAT4.15 QTL (P = 0.0213).
In the Ler ¥ Cvi RIL population, the AXR-1 QTL locatedat the top of chromosome 1 was present almost in everyenvironment and particularly significant in autumn–winter(Fig. 3, Tables 3 & 4). Nine of the 10 QTLs found in theLer ¥ Cvi RIL population showed seasonal and plant-density interaction. A high proportion of them were associ-ated with a small contribution to the total phenotypicvariation of flowering time with the exception of FD.85CQTL which was only associated with low density in autumn–winter. FD.85C, located at the middle of chromosome 2,explained at least 31% of the total genetic variance and Lerallele increased the flowering time by 8 d (Fig. 3, Table 3).The QTL ¥ E analysis detected a significant interaction atFD.85C (P = 0.026 for DTF and P = 0.0257 for TLN).
The flowering time QTL analysis in the Ler ¥ No-0 RILpopulation revealed four QTLs explaining between 23 and41.5% of the phenotypic variation under low and high plantdensities in autumn–winter season (Fig. 4, Tables 3 and 4).The most significant QTL was detected in low plant densityat PSL5 marker at chromosome 2 (Fig. 4). The other threeQTLs were detected at high plant density. NGA361 QTL
was mapped at the middle of chromosome 2 and NGA106and JV57 QTLs were located at chromosome 5. The No-0alleles increased DTF at NGA106 QTL in contrast to theother three QTLs that showed opposite allelic effects(Fig. 4, Table 3).
Comparison of locations of flowering time QTLbetween the three RIL populations
One aim of our QTL analysis using different RIL popula-tions was to elucidate whether the QTLs for DTF overlapbetween populations under the same seasonal and densityconditions. Linkage map positions were aligned with knownphysical positions for markers and with estimated physicalpositions for QTL. Considering the QTL analysis among thethree RIL populations, we found three QTLs that overlap.The occurrence of overlapping support intervals indicatesthat the same QTL was mapped or that genes contributingto trait variance are positionally linked. MSAT2.36(Bay ¥ Sha), FD.85C (Ler ¥ Cvi) and PSL5 (Ler ¥ No-0)QTLs at chromosome 2 overlapped among the RIL popula-tions (Figs 2–4,Table 3).The Ler alleles at FD.85C and PSL5QTLs increased DTF in low density and autumn–winter,whereas the contribution of the Sha alleles at MSAT2.36increased the DTF in every environmental condition.On thetop of chromosome 5, BH.325L (Ler ¥ Cvi), NGA249(Bay ¥ Sha) and NGA106 (Ler ¥ No-0) QTLs were mappedoverlapping across the three RIL populations (Figs 2–4,
Table 5. Environmental condition ofquantitative trait loci (QTL) detection fordays to flowering (DTF) and total leafnumber (TLN)
QTL Map position (cM) Environmental condition of QTL detection
Bay ¥ Sha DTF TLNF21M12* CI. 6 – DMSAT1.5 CI. 84 S SMSAT2.38* CII. 13 – S ¥ DMSAT2.36 CII. 27 S + D S + DNGA172* CIII. 0 S ¥ D –MSAT4.8 CIV. 2 D S ¥ DMSAT4.15* CIV. 34 S ¥ D S ¥ DNGA249 C5. 3 S ¥ D S + DMSAT5.12 CV. 64 S ¥ D S + D
Ler ¥ CviAXR-1 CI. 8 S + D S + DFD.85C* CII. 39 S ¥ D S ¥ DDF.140C* CII. 62 – S ¥ DGH.390L* CIII. 23 S ¥ D –GB.210L* CIII. 39 – S ¥ DHH.117C* CIII. 58 S ¥ D S ¥ DBH.325L CV. 16 S ¥ D –GH.117C CV. 37 S ¥ D –CD.116L* CV. 70 S ¥ D –CC.262C CV. 92 S ¥ D S ¥ D
The position of QTL is indicated by the closest marker. QTLs that overlap in their 2-LODsupport interval are considered the same QTL.Asterisks (*) indicate novel QTL detected in our study.S, QTL associated to seasonal environment independently of plant density; D, QTL associ-ated to density environment independently of the season; S + D, QTL detected in everyenvironmental condition; S ¥ D, QTL detected in any specific interaction of season anddensity environment.
1474 J. F. Botto & M. P. Coluccio
© 2007 The AuthorsJournal compilation © 2007 Blackwell Publishing Ltd, Plant, Cell and Environment, 30, 1465–1479

Table 3).The Ler and Sha alleles at these loci were associatedwith the decreasing of DTF. Additionally, those RIL popu-lations sharing the Ler parent background allowed thedetection of the QTL specifically under high plant density.At the bottom of chromosome 5, MSAT5.12 (Bay ¥ Sha),CC.262C (Ler ¥ Cvi) and JV57 (Ler ¥ No-0) QTLs over-lapped among the three RIL populations and explained upto 17% of the flowering time variation (Figs 2–4, Table 3).
Genetical and physiological characterizationof loci in Ler ¥ Cvi RIL population
Having found substantial variation associated with seasonand plant density, we analysed the extent to which thisvariation depends on the photoperiod detected in autumn–winter and spring experiments or the quality of light envi-ronment modulated by plant density using introgressionlines (NILs) carrying a Cvi genomic fragment around theQTL region into Ler genetic background. Simulating
photoperiods of the glasshouse experiments, we designed alaboratory experiment involving long (16 h light/8 h dark)and short (8 h light/16 h dark) photoperiods (LD and SD,respectively). Plants were grown under WL or under WLsupplemented with 30 min of FR at the end of the photo-period (WL + EOD) to mimic the effects of shade-avoidance syndrome induced by plant density. Theconspicuous effects of AXR-1 QTL were confirmedgrowing EDI NIL and transgenic lines in Ler backgroundcarrying an additional copy of the CRY2 from Ler (CRY2-Ler) or Cvi (CRY2-Cvi). As expected, the CRY2-Cvi allelesreduced DTF independently of the EOD treatment and thiseffect was particularly manifest under SD simulating theautumn–winter season (Fig. 5). FD.85C could not be con-firmed using NIL 43 and La(ER+) lines because these linesshowed opposite allelic effects than expected by the QTLmapping analysis under WL in SD conditions (Fig. 5). Inopposition, NIL DOG17.1, carrying a short fragment of Cviin chromosome 5, confirmed the dual effects of the Cvialleles at CD.116L depending on the photoperiod condi-tions: the NIL DOG17.1 showed a significant accelerationof flowering time compared with Ler control under WL inLD and WL + EOD in SD (Fig. 5).
DISCUSSION
We report a QTL study in three RIL populations of Arabi-dopsis thaliana to map the loci responsible for floweringvariations under low and high plant densities in autumn–winter and spring environments. Four QTLs were commonin all environments in Bay ¥ Sha or Ler ¥ Cvi RIL popula-tions, and several QTLs were common to those detected byother laboratories in controlled photoperiod chambers, sug-gesting the primary role of photoperiod in the regulation offlowering response. A substantial number of QTLs wererevealed specifically in our experimental conditions indicat-ing the involvement of additional genes in the transition toflowering under relevant ecological settings.
For the Bay ¥ Sha RIL population, we detected five ofnine QTLs that confirm those found by Loudet et al. (2002)under artificial light conditions.Natural photoperiods, radia-tion and temperature regimes could explain the differencesobserved between our and the Loudet et al. data. A smallgroup of loci was revealed for one environment factor inde-pendently of the other factor:MSAT1.5 QTL was detected inautumn–winter in low and high densities, confirming theseasonal nature of the QTL; meanwhile, MSAT4.8 for DTFwas mapped in low plant density and F21M12 was mapped incrowded environments either in autumn–winter and springseasons (Fig. 2, Tables 3 & 4). A higher contribution ofF21M12 was found in spring season explaining 26% of thetotal phenotypic variation. Unfortunately, we cannot makeadaptative and fitness interpretations about the function ofF21M12 in crowded environments because the informationavailable related to the exact site of origin of Bay and Shaaccessions is limited (Tonsor et al. 2005). For the Ler ¥ CviRIL population, we mapped 10 loci associated to the fourseasonal and plant-density environments. Nine loci were
71
51
61
43
38
15
0
24
Nga1145
Ciw3
Msat2.38
PSL5
Nga1126
Nga361
Msat2.10
Athbio2
90
75
65
53
46
17
27
0
98
Nga225
Nga106
Nga151
Nga76
So191
Ciw9
Nga129
Jv57
MBK5
LA
HA
LA
HA
LA
HA
LA
HA
23
4
10
4
12
4
20
7
2 5
Figure 4. QTL map for flowering time (DTF) in the Ler ¥ No-0RIL population under low and high plant density inautumn–winter season. Only chromosomes with significant QTLare shown. The arrowheads outside the rectangles point upwardswhen the Ler alleles increased and downwards when the No-0alleles increased the average value of the trait. LA, low density inautumn–winter; HA, high density in autumn–winter; QTL,quantitative trait loci; DTF, days to flowering. For otherreferences, see Fig 2.
Ecological flowering time QTL 1475
© 2007 The AuthorsJournal compilation © 2007 Blackwell Publishing Ltd, Plant, Cell and Environment, 30, 1465–1479

020406080
P =
0.0
001
**
*P
< 0
.0001
**
*
P <
0.0
001
**
*
P =
0.0
043
**
WL
AX
R-1
FD
.85C
020406080
P <
0.0
384
*
P <
0.0
057
**
WL
P <
0.0
057
**
P <
0.0
001
**
*
P <
0.0
001
**
*
AX
R-1
FD
.85C
020406080
P <
0.0
001
**
*P
< 0
.0001
**
*
P =
0.0
001
*
**
P =
0.0
41
*
P =
0.0
20
*
A
XR
-1F
D.8
5CW
L +
EO
D
Ler
020406080
P <
0.0
001
**
*P
= 0
.0005
*
*
AX
R-1
FD
.85C
WL
+ E
OD P
< 0
.0001
**
*
Gen
oty
pe
Flowering time
Sh
ort
day
sL
on
g d
ays
CD
.116
LC
D.1
16L
CD
.116
LC
D.1
16L
DO
G17
.1E
R+
N43
Cry
2Cvi
Cry
2Ler
ED
IL
erD
OG
17.1
ER
+N
43C
ry2C
viC
ry2L
erE
DI
Fig
ure
5.F
low
erin
gti
me
(DT
F)
ofL
er,N
ILs
and
CR
Y2
tran
sgen
icpl
ants
unde
rW
Lan
dW
L+
EO
Din
shor
tda
ys(8
hlig
ht+
16h
dark
)an
dlo
ngda
ys(1
6h
light
+8
hda
rk).
Eac
hba
rre
pres
ents
the
mea
nre
spon
se(�
SE)
ofat
leas
tsi
xre
plic
ates
.Sig
nific
ant
diff
eren
ces
wit
hre
spec
tto
Ler
are
indi
cate
dab
ove
bars
usin
gth
et-
test
com
pari
ngtw
om
eans
.EO
D,e
nd-o
f-da
y;W
L,w
hite
light
;NIL
s,ne
aris
ogen
iclin
es;D
TF,
days
toflo
wer
ing.
1476 J. F. Botto & M. P. Coluccio
© 2007 The AuthorsJournal compilation © 2007 Blackwell Publishing Ltd, Plant, Cell and Environment, 30, 1465–1479
found in a particular combination of season and plant-density although most of them were associated with a smallcontribution on flowering time. Four QTLs were common tothose found previously for plants grown under SD and LDphotoperiod conditions (Alonso-Blanco et al. 1998b;Ungerer et al. 2003).With the exception of the AXR-1 QTLwhich showed an association in almost all tested environ-ments,the other three loci,BH325L,GH.117C and CC.262C,were revealed under particular environmental conditions(Fig. 3, Tables 3 & 4) suggesting the action of complex inter-actions between photoperiod and other environmentalfactors (e.g. temperature, radiation).
In the present study, we have analysed the floweringallelic variation in a new RIL population derived from across of Ler ¥ No-0 (Alconada-Magliano et al. 2005). Inautumn–winter season, we found four QTLs that explainedbetween 23 and 41.5% of the flowering time variation underlow and high plant densities, respectively (Fig. 4, Table 3).By aligning the linkage maps onto a common physical map,we detected some QTLs that overlap between the threeRIL populations. MSAT2.36, FD85C and PSL5 QTLsco-localize at chromosome 2 (Figs 2–4, Table 3). MSAT2.36QTL was conspicuous for all seasonal and plant-densityenvironments in the Bay ¥ Sha RIL population. For the twoRIL populations sharing Ler parental genotype (i.e. FD85CQTL in Ler ¥ Cvi and PSL5 QTL in Ler ¥ No-0 RIL popu-lations), the Ler alleles increased DTF specifically in lowplant density and autumn–winter season. The resultsobtained using NIL 43 and La(ER+) plants grown in labo-ratory conditions to mimic photoperiod and density effectsof the glasshouse experiments indicate that ERECTA locusis not responsible for the FD85C QTL. Firstly, the effectobserved for La(ER+) line is opposite to what was expectedin the QTL mapping analysis. Secondly, NIL43 contains theERECTA allele but it behaves differently to the La(ER+)line. Thirdly, only two of the three RIL populations segre-gate for the erecta mutation while the overlapping QTL atchromosome 2 is segregating in the three populations. Thecandidate gene for the overlapping QTL at chromosome 2is PHYB gene (At2g18790). Phytochrome B plays a centralrole controlling flowering time and neighbour photodetec-tion (Halliday, Koornneef & Whitelam 1994) with conse-quences in biomass production and fruit production atpopulation level (Ballaré & Scopel 1997). The geneticvariation at the sequence of PHYB is expected to be con-siderable for Ler and Cvi (Borevitz et al. 2002), but unfor-tunately there is not available information about nucleotidevariation for No-0, Bay and Sha accessions. In addition, wefound a QTL overlapping among the three RIL populationsfor BH325L (Ler ¥ Cvi), NGA249 (Bay ¥ Sha) andNGA106 (Ler ¥ No-0) loci mapped on the top of chromo-some 5. Previous reports mapped these QTL for floweringtime under SD and LD in the RIL populations of Ler ¥ Cviand Bay ¥ Sha (Alonso-Blanco et al. 1998b; Loudet et al.2002). The study span region of these QTL contains theFLC gene (At5g10140) and it is a strong candidate. FLCencodes a MADS box transcription factor that is arepressor of the floral transition (Michaels & Amasino
1999; Sheldon et al. 1999). Strength alleles of FLC couldexplain why the plants carrying on Bay or No-0 alleles atNGA249 and NGA106 markers, respectively, flowerbetween 2.4 and 3.9 d later than the average response ofRILs (Table 3). Sha and Ler accessions show low expressionof FLC RNA (Gazzani et al. 2003; Michaels et al. 2003). Aninsertion of 1.2 kb in the first intron is responsible for theattenuation of the FLC-Ler allele (Michaels et al. 2003).However, the molecular bases of the weak behaviour of theFLC allele from Sha are not known. It is possible thatcertain polymorphisms affect cis-acting regulatory elementsthat are required for high levels of FLC expression. In themiddle of chromosome 5, GH.117C (Ler ¥ Cvi) andNGA106 (Ler ¥ No-0) QTLs overlapped in the two RILpopulations. HUA2 (at5g23150), a repressor of floral tran-sition, is a candidate gene. The Cvi and probably No-0accessions contain wild-type HUA2 alleles, whereas the Lerallele of HUA2 contains a premature stop codon that accel-erates flowering (Doyle et al. 2005).
Some loci detected in our mapping analysis are specificfor a given RIL population. FRI (at4g00650) is a strongcandidate for the MSAT4.8 QTL for DTF associated withlow plant density in Bay ¥ Sha population (Fig. 2, Tables 3& 4). The Sha FRI allele is apparently functional, mean-while Cvi and Ler FRI alleles are non-functional (Johansonet al. 2000; Gazzani et al. 2003) and this could be consistentwith the lack of the QTL near FRI in the Ler ¥ Cvi recom-binant inbred analysis (Fig. 3 and Alonso-Blanco et al.1998b). On the other hand, a candidate gene for MSAT1.5QTL, detected in autumn–winter at low and high densitiesin Bay ¥ Sha RIL population, is FLM (at1g77080), a floralinhibitor that is closely related to FLC. Using a combina-tion of QTL mapping and comparative hybridization ofgenomic DNA to Affymetrix ATH1 arrays, Werner et al.(2005) identified a deletion of FLM as responsible of flow-ering acceleration in short days of Niederzenz comparedwith Columbia strains. Surveying several accessions, theyfound the insertion of three different transposable elementsupstream of the FLM coding regions in the Sha accession,suggesting that the flowering acceleration observed in linescarrying Sha allele relative to Bay allele could be associatedwith reduced FLM activity (Fig. 2, Tables 3 & 4). Finally,previous and our results demonstrate that the candidategene for AXR-1 QTL is CRY2 (at1g04400), a pleiotropiclocus mapped on the top of chromosome 1 in the Ler ¥ CviRIL population (Fig. 3, El-Assal et al. 2001). Using CRY2allelic transgenic plants, it has been found that a singleamino acid substitution in the cry2 photoreceptor inducesearly flowering in short day plants carrying the Cvi allele(El-Assal et al. 2001). Our plant-density experiments andlaboratory experiments using lamps that affect the R/FRratio demonstrate that the central role of CRY2 polymor-phism modulating flowering time is independent of thequality light perceived by plants (Figs 3 & 5, Tables 3 & 4).
In conclusion, our findings validate the use of naturalecological settings and multiple populations to improvethe understanding of the QTL architecture of floweringtime. We identified the precise seasonal and density
Ecological flowering time QTL 1477
© 2007 The AuthorsJournal compilation © 2007 Blackwell Publishing Ltd, Plant, Cell and Environment, 30, 1465–1479

environments in which variation at particular loci plays arole in three RIL populations containing alleles from fiveparental genotypes. The identification of common lociamong different genetic backgrounds suggests the conser-vation of master genes regulating flowering. A high numberof QTLs was detected in particular seasonal and densityenvironments indicating that those loci may play a crucialrole, allowing a fine adjusting of flowering in specific eco-logical settings. In addition, the presence of seasonal anddensity loci suggests that both factors act as evolutive forcesmodulating the flowering time in Arabidopsis.
ACKNOWLEDGMENTS
The authors are grateful to Marteen Koornneef and CarlosAlonso-Blanco for providing NILs and CRY2-Ler andCRY2-Cvi transgenic genotypes to confirm some QTL andto the Arabidopsis Biological Resource Center (Ohio StateUniversity, Columbus, OH, USA) for the provision ofLer ¥ Cvi and Bay ¥ Sha RIL populations. We thank JorgeCasal for the helpful comments on the manuscript andMariana Conte and Paula Laserna for the technical helpduring plant measurements in the glasshouse experiments.This research was supported by the University of BuenosAires Grant G013 and the Agencia Nacional de PromociónCientífica y Tecnológica PICT 10765 and PICT 32137 to J.F.Botto.
REFERENCES
Alconada-Magliano T., Botto J.F., Godoy V., Symonds V.V., LloydA.M. & Casal J.J. (2005) New Arabidopsis recombinant inbredlines (Ler/No-0) reveal natural variation in phytochrome-mediated responses. Plant Physiology 138, 1126–1135.
Alonso-Blanco C., Peeters A., Koornneef M., Lister C., Dean C.,van den Bosch N., Pot J. & Kuiper M. (1998a) Development of anAFLP based linkage map of Ler, Col and Ler/Cvi recombinantinbred line population. Plant Journal 14, 259–271.
Alonso-Blanco C., El-Assal S., Coupland G. & Koornneef M.(1998b) Analysis of natural allelic variation at flowering time lociin the Landsberg erecta and Cape Verde Islands ecotypes ofArabidopsis thaliana. Genetics 149, 749–764.
Alonso-Blanco C., Bentsink L., Hanhart C.J., Blankestijn-de VriesH. & Koornneef M. (2003) Analysis of natural allelic variation atseed dormancy loci of Arabidopsis thaliana. Genetics 164, 711–729.
Ballaré C.L. & Scopel A.L. (1997) Phytochrome signalling in plantcanopies: testing its population-level implications with photore-ceptor mutants of Arabidopsis. Functional Ecology 11, 441–450.
Ballaré C.L., Scopel A.L. & Sánchez R.A. (1990) Far-red radiationreflected from adjacent leaves: an early signal of competition inplant canopies. Science 247, 329–332.
Borevitz J.O., Maloof J.N., Lutes J., et al. (2002) Quantitative traitloci controlling light and hormone response in two accessions ofArabidopsis thaliana. Genetics 160, 683–696.
Botto J.F. & Smith H. (2002) Differential genetic variation in adap-tive strategies to a common environmental signal in Arabidopsisaccessions: phytochrome-mediated shade avoidance. Plant, Cell& Environment 25, 53–63.
Botto J.F., Alonso-Blanco C., Garzarón I., Sánchez R.A. & CasalJ.J. (2003) The Cvi allele of cryptochrome 2 enhances cotyledon
unfolding in the absence of blue light in Arabidopsis. PlantPhysiology 133, 1547–1556.
Chase K., Adler F.R. & Lark K.G. (1997) Epistat: a computerprogram for identifying and testing interactions between pairs ofquantitative trait loci. Theoretical and Applied Genetics 94, 724–730.
Doerge R.W. & Churchill G.A. (1996) Permutations tests for mul-tiple loci affecting quantitative character. Genetics 142, 285–294.
Doyle M.R., Bizzell C.M., Keller M.R., Michaels S.D., Song J., NohY-S. & Amasino R.M. (2005) HUA2 is required for the expres-sion of floral repressors in Arabidopsis thaliana. Plant Journal 41,376–385.
El-Assal S.E., Alonso-Blanco C., Peeters A.J.M., Raz V. &Koornneef M. (2001) A QTL for flowering time in Arabidopsisreveals a novel allele of CRY2. Nature Genetics 29, 435–439.
Gazzani S., Gendall A.R., Lister C. & Dean C. (2003) Analysis ofthe molecular basis of flowering time variation in Arabidopsisaccessions. Plant Physiology 132, 1107–1114.
Halliday K.J., Koornneef M. & Whitelam G.C. (1994) PhytochromeB, and at least one other phytochrome, mediate the acceleratedflowering response of Arabidopsis thaliana L. to low red: far-redratio. Plant Physiology 104, 1311–1315.
Hayama R. & Coupland G. (2004) The molecular basis of diversityin the photoperiodic flowering responses of Arabidopsis andrice. Plant Physiology 135, 677–684.
InfoStat (2002). InfoStat Version 1.1. Grupo InfoStat, FCA, Univer-sidad Nacional de Córdoba, Córdoba, Argentina.
Johanson U., West J., Lister C., Michaels S.D., Amasino R.M. &Dean C. (2000) Molecular analysis of FRIGIDA, a major deter-minant of natural variation in Arabidopsis flowering time.Science 290, 344–347.
Koornneef M., Alonso-Blanco C. & Vreugdenhil D. (2004) Natu-rally occurring genetic variation in Arabidopsis thaliana. AnnualReview of Plant Biology 55, 141–172.
Lander E.S., Green P., Abrahamson J., Barlow A., Daly M.J.,Lincoln S.E. & Newburg L. (1987) MAPMARKER: an interac-tive computer package for constructing primary genetic linkagemaps of experimental and natural populations. Genomics 1, 174–181.
Loudet O., Chaillou S., Camilleri C., Bouchez D. & Daniel-VedeleF. (2002) Bay-0 ¥ Shahdara recombinant inbred line population:a powerful tool for the genetic dissection of complex traits inArabidopsis. Theoretical and Applied Genetics 104, 1173–1184.
Lynch M. & Walsh B. (1998) Genetics and Analysis of QuantitativeTraits. Sinauer Associates, Inc., Sunderland, MA, USA.
Michaels S.D. & Amasino R.M. (1999) FLOWERING LOCUS Cencodes a novel MADS domain protein that acts as a repressorof flowering. Plant Cell 11, 949–956.
Michaels S.D., He Y., Scortecci K.C. & Amasino R.M. (2003)Attenuation of FLOWERING LOCUS C activity as a mecha-nism for the evolution of summer-annual flowering behavior inArabidopsis. Proceedings of the National Academy of Sciences ofthe USA 100, 10102–10107.
Napp-Zinn K. (1976) Population genetical and gene geographicalaspects of germination and flowering in Arabidopsis thaliana.Arabidopsis Information Service 13, 26.
Nordborg M. & Bergelson J. (1999) The effect of seed and rosettecold treatment on germination and flowering time in some Ara-bidopsis thaliana (Brassicaceae) ecotypes. American Journal ofBotany 86, 470–475.
Pigliucci M. (1998) Ecological and evolutionary genetics of Arabi-dopsis. Trends in Plant Science 3, 485–489.
Ratcliffe D. (1965) The geographical and ecological distribution ofArabidopsis thaliana and comments on physiological variation.Arabidopsis Information Service 1S, 20.
Ratcliffe D. (1976) Germination characteristics and their inter- and
1478 J. F. Botto & M. P. Coluccio
© 2007 The AuthorsJournal compilation © 2007 Blackwell Publishing Ltd, Plant, Cell and Environment, 30, 1465–1479

intra-population variability in Arabidopsis. Arabidopsis Infor-mation Service 13, 32.
Schmitt J. (1997) Is photomorphogenic shade avoidance adaptive?Perspectives from population biology. Plant, Cell & Environ-ment 20, 826–830.
Sheldon C.C., Burn J.E., Perez P.P., Metzger J., Edwards J.A.,Peacock W.J. & Dennis E.S. (1999) The FLF MADS box gene: arepressor of flowering in Arabidopsis regulated by vernalizationand methylation Arabidopsis regulated by vernalization andmethylation. Plant Cell 11, 445–458.
Simpson G.G. & Dean C. (2002) Arabidopsis, the rosetta stone offlowering time? Science 296, 285–289.
Smith H. & Holmes M.G. (1977) The function of phytochrome inthe natural environment. III. Measurement and calculation ofphytochrome photoequilibrium. Photochemistry & Photobiol-ogy 25, 547–550.
Sokal R.R. & Rohlf F.J. (1995) Biometry: The Principles and Prac-tice of Statistics in Biological Research, 3rd edn. Freeman andCompany, New York, NY, USA.
Stratton D. (1998) Reaction norm functions and QTL–environment interactions for flowering time in Arabidopsisthaliana. Heredity 81, 144–155.
Symonds V.V., Godoy A.V., Alconada T., Botto J.F., Juenger T.E.,Casal J. & Lloyd A.M. (2005) Mapping QTL for trichome densityin multiple Arabidopsis thaliana populations reveals naturalvariation for genetic architecture. Genetics 169, 1649–1658.
Tonsor S.J., Alonso-Blanco C. & Koornneef M. (2005) Gene func-tion beyond the single trait: natural variation, gene effects, andevolutionary ecology in Arabidopsis thaliana. Plant, Cell & Envi-ronment 28, 2–20.
Ungerer M.C., Halldorsdottir S.S., Purugganan M.D. & MackayT.F.C. (2003) Genotype–environment interactions at quantita-tive trait loci affecting inflorescence development in Arabidopsisthaliana. Genetics 165, 353–365.
Wang X., Korstanje R., Higgins D. & Paigen B. (2004) Haplotypeanalysis in multiple crosses to identify a QTL. Genetical Research14, 1767–1772.
Weinig C., Ungerer M.C., Dorn L.A., Kane N.C., Toyonaga Y.,Halldorsdottir S.S., Mackay T.F.C., Purugganan M.D. & SchmittJ. (2002) Novel loci control variation in reproductive timing inArabidopsis thaliana in natural environments. Genetics 162,1875–1884.
Weinig C., Dorn L.A., Kane N.C., German Z.M., HalldorsdottirS.S.,Ungerer M.C., Toyonaga Y., Mackay T.F.C., PuruggananM.D. &Schmitt J. (2003) Heterogeneous selection at specific loci
in natural environments in Arabidopsis thaliana. Genetics 165,321–329.
Werner J.D., Borevitz J.O., Warthmann N., Trainer G., Ecker J.R.,Chory J. & Weigel D. (2005) Quantitative trait locus mappingand DNA array hybridization identify an FLM deletion as acause for natural flowering-time variation. Proceedings of theNational Academy of Sciences of the USA 102, 2460–2465.
Yanovsky M.J., Casal J.J. & Luppi J.P. (1997) The VLF loci, poly-morphic between ecotypes Landsberg erecta and Columbiadissect two branches of phytochrome A signalling pathwaysthat correspond to the very-low-fluence and high-irradianceresponses of phytochrome. Plant Journal 12, 101–109.
Zeng Z.-B. (1994) Precision mapping of quantitative trait loci.Genetics 136, 1457–1468.
Received 17 May 2007; received in revised form 12 June 2007;accepted for publication 9 July 2007
SUPPLEMENTARY MATERIAL
The following supplementary material is available for thisarticle:
Figure S1. Frequency distribution for flowering (TLN andDTF) in Bay ¥ Sha RIL population.Figure S2. Frequency distribution for flowering (TLN andDTF) in Ler ¥ Cvi RIL population.Table S1. Two-way anova for flowering time (DTF andTLN).
This material is available as part of the online articlefrom http://www.blackwell-synergy.com/doi/abs/10.1111/j.1365-3040.2007.01722.x(This link will take you to the article abstract)
Please note: Blackwell Publishing is not responsible for thecontent or functionality of any supplementary materialssupplied by the authors. Any queries (other than missingmaterial) should be directed to the corresponding authorfor the article.
Ecological flowering time QTL 1479
© 2007 The AuthorsJournal compilation © 2007 Blackwell Publishing Ltd, Plant, Cell and Environment, 30, 1465–1479
Related Documents